Embed Size (px)
Citation preview
State of Oregon Natural Hazards Mitigation Plan February 2012
Emergency Management Plan 3‐WS‐1
WINTER STORMS CHAPTER Winter storms are among nature’s most impressive spectacles. Their combination of heavy snow, ice accumulation, and extreme cold can totally disrupt modern civilization, closing down roads and airports, creating power outages, and downing telephone lines. Winter storms remind us how vulnerable we are to nature’s awesome powers.
For the most part, the wind aspects of winter storms are covered in the windstorms chapter of this plan. Heavy precipitation aspects associated with winter storms in some parts of the state, which sometimes lead to flooding, are covered in the flood chapter of this plan. The winter storms chapter instead generally addresses snow and ice hazards, and extreme cold.
Hazard Analysis/Characterization
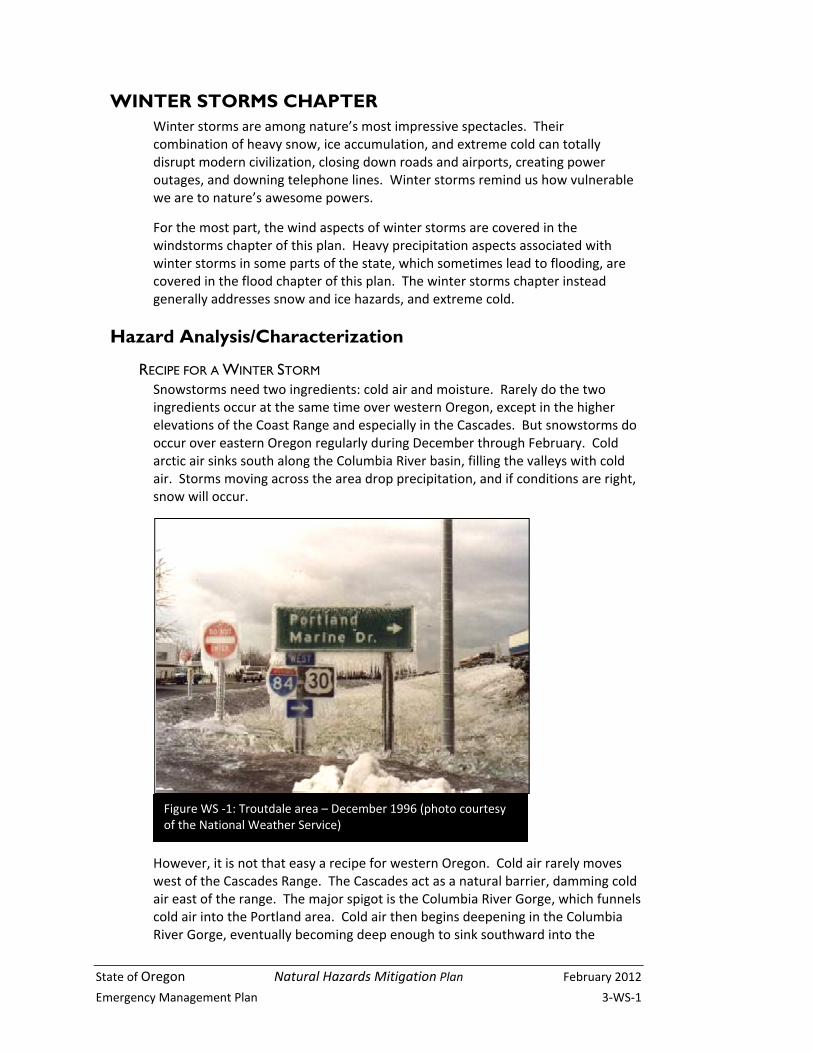
RECIPE FOR A WINTER STORM Snowstorms need two ingredients: cold air and moisture. Rarely do the two ingredients occur at the same time over western Oregon, except in the higher elevations of the Coast Range and especially in the Cascades. But snowstorms do occur over eastern Oregon regularly during December through February. Cold arctic air sinks south along the Columbia River basin, filling the valleys with cold air. Storms moving across the area drop precipitation, and if conditions are right, snow will occur.
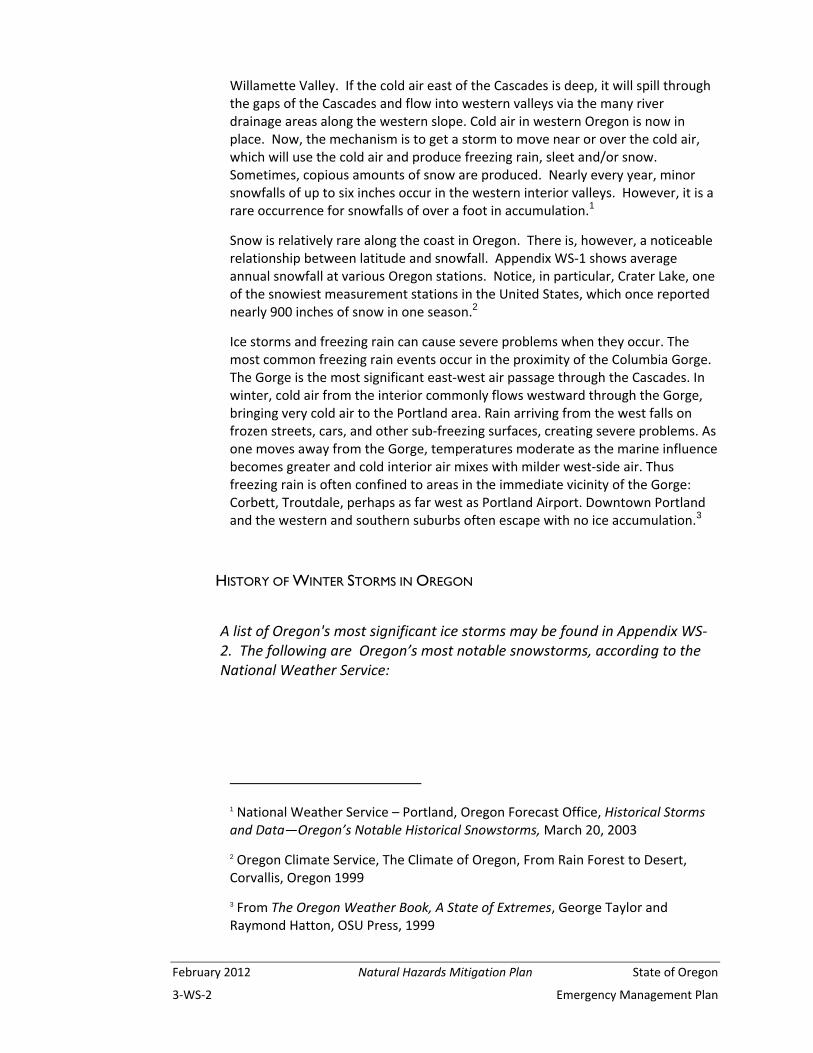
However, it is not that easy a recipe for western Oregon. Cold air rarely moves west of the Cascades Range. The Cascades act as a natural barrier, damming cold air east of the range. The major spigot is the Columbia River Gorge, which funnels cold air into the Portland area. Cold air then begins deepening in the Columbia River Gorge, eventually becoming deep enough to sink southward into the
Figure WS ‐1: Troutdale area – December 1996 (photo courtesy of the National Weather Service)
February 2012 Natural Hazards Mitigation Plan State of Oregon
3‐WS‐2 Emergency Management Plan
Willamette Valley. If the cold air east of the Cascades is deep, it will spill through the gaps of the Cascades and flow into western valleys via the many river drainage areas along the western slope. Cold air in western Oregon is now in place. Now, the mechanism is to get a storm to move near or over the cold air, which will use the cold air and produce freezing rain, sleet and/or snow. Sometimes, copious amounts of snow are produced. Nearly every year, minor snowfalls of up to six inches occur in the western interior valleys. However, it is a rare occurrence for snowfalls of over a foot in accumulation.1
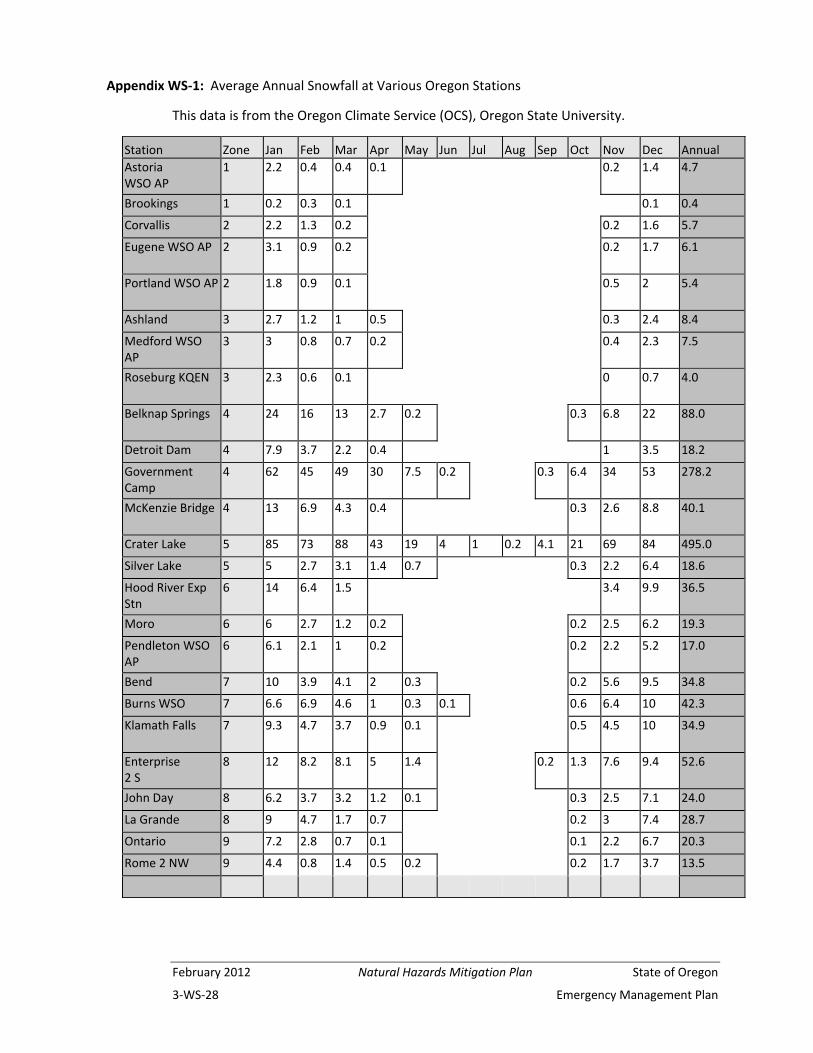
Snow is relatively rare along the coast in Oregon. There is, however, a noticeable relationship between latitude and snowfall. Appendix WS‐1 shows average annual snowfall at various Oregon stations. Notice, in particular, Crater Lake, one of the snowiest measurement stations in the United States, which once reported nearly 900 inches of snow in one season.2
Ice storms and freezing rain can cause severe problems when they occur. The most common freezing rain events occur in the proximity of the Columbia Gorge. The Gorge is the most significant east‐west air passage through the Cascades. In winter, cold air from the interior commonly flows westward through the Gorge, bringing very cold air to the Portland area. Rain arriving from the west falls on frozen streets, cars, and other sub‐freezing surfaces, creating severe problems. As one moves away from the Gorge, temperatures moderate as the marine influence becomes greater and cold interior air mixes with milder west‐side air. Thus freezing rain is often confined to areas in the immediate vicinity of the Gorge: Corbett, Troutdale, perhaps as far west as Portland Airport. Downtown Portland and the western and southern suburbs often escape with no ice accumulation.3
HISTORY OF WINTER STORMS IN OREGON
A list of Oregon's most significant ice storms may be found in Appendix WS‐2. The following are Oregon’s most notable snowstorms, according to the National Weather Service:
1 National Weather Service – Portland, Oregon Forecast Office, Historical Storms and Data—Oregon’s Notable Historical Snowstorms, March 20, 2003
2 Oregon Climate Service, The Climate of Oregon, From Rain Forest to Desert, Corvallis, Oregon 1999
3 From The Oregon Weather Book, A State of Extremes, George Taylor and Raymond Hatton, OSU Press, 1999
State of Oregon Natural Hazards Mitigation Plan February 2012
Emergency Management Plan 3‐WS‐3
1884 SnowstormOne‐Day Totals
December 16 to 18, 1884 – Only a few widely scattered observing stations existed at this time. However, enough reports were available to provide some insight to this heavy snowstorm. Most of the heavy snow fell over the Columbia River Basin from Portland to The Dalles and along the Cascades foothills in the Willamette Valley.
Albany 16.0 inches The Dalles 29.5 inches Portland 12.4 inches
1892 SnowstormTotals
December 20 to 23, 1892 – Substantial snow fell across most of northern Oregon, with the greatest snowfall reported over northwestern Oregon. In the northwest part of the state, storm totals ranged from 15 to 30 inches.
Albany 15.0 inches Corvallis 14.0 inches Portland 27.5 inches Forest Grove 28.0 inches Pendleton 8.0 inches
1909 SnowstormTotals
January 5 to 10, 1909 – Many locations, particularly in western Oregon, received more snow in this six‐day period than they normally would receive in an entire year.
Ashland 9.1 inches
Eugene 15.1 inches
Forest Grove 29.0 inches
Lakeview 17.0 inches
Portland 19.3 inches
The Dalles 14.5 inches
January 11 to 15, 1916 – This storm affected the entire state. A few days earlier, on January 6 through January 10, heavy snow fell in mountainous areas; Siskiyou Summit received 15.0 inches in one day, and 34.5 inches for the entire storm. During the same storm, Cascade Locks received 7.0 inches in one day and 24.0 inches for the entire storm. During the second storm of January 11 through 15, every reporting station in western Oregon, except for the southwestern interior and the coastal areas, recorded storm totals of at least five inches and most locations had eight inches or more. McMinnville had the honors of the most snow in one day, with 11 inches falling on January 12. Siskiyou Summit received another 24.0 inches, adding to the 34 inches already on the ground from the previous storm. Higher elevations in the Cascades received very heavy snowfall.
January 30 to February 3, 1916 – Snow produced by this storm fell mostly along the northern Oregon border. Heaviest snowfall occurred in the Hood River Valley where Parkdale received 29.5 inches in one day (Feb. 2) and a storm total of 81.5 inches. Heavy snow also fell at other locations, especially in the higher Cascades. Government Camp had a one‐day snowfall of 41.0 inches and a storm total of 87.5 inches. There had been considerable snow earlier at many of these locations, especially those in the Cascades. At many of these locations, the earlier snow had not melted. As a result, very substantial snow depths occurred with the
February 2012 Natural Hazards Mitigation Plan State of Oregon
3‐WS‐4 Emergency Management Plan
addition of new snow.
1919 Snowstorm Totals (inches)
December 9 to 11, 1919 – This snowstorm was one of three heaviest snowfall‐producing storms to hit Oregon on record. It was a particularly cold December with the lowest statewide average temperature since record keeping began in 1890. The Columbia River froze over, closing the river to navigation from the confluence with the Willamette River upstream. The snowstorm affected nearly every part of the state, with heaving snow falling over a widespread area. The heaviest snow fell on December 10.
Albany 25.5
Bend 49.0
Cascade Locks 21.5
Eugene 8.5
Heppner 16.0
Parkdale 63.0
Pendleton 15.0
Siskiyou Summit 50.0
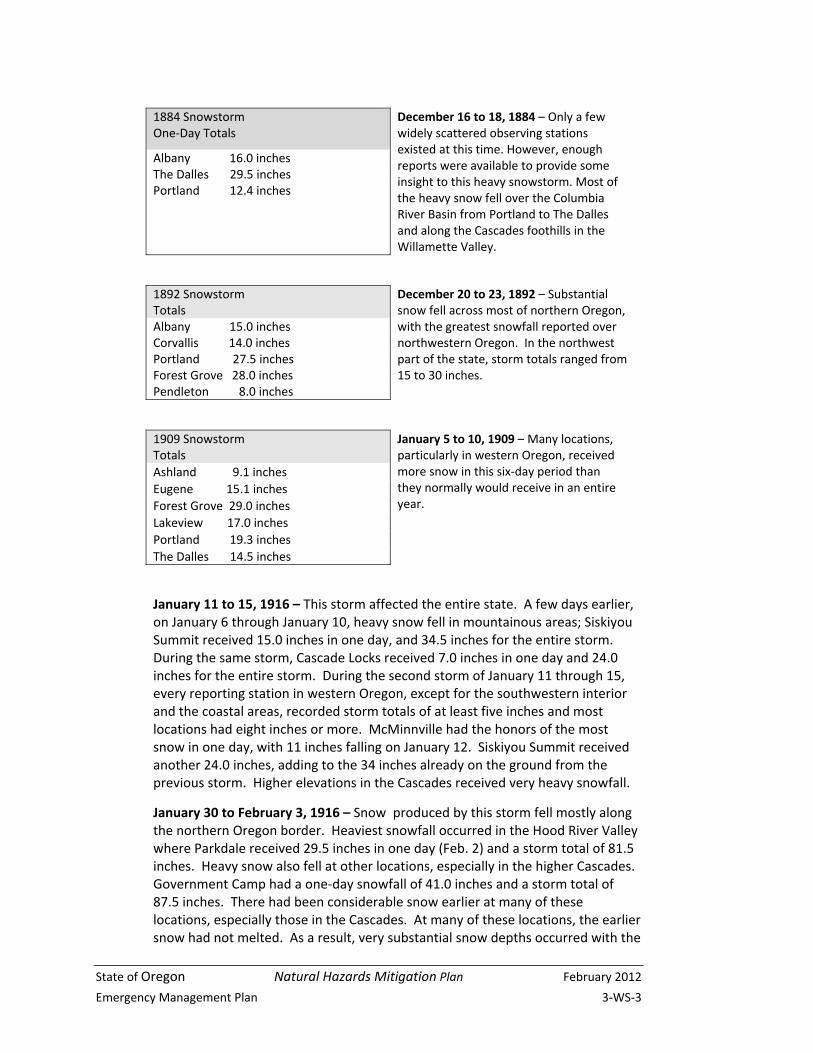
February 10, 1933 ‐ A cold outbreak brought a surge of Arctic air into the state. The city of Seneca, in northeast Oregon, recorded the state's all‐time record low temperature of ‐54 degrees F.4 The next day it was nearly 100 degrees warmer when the high reached 45 degrees.
January 31 to February 4, 1937 – While this storm was generally statewide, the heavy snowfalls were largely confined to the western slopes of the Cascades and the Willamette Valley. Heaviest snow fell on the afternoon and evening of January 31 and into the morning of February 1. Deep snowdrifts blocked major highways and most minor roads in northern Oregon and the passes of the Cascade Mountains for several days.
4 Ukiah reached the same low temperature the day before, but Seneca is credited with the official record because it is more recent.
Figure WS‐2: Rescuing snow bound vehicles, Old Oregon Trail Highway between Kamela and Meacham, 1923 (photo courtesy of ODOT)
State of Oregon Natural Hazards Mitigation Plan February 2012
Emergency Management Plan 3‐WS‐5
January 9 to 18, 1950 – January 1950 was a very cold month statewide, with frequent snowstorms. For the state as a whole, snow was heavier during this January than ever before, at least since the beginning of weather record keeping. For some areas, the heaviest one‐day snowfall was reported during the first few days, while for others the heaviest one‐day snowfall occurred later. See Appendix WS‐3 for snowfall accumulation around the state during January 1950.
Actually, there were three storms, but very little time separated them. Their net effect was a nearly continuous storm. On the 13th, snow was accompanied by high winds, creating widespread blowing and drifting of snow. Deep snowdrifts closed all highways west of the Cascades and through the Columbia River Gorge.
A very severe sleet storm began around noon on the 18th. Within hours sleet piled up to depths of four to five inches in northwestern Oregon. During the night of the 18th, the sleet turned to freezing rain, and created much havoc on highways, trees, and power lines. Hundreds of motorists were stranded in the Columbia River Gorge. The stranded motorists had to be rescued by train, though even all rail traffic had considerable difficulty and many delays in getting through the Gorge. Freezing rain downed many trees and power lines, creating wide‐spread power outages across northwestern Oregon. Hundreds of thousands of dollars of damage occurred.
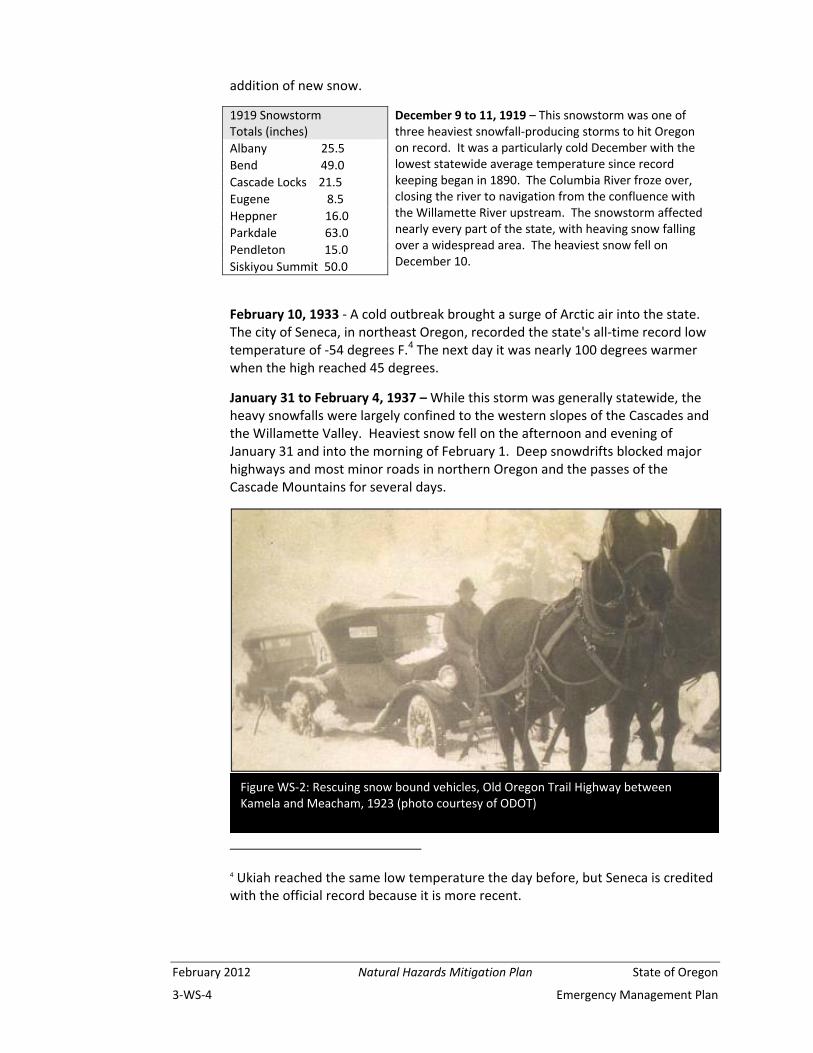
January 25 to 31, 1969 – For many areas, this storm was the most extreme on record. Snow‐ fall over the state was much above normal, mostly in part due to a very cold January. Between January 25 and January 30, snowfall records throughout Lane, Douglas, and Coos counties were surpassed by incredible numbers. Snowfalls of two to three feet fell on the valley floors, with much heavier amounts in the higher terrain. At Eugene, a snow depth of 34 inches was
Figure WS‐3: Willamette Valley – January 1969 (photo courtesy of the National Weather Service)
February 2012 Natural Hazards Mitigation Plan State of Oregon
3‐WS‐6 Emergency Management Plan
recorded on January 30, and the total January snowfall was 47 inches, nearly seven times the normal monthly snowfall. Roseburg reported a snow depth of 27 inches and a monthly snowfall of 35.2 inches. Along the coast, where the average snowfall is generally less than two inches, January snowfall totals ranged from two to three feet, with snow depths of 10 to 20 inches reported.
Hundreds of farm buildings and several large industrial buildings collapsed under the weight of the heavy wet snow. Losses in livestock were heavy. Entire communities were completely isolated for nearly a week in some locations. At times, traffic on nearly every major highway west of the Cascades and some in central Oregon were halted at a number of locations. Total losses from this snowstorm were estimated between $3 million and $4 million.
February 1 to 8, 1989 – Arctic air pushed southward across Oregon between the 1st and 3rd of the month. Heavy snow fell over all of Oregon. Some coastal areas had six to 12 inches of snow, an almost unheard of event. Salem reported nine inches of snow, and more than a foot settled over the state. Numerous record temperatures were set. Strong winds produced wind chill temperatures of between 30 and 60 degrees below zero Fahrenheit. There were extensive power failures as well as considerable home and business damage resulting from frozen plumbing throughout the state. Damage estimates exceeded one million dollars. Several moored boats sank on the Columbia River because of ice accumulation. There were five weather‐related deaths, three in auto accidents caused by ice and snow, and two in which women had frozen to death.
February 14 to 16, 1990 – A storm brought 24 to 35 inches of snow to the Columbia Gorge cities of Cascade Locks and Hood River. Up to 28 inches fell in the North Coast Range, 16 inches at Timberline Lodge. The Willamette Valley was coated with two to four inches, except for the higher hills around Portland, which received up to one foot. On the 16th, 10 to 15 inches of new snow fell in the North Coast Range and 20 to 35 inches in the North Cascades. The South Cascades reported between one and two feet of additional snow. The Columbia Gorge had up to six inches of additional snow while the Willamette Valley had two to five inches more. South‐central areas did not escape the new snow, with nine inches reported at Chemult and six to eight inches reported in the Klamath Falls and Lakeview areas. Tipton Summit in the northeast mountains had six inches of snow as did Juntura in the southeast.
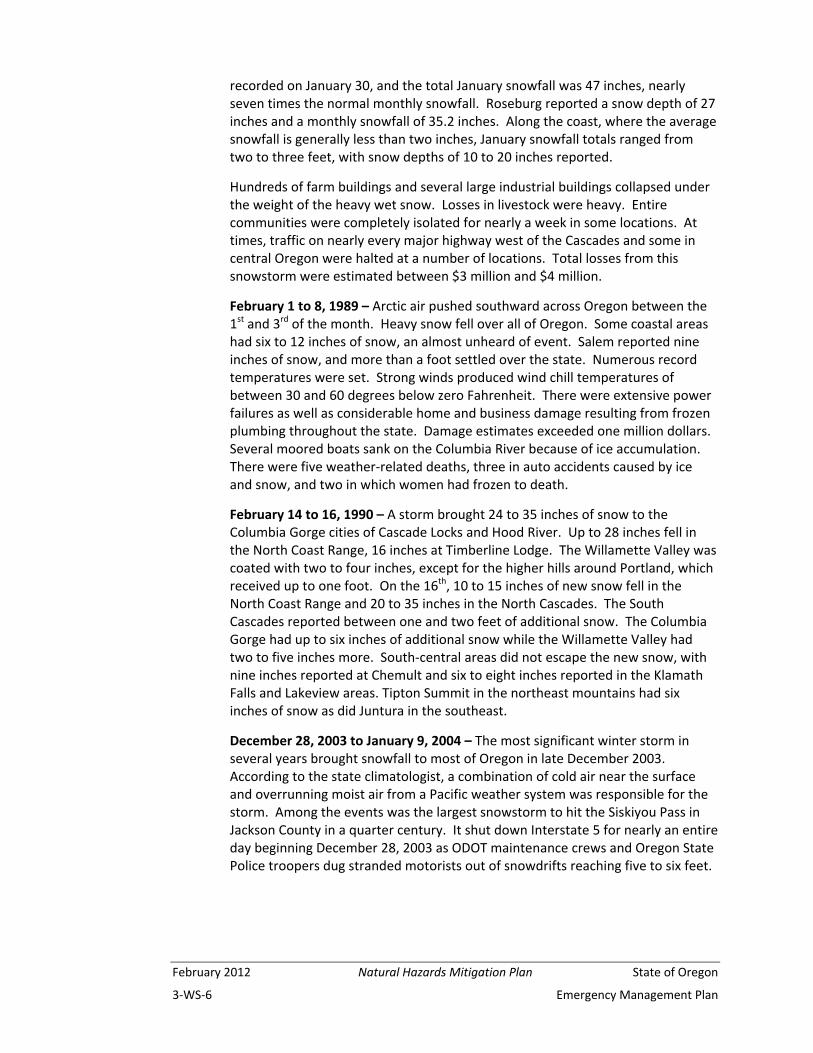
December 28, 2003 to January 9, 2004 – The most significant winter storm in several years brought snowfall to most of Oregon in late December 2003. According to the state climatologist, a combination of cold air near the surface and overrunning moist air from a Pacific weather system was responsible for the storm. Among the events was the largest snowstorm to hit the Siskiyou Pass in Jackson County in a quarter century. It shut down Interstate 5 for nearly an entire day beginning December 28, 2003 as ODOT maintenance crews and Oregon State Police troopers dug stranded motorists out of snowdrifts reaching five to six feet.
State of Oregon Natural Hazards Mitigation Plan February 2012
Emergency Management Plan 3‐WS‐7
Areas of the Blue Mountains in eastern Oregon received two feet of new snow, bringing roadside snow levels to more than six feet along sections of the Tollgate Highway, Oregon 204. The eastbound lanes of Interstate 84 were closed at Ladd Canyon east of La Grande from noon January 4 to
1 a.m. January 5. Although traffic was moving on I‐84 crossing Cabbage Hill and through the Meacham area between Pendleton and La Grande, the eastbound closure was moved to Pendleton as stranded motorists filled truck stops, motels and restaurants in the La Grande area.
Wet snow also blanketed highways in the Willamette Valley, causing power lines and trees to topple. Oregon 34 east of Philomath was closed for 30 hours January 5 and 6 while crews removed trees.
The snow situation on the Siskiyou Pass, however, made national news and was one of the top stories December 30 on the CNN website. The massive, fast moving storm closed 150 miles of I‐5 from Ashland to south of Redding, California. The closure occurred December 28 at 9 p.m., leaving 100 to 200 vehicles stranded on the Siskiyou Pass overnight. The American Red Cross opened a shelter on the Southern Oregon University campus, and reports out of cities from Redding to Medford confirmed that all motels were full.
Emergency services, such as the Jackson County Sheriff’s Office, the Oregon State Police, ODOT, and the California Department of Transportation delivered gasoline, food, and water to stranded motorists. Snowmobiles were employed by Jackson County Search and Rescue to serve hard‐to‐reach areas. The Oregon State Police reported one fatality related to the storm. A man apparently died from a heart attack the morning of December 29 after aiding other motorists stranded on the pass.
The northbound lanes of I‐5 on the Siskiyou Pass were reopened at 4 p.m. December 29, following the 19‐hour closure. The southbound lanes were reopened at 11 p.m. as crews continued to extricate stranded vehicles and plow the highway. Stranded motorists were given the option of staying with their vehicles or being transported to nearby shelters and having their cars towed.
In early January 2004, the snow event turned into a major ice storm. Cold air remained over all of Oregon during the first week of the month. On January 5, a Pacific storm approached the Oregon coast. Rain began to fall in the southern Willamette Valley in the early hours of January 6. As the rain reached the ground,
Figure WS‐4: Stranded motorists on Interstate 5 southbound at Siskiyou Pass, late December 2003; note vehicles being towed out the "wrong way" (photo courtesy of ODOT)
February 2012 Natural Hazards Mitigation Plan State of Oregon
3‐WS‐8 Emergency Management Plan
it generally froze on contact with roads, cars, and trees that had been chilled by the cold temperatures. Icy roads made driving hazardous. Many trees were damaged or destroyed by large amounts of ice adhering to the branches. Downed power lines, often due to falling trees, caused power outages. Many businesses, school districts, and government offices closed or shortened their hours due to the storm.
Several hundred flights were cancelled at the Portland International Airport beginning the evening of January 6. Thousands of passengers were stranded and many of them had to sleep at the airport. Airport officials said runway conditions were among the worst in recorded history. The MAX light rail system also was shut down by the storm. For the first time in anyone’s memory, ODOT required travelers to chain up on any Portland metro area highway. Due to high winds, freezing rain, and blowing snow, ODOT closed Interstate 84 through the Columbia Gorge twice, for almost 70 hours total. Freight trucks and passenger cars had to detour over Mount Hood where, ironically, road conditions were better than they were in downtown Portland.
Icy conditions caused ODOT to close US 101 over the Astoria Megler Bridge for about 14 hours as large chunks of ice fell off the bridge’s superstructure. Many other highways in the state were closed at times due to ice, fallen trees, or poor visibility. At one point, chains were required on almost all of I‐5 in Oregon.
The freezing rain that crippled the western portion of the state also made it to eastern Oregon. Minus thirty degrees was reported in Meacham on January 4. Wind gusts of more than 60 mph in Union County created whiteout conditions later in the week, prompting the closure of I‐84 between La Grande and Baker City. Several other highway sections in the area also were closed due to the blizzard‐like conditions. In Union, a three‐year‐old boy died of hypothermia after he apparently sneaked outside to play in the snow early January 6. The cold weather also claimed the life of a 91‐year‐old woman who was found January 7 near her home in the Blue Mountains north of Elgin, according to the Union County Sheriff’s Office.
President Bush issued a major disaster declaration for 26 Oregon counties affected by the winter storm. The declaration was eventually extended to 30 of Oregon’s 36 counties.
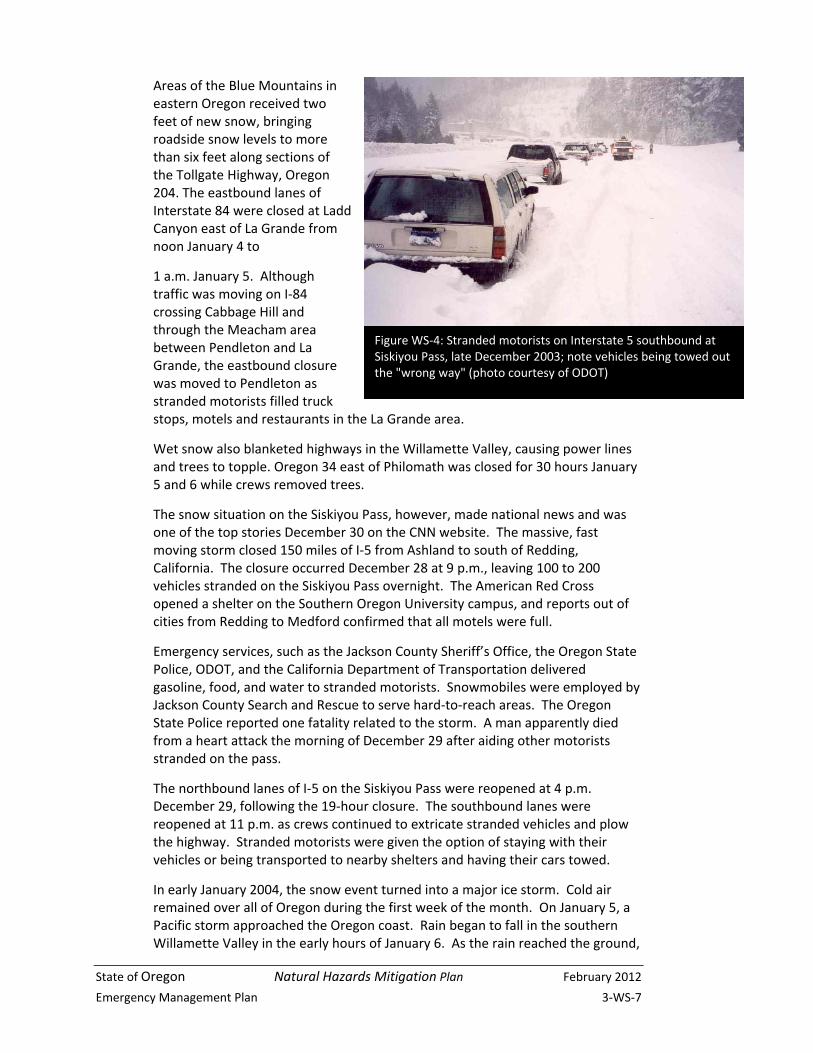
January 2 to February 9,
2008– A series of vigorous winter storms brought record setting snow accumulation to Detroit,
Figure WS‐5: Detroit Ranger Station Headquarters, February 2, 2008, buried from the 12 feet of snow received. (photo courtesy of ODOT)
State of Oregon Natural Hazards Mitigation Plan February 2012
Emergency Management Plan 3‐WS‐9
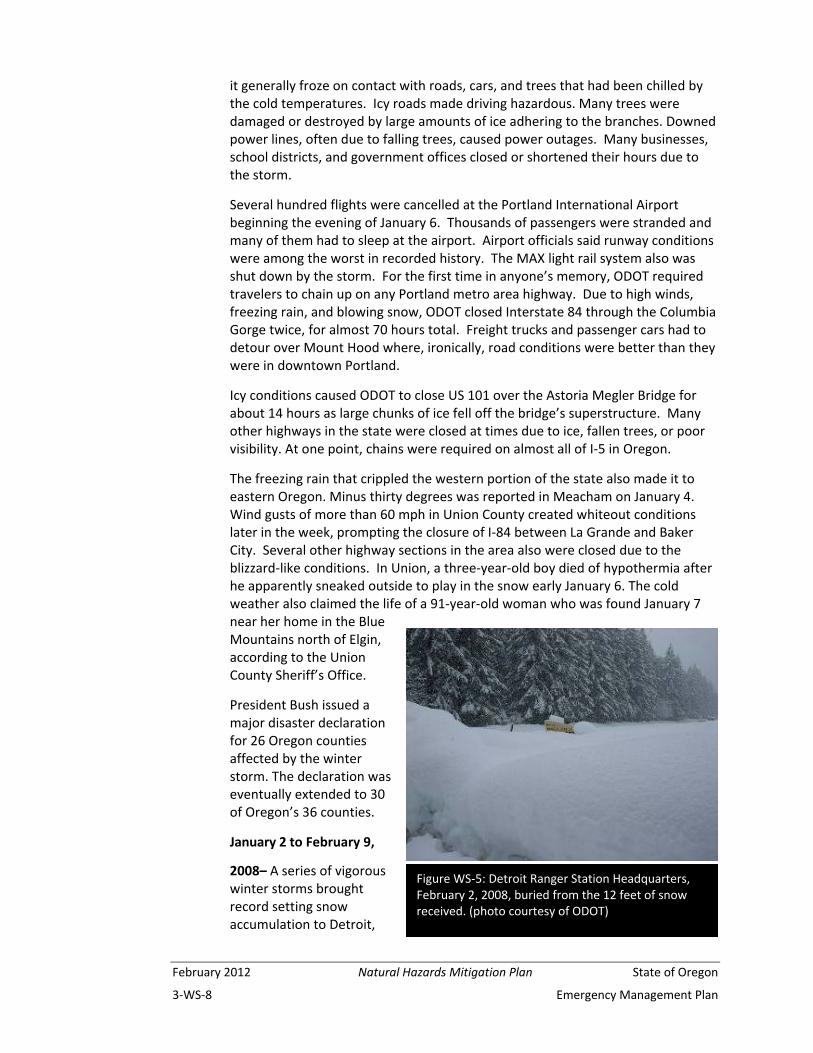
Oregon. Three dozen Oregon National Guard personnel were called in to help with snow removal in Detroit and Idanha. The towns received over 12 feet of snow in several weeks. Inmate crews were also called in to remove snow that cracked walls and collapsed roofs. ODOT Highway Maintenance crews that live in employee housing at Santiam Pass were affected both with extra hours of work and the damage to their homes. Several of the mobile homes and contents were lost from the collapse of the roof.
Effects
A major winter storm can last for days and can include high winds, freezing rain or sleet, heavy snowfall, and cold temperatures. People can become marooned at home without utilities or other services. Severe cold can cause much harm. It can damage crops and other vegetation and freeze pipes, causing them to burst. Unusually cold temperatures are especially dangerous in areas not accustomed to them because residents are generally unprepared and may not realize the dangers severe cold presents.
Heavy snowfall and blizzards can trap motorists in their vehicles and make walking to find help a deadly mistake. Heavy snow can immobilize a region and paralyze a city, stranding commuters, closing airports, stopping the flow of
Figure WS‐6: Trees collapse from weight of the snow on Oregon 62 near Prospect, February 2, 2008, (photo courtesy of ODOT)
Figure WS‐7: Keizer CERT Members tackling a snow covered roof in Idanha, February 9, 2008, (photo courtesy of Salem News)
February 2012 Natural Hazards Mitigation Plan State of Oregon
3‐WS‐10 Emergency Management Plan
supplies, and disrupting emergency and medical services. Accumulations of snow can cause roofs to collapse and knock down trees and power lines. Homes and farms may be isolated for days. In rural areas, unprotected livestock can be lost. In urban areas, the cost of snow removal, damage repair, and lost business can have severe economic impacts.
Heavy accumulations of ice can bring down trees and topple utility poles and communication towers. Ice can disrupt power and communication for days while utility companies repair extensive damage. Even small accumulations of ice can be dangerous to motorists and pedestrians. Bridges and overpasses are particularly dangerous because they freeze before other surfaces. Sleet is rain that freezes into ice pellets before reaching the ground. Sleet usually bounces when hitting a
surface and does not stick to objects; however, it can accumulate like snow and cause roads and walkways to become hazardous.
Freezing rain (also known as an ice storm) is rain that falls onto a surface with a temperature below freezing. The cold surface causes the rain to freeze so the surfaces, such as trees, utilities, and roads, become glazed with ice. Even small
accumulations of ice can cause a significant hazard to property, pedestrians, and motorists.
Black ice can fool drivers into thinking water is on the road. What they may not realize is that condensation, such as dew, freezes when temperatures reach 32 degrees F or below, forming a thin layer of ice. This shiny ice surface is one of the most dangerous road conditions. Black ice is likely to form under bridges and overpasses, in shady spots and at intersections.
Meteorologists define heavy snow as six inches or more falling in less than twelve hours, or snowfall of eight inches or more in twenty‐four hours. A blizzard is a severe winter weather condition characterized by low temperatures and strong winds blowing a great deal of snow. The National Weather Service defines a blizzard as having wind speeds of 35 mph or
The American Society of Civil Engineers has developed a 50‐year recurrence interval map of Oregon showing probabilities for ice thickness caused by freezing rain (ASCE‐7‐02, 2003a). See: http://www.americanlifelinesalliance.org/pdf/aaaOilGas_Commentary_FINAL043004RDraft.pdf
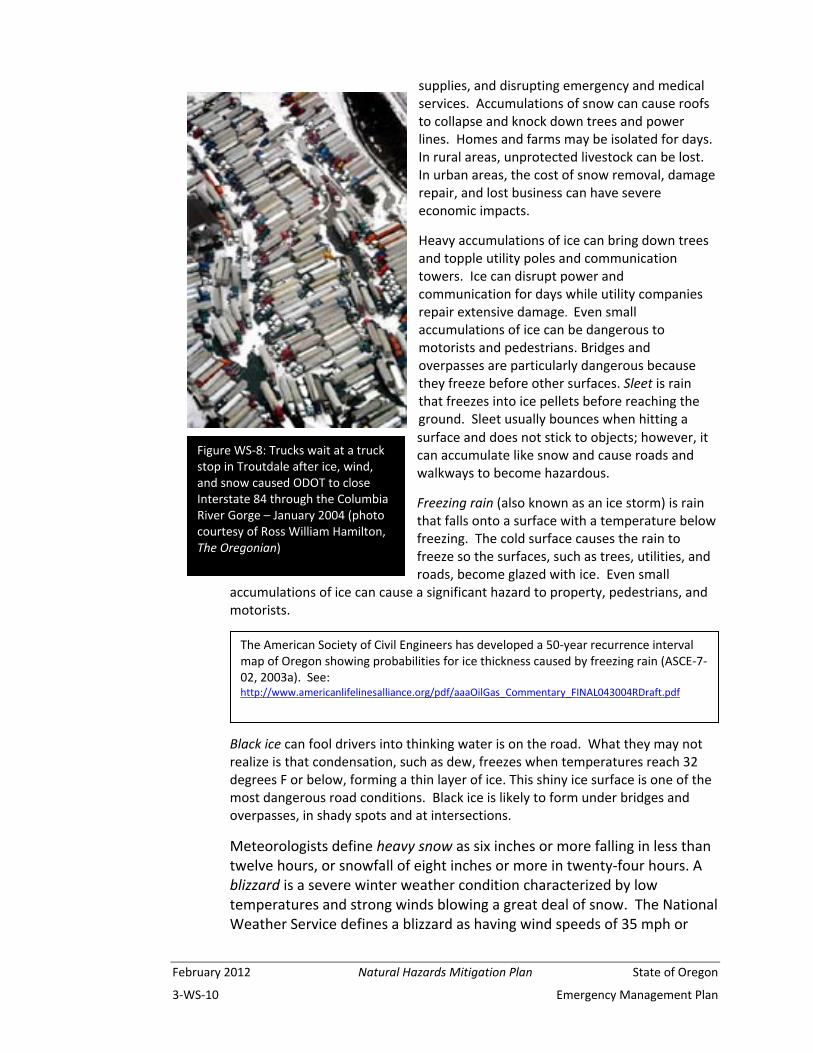
Figure WS‐8: Trucks wait at a truck stop in Troutdale after ice, wind, and snow caused ODOT to close Interstate 84 through the Columbia River Gorge – January 2004 (photo courtesy of Ross William Hamilton, The Oregonian)
State of Oregon Natural Hazards Mitigation Plan February 2012
Emergency Management Plan 3‐WS‐11
more, with a visibility of less than a quarter mile. Sometimes a condition known as a whiteout can occur during a blizzard. This is when the visibility drops to zero because of the amount of blowing snow.
Driving can be tricky in the snow, but once a storm has passed, there is another danger: flying snow from trucks and cars. When snow is warmed by the vehicle, it will begin to melt. Wind and motion cause sections to break off and hit other vehicles. The snow can also fall on the road, melt, and later turn into ice.
Wind blowing across your body makes you feel colder. The wind chill factor is a measure of how cold the combination of temperature and wind makes you feel. Wind chill of 50 degrees or lower can be very dangerous: exposed skin can develop frostbite in less than a minute, and a person or animal could freeze to death after just 30 minutes of exposure.
Exposure to cold can cause frostbite and life‐threatening hypothermia. Frostbite is the freezing of body tissue. It most frequently affects fingers, toes, earlobes, and the tip of the nose. Hypothermia begins to occur when a person’s body temperature drops three degrees below normal temperature. On average, a person begins to suffer hypothermia if his or her temperature drops to 96 degrees F (35.6 degrees C). Cold temperatures can cause hypothermia in anyone who is not adequately clothed or sheltered in a place with adequate heat. Hypothermia can kill people, and those who survive hypothermia are likely to suffer lasting ill effects. Infants and elderly people are the most susceptible. Elderly people account for the largest percentage of hypothermia victims, many of whom freeze to death in their own homes. Most of these victims are alone and their heating systems are working improperly or not at all. People who take certain medications, who have certain medical conditions, or who have been drinking alcohol also are at increased risk for hypothermia.
Winter storms are considered deceptive killers because most winter storm deaths are related only indirectly to the storms. Overall, most winter storm deaths result from vehicle or other transportation accidents caused by ice and snow. Exhaustion and heart attacks brought on by overexertion are two other common causes of deaths related to winter storms. Tasks such as shoveling snow, pushing a vehicle, or even walking in heavy snow can cause a heart attack, particularly in people who are older or who are not used to high levels of physical activity. Home fires occur more frequently in the winter because people do not take the proper safety precautions when using alternative heat sources. Fires during winter storms present a great danger because water supplies may freeze and it may be difficult for firefighting equipment to get to the fire. In addition, people can be killed by carbon monoxide emitted by fuels such as charcoal briquettes
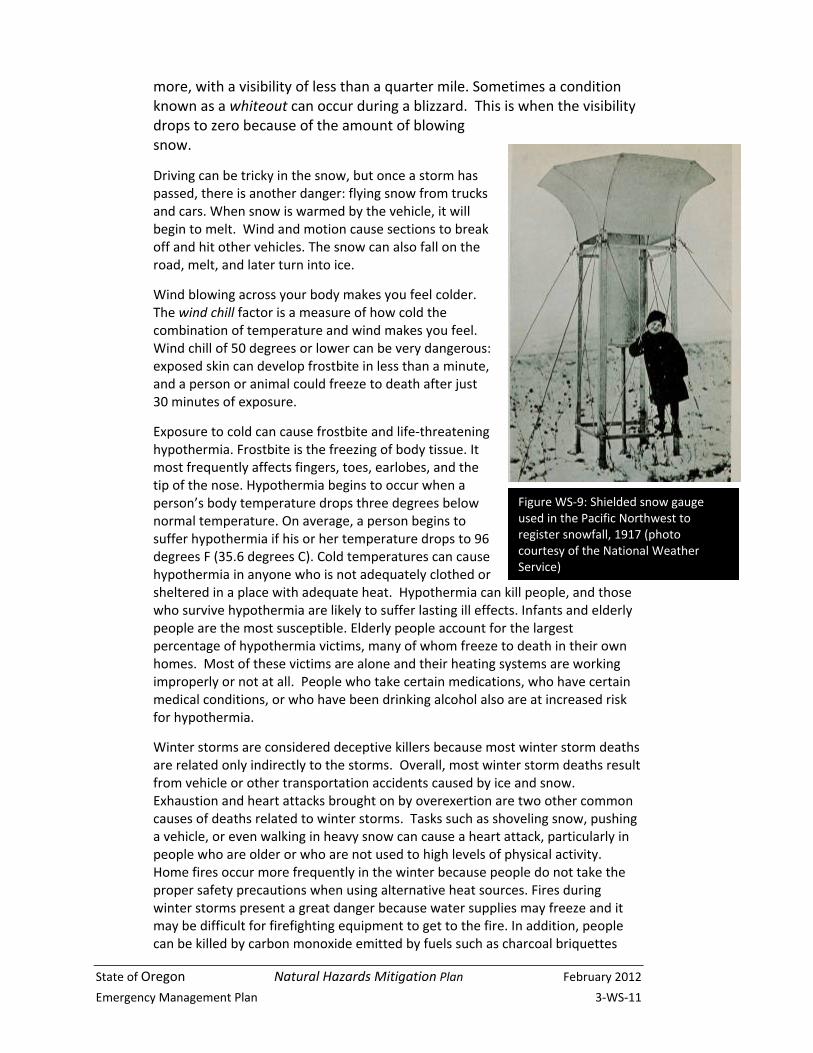
Figure WS‐9: Shielded snow gauge used in the Pacific Northwest to register snowfall, 1917 (photo courtesy of the National Weather Service)
February 2012 Natural Hazards Mitigation Plan State of Oregon
3‐WS‐12 Emergency Management Plan
improperly used to heat homes.5
When an ice storm strikes, some landscape trees seem to be able to come through with only minor damage, while others suffer the loss of large limbs or sizable parts of their branching structure. In the worst cases, trees may be completely split in two or may have nothing left standing but a trunk. If a tree has been weakened by disease, there may be little that can be done to prevent major breakage or loss when the stresses of a storm occur. However, there are preventive measures that cities and property owners can take to help their trees be stronger and more resistant to storm damage. For more information, see Appendix WS‐4: Reducing Ice Storm Damage to Trees.
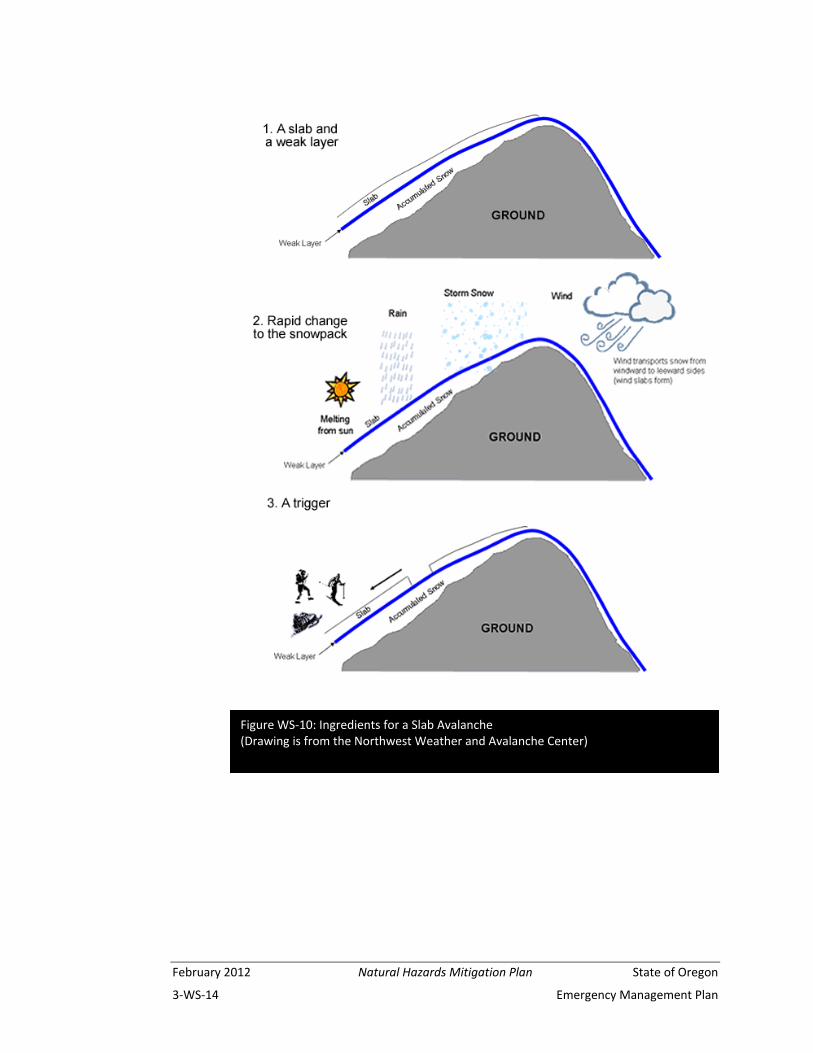
A snow avalanche is a mass of snow falling down a mountain or incline. Three variables interact to determine whether an avalanche is possible:
1. Terrain: the slope must be steep enough to avalanche. 2. Snowpack: the snow must be unstable enough to avalanche. 3. Weather: changing weather can quickly increase instability.
According to the Northwest Weather and Avalanche Center, avalanches don’t happen by accident and most human involvement is a matter of choice, not chance. Most avalanche accidents are caused by slab avalanches that are triggered by the victim or a member of the victim’s party. (See diagram of a slab avalanche.) However, any avalanche may cause injury or death and even small slides may be dangerous. On average, about 30 people in the United States are killed in avalanches each year. For the 21 years between 1985 and 2006. Oregon ranks 10th among the states for avalanche fatalities with five fatalities. This is based on statistics from the Colorado Avalanche Information Center. Avalanche victims are almost exclusively backcountry recreationists—snowmobilers, climbers, snowboarders, snowshoers, skiers, and hikers. Nationally snowmobilers lead the list with twice as many fatalities as any other activity.
According to Portland Mountain Rescue, most avalanche victims triggered the very avalanche that caught them. The group advises people to be aware of the constantly changing conditions in the backcountry and take a certified avalanche class to increase their avalanche awareness.
Ski areas are different from the backcountry. It is very rare for someone to get caught in an avalanche within a ski area. Professional snow safety crews rely on explosives and ski compaction to stabilize ski area snowpacks.
According to the Northwest Weather and Avalanche Center (NWAC), experts on the subject aren’t able to predict, nor do they completely understand each and every avalanche occurrence. Regional avalanche centers across the country do have the technology to forecast avalanche danger. These forecasts are valuable tools in reducing danger to people. However, no matter what forecasts indicate
5 From Talking About Disaster: Guide for Standard Messages, produced by the National Disaster Education Coalition, Washington, D.C., 2004
State of Oregon Natural Hazards Mitigation Plan February 2012
Emergency Management Plan 3‐WS‐13
even the smallest avalanche can be injurious or life threatening!
Avalanche danger ratings levels have been adopted within North America (with slight changes in Canada) and are generally accepted internationally. These levels are:
Low Avalanche Danger (green)—Natural avalanches very unlikely. Human triggered avalanches unlikely. Generally stable snow. Isolated areas of instability. Travel is generally safe. Normal caution advised.
Moderate Avalanche Danger (yellow)—Natural avalanches unlikely. Human triggered avalanches possible. Unstable slabs possible on steep terrain. Use caution in steeper terrain on certain aspects.
Considerable Avalanche Danger (orange)—Natural avalanches possible. Human triggered avalanches probable. Unstable slabs probable on steep terrain. Be increasingly cautious in steeper terrain.
High Avalanche Danger (red)—Natural and human triggered avalanches likely. Unstable slabs likely on a variety of aspects and slope angles. Travel in avalanche terrain is not recommended. Safest travel on windward ridges of lower angle slopes without steeper terrain above.
Extreme Avalanche Danger (red with black border)—Widespread natural or human triggered avalanches certain. Extremely unstable slabs certain on most aspects and slope angles. Large destructive avalanches possible. Travel in avalanche terrain should be avoided and travel confined to low angle terrain well away from avalanche path runouts.
February 2012 Natural Hazards Mitigation Plan State of Oregon
3‐WS‐14 Emergency Management Plan
Figure WS‐10: Ingredients for a Slab Avalanche(Drawing is from the Northwest Weather and Avalanche Center)
State of Oregon Natural Hazards Mitigation Plan February 2012
Emergency Management Plan 3‐WS‐15
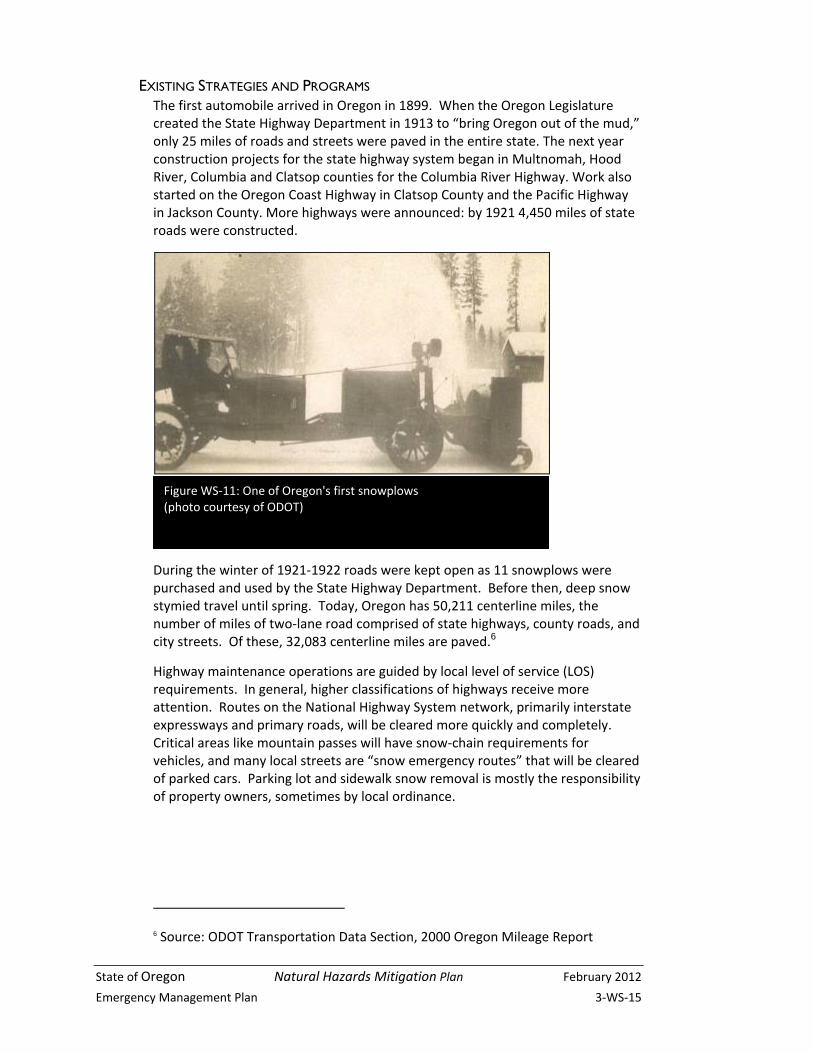
EXISTING STRATEGIES AND PROGRAMS The first automobile arrived in Oregon in 1899. When the Oregon Legislature created the State Highway Department in 1913 to “bring Oregon out of the mud,” only 25 miles of roads and streets were paved in the entire state. The next year construction projects for the state highway system began in Multnomah, Hood River, Columbia and Clatsop counties for the Columbia River Highway. Work also started on the Oregon Coast Highway in Clatsop County and the Pacific Highway in Jackson County. More highways were announced: by 1921 4,450 miles of state roads were constructed.
During the winter of 1921‐1922 roads were kept open as 11 snowplows were purchased and used by the State Highway Department. Before then, deep snow stymied travel until spring. Today, Oregon has 50,211 centerline miles, the number of miles of two‐lane road comprised of state highways, county roads, and city streets. Of these, 32,083 centerline miles are paved.6
Highway maintenance operations are guided by local level of service (LOS) requirements. In general, higher classifications of highways receive more attention. Routes on the National Highway System network, primarily interstate expressways and primary roads, will be cleared more quickly and completely. Critical areas like mountain passes will have snow‐chain requirements for vehicles, and many local streets are “snow emergency routes” that will be cleared of parked cars. Parking lot and sidewalk snow removal is mostly the responsibility of property owners, sometimes by local ordinance.
6 Source: ODOT Transportation Data Section, 2000 Oregon Mileage Report
Figure WS‐11: One of Oregon's first snowplows (photo courtesy of ODOT)
February 2012 Natural Hazards Mitigation Plan State of Oregon
3‐WS‐16 Emergency Management Plan
ODOT Winter Maintenance Practices
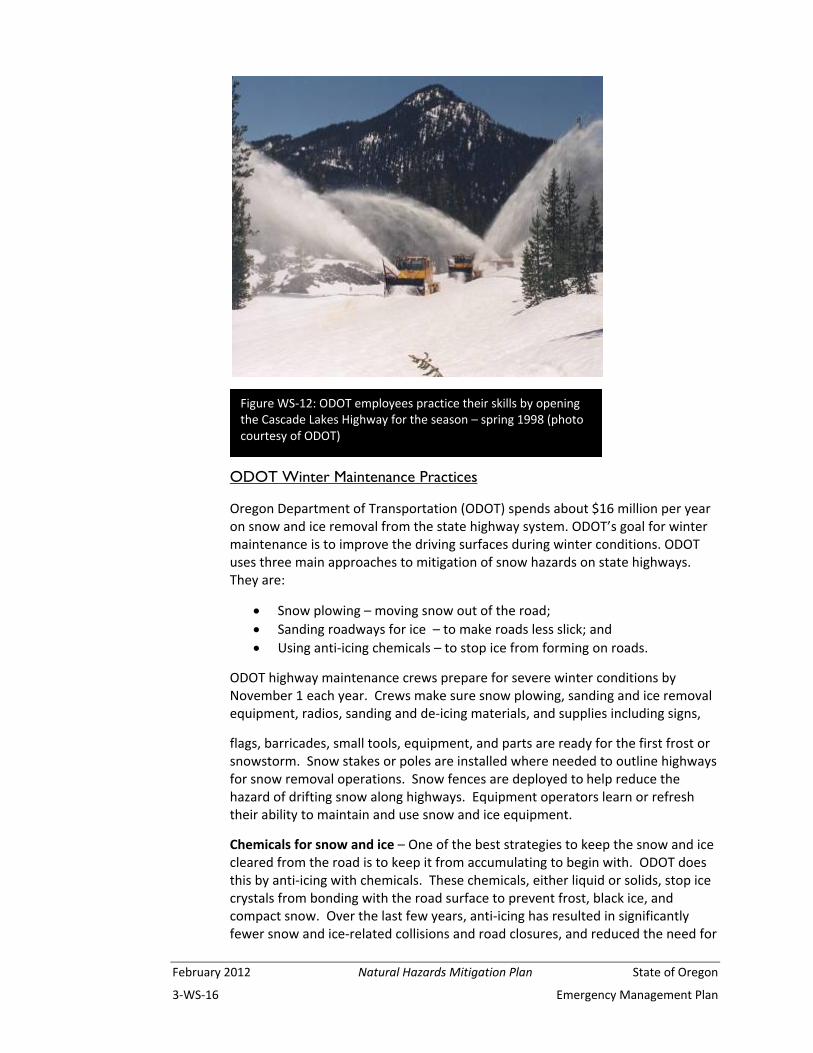
Oregon Department of Transportation (ODOT) spends about $16 million per year on snow and ice removal from the state highway system. ODOT’s goal for winter maintenance is to improve the driving surfaces during winter conditions. ODOT uses three main approaches to mitigation of snow hazards on state highways. They are:
Snow plowing – moving snow out of the road;
Sanding roadways for ice – to make roads less slick; and
Using anti‐icing chemicals – to stop ice from forming on roads.
ODOT highway maintenance crews prepare for severe winter conditions by November 1 each year. Crews make sure snow plowing, sanding and ice removal equipment, radios, sanding and de‐icing materials, and supplies including signs,
flags, barricades, small tools, equipment, and parts are ready for the first frost or snowstorm. Snow stakes or poles are installed where needed to outline highways for snow removal operations. Snow fences are deployed to help reduce the hazard of drifting snow along highways. Equipment operators learn or refresh their ability to maintain and use snow and ice equipment.
Chemicals for snow and ice – One of the best strategies to keep the snow and ice cleared from the road is to keep it from accumulating to begin with. ODOT does this by anti‐icing with chemicals. These chemicals, either liquid or solids, stop ice crystals from bonding with the road surface to prevent frost, black ice, and compact snow. Over the last few years, anti‐icing has resulted in significantly fewer snow and ice‐related collisions and road closures, and reduced the need for
Figure WS‐12: ODOT employees practice their skills by opening the Cascade Lakes Highway for the season – spring 1998 (photo courtesy of ODOT)
State of Oregon Natural Hazards Mitigation Plan February 2012
Emergency Management Plan 3‐WS‐17
studded tires. If snow and ice build up on the pavement, then chemicals may be used to de‐ice or assist in the removal of snow or ice. In some instances, a sand and chemical mixture may be used.
ODOT does not use “road salt” (sodium chloride). Instead, ODOT uses chemicals such as ‐inhibited magnesium chloride. Winter maintenance chemicals can be used both for anti‐icing before the storm to help prevent ice from bonding to the road surface, and as a deicer, after the storm to help break the bond between the ice and the road surface. ODOT applies winter maintenance chemicals at an average rate of 30 gallons per lane mile, which is about one ounce per square yard on the road. After applying, it takes very little additional precipitation to dilute the chemical completely. ODOT uses the least amount of chemical necessary. ODOT applies chemicals and sanding material primarily on hills, curves, structures, and known trouble spots. When driving, it is important to drive at speeds appropriate to the conditions, especially on straight roads that may not be treated. It is important to note that neither sand nor chemicals make the road safe. It is up to the motorist to drive at speeds appropriate for the weather and road conditions.
By using winter maintenance chemicals, ODOT has reduced sand and cinder usage. Sand and cinders can impact salmon habitat and stream water quality. Sand and cinders also get crushed by traffic, creating fine dust that can contribute to air quality concerns.
Use of winter maintenance chemicals can also be cheaper than sanding. Sand requires repeated applications because it’s easily blown off the road by traffic and in some areas must be swept up and hauled away for disposal, all of which adds
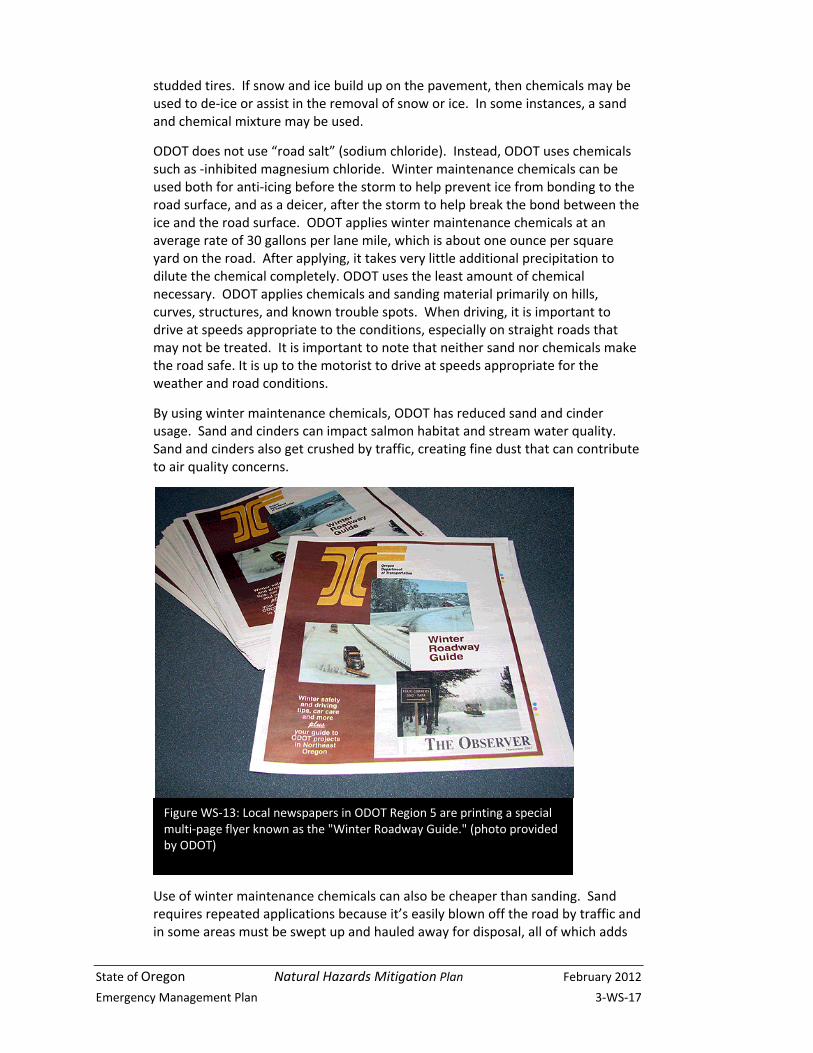
Figure WS‐13: Local newspapers in ODOT Region 5 are printing a special multi‐page flyer known as the "Winter Roadway Guide." (photo provided by ODOT)
February 2012 Natural Hazards Mitigation Plan State of Oregon
3‐WS‐18 Emergency Management Plan
cost.
ODOT has worked with environmental regulatory agencies to select appropriate chemicals and develop practices to make ODOT’s winter maintenance program more environmentally friendly. Suppliers of winter maintenance chemicals must meet very stringent specifications. The Pacific Northwest Snowfighters, a consortium of states and provinces including Washington, Oregon, Idaho, Montana, and British Columbia, developed the strict specifications that are used. ODOT has a statewide quality control/quality assurance program to ensure that all winter maintenance chemicals meet the specifications.
ODOT owns only about 10 percent of Oregon roads. ODOT’s winter maintenance practices may not reflect the practices used on county or city roadways.
Traveling Oregon highways in wintertime can pose quite a few challenges, especially for motorists unfamiliar with driving in snowy or icy conditions. To help inform motorists that might be new to wintertime travel in Eastern Oregon — and to provide some handy reminders for experienced drivers — several newspapers in ODOT’s Region 5 publish a special multi‐page flyer known as the Winter Roadway Guide. The annual newspaper insert is a collaborative effort between local media and ODOT.
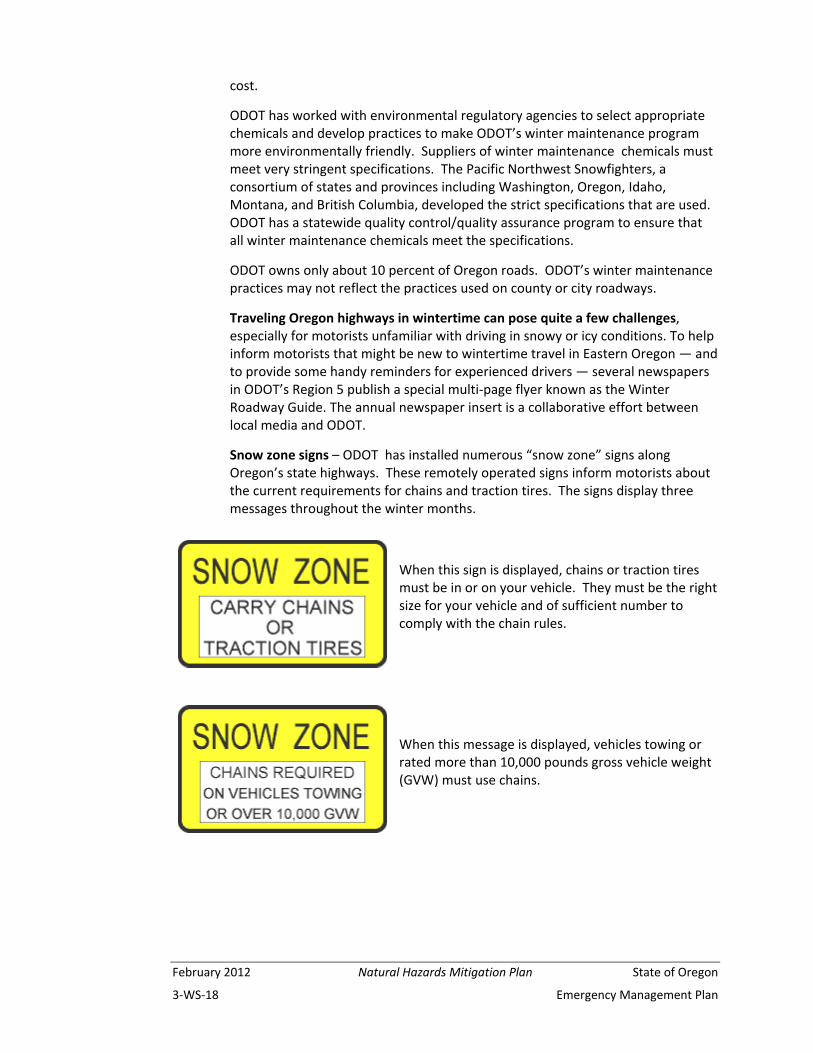
Snow zone signs – ODOT has installed numerous “snow zone” signs along Oregon’s state highways. These remotely operated signs inform motorists about the current requirements for chains and traction tires. The signs display three messages throughout the winter months.
When this sign is displayed, chains or traction tires must be in or on your vehicle. They must be the right size for your vehicle and of sufficient number to comply with the chain rules.
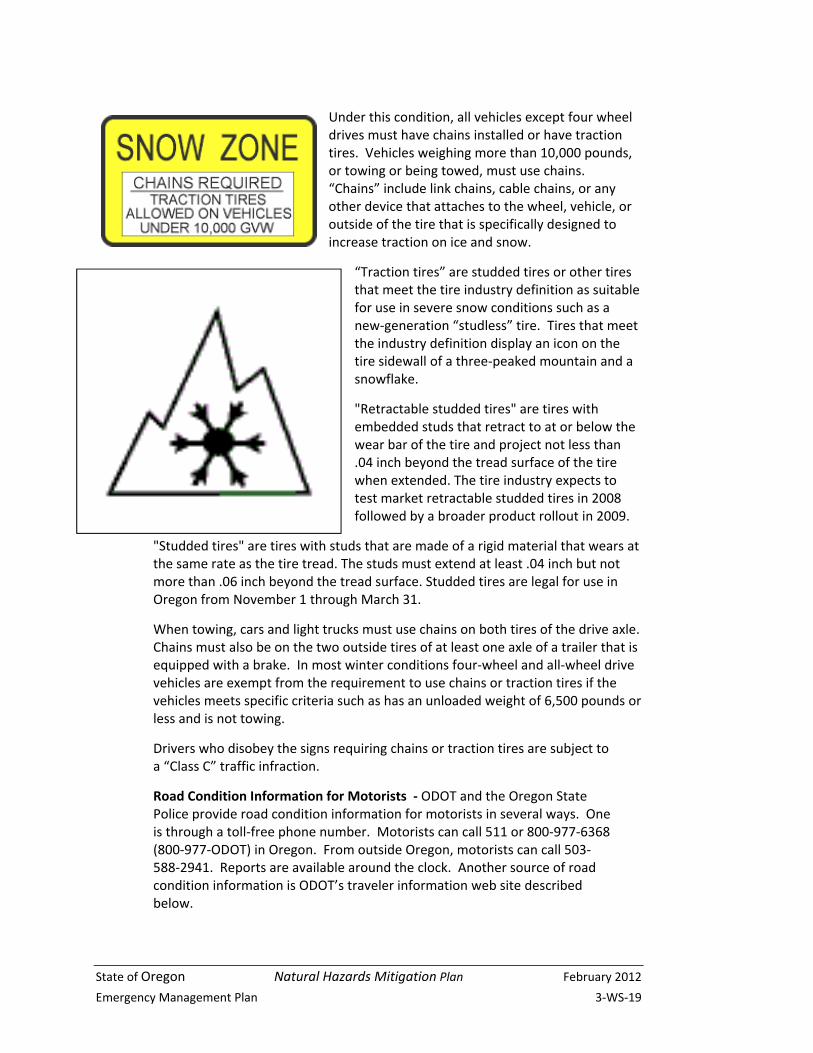
When this message is displayed, vehicles towing or rated more than 10,000 pounds gross vehicle weight (GVW) must use chains.
State of Oregon Natural Hazards Mitigation Plan February 2012
Emergency Management Plan 3‐WS‐19
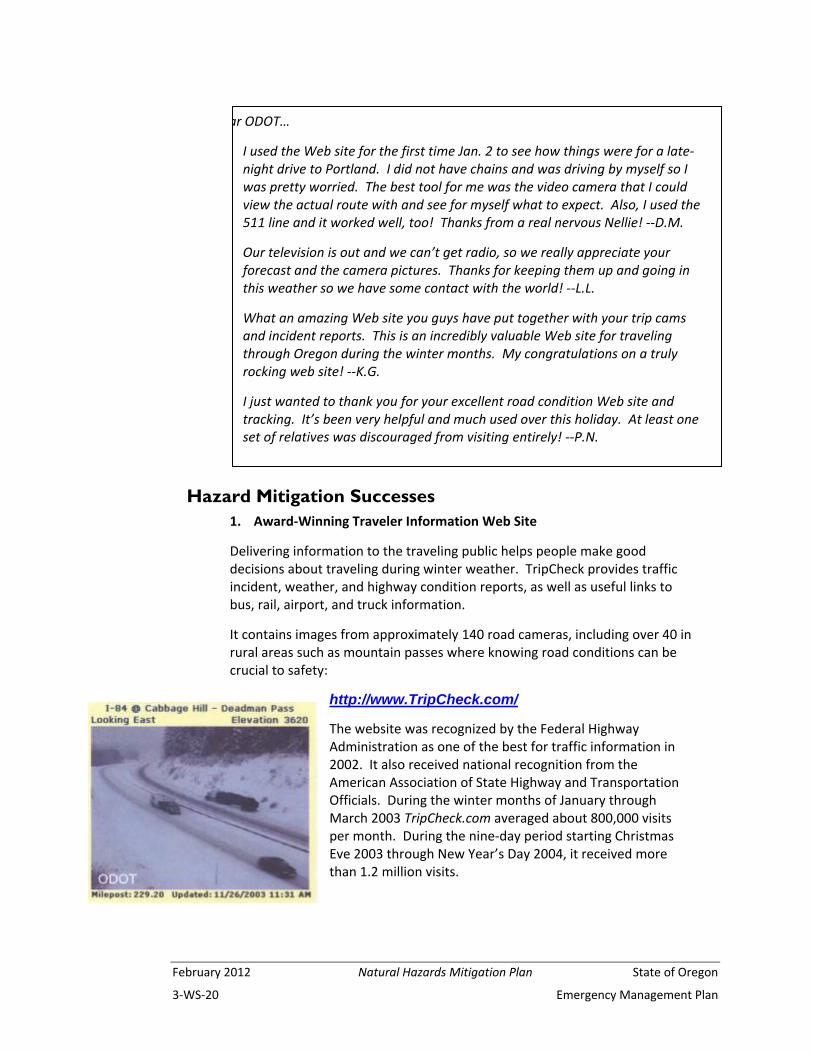
Under this condition, all vehicles except four wheel drives must have chains installed or have traction tires. Vehicles weighing more than 10,000 pounds, or towing or being towed, must use chains. “Chains” include link chains, cable chains, or any other device that attaches to the wheel, vehicle, or outside of the tire that is specifically designed to increase traction on ice and snow.
“Traction tires” are studded tires or other tires that meet the tire industry definition as suitable for use in severe snow conditions such as a new‐generation “studless” tire. Tires that meet the industry definition display an icon on the tire sidewall of a three‐peaked mountain and a snowflake.
"Retractable studded tires" are tires with embedded studs that retract to at or below the wear bar of the tire and project not less than .04 inch beyond the tread surface of the tire when extended. The tire industry expects to test market retractable studded tires in 2008 followed by a broader product rollout in 2009.
"Studded tires" are tires with studs that are made of a rigid material that wears at the same rate as the tire tread. The studs must extend at least .04 inch but not more than .06 inch beyond the tread surface. Studded tires are legal for use in Oregon from November 1 through March 31.
When towing, cars and light trucks must use chains on both tires of the drive axle. Chains must also be on the two outside tires of at least one axle of a trailer that is equipped with a brake. In most winter conditions four‐wheel and all‐wheel drive vehicles are exempt from the requirement to use chains or traction tires if the vehicles meets specific criteria such as has an unloaded weight of 6,500 pounds or less and is not towing.
Drivers who disobey the signs requiring chains or traction tires are subject to a “Class C” traffic infraction.
Road Condition Information for Motorists ‐ ODOT and the Oregon State Police provide road condition information for motorists in several ways. One is through a toll‐free phone number. Motorists can call 511 or 800‐977‐6368 (800‐977‐ODOT) in Oregon. From outside Oregon, motorists can call 503‐588‐2941. Reports are available around the clock. Another source of road condition information is ODOT’s traveler information web site described below.
February 2012 Natural Hazards Mitigation Plan State of Oregon
3‐WS‐20 Emergency Management Plan
Hazard Mitigation Successes 1. Award‐Winning Traveler Information Web Site
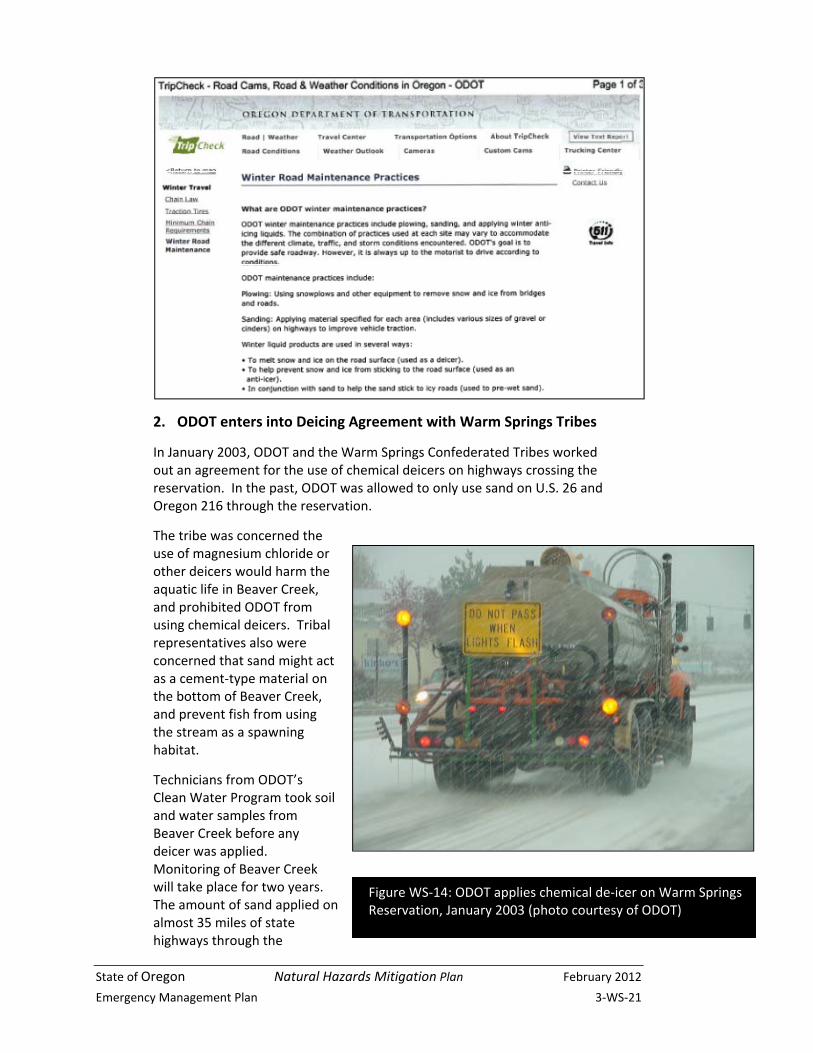
Delivering information to the traveling public helps people make good decisions about traveling during winter weather. TripCheck provides traffic incident, weather, and highway condition reports, as well as useful links to bus, rail, airport, and truck information.
It contains images from approximately 140 road cameras, including over 40 in rural areas such as mountain passes where knowing road conditions can be crucial to safety:
http://www.TripCheck.com/
The website was recognized by the Federal Highway Administration as one of the best for traffic information in 2002. It also received national recognition from the American Association of State Highway and Transportation Officials. During the winter months of January through March 2003 TripCheck.com averaged about 800,000 visits per month. During the nine‐day period starting Christmas Eve 2003 through New Year’s Day 2004, it received more than 1.2 million visits.
ar ODOT…
I used the Web site for the first time Jan. 2 to see how things were for a late‐night drive to Portland. I did not have chains and was driving by myself so I was pretty worried. The best tool for me was the video camera that I could view the actual route with and see for myself what to expect. Also, I used the 511 line and it worked well, too! Thanks from a real nervous Nellie! ‐‐D.M.
Our television is out and we can’t get radio, so we really appreciate your forecast and the camera pictures. Thanks for keeping them up and going in this weather so we have some contact with the world! ‐‐L.L.
What an amazing Web site you guys have put together with your trip cams and incident reports. This is an incredibly valuable Web site for traveling through Oregon during the winter months. My congratulations on a truly rocking web site! ‐‐K.G.
I just wanted to thank you for your excellent road condition Web site and tracking. It’s been very helpful and much used over this holiday. At least one set of relatives was discouraged from visiting entirely! ‐‐P.N.
State of Oregon Natural Hazards Mitigation Plan February 2012
Emergency Management Plan 3‐WS‐21
2. ODOT enters into Deicing Agreement with Warm Springs Tribes
In January 2003, ODOT and the Warm Springs Confederated Tribes worked out an agreement for the use of chemical deicers on highways crossing the reservation. In the past, ODOT was allowed to only use sand on U.S. 26 and Oregon 216 through the reservation.
The tribe was concerned the use of magnesium chloride or other deicers would harm the aquatic life in Beaver Creek, and prohibited ODOT from using chemical deicers. Tribal representatives also were concerned that sand might act as a cement‐type material on the bottom of Beaver Creek, and prevent fish from using the stream as a spawning habitat.
Technicians from ODOT’s Clean Water Program took soil and water samples from Beaver Creek before any deicer was applied. Monitoring of Beaver Creek will take place for two years. The amount of sand applied on almost 35 miles of state highways through the
Figure WS‐14: ODOT applies chemical de‐icer on Warm Springs Reservation, January 2003 (photo courtesy of ODOT)
February 2012 Natural Hazards Mitigation Plan State of Oregon
3‐WS‐22 Emergency Management Plan
An estimated $11 million is spent each year in Oregon to repair studded tire damage on city streets, county roads, and state highways, and those costs don’t include the inconvenience to motorists while the repairs were being made. A recent 22‐mile‐long freeway repair project between Salem and Portland cost $6.9 million to fix studded tire ruts.
Studded tires can be used in Oregon from November 1 to April 1. They are defined under Oregon Law as a type of traction tire. Research shows that studded tires are more effective than all‐weather tires on icy roads, but can be less effective in most other conditions.
In the Willamette Valley, icy roads happen only on about five percent of the days during studded tire season. When it rains, water collects in the pavement ruts caused by studded tires and creates dangerous driving conditions. In cold weather, that water can freeze and cause extra‐slippery roads.
Chains are more effective than studded tires and are getting easier to install. Link chains may not be recommended for use on some types of vehicles. Check the owner’s manual. Chain‐like devices are easy to install and fit nearly all vehicles.
Other traction tires meet the definition of the Rubber Manufacturers Association as suitable for use in severe snow conditions based on performance tests. They provide increased traction in winter conditions. Traction tires work about as good as studded tires on ice, and work better than studded tires or regular tires in most other winter conditions. Traction tires cause no damage to road surfaces.
reservation was drastically reduced, which will help improve the fish habitat. Another goal was to decrease the overall accident rate for U.S. 26 through the winter months.
3. Winter Practices Minimize Impact on Fish
ODOT has revised its winter highway maintenance practices to both cut costs and avoid affecting fish habitat while maintaining the same high standards for public safety. ODOT’s winter maintenance practices minimize the effects of sanding and the related cleanup in sensitive areas.
ODOT’s fish‐friendly maintenance changes include:
Using environmentally safe road deicers that replace or complement sanding. ODOT uses either calcium magnesium acetate (CMA) or magnesium chloride (with a rust inhibitor added) to treat roads. These products are mixed with water to form liquids and are sprayed
Motorists Asked to Consider Alternatives to Studded Tires
State of Oregon Natural Hazards Mitigation Plan February 2012
Emergency Management Plan 3‐WS‐23
on highways and bridges to keep ice from forming.
Placing barriers where appropriate and practical to keep sanding materials out of waterways. Road sand can cover spawning areas and can damage fish eggs.
Identifying and mapping areas where maintenance work could affect fish habitat. Staff educates highway crews on environmentally sensitive maintenance practices for those areas.
ODOT minimizes use of sidecast sweeping that pushes sand to the side of the road, especially on or around bridges. Reclaimed and cleaned sand is reused for berms, shoulder rebuilding, etc., as appropriate.
Adjusting truck speeds when sweeping and plowing to keep sand, soil, and road chemicals out of waterways.
ODOT highway maintenance workers also are reducing the amount of sand they spread by using winter maintenance chemicals more often during winter storms. The problem with sand is that once spread on the highway, it is easily moved off the roadway by the traffic and is effective for only a short period of time. Although ODOT has added these other tools to the winter maintenance toolbox, CMA and magnesium chloride are not a total replacement for traditional sanding practices. Winter maintenance chemicals
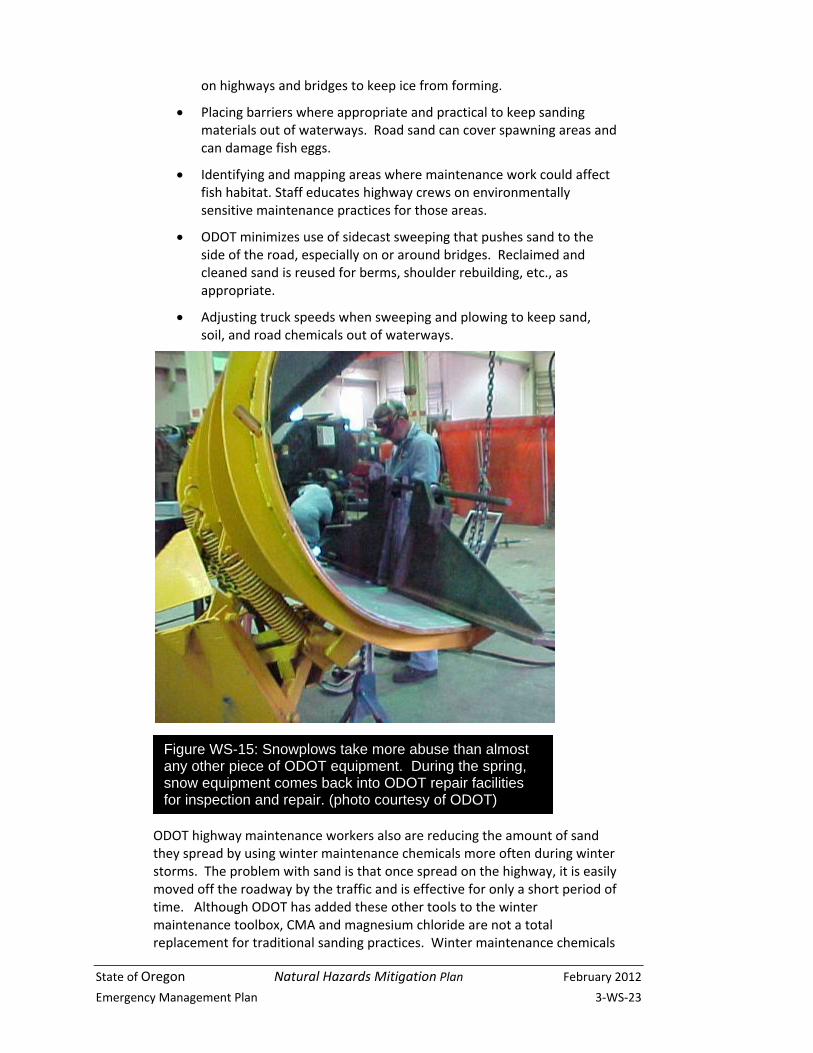
Figure WS-15: Snowplows take more abuse than almost any other piece of ODOT equipment. During the spring, snow equipment comes back into ODOT repair facilities for inspection and repair. (photo courtesy of ODOT)
February 2012 Natural Hazards Mitigation Plan State of Oregon
3‐WS‐24 Emergency Management Plan
are also not a replacement for responsible winter driving.
4. Avalanche Control Experts Help Clear Highway
The stretch of U.S.20 between milepost 79 and milepost 80 just west of the Santiam Pass Summit is among the most snow slide prone highways in Oregon. Hogg Rock, with its south‐facing slopes that range in pitch from 30 to 40 degrees, has very few natural "anchors" such as trees, which tend to prevent snow slides. Most slides occur on slopes that range from 30 to 45 degrees in pitch, according to the Northwest Weather and Avalanche Center.
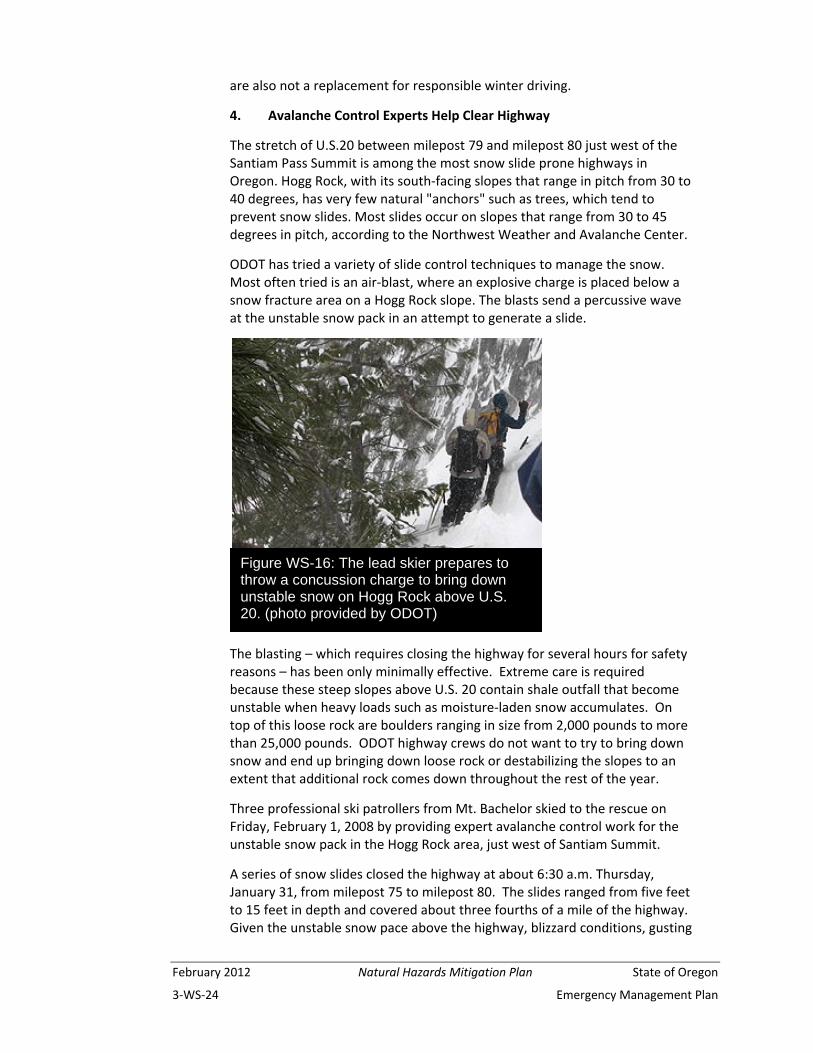
ODOT has tried a variety of slide control techniques to manage the snow. Most often tried is an air‐blast, where an explosive charge is placed below a snow fracture area on a Hogg Rock slope. The blasts send a percussive wave at the unstable snow pack in an attempt to generate a slide.
The blasting – which requires closing the highway for several hours for safety reasons – has been only minimally effective. Extreme care is required because these steep slopes above U.S. 20 contain shale outfall that become unstable when heavy loads such as moisture‐laden snow accumulates. On top of this loose rock are boulders ranging in size from 2,000 pounds to more than 25,000 pounds. ODOT highway crews do not want to try to bring down snow and end up bringing down loose rock or destabilizing the slopes to an extent that additional rock comes down throughout the rest of the year.
Three professional ski patrollers from Mt. Bachelor skied to the rescue on Friday, February 1, 2008 by providing expert avalanche control work for the unstable snow pack in the Hogg Rock area, just west of Santiam Summit.
A series of snow slides closed the highway at about 6:30 a.m. Thursday, January 31, from milepost 75 to milepost 80. The slides ranged from five feet to 15 feet in depth and covered about three fourths of a mile of the highway. Given the unstable snow pace above the highway, blizzard conditions, gusting
Figure WS-16: The lead skier prepares to throw a concussion charge to bring down unstable snow on Hogg Rock above U.S. 20. (photo provided by ODOT)
State of Oregon Natural Hazards Mitigation Plan February 2012
Emergency Management Plan 3‐WS‐25
wind and the risk for additional slides, ODOT managers decided to keep the highway closed overnight. The next morning, they decided to try a suggestion made by an ODOT employee who is also a member of the National Ski Patrol to shake loose the unstable snowpack and reopen the vital highway.
The ODOT employee, ODOT Region 2 Public Information Officer Joe Harwood, contacted Mt. Bachelor President Matt Janey and Pro Patrol Director Curtis Norsen, who immediately agreed to provide assistance. After lining up three Mt. Bachelor ski patrollers, Harwood then arranged for a certified demolitions transporter from Knife River to hook up with the group and deliver avalanche charges.
Harwood and Norsen, along with patrollers John Millslagle and Betsy Nelson, arrived at Santiam Summit before dawn Friday morning and armed the charges with cut‐timed detonation cord. The four then skied up about 1.5 miles into the Hogg Rock area. They set off ten separate explosions in an effort to trigger slides and bring down the unstable snow so that ODOT could reopen the highway. The charges, a combination of TNT and PETN, were thrown over a large, exposed area below the sheer face of Hogg Rock.
"We at ODOT are grateful for the expertise and assistance of Mt. Bachelor and the Mt. Bachelor Ski Patrol," said ODOT Director Matt Garrett. "Without their timely and unselfish help, we would not have been able to reopen the highway so quickly."
Following completion of the slide control work, ODOT crews from Santiam Junction spent about three hours clearing excess snow from the highway. The highway was reopened about 1 p.m. Friday, February 1.
5. Grant Funds Put More Troopers on Mountain Passes
Oregon's weather can change quickly and without warning. During the winter, conditions hit early and often cause problems for many travelers who are either ill‐prepared or do not follow driving safety tips and Oregon chain up laws. To help emphasize the importance of being prepared and complying with traffic laws, ODOT has again provided overtime funding for enforcement to put more Oregon State Police (OSP) troopers on selected mountain passes for the 2008‐2009 winter season.
OSP chain enforcement efforts received a grant from ODOT's Transportation Safety Division to provide more than 500 hours of overtime enforcement in 12 selected mountain passes. Every winter, interstate and state highway mountain passes see numerous motor vehicle crashes resulting in many injuries and deaths. Traffic often backs up, creating even more dangerous driving conditions. In many cases, these crashes are associated with excessive speed and lack of required chain equipment, or in the case of passenger vehicles, the appropriate tires and traction devices.
"We can't emphasize enough the importance of being prepared for upcoming driving challenges by having the appropriate chain equipment and tires, as well as driving safely at all times as dictated by the road and weather
February 2012 Natural Hazards Mitigation Plan State of Oregon
3‐WS‐26 Emergency Management Plan
conditions," said Sergeant Alan Hageman of the OSP Patrol Services Division. "The overtime grant funds will be put to good use putting more troopers in these areas when needed throughout the winter."
Mountain pass areas targeted for the extra enforcement using provided grant funds are:
Interstate 5 - Siskiyou Summit Interstate 5 - Sexton Mountain (between Roseburg and Grants
Pass) Interstate 84 - Cabbage Hill Interstate 84 - Ladd Canyon Interstate 84 - Three Mile Hill (between Huntington and Ontario) Interstate 84 – Weatherby (between Baker City and Huntington) Oregon 58 - Willamette Pass U.S. 20 - Santiam Pass U.S. 26 - Mt. Hood Pass U.S. 97 - Spring Creek Oregon 140W - Doak Mountain Oregon 140W - Seldom Hill
These problematic mountain passes were selected during the last couple years and are targeted again this year because they have been plagued by crashes during the winter months," said Sergeant Hageman. "Having the right size and number of chains required, and the appropriate tires on your vehicle when traveling where they may be required, is good for you and other drivers."
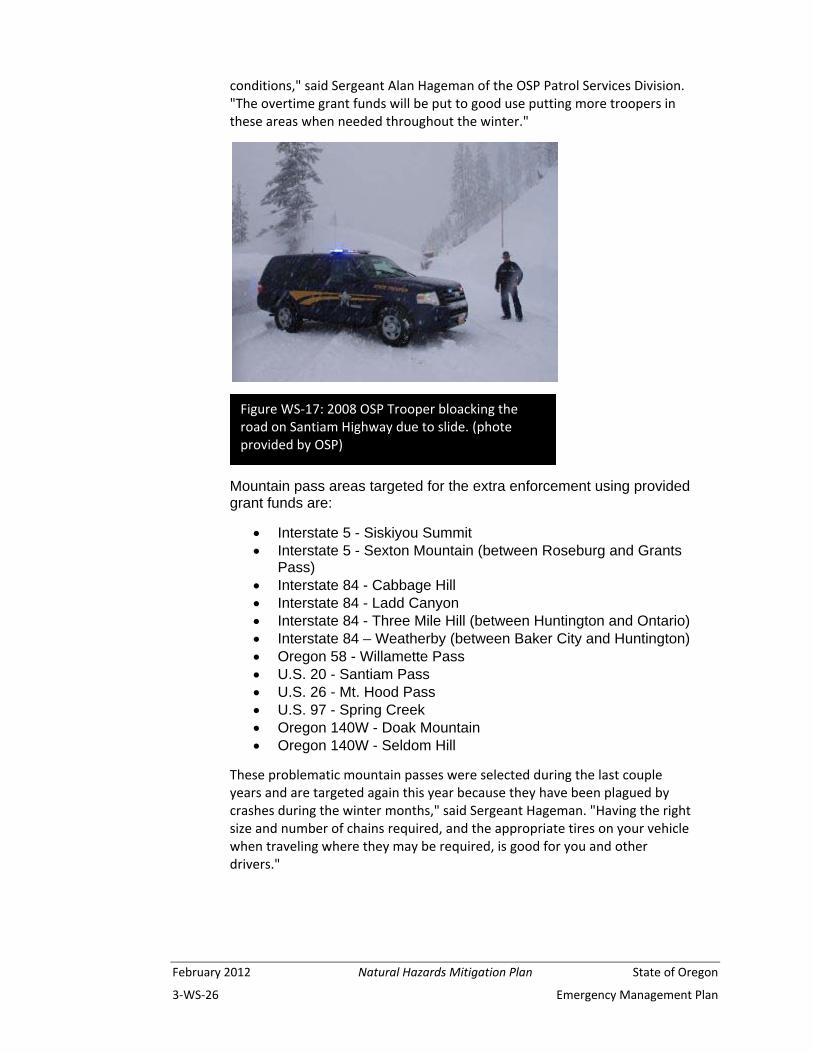
Figure WS‐17: 2008 OSP Trooper bloacking the road on Santiam Highway due to slide. (phote provided by OSP)
State of Oregon Natural Hazards Mitigation Plan February 2012
Emergency Management Plan 3‐WS‐27
6. Interagency “Fire and Ice” Agreement
The Oregon Department of Forestry (ODF) and the Oregon Department of Transportation (ODOT) have a cooperative “Fire and Ice” agreement for sharing some permanent, full time employees to perform seasonal work. These employees fight fires in the summer and plow snow in the winter. Depending on weather conditions, an employee in one of these positions typically works May through October performing ODF fire protection duties and then works November through April operating equipment for ODOT winter needs. The worker remains an ODF employee even while receiving direction and work from ODOT. Both agencies and the public benefit from the ability to retain skilled, experienced employees to perform seasonal work from year to year.
February 2012 Natural Hazards Mitigation Plan State of Oregon
3‐WS‐28 Emergency Management Plan
Appendix WS‐1: Average Annual Snowfall at Various Oregon Stations
This data is from the Oregon Climate Service (OCS), Oregon State University.
Station Zone Jan Feb Mar Apr May Jun Jul Aug Sep Oct Nov Dec Annual
Astoria WSO AP
1 2.2 0.4 0.4 0.1 0.2 1.4 4.7
Brookings 1 0.2 0.3 0.1 0.1 0.4
Corvallis 2 2.2 1.3 0.2 0.2 1.6 5.7
Eugene WSO AP 2 3.1 0.9 0.2 0.2 1.7 6.1
Portland WSO AP 2 1.8 0.9 0.1 0.5 2 5.4
Ashland 3 2.7 1.2 1 0.5 0.3 2.4 8.4
Medford WSO AP
3 3 0.8 0.7 0.2 0.4 2.3 7.5
Roseburg KQEN 3 2.3 0.6 0.1 0 0.7 4.0
Belknap Springs 4 24 16 13 2.7 0.2 0.3 6.8 22 88.0
Detroit Dam 4 7.9 3.7 2.2 0.4 1 3.5 18.2
Government Camp
4 62 45 49 30 7.5 0.2 0.3 6.4 34 53 278.2
McKenzie Bridge 4 13 6.9 4.3 0.4 0.3 2.6 8.8 40.1
Crater Lake 5 85 73 88 43 19 4 1 0.2 4.1 21 69 84 495.0
Silver Lake 5 5 2.7 3.1 1.4 0.7 0.3 2.2 6.4 18.6
Hood River Exp Stn
6 14 6.4 1.5 3.4 9.9 36.5
Moro 6 6 2.7 1.2 0.2 0.2 2.5 6.2 19.3
Pendleton WSO AP
6 6.1 2.1 1 0.2 0.2 2.2 5.2 17.0
Bend 7 10 3.9 4.1 2 0.3 0.2 5.6 9.5 34.8
Burns WSO 7 6.6 6.9 4.6 1 0.3 0.1 0.6 6.4 10 42.3
Klamath Falls 7 9.3 4.7 3.7 0.9 0.1 0.5 4.5 10 34.9
Enterprise 2 S
8 12 8.2 8.1 5 1.4 0.2 1.3 7.6 9.4 52.6
John Day 8 6.2 3.7 3.2 1.2 0.1 0.3 2.5 7.1 24.0
La Grande 8 9 4.7 1.7 0.7 0.2 3 7.4 28.7
Ontario 9 7.2 2.8 0.7 0.1 0.1 2.2 6.7 20.3
Rome 2 NW 9 4.4 0.8 1.4 0.5 0.2 0.2 1.7 3.7 13.5
State of Oregon Natural Hazards Mitigation Plan February 2012
Emergency Management Plan 3‐WS‐29
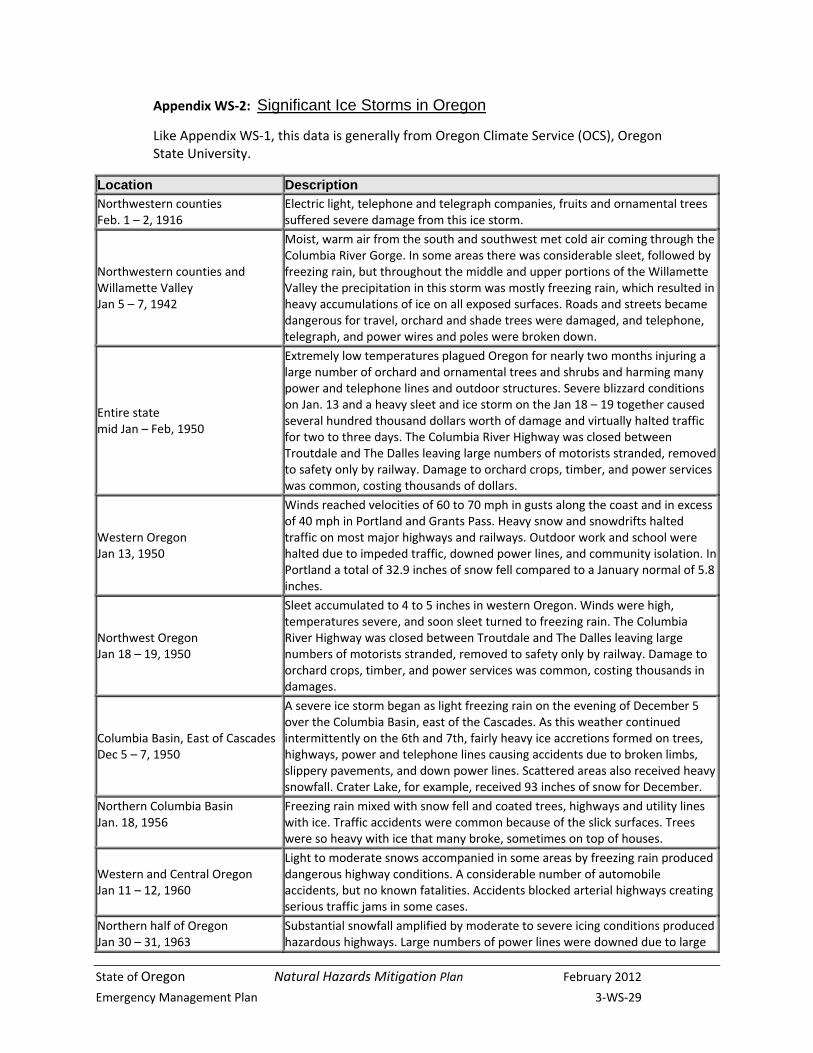
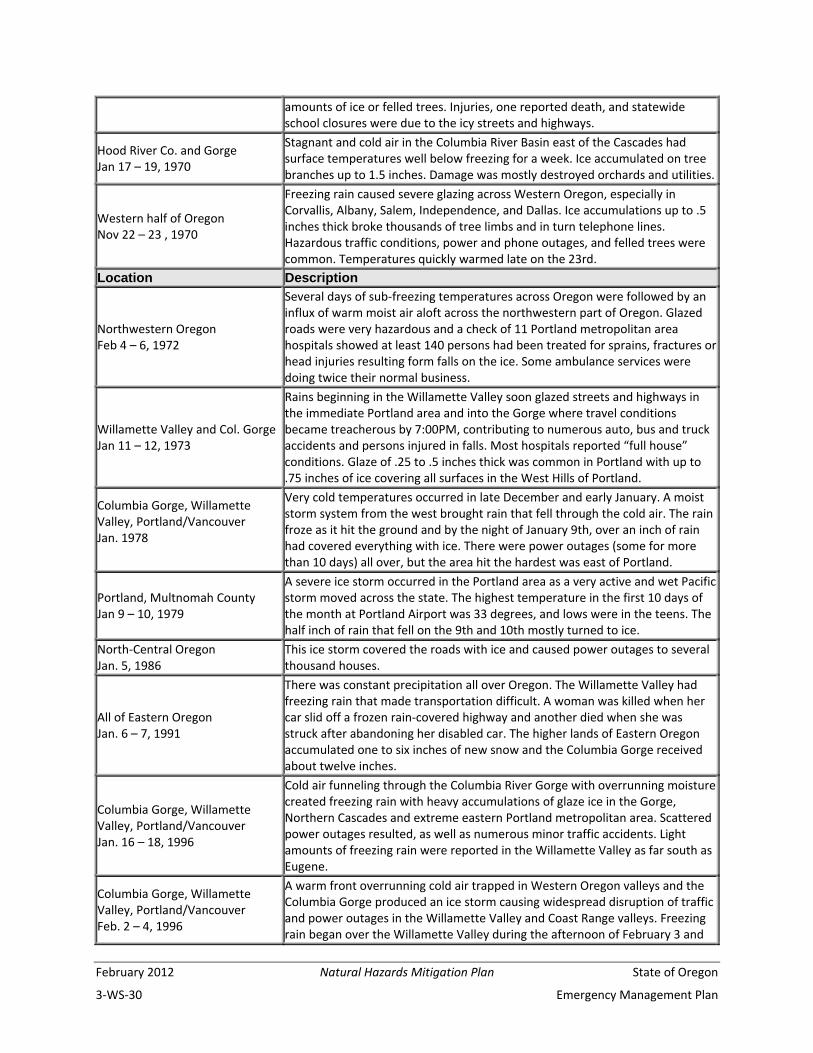
Appendix WS‐2: Significant Ice Storms in Oregon
Like Appendix WS‐1, this data is generally from Oregon Climate Service (OCS), Oregon State University.
Location DescriptionNorthwestern counties Feb. 1 – 2, 1916
Electric light, telephone and telegraph companies, fruits and ornamental trees suffered severe damage from this ice storm.
Northwestern counties and Willamette Valley Jan 5 – 7, 1942
Moist, warm air from the south and southwest met cold air coming through the Columbia River Gorge. In some areas there was considerable sleet, followed by freezing rain, but throughout the middle and upper portions of the Willamette Valley the precipitation in this storm was mostly freezing rain, which resulted in heavy accumulations of ice on all exposed surfaces. Roads and streets became dangerous for travel, orchard and shade trees were damaged, and telephone, telegraph, and power wires and poles were broken down.
Entire state mid Jan – Feb, 1950
Extremely low temperatures plagued Oregon for nearly two months injuring a large number of orchard and ornamental trees and shrubs and harming many power and telephone lines and outdoor structures. Severe blizzard conditions on Jan. 13 and a heavy sleet and ice storm on the Jan 18 – 19 together caused several hundred thousand dollars worth of damage and virtually halted traffic for two to three days. The Columbia River Highway was closed between Troutdale and The Dalles leaving large numbers of motorists stranded, removed to safety only by railway. Damage to orchard crops, timber, and power services was common, costing thousands of dollars.
Western Oregon Jan 13, 1950
Winds reached velocities of 60 to 70 mph in gusts along the coast and in excess of 40 mph in Portland and Grants Pass. Heavy snow and snowdrifts halted traffic on most major highways and railways. Outdoor work and school were halted due to impeded traffic, downed power lines, and community isolation. In Portland a total of 32.9 inches of snow fell compared to a January normal of 5.8 inches.
Northwest Oregon Jan 18 – 19, 1950
Sleet accumulated to 4 to 5 inches in western Oregon. Winds were high, temperatures severe, and soon sleet turned to freezing rain. The Columbia River Highway was closed between Troutdale and The Dalles leaving large numbers of motorists stranded, removed to safety only by railway. Damage to orchard crops, timber, and power services was common, costing thousands in damages.
Columbia Basin, East of Cascades Dec 5 – 7, 1950
A severe ice storm began as light freezing rain on the evening of December 5 over the Columbia Basin, east of the Cascades. As this weather continued intermittently on the 6th and 7th, fairly heavy ice accretions formed on trees, highways, power and telephone lines causing accidents due to broken limbs, slippery pavements, and down power lines. Scattered areas also received heavy snowfall. Crater Lake, for example, received 93 inches of snow for December.
Northern Columbia Basin Jan. 18, 1956
Freezing rain mixed with snow fell and coated trees, highways and utility lines with ice. Traffic accidents were common because of the slick surfaces. Trees were so heavy with ice that many broke, sometimes on top of houses.
Western and Central Oregon Jan 11 – 12, 1960
Light to moderate snows accompanied in some areas by freezing rain produced dangerous highway conditions. A considerable number of automobile accidents, but no known fatalities. Accidents blocked arterial highways creating serious traffic jams in some cases.
Northern half of Oregon Jan 30 – 31, 1963
Substantial snowfall amplified by moderate to severe icing conditions produced hazardous highways. Large numbers of power lines were downed due to large
February 2012 Natural Hazards Mitigation Plan State of Oregon
3‐WS‐30 Emergency Management Plan
amounts of ice or felled trees. Injuries, one reported death, and statewide school closures were due to the icy streets and highways.
Hood River Co. and Gorge Jan 17 – 19, 1970
Stagnant and cold air in the Columbia River Basin east of the Cascades had surface temperatures well below freezing for a week. Ice accumulated on tree branches up to 1.5 inches. Damage was mostly destroyed orchards and utilities.
Western half of Oregon Nov 22 – 23 , 1970
Freezing rain caused severe glazing across Western Oregon, especially in Corvallis, Albany, Salem, Independence, and Dallas. Ice accumulations up to .5 inches thick broke thousands of tree limbs and in turn telephone lines. Hazardous traffic conditions, power and phone outages, and felled trees were common. Temperatures quickly warmed late on the 23rd.
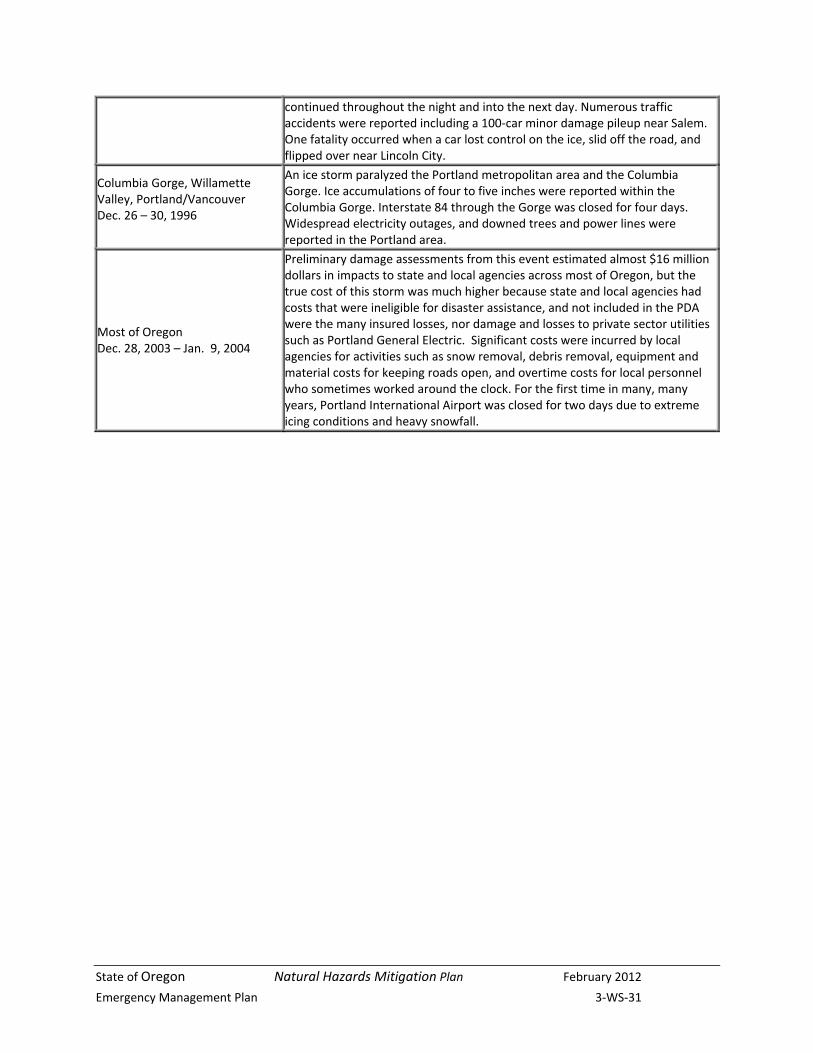
Location Description
Northwestern Oregon Feb 4 – 6, 1972
Several days of sub‐freezing temperatures across Oregon were followed by an influx of warm moist air aloft across the northwestern part of Oregon. Glazed roads were very hazardous and a check of 11 Portland metropolitan area hospitals showed at least 140 persons had been treated for sprains, fractures or head injuries resulting form falls on the ice. Some ambulance services were doing twice their normal business.
Willamette Valley and Col. Gorge Jan 11 – 12, 1973
Rains beginning in the Willamette Valley soon glazed streets and highways in the immediate Portland area and into the Gorge where travel conditions became treacherous by 7:00PM, contributing to numerous auto, bus and truck accidents and persons injured in falls. Most hospitals reported “full house” conditions. Glaze of .25 to .5 inches thick was common in Portland with up to .75 inches of ice covering all surfaces in the West Hills of Portland.
Columbia Gorge, Willamette Valley, Portland/Vancouver Jan. 1978
Very cold temperatures occurred in late December and early January. A moist storm system from the west brought rain that fell through the cold air. The rain froze as it hit the ground and by the night of January 9th, over an inch of rain had covered everything with ice. There were power outages (some for more than 10 days) all over, but the area hit the hardest was east of Portland.
Portland, Multnomah County Jan 9 – 10, 1979
A severe ice storm occurred in the Portland area as a very active and wet Pacific storm moved across the state. The highest temperature in the first 10 days of the month at Portland Airport was 33 degrees, and lows were in the teens. The half inch of rain that fell on the 9th and 10th mostly turned to ice.
North‐Central Oregon Jan. 5, 1986
This ice storm covered the roads with ice and caused power outages to several thousand houses.
All of Eastern Oregon Jan. 6 – 7, 1991
There was constant precipitation all over Oregon. The Willamette Valley had freezing rain that made transportation difficult. A woman was killed when her car slid off a frozen rain‐covered highway and another died when she was struck after abandoning her disabled car. The higher lands of Eastern Oregon accumulated one to six inches of new snow and the Columbia Gorge received about twelve inches.
Columbia Gorge, Willamette Valley, Portland/Vancouver Jan. 16 – 18, 1996
Cold air funneling through the Columbia River Gorge with overrunning moisture created freezing rain with heavy accumulations of glaze ice in the Gorge, Northern Cascades and extreme eastern Portland metropolitan area. Scattered power outages resulted, as well as numerous minor traffic accidents. Light amounts of freezing rain were reported in the Willamette Valley as far south as Eugene.
Columbia Gorge, Willamette Valley, Portland/Vancouver Feb. 2 – 4, 1996
A warm front overrunning cold air trapped in Western Oregon valleys and the Columbia Gorge produced an ice storm causing widespread disruption of traffic and power outages in the Willamette Valley and Coast Range valleys. Freezing rain began over the Willamette Valley during the afternoon of February 3 and
State of Oregon Natural Hazards Mitigation Plan February 2012
Emergency Management Plan 3‐WS‐31
continued throughout the night and into the next day. Numerous trafficaccidents were reported including a 100‐car minor damage pileup near Salem. One fatality occurred when a car lost control on the ice, slid off the road, and flipped over near Lincoln City.
Columbia Gorge, Willamette Valley, Portland/Vancouver Dec. 26 – 30, 1996
An ice storm paralyzed the Portland metropolitan area and the Columbia Gorge. Ice accumulations of four to five inches were reported within the Columbia Gorge. Interstate 84 through the Gorge was closed for four days. Widespread electricity outages, and downed trees and power lines were reported in the Portland area.
Most of Oregon Dec. 28, 2003 – Jan. 9, 2004
Preliminary damage assessments from this event estimated almost $16 million dollars in impacts to state and local agencies across most of Oregon, but the true cost of this storm was much higher because state and local agencies had costs that were ineligible for disaster assistance, and not included in the PDA were the many insured losses, nor damage and losses to private sector utilities such as Portland General Electric. Significant costs were incurred by local agencies for activities such as snow removal, debris removal, equipment and material costs for keeping roads open, and overtime costs for local personnel who sometimes worked around the clock. For the first time in many, many years, Portland International Airport was closed for two days due to extreme icing conditions and heavy snowfall.
February 2012 Natural Hazards Mitigation Plan State of Oregon
3‐WS‐32 Emergency Management Plan
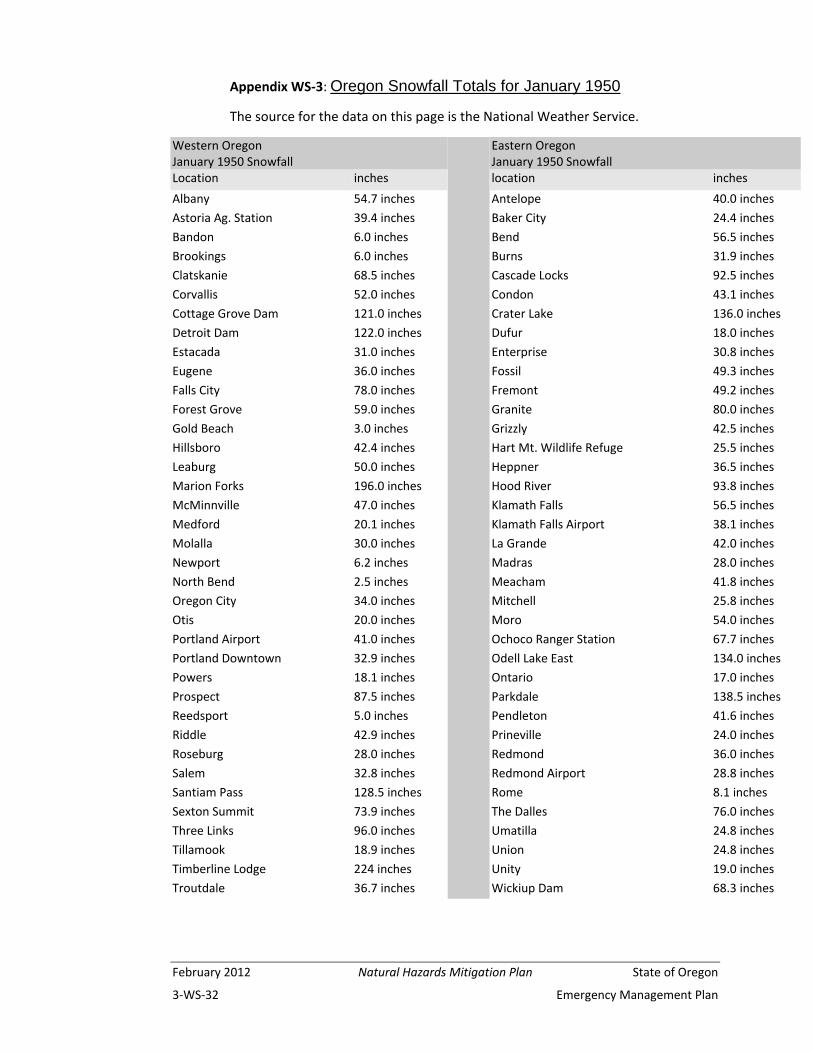
Appendix WS‐3: Oregon Snowfall Totals for January 1950
The source for the data on this page is the National Weather Service.
Western Oregon January 1950 Snowfall
Eastern Oregon January 1950 Snowfall
Location inches location inches
Albany 54.7 inches Antelope 40.0 inches
Astoria Ag. Station 39.4 inches Baker City 24.4 inches
Bandon 6.0 inches Bend 56.5 inches
Brookings 6.0 inches Burns 31.9 inches
Clatskanie 68.5 inches Cascade Locks 92.5 inches
Corvallis 52.0 inches Condon 43.1 inches
Cottage Grove Dam 121.0 inches Crater Lake 136.0 inches
Detroit Dam 122.0 inches Dufur 18.0 inches
Estacada 31.0 inches Enterprise 30.8 inches
Eugene 36.0 inches Fossil 49.3 inches
Falls City 78.0 inches Fremont 49.2 inches
Forest Grove 59.0 inches Granite 80.0 inches
Gold Beach 3.0 inches Grizzly 42.5 inches
Hillsboro 42.4 inches Hart Mt. Wildlife Refuge 25.5 inches
Leaburg 50.0 inches Heppner 36.5 inches
Marion Forks 196.0 inches Hood River 93.8 inches
McMinnville 47.0 inches Klamath Falls 56.5 inches
Medford 20.1 inches Klamath Falls Airport 38.1 inches
Molalla 30.0 inches La Grande 42.0 inches
Newport 6.2 inches Madras 28.0 inches
North Bend 2.5 inches Meacham 41.8 inches
Oregon City 34.0 inches Mitchell 25.8 inches
Otis 20.0 inches Moro 54.0 inches
Portland Airport 41.0 inches Ochoco Ranger Station 67.7 inches
Portland Downtown 32.9 inches Odell Lake East 134.0 inches
Powers 18.1 inches Ontario 17.0 inches
Prospect 87.5 inches Parkdale 138.5 inches
Reedsport 5.0 inches Pendleton 41.6 inches
Riddle 42.9 inches Prineville 24.0 inches
Roseburg 28.0 inches Redmond 36.0 inches
Salem 32.8 inches Redmond Airport 28.8 inches
Santiam Pass 128.5 inches Rome 8.1 inches
Sexton Summit 73.9 inches The Dalles 76.0 inches
Three Links 96.0 inches Umatilla 24.8 inches
Tillamook 18.9 inches Union 24.8 inches
Timberline Lodge 224 inches Unity 19.0 inches
Troutdale 36.7 inches Wickiup Dam 68.3 inches
State of Oregon Natural Hazards Mitigation Plan February 2012
Emergency Management Plan 3‐WS‐33
Appendix WS‐4: Reducing Ice Storm Damage to Trees7
Reducing ice storm damage to trees has two phases: proper tree selection and proper tree structure. When making species selections in areas prone to ice storms, careful species and site selection should be taken with an eye toward preventing future damage. Different species of trees respond in different ways to severe weather situations like ice storms. In general, conifers are more resistant to ice storm damage than deciduous hardwood trees, since conifers have a greater ability to bend. Among conifers, firs and spruces are generally less damaged than pine trees would be. Among deciduous trees, those trees that have harder wood and broadly spread branching habits rather than very narrow branching will be more resistant to damage. Trees that grow quickly sacrifice structural stability in order to do so. Weak‐wooded species such as Cottonwood, Siberian Elm, many of the Birches, Silver Maple, and Bradford Pear are prone to ice storm damage, and there is little that can be done to prevent such damage from occurring other than not planting those particular species. Most Oaks, some of the Maples, and Gingko are generally types of trees that are more resistant to damage in ice storms. Site selection considerations, such as planting trees in groups or groves rather than isolated plantings will help trees resist ice storm damage. Maintaining healthy trees in the landscape is the second key to preventing ice storm damage. The Oregon Department of Forestry and the National Arbor Day Foundation offer these suggestions for pruning a tree to promote the growth of strong branches: 1. Encourage good branch angles ‐ For most deciduous or hardwood trees, narrow angles between branches signal a point of future weakness, whether in the trunk or in the crown of the tree. Prune a tree early in its life to spread the branches along the trunk. 2. Encourage strong branch/trunk size relationships ‐ The relative size of lateral (side) branches is also important in determining branch strength. Ideally, lateral branches should be no more than 1/2 to 3/4 the diameter of the trunk. Branches larger than that are often heavier than the trunk can support, and are candidates to break when wind, ice, or snow come along. 3. Maintain a stable center of gravity ‐ Wind, winter snow loads, or previous loss of a major limb can create situations where the tree's center of gravity is not positioned over the trunk. Then when a severe storm hits, a slight bit of extra weight or wind pressure can break limbs, snap the trunk off, or even topple the tree, roots and all. 4. Remove rubbing branches, suckers, watersprouts, and temporary branches ‐ Branches that rub against each other can produce wounds and decay, so
7 Information provided by Oregon Department of Forestry, Urban and Community Forestry Program
February 2012 Natural Hazards Mitigation Plan State of Oregon
3‐WS‐34 Emergency Management Plan
one of the offending branches should be removed. Watersprouts and suckers are abnormal growth that can occur at the base of the tree or inside the crown. Because leaves are vital in providing the tree with nourishment, never remove more than one‐third of a tree's leafy crown when pruning. 5. Don't cut branches back to stubs ‐ Often people have the mistaken idea that long natural limbs on a tree will break more easily in a storm, and should be cut back to make them stronger. Just the opposite is the case. When a branch is cut back to a stub, new branches will grow from the edges of the stub. Because they cannot form a strong union with the stubbed branch, these new branches are even more likely to be broken in a future storm. If a branch needs to be removed, cut it back to a main branch or to the tree's trunk. Never leave a stub on a branch or at the top of the tree. Trees that are topped are more likely to break in future storms. If care is taken to select the right species and to keep landscape trees healthy, ice storm damage can be reduced. Trees are an important part of any landscape, providing shade, beauty, clean air, and increased property value. Keeping trees healthy is a wise investment. For more information on proper tree care, websites such as http://www.treesaregood.com or http://www.arborday.org will provide valuable guidance. Local urban foresters, county extension agents, or certified arborists are also good sources of information.


![Winter Storm Impacts By: Jenna Bodisch :]. Winter Storms Heavy snowfall and extreme cold can immobilize many people. Winter storms can result in flooding,](https://img.pdfslide.us/doc/110x75/5513e6695503466f748b5713/winter-storm-impacts-by-jenna-bodisch-winter-storms-heavy-snowfall-and-extreme-cold-can-immobilize-many-people-winter-storms-can-result-in-flooding.jpg)