Embed Size (px)
Citation preview
Seediscussions,stats,andauthorprofilesforthispublicationat:https://www.researchgate.net/publication/305074080
Stomatalacclimationtovaporpressuredeficitdoublestranspirationofsmalltreeseedlingswithwarming
ArticleinPlantCellandEnvironment·July2016
DOI:10.1111/pce.12790
CITATIONS
0
READS
47
5authors,including:
Someoftheauthorsofthispublicationarealsoworkingontheserelatedprojects:
Howdoplantscopewithhighradiationloads?Viewproject
ReneeMarchin
UniversityofSydney
7PUBLICATIONS136CITATIONS
SEEPROFILE
AliceA.Broadhead
NorthCarolinaStateUniversity
2PUBLICATIONS0CITATIONS
SEEPROFILE
RobertRDunn
NorthCarolinaStateUniversity
229PUBLICATIONS4,587CITATIONS
SEEPROFILE
WilliamArthurHoffmann
NorthCarolinaStateUniversity
93PUBLICATIONS4,138CITATIONS
SEEPROFILE
Allin-textreferencesunderlinedinbluearelinkedtopublicationsonResearchGate,
lettingyouaccessandreadthemimmediately.
Availablefrom:ReneeMarchin
Retrievedon:23November2016
Original Article
Stomatal acclimation to vapour pressure deficit doublestranspiration of small tree seedlings with warming
Renée M. Marchin1,2, Alice A. Broadhead2, Laura E. Bostic2, Robert R. Dunn3,4 & William A. Hoffmann2
1Centre for Carbon, Water and Food, University of Sydney, Camden, New South Wales 2570, Australia, 2Department of Plant Biology,North Carolina State University, Raleigh, NC 27695-7612, USA, 3Department of Applied Ecology and Keck Center for BehavioralBiology, North Carolina State University, Raleigh, NC 27695-7617, USA and 4Center for Macroecology, Evolution and Climate,Natural History Museum of Denmark, University of Copenhagen, DK-2100 Copenhagen, Denmark
ABSTRACT
Future climate change is expected to increase temperature (T)and atmospheric vapour pressure deficit (VPD) in many re-gions, but the effect of persistent warming on plant stomatal be-haviour is highly uncertain. We investigated the effect ofexperimental warming of 1.9–5.1 °C and increased VPD of0.5–1.3 kPa on transpiration and stomatal conductance (gs) oftree seedlings in the temperate forest understory (Duke Forest,North Carolina, USA).We observed peaked responses of tran-spiration to VPD in all seedlings, and the optimum VPD fortranspiration (Dopt) shifted proportionally with increasingchamber VPD. Warming increased mean water use of Caryaby 140% and Quercus by 150%, but had no significant effecton water use of Acer. Increased water use of ring-porous spe-cies was attributed to (1) higher air Tand (2) stomatal acclima-tion to VPD resulting in higher gs and more sensitive stomata,and thereby less efficient water use. Stomatal acclimationmain-tained homeostasis of leaf T and carbon gain despite increasedVPD, revealing that short-term stomatal responses to VPDmay not be representative of long-term exposure. Acclimationresponses differ from expectations of decreasing gs with in-creasing VPD and may necessitate revision of current modelsbased on this assumption.
Key-words: humidity; sap flux; stomata; stomatal conductance;temperature; warming experiment.
INTRODUCTION
Stomatal control of the exchange of carbon and water vapourbetween vegetation and the atmosphere plays an importantrole in the global carbon and water cycles. Each year, morethan half of the precipitation that falls on land is transpiredthrough plant stomata (Chahine 1992; Jackson et al. 2000).Global evapotranspiration increased by about 1mmyr�1 asair temperature (T) rose in the 1980s and 1990s (Jung et al.2010; Zhang et al. 2010; Zeng et al. 2012). General circulationmodels predict that warming will increase evapotranspiration(Manabe & Wetherald 1987; Gregory et al. 1997; Manabeet al. 2004) because of an acceleration of the hydrologic cycle
(Milly et al. 2002; Bosilovich et al. 2005), because higher T in-creases the water-holding capacity of the atmosphere. Yet in-creases in global evapotranspiration have stalled since 1998(Jung et al. 2010; Zeng et al. 2012), even as T has continuedto increase (IPCC 2014), casting doubt on the extent to whichT alone can predict evapotranspiration, particularly in the fu-ture. The disconnect between rising T and evapotranspirationsince 1998 may relate to the differing effects of T and vapourpressure deficit (VPD) on stomata. Increases in T nearly al-ways cause increases in VPD in natural ecosystems (Hardwicket al. 2015), and if relative humidity does not change markedlyin the future (e.g. Trenberth et al. 2005), warming will createwidespread regional increases in atmospheric VPD. Increasesin T often cause plants to open their stomata (Bunce 1985; Luet al. 2000; Kudoyarova et al. 2011; Sadras et al. 2012; Wayet al. 2012, but see Maenpaa et al. 2011), but this is confoundedby increases in VPD, which tend to trigger stomatal closure(Monteith 1995; Oren et al. 1999b). The extent to which stoma-tal closure is more strongly driven by T or VPD may, in turn,also be influenced by acclimation processes that modify stoma-tal responses to T and VPD, further complicating plant re-sponses to climate change.
Acclimation is commonly interpreted as an adaptiveresponse that allows organisms to maintain homeostasisduring environmental (or other) change. For stomatalresponses to VPD, however, maintaining homeostasis of waterrelations is at odds with maintaining homeostasis of carbonrelations. Stomatal closure upon exposure to drier air occurswithin minutes (Lange et al. 1971), but short-term responsesmay not be representative of longer-term exposure. To main-tain carbon gain despite increases in VPD, we would expectlong-term exposure to high VPD to have less of an effect onstomatal conductance (gs) than is observed under short-termexposure to high VPD (Fig. 1). Stomatal acclimation maintain-ing homeostasis of carbon relations could occur either through(1) increases in conductance, for example, gsref, the gs atVPD=1kPa, or (2) decreases in stomatal sensitivity to VPD,that is, the slope (–m) of the logarithmic decrease of gs with in-creasing VPD (Oren et al. 1999b). Besides sustaining high ratesof assimilation, this also allows plants to cool leaves (Nobel1974) and maintains leaf T within an optimal range (Mahan& Upchurch 1988), but it would result in increased plant waterCorrespondence: R. M. Marchin. Email: [email protected]
© 2016 John Wiley & Sons Ltd 1
doi: 10.1111/pce.12790Plant, Cell and Environment (2016)
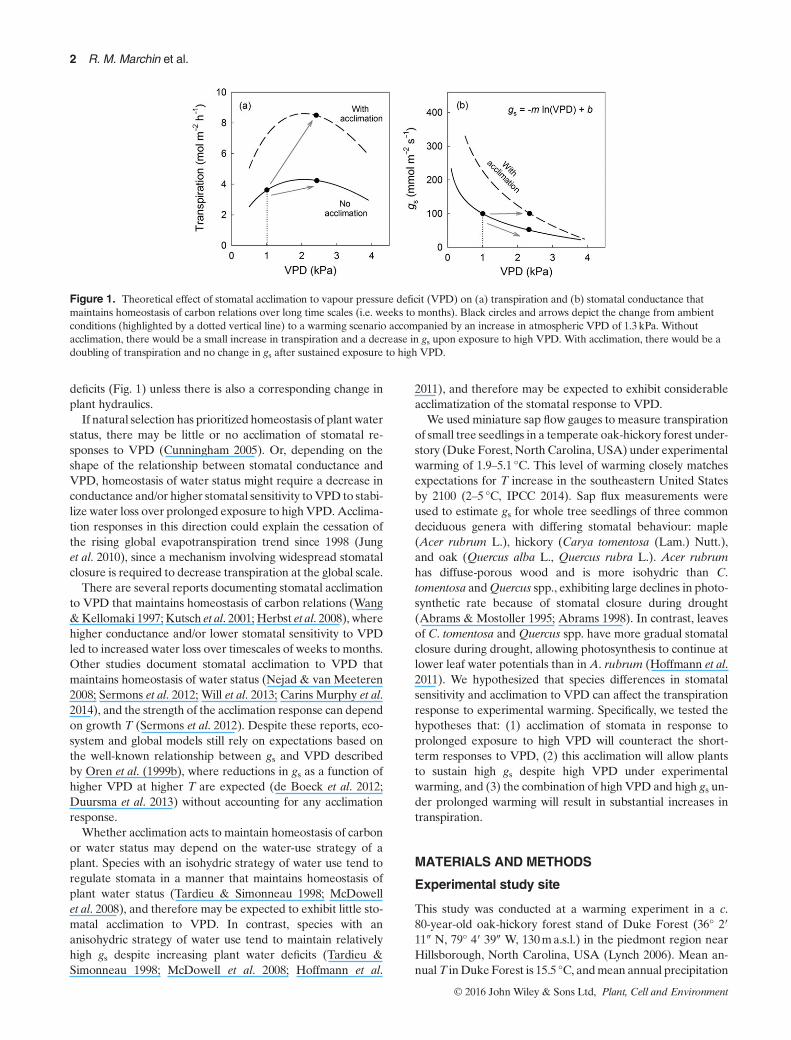
deficits (Fig. 1) unless there is also a corresponding change inplant hydraulics.
If natural selection has prioritized homeostasis of plant waterstatus, there may be little or no acclimation of stomatal re-sponses to VPD (Cunningham 2005). Or, depending on theshape of the relationship between stomatal conductance andVPD, homeostasis of water status might require a decrease inconductance and/or higher stomatal sensitivity to VPD to stabi-lize water loss over prolonged exposure to highVPD.Acclima-tion responses in this direction could explain the cessation ofthe rising global evapotranspiration trend since 1998 (Junget al. 2010), since a mechanism involving widespread stomatalclosure is required to decrease transpiration at the global scale.
There are several reports documenting stomatal acclimationto VPD that maintains homeostasis of carbon relations (Wang&Kellomaki 1997; Kutsch et al. 2001; Herbst et al. 2008), wherehigher conductance and/or lower stomatal sensitivity to VPDled to increased water loss over timescales of weeks to months.Other studies document stomatal acclimation to VPD thatmaintains homeostasis of water status (Nejad & van Meeteren2008; Sermons et al. 2012; Will et al. 2013; Carins Murphy et al.2014), and the strength of the acclimation response can dependon growth T (Sermons et al. 2012). Despite these reports, eco-system and global models still rely on expectations based onthe well-known relationship between gs and VPD describedby Oren et al. (1999b), where reductions in gs as a function ofhigher VPD at higher T are expected (de Boeck et al. 2012;Duursma et al. 2013) without accounting for any acclimationresponse.
Whether acclimation acts to maintain homeostasis of carbonor water status may depend on the water-use strategy of aplant. Species with an isohydric strategy of water use tend toregulate stomata in a manner that maintains homeostasis ofplant water status (Tardieu & Simonneau 1998; McDowellet al. 2008), and therefore may be expected to exhibit little sto-matal acclimation to VPD. In contrast, species with ananisohydric strategy of water use tend to maintain relativelyhigh gs despite increasing plant water deficits (Tardieu &Simonneau 1998; McDowell et al. 2008; Hoffmann et al.
2011), and therefore may be expected to exhibit considerableacclimatization of the stomatal response to VPD.
We used miniature sap flow gauges to measure transpirationof small tree seedlings in a temperate oak-hickory forest under-story (Duke Forest, North Carolina, USA) under experimentalwarming of 1.9–5.1 °C. This level of warming closely matchesexpectations for T increase in the southeastern United Statesby 2100 (2–5 °C, IPCC 2014). Sap flux measurements wereused to estimate gs for whole tree seedlings of three commondeciduous genera with differing stomatal behaviour: maple(Acer rubrum L.), hickory (Carya tomentosa (Lam.) Nutt.),and oak (Quercus alba L., Quercus rubra L.). Acer rubrumhas diffuse-porous wood and is more isohydric than C.tomentosa andQuercus spp., exhibiting large declines in photo-synthetic rate because of stomatal closure during drought(Abrams & Mostoller 1995; Abrams 1998). In contrast, leavesof C. tomentosa and Quercus spp. have more gradual stomatalclosure during drought, allowing photosynthesis to continue atlower leaf water potentials than inA. rubrum (Hoffmann et al.2011). We hypothesized that species differences in stomatalsensitivity and acclimation to VPD can affect the transpirationresponse to experimental warming. Specifically, we tested thehypotheses that: (1) acclimation of stomata in response toprolonged exposure to high VPD will counteract the short-term responses to VPD, (2) this acclimation will allow plantsto sustain high gs despite high VPD under experimentalwarming, and (3) the combination of high VPD and high gs un-der prolonged warming will result in substantial increases intranspiration.
MATERIALS AND METHODS
Experimental study site
This study was conducted at a warming experiment in a c.80-year-old oak-hickory forest stand of Duke Forest (36° 2′11″ N, 79° 4′ 39″ W, 130ma.s.l.) in the piedmont region nearHillsborough, North Carolina, USA (Lynch 2006). Mean an-nualT inDuke Forest is 15.5 °C, andmean annual precipitation
Figure 1. Theoretical effect of stomatal acclimation to vapour pressure deficit (VPD) on (a) transpiration and (b) stomatal conductance thatmaintains homeostasis of carbon relations over long time scales (i.e. weeks to months). Black circles and arrows depict the change from ambientconditions (highlighted by a dotted vertical line) to a warming scenario accompanied by an increase in atmospheric VPD of 1.3 kPa. Withoutacclimation, there would be a small increase in transpiration and a decrease in gs upon exposure to high VPD. With acclimation, there would be adoubling of transpiration and no change in gs after sustained exposure to high VPD.
2 R. M. Marchin et al.
© 2016 John Wiley & Sons Ltd, Plant, Cell and Environment
is 1140mm. Total precipitation was 884mm in the study year2010, 22% below average, and there was a moderate drought(Palmer Drought Index=�2 to � 2.9) during the growing sea-son (NDMC, USDA, & NOAA 2012).The experimental warming site consists of 15 plots in the for-
est understory: nine are heated chambers, three are unheatedcontrol chambers, and three are control plots that lack cham-bers but are the same size as the chambers. The octagonal,open-top chambers have a volume of 21.7m3 (5m in diameter,1.2m wall height) and are located on a north-facing slope(6–15% slope). The chambers are heated by forced air blownover hydronic radiators fed by a closed-loopmixture of hot wa-ter and propylene glycol (antifreeze). To control for effects ofwind, unheated chambers had the same forced air delivery sys-temwithout the radiators. Heat delivery to the chambers beganin January 2010, and chambers are heated year-round, bothday and night. The experiment uses a regression design ofchamber heating, where each chamber is heated to a target of1.5–5.5 °C above ambient T with 0.5 °C increments betweenchambers. Maintaining a precise target T over long time pe-riods is difficult, and the magnitude of warming varied by asmall amount over time (but were not statistically differentfrom target T, Fig. S1a). The T of control chambers was about0.5–0.9 °C above ambient temperature (Fig. S1a), so allwarming treatments were calculated relative to control cham-bers to account for this small chamber effect. Further detailsof the warming experiment can be found in Pelini et al. (2011).Sensors were installed in each chamber to measure air T
(two probes per chamber at 22 cm above ground level), soil T(two sensors buried 2 cm and two sensors buried 6 cm belowthe surface), relative humidity (HS-2000V capacitive polymersensor; Precon, Memphis, TN, USA), soil moisture (ModelCS616 TDR probes, Campbell Scientific Inc., Logan, UT,USA), and photosynthetically active radiation (PAR; ModelSQ110; Apogee Instruments Inc., Logan, UT, USA). Thesemeasurements were recorded every 10min by automateddataloggers (CR1000; Campbell Scientific Inc.). A duplicateset of sensors were installed within 1m of a focal A. rubrumseedling in each chamber to measure T and relative humidity(CS215-L sensor; Campbell Scientific Inc.), soil water content(Model CS616 TDR probes, Campbell Scientific Inc.), andPAR (Model SQ110; Apogee Instruments Inc.) every 10min.Environmental data were averaged over all available sensorsin an experimental chamber for data analysis. Relativeextractable soil water content (REW) was calculated for eachchamber according to the equation:
REW ¼ θ � θminð Þ= θmax � θminð Þ
where θ is the hourly soil water content, θmin is minimumsoil water content, and θmax is the mean maximum volumet-ric soil water content over the study period. Readings fromthree saturating rainfall events were averaged to determineθmax. Each reading was taken 2h after the rainfall event toaccount for soil macropore drainage and thus avoid over-estimating θmax.Many warming experiments unintentionally reduce light
availability and soil moisture (Kennedy 1995), but PAR and
REW was not affected by warming in our experiment (Fig.S1e,f). Our warming treatment heated the air inside chambersby 1.9–5.1 °C above controls (Fig. S1a), while the soil was indi-rectly warmed by up to 3.0 °C above controls (Fig. S1b).Warming decreased relative humidity by 5–14% and increasedVPD by 0.5–1.3kPa inside the experimental chambers (Fig.S1c,d).
Sap flux gauge design and deployment in the field
Miniature sap flux gauges were constructed according to thedesign by Clearwater et al. (2009) with several modifications.Similar sensor designs have been successfully used to mea-sure sap flux in a variety of plants and plant tissues, includ-ing flowering stems (Roddy & Dawson 2012), fruit pedicels(Clearwater et al. 2012), epiphytes (Gotsch et al. 2015) andshrubs (Skelton et al. 2013). Each gauge had a small externalheater (560 Ω, film-type resistor filed to flatten the externalside; filing did not affect the resistance) and two T sensors(fine-wire thermocouples) at equal distances (6mm) aboveand below the heater (Clearwater et al. 2009). These wereaffixed with cyanoacrylate adhesive to a cork block (32mmlong, 7mm wide, 4.5mm high). The heating element wasconnected in series with a voltage regulator delivering11.5V from a 12-V battery and controlled by a CR1000datalogger to deliver a 6-second heat pulse every 10min.This procedure dissipated 0.24W from the heating elementand caused no perceptible damage to the stem. The twothermocouples were connected to a multiplexer (AM16/32B, Campbell Scientific Inc.) via thermocouple extensionwire (Omega Engineering Inc., Stamford, CT, USA). Tem-perature of the thermocouples was measured immediatelyprior to each heat pulse and at 3-s intervals thereafter forsap flux calculations.
The four study species (A. rubrum, C. tomentosa, Q. alba,Q. rubra) are common in Duke Forest, enabling the sam-pling of naturally occurring tree seedlings that were presentat the site before the chambers were installed. One seedlingper species per chamber was sampled, if present, plus twoseedlings per species were measured in chamberless controlplots. Seedlings ranged from 9 to 84 cm in height withsmall-diameter stems (1.8–6.6mm). Gauges were installedon the surface of the main stem on 25 May–9 June, firmlysecured with laboratory film (Parafilm M, Alcan Packaging,Neeah, WI, USA), and insulated with foam rubber pipeinsulation, bubble wrap and foil.
Sap flux calculation
The heat ratio method (Marshall 1958) allows for the deter-mination of low flow rates in plant stems (Clearwater et al.2009). Sap flux was quantified at 10-minute intervals by ap-plying a heat pulse and measuring T differentials (°C) inthe top and bottom thermocouples (δT1 and δT2, respec-tively). These were measured over the interval from 60 to90 s after a heat pulse, which has been found to cover theperiod of greatest stability in T differentials (Clearwater
Stomatal acclimation increases transpiration 3
© 2016 John Wiley & Sons Ltd, Plant, Cell and Environment
et al. 2009). Whole-plant sap flux (F, g h�1) was calculatedusing the equation:
F ¼ B* lnδT1
δT2
� �
where B is an empirical coefficient that is a function of speciesand sapwood area and which is obtained from laboratory cali-brations. The calibration was performed to account for thethermal properties of stem anatomy (e.g. bark thickness, sap-wood area, volumetric stem water content) and for effects ofusing an external heat pulse (Marshall 1958; Clearwater et al.2009).We calculatedB as the slope of the relationship betweenln(δT1/δT2) and actual sap flow (F) in a series of calibration ex-periments in the laboratory.
For these calibrations, stems of non-study plants (n=10–12per species) were collected adjacent to the warming site inDuke Forest. Stems were cut in the field and submersed in wa-ter for transport to the laboratory. Stem ends were recut underwater in the laboratory, and stems were flushed with deionizedwater at 200kPa for 20min to remove emboli. A sap flux gaugewas installed on the stem and insulated as described earlier.The calibration was conducted by supplying water at a rangeof pressures, beginning at 200kPa and reducing the appliedpressure in approximately 10–20-kPa increments until the fluxreached zero.Afterflux stabilized at each pressure, ln(δT1/δT2)(i.e. the gauge signal) was recorded and the sap flow rate (F, gh�1) was measured volumetrically. Each calibration curvecontained 10–25 points.
To investigate potential sources of variation in B, sapwoodarea was measured on stem segments by perfusing stems withmethylene blue solution to determine the cross-sectional areaof active xylem (AS). The B was positively correlated to sap-wood area (AS) for each species (Fig. S2), so we estimated Bfor each study plant based on itsAS (Table S1). Species-specificallometric quadratic equations (Table S2) were used to relatestem diameter to AS, as determined from non-experimentalplants (n=11–17 per species) at the study site.
Sap flux data management
Significant offsets were detected in the sap flux measurementsin the field (i.e. nighttime measurements were significantly dif-ferent from zero) and were caused by small errors in the posi-tioning of the thermocouples on the gauge (Clearwater et al.2009). There was also seasonal drift in the zero offset of thegauges, possibly because of small fluctuations in stem diameterand gauge—bark contact throughout the growing season. Itwas therefore necessary to re-zero sap flux measurements ona daily basis using mean F from the previous night (23:00 to4:00). This procedure required the assumption of negligiblenighttime transpiration rates (Enight), which we tested byenclosing all study seedlings inside plastic bags to prevent tran-spiration and comparing the difference between the nighttimesap flux on bagged (22–23 October 2010) versus unbagged(21, 24October 2010) nights.MaximumEnight per unit leaf areawas less than 0.7mol H2O m�2 h�1 for all plants, and meanEnight was not significantly different from zero (Ar: 0.02±0.04
SE; Ct: 0.14±0.21; Qa: 0.01± 0.04; Qr: 0.01± 0.07). VPD canbe positively correlated with Enight (Caird et al. 2007), but thisrelationship existed only for A. rubrum (Ar: r2 = 0.53,p=0.041; Ct: r2 = 0.01, p=0.884; Qa: r2 = 0.06, p=0.505; Qr:r2 = 0.26, p=0.136). To account for this effect, the nightly zerooffset of A. rubrum seedlings heated by 2 °C or higher was in-creased by adding estimated Enight based on the T–Enight rela-tionship. These adjustments ranged from 0.007 to 0.025mmolH2O s�1.
Sap flux measurements from June to September 2010 wereobtained at 10-min intervals but were converted to hourly aver-ages for subsequent analyses. Despite care to insulate thegauges, sap flux was highly variable during rain events (possi-bly due to wetting of gauges), so all measurements during rainevents were discarded. Midday transpiration (Jmid, mol m�2
h�1, 1200 to 1400h) and whole-tree daily water flux (Etree,mol m�2 day�1, 0700 to 1800h) were calculated on a leaf areabasis. The AL of each study plant was estimated monthly bycounting number of leaves and using a species-specific allome-tric equation (Table S2) relating leaf number and stem height(H, cm) or diameter to AL, as determined from non-experimental plants (n=15–29 per species).
Whole-plant stomatal conductance
Stomatal conductance of whole seedlings (gs, mmol H2O m�2
s�1) was estimated from
gs ¼DL*AL
J*Patm� 1gb
� ��1
whereDL is leaf-to-air vapour pressure deficit (kPa),AL is leafarea (m2), J is transpiration rate (mmol H2O s�1), Patm isatmospheric pressure (kPa), and gb is boundary layerconductance (mmolm2 s�1). To determine leaf T, which isnecessary for calculating DL, abaxial leaf T was measured ontwo leaves per plant with thermocouples attached to the leafwith surgical tape.
For six to eight plants per species, gb was estimated by mea-suring the rate of mass loss of water from two water-saturatedfilter paper leaf replicas placed among the foliage, followingthe method of Roberts et al. (1990). Abaxial leaf surface Twas measured on one replica with a thermocouple and re-corded by a CR1000 datalogger, while mass loss from the otherleaf replica was measured at 5-min intervals. Values of gb werecalculated using the relationship:
gb ¼ E*Patmð Þ=DL
where E (mmolm2 s�1) is the evaporation rate of water fromthe leaf replica. We found that gb ranged from 762 to1969mmolm2 s�1 (Table S1).
To provide independent assessment of gs, leaf-level gs wasmeasured monthly using an AP4 porometer (Delta-T,Cambridge, UK). Stomatal conductance was measured ontwo leaves per plant at 2-h intervals from 0900 to 1700h on14 June, 21 July and 29August and at midday on 24 September2010. By comparing sap flux-based gs and porometric gs, wefound that seven of 40 gauges did not function properly and
4 R. M. Marchin et al.
© 2016 John Wiley & Sons Ltd, Plant, Cell and Environment
exhibited extremely low gs throughout the summer, possiblybecause of gauge attachment near a non-conducting stem seg-ment or poor contact between the gauge and the stem surface.We therefore removed these seedlings from analyses, leavingthe following sample sizes: A. rubrum (n=10), C. tomentosa(n=11) and Quercus spp. (n=12). The two Quercus spp. werepooled for analysis because of low sample sizes (Q. alba: 7;Q.rubra: 5).Hourly estimates of gs from sap fluxmeasurements generally
agreed with porometric gs, but tended to underestimate gs ofQuercus spp. (Fig. S3). InQuercus, the slope of the relationshipbetween sap flux-based gs and porometric gs was significantlydifferent from 1 (m=1.176, t165 = 11.953, p=0.001) and the in-tercept was significantly below 0 (b= –1.325, t165 = 5.146,p< 0.001), but not for Acer or Carya (slope: Ar: m=0.985,t146 = 0.103, p=0.749;Ct:m=0.965, t160 = 0.460, p=0.499; inter-cept: Ar: b= –0.086, t146 = 0.448, p=0.655; Ct: b= –0.105,t160 = 0.459, p=0.647).
Leaf water potential
Midday leaf water potentials (ΨL) were measured monthly on14 June, 21 July, 29 August and 24 September 2010. One leafper species per chamber was collected from non-study plants,and measured with a pressure chamber (Model 1000, PMS In-struments, Corvallis, OR, USA). Leaves were not collectedfromQ. rubra because of low seedling density in the chambers.
Statistical analyses
Unheated chambers had a minimal impact on plant water rela-tions, relative to chamberless controls. There was no differencebetween transpiration of plants in unheated chambers andchamberless controls in Acer (t3≤ 1.43, p≥ 0.290) or Quercus(t4≤ 1.05, p≥ 0.372). Transpiration of Carya seedlings waslower in the control chambers relative to the chamberless con-trol plots (0.5 versus 1.5molm�2 s�1, respectively: t4 = 3.59,p=0.037) in late August and September, but was unaffectedearlier in the growing season. We therefore restricted analysesof warming effects on plant water relations to summer (JJA)days and hereafter do not differentiate between plants in con-trol chambers and chamberless control plots. Coverage of thesap flux dataset (i.e. days with n=5–12 seedlings per genus)was 74–79days (>80%) of JJA, because of data losses fromsap flux sensor malfunctions, gaps in chamber environmentaldata and rain events.We fit both linear and quadratic models to determine the ef-
fect of chamber T and VPD on midday transpiration (Jmid) foreach seedling using the ‘lm’ function in the R STATISTICAL
PACKAGE (R 3.1.1, R Core Team 2014). We tested for individ-ual as well as combined effects of T and VPD on transpiration(i.e. T, VPD, T*VPD, T+VPD), thus testing a total of eightmodels. We chose the best model using Akaike’s InformationCriterion (AIC, Akaike 1974), which is a likelihood-basedmethod that compares the fit of models with a penalty for thenumber of parameters. When relevant, we determined the op-timal VPD for transpiration (Dopt), that is, VPD at maximum
Jmid, of the second-order polynomials and tested fortreatment-induced shifts in Dopt using least-square regression.
Stomatal response to VPD was quantified for each seedlingusing the relationship described by Oren et al. (1999b):
gs ¼�m� lnDL þ gsref
where –m is the sensitivity of gs to DL and gsref is a referenceconductance at DL=1kPa. Midday gs data was pooled fromJune–August, when mean monthly REW was similar (June:0.41, July: 0.35 and August: 0.34).
Differences in daily water flux, middayΨL, stomatal sensitiv-ity and gsref due to the experimental treatment were analyzedusing least-square regression for each genus separately, as ap-propriate for the experimental design. Standardized major axis(SMA) regression was used to characterize the relationship be-tween sap flux-based and porometric gs and between leaf waterpotential and gs using SMATR 2.0 (Warton et al. 2006). SMAwas used because it is not possible to functionally assign eithervariable as dependent. Before analyses, daily water flux and gswere ln-transformed to achieve normality. Means were consid-ered significantly different at p≤ 0.05.
RESULTS
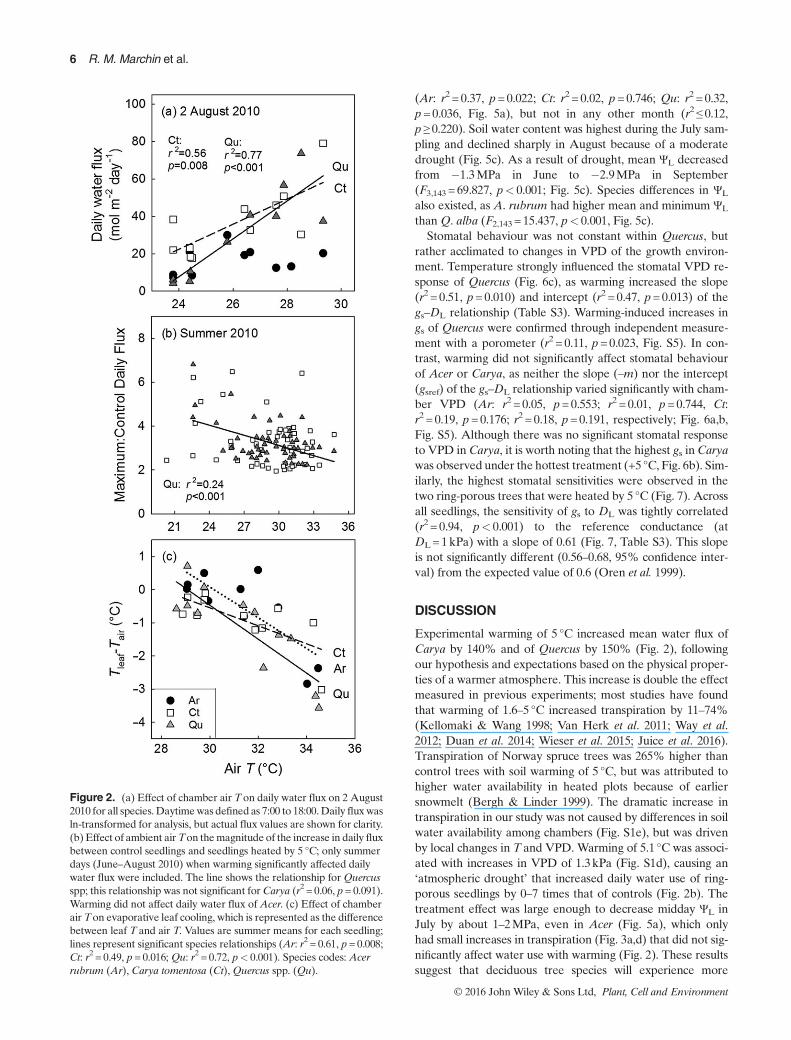
The effect of warming on plant water relations was dependenton genus. Warming increased daily water flux of Carya andQuercus, but notAcer (Fig. 2a). This effect was consistent overtime, with significant increases occurring on 61% of summerdays for Carya (r2≥ 0.36, p≤ 0.049), 70% for Quercus(r2≥ 0.42, p≤ 0.045), and 0% for Acer (r2≤ 0.56, p≥ 0.062).Daily water flux of Carya and Quercus seedlings heated by 5°C ranged from 0 to 7 times greater than that of controls(Fig. 2b). The largest warming-induced increases in transpira-tion of Quercus occurred on cooler summer days (ambientT< 30 °C; r2 = 0.24, p< 0.001, Fig. 2b). Increased evaporativecooling of leaves with warming was observed for all three gen-era (Ar: r2 = 0.61, p=0.008;Ct: r2 = 0.49, p=0.016;Qu: r2 = 0.72,p< 0.001, Fig. 2c), which prevented leaf Tof warmed seedlingsfrom exceeding 41 °C (Fig. S4).
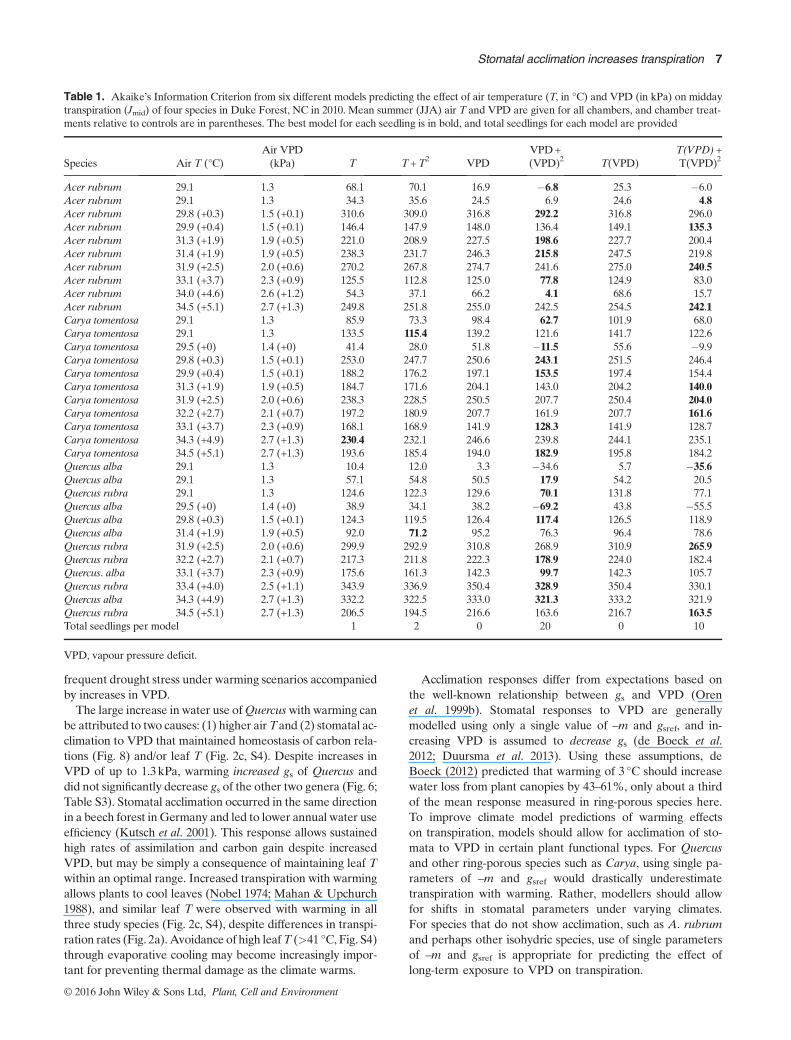
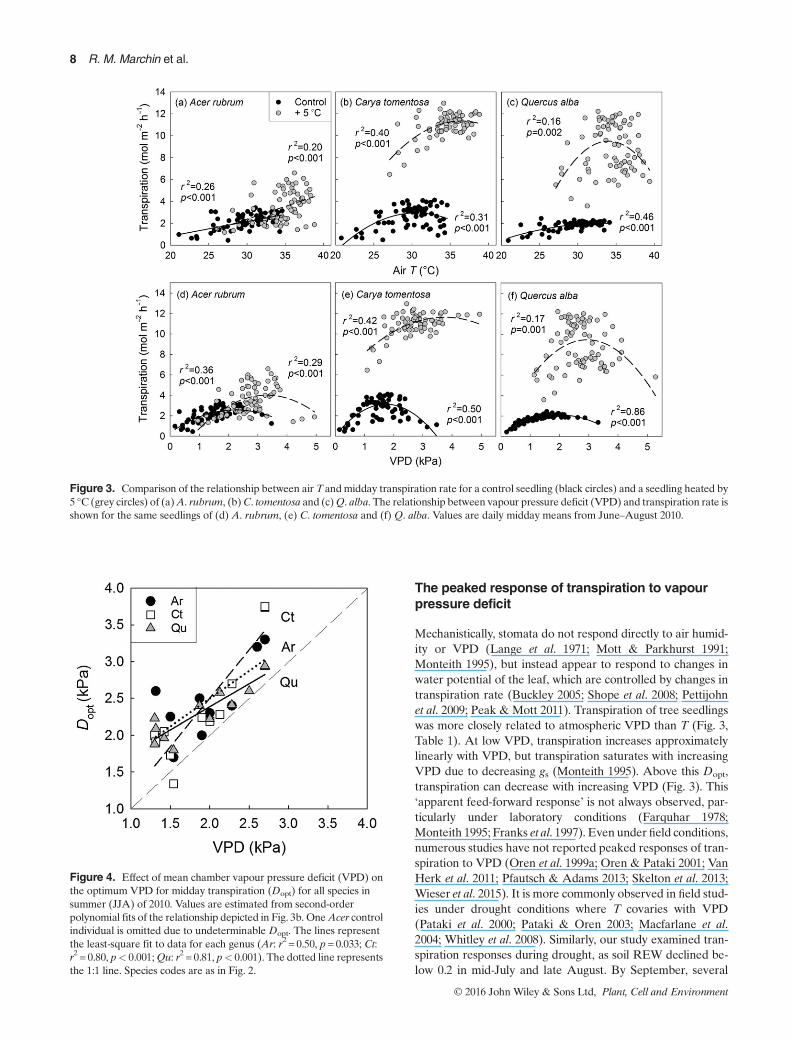
The shape of the relationship between air T and transpira-tion varied among seedlings, with peaked (quadratic) re-sponses found in 26 seedlings and positive linear relationshipsfound in seven seedlings (Table 1). Linear responses of transpi-ration to air Twere observed in control and heated individualsand were most common inAcer (Ar: 4, Ct: 2,Qu: 1; Fig. 3a–c).Transpiration rate was more closely related to changes in VPDthan T (or the combined effect ofTand VPD, i.e. T*VPD or T+VPD) over the summer (Table 1), however. For all seedlings,a peaked response of transpiration to VPD was observed(Table 1, Fig. 3d–f). The optimumVPD for transpiration (Dopt)was not constant within a genus, but rather was positively cor-related to chamber VPD (Ar: r2 = 0.50, p=0.033; Ct: r2 = 0.80,p< 0.001; Qu: r2 = 0.81, p< 0.001, Fig. 4).
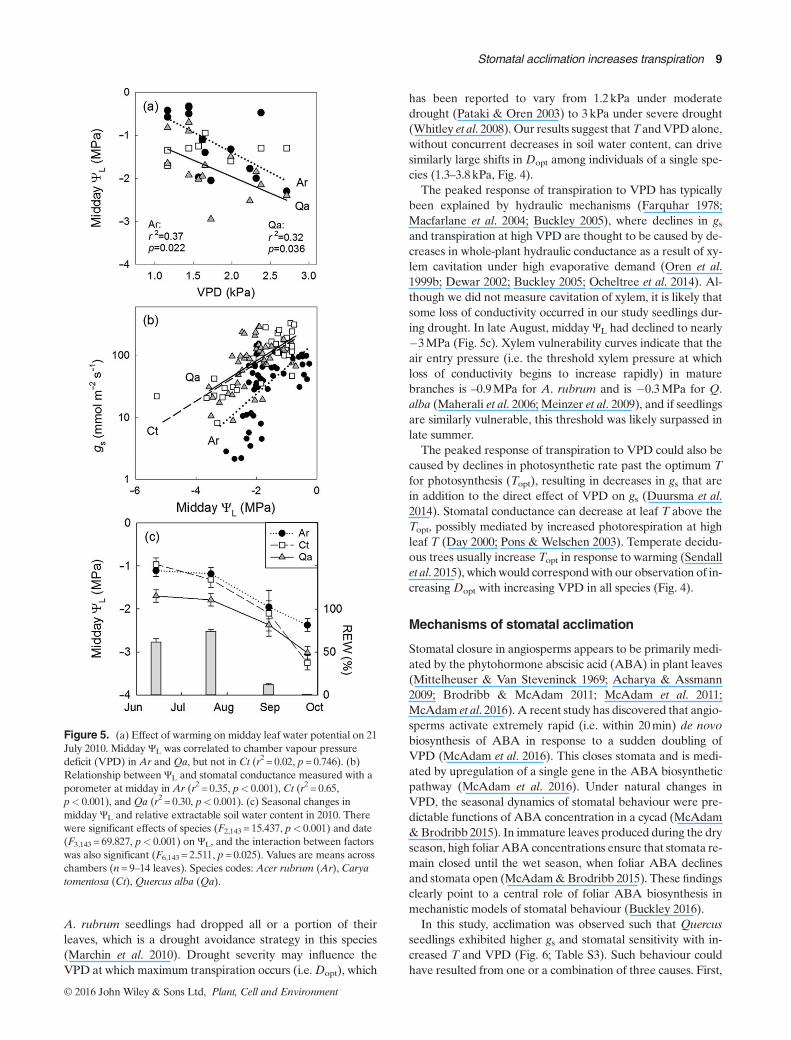
Midday leaf water potential (ΨL) was affected by thewarming treatment (Fig. 5a), even with no detectable changein soil water content (Fig. S1e). Midday ΨL was negativelycorrelated with chamber VPD in Acer and Quercus in July
Stomatal acclimation increases transpiration 5
© 2016 John Wiley & Sons Ltd, Plant, Cell and Environment
(Ar: r2 = 0.37, p=0.022; Ct: r2 = 0.02, p=0.746; Qu: r2 = 0.32,p=0.036, Fig. 5a), but not in any other month (r2≤ 0.12,p≥ 0.220). Soil water content was highest during the July sam-pling and declined sharply in August because of a moderatedrought (Fig. 5c). As a result of drought, mean ΨL decreasedfrom �1.3MPa in June to �2.9MPa in September(F3,143 = 69.827, p< 0.001; Fig. 5c). Species differences in ΨL
also existed, as A. rubrum had higher mean and minimum ΨL
than Q. alba (F2,143 = 15.437, p< 0.001, Fig. 5c).Stomatal behaviour was not constant within Quercus, but
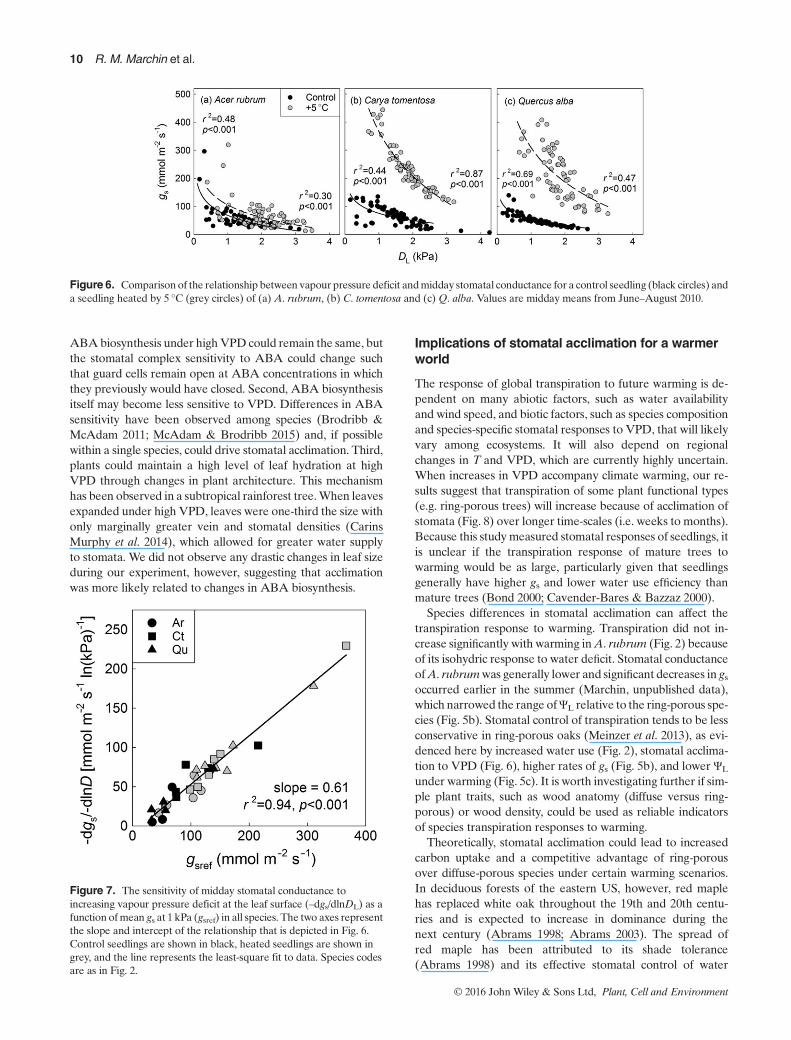
rather acclimated to changes in VPD of the growth environ-ment. Temperature strongly influenced the stomatal VPD re-sponse of Quercus (Fig. 6c), as warming increased the slope(r2 = 0.51, p=0.010) and intercept (r2 = 0.47, p=0.013) of thegs–DL relationship (Table S3). Warming-induced increases ings of Quercus were confirmed through independent measure-ment with a porometer (r2 = 0.11, p=0.023, Fig. S5). In con-trast, warming did not significantly affect stomatal behaviourof Acer or Carya, as neither the slope (–m) nor the intercept(gsref) of the gs–DL relationship varied significantly with cham-ber VPD (Ar: r2 = 0.05, p=0.553; r2 = 0.01, p=0.744, Ct:r2 = 0.19, p=0.176; r2 = 0.18, p=0.191, respectively; Fig. 6a,b,Fig. S5). Although there was no significant stomatal responseto VPD in Carya, it is worth noting that the highest gs inCaryawas observed under the hottest treatment (+5 °C, Fig. 6b). Sim-ilarly, the highest stomatal sensitivities were observed in thetwo ring-porous trees that were heated by 5 °C (Fig. 7). Acrossall seedlings, the sensitivity of gs to DL was tightly correlated(r2 = 0.94, p< 0.001) to the reference conductance (atDL=1kPa) with a slope of 0.61 (Fig. 7, Table S3). This slopeis not significantly different (0.56–0.68, 95% confidence inter-val) from the expected value of 0.6 (Oren et al. 1999).
DISCUSSION
Experimental warming of 5 °C increased mean water flux ofCarya by 140% and of Quercus by 150% (Fig. 2), followingour hypothesis and expectations based on the physical proper-ties of a warmer atmosphere. This increase is double the effectmeasured in previous experiments; most studies have foundthat warming of 1.6–5 °C increased transpiration by 11–74%(Kellomaki & Wang 1998; Van Herk et al. 2011; Way et al.2012; Duan et al. 2014; Wieser et al. 2015; Juice et al. 2016).Transpiration of Norway spruce trees was 265% higher thancontrol trees with soil warming of 5 °C, but was attributed tohigher water availability in heated plots because of earliersnowmelt (Bergh & Linder 1999). The dramatic increase intranspiration in our study was not caused by differences in soilwater availability among chambers (Fig. S1e), but was drivenby local changes in T and VPD. Warming of 5.1 °C was associ-ated with increases in VPD of 1.3kPa (Fig. S1d), causing an‘atmospheric drought’ that increased daily water use of ring-porous seedlings by 0–7 times that of controls (Fig. 2b). Thetreatment effect was large enough to decrease midday ΨL inJuly by about 1–2MPa, even in Acer (Fig. 5a), which onlyhad small increases in transpiration (Fig. 3a,d) that did not sig-nificantly affect water use with warming (Fig. 2). These resultssuggest that deciduous tree species will experience more
Figure 2. (a) Effect of chamber air Ton daily water flux on 2 August2010 for all species. Daytimewas defined as 7:00 to 18:00.Daily flux wasln-transformed for analysis, but actual flux values are shown for clarity.(b) Effect of ambient airTon themagnitude of the increase in daily fluxbetween control seedlings and seedlings heated by 5 °C; only summerdays (June–August 2010) when warming significantly affected dailywater flux were included. The line shows the relationship forQuercusspp; this relationship was not significant for Carya (r2 = 0.06, p= 0.091).Warming did not affect daily water flux of Acer. (c) Effect of chamberair Ton evaporative leaf cooling, which is represented as the differencebetween leaf T and air T. Values are summer means for each seedling;lines represent significant species relationships (Ar: r2 = 0.61, p= 0.008;Ct: r2 = 0.49, p= 0.016; Qu: r2 = 0.72, p< 0.001). Species codes: Acerrubrum (Ar), Carya tomentosa (Ct),Quercus spp. (Qu).
6 R. M. Marchin et al.
© 2016 John Wiley & Sons Ltd, Plant, Cell and Environment
frequent drought stress under warming scenarios accompaniedby increases in VPD.The large increase in water use ofQuercuswith warming can
be attributed to two causes: (1) higher airTand (2) stomatal ac-climation to VPD that maintained homeostasis of carbon rela-tions (Fig. 8) and/or leaf T (Fig. 2c, S4). Despite increases inVPD of up to 1.3kPa, warming increased gs of Quercus anddid not significantly decrease gs of the other two genera (Fig. 6;Table S3). Stomatal acclimation occurred in the same directionin a beech forest inGermany and led to lower annual water useefficiency (Kutsch et al. 2001). This response allows sustainedhigh rates of assimilation and carbon gain despite increasedVPD, but may be simply a consequence of maintaining leaf Twithin an optimal range. Increased transpiration with warmingallows plants to cool leaves (Nobel 1974; Mahan & Upchurch1988), and similar leaf T were observed with warming in allthree study species (Fig. 2c, S4), despite differences in transpi-ration rates (Fig. 2a).Avoidance of high leafT (>41 °C, Fig. S4)through evaporative cooling may become increasingly impor-tant for preventing thermal damage as the climate warms.
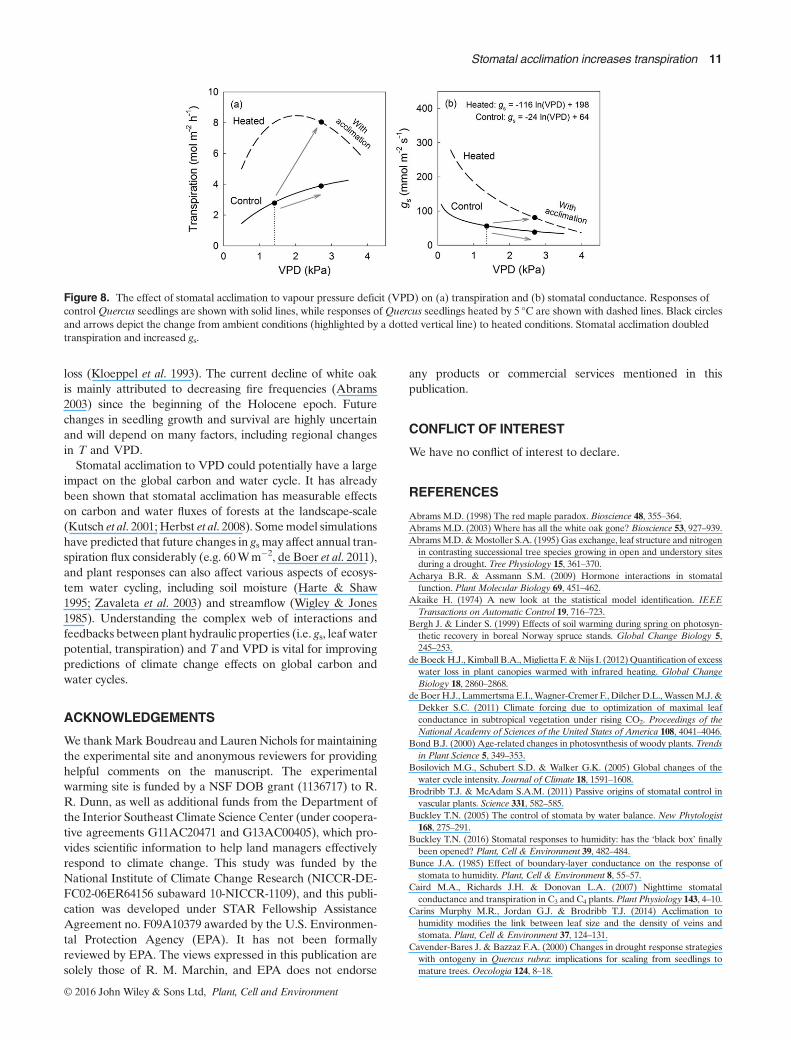
Acclimation responses differ from expectations based onthe well-known relationship between gs and VPD (Orenet al. 1999b). Stomatal responses to VPD are generallymodelled using only a single value of –m and gsref, and in-creasing VPD is assumed to decrease gs (de Boeck et al.2012; Duursma et al. 2013). Using these assumptions, deBoeck (2012) predicted that warming of 3 °C should increasewater loss from plant canopies by 43–61%, only about a thirdof the mean response measured in ring-porous species here.To improve climate model predictions of warming effectson transpiration, models should allow for acclimation of sto-mata to VPD in certain plant functional types. For Quercusand other ring-porous species such as Carya, using single pa-rameters of –m and gsref would drastically underestimatetranspiration with warming. Rather, modellers should allowfor shifts in stomatal parameters under varying climates.For species that do not show acclimation, such as A. rubrumand perhaps other isohydric species, use of single parametersof –m and gsref is appropriate for predicting the effect oflong-term exposure to VPD on transpiration.
Table 1. Akaike’s Information Criterion from six different models predicting the effect of air temperature (T, in °C) and VPD (in kPa) on middaytranspiration (Jmid) of four species in Duke Forest, NC in 2010. Mean summer (JJA) air T and VPD are given for all chambers, and chamber treat-ments relative to controls are in parentheses. The best model for each seedling is in bold, and total seedlings for each model are provided
Species Air T (°C)Air VPD(kPa) T T+T2 VPD
VPD+(VPD)2 T(VPD)
T(VPD)+T(VPD)2
Acer rubrum 29.1 1.3 68.1 70.1 16.9 �6.8 25.3 �6.0Acer rubrum 29.1 1.3 34.3 35.6 24.5 6.9 24.6 4.8Acer rubrum 29.8 (+0.3) 1.5 (+0.1) 310.6 309.0 316.8 292.2 316.8 296.0Acer rubrum 29.9 (+0.4) 1.5 (+0.1) 146.4 147.9 148.0 136.4 149.1 135.3Acer rubrum 31.3 (+1.9) 1.9 (+0.5) 221.0 208.9 227.5 198.6 227.7 200.4Acer rubrum 31.4 (+1.9) 1.9 (+0.5) 238.3 231.7 246.3 215.8 247.5 219.8Acer rubrum 31.9 (+2.5) 2.0 (+0.6) 270.2 267.8 274.7 241.6 275.0 240.5Acer rubrum 33.1 (+3.7) 2.3 (+0.9) 125.5 112.8 125.0 77.8 124.9 83.0Acer rubrum 34.0 (+4.6) 2.6 (+1.2) 54.3 37.1 66.2 4.1 68.6 15.7Acer rubrum 34.5 (+5.1) 2.7 (+1.3) 249.8 251.8 255.0 242.5 254.5 242.1Carya tomentosa 29.1 1.3 85.9 73.3 98.4 62.7 101.9 68.0Carya tomentosa 29.1 1.3 133.5 115.4 139.2 121.6 141.7 122.6Carya tomentosa 29.5 (+0) 1.4 (+0) 41.4 28.0 51.8 �11.5 55.6 �9.9Carya tomentosa 29.8 (+0.3) 1.5 (+0.1) 253.0 247.7 250.6 243.1 251.5 246.4Carya tomentosa 29.9 (+0.4) 1.5 (+0.1) 188.2 176.2 197.1 153.5 197.4 154.4Carya tomentosa 31.3 (+1.9) 1.9 (+0.5) 184.7 171.6 204.1 143.0 204.2 140.0Carya tomentosa 31.9 (+2.5) 2.0 (+0.6) 238.3 228.5 250.5 207.7 250.4 204.0Carya tomentosa 32.2 (+2.7) 2.1 (+0.7) 197.2 180.9 207.7 161.9 207.7 161.6Carya tomentosa 33.1 (+3.7) 2.3 (+0.9) 168.1 168.9 141.9 128.3 141.9 128.7Carya tomentosa 34.3 (+4.9) 2.7 (+1.3) 230.4 232.1 246.6 239.8 244.1 235.1Carya tomentosa 34.5 (+5.1) 2.7 (+1.3) 193.6 185.4 194.0 182.9 195.8 184.2Quercus alba 29.1 1.3 10.4 12.0 3.3 �34.6 5.7 �35.6Quercus alba 29.1 1.3 57.1 54.8 50.5 17.9 54.2 20.5Quercus rubra 29.1 1.3 124.6 122.3 129.6 70.1 131.8 77.1Quercus alba 29.5 (+0) 1.4 (+0) 38.9 34.1 38.2 �69.2 43.8 �55.5Quercus alba 29.8 (+0.3) 1.5 (+0.1) 124.3 119.5 126.4 117.4 126.5 118.9Quercus alba 31.4 (+1.9) 1.9 (+0.5) 92.0 71.2 95.2 76.3 96.4 78.6Quercus rubra 31.9 (+2.5) 2.0 (+0.6) 299.9 292.9 310.8 268.9 310.9 265.9Quercus rubra 32.2 (+2.7) 2.1 (+0.7) 217.3 211.8 222.3 178.9 224.0 182.4Quercus. alba 33.1 (+3.7) 2.3 (+0.9) 175.6 161.3 142.3 99.7 142.3 105.7Quercus rubra 33.4 (+4.0) 2.5 (+1.1) 343.9 336.9 350.4 328.9 350.4 330.1Quercus alba 34.3 (+4.9) 2.7 (+1.3) 332.2 322.5 333.0 321.3 333.2 321.9Quercus rubra 34.5 (+5.1) 2.7 (+1.3) 206.5 194.5 216.6 163.6 216.7 163.5Total seedlings per model 1 2 0 20 0 10
VPD, vapour pressure deficit.
Stomatal acclimation increases transpiration 7
© 2016 John Wiley & Sons Ltd, Plant, Cell and Environment
The peaked response of transpiration to vapourpressure deficit
Mechanistically, stomata do not respond directly to air humid-ity or VPD (Lange et al. 1971; Mott & Parkhurst 1991;Monteith 1995), but instead appear to respond to changes inwater potential of the leaf, which are controlled by changes intranspiration rate (Buckley 2005; Shope et al. 2008; Pettijohnet al. 2009; Peak & Mott 2011). Transpiration of tree seedlingswas more closely related to atmospheric VPD than T (Fig. 3,Table 1). At low VPD, transpiration increases approximatelylinearly with VPD, but transpiration saturates with increasingVPD due to decreasing gs (Monteith 1995). Above this Dopt,transpiration can decrease with increasing VPD (Fig. 3). This‘apparent feed-forward response’ is not always observed, par-ticularly under laboratory conditions (Farquhar 1978;Monteith 1995; Franks et al. 1997). Even under field conditions,numerous studies have not reported peaked responses of tran-spiration to VPD (Oren et al. 1999a; Oren & Pataki 2001; VanHerk et al. 2011; Pfautsch & Adams 2013; Skelton et al. 2013;Wieser et al. 2015). It is more commonly observed in field stud-ies under drought conditions where T covaries with VPD(Pataki et al. 2000; Pataki & Oren 2003; Macfarlane et al.2004; Whitley et al. 2008). Similarly, our study examined tran-spiration responses during drought, as soil REW declined be-low 0.2 in mid-July and late August. By September, several
Figure 3. Comparison of the relationship between air T andmidday transpiration rate for a control seedling (black circles) and a seedling heated by5 °C (grey circles) of (a)A. rubrum, (b)C. tomentosa and (c)Q. alba. The relationship between vapour pressure deficit (VPD) and transpiration rate isshown for the same seedlings of (d) A. rubrum, (e) C. tomentosa and (f)Q. alba. Values are daily midday means from June–August 2010.
Figure 4. Effect of mean chamber vapour pressure deficit (VPD) onthe optimum VPD for midday transpiration (Dopt) for all species insummer (JJA) of 2010. Values are estimated from second-orderpolynomial fits of the relationship depicted in Fig. 3b. OneAcer controlindividual is omitted due to undeterminable Dopt. The lines representthe least-square fit to data for each genus (Ar: r2 = 0.50, p= 0.033; Ct:r2 = 0.80, p< 0.001;Qu: r2 = 0.81, p< 0.001). The dotted line representsthe 1:1 line. Species codes are as in Fig. 2.
8 R. M. Marchin et al.
© 2016 John Wiley & Sons Ltd, Plant, Cell and Environment
A. rubrum seedlings had dropped all or a portion of theirleaves, which is a drought avoidance strategy in this species(Marchin et al. 2010). Drought severity may influence theVPD at which maximum transpiration occurs (i.e.Dopt), which
has been reported to vary from 1.2kPa under moderatedrought (Pataki & Oren 2003) to 3kPa under severe drought(Whitley et al. 2008). Our results suggest thatTandVPDalone,without concurrent decreases in soil water content, can drivesimilarly large shifts in Dopt among individuals of a single spe-cies (1.3–3.8 kPa, Fig. 4).
The peaked response of transpiration to VPD has typicallybeen explained by hydraulic mechanisms (Farquhar 1978;Macfarlane et al. 2004; Buckley 2005), where declines in gsand transpiration at high VPD are thought to be caused by de-creases in whole-plant hydraulic conductance as a result of xy-lem cavitation under high evaporative demand (Oren et al.1999b; Dewar 2002; Buckley 2005; Ocheltree et al. 2014). Al-though we did not measure cavitation of xylem, it is likely thatsome loss of conductivity occurred in our study seedlings dur-ing drought. In late August, midday ΨL had declined to nearly�3MPa (Fig. 5c). Xylem vulnerability curves indicate that theair entry pressure (i.e. the threshold xylem pressure at whichloss of conductivity begins to increase rapidly) in maturebranches is –0.9MPa for A. rubrum and is �0.3MPa for Q.alba (Maherali et al. 2006; Meinzer et al. 2009), and if seedlingsare similarly vulnerable, this threshold was likely surpassed inlate summer.
The peaked response of transpiration to VPD could also becaused by declines in photosynthetic rate past the optimum Tfor photosynthesis (Topt), resulting in decreases in gs that arein addition to the direct effect of VPD on gs (Duursma et al.2014). Stomatal conductance can decrease at leaf T above theTopt, possibly mediated by increased photorespiration at highleaf T (Day 2000; Pons & Welschen 2003). Temperate decidu-ous trees usually increase Topt in response to warming (Sendallet al. 2015), whichwould correspondwith our observation of in-creasing Dopt with increasing VPD in all species (Fig. 4).
Mechanisms of stomatal acclimation
Stomatal closure in angiosperms appears to be primarily medi-ated by the phytohormone abscisic acid (ABA) in plant leaves(Mittelheuser & Van Steveninck 1969; Acharya & Assmann2009; Brodribb & McAdam 2011; McAdam et al. 2011;McAdam et al. 2016). A recent study has discovered that angio-sperms activate extremely rapid (i.e. within 20min) de novobiosynthesis of ABA in response to a sudden doubling ofVPD (McAdam et al. 2016). This closes stomata and is medi-ated by upregulation of a single gene in the ABA biosyntheticpathway (McAdam et al. 2016). Under natural changes inVPD, the seasonal dynamics of stomatal behaviour were pre-dictable functions of ABA concentration in a cycad (McAdam&Brodribb 2015). In immature leaves produced during the dryseason, high foliar ABA concentrations ensure that stomata re-main closed until the wet season, when foliar ABA declinesand stomata open (McAdam&Brodribb 2015). These findingsclearly point to a central role of foliar ABA biosynthesis inmechanistic models of stomatal behaviour (Buckley 2016).
In this study, acclimation was observed such that Quercusseedlings exhibited higher gs and stomatal sensitivity with in-creased T and VPD (Fig. 6; Table S3). Such behaviour couldhave resulted from one or a combination of three causes. First,
Figure 5. (a) Effect of warming on midday leaf water potential on 21July 2010. Midday ΨL was correlated to chamber vapour pressuredeficit (VPD) in Ar and Qa, but not in Ct (r2 = 0.02, p= 0.746). (b)Relationship between ΨL and stomatal conductance measured with aporometer at midday in Ar (r2 = 0.35, p< 0.001), Ct (r2 = 0.65,p< 0.001), andQa (r2 = 0.30, p< 0.001). (c) Seasonal changes inmidday ΨL and relative extractable soil water content in 2010. Therewere significant effects of species (F2,143 = 15.437, p< 0.001) and date(F3,143 = 69.827, p< 0.001) on ΨL, and the interaction between factorswas also significant (F6,143 = 2.511, p= 0.025). Values are means acrosschambers (n= 9–14 leaves). Species codes: Acer rubrum (Ar), Caryatomentosa (Ct), Quercus alba (Qa).
Stomatal acclimation increases transpiration 9
© 2016 John Wiley & Sons Ltd, Plant, Cell and Environment
ABAbiosynthesis under high VPD could remain the same, butthe stomatal complex sensitivity to ABA could change suchthat guard cells remain open at ABA concentrations in whichthey previously would have closed. Second, ABA biosynthesisitself may become less sensitive to VPD. Differences in ABAsensitivity have been observed among species (Brodribb &McAdam 2011; McAdam & Brodribb 2015) and, if possiblewithin a single species, could drive stomatal acclimation. Third,plants could maintain a high level of leaf hydration at highVPD through changes in plant architecture. This mechanismhas been observed in a subtropical rainforest tree.When leavesexpanded under high VPD, leaves were one-third the size withonly marginally greater vein and stomatal densities (CarinsMurphy et al. 2014), which allowed for greater water supplyto stomata. We did not observe any drastic changes in leaf sizeduring our experiment, however, suggesting that acclimationwas more likely related to changes in ABA biosynthesis.
Implications of stomatal acclimation for a warmerworld
The response of global transpiration to future warming is de-pendent on many abiotic factors, such as water availabilityand wind speed, and biotic factors, such as species compositionand species-specific stomatal responses to VPD, that will likelyvary among ecosystems. It will also depend on regionalchanges in T and VPD, which are currently highly uncertain.When increases in VPD accompany climate warming, our re-sults suggest that transpiration of some plant functional types(e.g. ring-porous trees) will increase because of acclimation ofstomata (Fig. 8) over longer time-scales (i.e. weeks to months).Because this study measured stomatal responses of seedlings, itis unclear if the transpiration response of mature trees towarming would be as large, particularly given that seedlingsgenerally have higher gs and lower water use efficiency thanmature trees (Bond 2000; Cavender-Bares & Bazzaz 2000).
Species differences in stomatal acclimation can affect thetranspiration response to warming. Transpiration did not in-crease significantly with warming inA. rubrum (Fig. 2) becauseof its isohydric response to water deficit. Stomatal conductanceofA. rubrumwas generally lower and significant decreases in gsoccurred earlier in the summer (Marchin, unpublished data),which narrowed the range ofΨL relative to the ring-porous spe-cies (Fig. 5b). Stomatal control of transpiration tends to be lessconservative in ring-porous oaks (Meinzer et al. 2013), as evi-denced here by increased water use (Fig. 2), stomatal acclima-tion to VPD (Fig. 6), higher rates of gs (Fig. 5b), and lower ΨL
under warming (Fig. 5c). It is worth investigating further if sim-ple plant traits, such as wood anatomy (diffuse versus ring-porous) or wood density, could be used as reliable indicatorsof species transpiration responses to warming.
Theoretically, stomatal acclimation could lead to increasedcarbon uptake and a competitive advantage of ring-porousover diffuse-porous species under certain warming scenarios.In deciduous forests of the eastern US, however, red maplehas replaced white oak throughout the 19th and 20th centu-ries and is expected to increase in dominance during thenext century (Abrams 1998; Abrams 2003). The spread ofred maple has been attributed to its shade tolerance(Abrams 1998) and its effective stomatal control of water
Figure 6. Comparison of the relationship between vapour pressure deficit andmidday stomatal conductance for a control seedling (black circles) anda seedling heated by 5 °C (grey circles) of (a) A. rubrum, (b) C. tomentosa and (c) Q. alba. Values are midday means from June–August 2010.
Figure 7. The sensitivity of midday stomatal conductance toincreasing vapour pressure deficit at the leaf surface (–dgs/dlnDL) as afunction ofmean gs at 1 kPa (gsref) in all species. The two axes representthe slope and intercept of the relationship that is depicted in Fig. 6.Control seedlings are shown in black, heated seedlings are shown ingrey, and the line represents the least-square fit to data. Species codesare as in Fig. 2.
10 R. M. Marchin et al.
© 2016 John Wiley & Sons Ltd, Plant, Cell and Environment
loss (Kloeppel et al. 1993). The current decline of white oakis mainly attributed to decreasing fire frequencies (Abrams2003) since the beginning of the Holocene epoch. Futurechanges in seedling growth and survival are highly uncertainand will depend on many factors, including regional changesin T and VPD.Stomatal acclimation to VPD could potentially have a large
impact on the global carbon and water cycle. It has alreadybeen shown that stomatal acclimation has measurable effectson carbon and water fluxes of forests at the landscape-scale(Kutsch et al. 2001; Herbst et al. 2008). Somemodel simulationshave predicted that future changes in gs may affect annual tran-spiration flux considerably (e.g. 60Wm�2, de Boer et al. 2011),and plant responses can also affect various aspects of ecosys-tem water cycling, including soil moisture (Harte & Shaw1995; Zavaleta et al. 2003) and streamflow (Wigley & Jones1985). Understanding the complex web of interactions andfeedbacks between plant hydraulic properties (i.e. gs, leaf waterpotential, transpiration) and T and VPD is vital for improvingpredictions of climate change effects on global carbon andwater cycles.
ACKNOWLEDGEMENTS
We thankMark Boudreau and Lauren Nichols for maintainingthe experimental site and anonymous reviewers for providinghelpful comments on the manuscript. The experimentalwarming site is funded by a NSF DOB grant (1136717) to R.R. Dunn, as well as additional funds from the Department ofthe Interior Southeast Climate Science Center (under coopera-tive agreements G11AC20471 and G13AC00405), which pro-vides scientific information to help land managers effectivelyrespond to climate change. This study was funded by theNational Institute of Climate Change Research (NICCR-DE-FC02-06ER64156 subaward 10-NICCR-1109), and this publi-cation was developed under STAR Fellowship AssistanceAgreement no. F09A10379 awarded by the U.S. Environmen-tal Protection Agency (EPA). It has not been formallyreviewed by EPA. The views expressed in this publication aresolely those of R. M. Marchin, and EPA does not endorse
any products or commercial services mentioned in thispublication.
CONFLICT OF INTEREST
We have no conflict of interest to declare.
REFERENCES
Abrams M.D. (1998) The red maple paradox. Bioscience 48, 355–364.Abrams M.D. (2003) Where has all the white oak gone? Bioscience 53, 927–939.AbramsM.D. &Mostoller S.A. (1995) Gas exchange, leaf structure and nitrogenin contrasting successional tree species growing in open and understory sitesduring a drought. Tree Physiology 15, 361–370.
Acharya B.R. & Assmann S.M. (2009) Hormone interactions in stomatalfunction. Plant Molecular Biology 69, 451–462.
Akaike H. (1974) A new look at the statistical model identification. IEEETransactions on Automatic Control 19, 716–723.
Bergh J. & Linder S. (1999) Effects of soil warming during spring on photosyn-thetic recovery in boreal Norway spruce stands. Global Change Biology 5,245–253.
de BoeckH.J., Kimball B.A.,Miglietta F. &Nijs I. (2012)Quantification of excesswater loss in plant canopies warmed with infrared heating. Global ChangeBiology 18, 2860–2868.
de BoerH.J., LammertsmaE.I., Wagner-Cremer F., Dilcher D.L.,WassenM.J. &Dekker S.C. (2011) Climate forcing due to optimization of maximal leafconductance in subtropical vegetation under rising CO2. Proceedings of theNational Academy of Sciences of the United States of America 108, 4041–4046.
Bond B.J. (2000) Age-related changes in photosynthesis of woody plants. Trendsin Plant Science 5, 349–353.
Bosilovich M.G., Schubert S.D. & Walker G.K. (2005) Global changes of thewater cycle intensity. Journal of Climate 18, 1591–1608.
Brodribb T.J. & McAdam S.A.M. (2011) Passive origins of stomatal control invascular plants. Science 331, 582–585.
Buckley T.N. (2005) The control of stomata by water balance. New Phytologist168, 275–291.
Buckley T.N. (2016) Stomatal responses to humidity: has the ‘black box’ finallybeen opened? Plant, Cell & Environment 39, 482–484.
Bunce J.A. (1985) Effect of boundary-layer conductance on the response ofstomata to humidity. Plant, Cell & Environment 8, 55–57.
Caird M.A., Richards J.H. & Donovan L.A. (2007) Nighttime stomatalconductance and transpiration in C3 and C4 plants. Plant Physiology 143, 4–10.
Carins Murphy M.R., Jordan G.J. & Brodribb T.J. (2014) Acclimation tohumidity modifies the link between leaf size and the density of veins andstomata. Plant, Cell & Environment 37, 124–131.
Cavender-Bares J. & Bazzaz F.A. (2000) Changes in drought response strategieswith ontogeny in Quercus rubra: implications for scaling from seedlings tomature trees.Oecologia 124, 8–18.
Figure 8. The effect of stomatal acclimation to vapour pressure deficit (VPD) on (a) transpiration and (b) stomatal conductance. Responses ofcontrolQuercus seedlings are shown with solid lines, while responses ofQuercus seedlings heated by 5 °C are shown with dashed lines. Black circlesand arrows depict the change from ambient conditions (highlighted by a dotted vertical line) to heated conditions. Stomatal acclimation doubledtranspiration and increased gs.
Stomatal acclimation increases transpiration 11
© 2016 John Wiley & Sons Ltd, Plant, Cell and Environment
Chahine M.T. (1992) The hydrologic cycle and its influence on climate. Nature359, 373–380.
Clearwater M.J., Luo Z.W., Mazzeo M. & Dichio B. (2009) An external heatpulse method for measurement of sap flow through fruit pedicels, leaf petiolesand other small-diameter stems. Plant, Cell & Environment 32, 1652–1663.
ClearwaterM.J., Luo Z., Ong S.E.C., Blattmann P. & Thorp T.G. (2012) Vascularfunctioning and the water balance of ripening kiwifruit (Actinidia chinensis)berries. Journal of Experimental Botany 63, 1835–1847.
Cunningham S.C. (2005) Photosynthetic responses to vapour pressure deficit intemperate and tropical evergreen rainforest trees of Australia. Oecologia 142,521–528.
Day M.E. (2000) Influence of temperature and leaf-to-air vapor pressure deficiton net photosynthesis and stomatal conductance in red spruce (Picea rubens).Tree Physiology 20, 57–63.
Dewar R.C. (2002) The Ball-Berry-Leuning and Tardieu-Davies stomatalmodels: synthesis and extension within a spatially aggregated picture of guardcell function. Plant, Cell & Environment 25, 1383–1398.
Duan H., Duursma R.A., Huang G., Smith R.A., Choat B., O’Grady A.P. &Tissue D.T. (2014) Elevated CO2 does not ameliorate the negative effects ofelevated temperature on drought-induced mortality in Eucalyptus radiataseedlings. Plant, Cell & Environment 37, 1598–1613.
DuursmaR.A., Payton P., BangeM.P., Broughton K.J., Smith R.A., Medlyn B.E.& Tissue D.T. (2013) Near-optimal response of instantaneous transpiration ef-ficiency to vapour pressure deficit, temperature and CO2 in cotton (Gossypiumhirsutum L.) Agricultural and Forest Meteorology 168, 168–176.
DuursmaR.A., Barton C.V.M., LinY.-S.,MedlynB.E., EamusD., TissueD.T.,…McMurtrie R.E. (2014) The peaked response of transpiration rate to vapourpressure deficit in field conditions can be explained by the temperature opti-mum of photosynthesis. Agricultural and Forest Meteorology 189, 2–10.
Farquhar G.D. (1978) Feedforward responses of stomata to humidity.AustralianJournal of Plant Physiology 5, 787–800.
Franks P.J., Cowan I.R. & Farquhar G.D. (1997) The apparent feedforwardresponse of stomata to air vapour pressure deficit: Information revealed bydifferent experimental procedures with two rainforest trees. Plant, Cell &Environment 20, 142–145.
Gotsch S.G., Nadkarni N., Darby A., Glunk A., Dix M., Davidson K. & DawsonT.E. (2015) Life in the treetops: ecophysiological strategies of canopy epiphytesin a tropical montane cloud forest. Ecological Monographs 85, 393–412.
Gregory J.M., Mitchell J.F.B. & Brady A.J. (1997) Summer drought in northernmidlatitudes in a time-dependent CO2 climate experiment. Journal of Climate10, 662–686.
Hardwick S.R., Toumi R., PfeiferM., Turner E.C., Nilus R. & Ewers R.M. (2015)The relationship between leaf area index and microclimate in tropical forestand oil palm plantation: Forest disturbance drives changes in microclimate.Agricultural and Forest Meteorology 201, 187–195.
Harte J. & Shaw R. (1995) Shifting dominance within a montane vegetationcommunity - Results of a climate-warming experiment. Science 267, 876–880.
Herbst M., Rosier P.T.W., Morecroft M.D. & Gowing D.J. (2008) Comparativemeasurements of transpiration and canopy conductance in two mixed decidu-ous woodlands differing in structure and species composition. Tree Physiology28, 959–970.
Hoffmann W.A., Marchin R.M., Abit P.P. & Lau O.L. (2011) Hydraulic failureand tree dieback are associated with high wood density in a temperate forestunder extreme drought.Global Change Biology 17, 2731–2742.
IPCC (2014) Summary for policymakers. InClimate Change 2014: Impacts, Adapta-tion, and Vulnerability. Contribution of Working Group II to the Fifth AssessmentReport of the Intergovernmental Panel on Climate Change (eds Field CB B.V.,Dokken D.J., Mach K.J., Mastrandrea M.D., Bilir T.E., Chatterjee M., et al.),pp. 1–32.CambridgeUniversity Press, Cambridge,UKandNewYork,NY,USA.
Jackson R.B., Sperry J.S. & Dawson T.E. (2000) Root water uptake andtransport: using physiological processes in global predictions. Trends in PlantScience 5, 482–488.
Juice S.M., Templer P.H., Phillips N.G., Ellison A.M.& Pelini S.L. (2016) Ecosys-temwarming increases sap flow rates of northern red oak trees.Ecosphere 7(3),e01221.
Jung M., Reichstein M., Ciais P., Seneviratne S.I., Sheffield J., Goulden M.L., …Zhang K. (2010) Recent decline in the global land evapotranspiration trenddue to limited moisture supply. Nature 467, 951–954.
Kellomaki S. & Wang K.Y. (1998) Sap flow in Scots pines growing underconditions of year-round carbon dioxide enrichment and temperatureelevation. Plant, Cell & Environment 21, 969–981.
Kennedy A.D. (1995) Simulated climate change: are passive greenhouses a validmicrocosm for testing the biological effects of environmental perturbations?Global Change Biology 1, 29–42.
Kloeppel B.D., Abrams M.D. & Kubiske M.E. (1993) Seasonal ecophysiologyand leaf morphology of four successional Pennsylvania barrens species in openversus understory environments. Canadian Journal of Forest Research-RevueCanadienne De Recherche Forestiere 23, 181–189.
Kudoyarova G., Veselova S., Hartung W., Farhutdinov R., Veselov D. &Sharipova G. (2011) Involvement of root ABA and hydraulic conductivity inthe control of water relations in wheat plants exposed to increased evaporativedemand. Planta 233, 87–94.
KutschW.L., HerbstM., VanselowR., Hummelshoj P., Jensen N.O. &Kappen L.(2001) Stomatal acclimation influences water and carbon fluxes of a beechcanopy in northern Germany. Basic and Applied Ecology 2, 265–281.
LangeO.L., LoschR., Schulze E.D.&Kappen L. (1971) Responses of stomata tochanges in humidity. Planta 100, 76–86.
Lu Z.M., Quinones M.A. & Zeiger E. (2000) Temperature dependence of guardcell respiration and stomatal conductance co-segregate in an F2 population ofPima cotton. Australian Journal of Plant Physiology 27, 457–462.
Lynch I.P. (2006) The Duke Forest at 75: A Resource for All Seasons. Office ofthe Duke Forest.
Macfarlane C., White D.A. & Adams M.A. (2004) The apparent feed-forwardresponse to vapour pressure deficit of stomata in droughted, field-grownEucalyptus globulus Labill. Plant, Cell & Environment 27, 1268–1280.
Maenpaa M., Riikonen J., Kontunen-Soppela S., Rousi M. & Oksanen E. (2011)Vertical profiles reveal impact of ozone and temperature on carbon assimila-tion of Betula pendula and Populus tremula. Tree Physiology 31, 808–818.
Mahan J.R. & Upchurch D.R. (1988) Maintenance of constant leaf temperatureby plants. I. Hypothesis-limited homeothermy. Environmental and Experimen-tal Botany 28, 351–357.
Maherali H., Moura C.F., Caldeira M.C., Willson C.J. & Jackson R.B. (2006)Functional coordination between leaf gas exchange and vulnerability to xylemcavitation in temperate forest trees. Plant, Cell and Environment 29, 571–583.
Manabe S. &Wetherald R.T. (1987) Large-scale changes of soil wetness inducedby an increase in atmospheric carbon dioxide. Journal of the Atmospheric Sci-ences 44, 1211–1235.
Manabe S., Milly P.C.D. & Wetherald R. (2004) Simulated long-term changes inriver discharge and soil moisture due to global warming.Hydrological SciencesJournal-Journal Des Sciences Hydrologiques 49, 625–642.
Marchin R., Zeng H.N. & Hoffmann W. (2010) Drought-deciduous behaviorreduces nutrient losses from temperate deciduous trees under severe drought.Oecologia 163, 845–854.
Marshall D.C. (1958) Measurement of sap flow in conifers by heat transport.Plant Physiology 33, 385–396.
McAdam S.A.M. & Brodribb T.J. (2015) Hormonal dynamics contributes todivergence in seasonal stomatal behaviour in a monsoonal plant community.Plant, Cell & Environment 38, 423–432.
McAdam S.A.M., Brodribb T.J., Ross J.J. & JordanG.J. (2011) Augmentation ofabscisic acid (ABA) levels by drought does not induce short-term stomatalsensitivity to CO2 in two divergent conifer species. Journal of ExperimentalBotany 62, 195–203.
McAdam S.A.M., Sussmilch F.C. & Brodribb T.J. (2016) Stomatal responses tovapour pressure deficit are regulated by high speed gene expression inangiosperms. Plant, Cell & Environment 39, 485–491.
McDowell N., PockmanW.T., Allen C.D., Breshears D.D., Cobb N., Kolb T.,…Yepez E.A. (2008)Mechanisms of plant survival and mortality during drought:why do some plants survive while others succumb to drought?New Phytologist178, 719–739.
Meinzer F.C., Johnson D.M., Lachenbruch B., McCulloh K.A. &Woodruff D.R.(2009) Xylem hydraulic safety margins in woody plants: coordination of stoma-tal control of xylem tension with hydraulic capacitance. Functional Ecology 23,922–930.
Meinzer F.C.,Woodruff D.R., EissenstatD.M., LinH.S.,Adams T.S. &McCullohK.A. (2013) Above- and belowground controls on water use by trees of differ-ent wood types in an easternUSdeciduous forest.Tree Physiology 33, 345–356.
Milly P.C.D., Wetherald R.T., Dunne K.A. & Delworth T.L. (2002) Increasingrisk of great floods in a changing climate. Nature 415, 514–517.
Mittelheuser C.J. & Van Steveninck R.F.M. (1969) Stomatal closure and inhibi-tion of transpiration induced by (RS)-abscisic acid. Nature 221, 281–282.
Monteith J.L. (1995) A reinterpretation of stomatal responses to humidity. Plant,Cell & Environment 18, 357–364.
Mott K.A. & Parkhurst D.F. (1991) Stomatal responses to humidity in air andhelox. Plant, Cell & Environment 14, 509–515.
NDMC, USDA & NOAA (2012) United States Drought Monitor.Nejad A.R. & van Meeteren U. (2008) Dynamics of adaptation of stomatal be-
haviour to moderate or high relative air humidity in Tradescantia virginiana.Journal of Experimental Botany 59, 289–301.
12 R. M. Marchin et al.
© 2016 John Wiley & Sons Ltd, Plant, Cell and Environment
Nobel P. (1974) Introduction to biophysical plant physiology. WH Freeman &Company, San Francisco, CA.
Ocheltree T.W., Nippert J.B. & Prasad P.V.V. (2014) Stomatal responses tochanges in vapor pressure deficit reflect tissue-specific differences in hydraulicconductance. Plant, Cell & Environment 37, 132–139.
Oren R. & Pataki D.E. (2001) Transpiration in response to variation in microcli-mate and soil moisture in southeastern deciduous forests. Oecologia 127,549–559.
Oren R., Phillips N., Ewers B.E., Pataki D.E. & Megonigal J.P. (1999a)Sap-flux-scaled transpiration responses to light, vapor pressure deficit, andleaf area reduction in a flooded Taxodium distichum forest. Tree Physiology19, 337–347.
Oren R., Sperry J.S., Katul G.G., Pataki D.E., Ewers B.E., Phillips N. & SchaferK.V.R. (1999b) Survey and synthesis of intra- and interspecific variation instomatal sensitivity to vapour pressure deficit. Plant, Cell & Environment 22,1515–1526.
Pataki D.E.&OrenR. (2003) Species differences in stomatal control of water lossat the canopy scale in a mature bottomland deciduous forest. Advances inWater Resources 26, 1267–1278.
Pataki D.E., Oren R. & Smith W.K. (2000) Sap flux of co-occurring species in awestern subalpine forest during seasonal soil drought. Ecology 81, 2557–2566.
Peak D. & Mott K.A. (2011) A new, vapour-phase mechanism for stomatal re-sponses to humidity and temperature. Plant, Cell & Environment 34, 162–178.
Pelini S.L., Bowles F.P., Ellison A.M., Gotelli N.J., Sanders N.J. & Dunn R.R.(2011) Heating up the forest: open-top chamber warming manipulation ofarthropod communities at Harvard and Duke Forests. Methods in Ecologyand Evolution 2, 534–540.
Pettijohn J.C., Salvucci G.D., Phillips N.G. & Daley M.J. (2009) Mechanisms ofmoisture stress in a mid-latitude temperate forest: Implications for feedforwardand feedback controls from an irrigation experiment. Ecological Modelling220, 968–978.
Pfautsch S. & Adams M.A. (2013) Water flux of Eucalyptus regnans: defyingsummer drought and a record heatwave in 2009. Oecologia 172, 317–326.
Pons T.L. &WelschenR.A.M. (2003)Midday depression of net photosynthesis inthe tropical rainforest tree Eperua grandiflora: contributions of stomatal andinternal conductances, respiration and Rubisco functioning. Tree Physiology23, 937–947.
R Core Team (2014) R: A language and environment for statistical computing. RFoundation for Statistical Computing, Vienna, Austria.
Roberts J., Cabral O.M.R. & Deaguiar L.F. (1990) Stomatal and boundary-layerconductances in an Amazonian terra-firme rain forest. Journal of AppliedEcology 27, 336–353.
RoddyA.B. &Dawson T.E. (2012) Determining the water dynamics of floweringusing miniature sap flow sensors. Acta Horticulturae 951, 47–53.
Sadras V.O., Montoro A., Moran M.A. & Aphalo P.J. (2012) Elevated tempera-ture altered the reaction norms of stomatal conductance in field-growngrapevine. Agricultural and Forest Meteorology 165, 35–42.
Sendall K.M., Reich P.B., Zhao C.M., Hou J.H., Wei X.R., Stefanski A., …Montgomery R.A. (2015) Acclimation of photosynthetic temperature optimaof temperate and boreal tree species in response to experimental forestwarming.Global Change Biology 21, 1342–1357.
Sermons S.M., Seversike T.M., Sinclair T.R., Fiscus E.L. & Rufty T.W. (2012)Temperature influences the ability of tall fescue to control transpiration inresponse to atmospheric vapour pressure deficit. Functional Plant Biology 39,979–986.
Shope J.C., Peak D. & Mott K.A. (2008) Stomatal responses to humidity inisolated epidermes. Plant, Cell & Environment 31, 1290–1298.
Skelton R.P., West A.G., Dawson T.E. & Leonard J.M. (2013) External heat-pulse method allows comparative sapflow measurements in diverse functionaltypes in a Mediterranean-type shrubland in South Africa. Functional PlantBiology 40, 1076–1087.
Tardieu F. & Simonneau T. (1998) Variability among species of stomatal controlunder fluctuating soil water status and evaporative demand: modellingisohydric and anisohydric behaviours. Journal of Experimental Botany 49,419–432.
Trenberth K.E., Fasullo J. & Smith L. (2005) Trends and variability in column-integrated atmospheric water vapor. Climate Dynamics 24, 741–758.
Van Herk I.G., Gower S.T., Bronson D.R. & Tanner M.S. (2011) Effects ofclimatewarming on canopywater dynamics of a boreal black spruce plantation.Canadian Journal of Forest Research-Revue Canadienne De RechercheForestiere 41, 217–227.
Wang K.Y. & Kellomaki S. (1997) Stomatal conductance and transpiration inshoots of Scots pine after 4-year exposure to elevated CO2 and temperature.Canadian Journal of Botany-Revue Canadienne De Botanique 75, 552–561.
Warton D.I., Wright I.J., Falster D.S. & Westoby M. (2006) Bivariate line-fittingmethods for allometry. Biological Reviews 81, 259–291.
Way D.A., Domec J.-C. & Jackson R.B. (2012) Elevated growth temperaturesalter hydraulic characteristics in trembling aspen (Populus tremuloides)seedlings: implications for tree drought tolerance. Plant, Cell & Environment36, 103–115.
Whitley R., Zeppel M., Armstrong N., Macinnis-Ng C., Yunusa I. & Eamus D.(2008) A modified Jarvis-Stewart model for predicting stand-scale transpira-tion of an Australian native forest. Plant and Soil 305, 35–47.
Wieser G., Grams T.E.E., Matyssek R., Oberhuber W. & Gruber A. (2015) Soilwarming increased whole-tree water use of Pinus cembra at the treeline inthe Central Tyrolean Alps. Tree Physiology 35, 279–288.
Wigley T.M.L. & Jones P.D. (1985) Influences of precipitation changes and directCO2 effects on streamflow. Nature 314, 149–152.
Will R.E.,Wilson S.M., Zou C.B. &Hennessey T.C. (2013) Increased vapor pres-sure deficit due to higher temperature leads to greater transpiration and fastermortality during drought for tree seedlings common to the forest-grasslandecotone. New Phytologist 200, 366–374.
Zavaleta E.S., Thomas B.D., Chiariello N.R., Asner G.P., Shaw M.R. & Field C.B. (2003) Plants reverse warming effect on ecosystem water balance. Proceed-ings of the National Academy of Sciences of the United States of America 100,9892–9893.
Zeng Z., Piao S., Lin X., Yin G., Peng S., Ciais P. & Myneni R.B. (2012) Globalevapotranspiration over the past three decades: estimation based on the waterbalance equation combined with empirical models. Environmental ResearchLetters 7, 8.
Zhang K., Kimball J.S., Nemani R.R. & Running S.W. (2010) A continuoussatellite-derived global record of land surface evapotranspiration from 1983to 2006. Water Resources Research 46, 21.
Received 9 March 2016; received in revised form 28 June 2016; acceptedfor publication 1 July 2016
SUPPORTING INFORMATION
Additional Supporting Information may be found in the onlineversion of this article at the publisher’s web-site:
Table S1 Summary of anatomical and physiological traits fortree seedlings used in this study. Stem diameter was directlymeasured, while sapwood area and leaf area were estimatedusing species-specific allometric equations (Table S2). Themultiplier B was estimated from sap flux calibration curvesboundary layer conductance (gb) was estimated via mass lossof water from filter paper leaf replicas. Mean summer (June-August) air T and VPD are given for all chambers, and cham-ber treatments relative to controls are in parenthesesTable S2 Species-specific allometric equations used to estimatesapwood area (AS, mm2) and leaf area (AL, m
2) of tree seed-lings for calculation of transpiration and canopy conductance.Predictor variables are stem diameter (x, mm), leaf number(L), and stemheight (H, cm). Equations were determined fromnon-experimental plants at the study site (AS: n=11–17 perspecies; AL: n=15–29 per species).Table S3 Stomatal responses of seedlings were quantified usingthe function shown in Fig. 6: gs=�m ∙ lnDL+ gsref, where gs ismidday stomatal conductance (mmolm�2 s�1), m is in mmolm�2 s�1 ln(kPa)�1, DL is vapor pressure deficit at the leaf sur-face (kPa), and gsref is estimated stomatal conductance at 1 kPa(mmolm�2 s�1). Mean summer (June-August) air T and VPDare given for all chambers, and chamber treatments relative tocontrols are in parentheses. Significant relationships are indi-cated with stars: * p< 0.05, ** p< 0.001, *** p< 0.001.Figure S1 Mean midday (a) air temperature, (b) soil tempera-ture, (c) relative humidity, (d) vapor pressure deficit, (e) rela-tive extractable soil water content, and (f) photosyntheticallyactive radiation inside the 12 experimental chambers in DukeForest, NC in July 2010. Control chambers are shown as black
Stomatal acclimation increases transpiration 13
© 2016 John Wiley & Sons Ltd, Plant, Cell and Environment
circles; heated chambers are shown as gray circles. Significanteffects of warming on environmental variables (p< 0.05) aredepicted with lines. In panel (a), air T is compared to the targetT of each chamber. In panel (d), the line depicts the effect of Ton the saturated vapor pressure of air, using themeanT in con-trol chambers as the reference T.Figure S2Differences in B were related to stem sapwood areain (a)Acer rubrum, (b)Carya tomentosa, (c)Quercus alba, and(d) Quercus rubra. The B coefficient incorporates the thermalproperties of stem anatomy (e.g. bark thickness, sapwood area,volumetric stem water content). Sampled stems ranged in di-ameter from 1.5–7mm.Figure S3 Comparison of stomatal conductance measured atthe leaf-level with a porometer and estimated via whole-plantsap flux for (a) Acer rubrum, (b) Carya tomentosa, and (c)Quercus spp. Porometer measurements (n=2 leaves per plant)were made on 14 June, 21 July, 29 August, and 24 September
2010, and sap flux measurements are hourly means of data col-lected every 10minutes. The dotted line represents the 1:1 rela-tionship. Relationships were analyzed using standardizedmajor axis (SMA) regression, because neither variable can befunctionally assigned as dependent.Figure S4 Maximum midday leaf T observed in summer 2010for all study seedlings. Chamber T was positively correlatedto maximum leaf T for all species (Ar: r2 = 0.69, p=0.017; Ct:r2 = 0.88, p< 0.001; Qu: r2 = 0.83, p< 0.001), although onlyone curve is plotted for ease of visualization.Figure S5 Effect of warming on midday stomatal conductance(n=2 leaves) of (a) Acer rubrum, (b) Carya tomentosa, and(c) Quercus spp. Temperature did not significantly affect sto-matal conductance in Acer (r2 = 0.001, p=0.837) or Carya(r2 = 0.01, p=0.511). Stomatal conductance was measured witha porometer on 14 June, 21 July, and 29 August 2010.
14 R. M. Marchin et al.
© 2016 John Wiley & Sons Ltd, Plant, Cell and Environment


![Evolution of the Stomatal Regulation of Plant Water ...Update on Stomatal Evolution Evolution of the Stomatal Regulation of Plant Water Content[OPEN] Timothy J. Brodribb* and Scott](https://img.pdfslide.us/doc/110x75/5e87e202c27a1d71d24f112b/evolution-of-the-stomatal-regulation-of-plant-water-update-on-stomatal-evolution.jpg)
![Stomatal Defense a Decade Later1[OPEN] - Plant Physiology · Update on Stomatal Defense Stomatal Defense a Decade Later1[OPEN] Maeli Melotto*, Li Zhang, Paula R. Oblessuc, and Sheng](https://img.pdfslide.us/doc/110x75/5eddc0a3ad6a402d6668efaa/stomatal-defense-a-decade-later1open-plant-update-on-stomatal-defense-stomatal.jpg)