Embed Size (px)
Citation preview
Stock Market Seminar
Nik Ihsan Raja Abdullah, MSTA, CFTe President, Malaysian Association of Technical Analysts (MATA)
Chartist, Retail Research, Maybank Investment Bank Berhad
Full Members of United Kingdom Society of Technical Analysts (UK STA)
Colleagues, International Federation of Technical Analysts (IFTA)

The Securities Commission established under the Securities
Commission Act 1993 (“Commission”) reserve all proprietary rights
to the contents of this Presentation. No part of this Presentation
may be used or reproduced in any form without the
Commission’s prior written permission.
This Presentation is provided for information purposes only.
Neither the Commission nor the Presenter make any warranty,
express or implied, nor assume any legal liability or responsibility
for the accuracy, completeness or currency of the contents of
this Presentation.
It is your responsibility to verify any information before using or
relying on it.

The Speaker
Nik Ihsan Raja Abdullah
President of Malaysian Association of
Technical Analyst (MATA)
• Chartist for Research and License Investment
Advisor, Maybank Investment Bank Behad
• Certified Technical Analyst and been recognized
by United Kingdom Society of Technical Analysts
(UK STA) and International Federation of
Technical Analysts (IFTA)
• Lecturer for MSTA Diploma Program under
collaboration between PRIBUMI-MATA and UK STA.
• Former Institutional Sales Dealer with BIMB
Securities
• Former Investment & Technical Analyst for UOB
Kay Hian

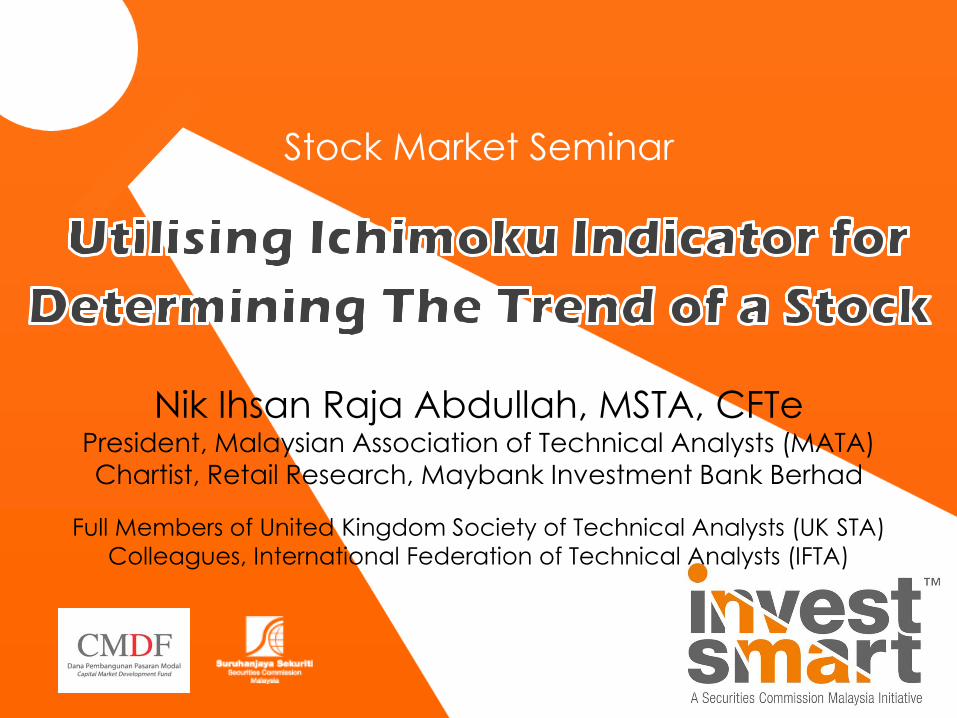
The Definition of Trends
TREND

TREND IDENTIFICATION
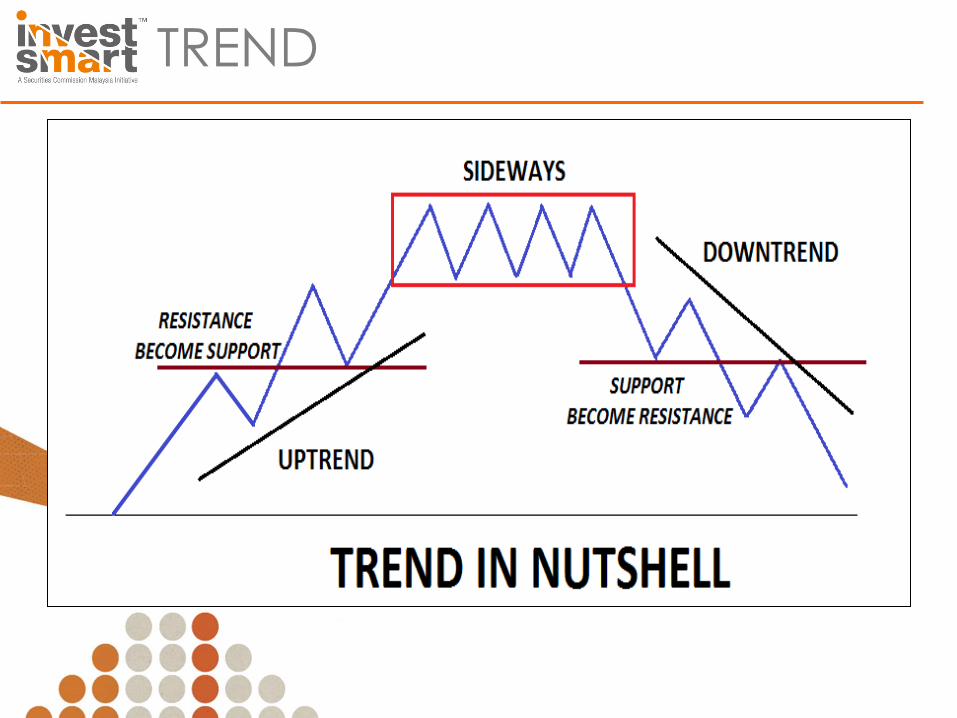
ACTUAL TREND
• How trend develop?
• How trend can shifted from bullish to bearish?
• Sign of weakness / strength
MARKET STRUCTURES

TREND DEVELOPMENT
H
HH
HH
LH
LH
L HL
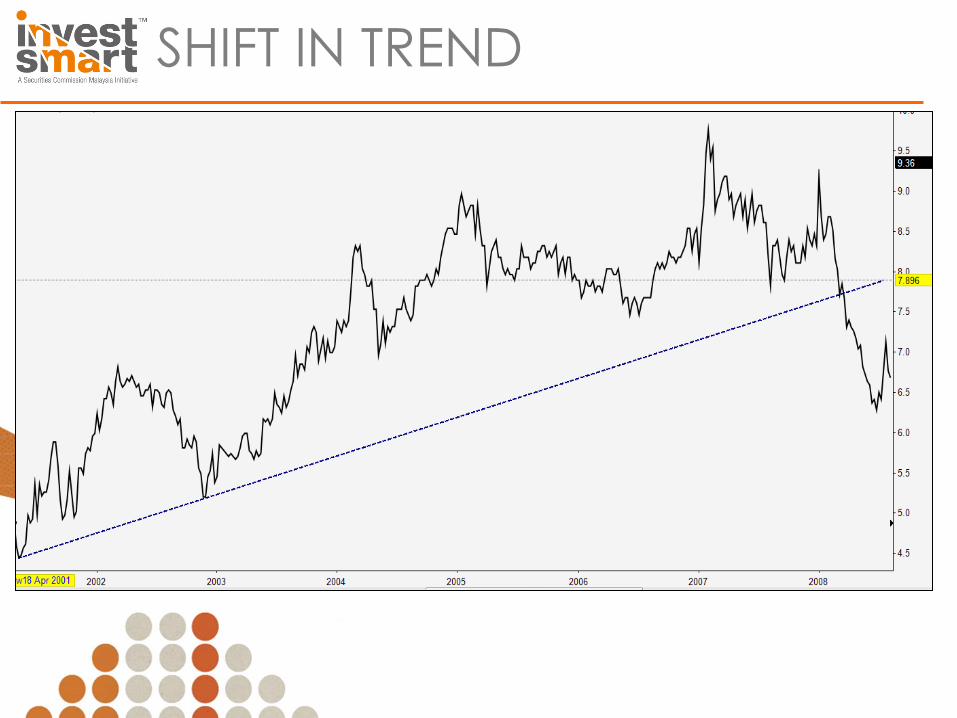
SHIFT IN TREND
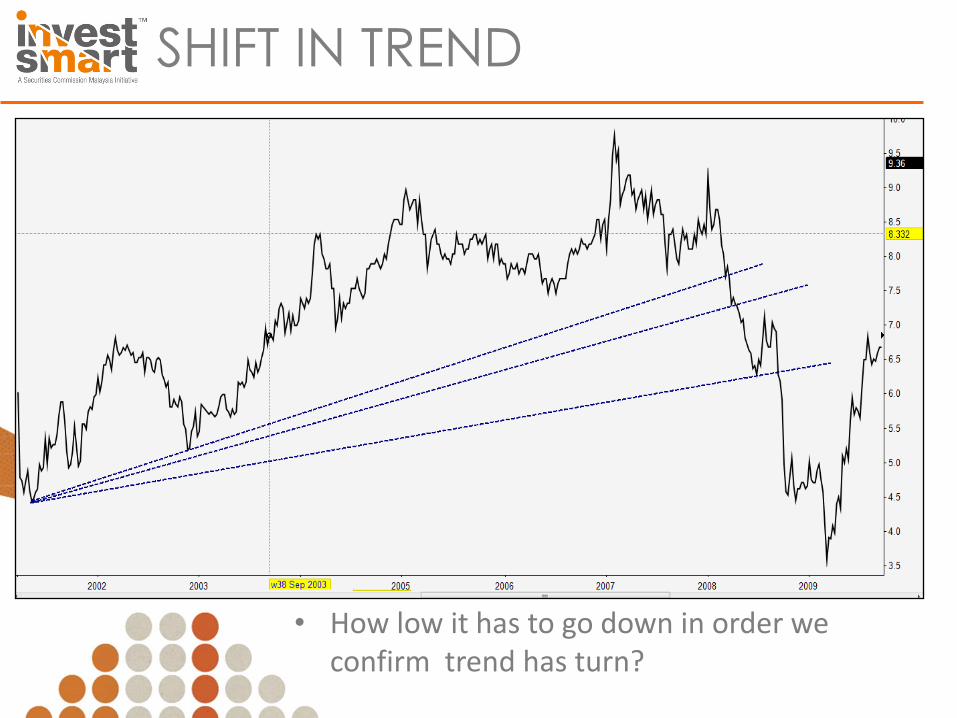
• How low it has to go down in order we confirm trend has turn?
SHIFT IN TREND
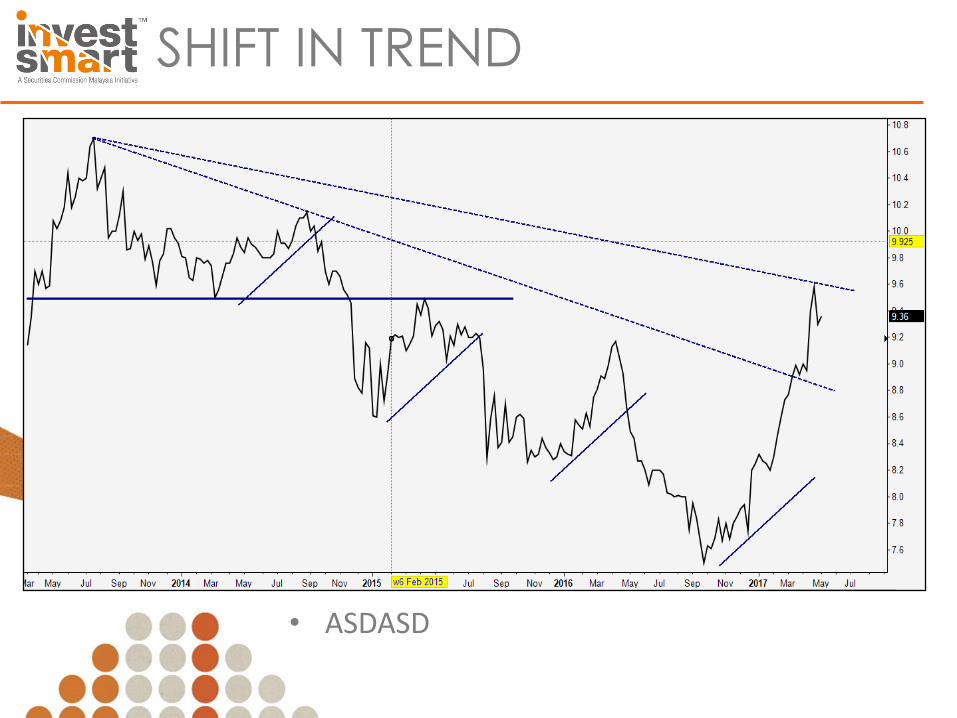
• ASDASD
SHIFT IN TREND

ICHIMOKU KINKO HYO
The Ichimoku Cloud, also known as Ichimoku Kinko Hyo, is a versatile indicator that defines support and resistance, identifies trend direction, gauges momentum and provides trading signals. Ichimoku Kinko Hyo translates into “one look equilibrium chart”. With one look, chartists can identify the trend and look for potential signals within that trend. The indicator was developed by Goichi Hosoda, a journalist, and published in his 1969 book. Even though the Ichimoku Cloud may seem complicated when viewed on the price chart, it is really a straight forward indicator that is very usable.
(Sources: stockcharts.com)
INTRODUCTION
• Tenkan-sen (Conversion Line)
• Kijun-sen (Base Line)
• Senkou Span A (Leading Span A)
• Senkou Span B (Leading Span B)
• Chikou Span (Lagging Span)
ICHIMOKU COMPONENTS
ICHIMOKU CHART
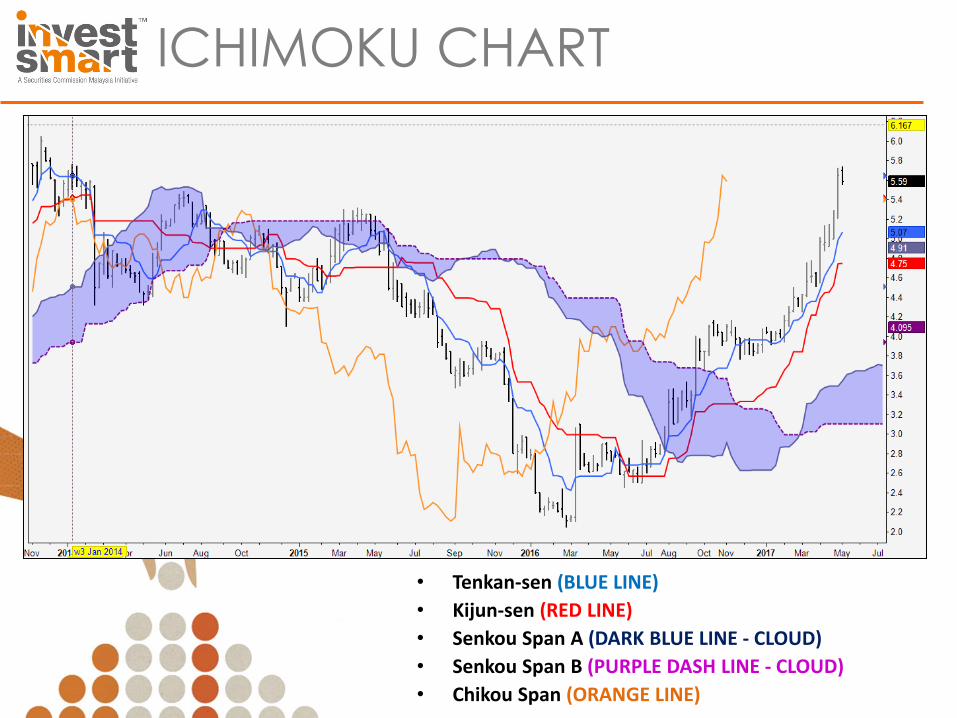
• Tenkan-sen (BLUE LINE)
• Kijun-sen (RED LINE)
• Senkou Span A (DARK BLUE LINE - CLOUD)
• Senkou Span B (PURPLE DASH LINE - CLOUD)
• Chikou Span (ORANGE LINE)
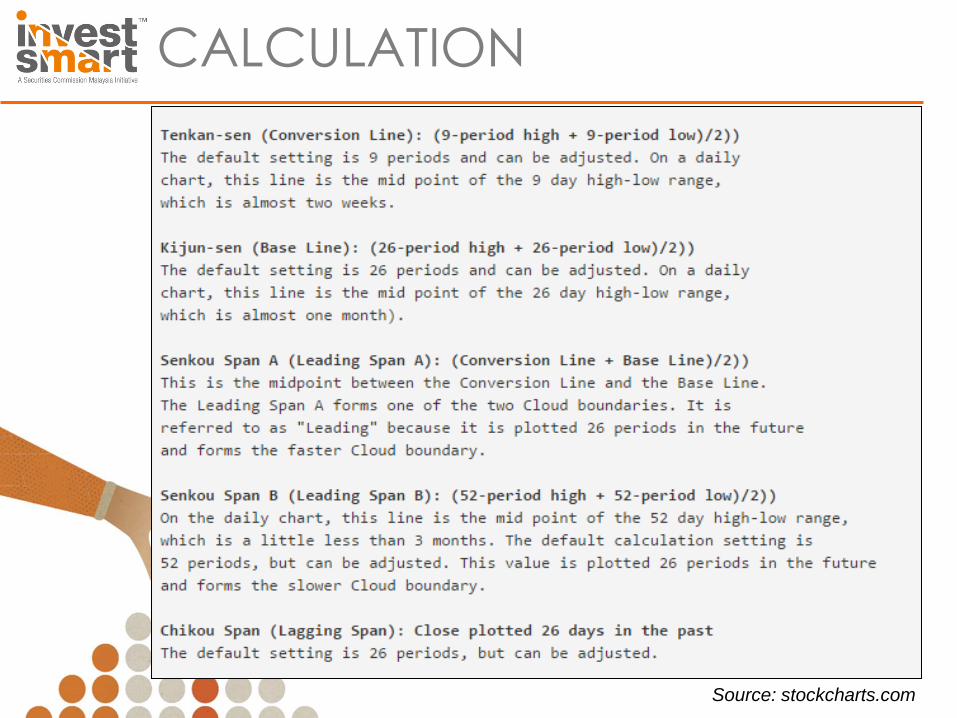
CALCULATION
Source: stockcharts.com
The trend is UP when prices are above the Cloud, DOWN when prices are below the Cloud and
FLAT when prices are in the Cloud.
THE INTERPRETATION
• Trend Confirmation
• Trend Strength or Weakness
• Support and Resistance
• Crossover Signals
THE USAGE
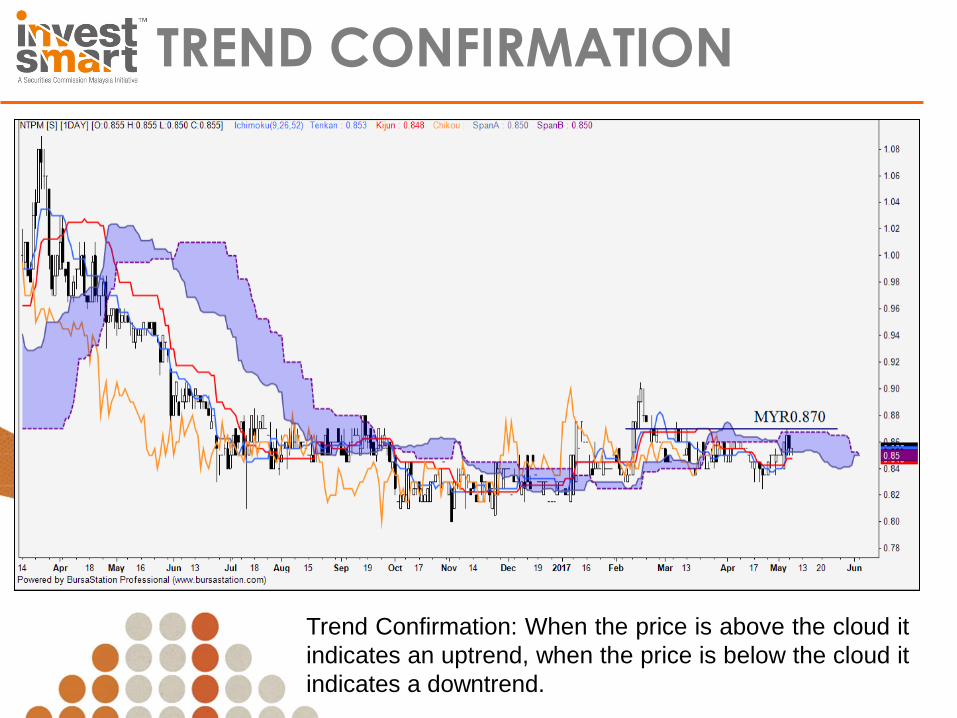
TREND CONFIRMATION
Trend Confirmation: When the price is above the cloud it
indicates an uptrend, when the price is below the cloud it
indicates a downtrend.
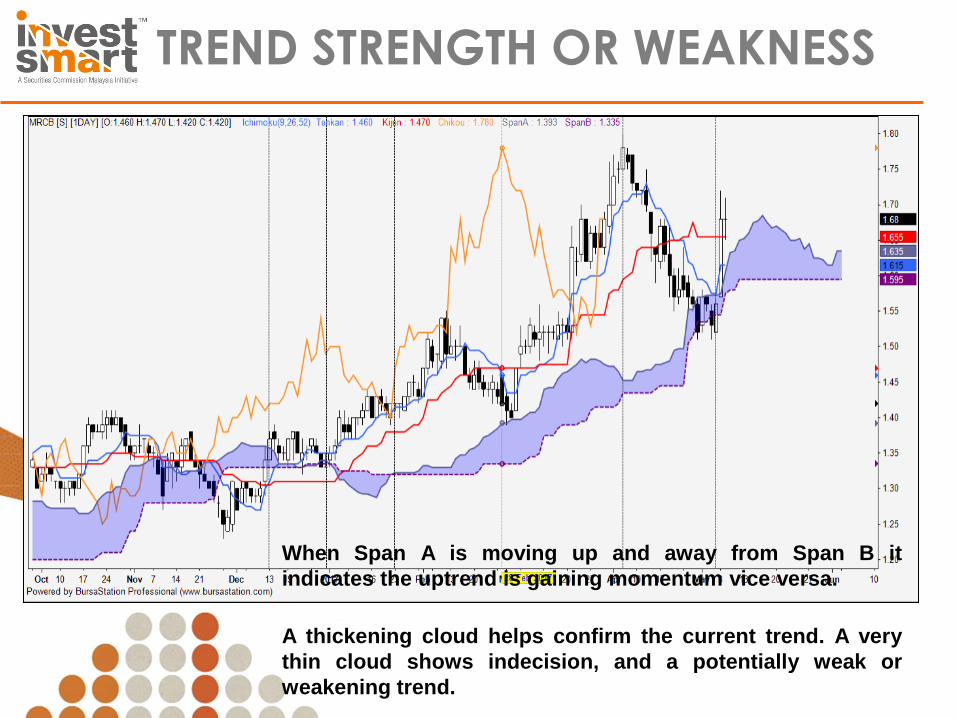
TREND STRENGTH OR WEAKNESS
When Span A is moving up and away from Span B it
indicates the uptrend is gaining momentum vice versa.
A thickening cloud helps confirm the current trend. A very
thin cloud shows indecision, and a potentially weak or
weakening trend.
• The cloud is projected out 26 price bars to the right of the current price, providing an idea of where support and resistance may develop in the future.
• During an uptrend, the price will often bounce off the cloud during pullbacks and then resume the uptrend.
• During a downtrend, the price will often retrace to the cloud and then continue lower. Therefore, the cloud presents entry opportunities into the trend.
SUPPORT AND RESISTANCE
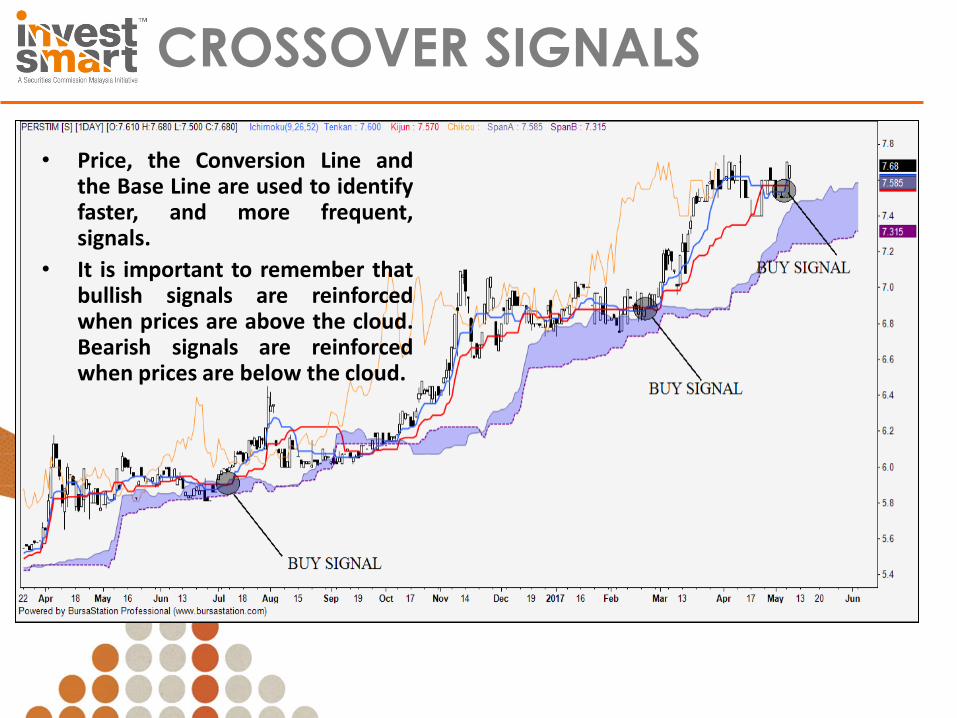
• Price, the Conversion Line and the Base Line are used to identify faster, and more frequent, signals.
• It is important to remember that bullish signals are reinforced when prices are above the cloud. Bearish signals are reinforced when prices are below the cloud.
CROSSOVER SIGNALS
• Thicker the cloud – The stronger trend would be
• Cloud as confirmation
• Cloud as FUTURES SUPPORT & RESISTANCE
• Tenkan & Kijun as REENTRY METHOD within the bigger trend
REMEMBER!
Bullish Signals:
• Price moves above Cloud (trend)
• Cloud turns from red to green (ebb-flow within trend)
• Price Moves above the Base Line (momentum)
• Conversion Line moves above Base Line (momentum)
SIGNAL SUMMARY (BULL)
Bearish Signals:
• Price moves below Cloud (trend)
• Cloud turns from green to red (ebb-flow within trend)
• Price Moves below Base Line (momentum)
• Conversion Line moves below Base Line (momentum)
SIGNAL SUMMARY (BEAR)
• May generate false signal particularly when trend start to shift. COUNTER – Add indicators e.g DMI, Money Flow Index etc.
• The cloud is also just essentially a pair of moving altered moving averages, which may or not provide support during an uptrend, or resistance in a downtrend.
• All calculations are also based on historical data, which means trade signals may appear late or at inopportune times, because historical short-term tendencies (which the indicator captures) may not repeat in the future.
LIMITATION
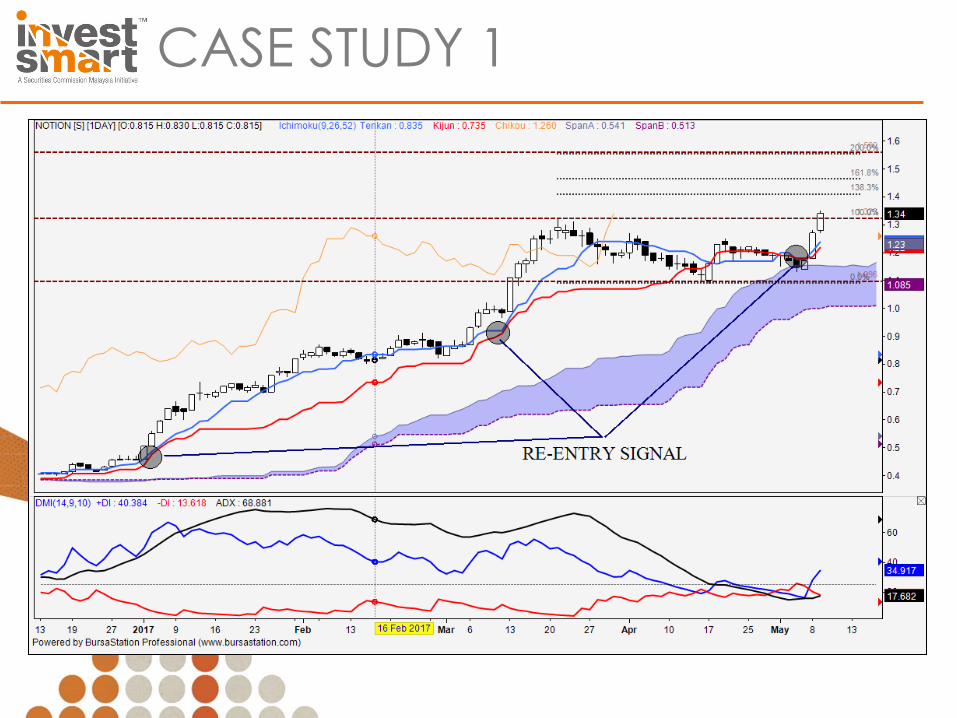
CASE STUDY 1
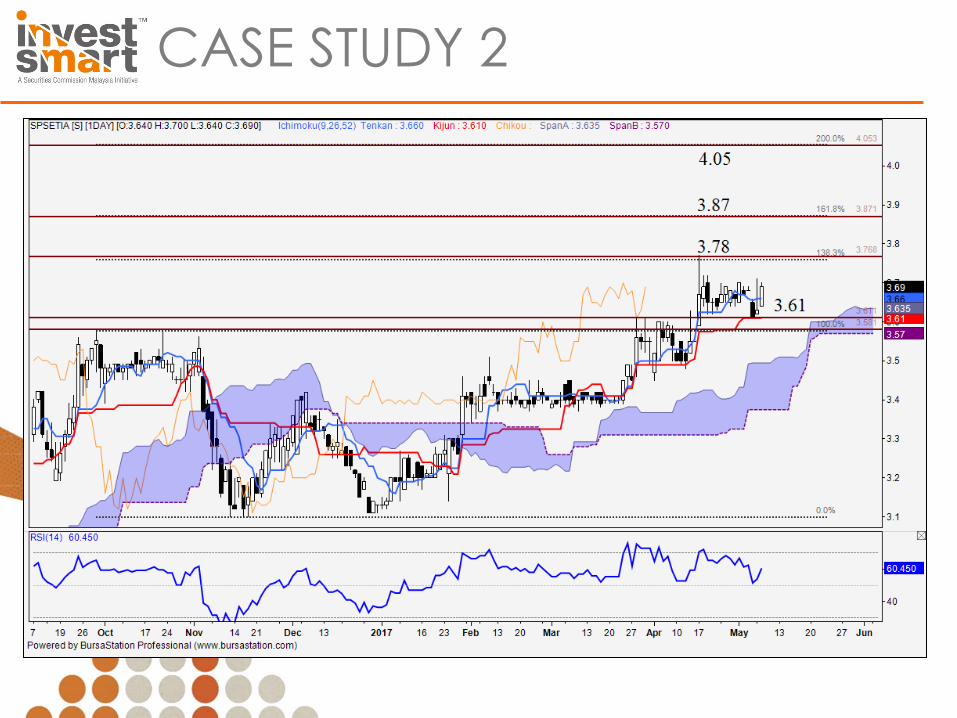
CASE STUDY 2
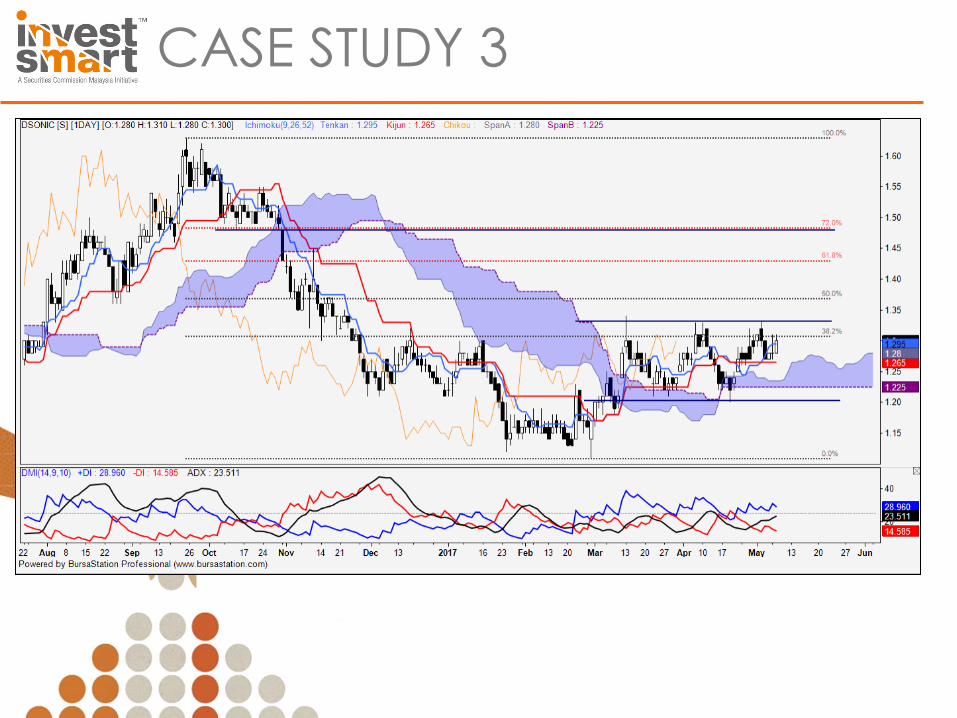
CASE STUDY 3

CONCLUSION
The Ichimoku Cloud is a useful indicator, especially for new traders who want some help with gauging trend direction, momentum, spotting trend reversals and finding entry points. Traders will still need to control risk with a stop loss and also find a way to profitably exit trades. With all its lines, the Ichimoku Cloud can appear scary, but basically if the price is below the Cloud, the trend is down; look for short positions and avoid long positions. When the price is above the Cloud, the trend is up; look for long positions and avoid short positions.
CONCLUSION
CONTACT US
FACEBOOK / PAGES
• Personal Facebook - Nik Ihsan
• MATA Facebook – Malaysian
Association of Technical
Analysts (@malaysianchartist)
WEBSITE / OTHER MEDIA
• www.malaysianchartist.com
• Telegram Channel –
https://t.me/matatechchannel
• Email: