Embed Size (px)
Citation preview
Japanese Cloud Charts
Ichimoku Kinko HyoVéronique Lashinski, CMT
Newedge USA, LLC
23/3/2010 Japanese Clouds
Table of Contents
1. Construction of cloud charts
2. Cloud as support and resistance
3. A look back in time: Weekly, monthly
cloud charts
4. Comparison with Western techniques: A
few examples
5. Sideways markets
6. Building indexes from the cloud lines
1. Construction of cloud
charts
43/3/2010 Japanese Clouds
Preliminary remarks
• Method is based on a 6-day working week
• For commodity futures, consider using a 5-day working week. We
will give both the default settings and the periods for the change
to 5 days in the definitions that follow.
• As cloud charts use the extremes, charts can be different when
using all-sessions 24 hour markets, or just pit-hours
• A short-lived spike in a market will impact the cloud chart for
several weeks
53/3/2010 Japanese Clouds
Kijun Sen and Tenkan Sen
Definitions and defaults
• Tenkan Sen : (Highest high + lowest low) / 2, for the past 9 days.
(7 days for a 5-day working week)
• Kijun Sen : (Highest high + lowest low) / 2, for the past 26 days.
(22 days for a 5-day working week)
• This is the middle of the range, over respectively 1 ½ weeks and one
month
• Crossovers between the Tenkan Sen and the Kijun Sen can be used for
buy and sell signals, in a similar way as moving averages in Western
techniques
63/3/2010 Japanese Clouds
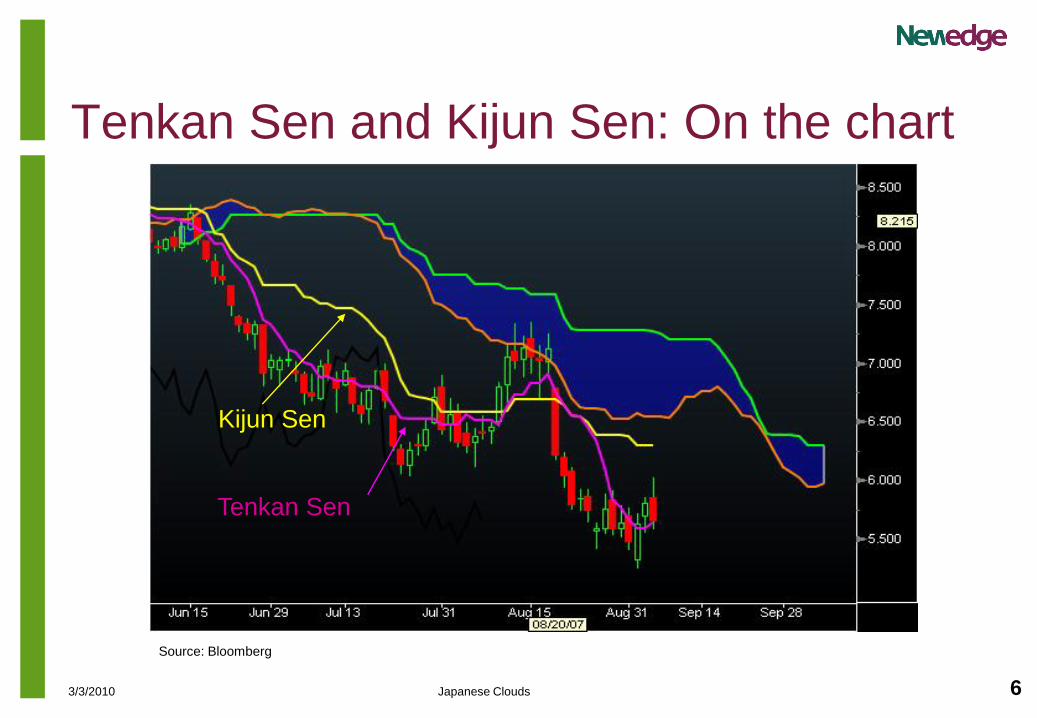
Tenkan Sen and Kijun Sen: On the chart
Kijun Sen
Tenkan Sen
Source: Bloomberg
73/3/2010 Japanese Clouds
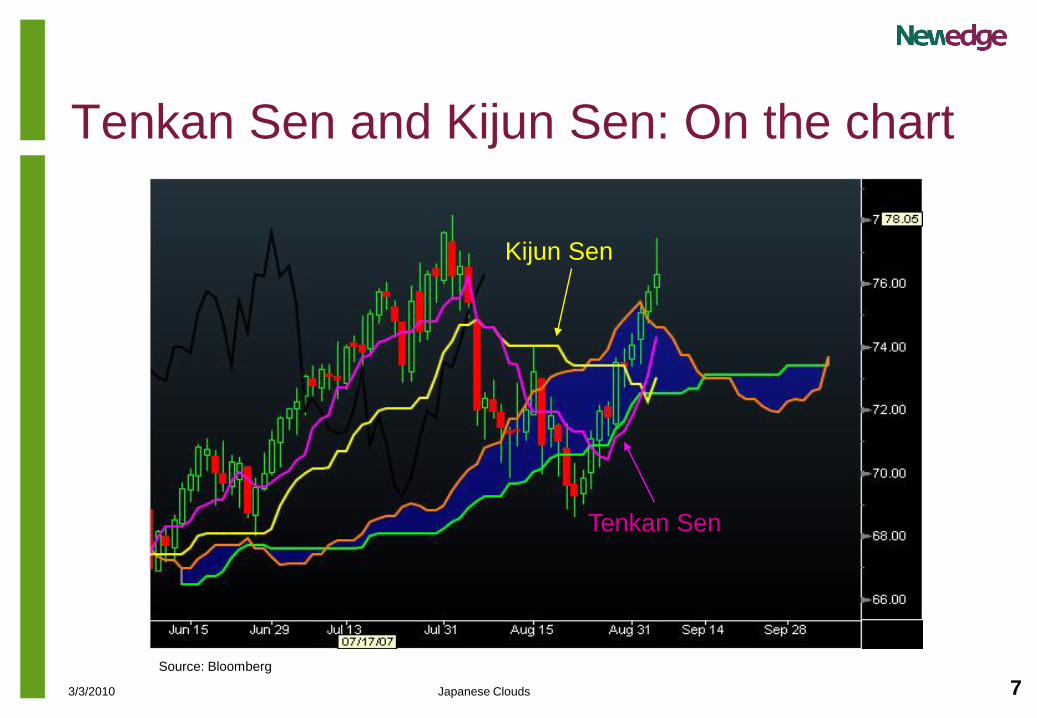
Tenkan Sen and Kijun Sen: On the chart
Kijun Sen
Tenkan Sen
Source: Bloomberg
83/3/2010 Japanese Clouds
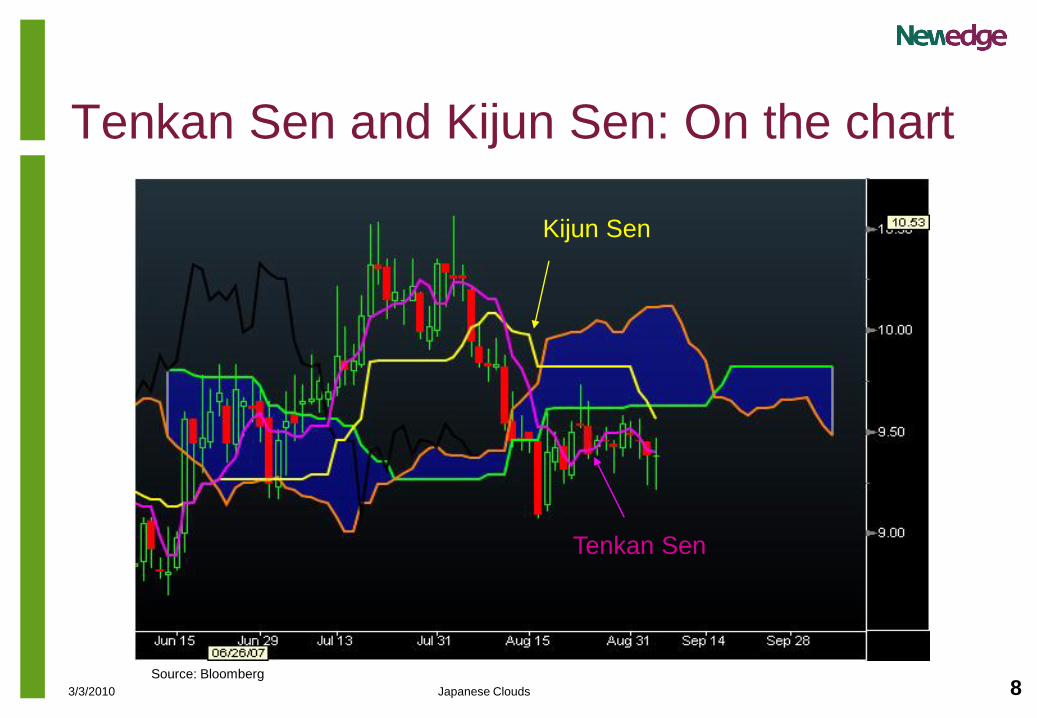
Tenkan Sen and Kijun Sen: On the chart
Kijun Sen
Tenkan Sen
Source: Bloomberg
93/3/2010 Japanese Clouds
Lagging Span (Chikou Span)
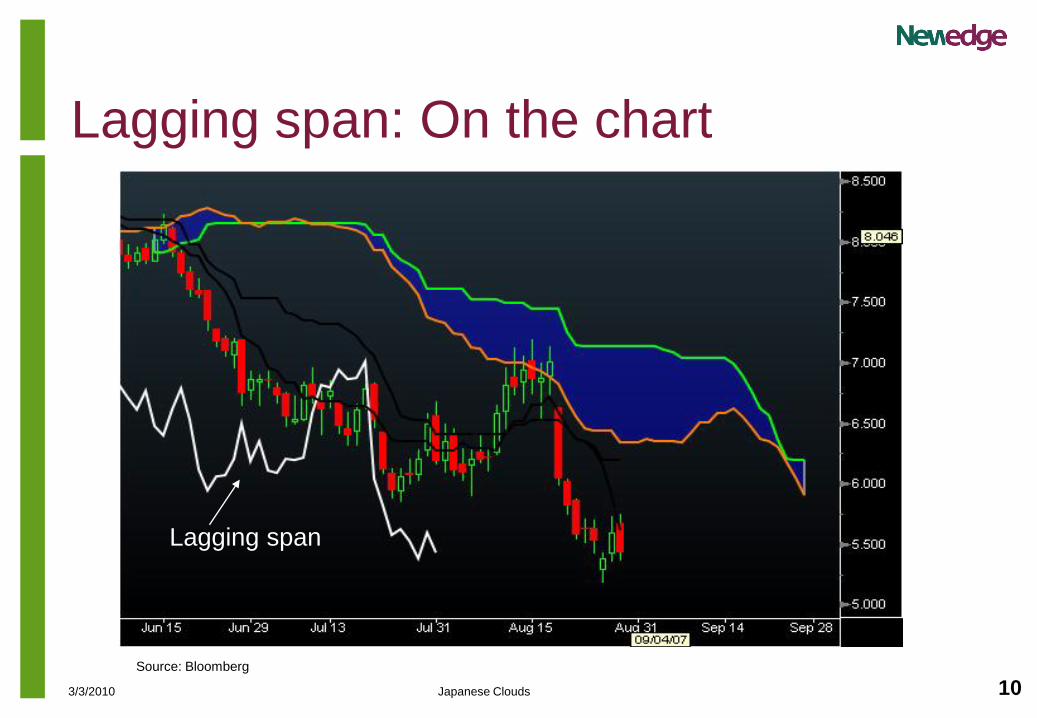
• Today’s close, plotted 26 days behind (22 days for a 5-day
working week)
• Compares current prices to levels a month ago
• Price levels 26 (22) days ago and the cloud are current
resistance / support
• The lagging span can be used as confirmation of signals derived
from the cloud and prices (more on this later)
103/3/2010 Japanese Clouds
Lagging span: On the chart
Lagging span
Source: Bloomberg
113/3/2010 Japanese Clouds
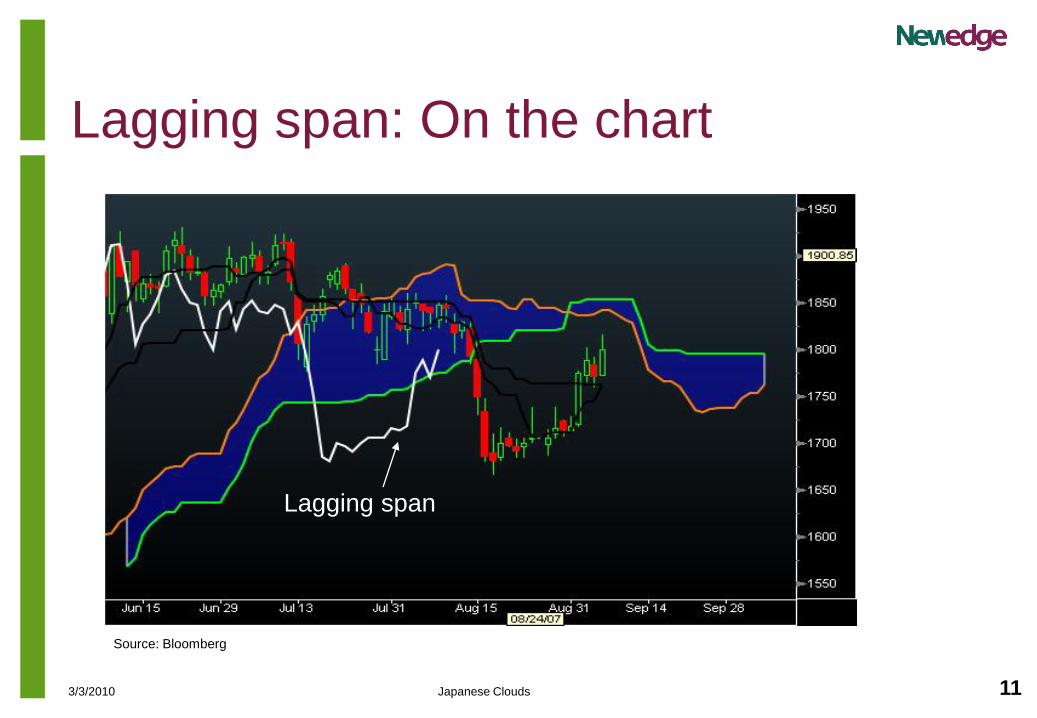
Lagging span: On the chart
Lagging span
Source: Bloomberg
123/3/2010 Japanese Clouds
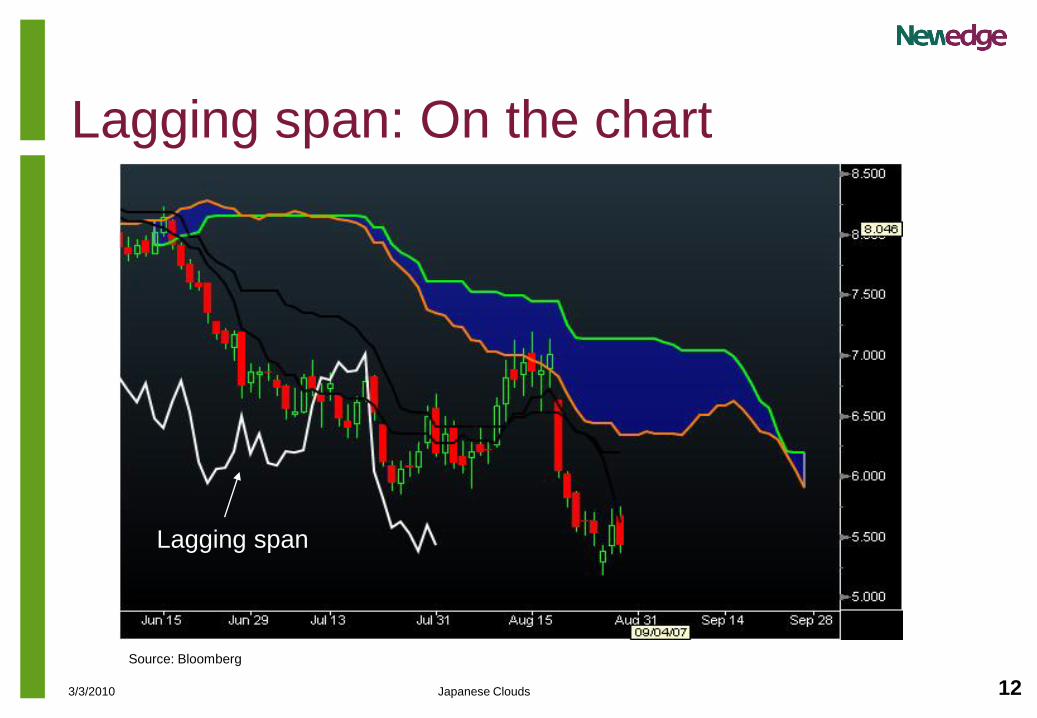
Lagging span: On the chart
Lagging span
Source: Bloomberg
133/3/2010 Japanese Clouds
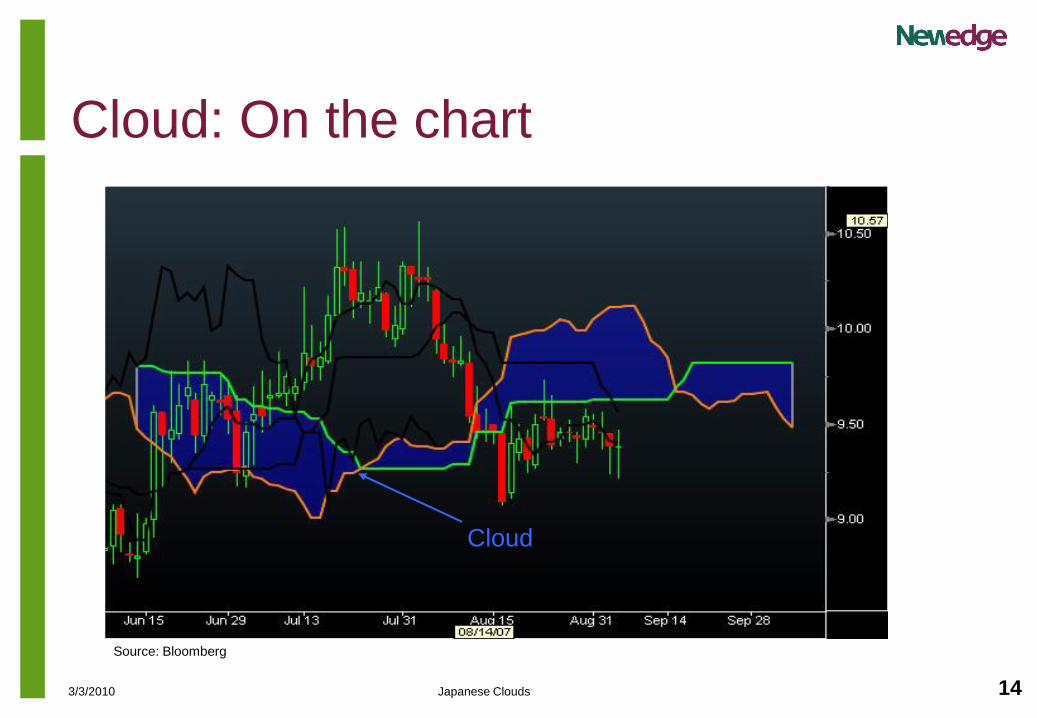
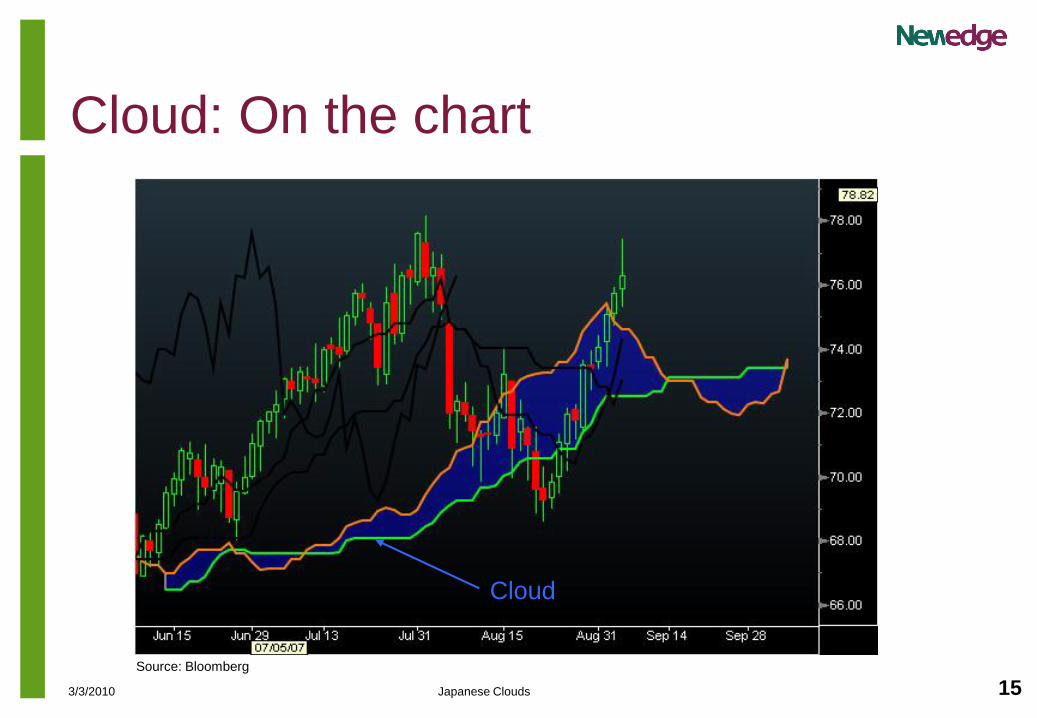
Cloud Lines
• Senkou Span A : (Tenkan Sen + Kijun Sen) / 2, plotted 26 days
ahead. (22 days for a 5-day working week). - Middle of the range of the past 26 days, but the last 9 days are counted with double weight.
• Senkou Span B : (Highest high + lowest low) / 2, for the past 52
days, plotted 26 days ahead. (44 days, plotted 22 days ahead for
a 5-day working week).- Again, note the importance of the middle of the range.
• The area between Senkou Span A and Senkou Span B is “the
cloud”, representing key support (if the cloud is below prices) or
resistance (if the cloud is above prices).
143/3/2010 Japanese Clouds
Cloud: On the chart
Cloud
Cloud
Source: Bloomberg
153/3/2010 Japanese Clouds
Cloud: On the chart
Source: Bloomberg
Cloud
2. Clouds as support
and resistance
173/3/2010 Japanese Clouds
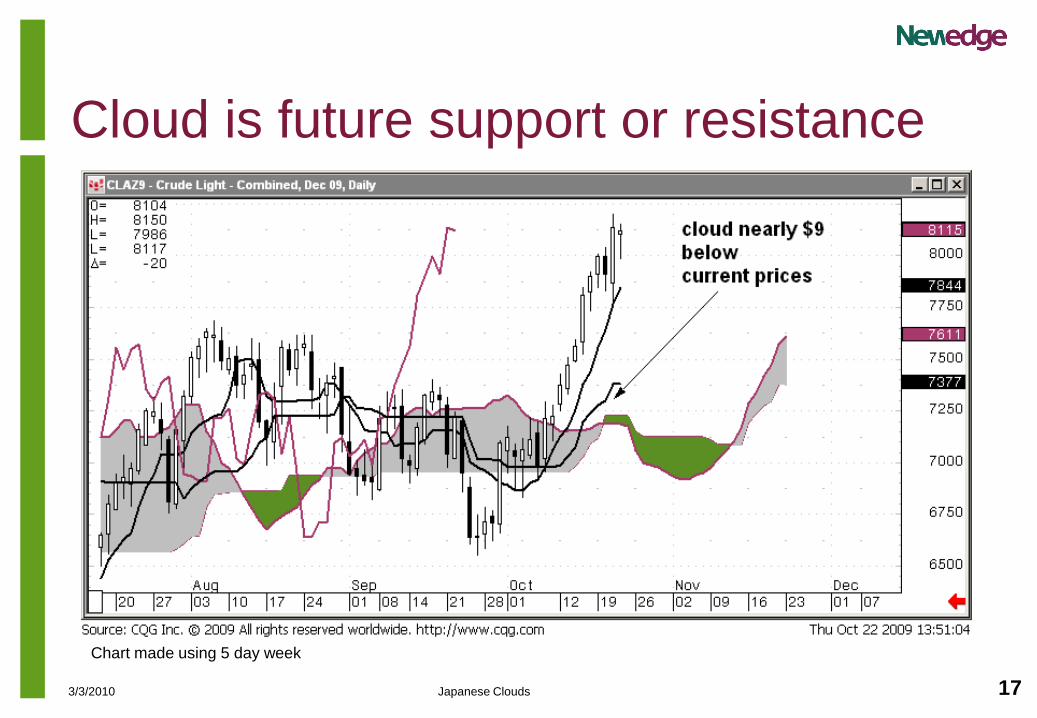
Cloud is future support or resistance
Chart made using 5 day week
183/3/2010 Japanese Clouds
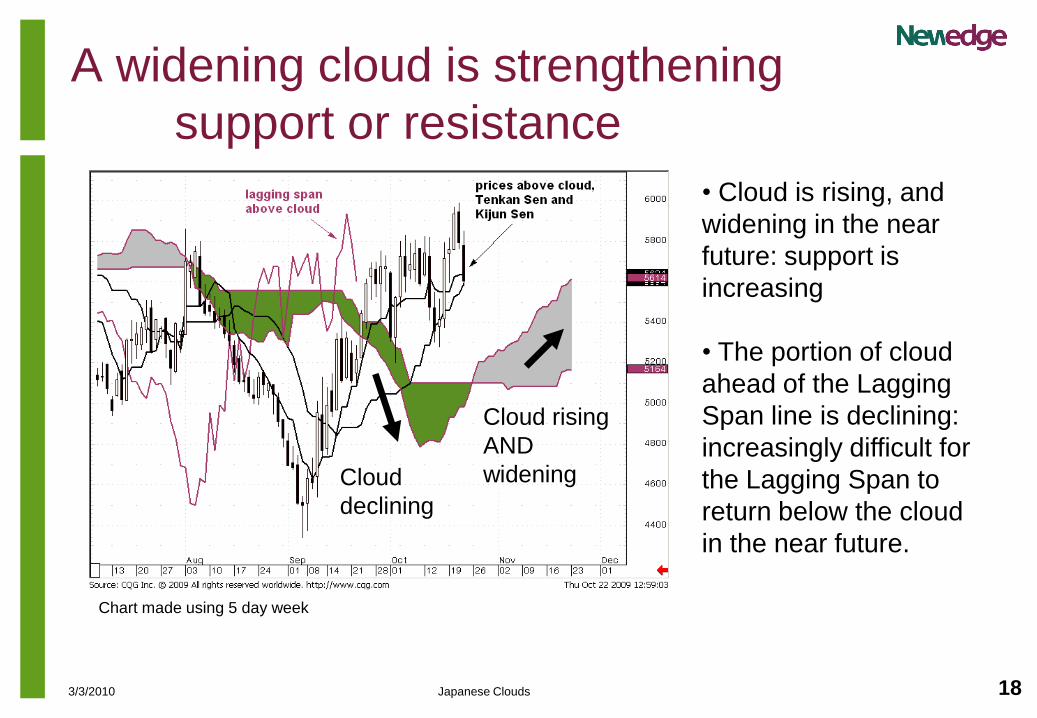
A widening cloud is strengthening
support or resistance
• Cloud is rising, and
widening in the near
future: support is
increasing
• The portion of cloud
ahead of the Lagging
Span line is declining:
increasingly difficult for
the Lagging Span to
return below the cloud
in the near future.
Cloud
declining
Cloud rising
AND
widening
Chart made using 5 day week
193/3/2010 Japanese Clouds
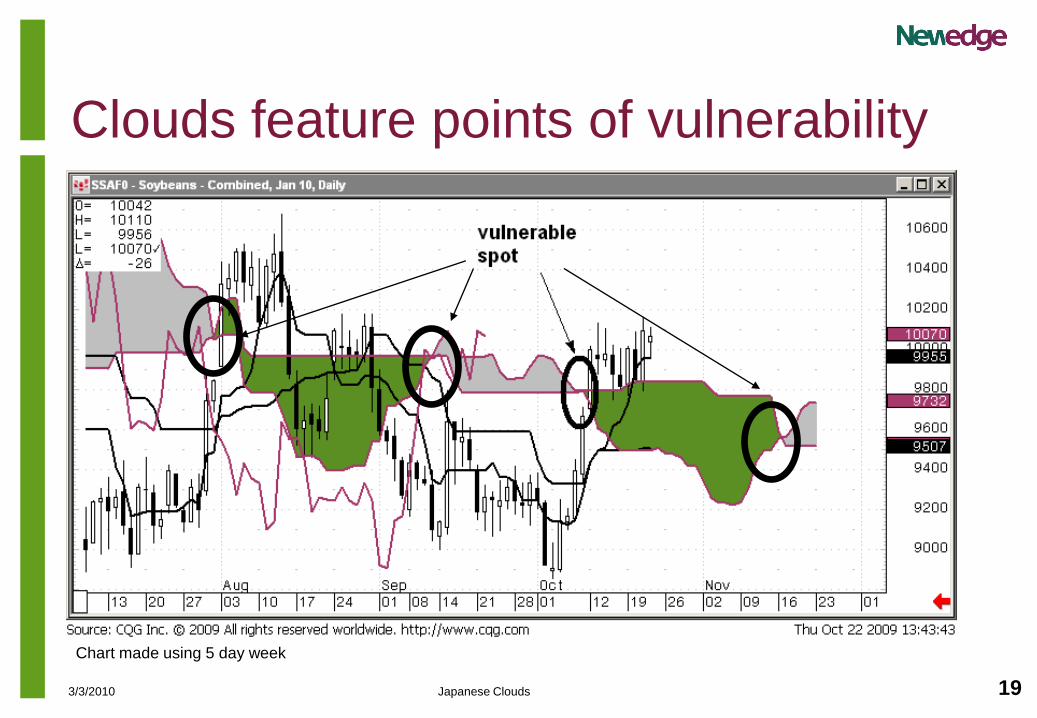
Clouds feature points of vulnerability
Chart made using 5 day week
203/3/2010 Japanese Clouds
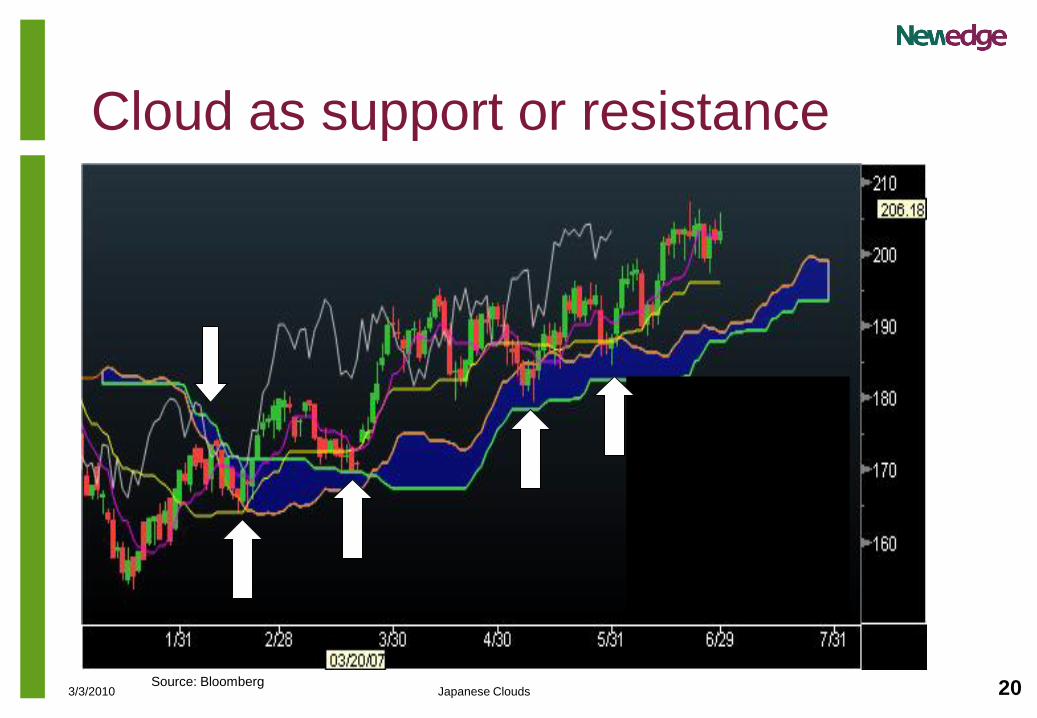
Cloud as support or resistance
Source: Bloomberg
213/3/2010 Japanese Clouds
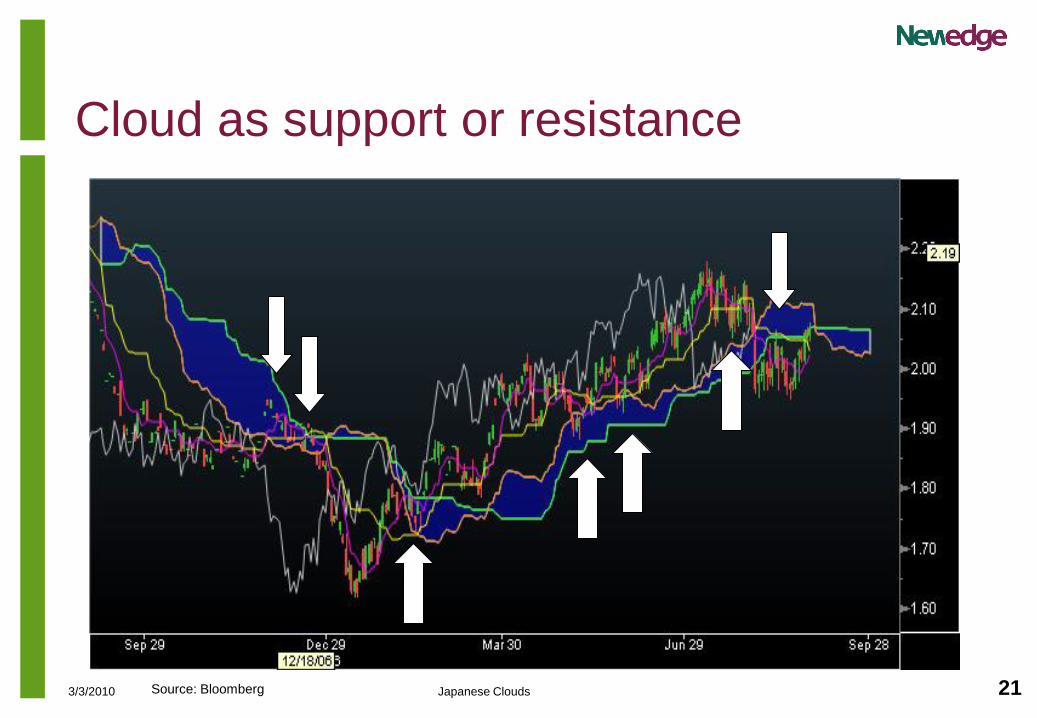
Cloud as support or resistance
Source: Bloomberg
223/3/2010 Japanese Clouds
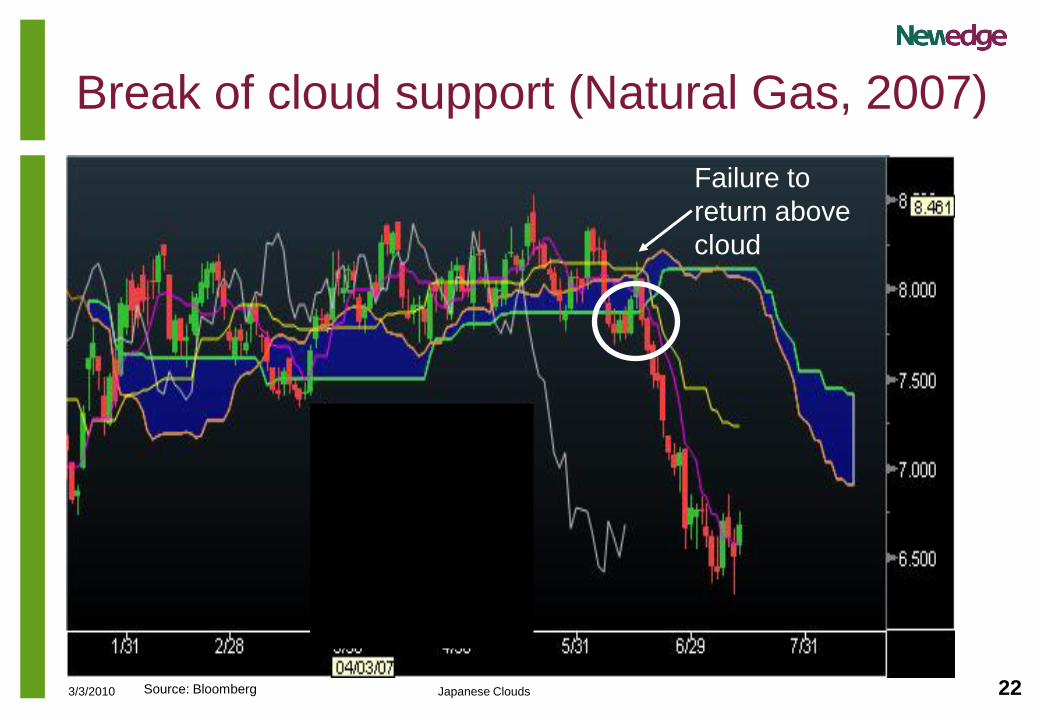
Break of cloud support (Natural Gas, 2007)
Failure to
return above
cloud
Failure to
return above
cloud
Source: Bloomberg
233/3/2010 Japanese Clouds
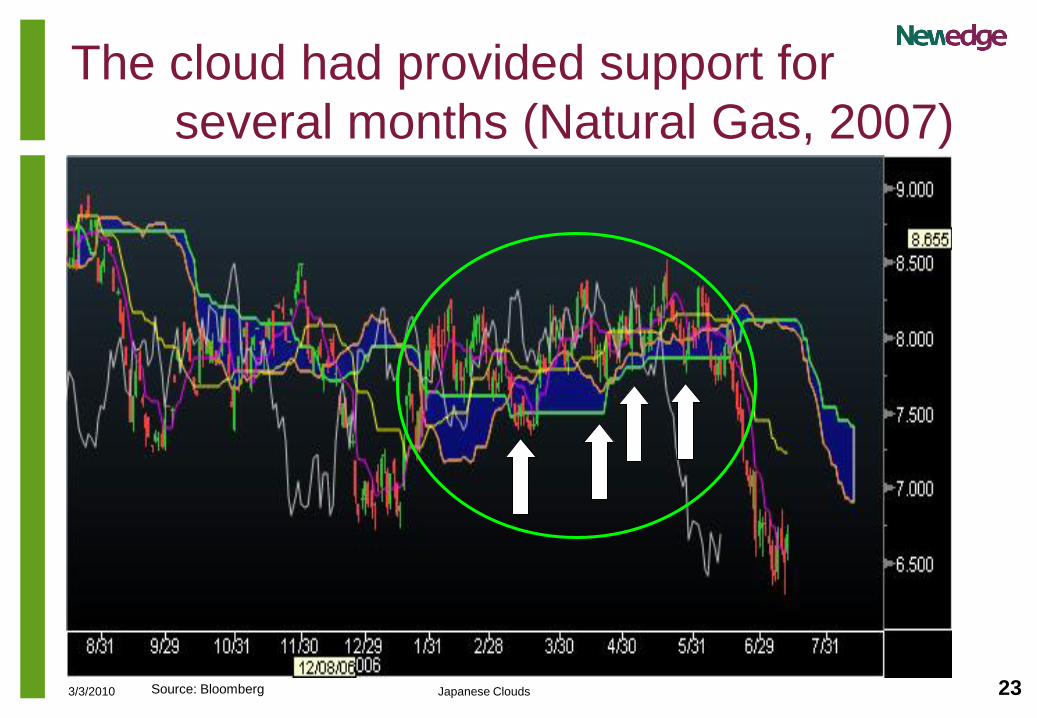
The cloud had provided support for
several months (Natural Gas, 2007)
Source: Bloomberg
3. A look back in time:
Weekly, monthly
cloud charts
253/3/2010 Japanese Clouds
End of 2006
/ early 2007
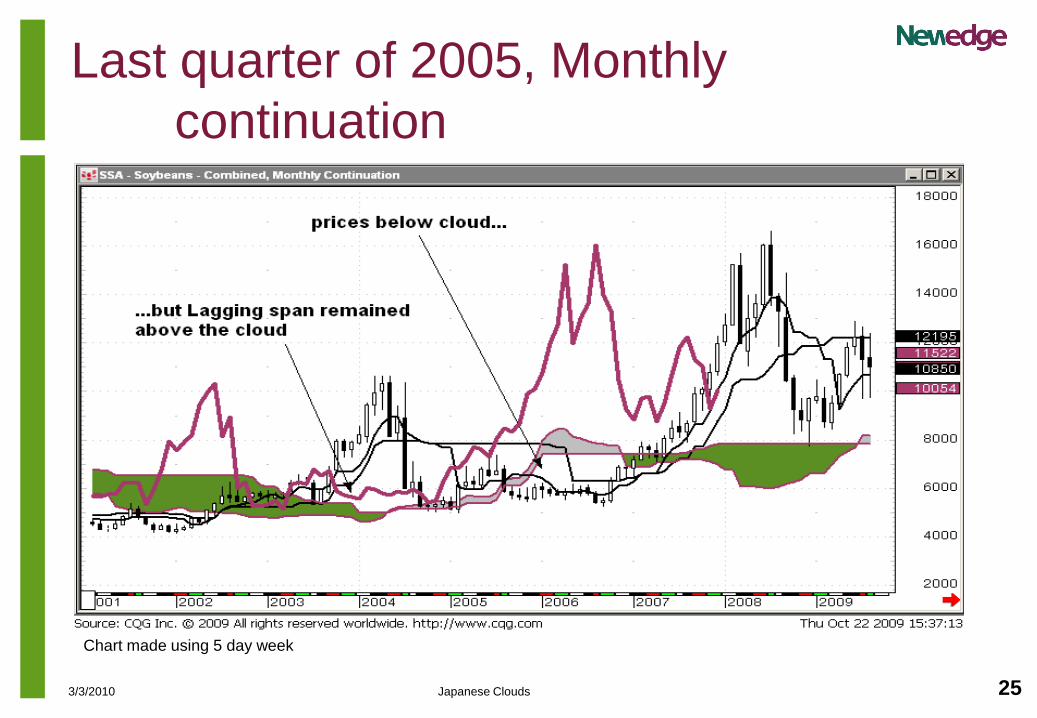
Last quarter of 2005, Monthly
continuation
Chart made using 5 day week
263/3/2010 Japanese Clouds
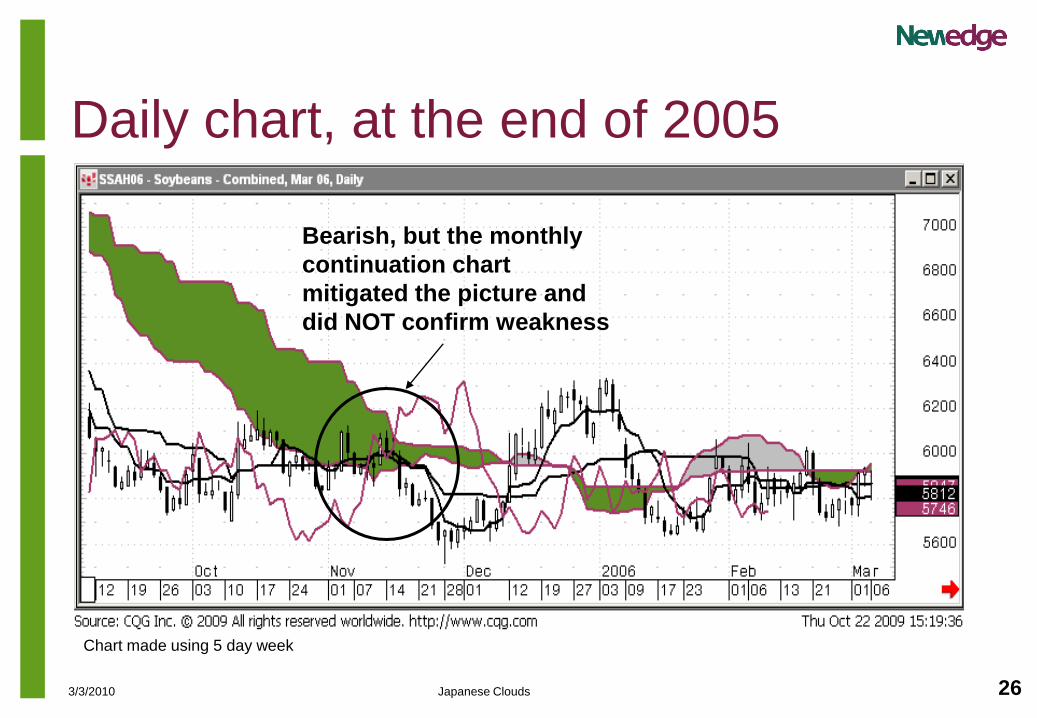
Daily chart, at the end of 2005
Bearish, but the monthly
continuation chart
mitigated the picture and
did NOT confirm weakness
Chart made using 5 day week
273/3/2010 Japanese Clouds
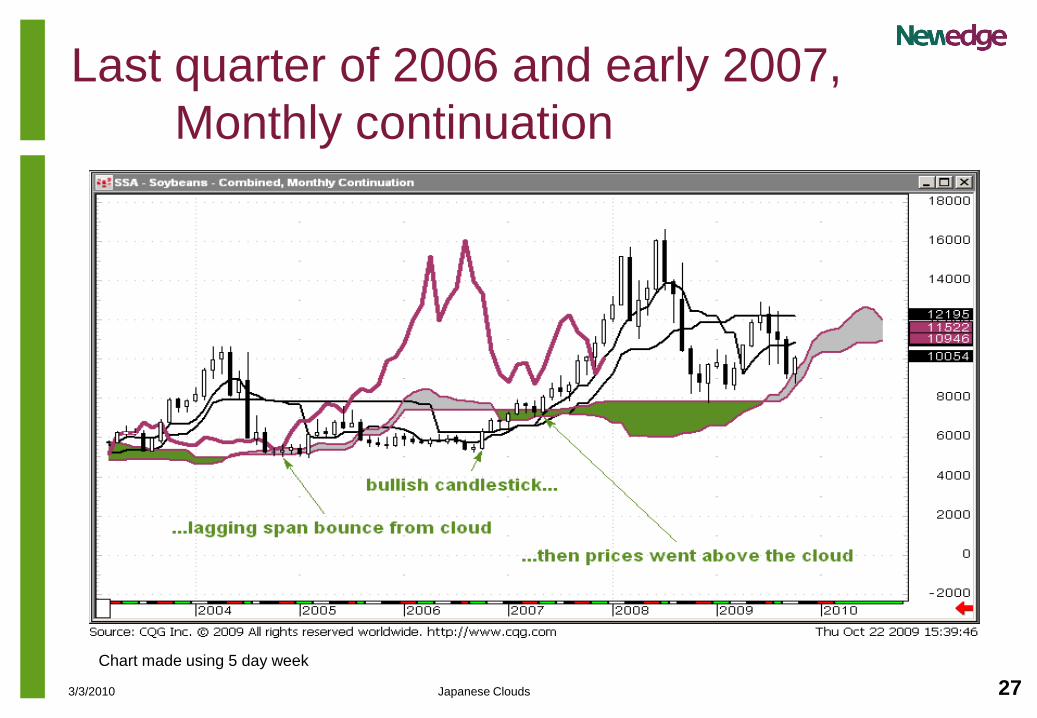
End of 2006
/ early 2007
Last quarter of 2006 and early 2007,
Monthly continuation
Chart made using 5 day week
283/3/2010 Japanese Clouds
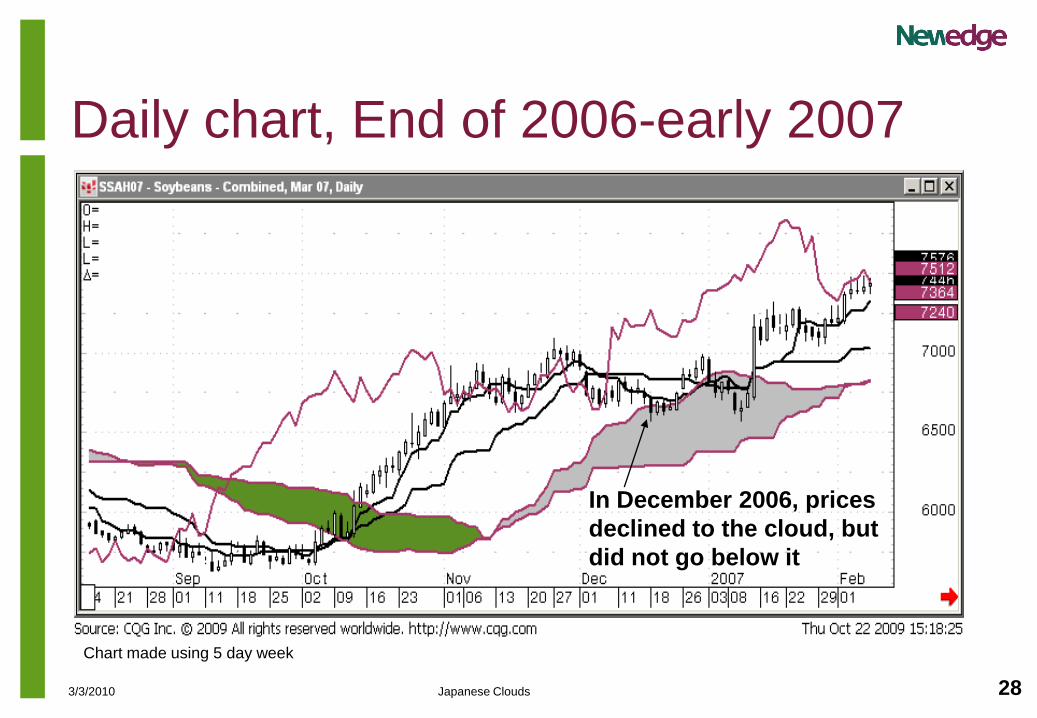
Daily chart, End of 2006-early 2007
In December 2006, prices
declined to the cloud, but
did not go below it
Chart made using 5 day week
4. Comparison with
Western techniques:
A few examples
• Clouds and Fibonacci retracements
• Example of a channel break out, and break of 50-day MA
• Example of a bear flag
303/3/2010 Japanese Clouds
Candlesticks and Fibonacci retracements
• Candlesticks are a key component of the method
- For Example:
• Bullish candlestick / pattern on support
• Strongly bearish candlestick / pattern going through support
• Fibonacci retracements and clouds
- The 50% retracement is the middle of the move being
corrected, while the cloud is based on data using the mid-point
of the ranges, projected forward.
- In corrections, the cloud is typically close to Fibonacci
retracements.
313/3/2010 Japanese Clouds
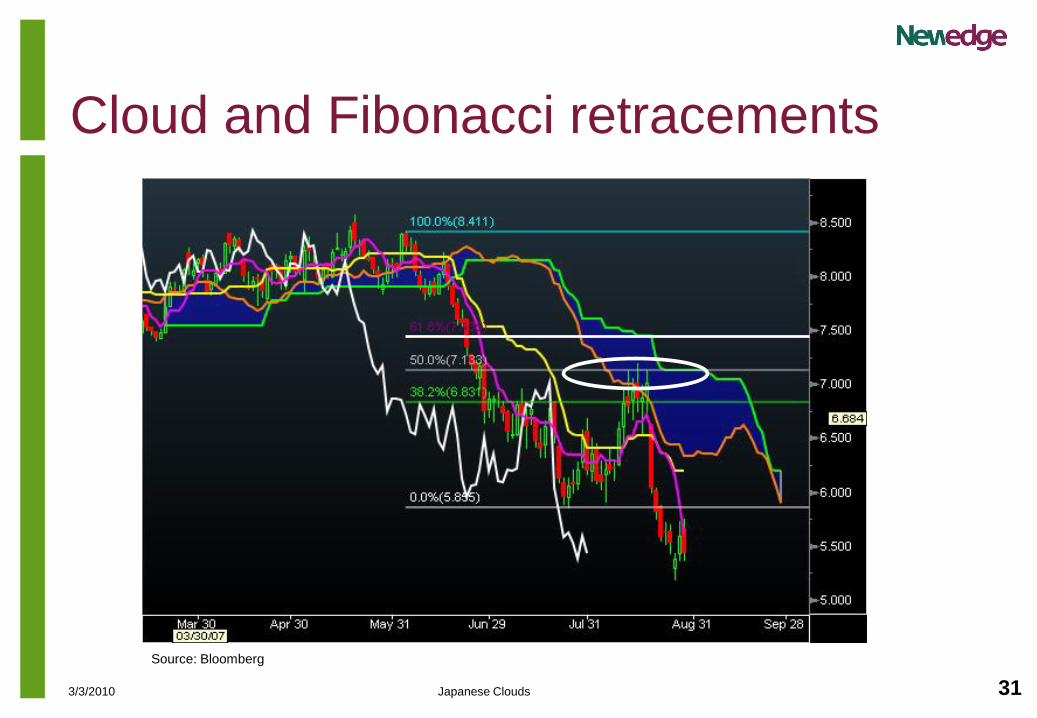
Cloud and Fibonacci retracements
Source: Bloomberg
323/3/2010 Japanese Clouds
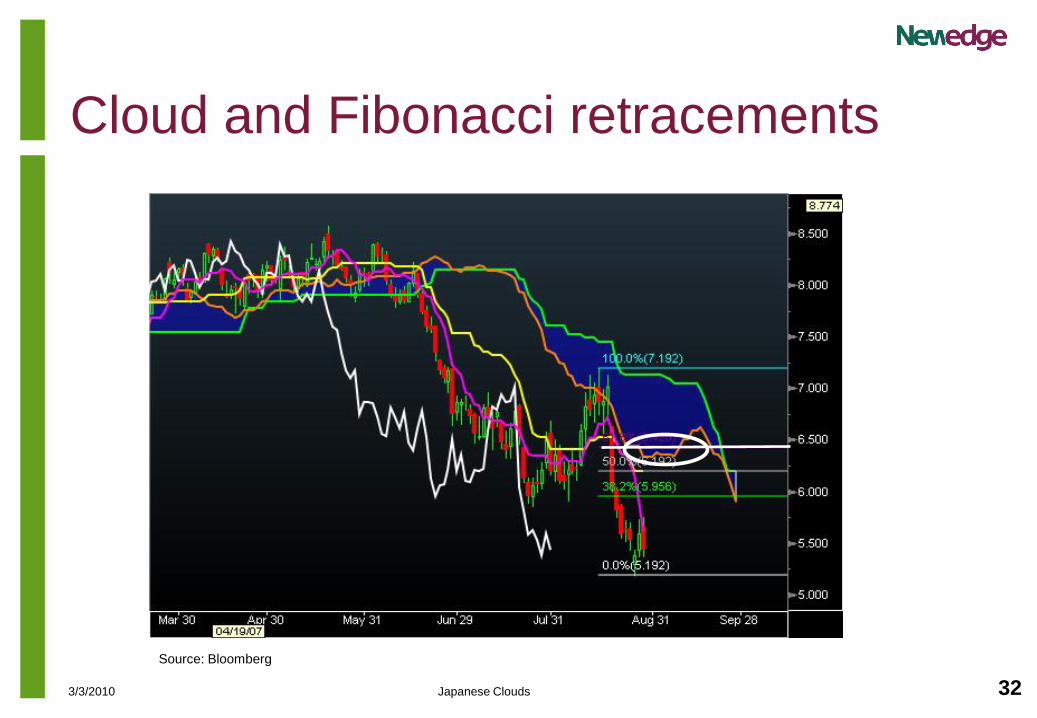
Cloud and Fibonacci retracements
Source: Bloomberg
333/3/2010 Japanese Clouds
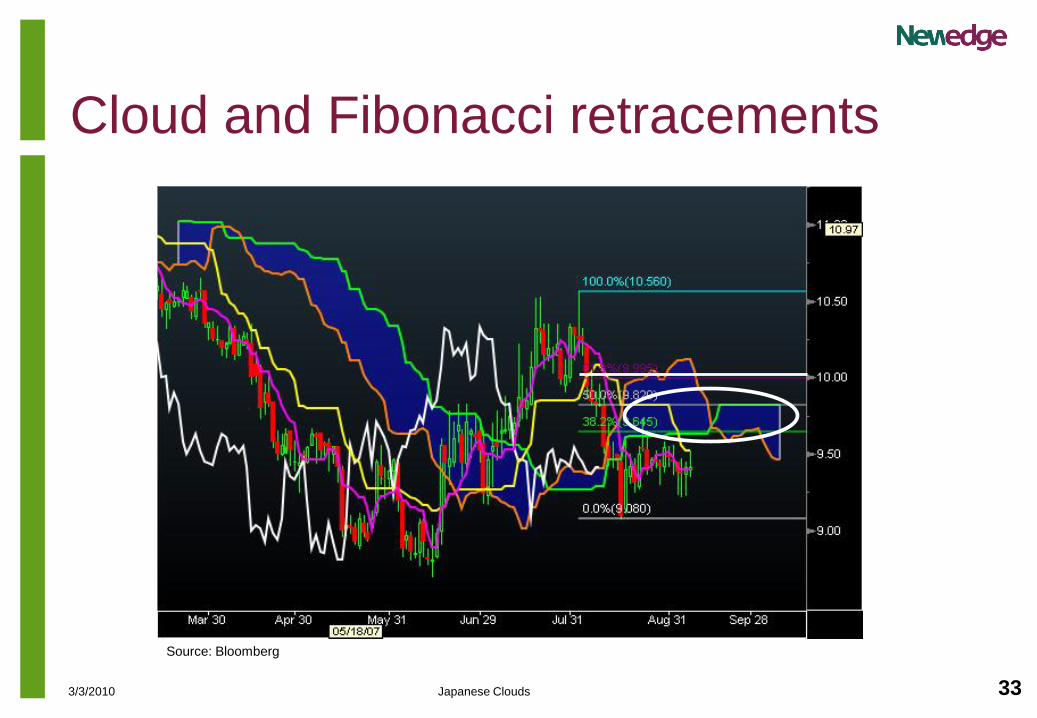
Cloud and Fibonacci retracements
Source: Bloomberg
343/3/2010 Japanese Clouds
Example: December CBOT Soybean
Oil, 2007
Comparison of channel and 50-day MA
support, with a cloud chart
353/3/2010 Japanese Clouds
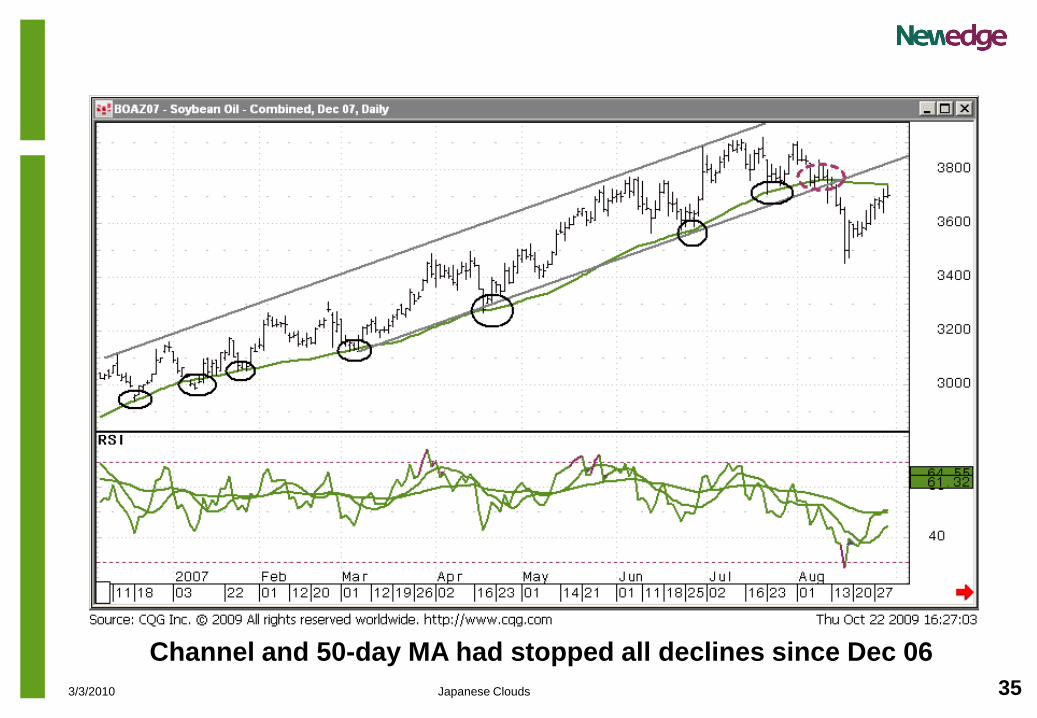
Channel and 50-day MA had stopped all declines since Dec 06
363/3/2010 Japanese Clouds
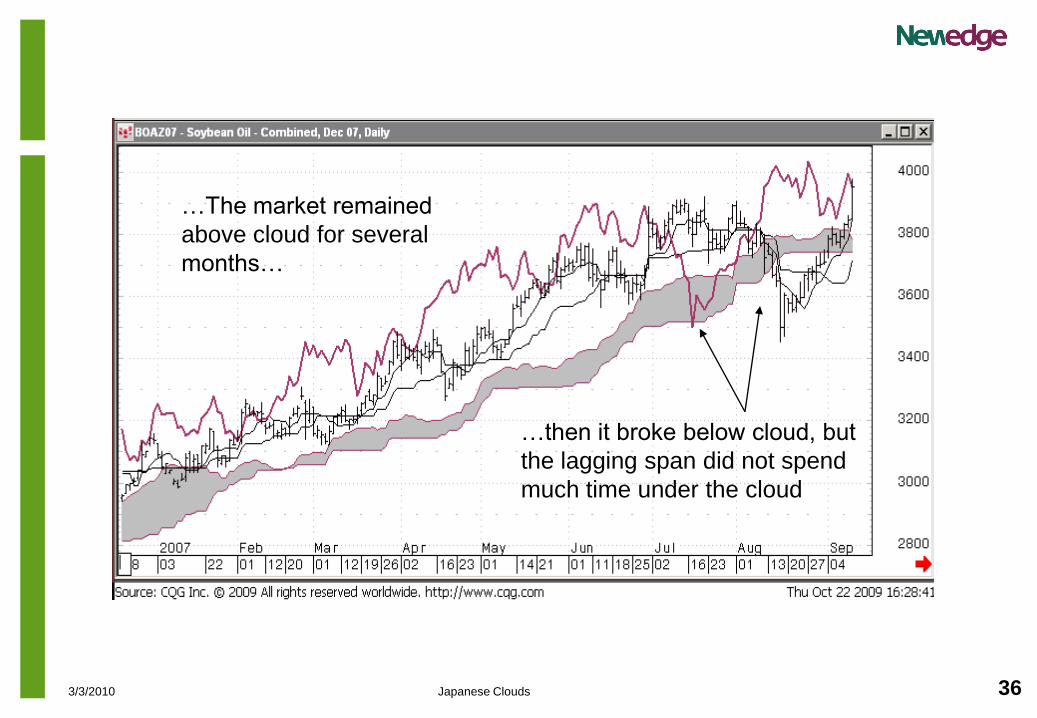
…The market remained
above cloud for several
months…
…then it broke below cloud, but
the lagging span did not spend
much time under the cloud
373/3/2010 Japanese Clouds
Case study: Bear flag
CBOT December 2007 Soybean Meal
futures, in July 2007
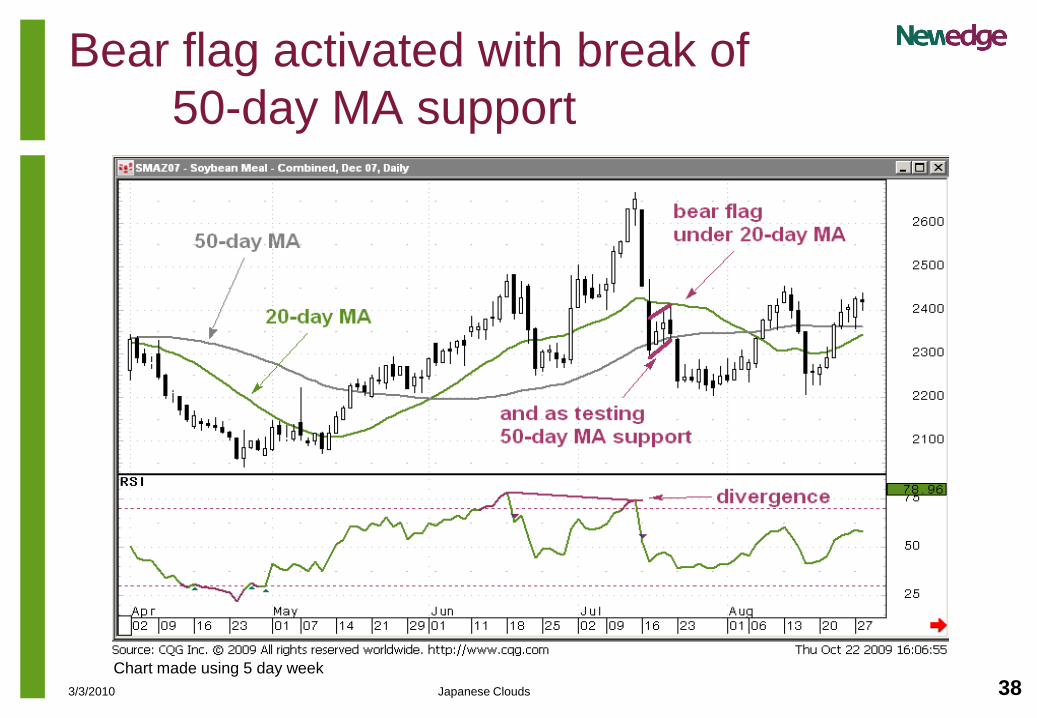
383/3/2010 Japanese Clouds
Bear flag activated with break of
50-day MA support
Chart made using 5 day week
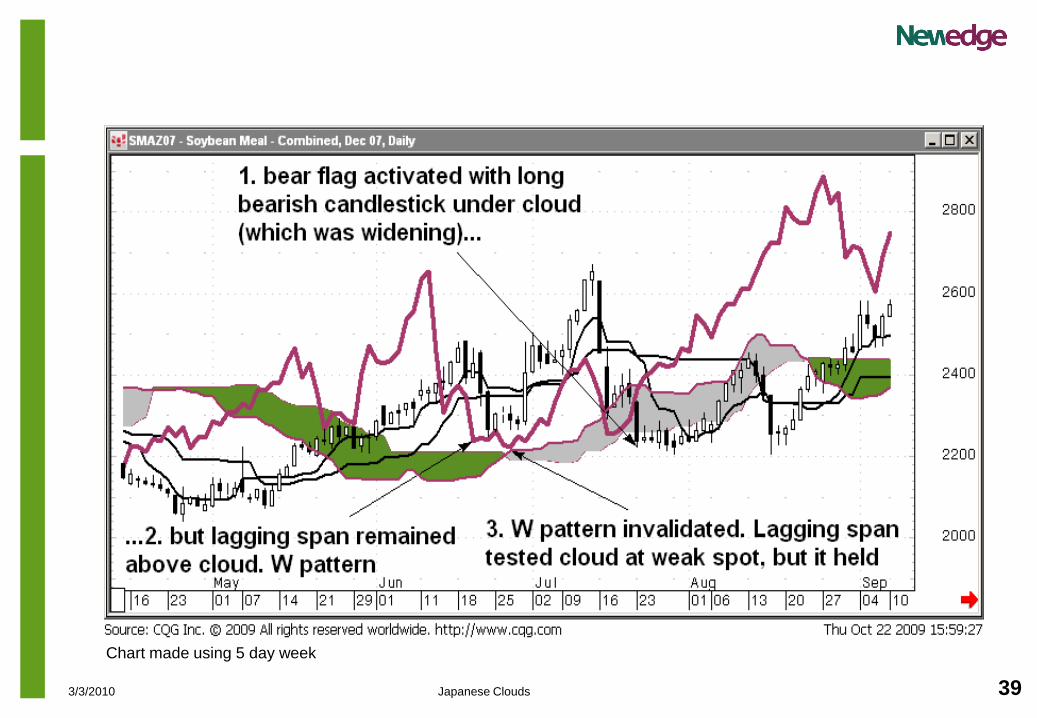
393/3/2010 Japanese Clouds
Chart made using 5 day week
403/3/2010 Japanese Clouds
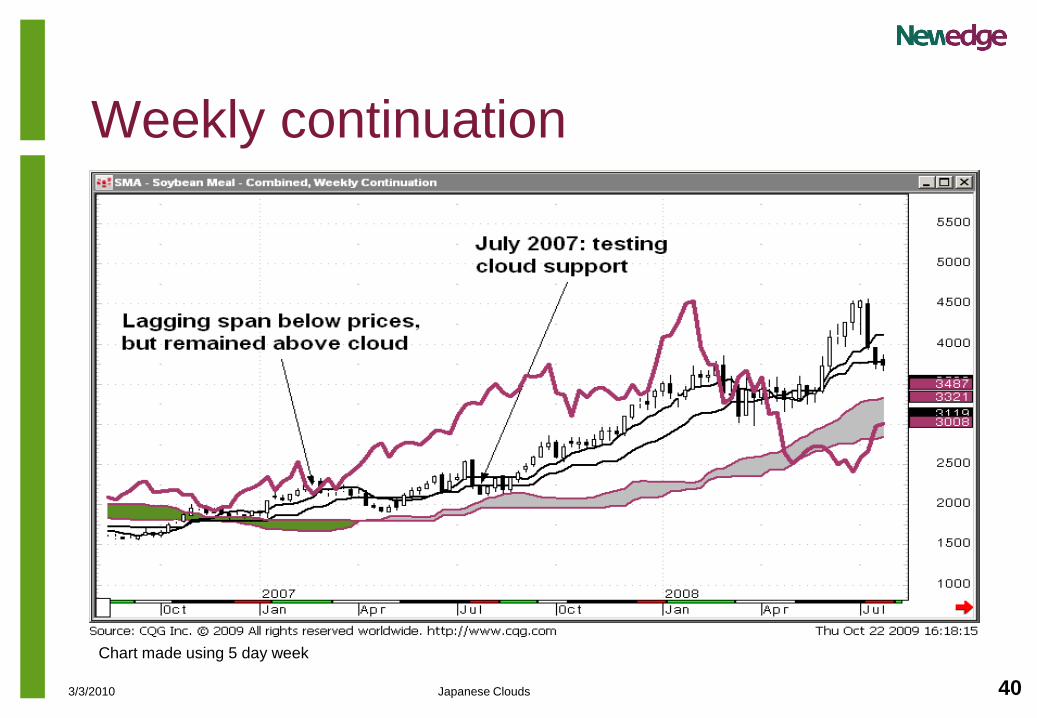
Weekly continuation
Chart made using 5 day week
413/3/2010 Japanese Clouds
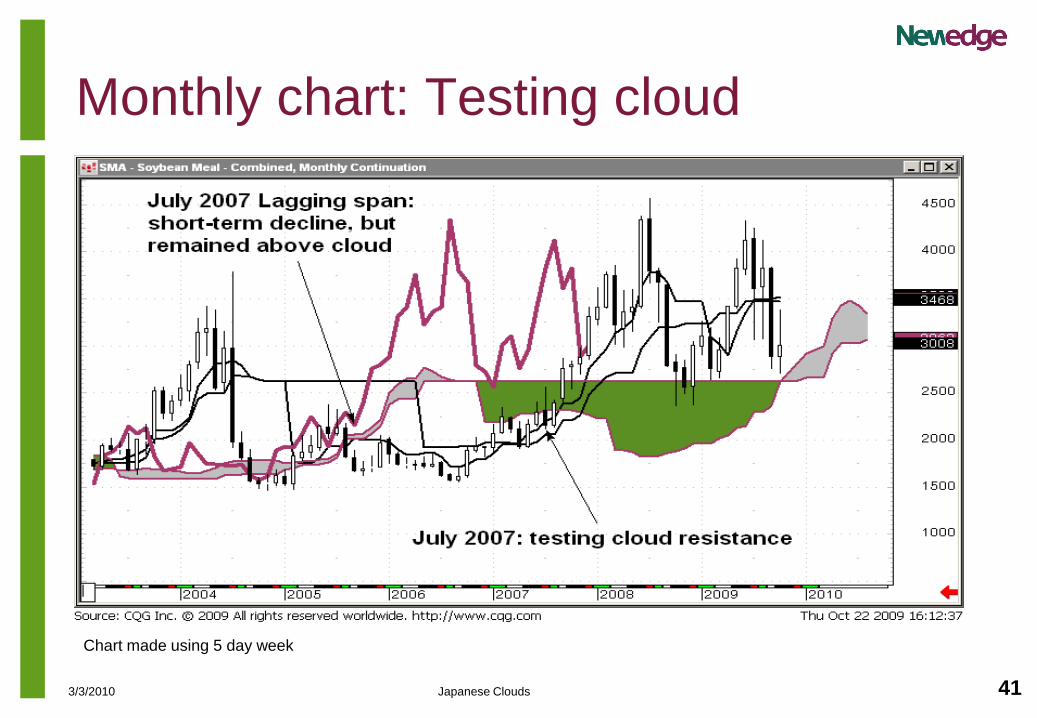
Monthly chart: Testing cloud
Chart made using 5 day week
5. Cloud charts:
A cluttered picture in
sideways markets!
433/3/2010 Japanese Clouds
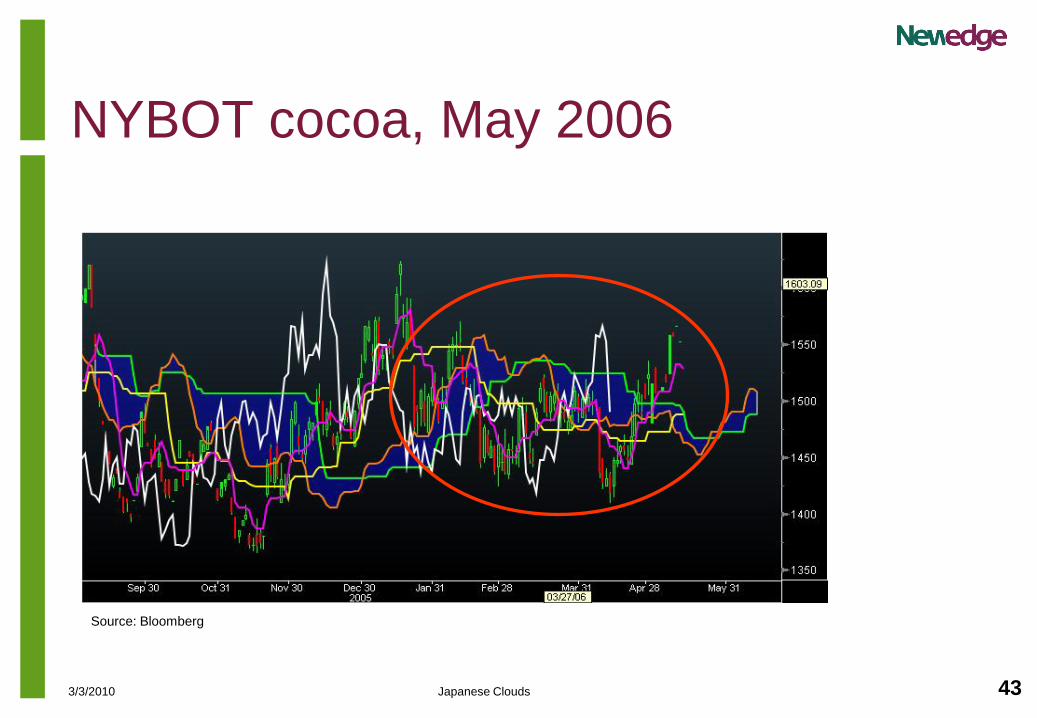
NYBOT cocoa, May 2006
Source: Bloomberg
443/3/2010 Japanese Clouds
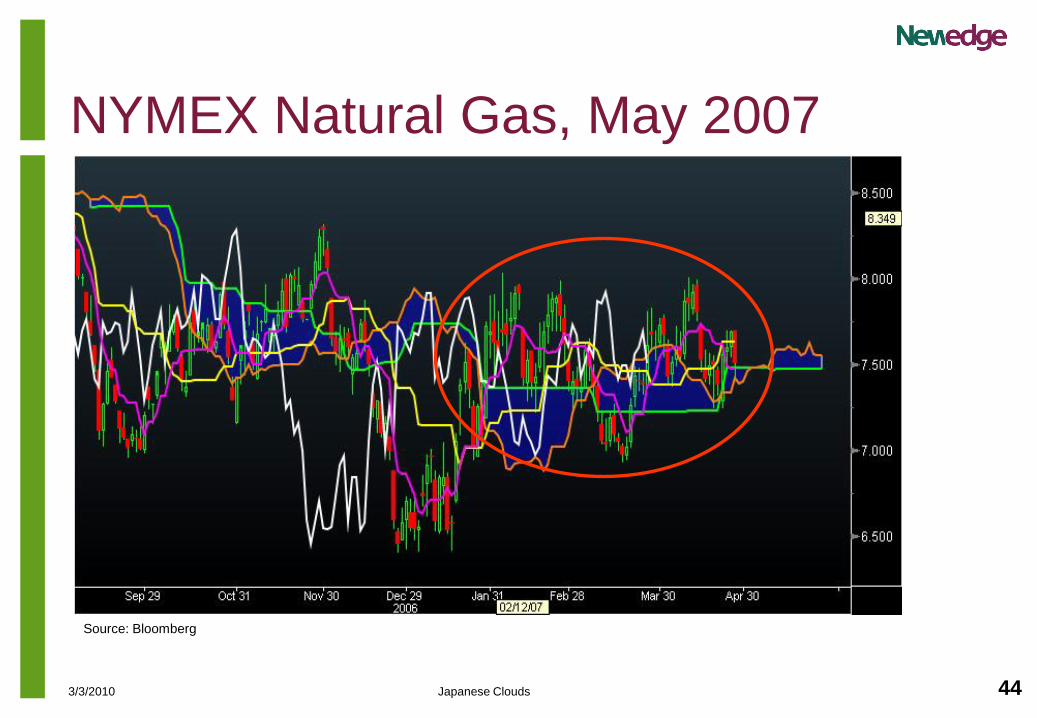
NYMEX Natural Gas, May 2007
Source: Bloomberg
6. Building indexes from
the cloud lines: A
western twist on an
Eastern tool
463/3/2010 Japanese Clouds
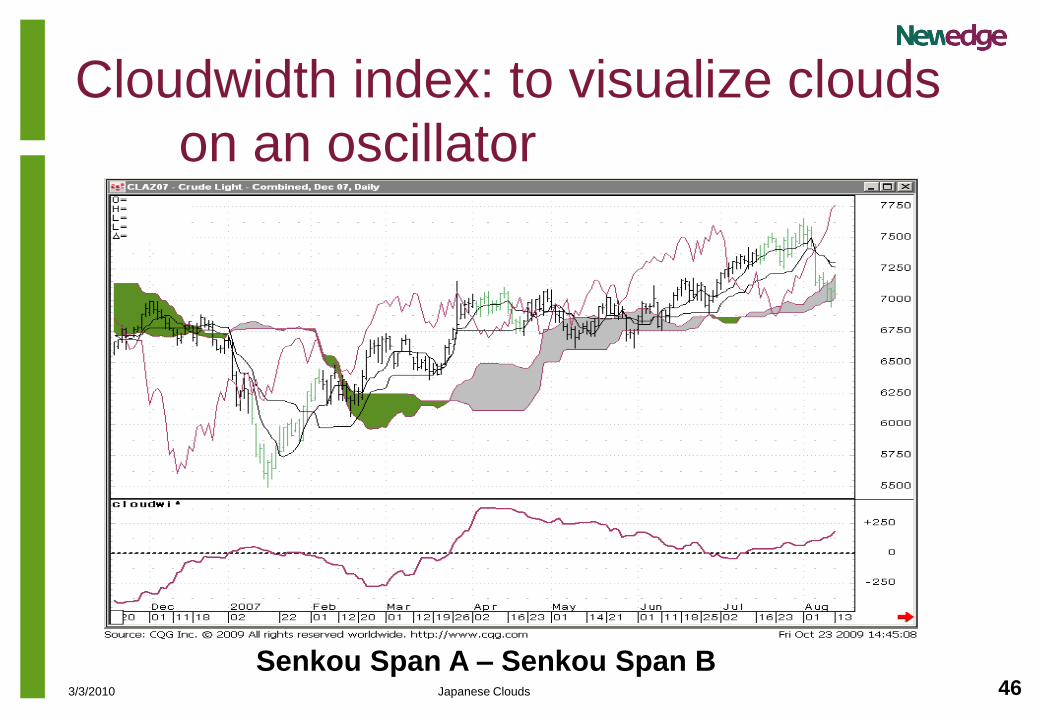
Cloudwidth index: to visualize clouds
on an oscillator
Senkou Span A – Senkou Span B
473/3/2010 Japanese Clouds
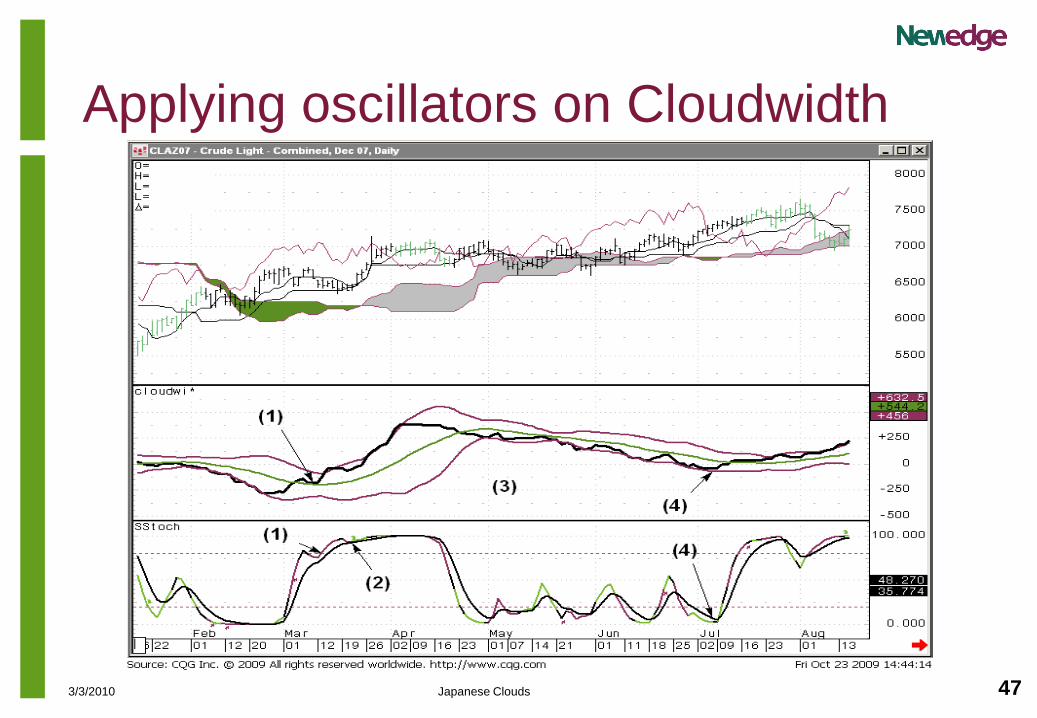
Applying oscillators on Cloudwidth
483/3/2010 Japanese Clouds
493/3/2010 Japanese Clouds
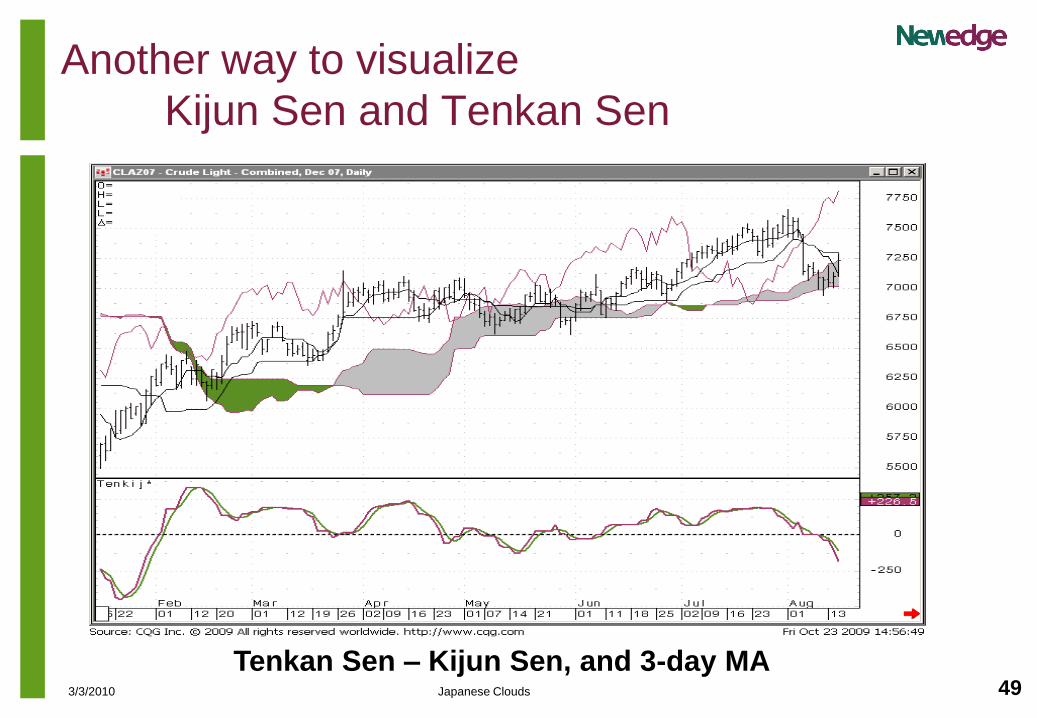
Another way to visualize
Kijun Sen and Tenkan Sen
Tenkan Sen – Kijun Sen, and 3-day MA
503/3/2010 Japanese Clouds
Contact Information
Véronique Lashinski, CMT
Vice-President & Senior Research Analyst
Newedge USA, LLC
550 West Jackson #241D
Chicago, IL 60661
Phone (312) 756 1562
513/3/2010 Japanese Clouds
The content of this report is proprietary to Newedge USA, LLC. You may not copy, reproduce and/nor distribute this material in part or in
whole without the prior written authorization of Newedge USA, LLC.
Newedge Group is authorized by the Banque de France. Newedge Group (UK Branch) is authorized by the Commission Bancaire and Autorité des
Marchés Financiers in France and is subject to limited regulation by the Financial Services Authority (the FSA) for the conduct of its UK business. Details
on the extent of our regulation by the FSA are available from us on request. Newedge Group (Frankfurt Branch) is regulated by BaFIN. Newedge Group
(Madrid Branch) is regulated by MEFF. Newedge Group (Dubai) is regulated by the Dubai Financial Services Authority). This information is not intended
for distribution to “Retail Customers” (as defined under MiFID).
Subject to the nature and contents of this report, the investments described herein are subject to fluctuations in price and/or value and investors may get
back less than originally invested. Certain high-volatility investments can be subject to sudden and large falls in value that could equal or exceed the
amount invested. The reader is advised that futures and options are speculative products and the risk of loss can be substantial. Futures spreads are not
necessarily less risky than short or long futures transactions and positions. Consequently only risk capital should be used to trade futures. Accordingly,
investors should, before acting on advice, consider the appropriateness of the advice, having regard to their objectives, financial situation and needs.
Newedge Group (UK Branch) accepts no liability whatsoever for any direct, indirect or consequential loss arising from the use of this report or its
content. This report is not to be construed as providing investment services in any jurisdiction where the provision of such services would be illegal.
The opinions, views and forecasts expressed in this report reflect the personal views of the author(s) and do not necessarily reflect the views of
Newedge Group (UK Branch) or any other branch or subsidiary of Newedge Group (collectively, "Affiliates"). Newedge Group (UK Branch), its
worldwide Affiliates, or any of their employees may, from time to time, have transactions and positions in, make a market in or effect transactions in any
investment or related investment covered by the report. Newedge Group (UK Branch) makes no representation or warranty regarding the correctness of
any information contained herein, or the appropriateness of any transaction for any person. All references to prices and yields are subject to change
without notice. Past results are not necessarily an indication of future performance. Nothing herein shall be construed as a recommendation to buy or
sell any financial instrument or security. This communication is for information purposes only. Investors should also consider this report as only a single
factor in making their investment decision. This communication may contain privileged and/or confidential information and is intended only for the use of
the individual or entity to which it is addressed. No waiver of confidentiality or privilege is made by mistransmission. If the reader of this message is not
the intended recipient, you are hereby notified that any unauthorized dissemination, distribution, reading, printing, copying and/or use of this
communication are strictly prohibited.
THE DISTRIBUTION OF THIS REPORT IN OTHER JURISDICTIONS MAY BE PROHIBITED OR RESTRICTED BY LAW, AND PERSONS INTO
WHOSE POSSESSION THIS REPORT COMES SHOULD INFORM THEMSELVES ABOUT, AND OBSERVE, ANY SUCH PROHIBITION OR
RESTRICTIONS. BY ACCEPTING THIS REPORT YOU AGREE TO BE BOUND BY THE FOREGOING.
Date of first use: Wednesday, March 03, 2010
© Newedge USA, LLC - March 10
All rights reserved.