Embed Size (px)
Citation preview
2014 NDACo ANNUAL CONFERENCESECURITY FOR COURTHOUSES AND
COURTROOMSSteven R. Engen
Director of Facility InspectionNorth Dakota Department of Corrections and Rehabilitation
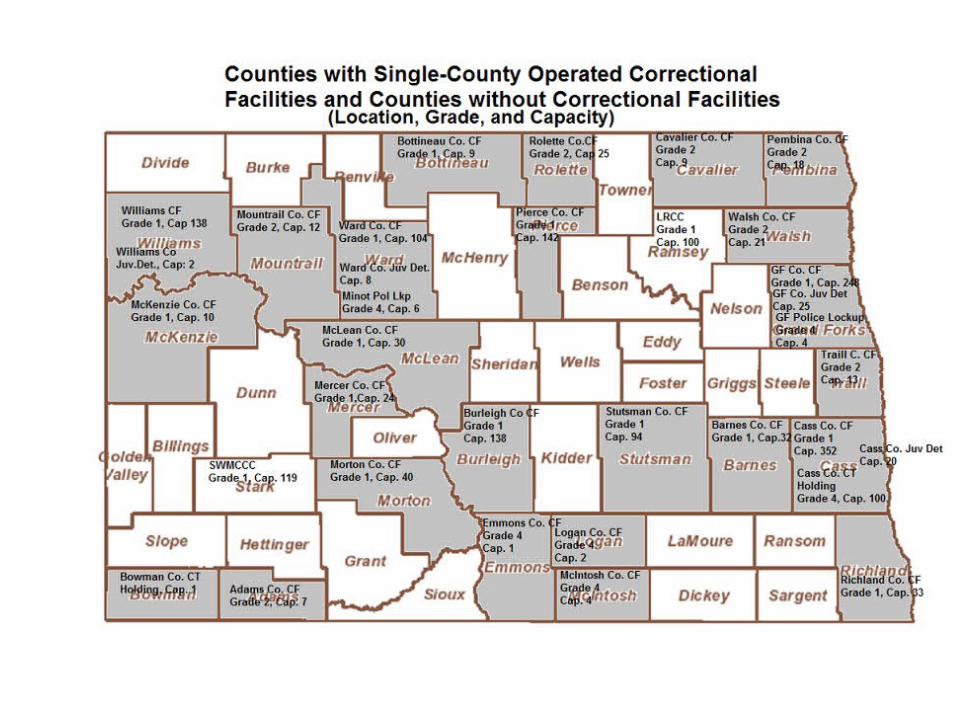
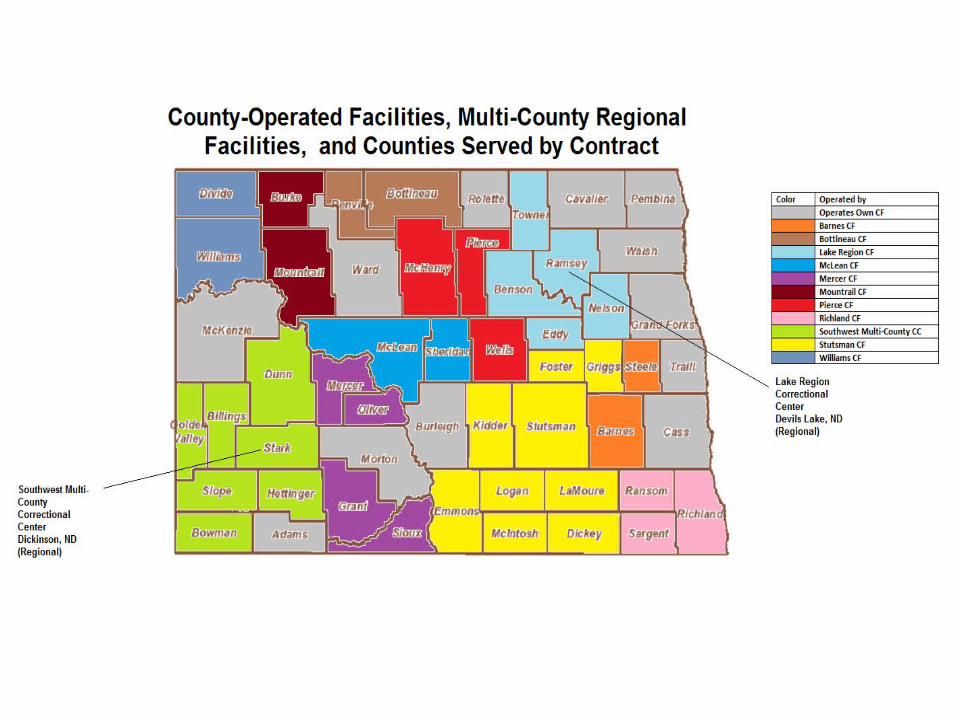
Currently there are 35 multi-county, county or city operated secure correctional facilities in North Dakota.
Correctional facilities in North Dakota are classified as:◦ Grade one.◦ Grade two.◦ Grade three◦ Grade four.◦ Juvenile detention Centers.
North Dakota county corrections overview
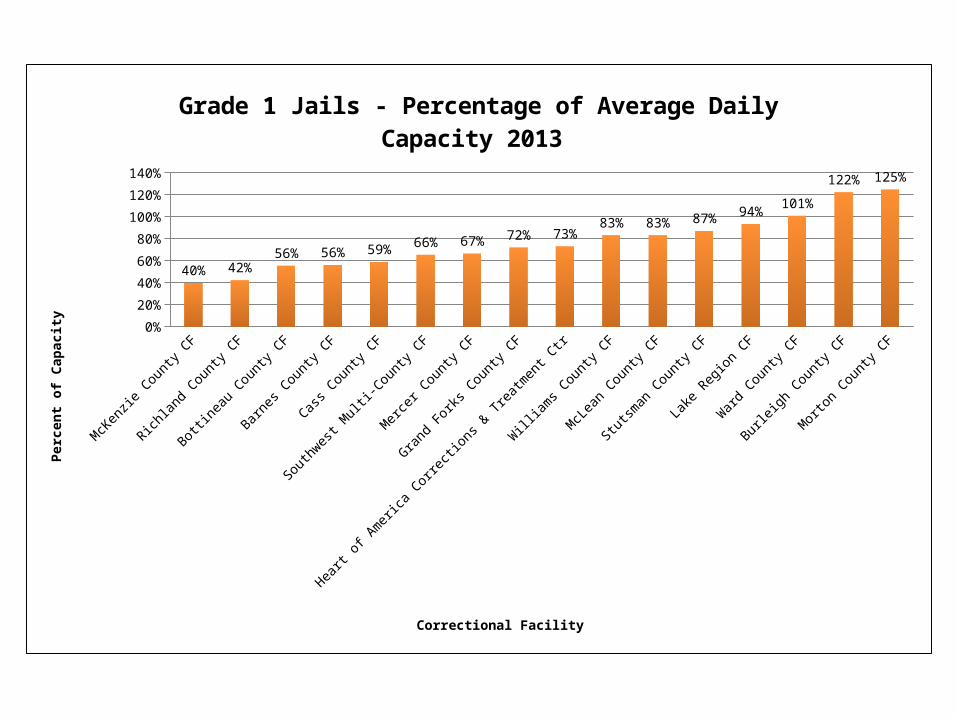
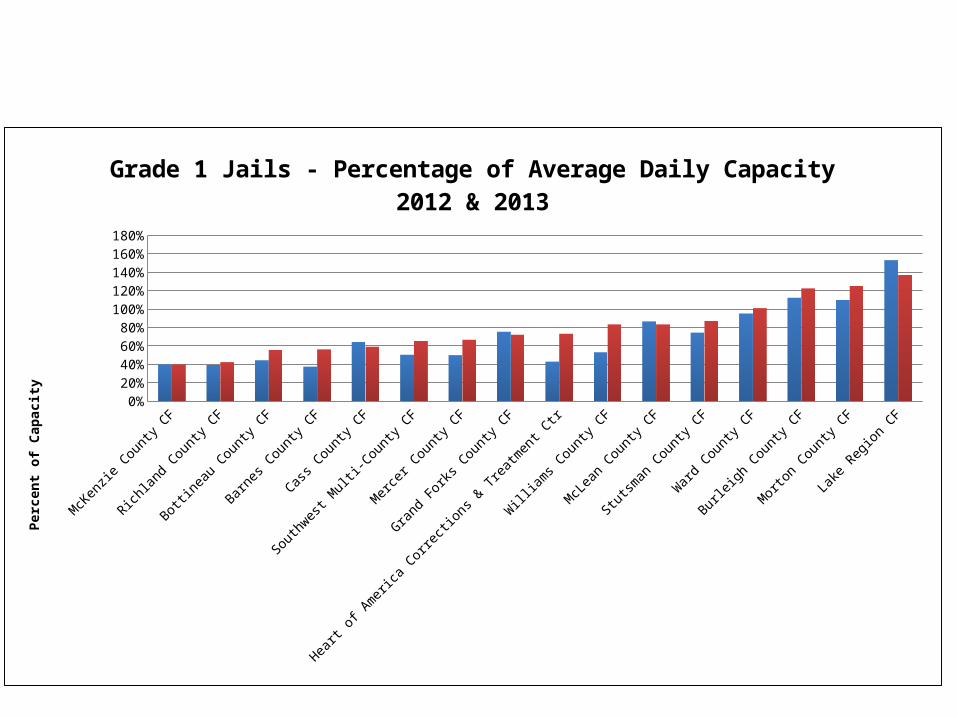
A grade one facility may hold an adult inmate sentenced or presentenced for not more than one year.
Grade one facilities must provide an outdoor recreation area that allows a minimum of 15 square feet of space per inmate. Grade one facilities may utilize opening louvered vented rooms that allow outside air in as outdoor recreation.
Grade one facilities must provide an indoor recreation made up of a minimum of 100 square feet with a minimum of 15 square feet per inmate using the area at the same time. Inmates using this area may not have access to other inmates in their cells.
Grade one facilities must provide secure visitation areas, including attorney-client visitation.
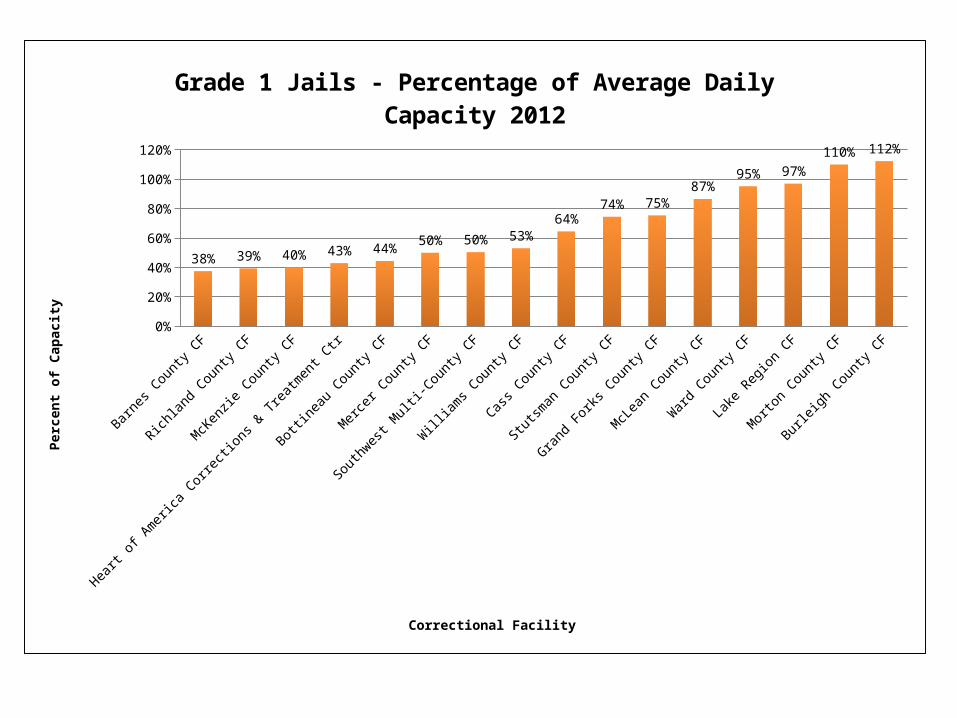
There are 16 grade one facilities in North Dakota.
Grade One facilities.
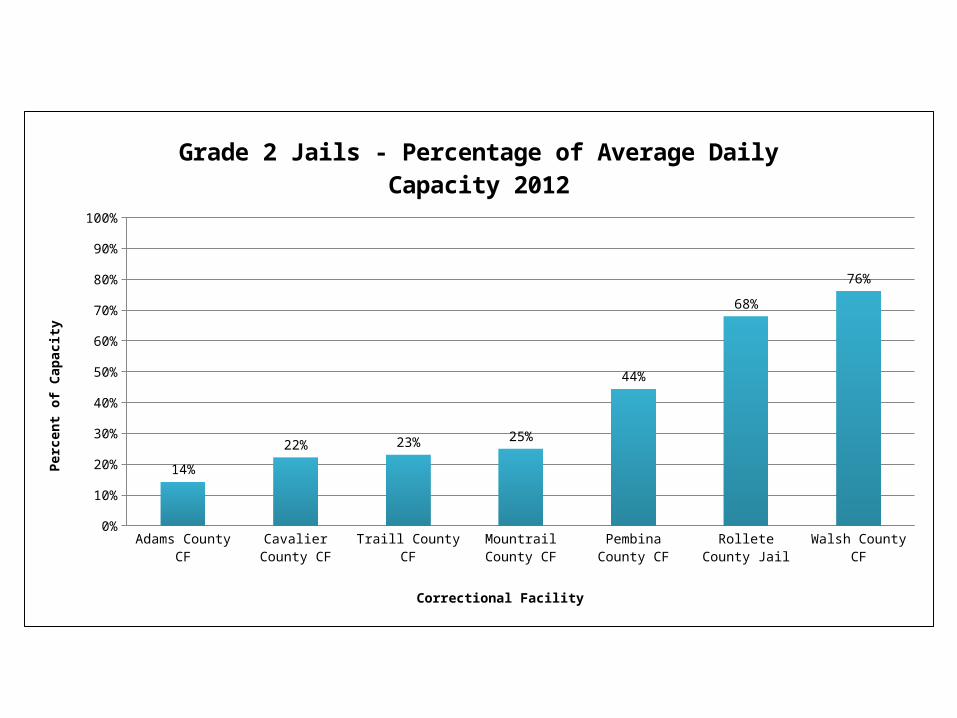
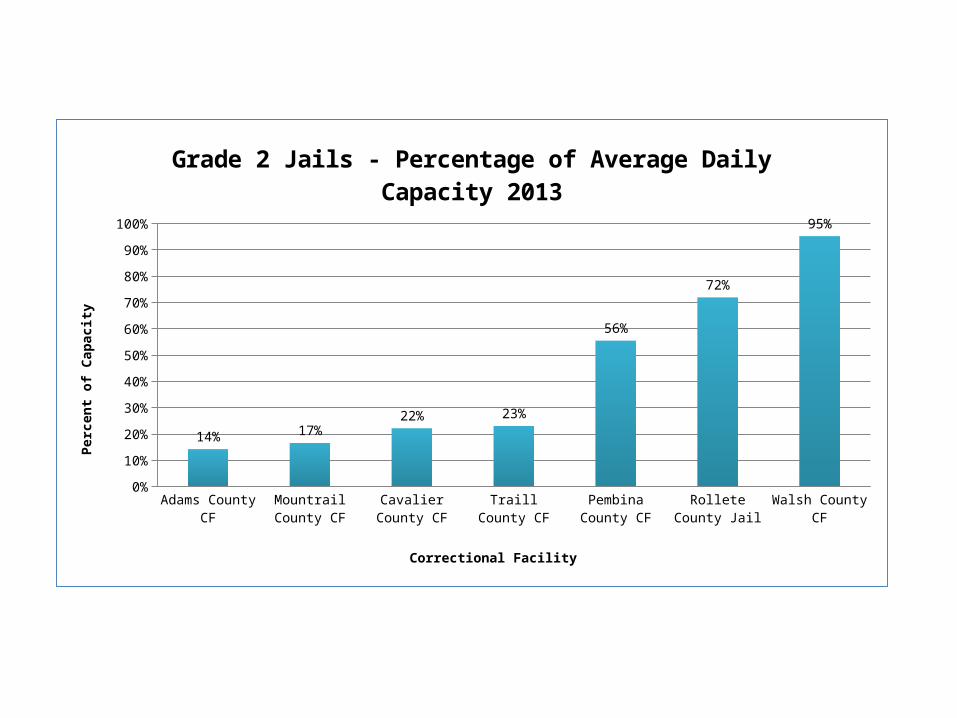
A grade two facility may hold an adult inmate sentenced or presentenced for not more than 90 days.
Grade two facilities must provide an indoor recreation made up of a minimum of 100 square feet with a minimum of 15 square feet per inmate using the area at the same time. Inmates using this area may not have access to other inmates in their cells.
Grade two facilities must provide secure visitation areas, including attorney-client visitation.
There are seven grade two facilities in North Dakota.
Grade Two facilities
A grade three facility may hold an adult inmate, sentence or presentenced for not more than 96 hours. There are currently no grade three facilities operating in North Dakota at this time. This is due to the creation of a grade four facility by the Sixty-third Legislative Assembly.
Grade Three facilities
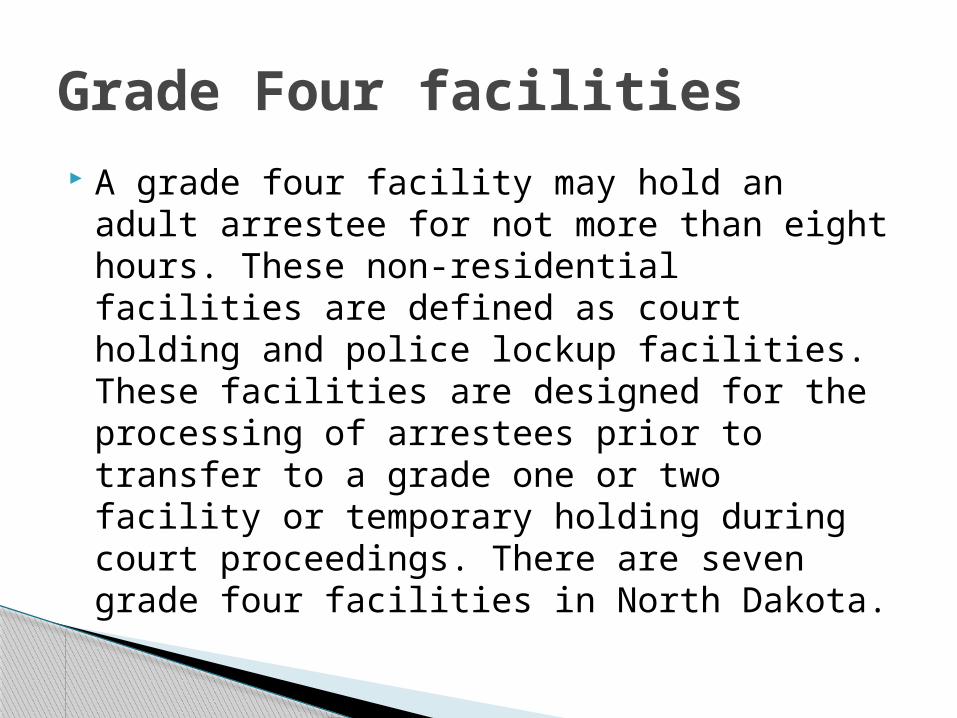
A grade four facility may hold an adult arrestee for not more than eight hours. These non-residential facilities are defined as court holding and police lockup facilities. These facilities are designed for the processing of arrestees prior to transfer to a grade one or two facility or temporary holding during court proceedings. There are seven grade four facilities in North Dakota.
Grade Four facilities

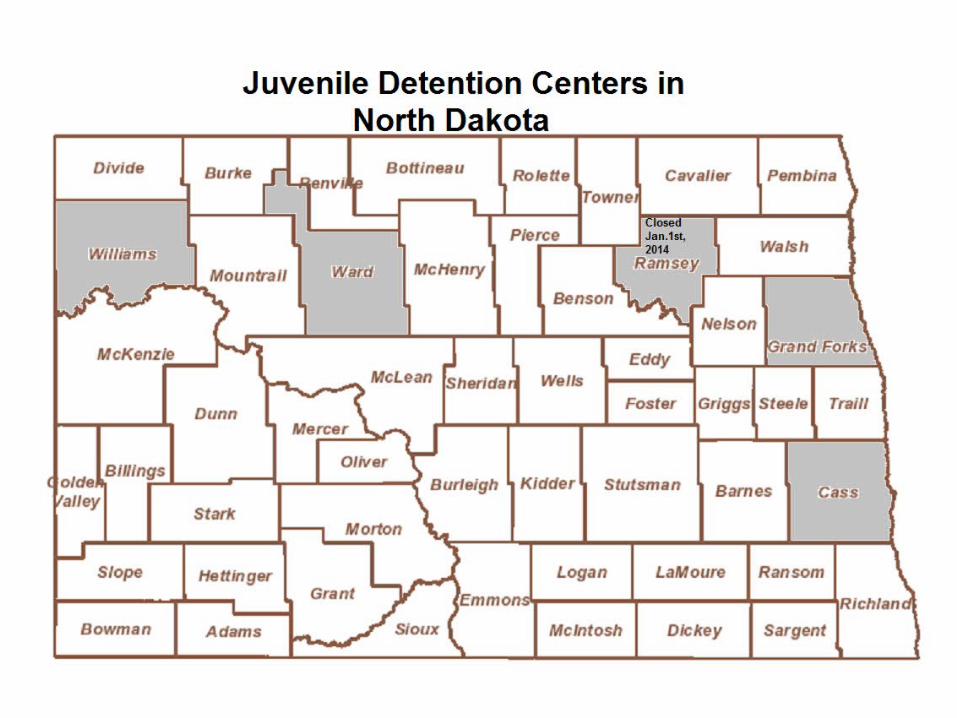
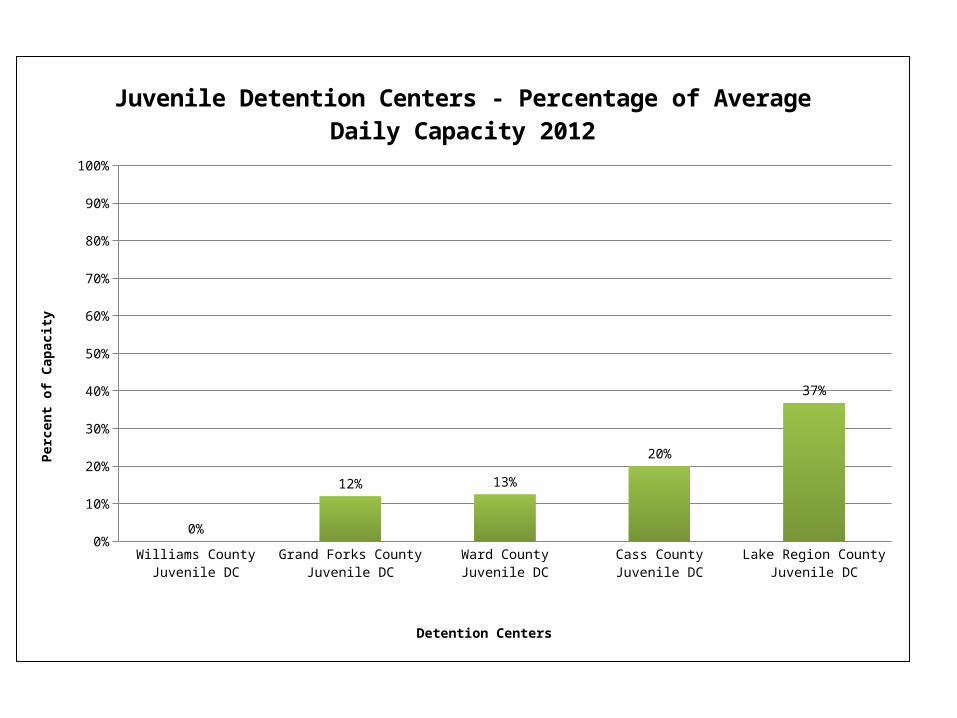
A juvenile detention center is a publicly maintained correctional facility for the detention of juveniles. The term does not include the North Dakota Youth Correctional Center. In 2013, there were five Juvenile Detention Centers in North Dakota. In January 2014, the Lake Region Juvenile Detention Center closed. The space formerly utilized for holding juveniles became space for holding adult inmates. Currently there are four juvenile detention centers in North Dakota.
Juvenile Detention Centers
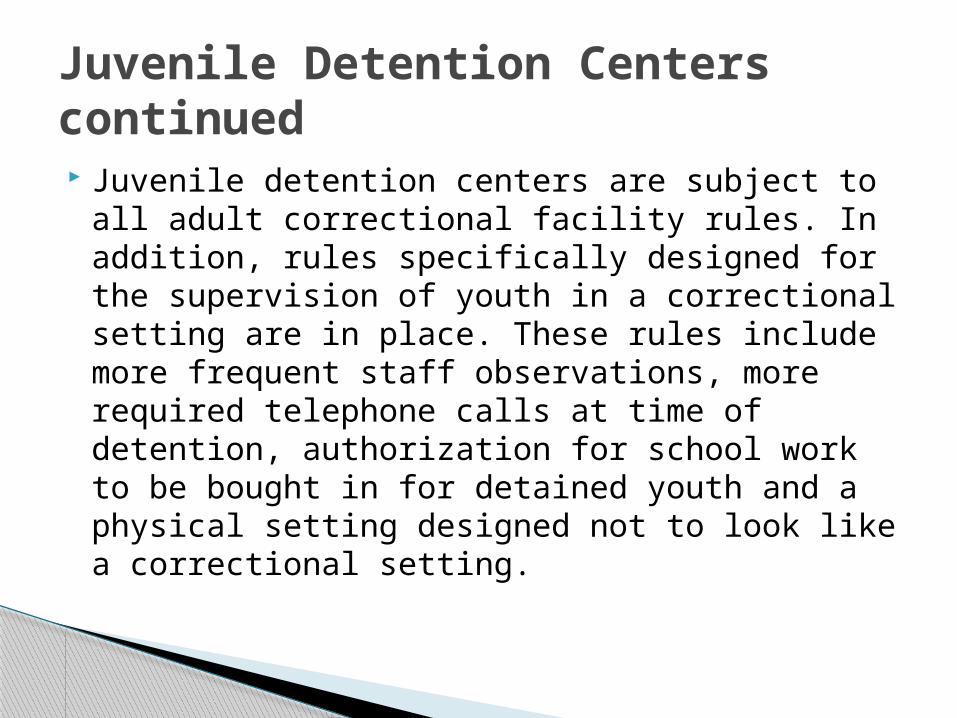
Juvenile detention centers are subject to all adult correctional facility rules. In addition, rules specifically designed for the supervision of youth in a correctional setting are in place. These rules include more frequent staff observations, more required telephone calls at time of detention, authorization for school work to be bought in for detained youth and a physical setting designed not to look like a correctional setting.
Juvenile Detention Centers continued

Grade one-1569 beds. Grade two-105 beds. Grade three-0 beds as there are no grade
three facilities. Grade four-No overnight capacity. Total adult bed space available statewide-
1674 Juvenile Detention Centers-93 beds until
January 1, 2014. Currently 55 beds available due to Lake Region Juvenile Detention closing.
Total overnight bed capacity
Barnes
County CF
Richlan
d County CF
McKen
zie County
CF
Heart
of Ameri
ca Corre
ctions &
Trea
tmen
t Ctr
Bottineau County
CF
Mercer
County CF
Southwest
Multi-County
CF
Willi
ams C
ounty CF
Cass County
CF
Stutsm
an County
CF
Grand Fo
rks County
CF
McLean
County CF
Ward
County CF
Lake R
egion CF
Morton County
CF
Burleigh
County CF
0%
20%
40%
60%
80%
100%
120%
38% 39% 40% 43% 44%50% 50% 53%
64%
74% 75%
87%
95% 97%
110% 112%
Grade 1 Jails - Percentage of Average Daily Capacity 2012
Correctional Facility
Perc
ent o
f Cap
acity
McKen
zie County
CF
Richlan
d County CF
Bottineau County
CF
Barnes
County CF
Cass County
CF
Southwest
Multi-County
CF
Mercer
County CF
Grand Fo
rks County
CF
Heart
of Ameri
ca Corre
ctions &
Trea
tmen
t Ctr
Willi
ams C
ounty CF
McLean
County CF
Stutsm
an County
CF
Lake R
egion CF
Ward
County CF
Burleigh
County CF
Morton County
CF0%
20%
40%
60%
80%
100%
120%
140%
40% 42%
56% 56% 59%66% 67%
72% 73%
83% 83% 87%94%
101%
122% 125%
Grade 1 Jails - Percentage of Average Daily Capacity 2013
Correctional Facility
Perc
ent o
f Cap
acity
Adams County CF Cavalier County CF Traill County CF Mountrail County CF
Pembina County CF Rollete County Jail Walsh County CF0%
10%
20%
30%
40%
50%
60%
70%
80%
90%
100%
14%
22% 23% 25%
44%
68%
76%
Grade 2 Jails - Percentage of Average Daily Capacity 2012
Correctional Facility
Perc
ent o
f Cap
acity
Adams County CF Mountrail County CF
Cavalier County CF
Traill County CF Pembina County CF
Rollete County Jail Walsh County CF0%
10%
20%
30%
40%
50%
60%
70%
80%
90%
100%
14% 17%22% 23%
56%
72%
95%
Grade 2 Jails - Percentage of Average Daily Capacity 2013
Correctional Facility
Perc
ent o
f Cap
acity
Willi
ams C
ounty Juve
nile DC
Grand Fo
rks County
Juvenile
DC
Ward
County Juve
nile DC
Cass County
Juvenile
DC
Lake R
egion County
Juvenile
DC0%
10%
20%
30%
40%
50%
60%
70%
80%
90%
100%
0%
12% 13%
20%
37%
Juvenile Detention Centers - Percentage of Average Daily Capacity 2012
Detention Centers
Perc
ent o
f Cap
acity
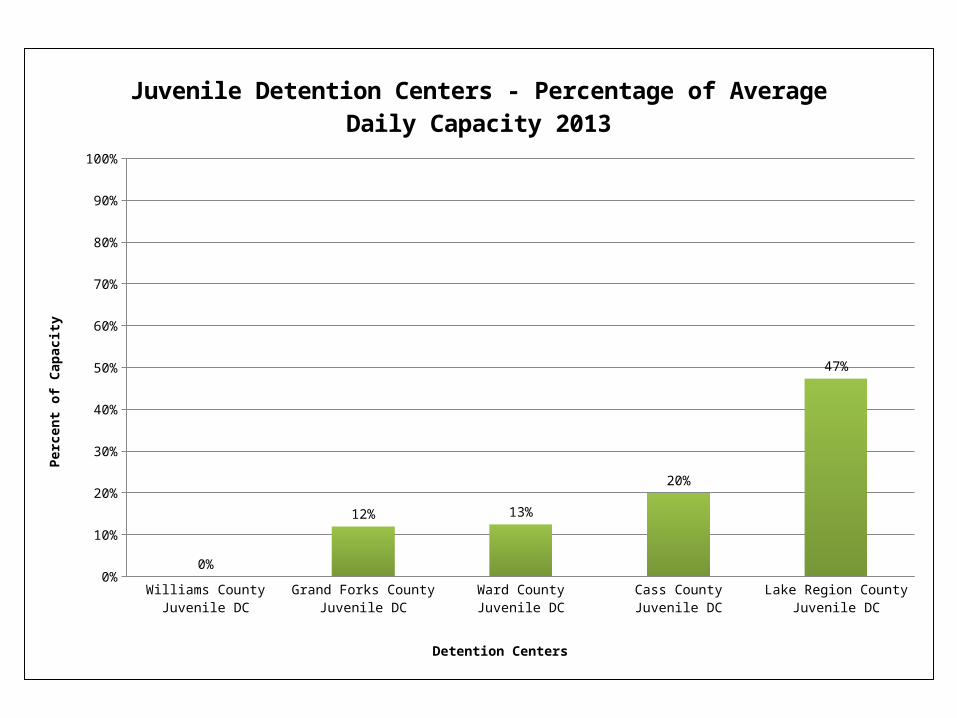
Williams County Juvenile DC Grand Forks County Juvenile DC
Ward County Juvenile DC Cass County Juvenile DC Lake Region County Juvenile DC
0%
10%
20%
30%
40%
50%
60%
70%
80%
90%
100%
0%
12% 13%
20%
47%
Juvenile Detention Centers - Percentage of Average Daily Capacity 2013
Detention Centers
Perc
ent o
f Cap
acity
McKen-zie
County CF
Richland County
CF
Bot-tineau County
CF
Barnes County
CF
Cass County
CF
South-west
Multi-County
CF
Mercer County
CF
Grand Forks
County CF
Heart of America Correc-tions & Treat-
ment Ctr
Williams County
CF
McLean County
CF
Stutsman
County CF
Ward County
CF
Burleigh County
CF
Morton County
CF
Lake Re-gion CF
2012
0.4 0.39393939393
9394
0.44444444444
4445
0.375 0.64488636363
6364
0.50420168067
2269
0.5 0.75403225806
4516
0.42957746478
8732
0.53030303030
3031
0.86666666666
6667
0.74468085106
383
0.95192307692
3077
1.12318840579
71
1.1 1.53225806451
613
2013
0.4 0.42424242424
2424
0.55555555555
5556
0.5625 0.59090909090
9091
0.65546218487
3949
0.66666666666
6667
0.72177419354
8388
0.73239436619
7183
0.83333333333
3334
0.83333333333
3334
0.87234042553
1915
1.00961538461
538
1.22463768115
942
1.25 1.37096774193
548
10%
30%
50%
70%
90%
110%
130%
150%
170%
Grade 1 Jails - Percentage of Average Daily Capacity 2012 & 2013
Perc
ent o
f Cap
acity
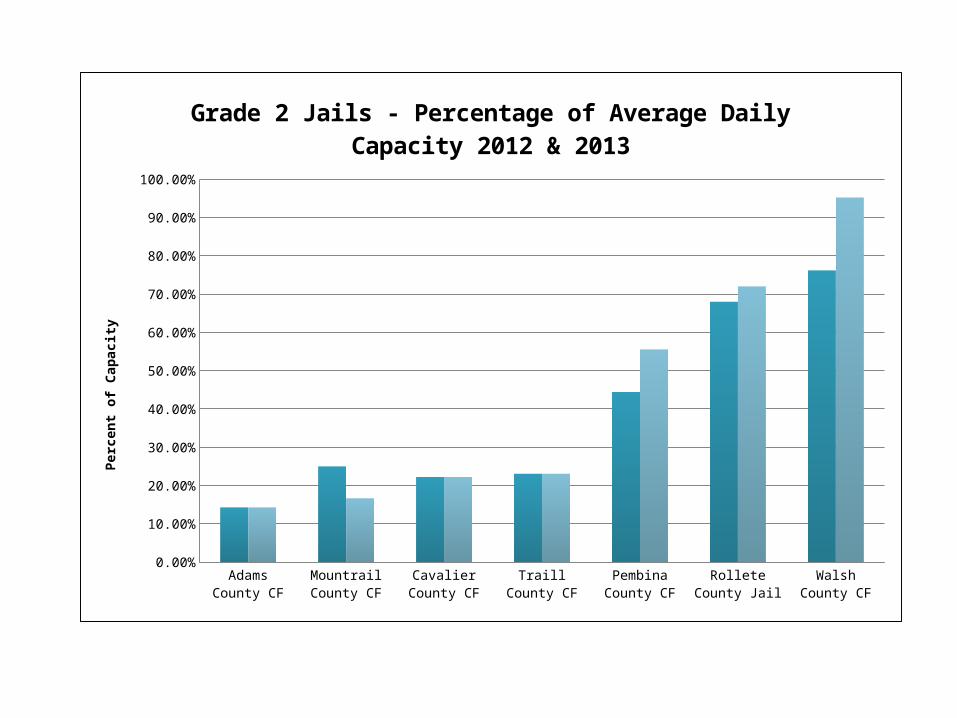
Adams County CF Mountrail County CF
Cavalier County CF
Traill County CF Pembina County CF
Rollete County Jail
Walsh County CF
2012 0.142857142857143
0.25 0.222222222222222
0.230769230769231
0.444444444444444
0.68 0.761904761904762
2013 0.142857142857143
0.166666666666667
0.222222222222222
0.230769230769231
0.555555555555556
0.72 0.952380952380952
5.00%
15.00%
25.00%
35.00%
45.00%
55.00%
65.00%
75.00%
85.00%
95.00%
Grade 2 Jails - Percentage of Average Daily Capacity 2012 & 2013Pe
rcen
t of C
apac
ity
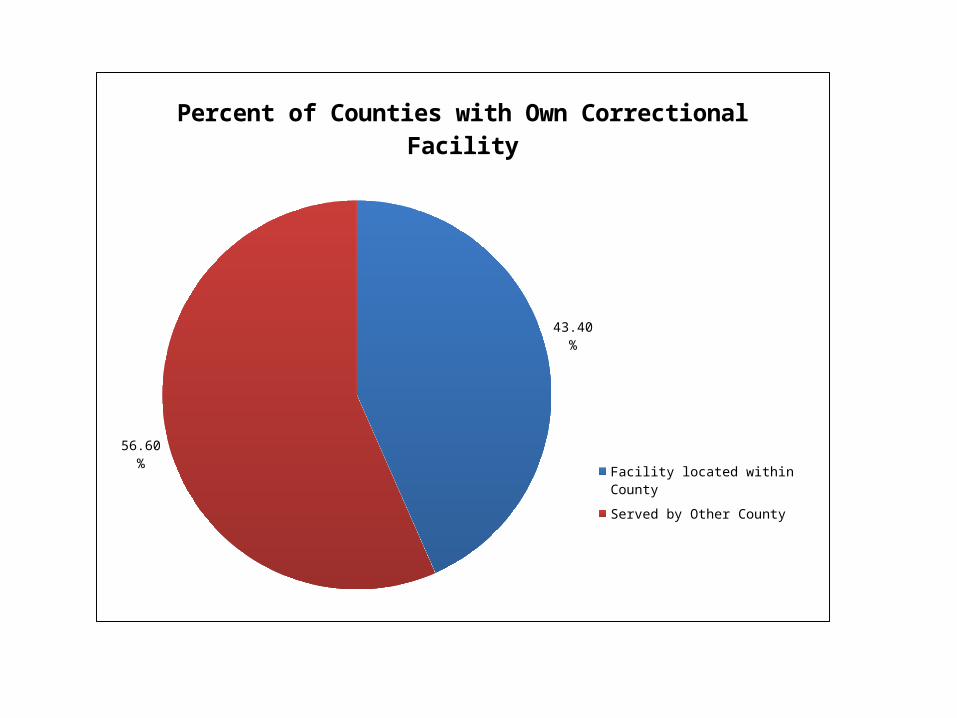
43.40%
56.60%
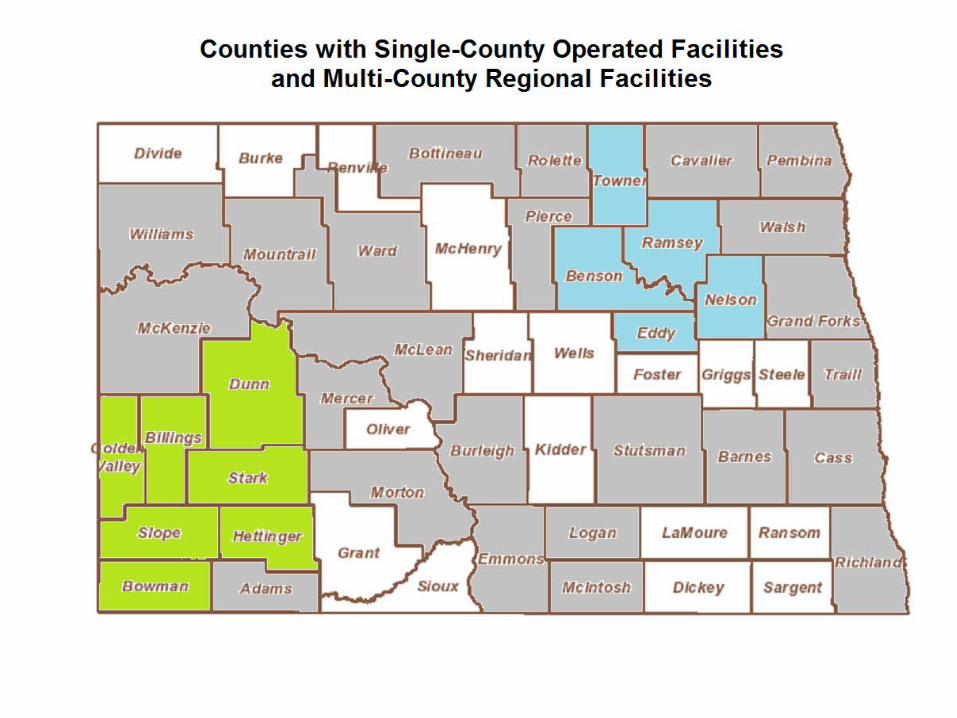
Percent of Counties with Own Correctional Facility
Facility located within County
Served by Other County