Embed Size (px)
Citation preview
Seeing Optical with ClarityAn Overview of Broadband Economics
Steven GlapaVP of Marketing & Product Management
Digital City Expo, January 23, 2008
PROPRIETARY & CONFIDENTIAL 2
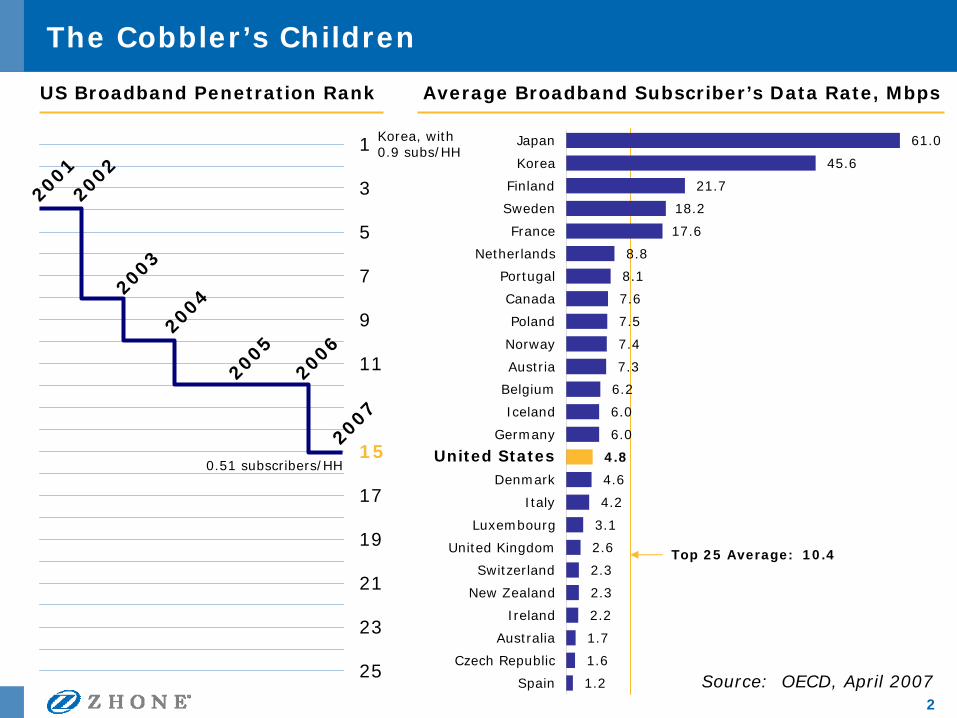
The Cobbler’s Children
Source: OECD, April 2007
1
3
5
7
9
11
13
15
17
19
21
23
25
61.0
45.6
21.7
18.2
17.6
8.8
8.1
7.6
7.5
7.4
7.3
6.2
6.0
6.0
4.8
4.6
4.2
3.1
2.6
2.3
2.3
2.2
1.7
1.6
1.2
Japan
Korea
Finland
Sweden
France
Netherlands
Portugal
Canada
Poland
Norway
Austria
Belgium
Iceland
Germany
United StatesDenmark
Italy
Luxembourg
United Kingdom
Switzerland
New Zealand
Ireland
Australia
Czech Republic
Spain
Top 25 Average: 10.4
2001
2007
2002
2003
2004
2005
2006
0.51 subscribers/HH
Korea, with0.9 subs/HH
Average Broadband Subscriber’s Data Rate, MbpsUS Broadband Penetration Rank
PROPRIETARY & CONFIDENTIAL 3
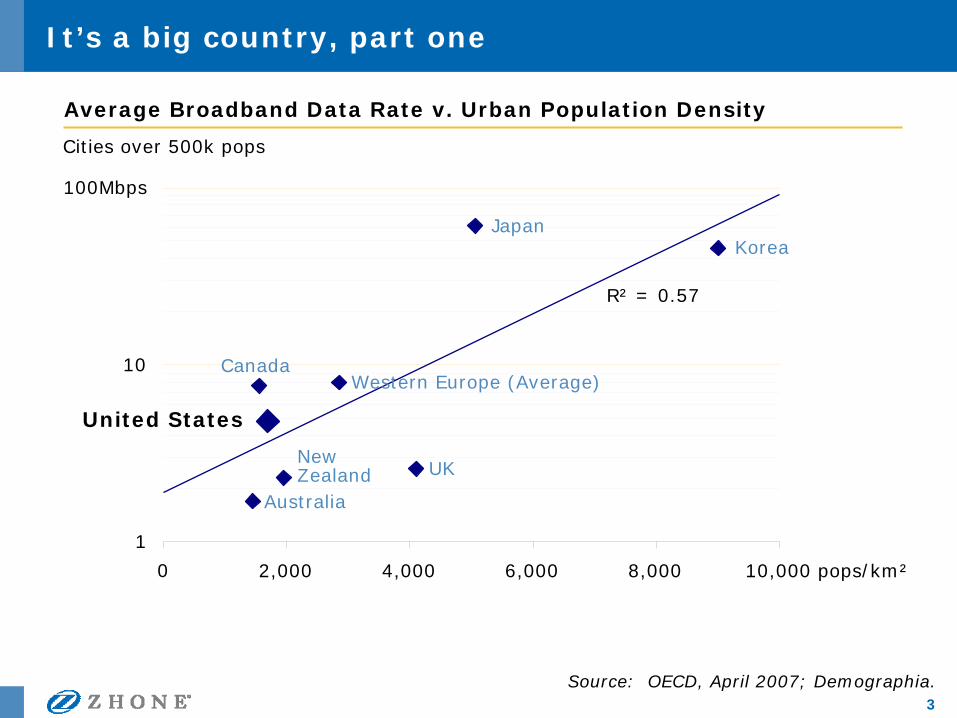
It’s a big country, part one
1
10
100Mbps
0 2,000 4,000 6,000 8,000 10,000 pops/km²
KoreaJapan
Australia
UKNewZealand
United States
CanadaWestern Europe (Average)
R² = 0.57
Average Broadband Data Rate v. Urban Population Density
Source: OECD, April 2007; Demographia.
Cities over 500k pops
PROPRIETARY & CONFIDENTIAL 4
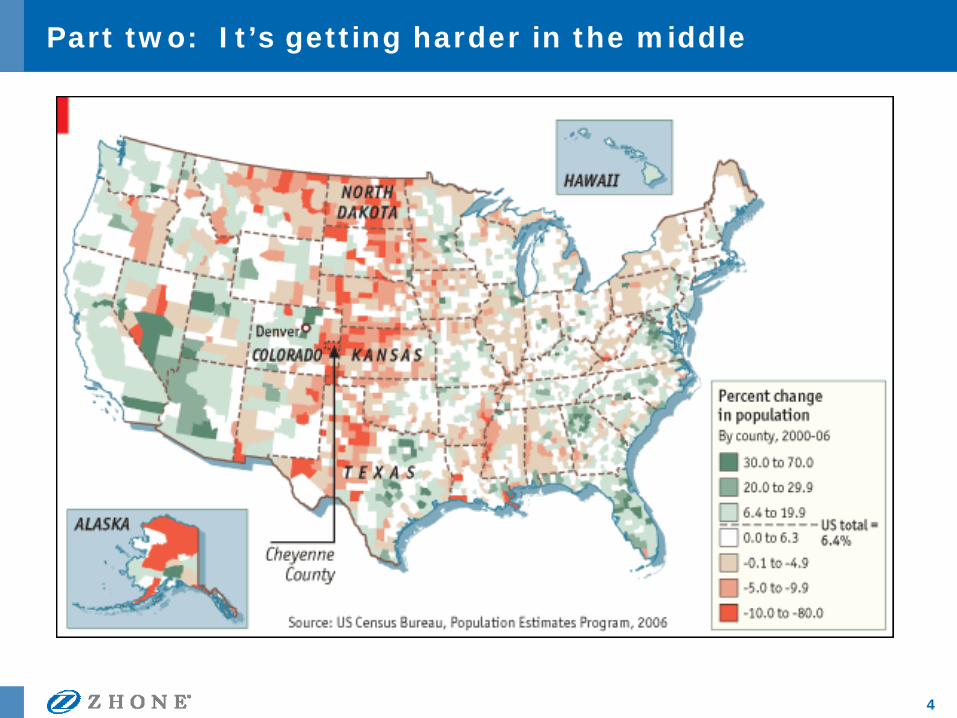
Part two: It’s getting harder in the middle
PROPRIETARY & CONFIDENTIAL 5
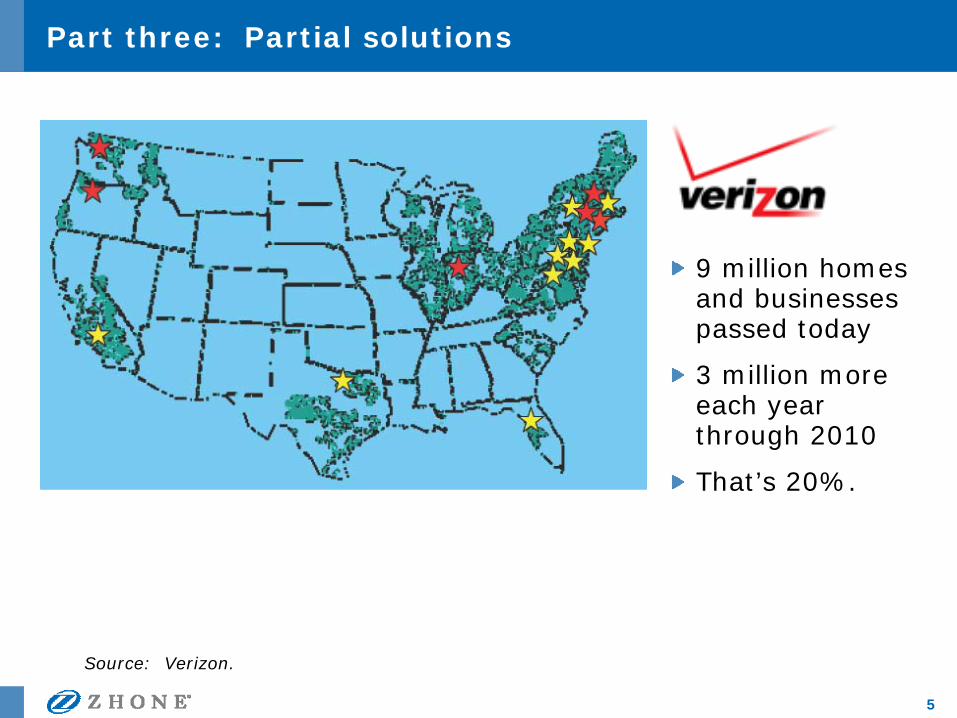
Part three: Partial solutions
9 million homes and businesses passed today
3 million more each year through 2010
That’s 20%.
Source: Verizon.
Clarity
“Access” (a.k.a. the last mile)can be confusing
Some contributions to reduce confusion
• Demand and the future
• Wireline technology
• Wireless technology
Another time: Content, IPTV, VoIP, backbone, ISP partnerships for full or wholesale operator model
PROPRIETARY & CONFIDENTIAL 7
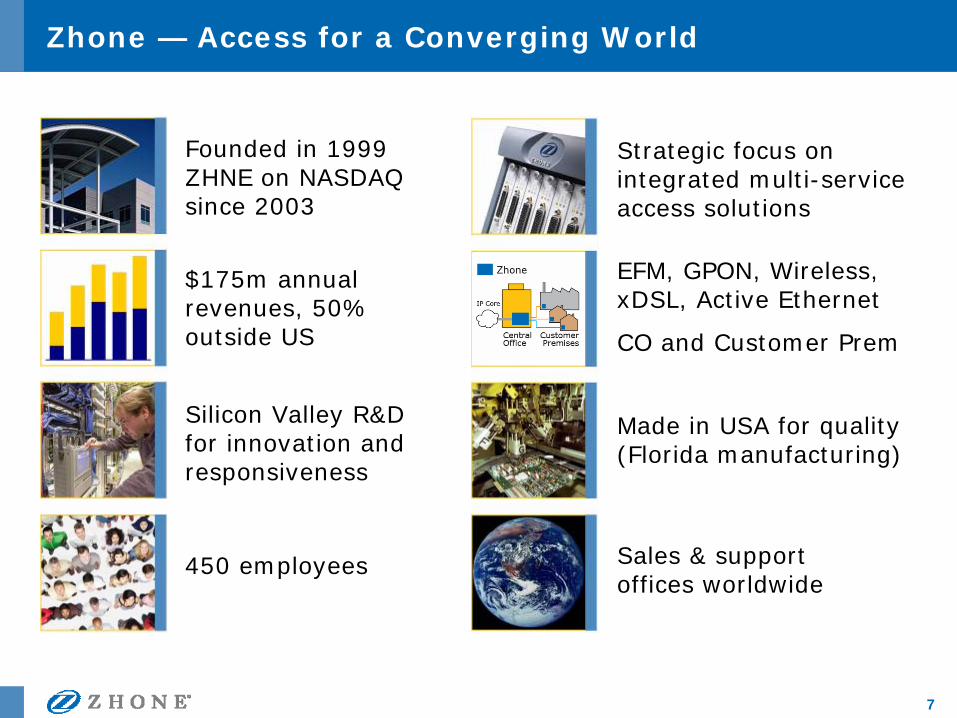
Zhone — Access for a Converging World
Founded in 1999 ZHNE on NASDAQ since 2003
$175m annual revenues, 50% outside US
EFM, GPON, Wireless,xDSL, Active Ethernet
CO and Customer Prem
Silicon Valley R&D for innovation and responsiveness
Made in USA for quality(Florida manufacturing)
450 employees Sales & support offices worldwide
Strategic focus on integrated multi-service access solutions
PROPRIETARY & CONFIDENTIAL 8
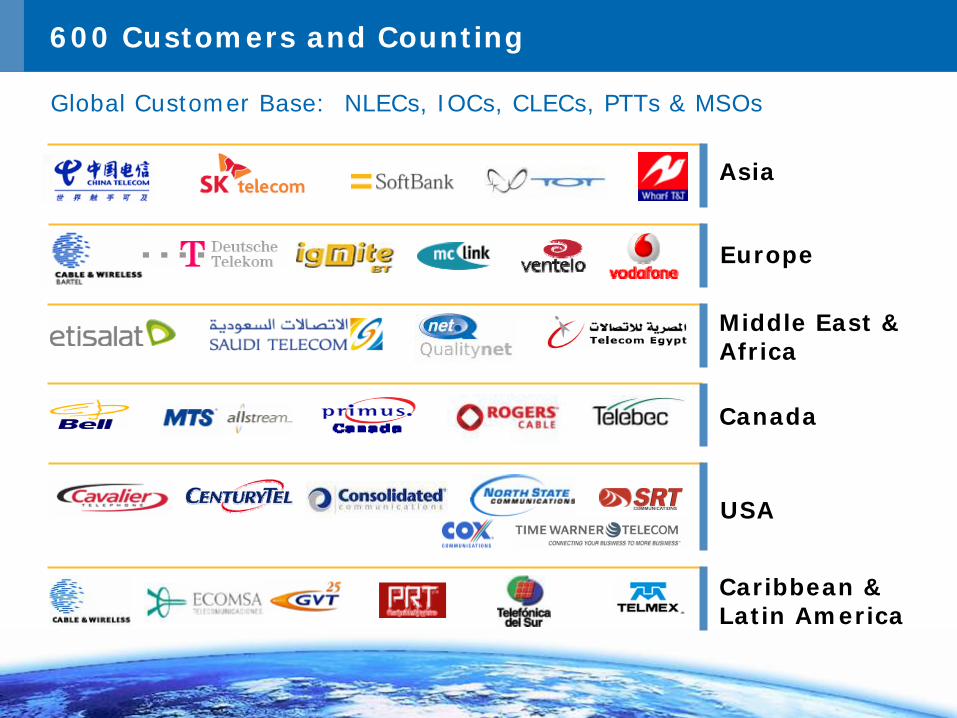
600 Customers and Counting
USA
Global Customer Base: NLECs, IOCs, CLECs, PTTs & MSOs
Canada
Europe
Asia
Middle East &Africa
Caribbean &Latin America
PROPRIETARY & CONFIDENTIAL 9
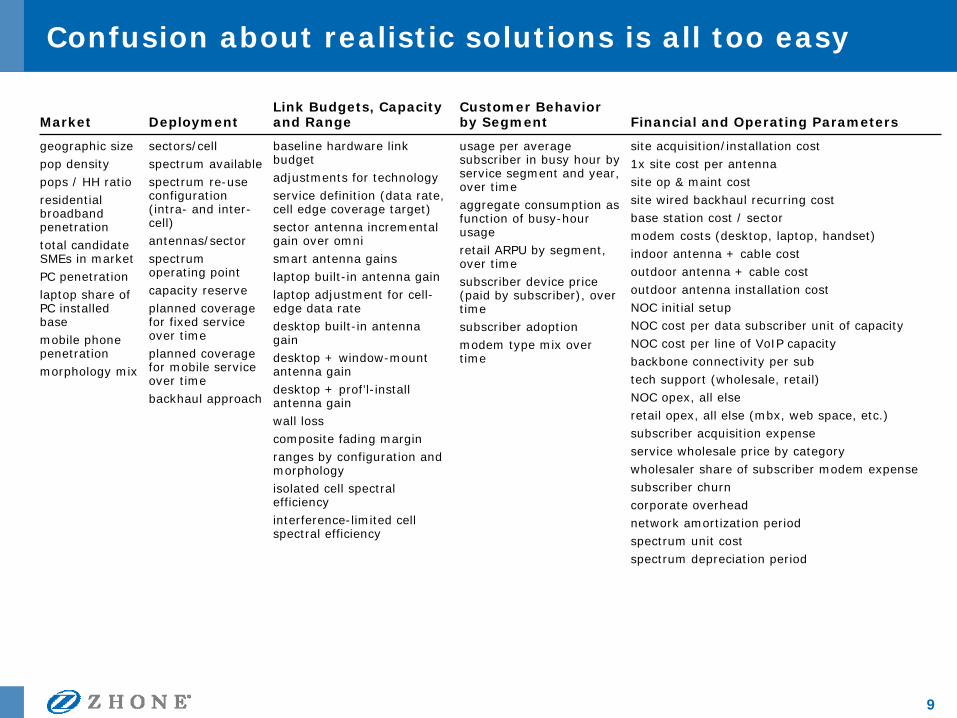
Confusion about realistic solutions is all too easy
site acquisition/installation cost1x site cost per antennasite op & maint costsite wired backhaul recurring costbase station cost / sectormodem costs (desktop, laptop, handset)indoor antenna + cable costoutdoor antenna + cable costoutdoor antenna installation costNOC initial setupNOC cost per data subscriber unit of capacityNOC cost per line of VoIP capacitybackbone connectivity per subtech support (wholesale, retail)NOC opex, all elseretail opex, all else (mbx, web space, etc.)subscriber acquisition expenseservice wholesale price by categorywholesaler share of subscriber modem expensesubscriber churncorporate overheadnetwork amortization periodspectrum unit costspectrum depreciation period
usage per average subscriber in busy hour by service segment and year, over timeaggregate consumption as function of busy-hour usageretail ARPU by segment, over timesubscriber device price (paid by subscriber), over timesubscriber adoptionmodem type mix over time
baseline hardware link budgetadjustments for technologyservice definition (data rate, cell edge coverage target)sector antenna incremental gain over omnismart antenna gainslaptop built-in antenna gainlaptop adjustment for cell-edge data ratedesktop built-in antenna gaindesktop + window-mount antenna gaindesktop + prof’l-install antenna gainwall losscomposite fading marginranges by configuration and morphologyisolated cell spectral efficiencyinterference-limited cell spectral efficiency
sectors/cellspectrum availablespectrum re-use configuration (intra- and inter-cell)antennas/sectorspectrum operating pointcapacity reserveplanned coverage for fixed service over timeplanned coverage for mobile service over timebackhaul approach
geographic sizepop densitypops / HH ratioresidential broadband penetrationtotal candidate SMEs in marketPC penetrationlaptop share of PC installed basemobile phone penetrationmorphology mix
Financial and Operating ParametersCustomer Behavior by Segment
Link Budgets, Capacity and RangeDeploymentMarket
PROPRIETARY & CONFIDENTIAL 10
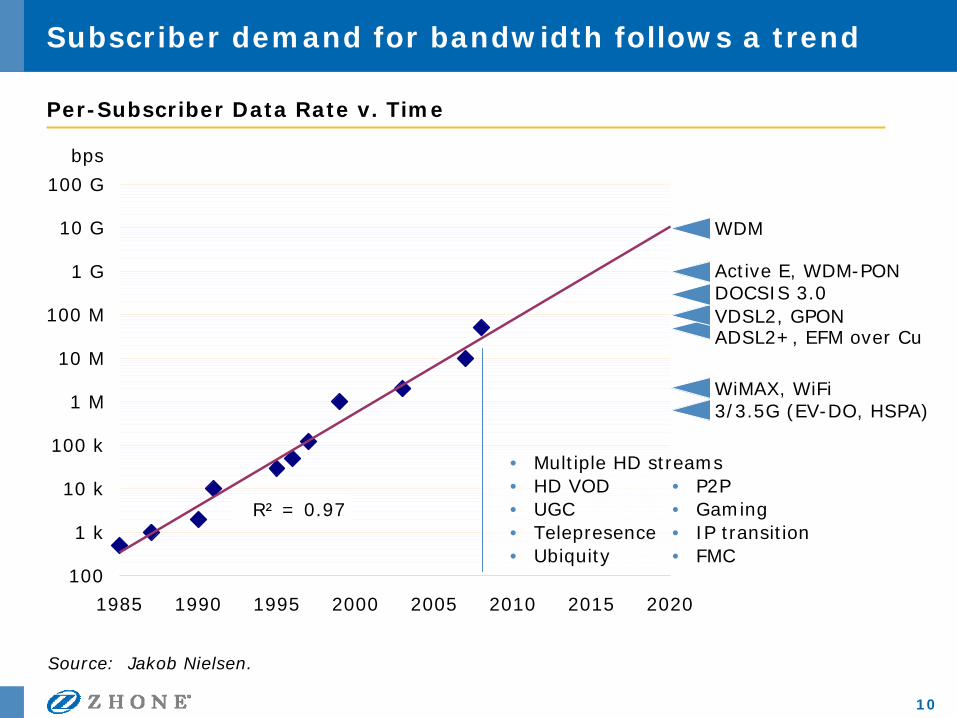
Subscriber demand for bandwidth follows a trend
Source: Jakob Nielsen.
1985 1990 1995 2000 2005 2010 2015 2020
100
1 k
10 k
100 k
1 M
10 M
100 M
1 G
10 G
100 G
bps
R² = 0.97
3/3.5G (EV-DO, HSPA)WiMAX, WiFi
ADSL2+, EFM over CuVDSL2, GPON
WDM
DOCSIS 3.0Active E, WDM-PON
Per-Subscriber Data Rate v. Time
• Multiple HD streams• HD VOD• UGC• Telepresence• Ubiquity
• P2P• Gaming• IP transition• FMC
PROPRIETARY & CONFIDENTIAL 11
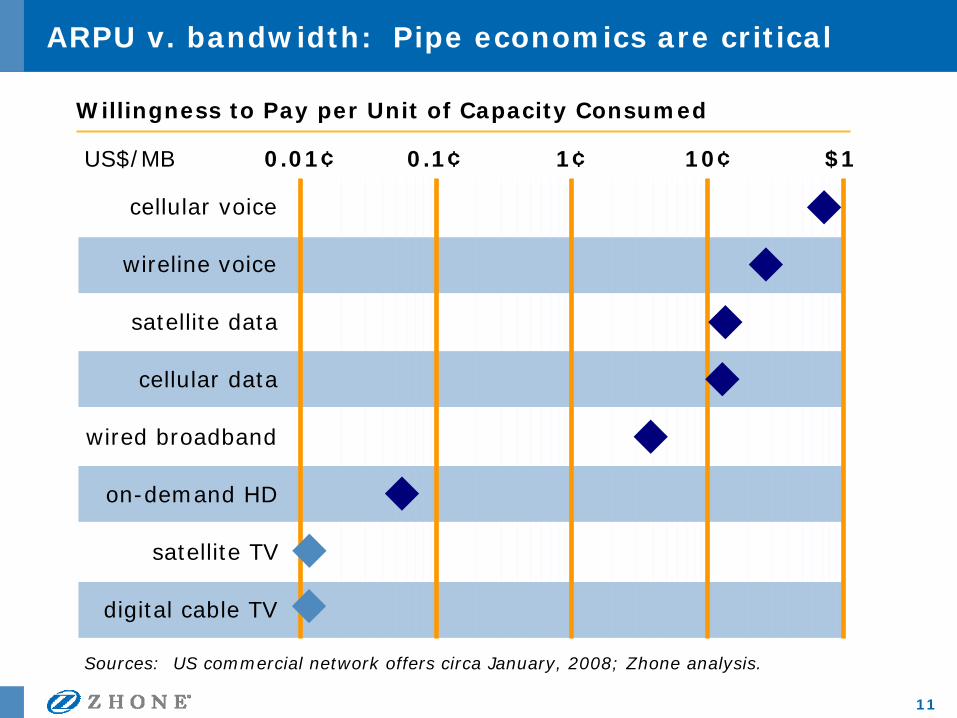
ARPU v. bandwidth: Pipe economics are critical
cellular voice
wireline voice
satellite data
cellular data
wired broadband
on-demand HD
satellite TV
digital cable TV
10¢ $11¢0.1¢0.01¢
Willingness to Pay per Unit of Capacity Consumed
US$/MB
Sources: US commercial network offers circa January, 2008; Zhone analysis.
Clarity
“Access” can be confusing
Some contributions to help
• Demand and the future
• Wireline technology
• Wireless technology
PROPRIETARY & CONFIDENTIAL 13
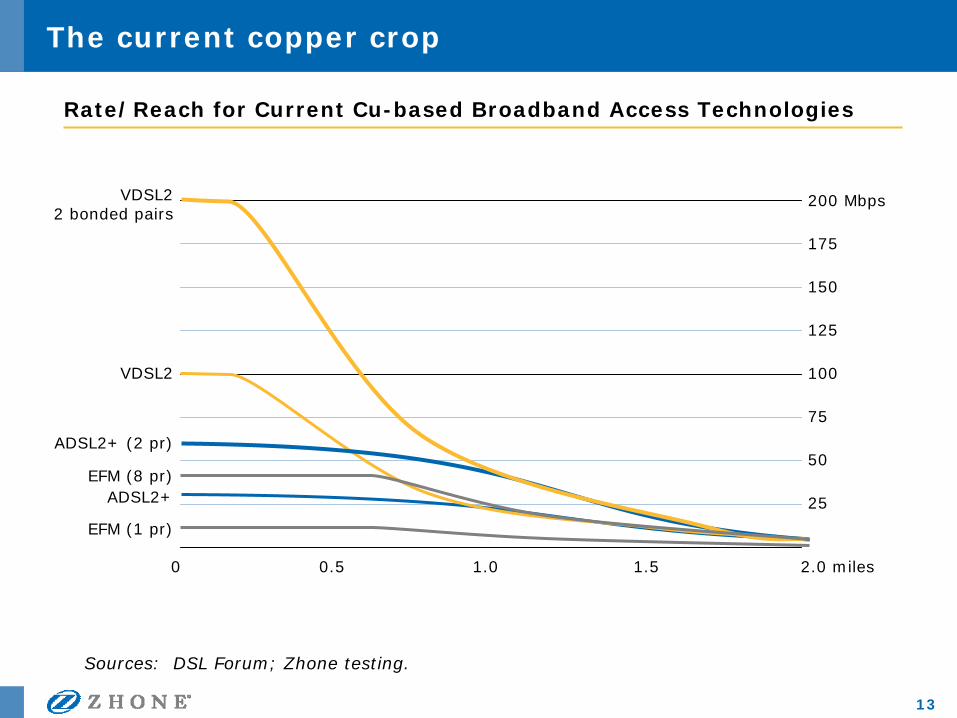
The current copper crop
Rate/Reach for Current Cu-based Broadband Access Technologies
25
50
75
100
125
150
175
200 Mbps
Sources: DSL Forum; Zhone testing.
VDSL22 bonded pairs
VDSL2
ADSL2+ (2 pr)
EFM (8 pr)ADSL2+
EFM (1 pr)
0 1.0 2.0 miles0.5 1.5
PROPRIETARY & CONFIDENTIAL 14
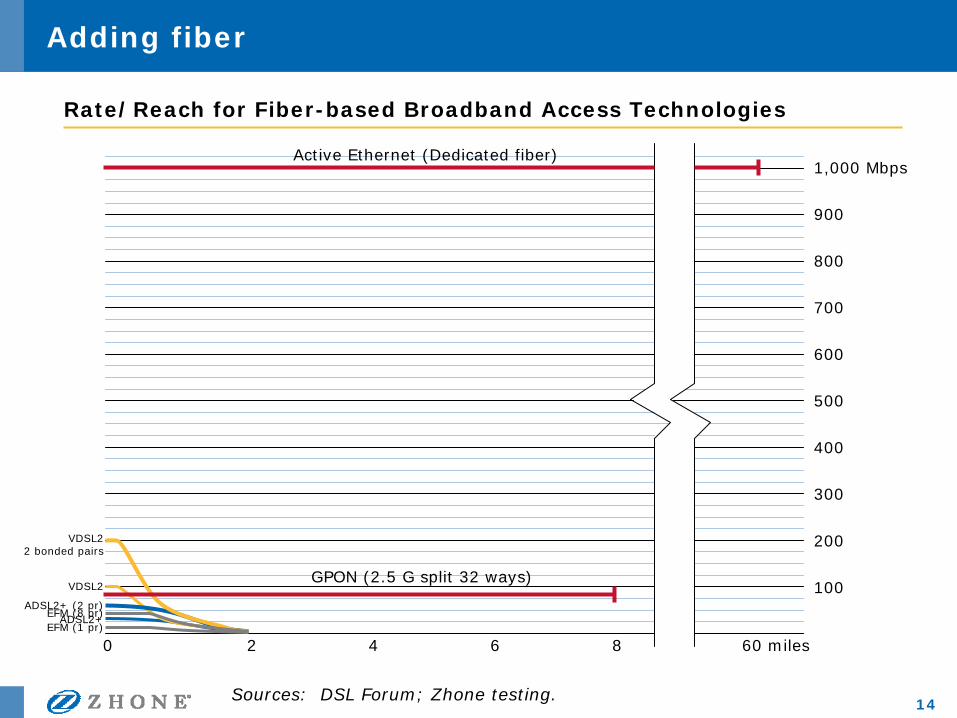
Adding fiber
Rate/Reach for Fiber-based Broadband Access Technologies
Sources: DSL Forum; Zhone testing.
0 2
100
200VDSL22 bonded pairs
VDSL2
ADSL2+ (2 pr)EFM (8 pr)ADSL2+EFM (1 pr)
1,000 Mbps
300
400
500
600
700
800
900
60 miles4 6 8
GPON (2.5 G split 32 ways)
Active Ethernet (Dedicated fiber)
PROPRIETARY & CONFIDENTIAL 15
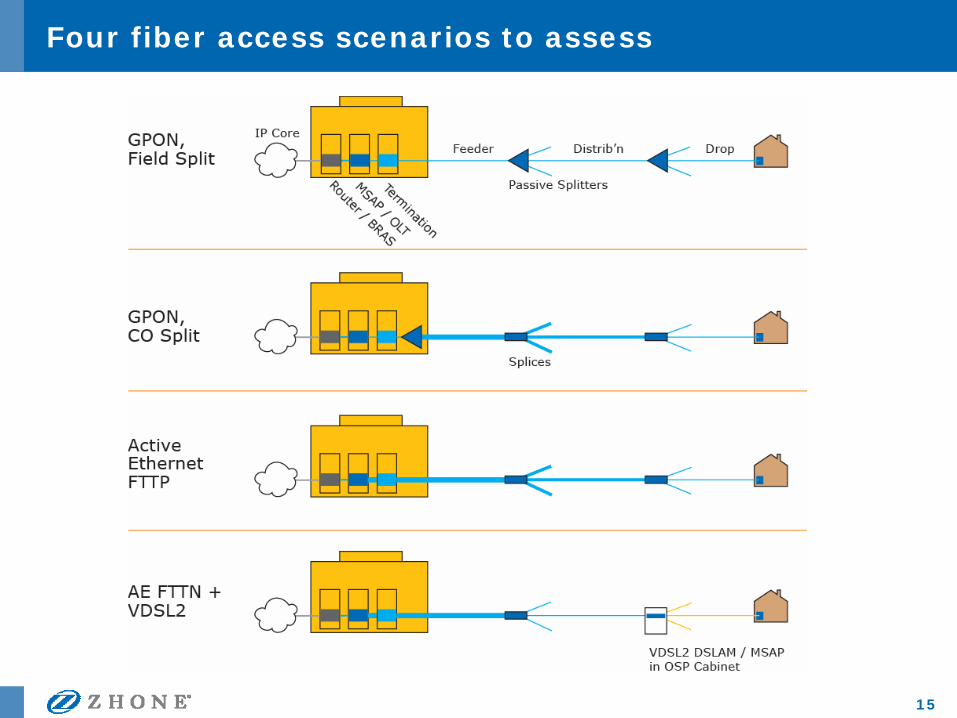
Four fiber access scenarios to assess
PROPRIETARY & CONFIDENTIAL 16
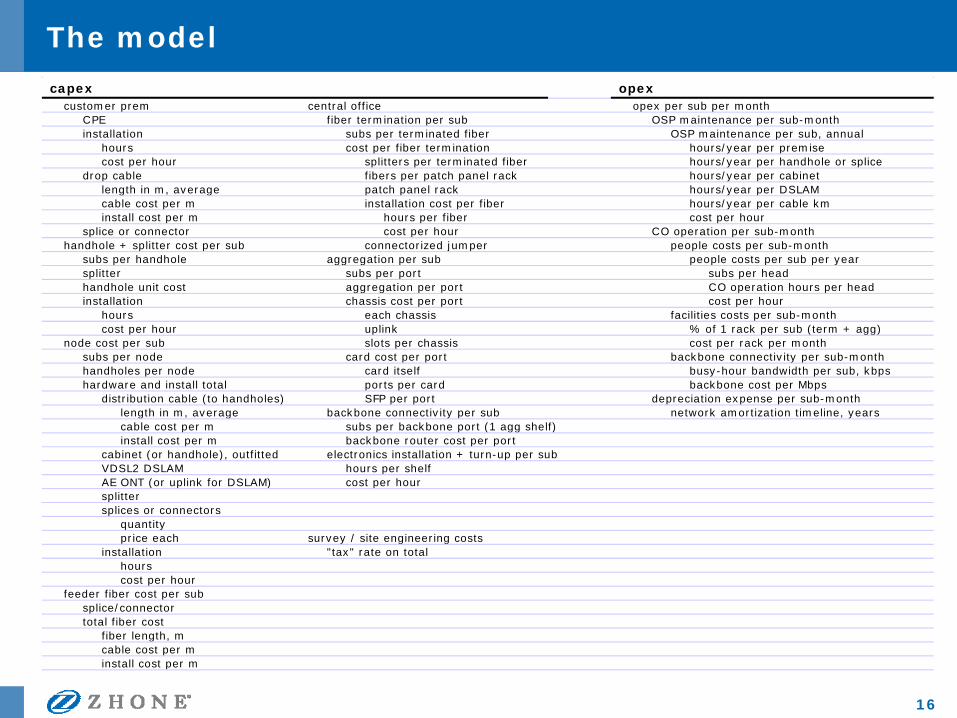
The model
capex opexcustomer prem central office opex per sub per month
CPE fiber termination per sub OSP maintenance per sub-monthinstallation subs per terminated fiber OSP maintenance per sub, annual
hours cost per fiber termination hours/year per premisecost per hour splitters per terminated fiber hours/year per handhole or splice
drop cable fibers per patch panel rack hours/year per cabinetlength in m, average patch panel rack hours/year per DSLAMcable cost per m installation cost per fiber hours/year per cable kminstall cost per m hours per fiber cost per hour
splice or connector cost per hour CO operation per sub-monthhandhole + splitter cost per sub connectorized jumper people costs per sub-month
subs per handhole aggregation per sub people costs per sub per yearsplitter subs per port subs per headhandhole unit cost aggregation per port CO operation hours per headinstallation chassis cost per port cost per hour
hours each chassis facilities costs per sub-monthcost per hour uplink % of 1 rack per sub (term + agg)
node cost per sub slots per chassis cost per rack per monthsubs per node card cost per port backbone connectivity per sub-monthhandholes per node card itself busy-hour bandwidth per sub, kbpshardware and install total ports per card backbone cost per Mbps
distribution cable (to handholes) SFP per port depreciation expense per sub-monthlength in m, average backbone connectivity per sub network amortization timeline, yearscable cost per m subs per backbone port (1 agg shelf)install cost per m backbone router cost per port
cabinet (or handhole), outfitted electronics installation + turn-up per subVDSL2 DSLAM hours per shelfAE ONT (or uplink for DSLAM) cost per hoursplittersplices or connectors
quantityprice each survey / site engineering costs
installation "tax" rate on totalhourscost per hour
feeder fiber cost per subsplice/connectortotal fiber cost
fiber length, mcable cost per minstall cost per m
PROPRIETARY & CONFIDENTIAL 17
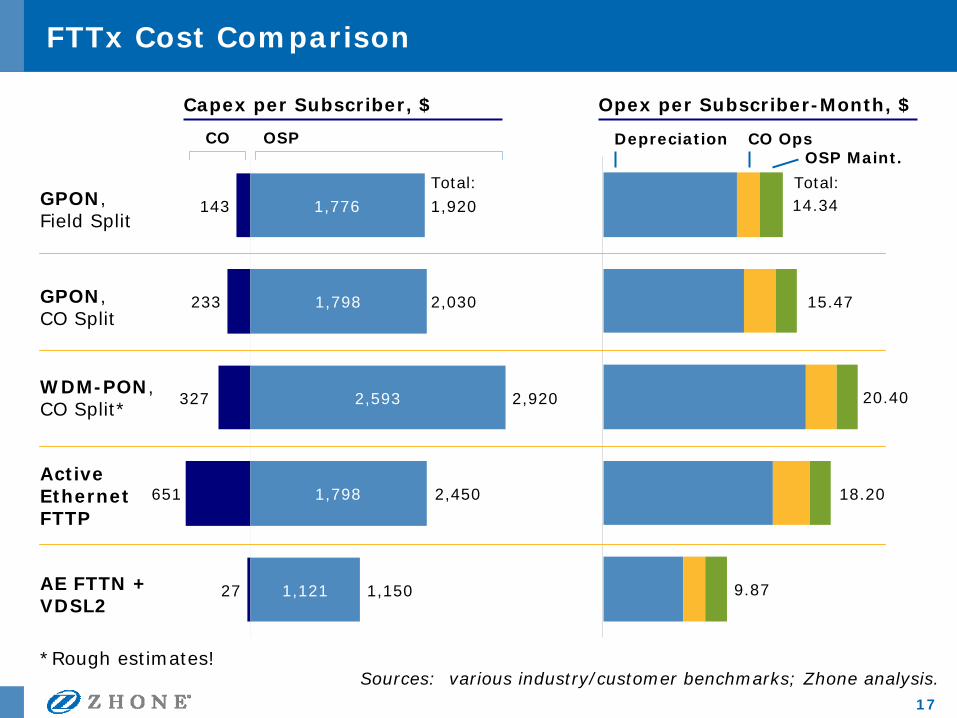
FTTx Cost Comparison
27
651
327
233
143
1,121
1,798
2,593
1,798
1,776
AE FTTN +VDSL2
ActiveEthernetFTTP
WDM-PON,CO Split*
GPON,CO Split
GPON,Field Split
9.87
18.20
20.40
15.47
14.34
CO OSP
Capex per Subscriber, $ Opex per Subscriber-Month, $
1,150
2,450
2,920
2,030
1,920Total:
Depreciation
Total:
CO OpsOSP Maint.
*Rough estimates!Sources: various industry/customer benchmarks; Zhone analysis.
PROPRIETARY & CONFIDENTIAL 18
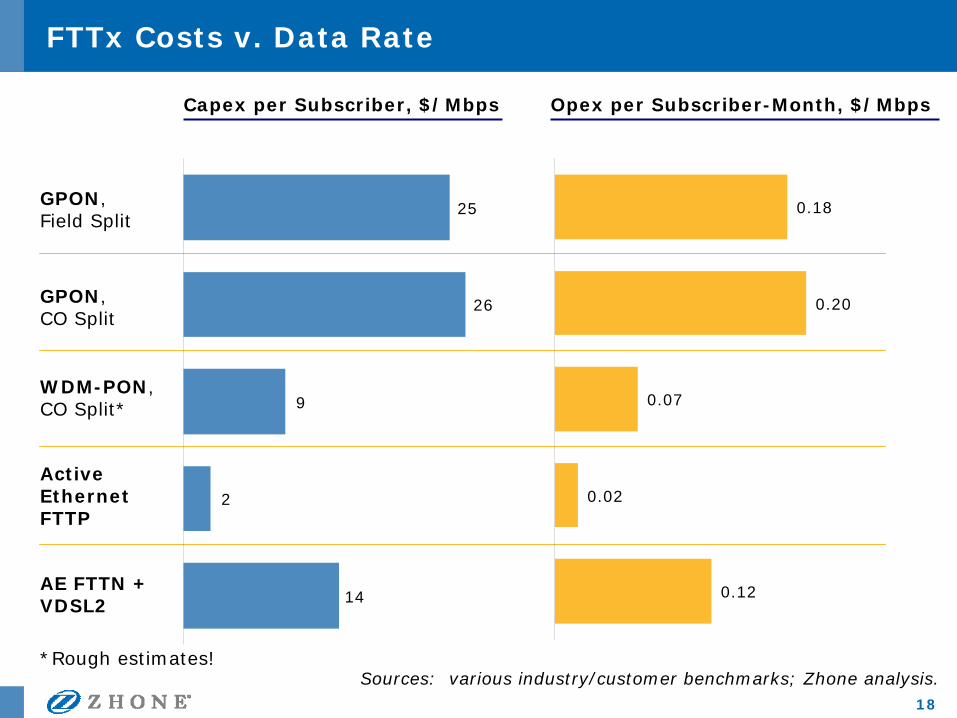
FTTx Costs v. Data Rate
AE FTTN +VDSL2
ActiveEthernetFTTP
WDM-PON,CO Split*
GPON,CO Split
GPON,Field Split
Capex per Subscriber, $/Mbps Opex per Subscriber-Month, $/Mbps
*Rough estimates!Sources: various industry/customer benchmarks; Zhone analysis.
14
2
9
26
25
0.12
0.02
0.07
0.20
0.18
PROPRIETARY & CONFIDENTIAL 19
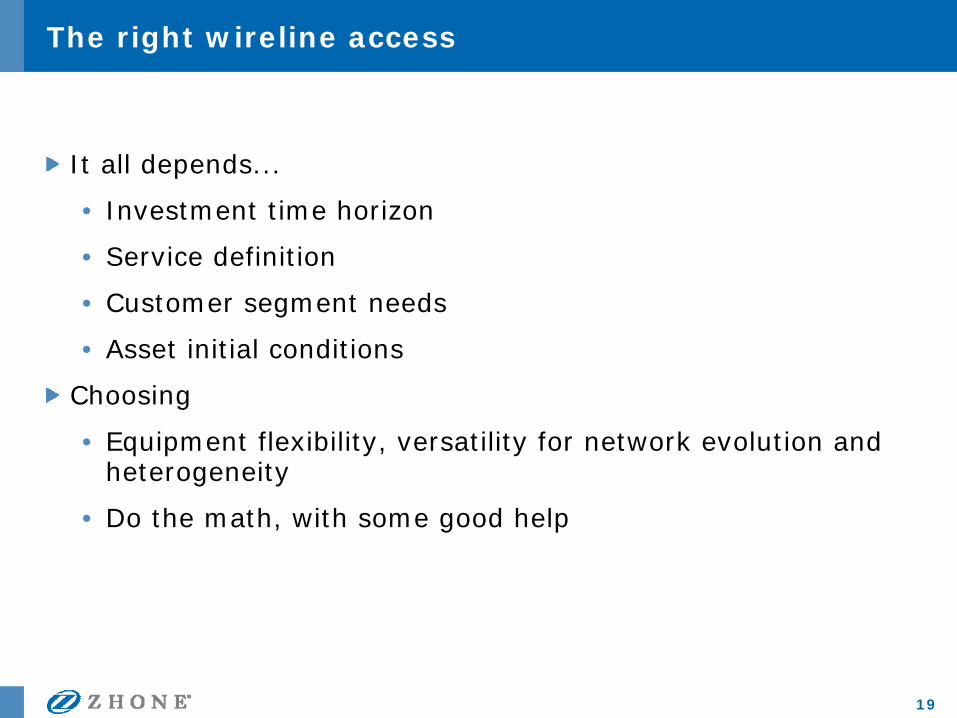
The right wireline access
It all depends...
• Investment time horizon
• Service definition
• Customer segment needs
• Asset initial conditions
Choosing
• Equipment flexibility, versatility for network evolution and heterogeneity
• Do the math, with some good help
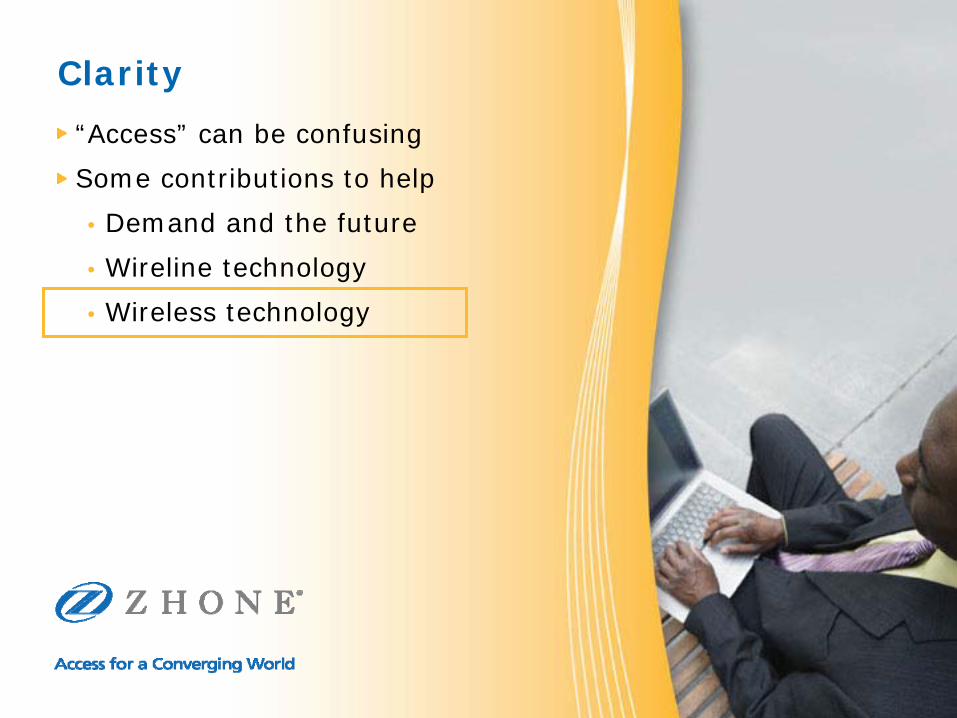
Clarity
“Access” can be confusing
Some contributions to help
• Demand and the future
• Wireline technology
• Wireless technology
PROPRIETARY & CONFIDENTIAL 21
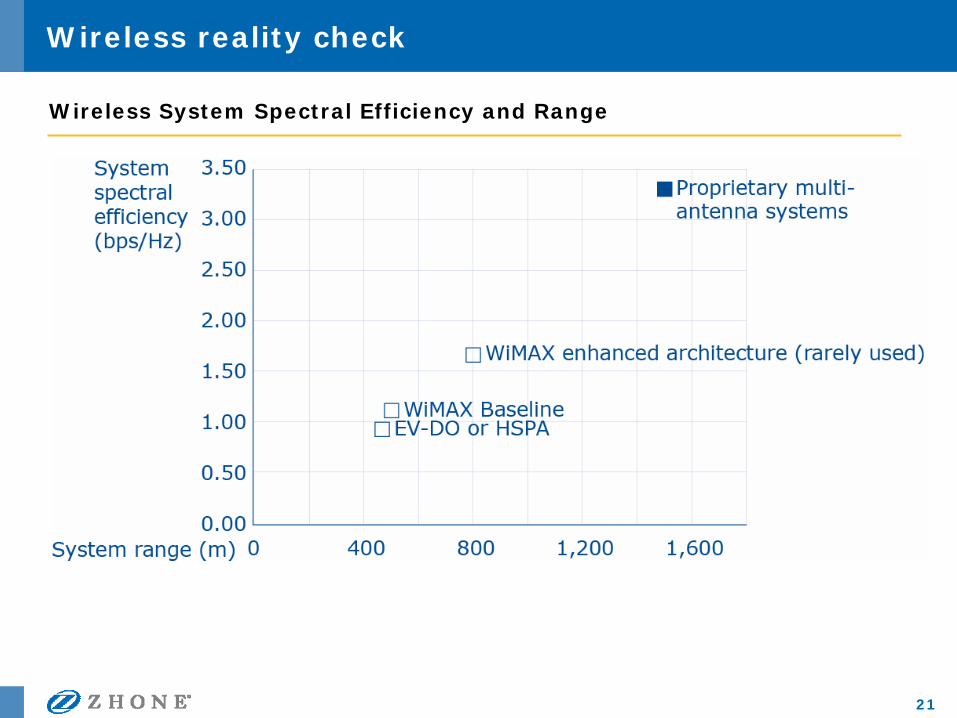
Wireless reality check
Wireless System Spectral Efficiency and Range
PROPRIETARY & CONFIDENTIAL 22
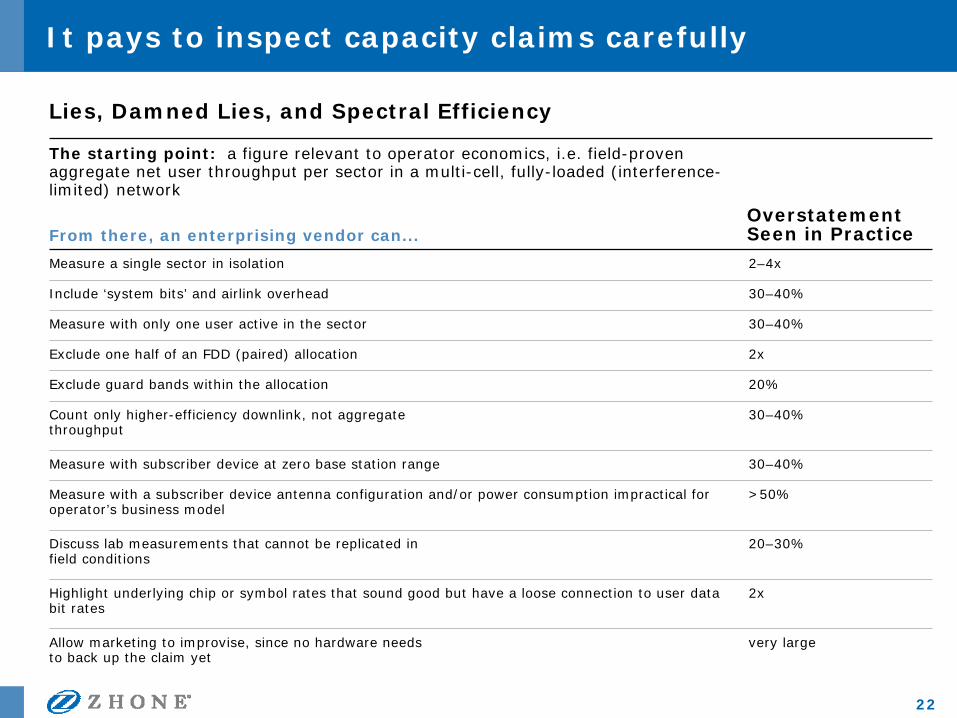
It pays to inspect capacity claims carefully
>50%Measure with a subscriber device antenna configuration and/or power consumption impractical for operator’s business model
2xHighlight underlying chip or symbol rates that sound good but have a loose connection to user data bit rates
30–40%Measure with only one user active in the sector
30–40%Include ‘system bits’ and airlink overhead
very largeAllow marketing to improvise, since no hardware needsto back up the claim yet
20–30%Discuss lab measurements that cannot be replicated infield conditions
30–40%Measure with subscriber device at zero base station range
30–40%Count only higher-efficiency downlink, not aggregatethroughput
20%Exclude guard bands within the allocation
From there, an enterprising vendor can...
2xExclude one half of an FDD (paired) allocation
2–4xMeasure a single sector in isolation
The starting point: a figure relevant to operator economics, i.e. field-proven aggregate net user throughput per sector in a multi-cell, fully-loaded (interference-limited) network
Lies, Damned Lies, and Spectral Efficiency
Overstatement Seen in Practice
PROPRIETARY & CONFIDENTIAL 23
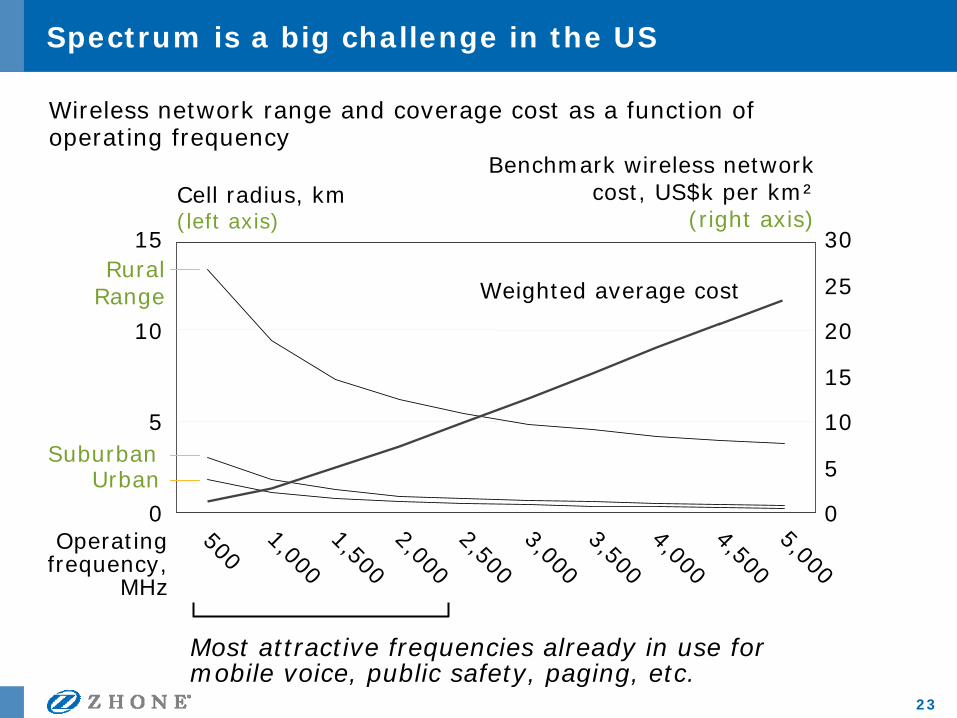
Spectrum is a big challenge in the US
0
5
10
15
500
1,0001,5002,0002,5003,0003,5004,0004,5005,000
0
5
10
15
20
25
30
Cell radius, km(left axis)
Benchmark wireless network cost, US$k per km²
(right axis)
Operating frequency,
MHz
Most attractive frequencies already in use for mobile voice, public safety, paging, etc.
RuralRange
SuburbanUrban
Weighted average cost
Wireless network range and coverage cost as a function of operating frequency
PROPRIETARY & CONFIDENTIAL 24
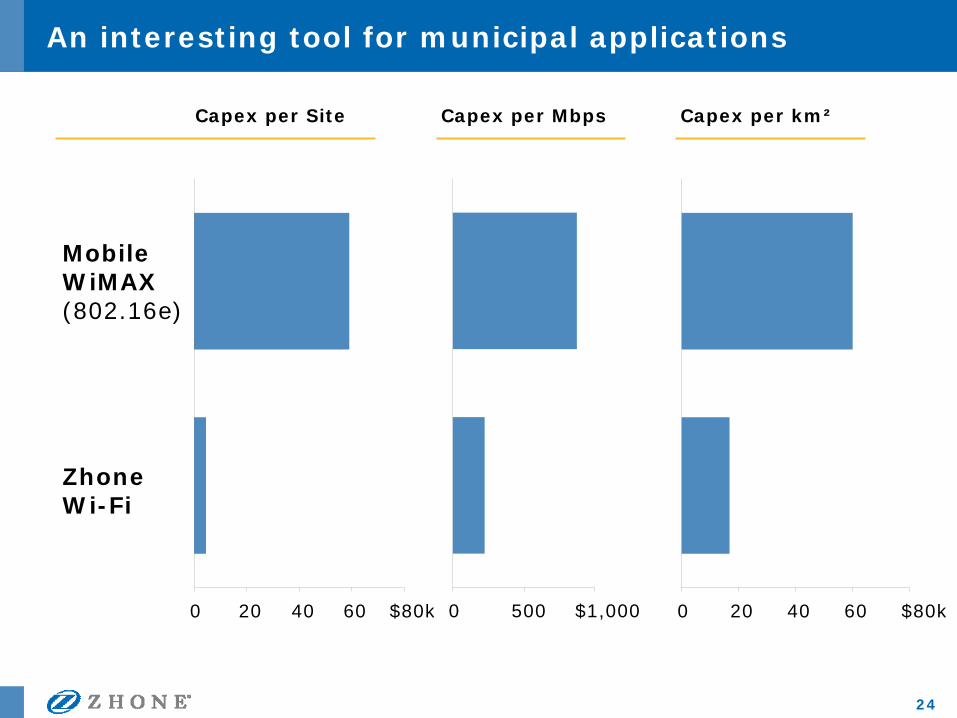
An interesting tool for municipal applications
0 20 40 60 $80k
ZhoneWi-Fi
MobileWiMAX(802.16e)
0 500 $1,000 0 20 40 60 $80k
Capex per Site Capex per Mbps Capex per km²
PROPRIETARY & CONFIDENTIAL 25
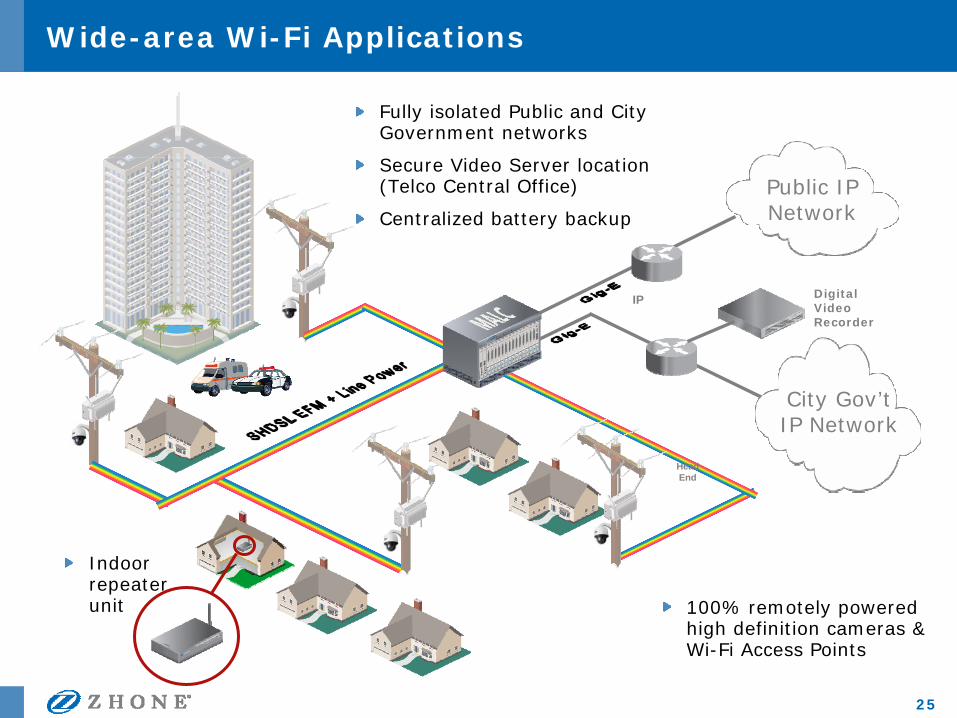
Public IP Network
City Gov’tIP Network
HeadEnd
IP Digital Video Recorder
Wide-area Wi-Fi Applications
100% remotely powered high definition cameras & Wi-Fi Access Points
Fully isolated Public and City Government networks
Secure Video Server location (Telco Central Office)
Centralized battery backup
Indoor repeater unit
PROPRIETARY & CONFIDENTIAL 26
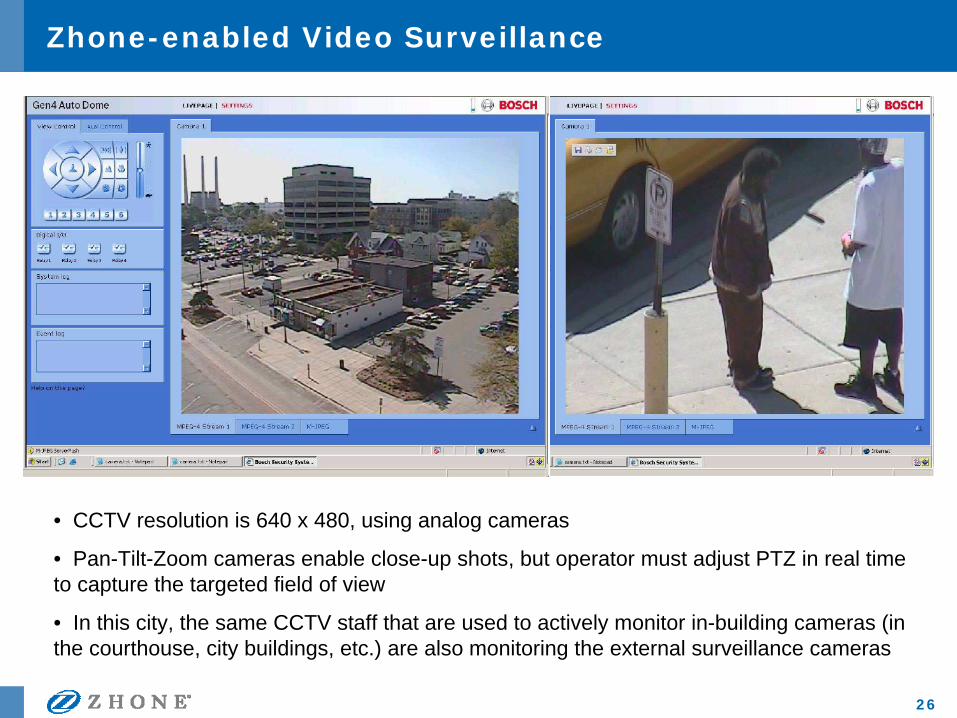
Zhone-enabled Video Surveillance
• CCTV resolution is 640 x 480, using analog cameras
• Pan-Tilt-Zoom cameras enable close-up shots, but operator must adjust PTZ in real time to capture the targeted field of view
• In this city, the same CCTV staff that are used to actively monitor in-building cameras (in the courthouse, city buildings, etc.) are also monitoring the external surveillance cameras
PROPRIETARY & CONFIDENTIAL 27
In Sum
Access technology holds great promise for economic development and service innovation
There are many choices, best made carefully
The better solutions provide flexibility, support evolution
We and our partners are here to help
Thank YouFor more info, come see us in booth 36/37