Embed Size (px)
Citation preview
Steve Varnedoe
Condition Assessment & Funding Needs
for
North Carolina’s Highway System
North Carolina Department of Transportation
Report to the
Joint Legislative Transportation Oversight Committee
January 14, 2003

Condition Assessment & Funding Needs For North Carolina’s Highway System
• Reporting Requirements• Overview of the System• Assessment Methodologies• Current Conditions• Funding Needs• Maintenance Operational Improvements

Biennial Report on Maintenance Requirements. G.S. 136-44.3
• The annual cost of routine maintenance
• The cost of eliminating maintenance backlog
• Annual resurfacing cost based on a 12-year cycle for
primary roads and a 15-year cycle for other systems
• The cost of eliminating any resurfacing backlog

Since the Highway Trust Fund was enacted:Since the Highway Trust Fund was enacted:
1989• 76,808 road miles
• 127,809 paved lane miles
• 16,104 miles of unpaved roads
• 16,900 structures
• 61.1 M sf bridge deck area
1989• 76,808 road miles
• 127,809 paved lane miles
• 16,104 miles of unpaved roads
• 16,900 structures
• 61.1 M sf bridge deck area
2003• 78,347 road miles
• 155,960 paved lane miles
• 6,644 miles of unpaved roads
• 17,463 structures
• 72.3 M sf bridge deck area
2003• 78,347 road miles
• 155,960 paved lane miles
• 6,644 miles of unpaved roads
• 17,463 structures
• 72.3 M sf bridge deck area
North Carolina State Highway SystemNorth Carolina State Highway System
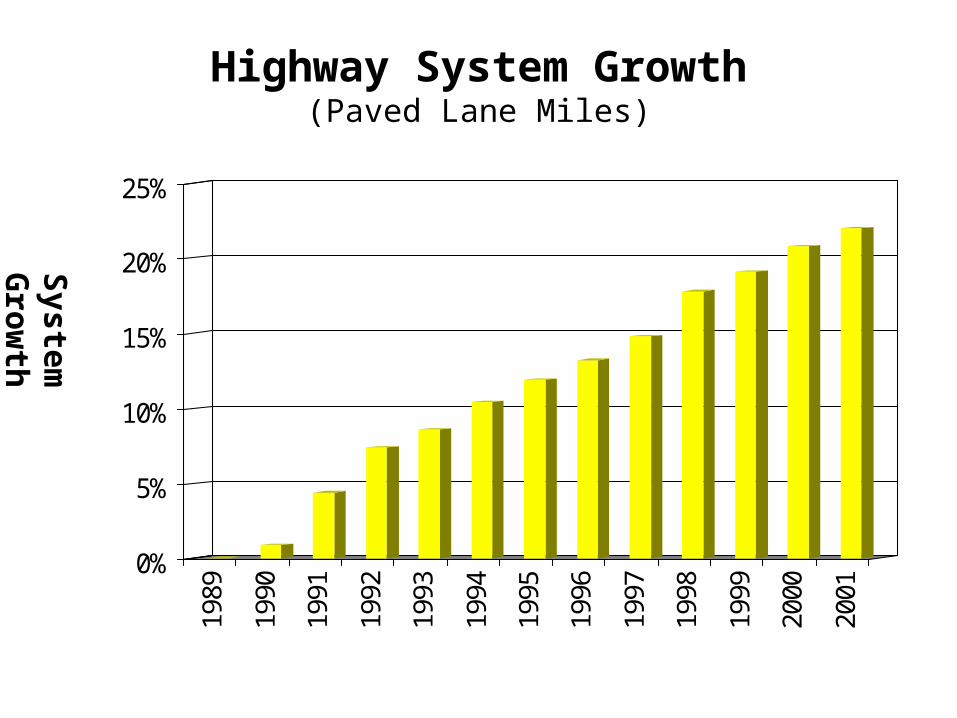
Highway System Growth(Paved Lane Miles)
0%
5%
10%
15%
20%
25%19
89
1990
1991
1992
1993
1994
1995
1996
1997
1998
1999
2000
2001
System
G
row
th

Bridge System Growth(Square Feet of Bridge Deck)
0%2%4%6%8%
10%12%14%16%18%20%
1989
1990
1991
1992
1993
1994
1995
1996
1997
1998
1999
2000
2001
Deck A
rea G
row
th

Highway System Usage(Vehicle Miles Traveled)
Gro
wth
0%5%
10%15%20%25%30%35%40%45%50%
19
89
19
91
19
93
19
95
19
97
19
99
20
01
Vehicle Miles Traveled Paved Lane Miles
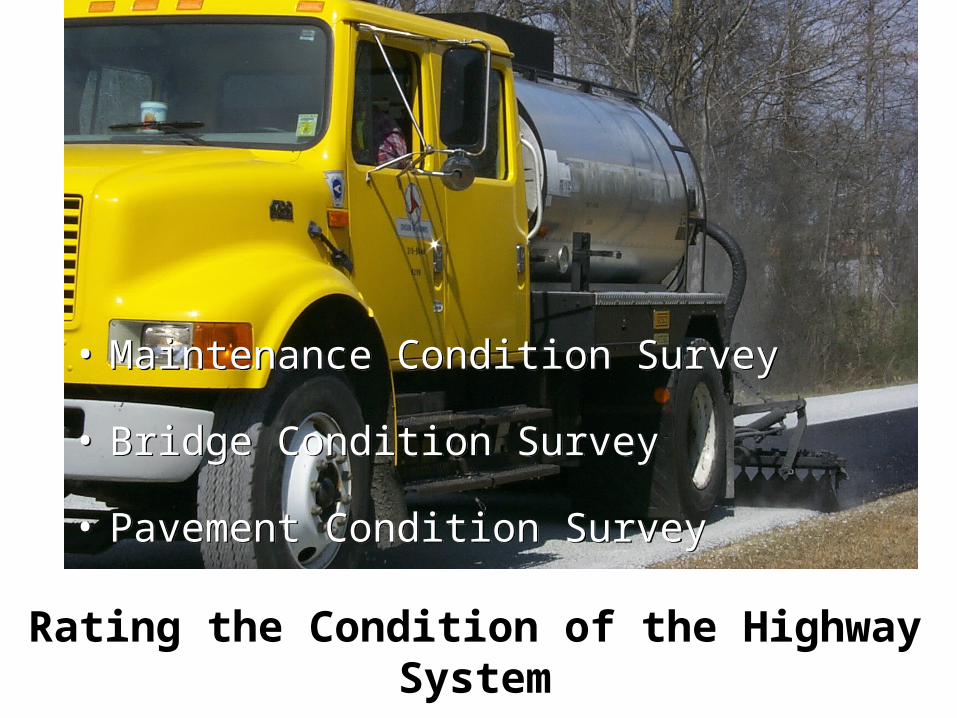
Rating the Condition of the Highway System
• Maintenance Condition Survey
• Bridge Condition Survey
• Pavement Condition Survey
• Maintenance Condition Survey
• Bridge Condition Survey
• Pavement Condition Survey

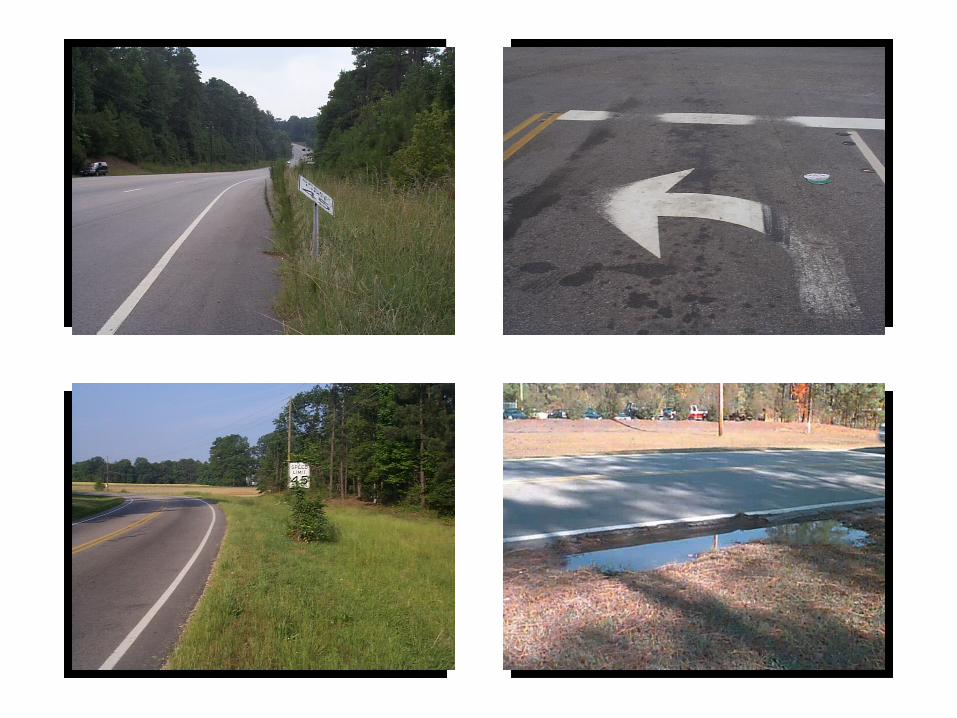
Maintenance Condition Elements
RoadwayLow ShoulderHigh ShoulderLateral DitchesLateral Ditch
Erosion
DrainageCrossline PipeDriveway PipeCurb & GutterCatch Basin &
Drop InletsOther Drainage
Features
Roadside MowingBrush and Tree
ControlLitter & DebrisSlopeGuardrail
Traffic Control DevicesTraffic SignsPavement StripingWords and SymbolsPavement Markers
EnvironmentalTurf ConditionMiscellaneous
Vegetation Management
PavementFlexibleRigid
BridgeDecksRailsExpansion JointsSuperstructureSubstructure

Roadway Performance Measures(Interstate)
ElementPavement
Shoulders/Ditches
Roadside
Drainage
Traffic Control Devices
Environmental
Total
Target93
88
88
88
88
88
90
Actual86
74
70
73
68
47
76
Scale 1-100

RoadwayLevel of Service
(2002 Survey)
Interstate Primary Urban SecondaryF
D
C
B
A
90
82 82 82
76 73 74 76

Performance Measure Trends(Roadway)
64
66
68
70
72
74
76
78
80
82
1998 1999 2000 2002
InterstatePrimarySecondaryUrban
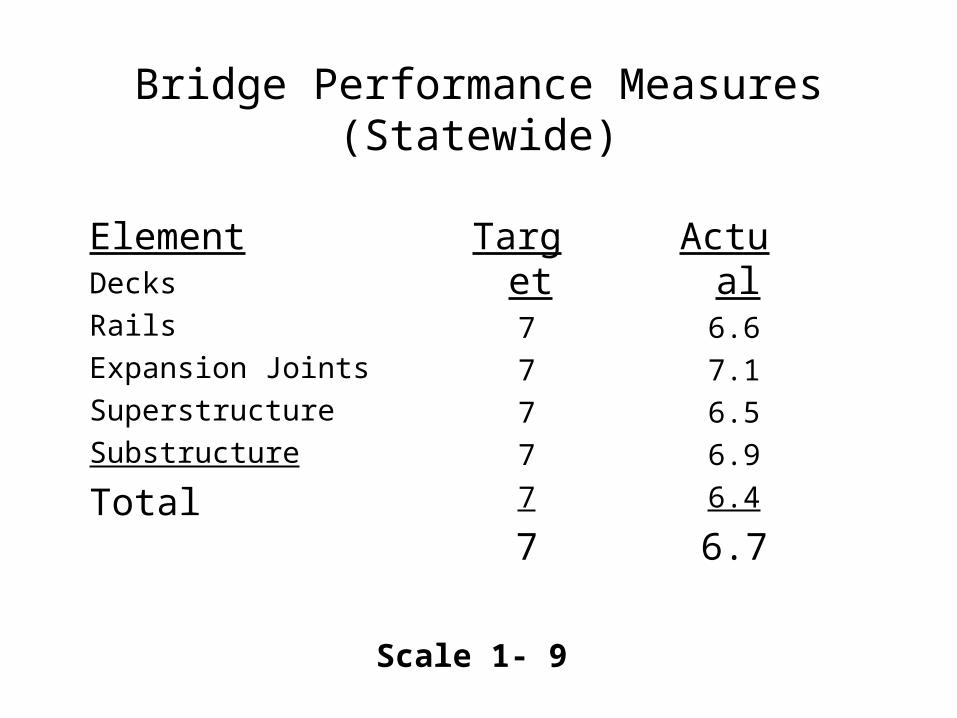
Bridge Performance Measures(Statewide)
ElementDecks
Rails
Expansion Joints
Superstructure
Substructure
Total
Target7
7
7
7
7
7
Actual6.6
7.1
6.5
6.9
6.4
6.7
Scale 1- 9

Bridge Performance Measures(Statewide)
ElementDecks
Rails
Expansion Joints
Superstructure
Substructure
Total
Target7
7
7
7
7
7
Actual6.6
7.1
6.5
6.9
6.4
6.7
Scale 1- 9
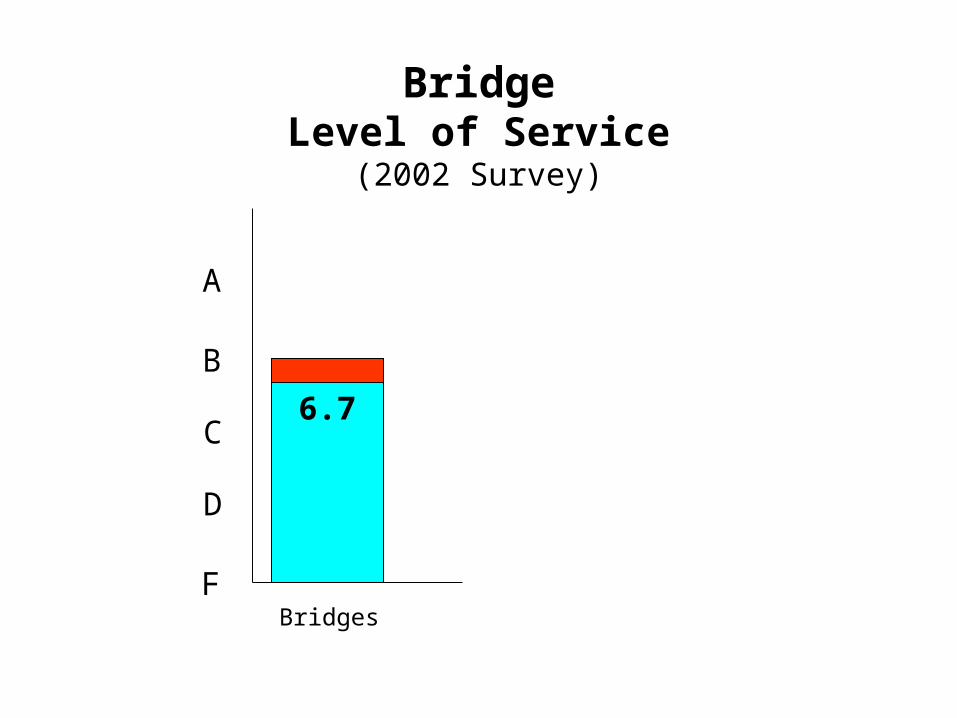
BridgeLevel of Service
(2002 Survey)
F
D
C
B
A
Bridges
76.7

Performance Measure Trends(Bridge)
5
5.5
6
6.5
7
7.5
8
1998 1999 2000 2002
Statewide

Pavement Preventive Maintenance
Program has doubled since 2000
2002 - 2800 miles at $ 31.3 million
Program has doubled since 2000
2002 - 2800 miles at $ 31.3 million
RetreatmentRetreatment
Goal - 5000 miles per year at $ 77.5 millionGoal - 5000 miles per year at $ 77.5 million
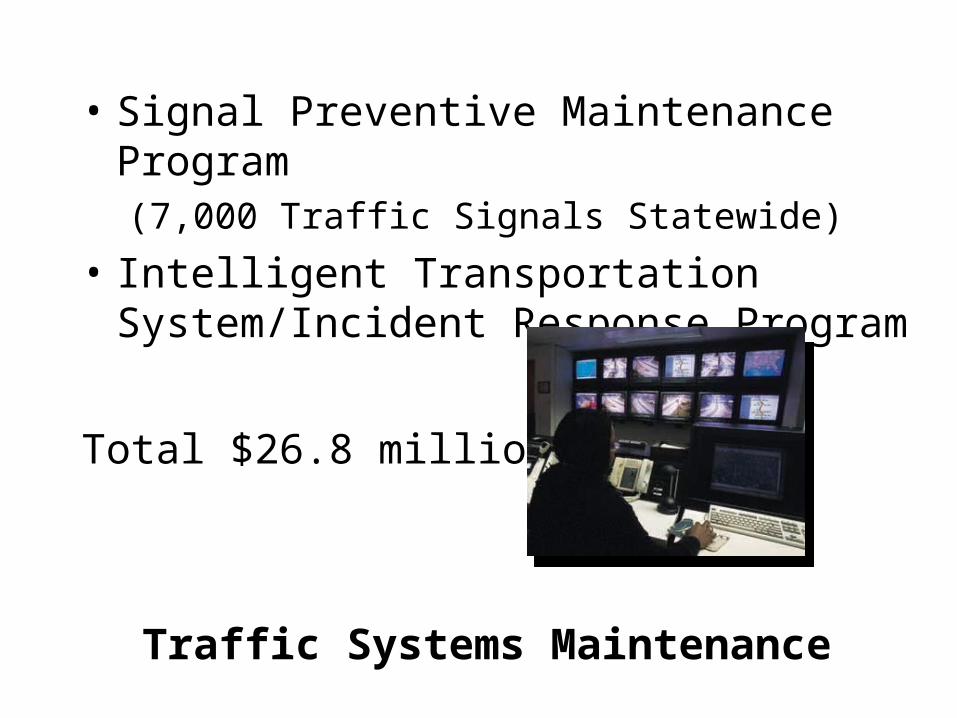
Traffic Systems Maintenance
• Signal Preventive Maintenance Program(7,000 Traffic Signals Statewide)
• Intelligent Transportation System/Incident Response Program
Total $26.8 million

Contract Resurfacing
Resurfacing Cycles Per G.S. 136-44.3
Primary System 12 yrs
All Other Systems 15 yrs
Total Cost $ 227.4 million
Resurfacing Cycles Per G.S. 136-44.3
Primary System 12 yrs
All Other Systems 15 yrs
Total Cost $ 227.4 million

Floyd $ 62.4Snow Storm (Jan. ‘00) $ 17.4Ice Storm (Dec. ‘02) $ 44.4Total $ 124.2
Anticipated Reimbursement (67.0)Estimated DOT Debt $ 57.2
Floyd $ 62.4Snow Storm (Jan. ‘00) $ 17.4Ice Storm (Dec. ‘02) $ 44.4Total $ 124.2
Anticipated Reimbursement (67.0)Estimated DOT Debt $ 57.2
FEMA/FHWA Emergencies and Disasters (millions)
Storm CostStorm Cost
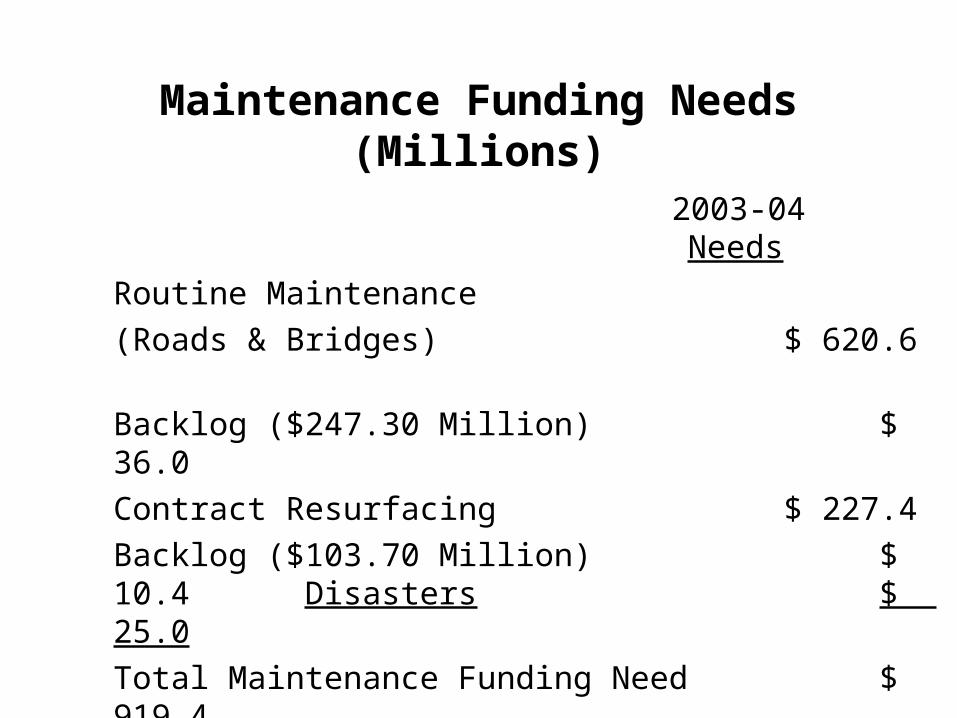
Maintenance Funding Needs(Millions)
Needs
Routine Maintenance
(Roads & Bridges) $ 620.6
Backlog ($247.30 Million) $ 36.0
Contract Resurfacing $ 227.4
Backlog ($103.70 Million) $ 10.4Disasters $ 25.0
Total Maintenance Funding Need $ 919.4
2003-04

History of Routine Maintenance Funding
$150
$200
$250
$300
$350
$400
$450
90 91 92 93 94 95 96 97 98 99 00 01 02 03
Allocation CPI Adjusted Allocation
Millio
ns
$ 94.6 M

History of Resurfacing Funding
$0
$20
$40
$60
$80
$100
$120
$140
$160
$180
90 91 92 93 94 95 96 97 98 99 00 01 02 03
Allocation CPI Adjusted Allocation
Millio
ns
$ 28.4 M
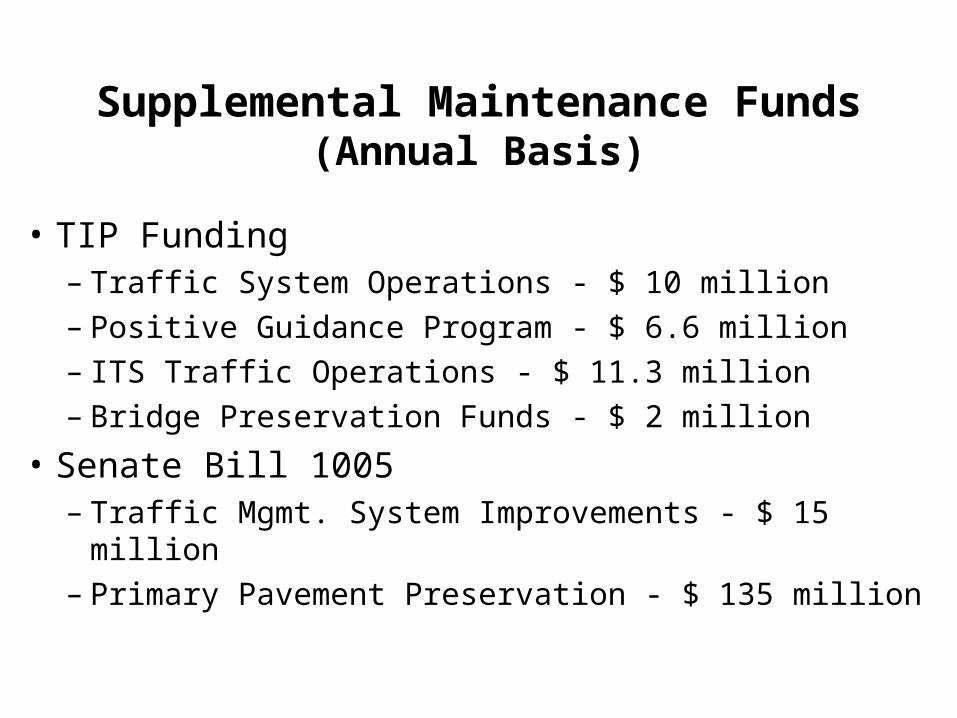
Supplemental Maintenance Funds(Annual Basis)
• TIP Funding– Traffic System Operations - $ 10 million– Positive Guidance Program - $ 6.6 million– ITS Traffic Operations - $ 11.3 million– Bridge Preservation Funds - $ 2 million
• Senate Bill 1005– Traffic Mgmt. System Improvements - $ 15 million– Primary Pavement Preservation - $ 135 million

Impact of SB 1005 on Pavement Needs
• Authorized use of Highway Trust Fund cash balances
• Targets major primary system corridors
• Provides approx. $423 million over 3 years
• Approx. 5,500 lane miles will be strengthened and resurfaced
• Helps eliminate resurfacing backlog
• Reduces pavement needs

Primary Route Preservation ProjectsSB 1005 (Year 1 and 2)
Primary
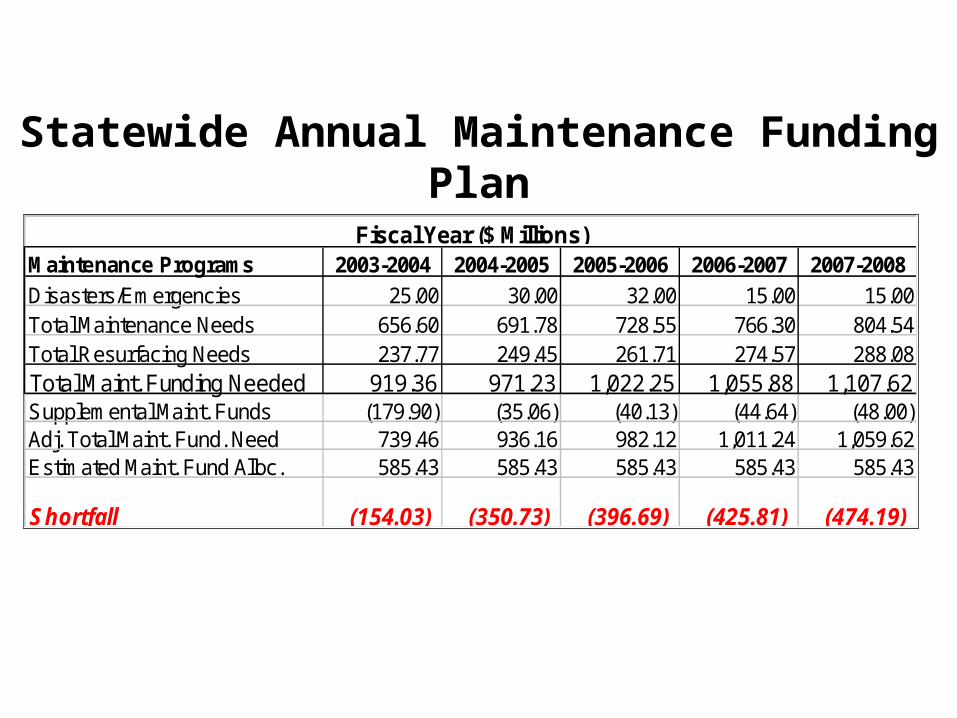
Statewide Annual Maintenance Funding Plan
Maintenance Programs 2003-2004 2004-2005 2005-2006 2006-2007 2007-2008
Disasters/Emergencies 25.00 30.00 32.00 15.00 15.00Total Maintenance Needs 656.60 691.78 728.55 766.30 804.54Total Resurfacing Needs 237.77 249.45 261.71 274.57 288.08Total Maint. Funding Needed 919.36 971.23 1,022.25 1,055.88 1,107.62Supplemental Maint. Funds (179.90) (35.06) (40.13) (44.64) (48.00)Adj. Total Maint. Fund. Need 739.46 936.16 982.12 1,011.24 1,059.62Estimated Maint. Fund Alloc. 585.43 585.43 585.43 585.43 585.43
Shortfall (154.03) (350.73) (396.69) (425.81) (474.19)
Fiscal Year ($ Millions)

Maintenance Operational Improvements
• LED Replacement for Signal Bulbs
• Signal Preventive Maintenance
• Improved Primary Pavements (SB)
• ITS (IMAP) Initiatives
• Road Oil Incentive Pay Program
• DOC Litter Pickup Program
• Pavement Preservation Implementation

Questions?