Embed Size (px)
Citation preview
1
The Effect of Primary School Size on Academic Achievement
Seth Gershenson1
Assistant Professor of Public Administration and Policy
School of Public Affairs
American University
Laura Langbein
Professor of Public Administration and Policy
School of Public Affairs
American University
June 2013
1 Corresponding author – comments are welcome. Department of Public Administration &
Policy, American University, 4400 Massachusetts Avenue, NW, Washington, DC 20016-8070.
Email: [email protected]. Gershenson gratefully acknowledges financial support from an
American University Faculty Research Support Grant and thanks the North Carolina Education
Research Data Center (NCERDC) for providing and assisting with the data. We thank Laura
Crispin, Peter Hinrichs, Ben Ost, David Pitts, and Jeffrey Weinstein for helpful comments.
Michael Hayes provided excellent research assistance. Any remaining errors are our own.

2
The Effect of Primary School Size on Academic Achievement
Seth Gershenson
Laura Langbein
Department of Public Administration and Policy
School of Public Affairs
American University
Abstract
School size is a potentially important dimension of school quality over which policy makers have
some control. However, evidence on the optimal school size is mixed. We estimate the effect of
school size on the academic achievement of 4th- and 5th-grade students in North Carolina’s
public schools using rich student-level administrative panel data between 2003 and 2010.
Estimates of value-added models that condition on teacher-by-school fixed effects, school-
specific time trends, and time-varying school characteristics suggest that a one standard
deviation increase in school size reduces math achievement by about 0.02 test-score standard
deviations and that this effect is approximately linear in school size. The corresponding effect on
reading achievement is smaller and in some specifications indistinguishable from zero. We find
strong evidence of heterogeneity in the relationship between school size and academic
achievement, particularly for the reading achievement of economically disadvantaged students
and math achievement in both charter schools and new schools. However, we find no evidence
that the effect of school size varies by schools’ geographic locations or students’ English
language proficiency.
Keywords: School size, school climate, school quality, education production function
3
1. INTRODUCTION
School quality, broadly defined, is an important predictor of educational attainment and labor-
market success (e.g., Altonji & Mansfield, 2011). School size is one potential measure of school
quality over which policy makers have some control. Indeed, the school consolidation
movement in the U.S. in the middle of the 20th century was predicated on the notion that larger
schools could offer more specialized instruction, increase administrative efficiency, and reduce
per-student costs by exploiting economies of scale (e.g., Berry, 2006; Conant, 1959; Duncombe
& Yinger, 2007). The school consolidation movement was successful in eliminating about 70
percent of schools and increasing the average school enrollment from less than 100 to about 440
between 1930 and 1970 (Berry & West, 2010). The average U.S. primary school currently
enrolls about 486 students.2
However, the benefits of larger schools described in the preceding paragraph come at a
cost, as larger schools have higher rates of student absences and social disorder that may hinder
educational achievement (Gottfredson & DiPietro, 2011). Perhaps unsurprisingly, empirical
evidence on the relationship between school size and academic performance is mixed; see
Andrews, Duncombe, and Yinger (2002), Cotton (1996), and Leithwood and Jantzi (2009) for
thorough reviews of the literature. Kuziemko (2006) speculates that the “current confusion in
the literature” is at least partly driven by the cross-sectional, correlational nature of many
previous studies of school size. Similarly, Andrews, Duncombe, and Yinger (2002) lament the
literature’s general failure to utilize student-level data. Exceptions to these critiques include
value-added style analyses of school size’s effect on the academic performance of 6th and 8th
graders in Chicago Public Schools (Lee & Loeb, 2000), high-school students in New York City
2 Source: Authors’ calculations of the Common Core of Data.

4
(Schwartz, Stiefel, & Wiswall, 2012), and the NELS-88 nationally representative sample of U.S.
10th graders (Crispin, 2012). The latter two studies find evidence of heterogeneities in the effect
of school size on academic performance by school age and geographic locale, respectively,
suggesting that the earlier literature’s focus on parsimonious specifications of the education
production function that assumed homogeneous effects of school size may have contributed to
the mixed results.
A second shortcoming of the existing school-size literature is the underrepresentation of
primary schools (Cotton, 1996; Leithwood & Jantzi, 2009; Ready & Lee, 2006), since the
mechanisms through which school size influences academic performance likely differ between
primary and secondary schools. Understanding the relationship between enrollment and
achievement in primary schools is important, as the recent spate of school closures in the U.S. is
increasing enrollments in the primary schools that remain open and children undergo substantial
developmental changes during these ages: problems of chronic attendance and school
disengagement begin to manifest as early as first grade (Alexander, Entwisle, & Kabbani, 2001;
Schoeneberger, 2012). Existing studies of the relationship between primary school size and
academic performance largely do so at the school level. For example, Lamdin (1995) and Chen
(2007) examine school-level data from Baltimore and New York City, respectively, and find
contradictory results. In a study notable for the use of panel-data and instrumental-variable
methods, Kuziemko (2006) finds a sizable negative relationship between primary school size and
academic performance in Indiana during the 1990s.
The current study contributes to the school-size literature by exploiting within-school
changes in enrollments in North Carolina’s public primary schools between 2003 and 2010 to
identify the effect of such changes on the academic performance of individual students. The
5
empirical strategy includes school size as a contemporaneous input in value-added models
(VAMs) of the education production function that condition on teacher-by-school fixed effects
(FE), school-specific time trends, time-varying school characteristics that are correlated with
both enrollment and academic performance, and lagged student test scores. The teacher-by-
school FE and school-specific linear time trends are important and novel contributions of the
current study, as they account for the nonrandom sorting of teachers and students across schools
and unobserved trends in school quality that jointly influence enrollments and achievement
gains. Similarly, even after conditioning on these unobserved school effects, it is equally
important to condition on the predictors of academic performance that may vary with school
enrollments: size of instructional staff (Meier & Bohte, 2000), average daily attendance rates
(Chen, 2007), and misbehavior (Leung & Ferris, 2008; Haller, 1992). The current study is the
first to rigorously investigate the relationship between primary school size and academic
performance using longitudinal data on both schools and students from a large and diverse
student population. We find robust evidence of a statistically and arguably practically significant
adverse effect of school size on math achievement that is approximately linear and significantly
greater in charter schools than in traditional public schools. Effects on reading achievement are
smaller and only marginally significant. Interestingly, the effect of school size does not appear
to vary by schools’ geographic locations or students’ English language proficiency.
The paper proceeds as follows. Section 2 briefly reviews the relevant literature and
theoretical mechanisms through which school size may influence academic achievement. The
data and empirical strategy are described in sections 3 and 4, respectively. Section 5 presents the
results and section 6 concludes by discussing the main findings and their implications for policy.

6
2. THEORETICAL BACKGROUND & LITERATURE REVIEW
Previous scholarship has considered the potential for school size to influence students’ behavior
and academic performance. Regarding the former, both theoretical and empirical evidence
suggest that larger schools experience higher rates of student indiscipline (e.g., Haller, 1992;
Johnson, 2009; Leung & Ferris, 2008). Disorderly incidents may decrease academic
achievement through some combination of diverting student attention, creating a fearful or
disruptive environment, changing schools’ social norms, and decreasing student attendance
(Akerlof & Kranton, 2002; Gottfredson & DiPietro, 2011).
Through what mechanism, then, does the effect of a change in school size net of its
influence on school disorder and average daily attendance operate? We interpret such effects as
the result of changes in schools’ climates (Akerlof & Kranton, 2002; Anderson, 1982; Welsh,
Stokes, & Greene, 2000). Specifically, the National School Climate Center states that “School
climate is based on patterns of students’, parents’ and school personnel’s experience of school
life and reflects norms, goals, values, interpersonal relationships, teaching and learning practices,
and organizational structures.”3 School size impacts school climate by changing schools’ stocks
of social capital (Coleman, 1988) and “sense of community” (Wynne & Ryan, 1997). For
example, there is less frequent and less direct communication between teachers, administrators,
and students in larger schools (Gottfredson & DiPietro, 2011). Akerlof and Kranton (2002)
argue that students in small schools benefit by being better able to identify with the school and
with each other. Boccardo et al. (2013) provide empirical support for these claims by showing
that students have better relationships with one another in New York City’s old small schools.
Furthermore, the benefits of small schools may spill over into the community, as Dee, Ha, and
3 See http://www.schoolclimate.org/ for additional information.

7
Jacob (2006) provide suggestive evidence that small rural schools promote parental involvement
in the form of volunteering at school and participating in Parent Teacher Associations.
Numerous studies, reviewed by Andrews, Duncombe, and Yinger (2002), Cotton (1996),
and Leithwood and Jantzi (2009), have investigated the relationship between school size and
academic achievement. However, much of the existing literature provides mixed evidence and
cannot be given a causal interpretation (Kuziemko, 2006). Only two studies have attempted to
use student-level data to identify the causal effect of school size on academic achievement in the
primary school context. We briefly review each in turn both to contextualize our results and
identify the novel contributions of the current study.
First, Lee and Loeb (2000) are two of the first researchers to estimate the effect of school
size using student-level achievement data. The authors estimate hierarchical linear models of the
1997 math achievement of 6th and 8th grade students in Chicago Public Schools that control for
lagged (1996) math achievement. However, the lack of school-level panel data prohibits the use
of school FE to control for unobserved school-level heterogeneity that may be correlated with
school size. The authors categorize schools as small (< 400 students), medium, or large (> 750
students) and find that math achievement is significantly greater in small schools, but find no
significant difference between medium and large schools. Second, McMillen (2004) conducts a
methodologically similar analysis using data on the 3rd- and 5th-grade end-of-grade test scores
of North Carolina’s 1997 3rd-grade cohort. Because two years transpire between the current and
lagged test score the author measures school size as the two-year (4th and 5th grade) average
school size experienced by each student. Again, the lack of repeated observations of schools
over time prevents the use of school FE. The author finds no direct effect of school size on
either math or reading achievement.
8
The current study expands upon these early analyses in three important ways. First, by
using school-level panel data we are able to control for both the non-random sorting of teachers
and students across schools and time-invariant unobserved school heterogeneity by conditioning
on teacher-by-school FE. Second, rich administrative data from a state as diverse as North
Carolina enables the current study to provide results that are more generalizable to the U.S.
student population than the results of a district-level analysis, test for differential effects of
school size by schools’ and students’ observable characteristics, and control for school-level
attributes that jointly predict achievement gains and school size. Finally, by updating the earlier
analyses using data from the modern era of school choice, charter schools, and school closings
we are able to estimate the effect of school size in the context of current education policy and test
for differential effects of school size in charter schools.
3. DATA
We use student-level administrative records on the population of 3rd through 5th grade students
in North Carolina’s public schools between 2003 and 2010 to estimate models of the education
production function. The data contain end-of-grade math and reading scores, student
demographics, classroom identifiers, and a set of potentially time-varying school-level
characteristics.4 While the generalizability of North Carolina’s educational context is potentially
limited, two redeeming features make the data well suited for the current analysis. First,
repeated observations of both schools and students over time enable fixed effects (FE) estimators
4 The North Carolina Education Research Data Center (NCERDC) cleaned, coded, and de-
identified the student- and teacher-level data and makes these data available to researchers. See
http://www.childandfamilypolicy.duke.edu/project_detail.php?id=35 for more information. The
end-of-grade tests are state mandated, criterion referenced, and vertically aligned. We
standardize test scores to have mean 0 and standard deviation 1 for each grade-year-subject
triple, as suggested by Ballou (2009).

9
that exploit within-school and within-student changes in school size over time. Second, detailed
school-level data on total enrollment; average daily attendance; suspensions, expulsions, and
crimes per 1,000 students; charter status; grade span; geographic locale; and the demographic
composition of the student body facilitate tests for heterogeneous effects of school size and
provide time-varying information on the attributes that likely co-vary with school size and
predict student achievement. Furthermore, North Carolina is home to a large geographically,
socioeconomically, and demographically diverse student population: the estimation sample is
comprised of 722,676 unique students who attended 1,429 unique schools in North Carolina
between 2004 and 2010.5 The estimation sample is restricted to students who attended the same
school in 3rd through 5th grades to avoid conflating the effect of changing schools with that of
changes in enrollment; however, including the approximately 50,000 students who changed
schools during this time does not change the qualitative results.
The independent variable of interest is school size, as measured by total student
enrollment.6 Figure 1 depicts histogram and kernel density estimates of the school size
distribution, where school-years are the unit of observation. The school-size distribution is
approximately symmetric about the mean (511) and median (500). Summary statistics of the
school size distribution are reported in Table 1. North Carolina’s primary schools appear to have
moderately increased in size between 2004 and 2008, before shrinking in 2009 and 2010. Table
1 also reports school-size summary statistics conditional on school type, as previous research
suggests potential heterogeneities in the effect of school size by vintage (Schwartz, Stiefel, &
Wiswall, 2012) and geographic locale (Crispin, 2012). Charter schools are substantially smaller
5 Students in 3rd grade and in the 2003 academic year do not appear in the estimation sample, as
these data are only used to create lag scores and gain scores for use in the value-added models. 6 Enrollment counts reflect schools’ average daily membership during the course of the academic
school year. We also consider grade-specific enrollments in a sensitivity analysis.

10
than traditional public schools and the 115 new schools introduced between 2004 and 2008 tend
to be slightly larger than existing schools. Rural schools tend to be smaller than both urban and
suburban schools, the latter of which are similar in size. Interestingly, schools classified as
“High Performing” by North Carolina’s ABC accountability program enroll about 40 more
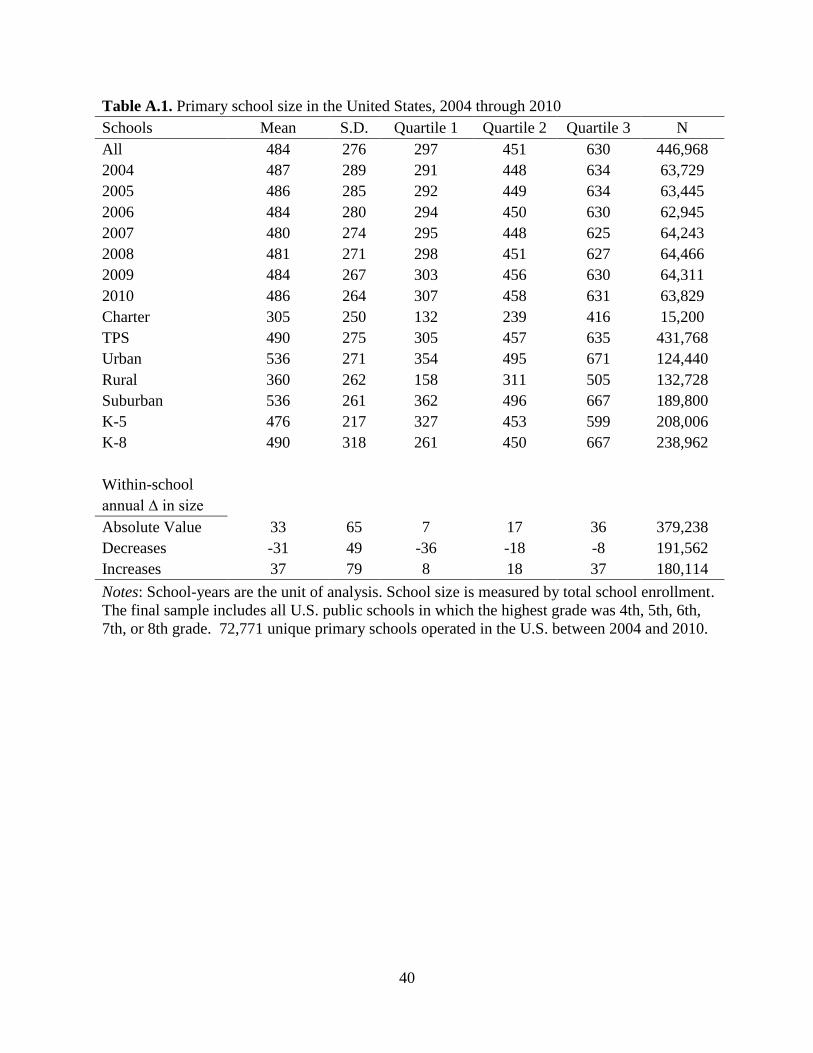
students, on average, than “Low Performing” schools.7 Appendix Table A.1 similarly describes
the population of U.S. primary schools for the same time period using data from the National
Center for Educational Statistics’ Common Core of Data (CCD).8 North Carolina’s primary
schools tend to be about 25 students larger than the national average, though the average within-
school annual change in enrollment in North Carolina is nearly identical to the national average.
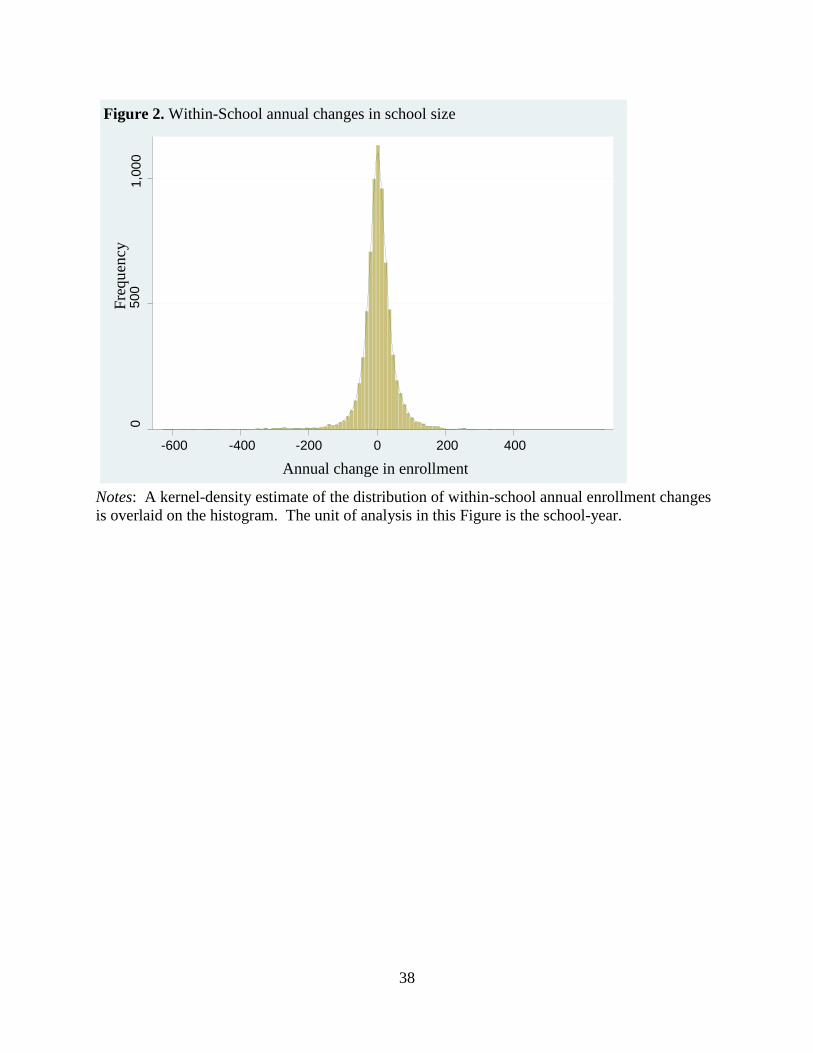
Because the identification strategy described in the following section exploits within-
school variation in enrollments, it is also useful to describe the annual enrollment changes
experienced by North Carolina’s primary schools between 2004 and 2010. The lower panel of
Table 1 shows that the average annual change was 35 students and that average increases and
decreases were of roughly the same magnitude. Figure 2 plots the distribution of annual within-
school changes, which is approximately normal and tightly centered on small changes of fewer
than 50 students. However, increases and decreases as large as 200 students do occur.
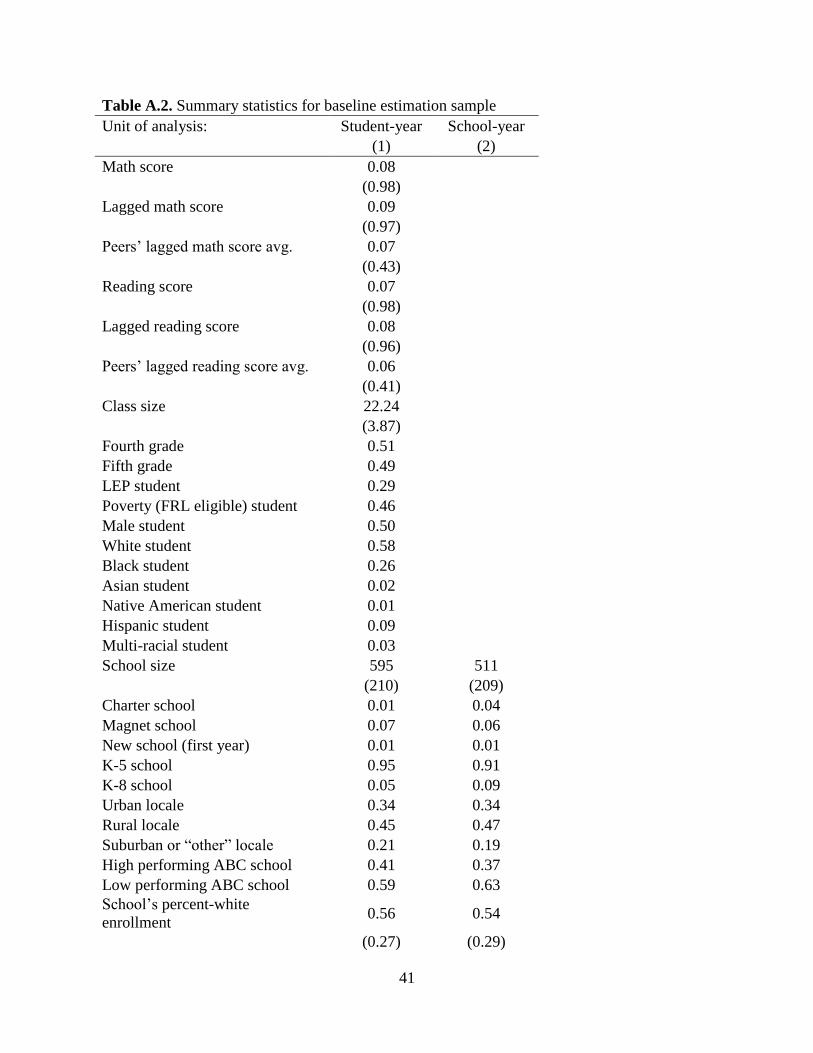
Appendix Table A.2 reports summary statistics for the statistical controls included in the
empirical models at both the student-year and school-year levels.9 The estimation sample is
approximately evenly split between 4th and 5th grade, poor and non-poor, male and female, and
7 The ABC program publicly rates schools based on performance growth. See Clotfelter et al.
(2004) and http://abcs.ncpublicschools.org/abcs/ for thorough descriptions of the ABC program. 8 The CCD is publicly available here: http://nces.ed.gov/ccd/.
9 The student-level summary statistics may be viewed as school-level averages weighted by 4th
and 5th grade enrollment. Test score means and standard deviations are not precisely 0 and 1,
respectively, because they were standardized using all available test scores and summary
statistics are reported for the estimation sample for which no data were missing.

11
white and non-white students. Over 90 percent of North Carolina’s primary schools contain
grades K through 5 and about 5 percent are classified as charter schools. Disorderly incidents
are rare in the estimation sample, which is unsurprising given the ages of primary-school
students; nonetheless, they do occur.
4. METHODOLOGY
The identification strategy includes school size as a contemporaneous input in value-added
models (VAM) of the education production function. We take Ordinary Least Squares (OLS)
estimates of a lagged-test score specification as the baseline, as Guarino, Reckase, and
Wooldridge (2012) find this approach the most robust to a variety of potential non-random
student-teacher assignment scenarios and similar specifications are commonly used in analyses
of the effects of educational inputs.10
Formally, we model student i’s end-of-grade test score (y)
in year t as
, 1 , ,ijst i t it st st jst i jst js t ijsty y X f size Z c p u
(1)
where j indexes teachers and s indexes schools; X is a vector of student characteristics including
race, gender, grade level, and poverty status; f(size) is a general function of school size; Z is a
vector of potentially time-varying school characteristics including the demographic composition
of the student body, the size and credentials of the instructional staff, geographic locale (i.e.,
rural, suburban, or urban), grade span, charter status, average daily attendance, and the numbers
of crimes, suspensions, and expulsions per 1,000 students; c is student i’s class size; p is the
average of student i’s year-t classmates’ lagged test scores; ω is a teacher-by-school FE; τ is a
year FE; and u is an idiosyncratic error term that contains student i’s potentially time-varying
10
The authors refer to this approach as dynamic OLS, or dOLS. Rothstein (2010) provides
evidence of non-random student-teacher assignments in North Carolina.

12
unobserved ability and test-score measurement error.11
Standard errors are made robust to
clustering at the district level (N = 188), which makes statistical inference robust to potentially
time-varying unobserved district effects and to serial correlation within schools and students
because the estimation sample is restricted to students who did not change schools between 3rd
and 5th grades and schools are nested within districts (Angrist & Pischke, 2009, p. 319).
Four aspects of equation (1) warrant further discussion. First, we consider four
specifications of f(size): linear, quadratic, and logarithmic functions of school size as well as sets
of categorical school-size indicators (e.g., quartiles of the school-size distribution).12
Similarly,
we interact school size with a variety of student- and school-level observed characteristics to test
for heterogeneity in the relationship between school size and student achievement. Second, two
potential concerns are that schools close endogenously and new-school sites are endogenously
determined. To verify that the results are not driven by school openings or closings, we test for
endogenous attrition of schools by estimating (1) on the balanced panel of schools that were
consistently open between 2004 and 2010 (Wooldridge, 2010, p. 831).
Third, the teacher-by-school FE are crucial to the identification strategy as they control
for the quality of individual students’ teachers, the sorting of teachers across schools, and
unobserved time-invariant school effects during teachers’ school-specific spells. Because the
teacher-by-school FE control for unobserved school effects that remain constant during each
teacher’s spell in a given school, time-invariant teacher and school FE are redundant in (1).
However, the time-varying school-level characteristics in Z perform the equally important role of
11
See Todd and Wolpin (2003) or Guarino, Reckase, and Wooldridge (2012) for derivations of
(1) from the linear cumulative effects specification of the education production function and
thorough discussions of the assumptions required for the consistency of OLS estimates of (1). 12
We do not pursue non-parametric estimators of the relationship between school size and
student achievement, though this is an interesting extension that we leave to future research.
13
controlling for school characteristics that potentially vary with school size and predict gains in
student performance. Similarly, there may be unobserved school-specific trends that jointly
predict enrollments and achievement. Thus we conduct two sensitivity analyses to verify that the
baseline estimates are not driven by the presence of time-varying unobserved school effects: we
generalize (1) to condition on school-specific linear time trends (Wooldridge, 2010, p. 375) and
we estimate (1) with the coefficients on Z restricted to equal zero and compare the resulting
estimate of the effect of school size to that from the baseline specification. Both sensitivity
analyses provide approximate tests of whether the results are driven by time-varying unobserved
school characteristics.
Finally, a potential concern with the lagged test score specification of (1) is that
unobserved student ability not captured by the lagged test score is left in the error term, which
may be correlated with the model’s covariates. While Guarino, Reckase, and Wooldridge (2012)
find that OLS on (1) is the most robust estimator in the presence of non-random student-teacher
assignments, which is likely the case in North Carolina (Rothstein, 2010), we examine the
robustness of the baseline model (1) to conditioning on unobserved student heterogeneity.
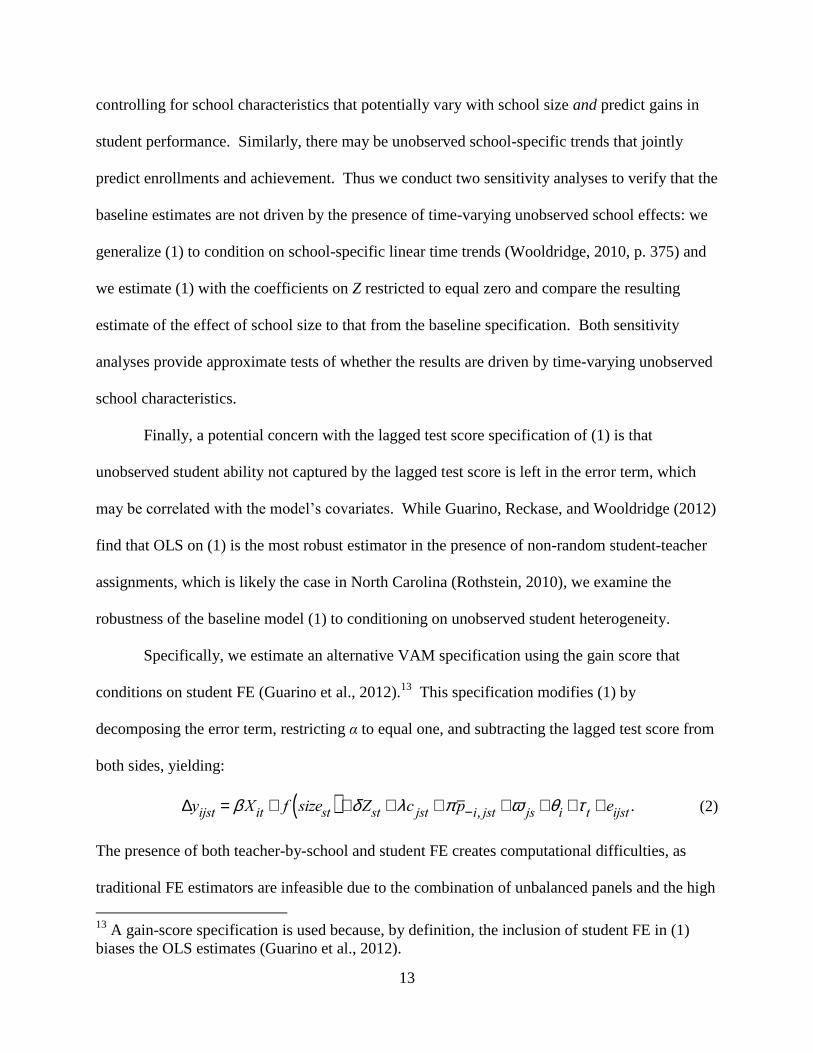
Specifically, we estimate an alternative VAM specification using the gain score that
conditions on student FE (Guarino et al., 2012).13
This specification modifies (1) by
decomposing the error term, restricting α to equal one, and subtracting the lagged test score from
both sides, yielding:
Dyijst = b Xit + f sizest( )+dZst + lc jst +p p-i, jst +w js +qi +t t + eijst .
(2)
The presence of both teacher-by-school and student FE creates computational difficulties, as
traditional FE estimators are infeasible due to the combination of unbalanced panels and the high
13
A gain-score specification is used because, by definition, the inclusion of student FE in (1)
biases the OLS estimates (Guarino et al., 2012).

14
dimensionality of the problem (Abowd, Kramarz, & Margolis, 1999).14
Thus we estimate
equation (2) using the two way-FE estimator proposed by Mittag (2012).
5. RESULTS
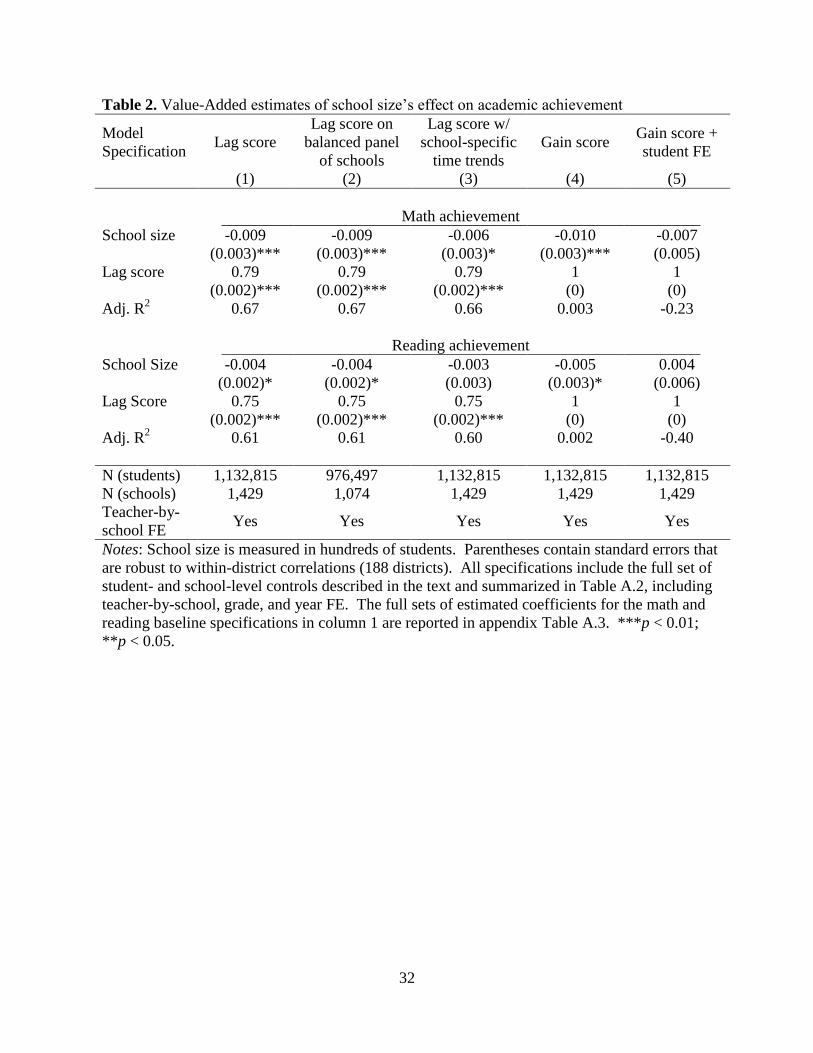
Estimates of the baseline specification (1) that assume a linear relationship between school size
and student achievement and several of the alternative specifications described above are
reported in Table 2. For the purposes of reporting coefficient estimates, school size is measured
in hundreds of students. The top panel of Table 2 reports results for math achievement and the
bottom panel reports results for reading achievement. We discuss the math results first, which
are generally strongly statistically significant and larger in magnitude than those for reading.
Column 1 reports the estimated effect of school size on math achievement for the baseline
specification (equation 1) and column 2 estimates the same specification using the balanced
panel of schools that were consistently in operation between 2004 and 2010. The point estimate
of -0.009 is strongly statistically significant and identical in both specifications; this suggests that
the results are not driven by endogenous school closings or selection into newly-opened schools
and that a 100-student increase in school size lowers math scores by 0.009 of a test-score
standard deviation. While this effect appears small, recall that the standard deviation of school
size is about 200 students. Thus a one standard-deviation increase in school size is associated
with a 0.018 standard-deviation decrease in math achievement. This effect is arguably
practically significant, as it is approximately 20 percent of the effect of a one standard deviation
increase in the distribution of teacher effects (Rockoff, 2004; Rivkin, Hanushek, & Kain, 2005)
and 10 percent of the effect of a 7-student reduction in class size (Krueger, 1999).
14
The estimation sample contains 34,687 and 833,470 unique teacher-school and student-school
spells, respectively.

15
Column 3 of Table 2 estimates an extension of (1) that conditions on school-specific
linear time trends. Adding over 1,000 school time trends to the RHS of (1), which are jointly
statistically insignificant at traditional confidence levels, lessens the precision of the estimated
coefficient on school size and actually decreases the adjusted R2. However, the estimated effect
of school size remains negative, marginally statistically significant, and similar in magnitude to
the baseline estimate in column 1.
Column 4 of Table 2 reports the estimated coefficient on school size in a gain-score
specification that is otherwise identical to (1), to provide context for comparisons between
estimates of equations (1) and (2). The point estimate of school size’s effect in column 4 is
nearly identical to that in the baseline specification of column 1 and is again strongly statistically
significant. Column 5 of Table 2 reports the two-way FE estimate of the coefficient on school
size in equation (2). The point estimate is again negative and similar in magnitude to that in
column 1, but is smaller and imprecisely estimated: the standard error nearly doubles in size.
The imprecision of the two-way FE estimator is perhaps unsurprising, as the student FE are
jointly insignificant and actually turn the adjusted R2 negative, indicating that (2) provides an
exceptionally poor fit of the data (Wooldridge, 2013, p. 203). While the school time trend and
two-way FE estimates reported in columns 3 and 5 of Table 2 provide supporting evidence that
school size has a modest negative effect on math achievement, the estimates of (1) reported in
column 1 are preferred on the basis of goodness of fit (adjusted R2), because the school time
trends and student FE are jointly insignificant (p-values > 0.8), and because Guarino, Reckase,
and Wooldridge (2012) find that OLS on (1) is more robust to the non-random assignment of
students to teachers than the available alternative estimation methods.

16
The lower panel of Table 2 reports estimates of school size’s effect on reading
achievement in the same five specifications. The baseline estimate of the effect of school size on
reading achievement is about half the size of the corresponding estimate for math achievement
and is only marginally statistically significant at the 10 percent confidence level. Like in the
results for math achievement discussed above, estimates on the balanced panel, school linear
time trends specification, and gain-score specification yield estimates that are similar in
magnitude to the baseline estimate of column 1. Interestingly, the two-way FE point estimate of
school size’s effect on reading achievement reported in column 5 is positive, though imprecisely
estimated. Again, the student FE are jointly insignificant and the adjusted R2 is negative,
suggesting that the two-way FE model provides a poor fit of the reading achievement data. The
finding that school size has less, if any, effect on reading than math achievement is consistent
with studies of the relationship between high-school size and student achievement (e.g., Crispin,
2012) and with the general finding that educational inputs have relatively greater impacts on
math achievement (e.g., Hanushek & Rivkin, 2010; Jacob, 2005; Rivkin, Hanushek, & Kain,
2005; Rockoff, 2004).15
Finally, it is reassuring to note that the estimated coefficients on the
lagged math and reading scores in columns 1 through 3 of Table 2 are similar to those found by
other researchers who fit similar models to the NCERDC data (e.g., Jackson & Bruegmann,
2009). Estimated coefficients for the full set of covariates included in the baseline specification
are generally of the expected sign and reported in appendix Table A.3.
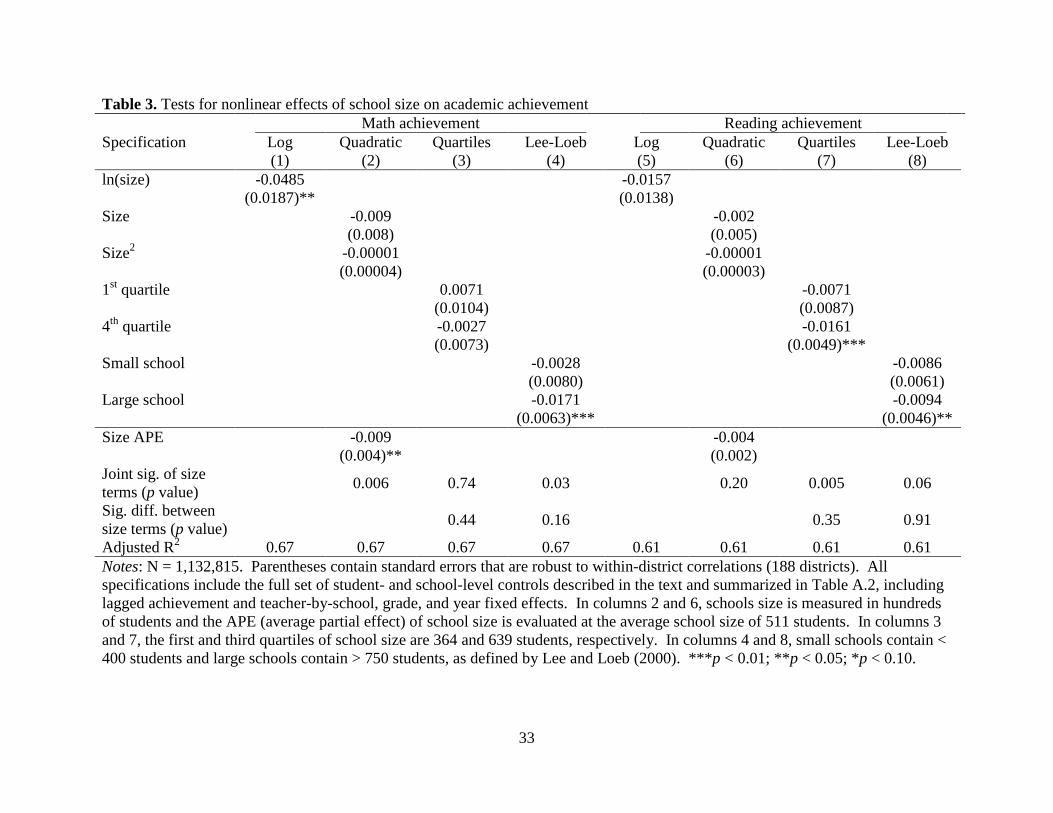
Columns 1 through 4 of Table 3 test for nonlinearities in the relationship between school
size and math achievement using four alternative specifications of f(size) in the preferred
15
This may be due to the structure of reading tests (MET, 2010) or the fact that schools do in
fact have larger impacts on the development of math skills, as children learn and develop reading
skills at home (Currie & Thomas, 2001).

17
specification of equation (1). In column 1 f(size) is modeled as the natural log. The estimated
coefficient of -0.05 is strongly statistically significant and suggests that a 20 percent increase in
school size lowers math achievement by 0.01 of a test-score standard deviation, which is similar
in magnitude to the linear effect of a 20 percent (100 student) increase in school size on math
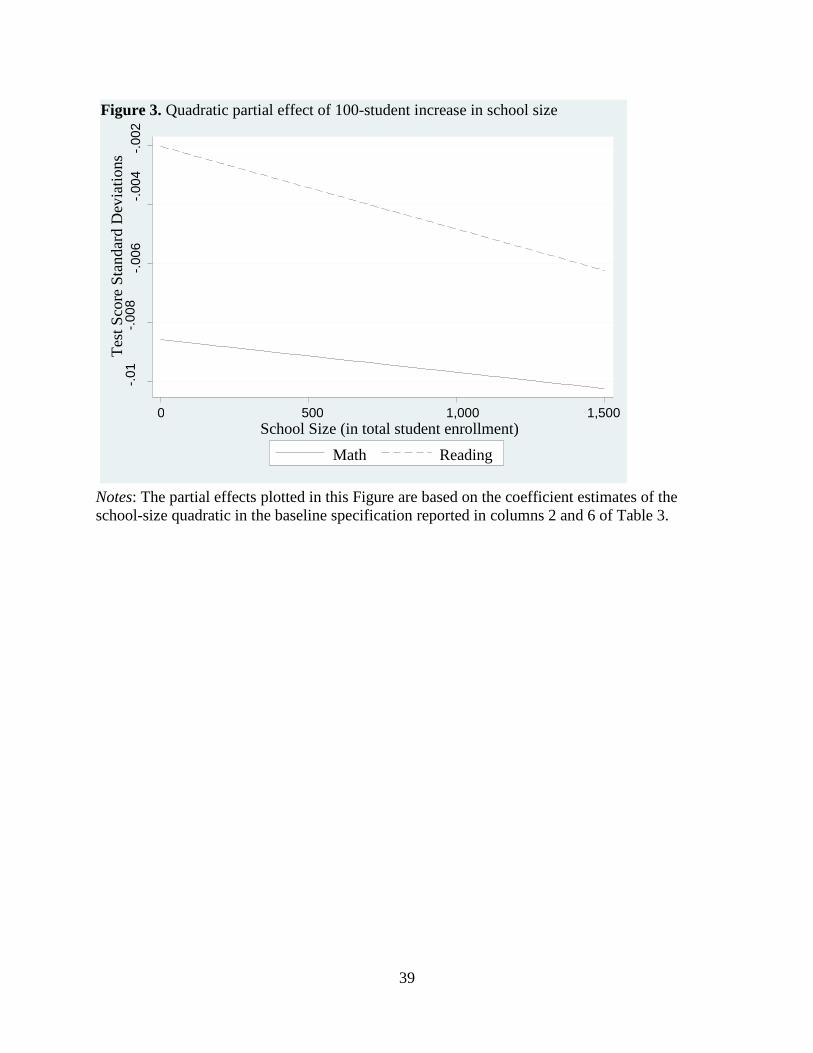
achievement estimated in column 1 of Table 2. Column 2 of Table 3 assumes a quadratic
function of school size, in which the linear and squared terms are individually insignificant but
strongly jointly significant. The negative coefficient on the squared term suggests that the effect
of school size is consistently negative and that there is no optimal school size (with regards to
math achievement). Again, the estimated average partial effect is similar in magnitude to the
linear effect reported in column 1 of Table 2. Figure 3 plots the partial effect of school size on
math achievement as a function of school size, which remains approximately constant over the
range of school sizes observed in North Carolina.
Finally, columns 3 and 4 of Table 3 include indicators for “small” and “large” schools,
omitting midsize schools as the reference group. In no case are the estimated coefficients on the
small and large categories significantly different from one another at traditional confidence
levels. In column 3, “small” and “large” are defined as the first and fourth quartiles of the school
size distribution summarized in Table 1. The quartile dummies are neither individually nor
jointly significant at traditional confidence levels, though the relatively large positive coefficient
on “first quartile” suggests that students in smaller schools experience greater gains math
achievement than their counterparts in midsize and large schools. In column 4, “small” and
“large” definitions of fewer than 400 students and more than 750 students, respectively, are
adopted from Lee and Loeb (2000). The estimated coefficient on the large-school indicator of
-0.017 is strongly statistically significant, suggesting that students in large schools score about

18
0.017 math test-score standard deviations lower than students in midsize schools. As in the case
of the quadratic specification, this effect is similar in magnitude to the linear effect of a
similarly-sized increase in school size on math achievement estimated in Table 2. Taken
together, the results reported in columns 1 through 4 of Table 3 suggest that the effect of school
size on math achievement is approximately linear.
Columns 5 through 8 of Table 3 test the same four possible nonlinear relationships
between school size and reading achievement using the preferred specification of equation (1).
In columns 5 and 6, estimated coefficients on the logarithmic and quadratic functions of school
size are negative, but practically small and statistically insignificant. In columns 7 and 8 the
“large school” indicators’ coefficients are negative and similar in magnitude to the corresponding
partial effect of a similar increase in school size predicted by the linear model estimated in
column 1 of Table 2. However, as in the case of math achievement, the results reported in
columns 5 through 8 of Table 3 provide no evidence of a nonlinear relationship between school
size and reading achievement. And, as in the case of the linear models estimated in Table 2, the
negative effect of school size is stronger on math achievement than on reading.
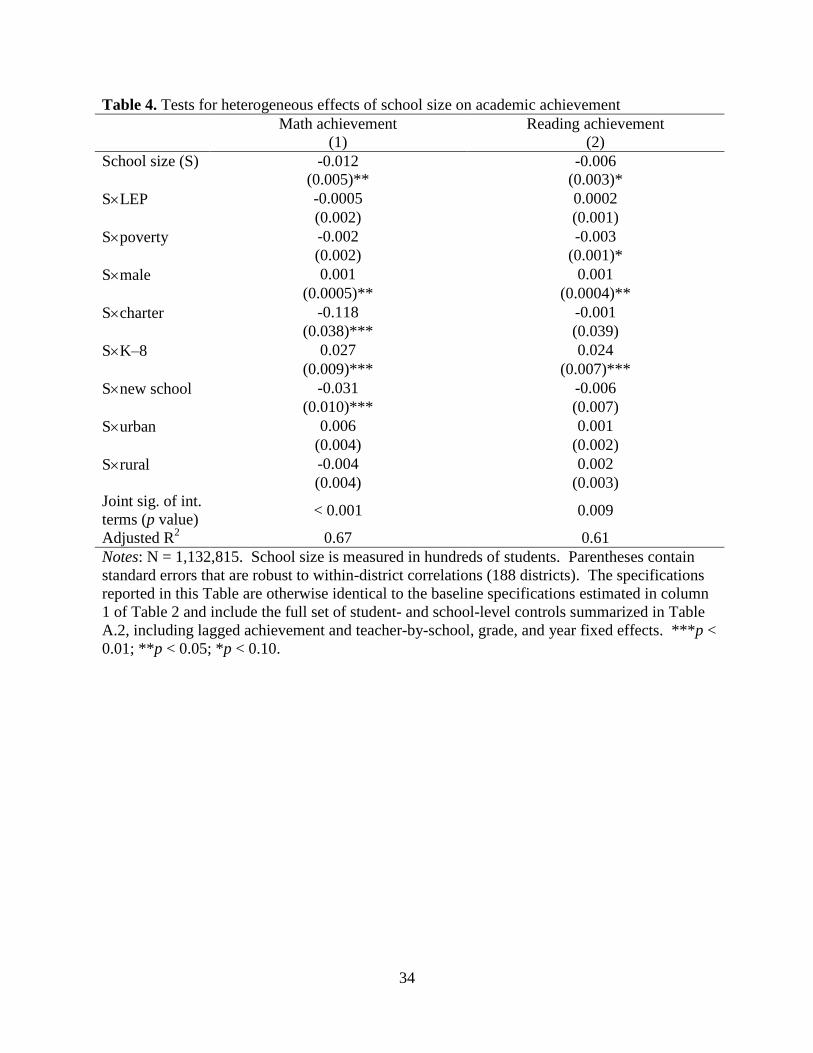
In Table 4 we test the hypothesis that the effect of school size on academic achievement
varies by student and school type. This is done by adding interactions of school size with eight
student and school characteristics to the baseline specification of equation (1) and testing the
statistical significance of these interaction terms. The eight interaction terms are strongly jointly
significant for both math and reading achievement, suggesting that the relationship between
school size and academic achievement is heterogeneous. For this reason the eight interaction
terms are simultaneously added to the baseline model; however, adding each interaction term to

19
the baseline specification individually yields qualitatively similar estimates of the interaction
effects.
The first three interaction terms reported in Table 4 examine how the effect of school size
varies with student-level indicators of Limited English Proficiency (LEP), poverty, and gender.
There is reason to believe that students may differentially respond to school size, as Krueger
(1999) finds that the effect of class size varies by students’ socioeconomic status (SES) and
Baydar and Brooks-Gunn (1991) find differential effects of childcare on cognitive development
by SES and child’s gender. The marginal benefit of individual attention provided by smaller
schools may be greater for disadvantaged students who receive less attention at home (Guryan,
Hurst, & Kearney, 2008). Similarly, the effect of school size would differ by students’ LEP
status if LEP students either encounter difficulties navigating the social and administrative
environments of large schools or benefit from larger schools’ economies of scale in the provision
of LEP services.
For math achievement, reported in column 1 of Table 4, only the male-school size
interaction is even marginally statistically significant. However, the interaction effect of 0.001 is
quite small and unlikely to be practically important. Column 2 reports the estimated interaction
effects on reading achievement. As in the case of math, there is a small but marginally
statistically significant difference in the effect of school size on reading achievement between
boys and girls: boys appear to perform slightly better than girls in large schools. The poverty-
school size interaction effect is also marginally statistically significant in column 2 of Table 4,
suggesting that the adverse effect of school size on reading achievement is about 50 percent
larger for socioeconomically disadvantaged students. This difference is consistent with the
hypothesis that while reading skills are primarily developed at home (Currie & Thomas, 2001),

20
they are more effectively developed in high-SES households that are able to invest more time
reading to children and thus children from disadvantaged backgrounds stand to gain more from
the individualized attention that smaller schools may provide.
The specifications estimated in Table 4 also interact school size with five indicators of
school type. First, we test for a differential effect of school size in charter schools, which Table
1 shows tend to be much smaller than traditional public schools (TPS). Doing so will determine
whether the benefits of small schools identified in the baseline specifications estimated in Table
2 are driven by the presence of small charter schools. Second, we control for a differential effect
of school size by schools’ grade span because school size is a function of grades served (Lee &
Loeb, 2000) and also in order to disentangle charter-school from grade-span effects, as charter
schools are more likely to serve kindergarten through 8th-grade students than TPS in North
Carolina. Third, following (Schwartz, Stiefel, & Wiswall, 2012), we allow for a differential
effect of school size in new schools. Finally, following Crispin (2012), we test for differential
effects of school size in urban and rural locations, omitting suburban schools as the reference
category.
The estimated school size-charter school interaction effect on math achievement reported
in column 1 of Table 4 is strongly statistically significant and quite large in magnitude: the point
estimate of -0.11 is about ten times larger than the baseline estimate, indicating that a one
standard deviation increase in charter school size reduces math achievement by about one fifth of
a test-score standard deviation. However, the effect of school size on reading achievement does
not appear to vary by charter status. The differential effect of school size on both math and
reading achievement is positive and strongly significant in K-8 schools. The magnitude of the
positive differential K-8 effect of school size is twice as large as the baseline effect, indicating a
21
positive net effect of school size in non-charter K-8 schools. The adverse effect of school size on
math achievement appears to be significantly larger in new schools, which corroborates the
findings of Schwartz, Stiefel, & Wiswall (2012), though the effect of school size on reading
achievement is similar in both new and existing schools. Finally, the geographic locale-school
size interaction effects are statistically insignificant at traditional confidence levels, yet are
relatively large in magnitude for math achievement. Specifically, the point estimates suggest
that relative to suburban schools, the harmful effect of school size on math achievement is about
40 percent smaller in urban schools and 50 percent larger in rural schools. The imprecision of
these estimates may result from the lack of variation by locale in within-school variation in
school size over time.
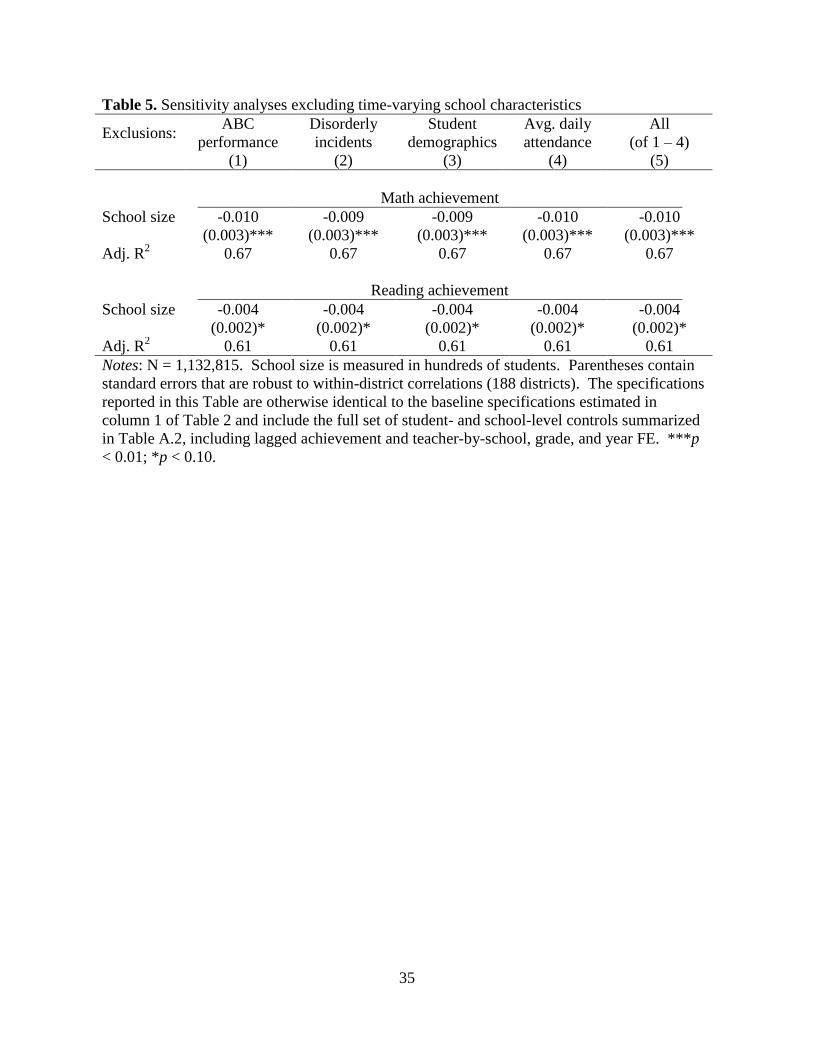
A causal interpretation of the main results reported in Tables 2 through 4 requires that
school size is uncorrelated with unobserved time-varying school characteristics that influence
academic achievement (e.g., school quality as perceived by parents). While the school-specific
linear time trend specifications reported in column 3 of Table 2 suggest that this is the case, this
assumption cannot be formally tested and no valid instrumental variables for school size are
readily available. However, as discussed in the methodology section, excluding the time-varying
school characteristics thought to co-vary with school size arguably provides an approximate test
of this assumption. Specifically, because unobserved time-varying school quality is likely
correlated with certain time-varying elements of Z, excluding those elements of Z from the
model will only change the estimated effect of school size if the observed relationship between
school size and academic achievement is indeed driven by within-school changes in quality.
Alternatively, if the estimated effect of school size is robust to the specification of Z, this

22
suggests that the teacher-by-school FE adequately control for unobserved differences in school
quality.
This approximate test is carried out in Table 5 for both math and reading achievement.
Columns 1 through 4 exclude ABC performance ratings, the frequency of disorderly incidents,
school-level demographics, and average daily attendance from Z, respectively, from the baseline
specification of (1). Column 5 excludes all of these covariates. The estimated effect of school
size on both math and reading achievement is remarkably robust: there are no practically
significant differences between the preferred baseline estimates of Table 2 and any of the five
alternatives reported in Table 5. While not conclusive, this result is highly suggestive that the
baseline estimates are not biased by time-varying unobserved school-level heterogeneity.
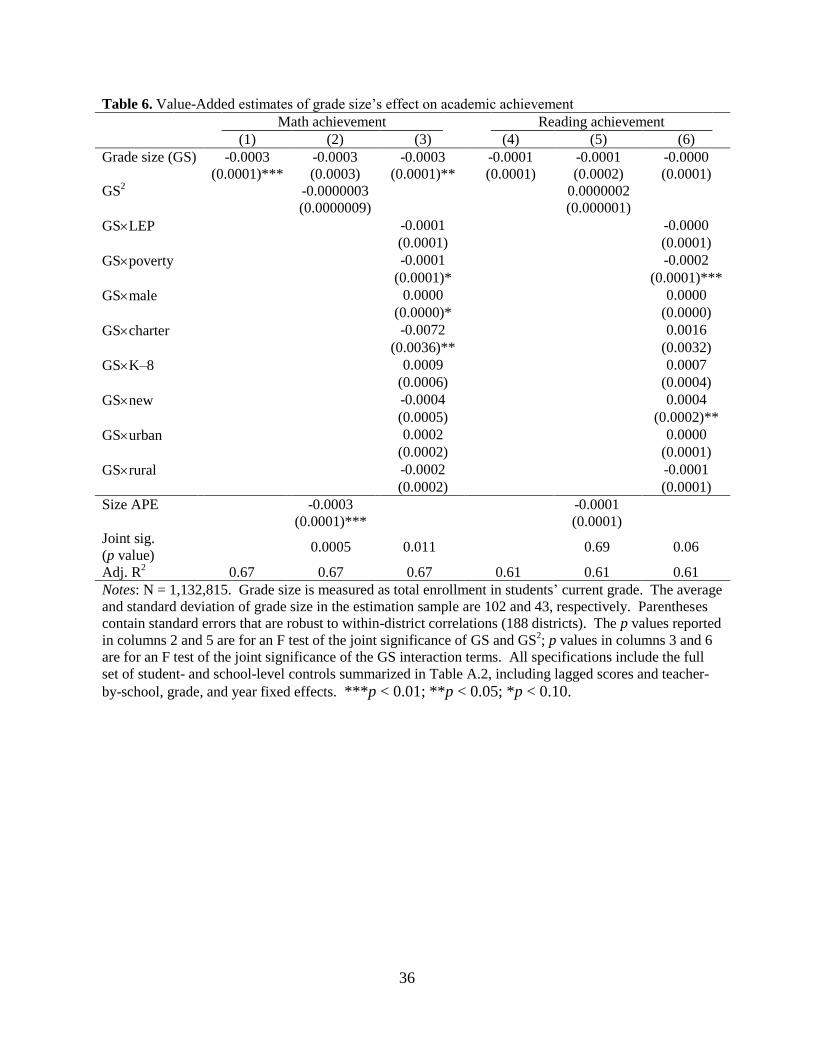
Finally, as mentioned in the theoretical background section, there are at least three
reasons why grade size provides a useful measure of school size: students and teachers within
each grade level primarily interact with one another (Ready & Lee, 2006), schools’ enrollment
may vary across grades due to demographic trends in the district, and school size is partially a
function of the school’s grade span (Lee & Loeb, 2000). Accordingly, we investigate the
robustness of the main results to using schools’ total enrollment in students’ current grade levels
as the measure of school size. The results of this exercise are reported in Table 6, where grade
size is measured in total grade enrollment. For both math and reading, we consider linear,
quadratic, and fully-interacted specifications. The results are generally consistent with those for
school size: the effect is larger on math achievement, approximately linear, and the adverse
effect of grade size is especially large in charter schools. The magnitude of the effect of a one
standard deviation increase in grade size (43 students) on math achievement is slightly smaller
than the analogous effect of school size: approximately 0.013 of a test-score standard deviation.

23
These results reinforce the paper’s main finding that the effect of school size on academic
achievement is negative, yet modest in magnitude.
6. DISCUSSION
The current study uses rich student-level administrative records from North Carolina’s public
school system that include repeated observations of both students and schools over time to
estimate the effect of school size on academic achievement in a value-added framework. The
main results suggest that a one standard deviation increase in school size reduces math
achievement by about 0.02 test-score standard deviations. This effect is arguably causal, as it is
robust to a variety of specifications and estimators that condition on student, teacher, and school
fixed effects, school-specific linear time trends, and a rich set of time-varying school
characteristics. The effect of school size on math achievement is approximately linear in school
size and robust to a variety of plausible VAM specifications and definitions of school size. The
estimated effect of school size on reading achievement is generally negative, but smaller in
magnitude and indistinguishable from zero in several specifications. The relationship between
school size and academic achievement appears to vary by both school and student type,
specifically in charter schools, where the adverse effect of a one standard deviation increase in
school size on math achievement is significantly larger at nearly one fifth of a test-score standard
deviation.
It is useful to put these results in perspective by comparing them to both existing
estimates of the effect of school size on math achievement and to the estimated effects of other
educational inputs, interventions, and policies. Crispin (2012) estimates the effect of secondary
school size using student-level data from the nationally representative NELS-88 survey. Her
24
results indicate that the effects of a one standard deviation increase in an average sized school’s
enrollment on math achievement in both urban and rural schools are approximately 0.02 to 0.04
test-score standard deviations. The current study’s baseline estimate falls at the low end of this
range, perhaps because the current study partials out the indirect effect of size that operates
through student indiscipline. Alternatively, it could be that the effect of school size is simply
larger in high schools, a hypothesis that future research might address by conducting an analysis
similar to that of the current study using detailed student-level administrative records for a panel
of secondary schools.
Regarding the practical significance and potential policy implications of the current
study’s results, the modest effect size of 0.02 test-score standard deviations is most easily
interpreted relative to the effects of other potential educational interventions that are considered
to be practically significant. For example, it is approximately 20 percent of the effect of a one
standard deviation increase in the distribution of teacher effects (Rockoff, 2004; Rivkin,
Hanushek, & Kain, 2005) and 10 percent of the effect of a 7-student reduction in class size
(Krueger, 1999). Arguably, these are nontrivial impacts on student achievement, and schools in
our sample experience annual changes in enrollment as large as 200 students. From a policy
perspective, annual changes greater than one hundred students likely occur when smaller schools
are consolidated or closed. At the very least, our results strongly suggest that there are neither
large negative effects nor positive effects of increases in school size on student achievement.
Thus the relevant policy question in an era of tremendous budgetary pressures on school
districts is whether enrollment-reduction policies are cost effective relative to other potential
interventions such as class-size reductions, extended school years, after-school tutoring, summer
programs, and so on, as there are both direct and indirect (opportunity) costs to reducing school

25
size (Harris, 2006). Though a rigorous cost-benefit analysis is beyond the scope of the current
study, we follow Kuziemko (2006) in conducting a back-of the-envelope cost-benefit analysis of
reducing school size by 50 percent (250 students). Like Kuziemko, we use conservative
estimates that likely understate the benefits and exaggerate the costs of such a policy. Unlike
Kuziemko, however, we find that the direct costs of implementing such a policy are likely
greater than the benefits: the expected increase in lifetime earnings generated by a 50 percent
reduction in school size is only about 25 percent of the expected increase in operating costs, to
say nothing of the costs associated with the construction of new schools. The details of the cost-
benefit analysis are described in an online appendix.16
An interesting non-finding of the current analysis is the lack of differential effects of
school size across urban, rural, and suburban campuses, as Crispin’s (2012) analysis of the
NELS-88 suggests that the relationship between high school size and academic achievement
varies by geographic locale and Dee, Ha, and Jacob (2006) find evidence that small rural schools
have positive effects on parental involvement. This could be the result of structural differences
between the production of education in primary and secondary schools, as Egalite and Kisida
(2013) report larger effects of school size in high schools than primary schools, or perhaps a
result specific to North Carolina.17
The former suggests the usefulness of conducting similar
analyses of the relationship between secondary school size and academic achievement using
similarly rich administrative student-level data that contain repeated observations of high schools
over time in an effort to replicate Crispin’s results. The latter raises a potential limitation of the
16
All appendices are available at the end of this article as it appears in JPAM online. Go to the
publisher’s website and use the search engine to locate the article at
http://www3.interscience.wiley.com/cgi-bin/jhome/34787. 17
The non-finding is not the result of controlling for school or teacher-by-school FE, as pooled
OLS estimates of the geographic locale interaction terms are statistically insignificant as well.
26
current study: the external validity of analyzing a single state. Similarly, just as the mechanisms
through which school size impact student achievement may vary between primary and secondary
schools, they may vary between grade levels. Accordingly, a second limitation of the current
analysis is its focus on achievement in grades 4 and 5 in North Carolina. For these reasons,
future research that conducts similar analyses of nationally representative data that measures
achievement in earlier grades such as the Early Childhood Longitudinal Study – Kindergarten
Cohort (ECLS-K) or administrative data from other states would be worthwhile.
Finally, the finding that school size influences academic achievement over and above its
influence on student indiscipline and attendance highlights the general importance of school
climate in the educational process, which encompasses a number of behaviors, attributes, and
cultural and social norms. This raises deeper questions of how and why school climate is a
function of school size. It would be useful for future research to attempt to get inside the “black
box” of school size’s role in the educational process and further unpack the effect of school size
and school climate. For example, do class sizes, instructional practices, or rates of teacher
attrition systematically vary by school size? Similarly, additional surveys and qualitative
analyses of student, parent, teacher, and administrator perceptions of school climate similar to
those analyzed by Lee and Loeb (2000) and Boccardo et al. (2012) may prove useful, as policy
implications and recommendations for best practice ultimately depend upon the channels through
which school size and school climate influence student learning.

27
REFERENCES
Abowd, J. M., Kramarz, F., & Margolis, D. N. (1999). High wage workers and high wage firms.
Econometrica, 67, 251-333.
Akerlof, G. A., & Kranton, R. E. (2002). Identity and schooling: Some lessons for the economics
of education. Journal of Economic Literature, 40, 1167-1201.
Alexander, K. L., Entwisle, D. R., & Kabbani, N. (2001). The dropout process in life course
perspective: Early risk factors at home and school. Teachers College Record, 103, 760-
822.
Altonji, J. G., & Mansfield, R. (2011). The role of family, school, and community characteristics
in inequality in education and labor-market outcomes. In G. Duncan & R. Murnane
(Eds.), Whither Opportunity? Rising Inequality, Schools, and Children's Life Chances
(pp. 207-228). New York: Russell Sage Foundation.
Anderson, C. S. (1982). The search for school climate: a review of the literature. Review of
Educational Research, 52, 368-420.
Andrews, M., Duncombe, W., & Yinger, J. (2002). Revisiting economies of size in American
education: are we any closer to a consensus? Economics of Education Review, 21, 245-
262.
Angrist, J., & Pischke, S. (2009). Mostly Harmless Econometrics: An Empiricists’ Companion.
Princeton, NJ: Princeton Univ. Press.
Ballou, D. (2009). Test scaling and value-added measurement. Education Finance and Policy, 4,
351-383.
Baydar, N., & Brooks-Gunn, J. (1991). Effects of maternal employment and child-care
arrangements on preschoolers' cognitive and behavioral outcomes: Evidence from the
Children of the National Longitudinal Survey of Youth. Developmental Psychology, 27,
932.
Berry, C. (2006). School consolidation and inequality. Brookings Papers on Education Policy,
9, 49-75.
Berry, C. R., & West, M. R. (2010). Growing pains: The school consolidation movement and
student outcomes. Journal of Law, Economics, and Organization, 26, 1-29.
Boccardo, J., Schwartz, A. E., Stiefel, L., & Wiswall, M. (2013). Beyond Academics: Do Small
Schools have Better Learning Environments? Unpublished Manuscript.
Chen, G. (2007). School Disorder and Student Achievement: A Study of New York
City Elementary Schools. Journal of School Violence, 6, 27-43.
28
Clotfelter, C. T., Ladd, H. F., Vigdor, J. L., & Diaz, R. A. (2004). Do school accountability
systems make it more difficult for low-performing schools to attract and retain high
quality teachers? Journal of Policy Analysis and Management, 23, 251-271.
Coleman, J. S. (1988). Social capital in the creation of human capital. American Journal of
Sociology, 94, S95-S120.
Conant, J. B. (1959). The American High School Today: A First Report to Interested Citizens.
New York: McGraw Hill Book Company.
Cotton, K. (1996). School Size, School Climate and Student Performance, Close-up #20.
Portland, OR: Northwest Regional Educational Laboratory.
Covay, E., & Carbonaro, W. (2010). After the Bell: Participation in Extracurricular Activities,
Classroom Behavior, and Academic Achievement. Sociology of Education, 83, 20-45.
Crispin, L. (2012). School Size and Student Achievement: Does One Size Fit All? Ohio State
University.
Currie, J., & Thomas, D. (2001). Early Test Scores, Socioeconomic Status, School
Quality, and Future Outcomes. Research in Labor Economics, 20, 103-132.
Dee, T. S., Ha, W., & Jacob, B. A. (2006). The effects of school size on parental involvement
and social capital: Evidence from the ELS: 2002. Brookings Papers on Education Policy,
9, 77-97.
Duncombe, W., & Yinger, J. (2007). Does school district consolidation cut costs? Economics of
Education Review, 22, 193-201.
Egalite, A. J., & Kisida, B. (2013). The impact of school size on student achievement:
Evidence from four states. EDRE Working Paper No. 2013-03
Ferris, J. S., & West, E. G. (2004). Economies of scale, school violence and the optimal size of
schools. Applied Economics, 36, 1677-1684.
Gottfredson, D. C., & DiPietro, S. M. (2011). School size, social capacity, and student
victimization. Sociology of Education, 84, 69-89.
Guarino, C. M., Reckase, M. D., & Wooldridge, J. M. (2012). Can value-added measures of
teacher performance be trusted? MSU Education Policy Center Working Paper 18:
Michigan State University.
Guryan, J., Hurst, E., & Kearney, M. (2008). Parental education and parental time with children.
The Journal of Economic Perspectives, 22, 23-46.
29
Haller, E. J. (1992). High school size and student indiscipline: another aspect of the school
consolidation issue? Educational Evaluation and Policy Analysis, 14, 145-156.
Hanushek, E. A., & Rivkin, S. G. (2010). Generalizations About Using Value-Added Measures
of Teacher Quality. American Economic Review, 100, 267-271.
Harris, D. N. (2006). Class size and school size: Taking the trade-offs seriously. Brookings
papers on education policy, 9, 137-161.
Jackson, C. K., & Bruegmann, E. (2009). Teaching students and teaching each other: The
importance of peer learning for teachers. American Economic Journal: Applied
Economics, 1, 85-108.
Jacob, B. A. (2005). Accountability, incentives and behavior: The impact of high-stakes testing
in the Chicago Public Schools. Journal of Public Economics, 89, 761-796.
Johnson, S. L. (2009). Improving the School Environment to Reduce School Violence: A
Review of the Literature. Journal of school health, 79, 451-465.
Krueger, A. B. (1999). Experimental Estimates of Education Production Functions. Quarterly
Journal of Economics, 114, 497-532.
Kuziemko, I. (2006). Using shocks to school enrollment to estimate the effect of school size on
student achievement. Economics of Education Review, 25, 63-75.
Lamdin, D. J. (1995). Testing for the effect of school size on student achievement within a
school district. Educational Economics, 3, 33-42.
Lee, V. E., & Loeb, S. (2000). School Size in Chicago Elementary Schools: Effects on Teachers’
Attitudes and Students’ Achievement. American Educational Research Journal, 37, 3-31.
Leithwood, K., & Jantzi, D. (2009). A Review of Empirical Evidence About School Size Effects:
A Policy Perspective. Review of Educational Research, 79, 464-490.
Leung, A., & Ferris, J. S. (2008). School size and youth violence. Journal of Economic Behavior
and Organization, 65, 318-333.
McMillen, B. J. (2004). School size, achievement, and achievement gaps. Education Policy
Analysis Archives, 12, 1-24.
Meier, K. J., & Bohte, J. (2000). Ode to Luther Gulick: Span of control and organizational
performance. Administration and Society, 32, 115-136.
MET. (2010). Learning about Teaching: Initial Findings from the Measures of Effective
Teaching Project, MET Project Research Paper. Seattle, Washington: Bill & Melinda
Gates Foundation.

30
Mittag, N. (2012). New methods to estimate models with large sets of fixed effects with an
application to matched employer-employee data from Germany. FDZ-Methodenreport
02/2012.
Ready, D. D., & Lee, V. E. (2006). Optimal context size in elementary schools: Disentangling
the effects of class size and school size. Brookings Papers on Education Policy, 9, 99-
135.
Rivkin, S. G., Hanushek, E., & Kain, J. F. (2005). Teachers, schools and academic achievement.
Econometrica, 73, 417-458.
Rockoff, J. E. (2004). The Impact of Individual Teachers on Student Achievement: Evidence
from Panel Data. American Economic Review, 94, 247-252.
Rothstein, J. (2010). Teacher quality in educational production: Tracking, decay, and student
achievement. Quarterly Journal of Economics, 125, 175-214.
Schoeneberger, J. A. (2012). Longitudinal attendance patterns: Developing high school dropouts.
The Clearing House, 85, 7-14.
Schwartz, A. E., Stiefel, L., & Wiswall, M. (2012). Do Small Schools Improve Performance in
Large, Urban Districts? Causal Evidence from New York City: Social Science Research
Network. Unpublished Manuscript.
Todd, P. E., & Wolpin, K. I. (2003). On the specification and estimation of the production
function for cognitive achievement. Economic Journal, 113, F3-F33.
Welsh, W., Stokes, R., & Greene, J. R. (2000). A macro-level model of school disorder. Journal
of Research in Crime and Delinquency, 37, 243-283.
Wooldridge, J.M. (2010). Econometric Analysis of Cross Section and Panel Data. 2nd Edition.
Cambridge, MA: MIT Press.
Wooldridge, J. (2013). Introductory econometrics, 5th
Edition. Mason, Ohio: South-Western
Cengage.
Wynne, E., & Ryan, K. (1997). Reclaiming our schools: teaching character, academics, and
discipline: Prentice Hall.

31
Table 1. Primary school size in North Carolina, 2004 through 2010
Schools Mean S.D. 25
th
Percentile Median
75th
Percentile N
All 511 209 364 500 639 8,978
2004 495 204 346 478 620 1,272
2005 500 207 356 487 624 1,279
2006 505 211 352 495 635 1,292
2007 520 216 365 508 648 1,300
2008 537 213 389 525 668 1,222
2009 516 208 374 506 640 1,254
2010 508 201 368 500 639 1,359
Charter 300 191 149 253 373 334
TPS 520 205 376 506 642 8,644
New 537 168 420 528 656 115
Not New 511 209 363 499 638 8,863
Urban 532 211 384 513 664 3,038
Rural 488 209 334 482 619 4,222
Suburban 533 198 389 516 665 1,718
High-Performing 538 222 385 526 677 3,337
Low-Performing 497 198 354 486 617 5,631
Within-school
annual Δ in size
Absolute value 35 48 9 21 41 7,401
Decreases -37 58 -40 -20 -9 3,361
Increases 33 39 10 22 42 3,950
Notes: School-years are the unit of analysis. School size is measured by total student
enrollment. 1,429 unique primary schools operated in NC between 2004 and 2010.
32
Table 2. Value-Added estimates of school size’s effect on academic achievement
Model
Specification Lag score
Lag score on
balanced panel
of schools
Lag score w/
school-specific
time trends
Gain score Gain score +
student FE
(1) (2) (3) (4) (5)
Math achievement
School size -0.009 -0.009 -0.006 -0.010 -0.007
(0.003)*** (0.003)*** (0.003)* (0.003)*** (0.005)
Lag score 0.79 0.79 0.79 1 1
(0.002)*** (0.002)*** (0.002)*** (0) (0)
Adj. R2 0.67 0.67 0.66 0.003 -0.23
Reading achievement
School Size -0.004 -0.004 -0.003 -0.005 0.004
(0.002)* (0.002)* (0.003) (0.003)* (0.006)
Lag Score 0.75 0.75 0.75 1 1
(0.002)*** (0.002)*** (0.002)*** (0) (0)
Adj. R2 0.61 0.61 0.60 0.002 -0.40
N (students) 1,132,815 976,497 1,132,815 1,132,815 1,132,815
N (schools) 1,429 1,074 1,429 1,429 1,429
Teacher-by-
school FE Yes Yes Yes Yes Yes
Notes: School size is measured in hundreds of students. Parentheses contain standard errors that
are robust to within-district correlations (188 districts). All specifications include the full set of
student- and school-level controls described in the text and summarized in Table A.2, including
teacher-by-school, grade, and year FE. The full sets of estimated coefficients for the math and
reading baseline specifications in column 1 are reported in appendix Table A.3. ***p < 0.01;
**p < 0.05.
33
Table 3. Tests for nonlinear effects of school size on academic achievement
Math achievement Reading achievement
Specification Log Quadratic Quartiles Lee-Loeb Log Quadratic Quartiles Lee-Loeb
(1) (2) (3) (4) (5) (6) (7) (8)
ln(size) -0.0485 -0.0157
(0.0187)** (0.0138)
Size -0.009 -0.002
(0.008) (0.005)
Size2 -0.00001 -0.00001
(0.00004) (0.00003)
1st quartile 0.0071 -0.0071
(0.0104) (0.0087)
4th
quartile -0.0027 -0.0161
(0.0073) (0.0049)***
Small school -0.0028 -0.0086
(0.0080) (0.0061)
Large school -0.0171 -0.0094
(0.0063)*** (0.0046)**
Size APE -0.009 -0.004
(0.004)** (0.002)
Joint sig. of size
terms (p value) 0.006 0.74 0.03 0.20 0.005 0.06
Sig. diff. between
size terms (p value) 0.44 0.16 0.35 0.91
Adjusted R2 0.67 0.67 0.67 0.67 0.61 0.61 0.61 0.61
Notes: N = 1,132,815. Parentheses contain standard errors that are robust to within-district correlations (188 districts). All
specifications include the full set of student- and school-level controls described in the text and summarized in Table A.2, including
lagged achievement and teacher-by-school, grade, and year fixed effects. In columns 2 and 6, schools size is measured in hundreds
of students and the APE (average partial effect) of school size is evaluated at the average school size of 511 students. In columns 3
and 7, the first and third quartiles of school size are 364 and 639 students, respectively. In columns 4 and 8, small schools contain <
400 students and large schools contain > 750 students, as defined by Lee and Loeb (2000). ***p < 0.01; **p < 0.05; *p < 0.10.
34
Table 4. Tests for heterogeneous effects of school size on academic achievement
Math achievement Reading achievement
(1) (2)
School size (S) -0.012 -0.006
(0.005)** (0.003)*
SLEP -0.0005 0.0002
(0.002) (0.001)
Spoverty -0.002 -0.003
(0.002) (0.001)*
Smale 0.001 0.001
(0.0005)** (0.0004)**
Scharter -0.118 -0.001
(0.038)*** (0.039)
SK–8 0.027 0.024
(0.009)*** (0.007)***
Snew school -0.031 -0.006
(0.010)*** (0.007)
Surban 0.006 0.001
(0.004) (0.002)
Srural -0.004 0.002
(0.004) (0.003)
Joint sig. of int.
terms (p value) < 0.001 0.009
Adjusted R2 0.67 0.61
Notes: N = 1,132,815. School size is measured in hundreds of students. Parentheses contain
standard errors that are robust to within-district correlations (188 districts). The specifications
reported in this Table are otherwise identical to the baseline specifications estimated in column
1 of Table 2 and include the full set of student- and school-level controls summarized in Table
A.2, including lagged achievement and teacher-by-school, grade, and year fixed effects. ***p <
0.01; **p < 0.05; *p < 0.10.
35
Table 5. Sensitivity analyses excluding time-varying school characteristics
Exclusions: ABC
performance
Disorderly
incidents
Student
demographics
Avg. daily
attendance
All
(of 1 – 4)
(1) (2) (3) (4) (5)
Math achievement
School size -0.010 -0.009 -0.009 -0.010 -0.010
(0.003)*** (0.003)*** (0.003)*** (0.003)*** (0.003)***
Adj. R2 0.67 0.67 0.67 0.67 0.67
Reading achievement
School size -0.004 -0.004 -0.004 -0.004 -0.004
(0.002)* (0.002)* (0.002)* (0.002)* (0.002)*
Adj. R2 0.61 0.61 0.61 0.61 0.61
Notes: N = 1,132,815. School size is measured in hundreds of students. Parentheses contain
standard errors that are robust to within-district correlations (188 districts). The specifications
reported in this Table are otherwise identical to the baseline specifications estimated in
column 1 of Table 2 and include the full set of student- and school-level controls summarized
in Table A.2, including lagged achievement and teacher-by-school, grade, and year FE. ***p
< 0.01; *p < 0.10.
36
Table 6. Value-Added estimates of grade size’s effect on academic achievement
Math achievement Reading achievement
(1) (2) (3) (4) (5) (6)
Grade size (GS) -0.0003 -0.0003 -0.0003 -0.0001 -0.0001 -0.0000
(0.0001)*** (0.0003) (0.0001)** (0.0001) (0.0002) (0.0001)
GS2 -0.0000003 0.0000002
(0.0000009) (0.000001)
GSLEP -0.0001 -0.0000
(0.0001) (0.0001)
GSpoverty -0.0001 -0.0002
(0.0001)* (0.0001)***
GSmale 0.0000 0.0000
(0.0000)* (0.0000)
GScharter -0.0072 0.0016
(0.0036)** (0.0032)
GSK–8 0.0009 0.0007
(0.0006) (0.0004)
GSnew -0.0004 0.0004
(0.0005) (0.0002)**
GSurban 0.0002 0.0000
(0.0002) (0.0001)
GSrural -0.0002 -0.0001
(0.0002) (0.0001)
Size APE -0.0003 -0.0001
(0.0001)*** (0.0001)
Joint sig.
(p value) 0.0005 0.011 0.69 0.06
Adj. R2 0.67 0.67 0.67 0.61 0.61 0.61
Notes: N = 1,132,815. Grade size is measured as total enrollment in students’ current grade. The average
and standard deviation of grade size in the estimation sample are 102 and 43, respectively. Parentheses
contain standard errors that are robust to within-district correlations (188 districts). The p values reported
in columns 2 and 5 are for an F test of the joint significance of GS and GS2; p values in columns 3 and 6
are for an F test of the joint significance of the GS interaction terms. All specifications include the full
set of student- and school-level controls summarized in Table A.2, including lagged scores and teacher-
by-school, grade, and year fixed effects. ***p < 0.01; **p < 0.05; *p < 0.10.

37
Notes: A kernel-density estimate of the school-size distribution is overlaid on the histogram.
The unit of analysis in this Figure is the school-year.
0
10
20
30
Fre
qu
ency
0 500 1,000 1,500
School Size (Total Enrollment)
Figure 1. School size distribution
38
Notes: A kernel-density estimate of the distribution of within-school annual enrollment changes
is overlaid on the histogram. The unit of analysis in this Figure is the school-year.
0
500
1,0
00
Fre
qu
ency
-600 -400 -200 0 200 400
Annual change in enrollment
Figure 2. Within-School annual changes in school size
39
Notes: The partial effects plotted in this Figure are based on the coefficient estimates of the
school-size quadratic in the baseline specification reported in columns 2 and 6 of Table 3.
-.01
-.008
-.006
-.004
-.002
Tes
t S
core
Sta
ndar
d D
evia
tions
0 500 1,000 1,500 School Size (in total student enrollment)
Math Reading
Figure 3. Quadratic partial effect of 100-student increase in school size
40
Table A.1. Primary school size in the United States, 2004 through 2010
Schools Mean S.D. Quartile 1 Quartile 2 Quartile 3 N
All 484 276 297 451 630 446,968
2004 487 289 291 448 634 63,729
2005 486 285 292 449 634 63,445
2006 484 280 294 450 630 62,945
2007 480 274 295 448 625 64,243
2008 481 271 298 451 627 64,466
2009 484 267 303 456 630 64,311
2010 486 264 307 458 631 63,829
Charter 305 250 132 239 416 15,200
TPS 490 275 305 457 635 431,768
Urban 536 271 354 495 671 124,440
Rural 360 262 158 311 505 132,728
Suburban 536 261 362 496 667 189,800
K-5 476 217 327 453 599 208,006
K-8 490 318 261 450 667 238,962
Within-school
annual ∆ in size
Absolute Value 33 65 7 17 36 379,238
Decreases -31 49 -36 -18 -8 191,562
Increases 37 79 8 18 37 180,114
Notes: School-years are the unit of analysis. School size is measured by total school enrollment.
The final sample includes all U.S. public schools in which the highest grade was 4th, 5th, 6th,
7th, or 8th grade. 72,771 unique primary schools operated in the U.S. between 2004 and 2010.
41
Table A.2. Summary statistics for baseline estimation sample
Unit of analysis: Student-year School-year
(1) (2)
Math score 0.08
(0.98)
Lagged math score 0.09
(0.97)
Peers’ lagged math score avg. 0.07
(0.43)
Reading score 0.07
(0.98)
Lagged reading score 0.08
(0.96)
Peers’ lagged reading score avg. 0.06
(0.41)
Class size 22.24
(3.87)
Fourth grade 0.51
Fifth grade 0.49
LEP student 0.29
Poverty (FRL eligible) student 0.46
Male student 0.50
White student 0.58
Black student 0.26
Asian student 0.02
Native American student 0.01
Hispanic student 0.09
Multi-racial student 0.03
School size 595 511
(210) (209)
Charter school 0.01 0.04
Magnet school 0.07 0.06
New school (first year) 0.01 0.01
K-5 school 0.95 0.91
K-8 school 0.05 0.09
Urban locale 0.34 0.34
Rural locale 0.45 0.47
Suburban or “other” locale 0.21 0.19
High performing ABC school 0.41 0.37
Low performing ABC school 0.59 0.63
School’s percent-white
enrollment 0.56 0.54
(0.27) (0.29)

42
School’s percent-black enrollment 0.28 0.31
(0.23) (0.26)
School’s percent-Hispanic
enrollment 0.11 0.10
(0.11) (0.11)
School’s avg. daily attendance
rate 0.96 0.96
(0.01) (0.01)
Number of classroom teachers 41.19 36.67
(13.04) (13.30)
Crimes per 1,000 students 0.14 0.16
(0.38) (0.42)
Suspensions per 1,000 students 0.01 0.009
(0.09) (0.11)
Expulsions per 1,000 students 0.00 0.0006
(0.01) (0.02)
Percent fully-licensed teachers 0.95 0.94
(0.07) (0.09)
Percent highly-qualified teachers 0.96 0.96
(0.08) (0.10)
2004 0.15 0.14
2005 0.14 0.14
2006 0.14 0.14
2007 0.14 0.14
2008 0.13 0.14
2009 0.13 0.14
2010 0.16 0.15
N 1,132,815 8,978
N (Unique Students) 722,676 n/a
N (Unique Schools) 1,429 1,429
Notes: Standard deviations reported in parentheses for non-binary
variables. Test scores were standardized using the full sample of
test scores, which is why the means and standard deviations are
not exactly 0 and 1, respectively, in the estimation sample.

43
Table A.3. Coefficient estimates for baseline value-added models
Math Achievement Reading Achievement
(1) (2)
School size -0.009 -0.004
(0.003)*** (0.002)*
Lag score 0.7901 0.7538
(0.0020)*** (0.0020)***
Peer avg. -0.0489 0.0183
(0.0086)*** (0.0072)**
LEP -0.0071 -0.0080
(0.0033)** (0.0032)**
Poverty (FRL) -0.0921 -0.1096
(0.0030)*** (0.0028)***
Male -0.0063 -0.0238
(0.0014)*** (0.0014)***
Black -0.0971 -0.1314
(0.0062)*** (0.0059)***
Asian 0.1068 0.0202
(0.0069)*** (0.0091)**
Native American -0.0596 -0.0776
(0.0084)*** (0.0097)***
Hispanic -0.0053 -0.0599
(0.0073) (0.0075)***
Multi-Racial -0.0252 -0.0345
(0.0036)*** (0.0037)***
Class size -0.0052 -0.0023
(0.0005)*** (0.0004)***
Fifth grade 0.0205 0.0137
(0.0099)** (0.0059)**
2005 0.0065 0.0002
(0.0052) (0.0046)
2006 0.0004 -0.0068
(0.0081) (0.0063)
2007 -0.0003 -0.0003
(0.0087) (0.0087)
2008 0.0062 0.0062
(0.0093) (0.0093)
2009 0.0023 0.0023
(0.0078) (0.0078)
2010 -0.0079 -0.0079
(0.0092) (0.0092)
Magnet 0.0496 0.0496
(0.0078)*** (0.0078)***
New school 0.0055 0.0055
(0.0122) (0.0122)
K-8 school -0.0325 -0.0325
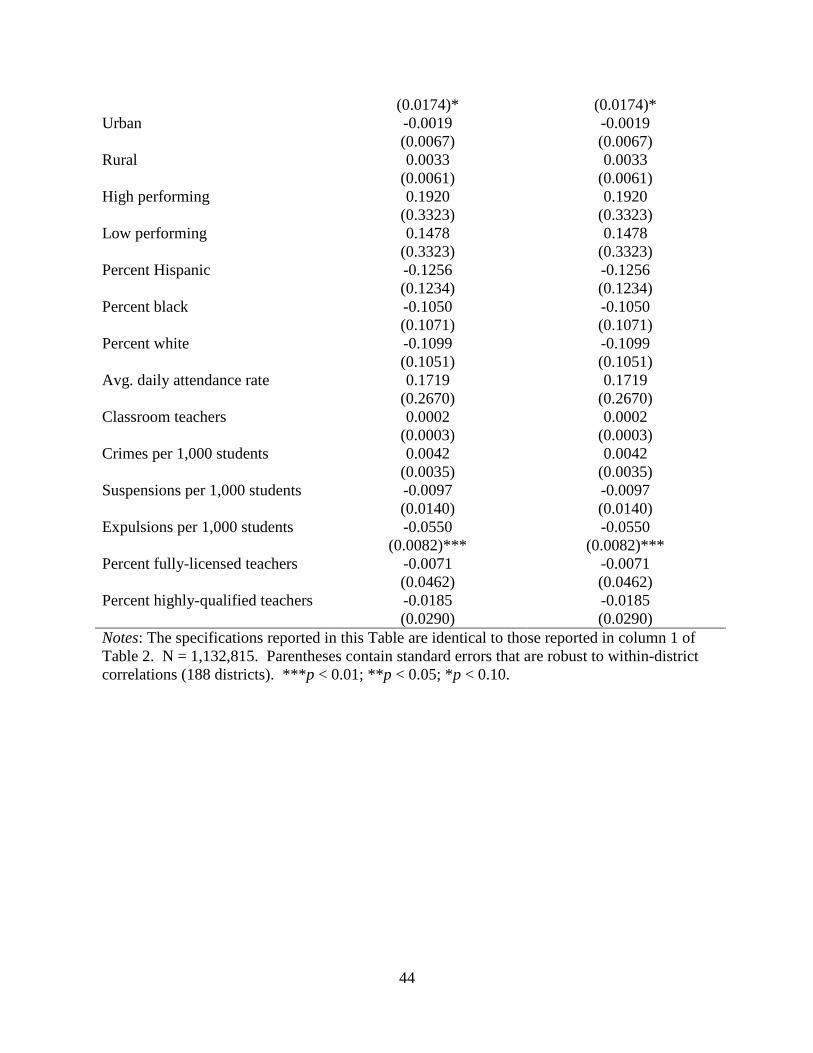
44
(0.0174)* (0.0174)*
Urban -0.0019 -0.0019
(0.0067) (0.0067)
Rural 0.0033 0.0033
(0.0061) (0.0061)
High performing 0.1920 0.1920
(0.3323) (0.3323)
Low performing 0.1478 0.1478
(0.3323) (0.3323)
Percent Hispanic -0.1256 -0.1256
(0.1234) (0.1234)
Percent black -0.1050 -0.1050
(0.1071) (0.1071)
Percent white -0.1099 -0.1099
(0.1051) (0.1051)
Avg. daily attendance rate 0.1719 0.1719
(0.2670) (0.2670)
Classroom teachers 0.0002 0.0002
(0.0003) (0.0003)
Crimes per 1,000 students 0.0042 0.0042
(0.0035) (0.0035)
Suspensions per 1,000 students -0.0097 -0.0097
(0.0140) (0.0140)
Expulsions per 1,000 students -0.0550 -0.0550
(0.0082)*** (0.0082)***
Percent fully-licensed teachers -0.0071 -0.0071
(0.0462) (0.0462)
Percent highly-qualified teachers -0.0185 -0.0185
(0.0290) (0.0290)
Notes: The specifications reported in this Table are identical to those reported in column 1 of
Table 2. N = 1,132,815. Parentheses contain standard errors that are robust to within-district
correlations (188 districts). ***p < 0.01; **p < 0.05; *p < 0.10.

45
Online Appendix: Cost Benefit Analysis
The back-of-the-envelope cost-benefit analysis of a 50 percent reduction in school size discussed
in the discussion section of the main text uses crude approximations of the costs and benefits
associated with implementing such a policy. The exercise follows the approach of Kuziemko
(2006), using updated estimates of costs and benefits where applicable. Like Kuziemko, the
exercise is conservative in that we choose estimates that likely overstate the costs and understate
the benefits of reducing school size. Benefits are measured as the average increase to an
individual’s present discounted value (PDV) of lifetime earnings attributable to a policy that
reduces school size by 50 percent, ignoring the positive externalities potentially associated with a
better-educated public and smaller schools. Following Kuziemko (2006), we compute the PDV
as follows.
We begin by translating the estimated effect of school size on academic performance to
the corresponding effect on future earnings. Our preferred estimates of the effect of a 100-
student change in school size on math achievement (0.009 test-score standard deviations (s.d.))
suggest that a 50 percent reduction in school size increases math achievement by 0.023 test-score
s.d. Assuming that a one s.d. increase in math achievement is associated with a 13 percent
increase in future earnings (Hanushek, 2013), a 50 percent reduction in school size increases
future earnings by 0.3 percent.18
This amounts to $171.50 annually, as the average income of a
full-time, year-round worker in the U.S. in 2011 was roughly $57,165.19
Assuming that the
18
Hanushek (2013) notes that estimated effects of a one s.d. increase in test scores on earnings
range from 13 to 20 percent. Using the upper-bound estimate of 20 percent yields an estimated
benefit of $4,235, which does not change the qualitative finding that the costs associated with a
50 percent reduction in school size are greater than the corresponding benefits. 19
Based on authors’ calculations using IPUMS archives of the March supplement of the 2011
Current Population Survey (CPS).

46
individual works from age 18 to 65, experiences no real income growth, and has a 4 percent
discount rate the PDV of the earnings gain attributable to a 50 percent reduction in school size is
$171.501
1.04( )t-10
»
t=18
65
å $2762, (A.1)
which is a crude approximation of the average benefit to an individual of reducing school size by
50 percent and can be compared to the approximate per-student costs of implementing such a
policy.20
Reducing school size incurs two types of costs. First, schools’ operating costs will likely
increase. Following Kuziemko (2006), we assume that a 50 percent decrease in school size will
create a 20 percent increase in per-pupil operating costs (Taylor & Bradley, 2000). In 2009 the
national average of per-pupil spending was $10,591 (Snyder & Dillow, 2012).21
Assuming that
students remain in school for six years following the school-size reduction, operating costs per
pupil will increase by:
6$10,591 0.2
$11,548.6 1
1.041t
(A.2)
It is clear from comparing (A.2) to (A.1) that the increased operating costs alone exceed the
likely benefits of a 50 percent reduction in school size.
Second, reducing school size by 50 percent would also require the construction of new
schools. In the 2009-10 school-year, the U.S. was home to 72,870 public elementary schools that
served 34,417,985 elementary students (Snyder & Dillow, 2012). If the policy is enacted
20
This is the discount rate used by Kuziemko (2006), on the grounds that it is approximately the
return to an inflation-adjusted U.S. government bond. 21
This Figure overstates the increase in operating cost because it includes both operating and
capital costs.
47
immediately, 36,435 new elementary schools would be required to reduce school size by 50
percent. The average cost of building a public elementary school in 2011 was $16,400,000
(Abramson, 2012). Assuming the average age of existing schools is 40 years, the per-pupil
annual increase in the cost of constructing elementary schools is $430, which amounts to $2,582
over six years of elementary school instruction. Taken together, the estimated increase in total
operating expenses and construction costs far outweigh the benefits, though it is worth keeping
in mind that this cost-benefit analysis is approximate, makes a number of simplifying
assumptions, and takes a conservative approach biased towards finding that costs exceed
benefits. A more rigorous cost-benefit analysis of a school-size reduction policy would be a
valuable contribution to the literature. Similarly, it would be useful to compare the results of a
more rigorous cost-benefit analysis to similar analyses of other educational interventions.
References
Abramson, P. (2012). 2012 Annual School Construction Report. School Planning and
Management. February, CR2-CR15.
Hanushek, E. A. (2013). Use of Value Added in Teacher Policy Measures. Focus 29, 25-26.
Snyder, T. D., & Dillow, S. A. (2012). Digest of Education Statistics 2011. National Center for
Education Statistics: Wahsington, D.C. (http://nces.ed.gov/pubs2012/2012001.pdf, accessed
April 19, 2013).
Taylor, J., & Bradley, S. (2000). Resource utilization and economies of size in secondary
schools. Bulletin of Economic Research, 52, 123-150.