Embed Size (px)
Citation preview
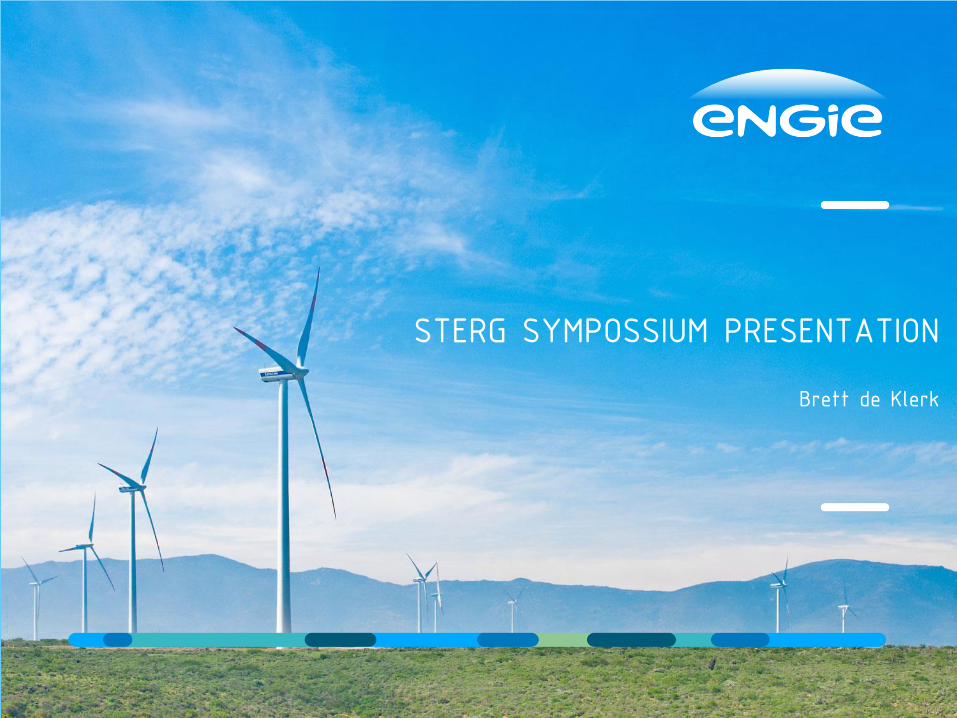
STERG Presentation Brett de Klerk
July 16, 2016 STERG SYMPOSSIUM PRESENTATION
Brett de Klerk
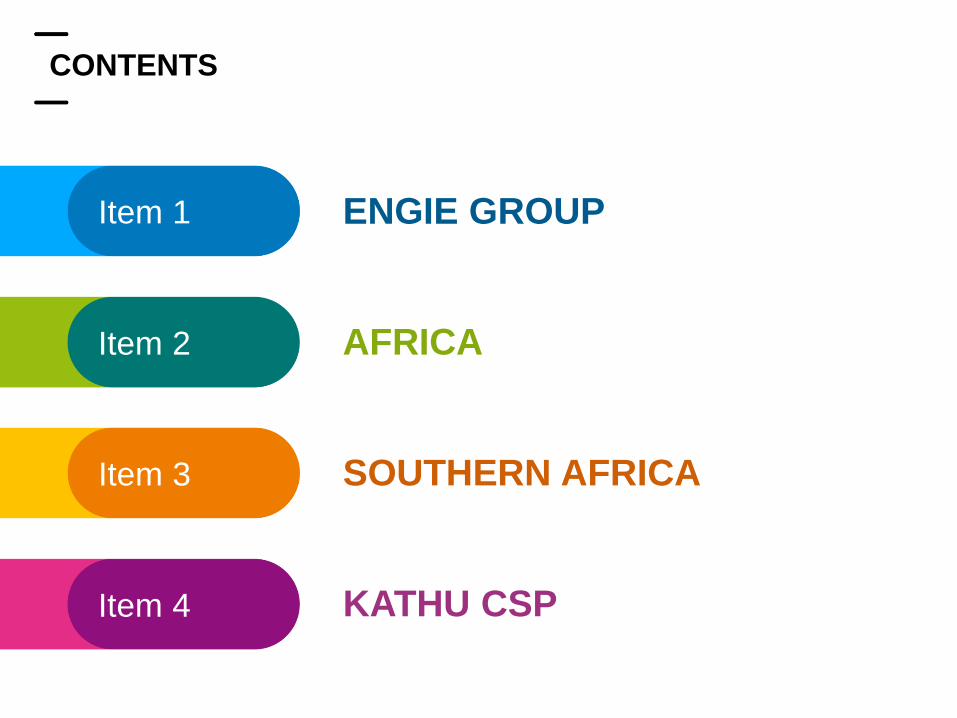
CONTENTS
Item 1 ENGIE GROUP
Item 2 AFRICA
Item 3 SOUTHERN AFRICA
Item 4 KATHU CSP
ENGIE GROUP
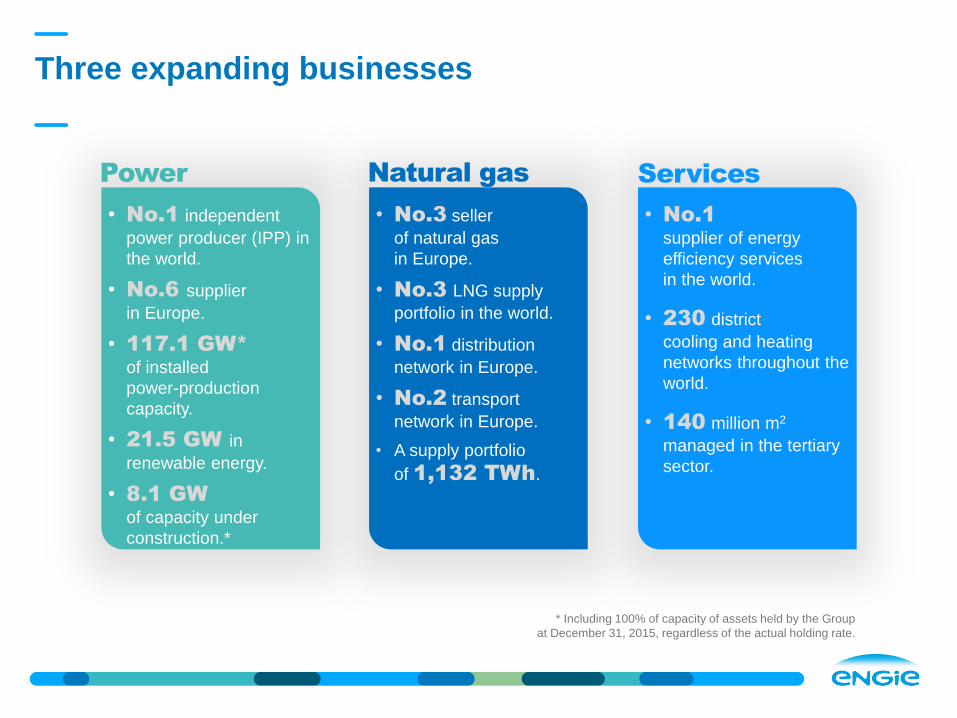
• No.1
supplier of energy
efficiency services
in the world.
• 230 district
cooling and heating
networks throughout the
world.
• 140 million m2
managed in the tertiary
sector.
• No.3 seller
of natural gas
in Europe.
• No.3 LNG supply
portfolio in the world.
• No.1 distribution
network in Europe.
• No.2 transport
network in Europe.
• A supply portfolio
of 1,132 TWh.
• No.1 independent
power producer (IPP) in
the world.
• No.6 supplier
in Europe.
• 117.1 GW* of installed
power-production
capacity.
• 21.5 GW in
renewable energy.
• 8.1 GW of capacity under
construction.*
Three expanding businesses
Power Services
* Including 100% of capacity of assets held by the Group
at December 31, 2015, regardless of the actual holding rate.
Natural gas
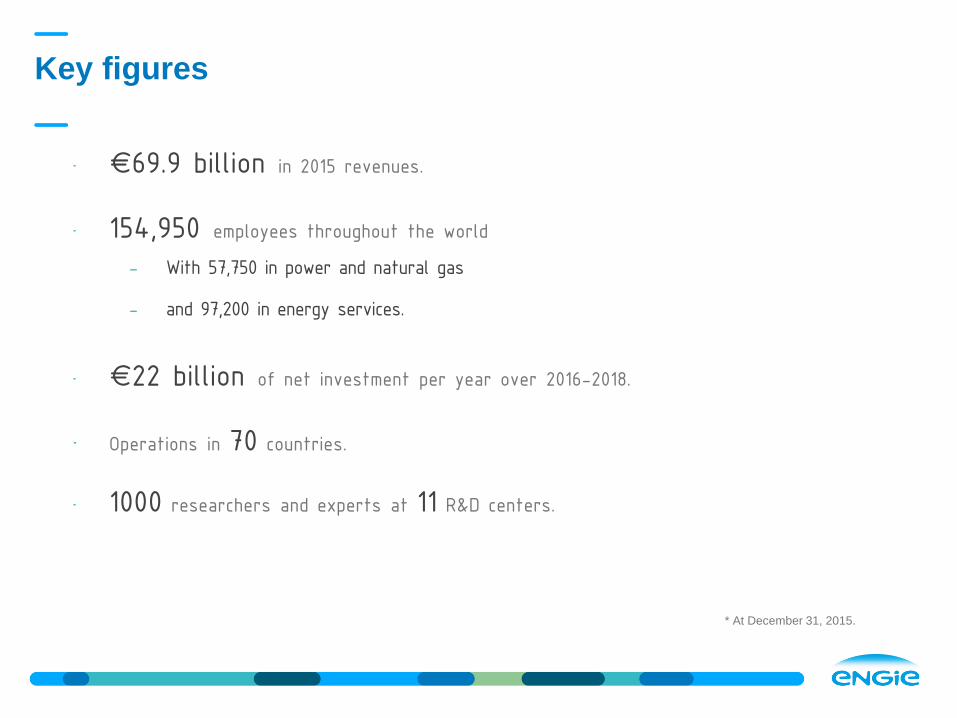
• €69.9 billion in 2015 revenues.
• 154,950 employees throughout the world
- With 57,750 in power and natural gas
- and 97,200 in energy services.
• €22 billion of net investment per year over 2016-2018.
• Operations in 70 countries.
• 1000 researchers and experts at 11 R&D centers.
Key figures
* At December 31, 2015.
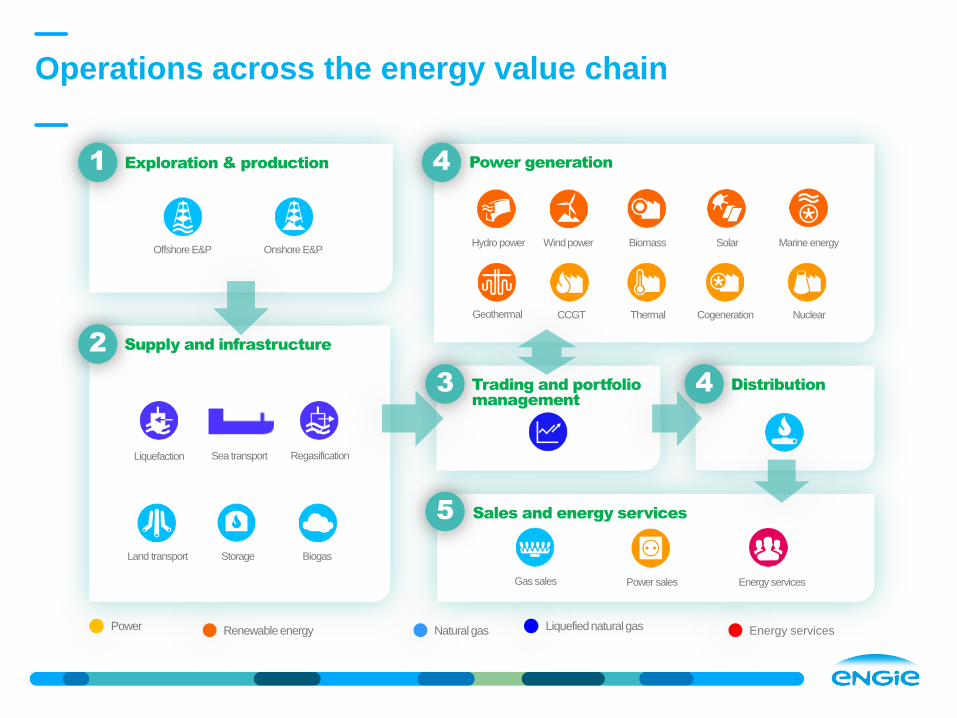
Operations across the energy value chain
Renewable energy Natural gas Energy services
Distribution
Sales and energy services
Trading and portfolio
management
Supply and infrastructure
Power generation Exploration & production
Hydro power Biomass
CCGT Thermal Cogeneration
Marine energy Wind power
Nuclear
Offshore E&P
Sea transport
Land transport
Onshore E&P
Liquefaction Regasification
Storage
Gas sales
Biogas
Power sales
2
1
3
4
5
Geothermal
Solar
4
Energy services
Power Liquefied natural gas
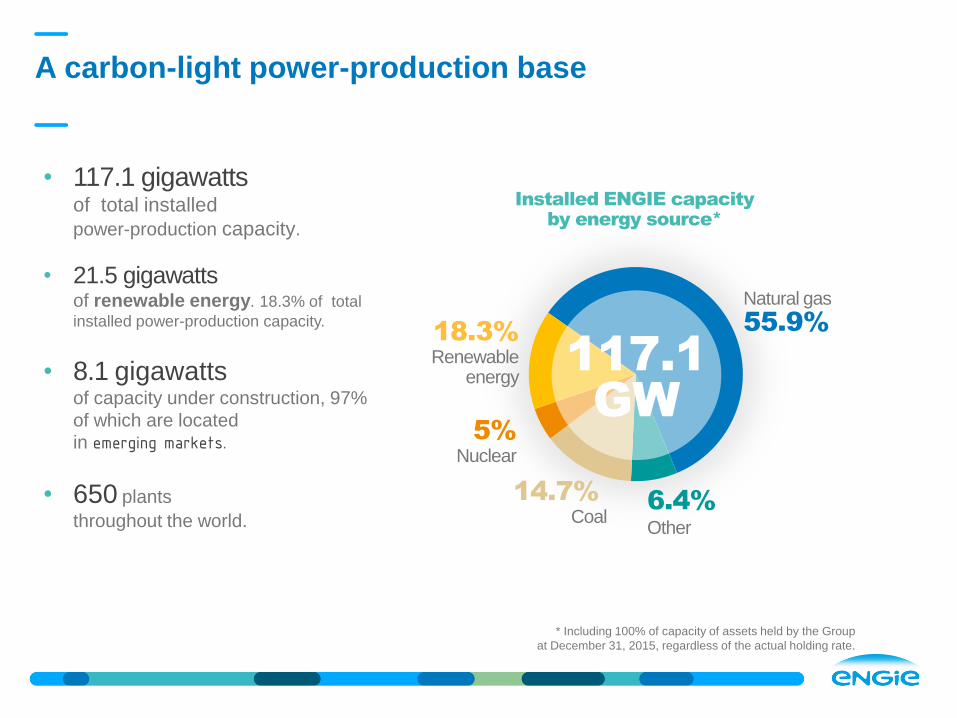
• 117.1 gigawatts of total installed
power-production capacity.
• 21.5 gigawatts of renewable energy. 18.3% of total
installed power-production capacity.
• 8.1 gigawatts of capacity under construction, 97%
of which are located
in emerging markets.
• 650 plants
throughout the world.
A carbon-light power-production base
Installed ENGIE capacity
by energy source*
18.3%
Renewable energy
6.4%
Other
14.7%
Coal
5%
Nuclear
Natural gas
55.9%
* Including 100% of capacity of assets held by the Group
at December 31, 2015, regardless of the actual holding rate.
117.1
GW
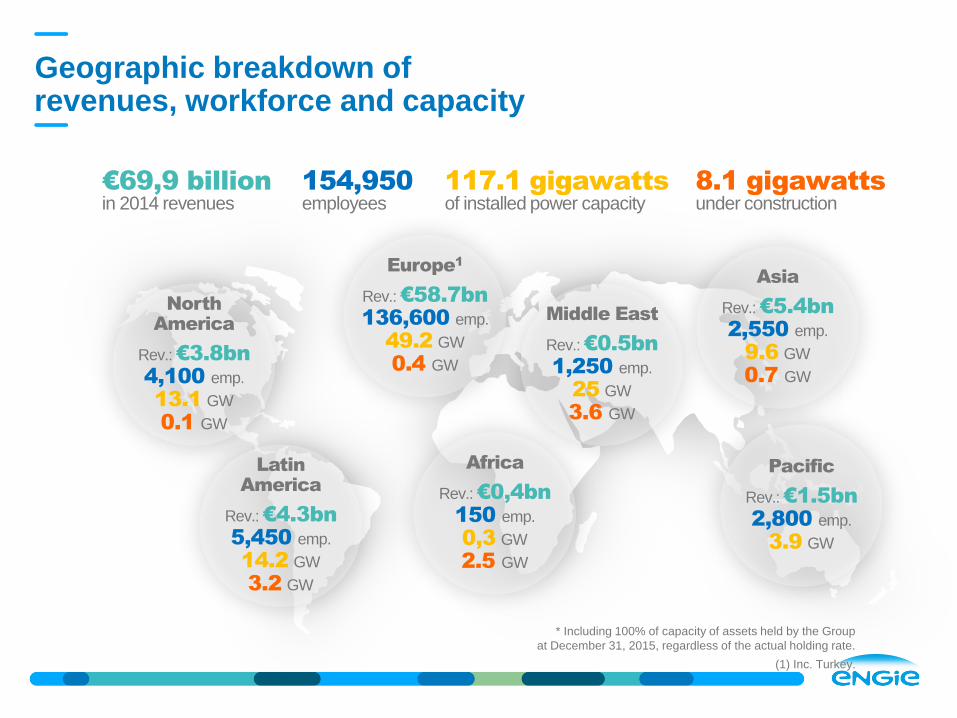
Geographic breakdown of revenues, workforce and capacity
* Including 100% of capacity of assets held by the Group
at December 31, 2015, regardless of the actual holding rate.
(1) Inc. Turkey.
€69,9 billion
in 2014 revenues 154,950 employees
8.1 gigawatts
under construction 117.1 gigawatts
of installed power capacity
Latin
America
Rev.: €4.3bn
5,450 emp.
14.2 GW
3.2 GW
North
America
Rev.: €3.8bn
4,100 emp.
13.1 GW
0.1 GW
Europe1
Rev.: €58.7bn
136,600 emp.
49.2 GW
0.4 GW
Africa
Rev.: €0,4bn
150 emp.
0,3 GW
2.5 GW
Middle East
Rev.: €0.5bn
1,250 emp.
25 GW
3.6 GW
Asia
Rev.: €5.4bn
2,550 emp.
9.6 GW
0.7 GW
Pacific
Rev.: €1.5bn
2,800 emp.
3.9 GW
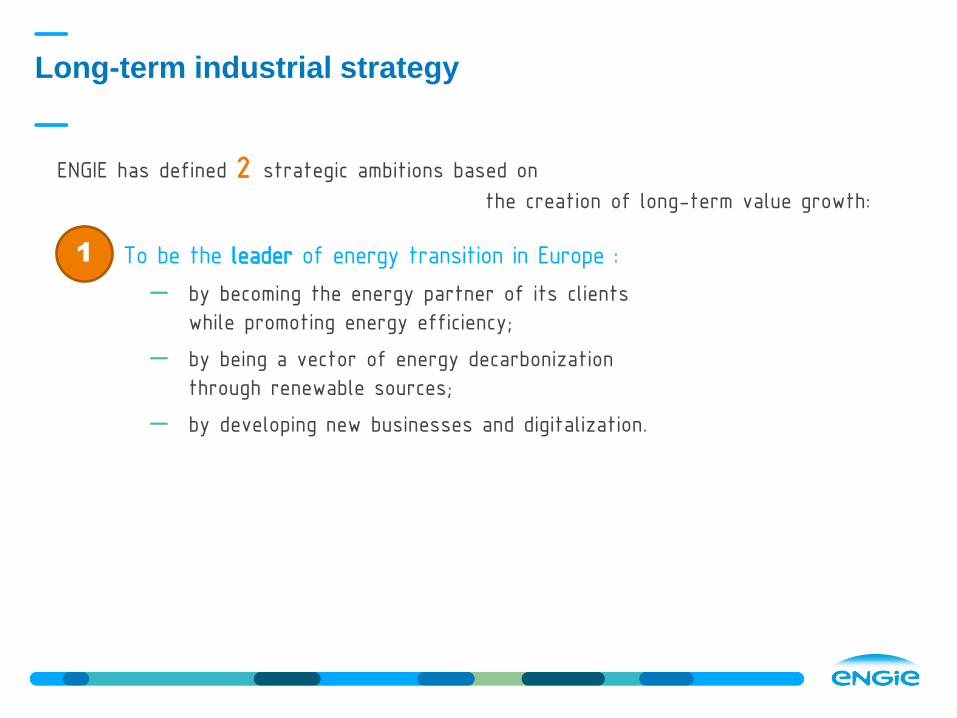
ENGIE has defined 2 strategic ambitions based on the creation of long-term value growth:
To be the leader of energy transition in Europe :
‒ by becoming the energy partner of its clients
while promoting energy efficiency;
‒ by being a vector of energy decarbonization
through renewable sources;
‒ by developing new businesses and digitalization.
Long-term industrial strategy
1
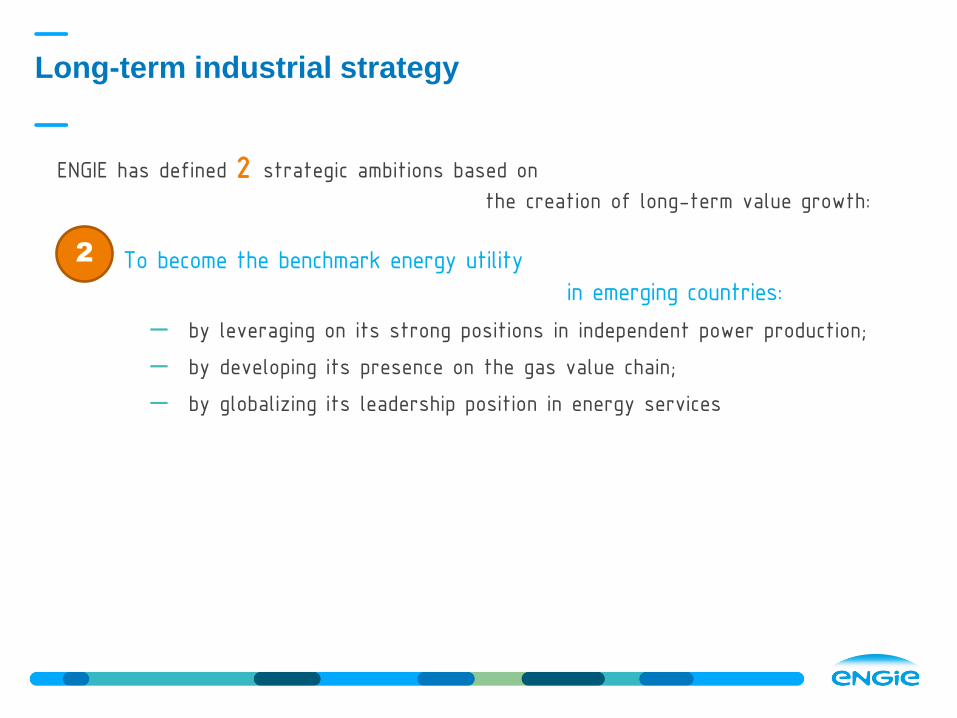
ENGIE has defined 2 strategic ambitions based on the creation of long-term value growth:
To become the benchmark energy utility
in emerging countries:
‒ by leveraging on its strong positions in independent power production;
‒ by developing its presence on the gas value chain;
‒ by globalizing its leadership position in energy services
Long-term industrial strategy
2
AFRICA
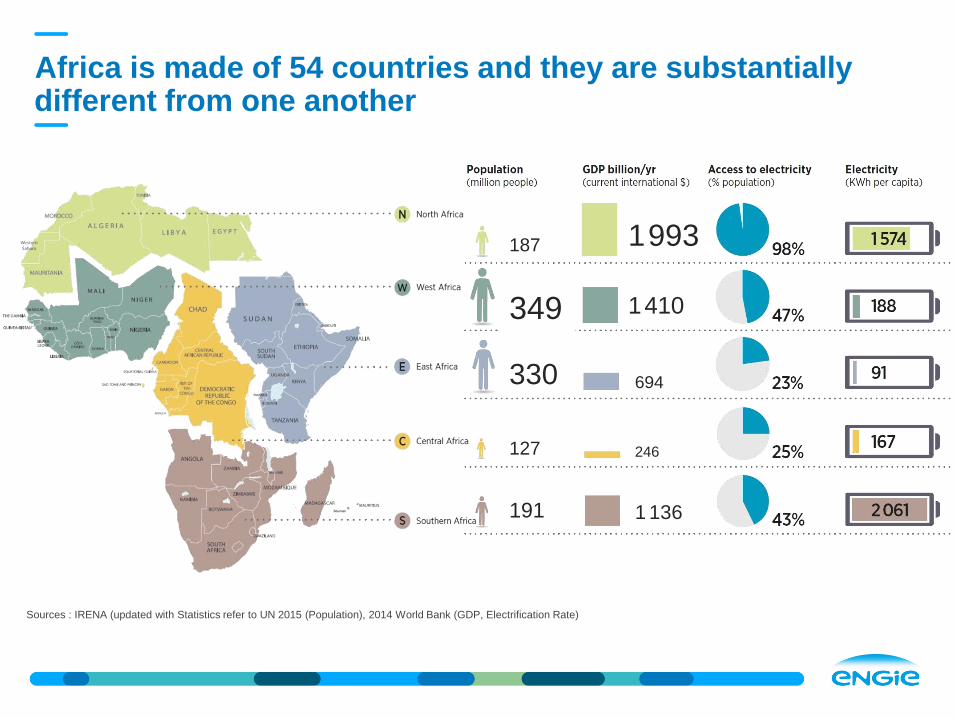
Africa is made of 54 countries and they are substantially different from one another
Sources : IRENA (updated with Statistics refer to UN 2015 (Population), 2014 World Bank (GDP, Electrification Rate)
187
349
330
127
191
1 993
1 410
1 136
694
246
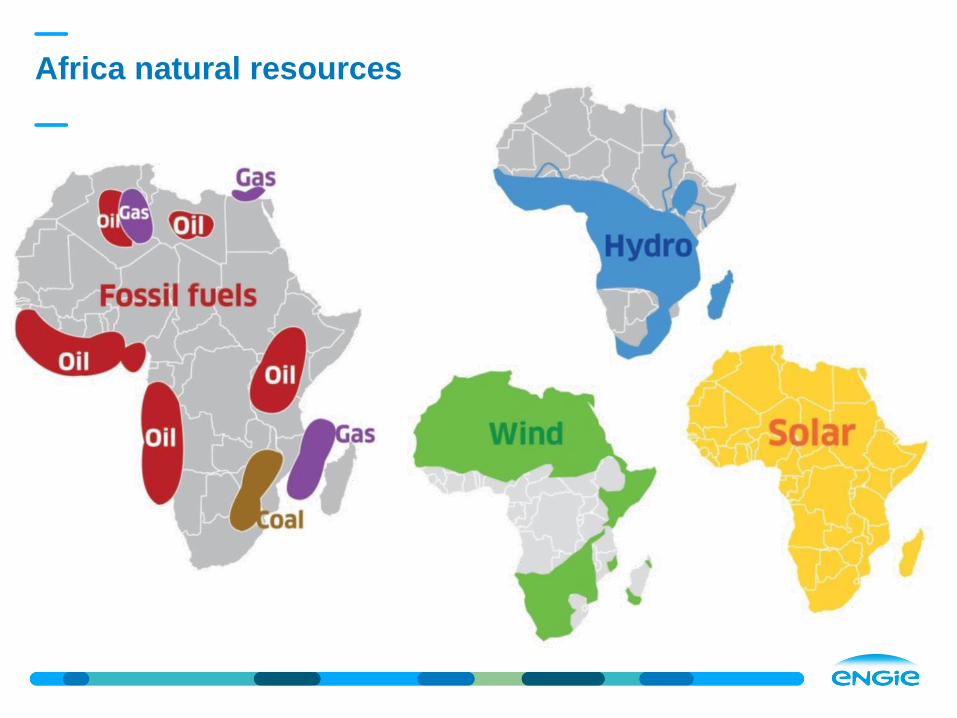
Africa natural resources
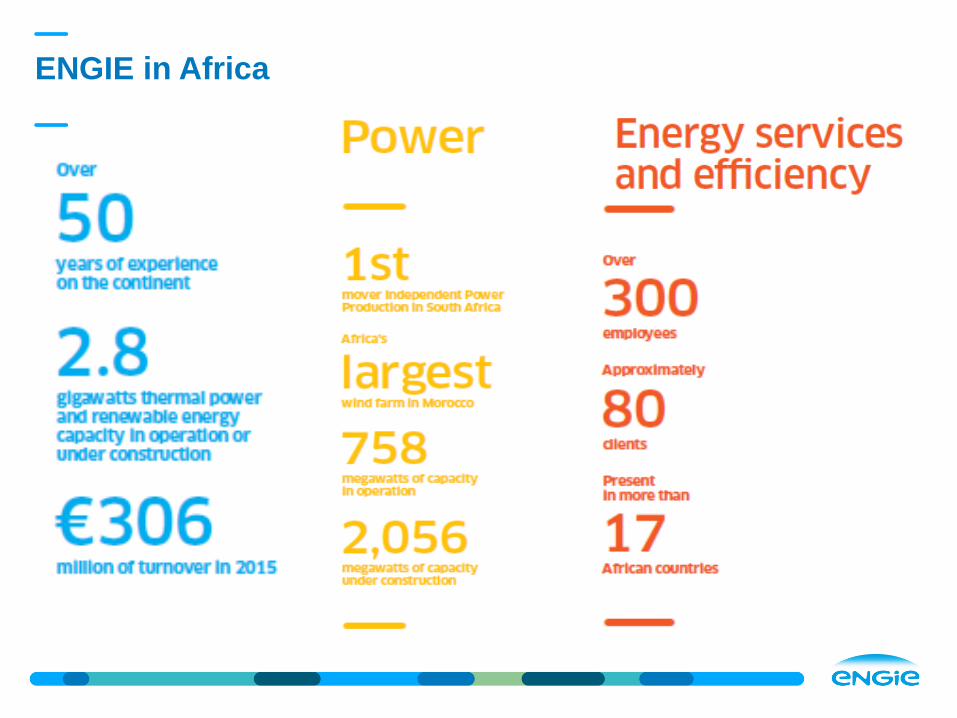
ENGIE in Africa
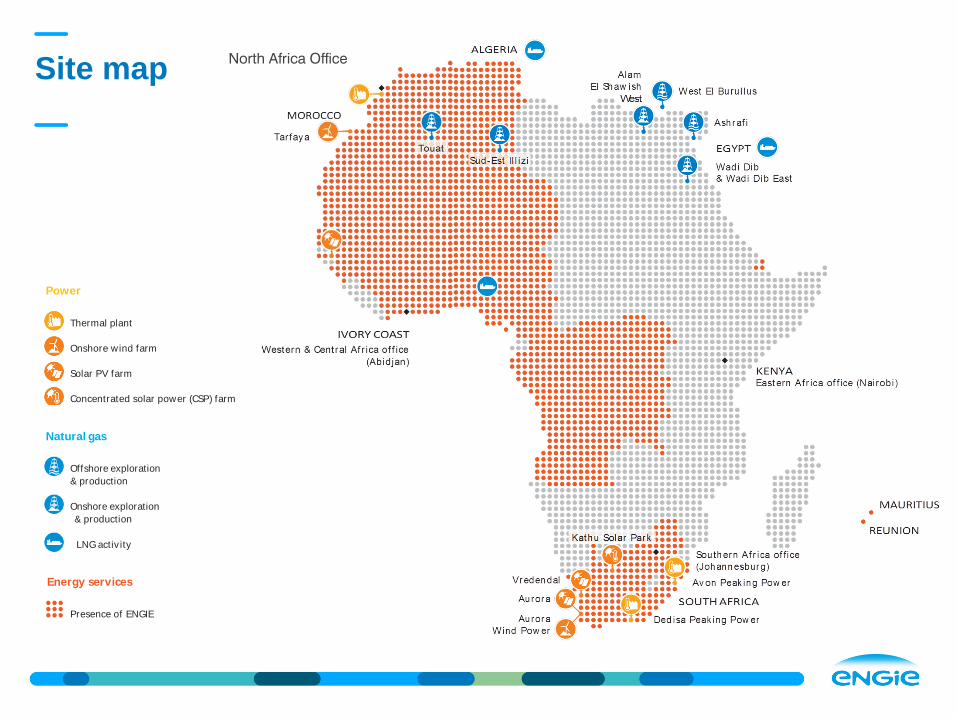
Site map
Power
Thermal plant
Onshore wind farm
Solar PV farm
Concentrated solar power (CSP) farm
Natural gas
Offshore exploration
& production
Onshore exploration
& production
LNG activ ity
Energy services
Presence of ENGIE
Offi es
MOROCCO
Tarfaya
IVORY COAST
Western & Central Af r ica of f ice
(Abidjan)
Touat
North Africa Office
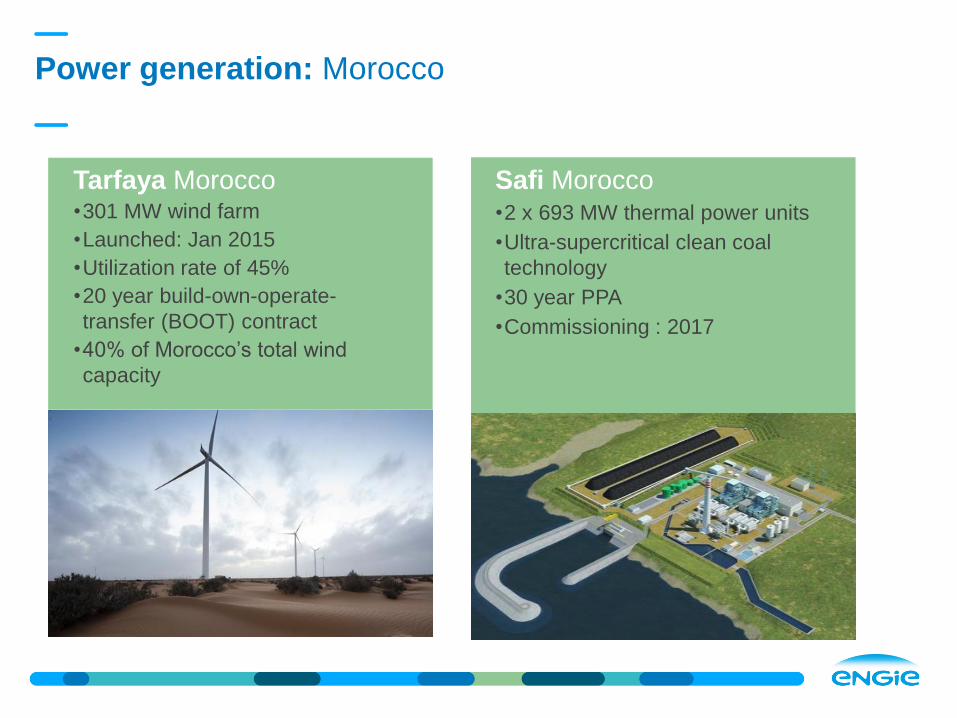
Power generation: Morocco
Safi Morocco •2 x 693 MW thermal power units
•Ultra-supercritical clean coal
technology
•30 year PPA
•Commissioning : 2017
Tarfaya Morocco •301 MW wind farm
•Launched: Jan 2015
•Utilization rate of 45%
•20 year build-own-operate-
transfer (BOOT) contract
•40% of Morocco’s total wind
capacity
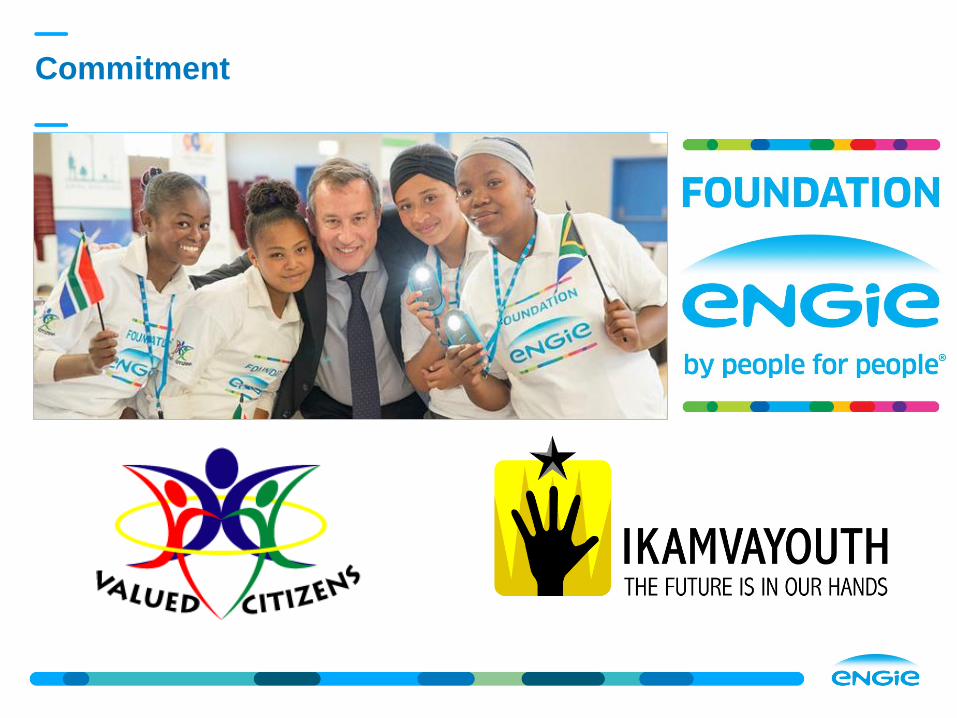
Commitment
SOUTHERN AFRICA
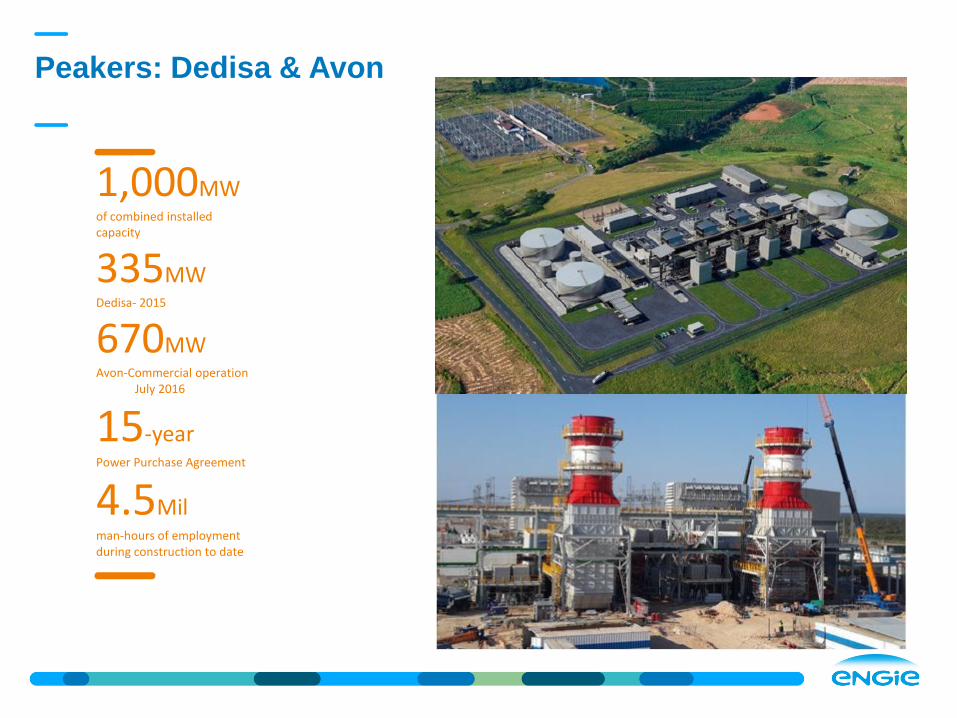
Peakers: Dedisa & Avon
1,000MW of combined installed
capacity
335MW Dedisa- 2015
670MW Avon-Commercial operation July 2016
15-year Power Purchase Agreement
4.5Mil man-hours of employment during construction to date
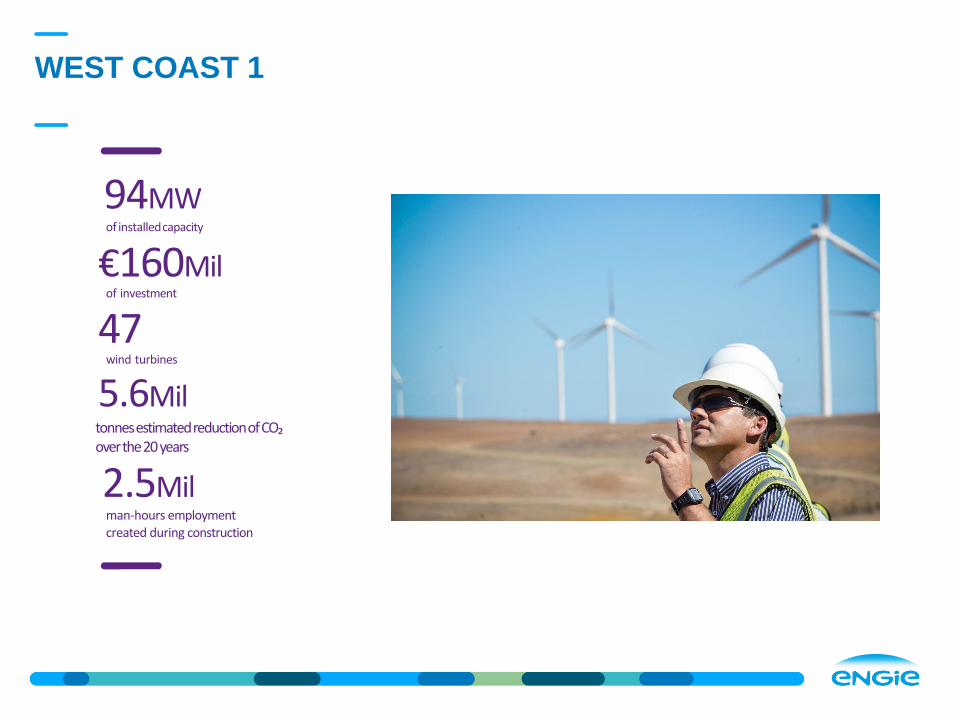
WEST COAST 1
94MW of installed capacity
€160Mil of investment
47 wind turbines
5.6Mil tonnes estimated reduction of CO₂ over the 20 years
2.5Mil man-hours employment created during construction
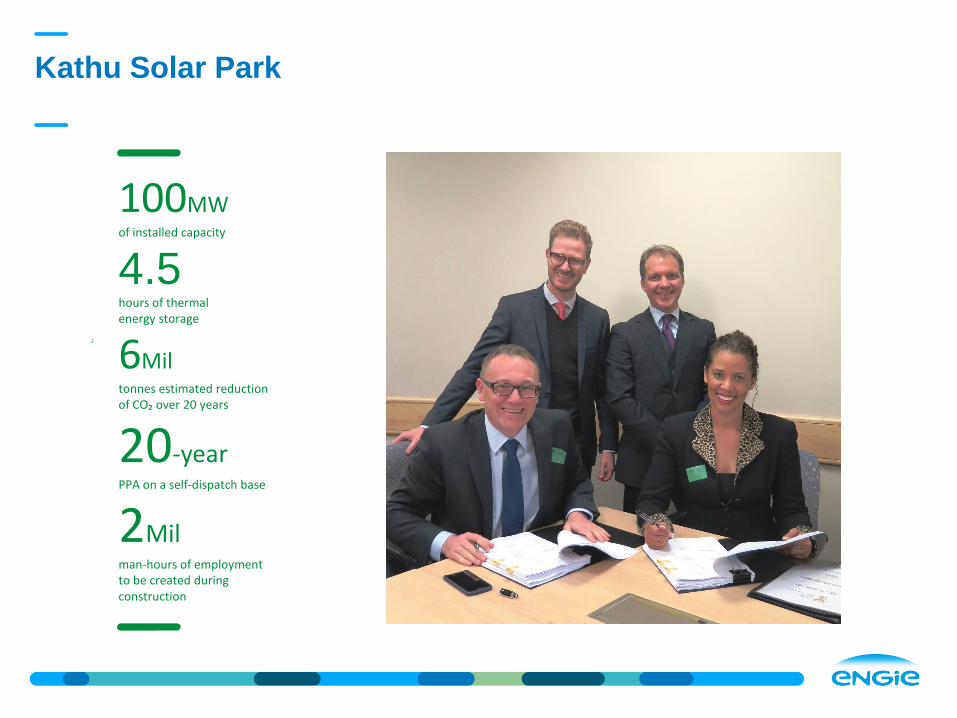
Kathu Solar Park
2
100MW of installed capacity
4.5 hours of thermal energy storage
6Mil tonnes estimated reduction of CO₂ over 20 years
20-year PPA on a self-dispatch base
2Mil man-hours of employment to be created during construction
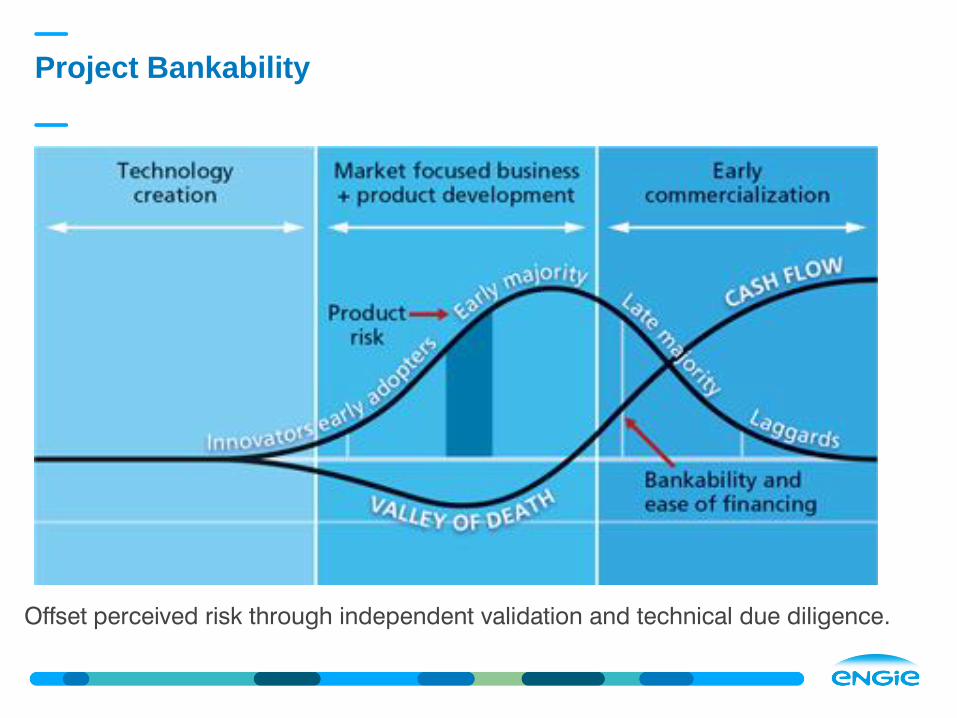
Offset perceived risk through independent validation and technical due diligence.
Project Bankability
• 1000 researchers and experts at 11 R&D centers.
Research from Africa?
Coming soon….
Developing for the Future
Developing for the Future
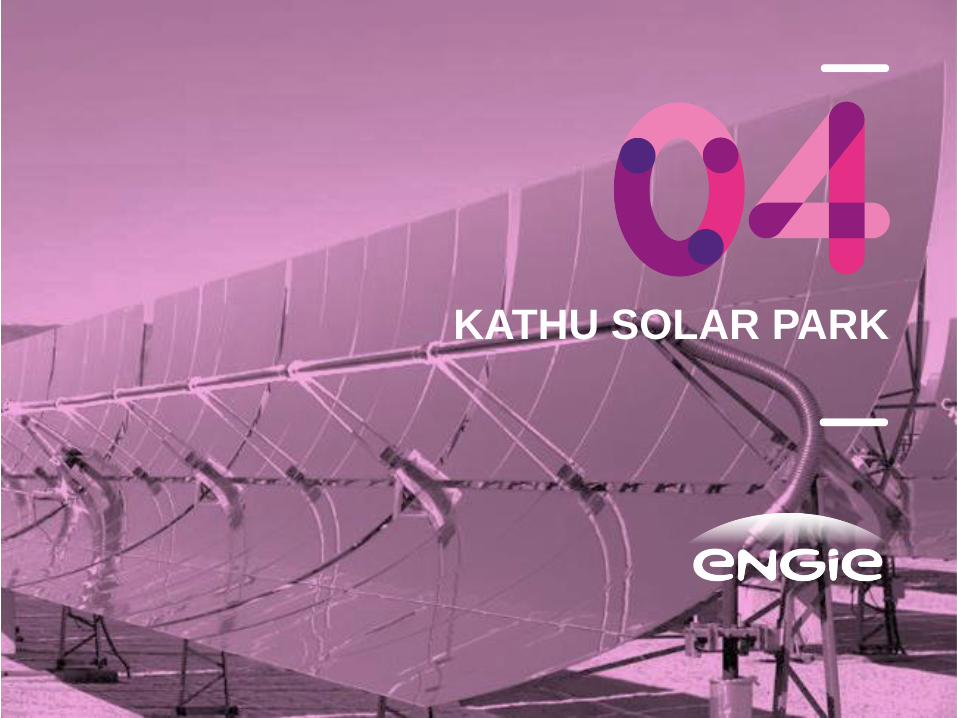
KATHU SOLAR PARK
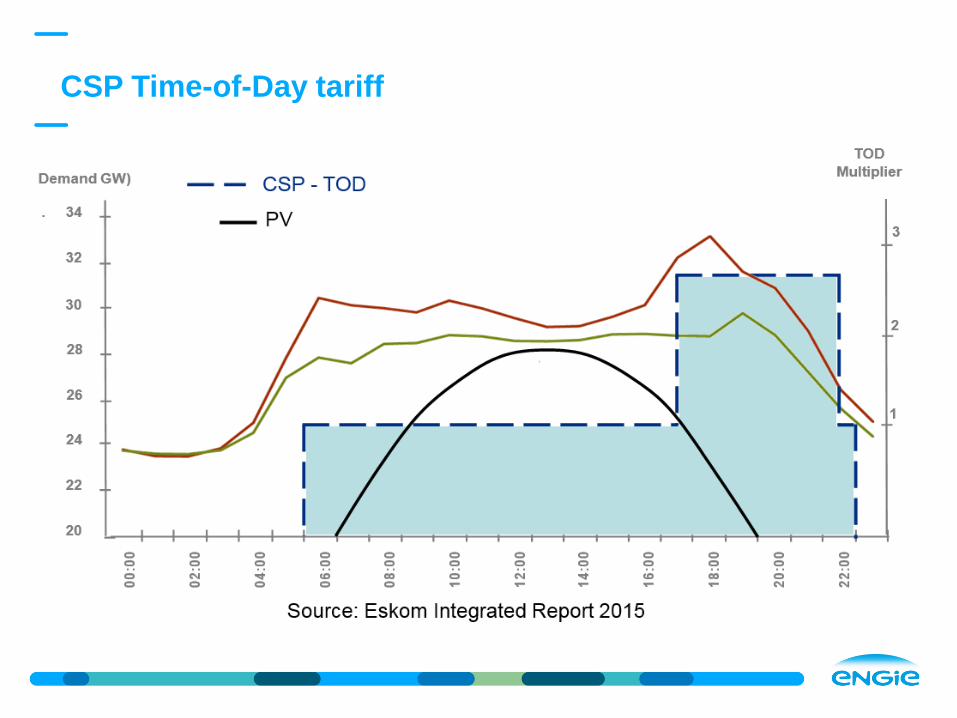
CSP Time-of-Day tariff
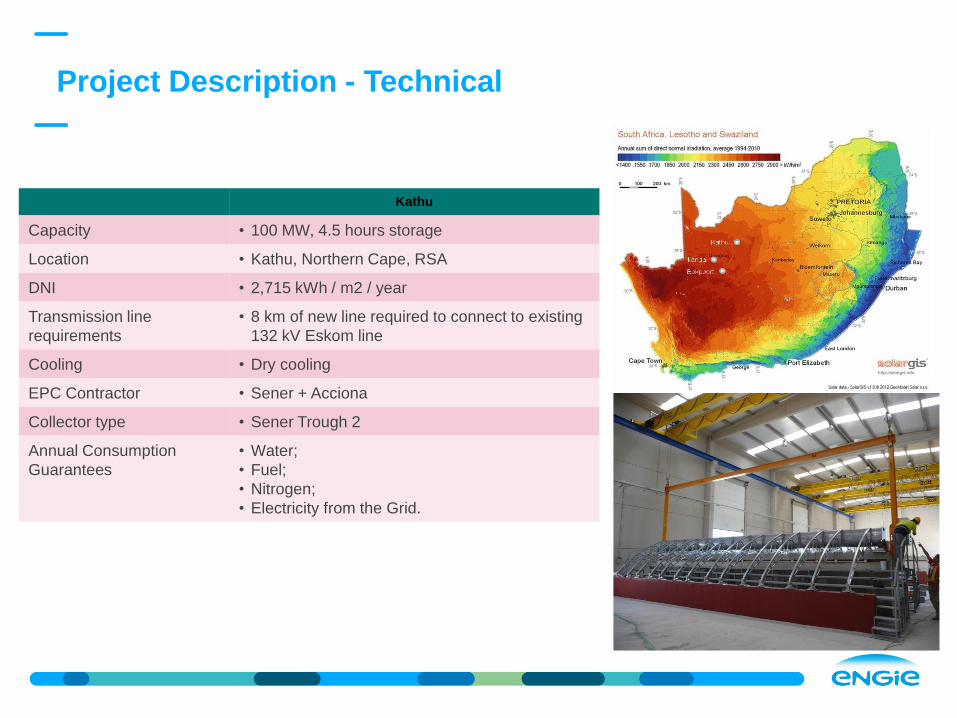
Project Description - Technical
Kathu
Capacity • 100 MW, 4.5 hours storage
Location • Kathu, Northern Cape, RSA
DNI • 2,715 kWh / m2 / year
Transmission line
requirements
• 8 km of new line required to connect to existing
132 kV Eskom line
Cooling • Dry cooling
EPC Contractor • Sener + Acciona
Collector type • Sener Trough 2
Annual Consumption
Guarantees
• Water;
• Fuel;
• Nitrogen;
• Electricity from the Grid.
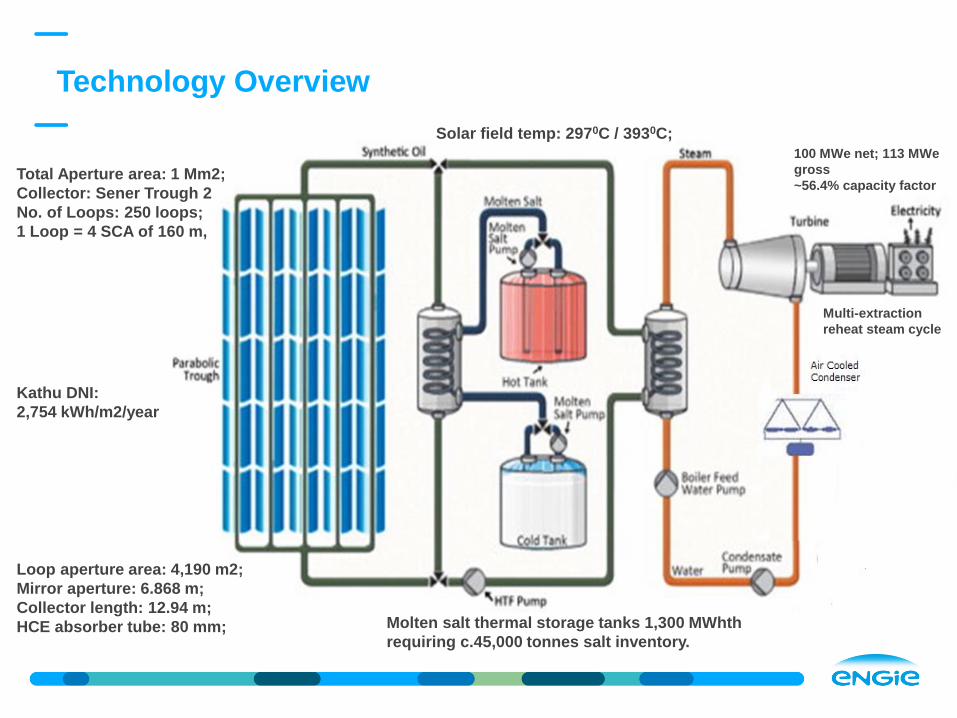
Multi-extraction
reheat steam cycle
100 MWe net; 113 MWe
gross
~56.4% capacity factor
Total Aperture area: 1 Mm2;
Collector: Sener Trough 2
No. of Loops: 250 loops;
1 Loop = 4 SCA of 160 m,
Molten salt thermal storage tanks 1,300 MWhth
requiring c.45,000 tonnes salt inventory.
Technology Overview
Loop aperture area: 4,190 m2;
Mirror aperture: 6.868 m;
Collector length: 12.94 m;
HCE absorber tube: 80 mm;
Solar field temp: 2970C / 3930C;
Kathu DNI:
2,754 kWh/m2/year
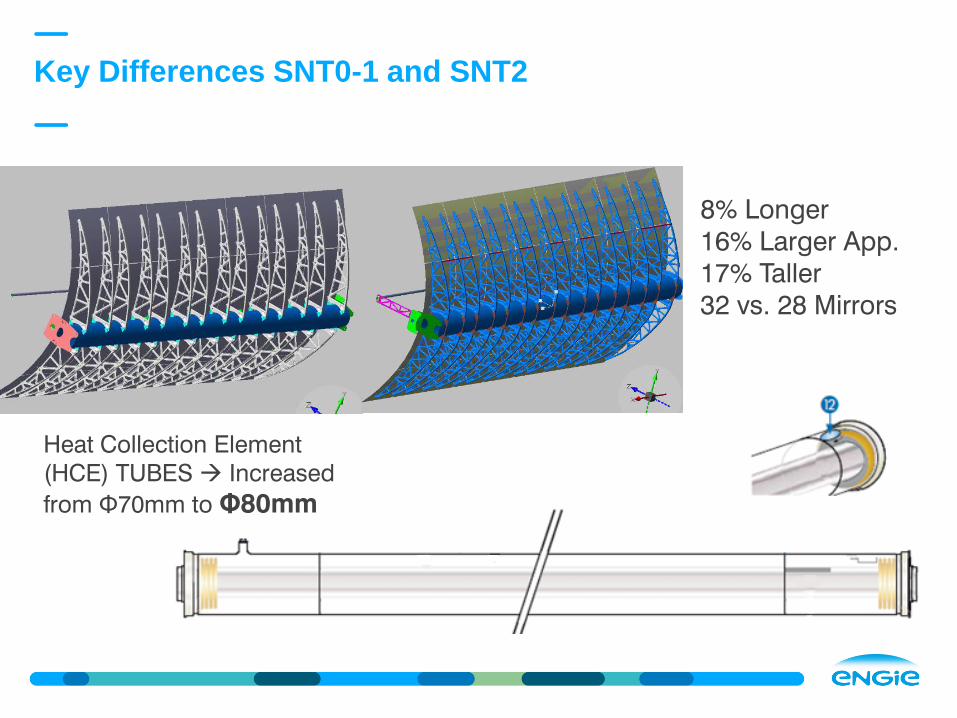
Key Differences SNT0-1 and SNT2
8% Longer
16% Larger App.
17% Taller
32 vs. 28 Mirrors
Heat Collection Element
(HCE) TUBES Increased
from Φ70mm to Φ80mm
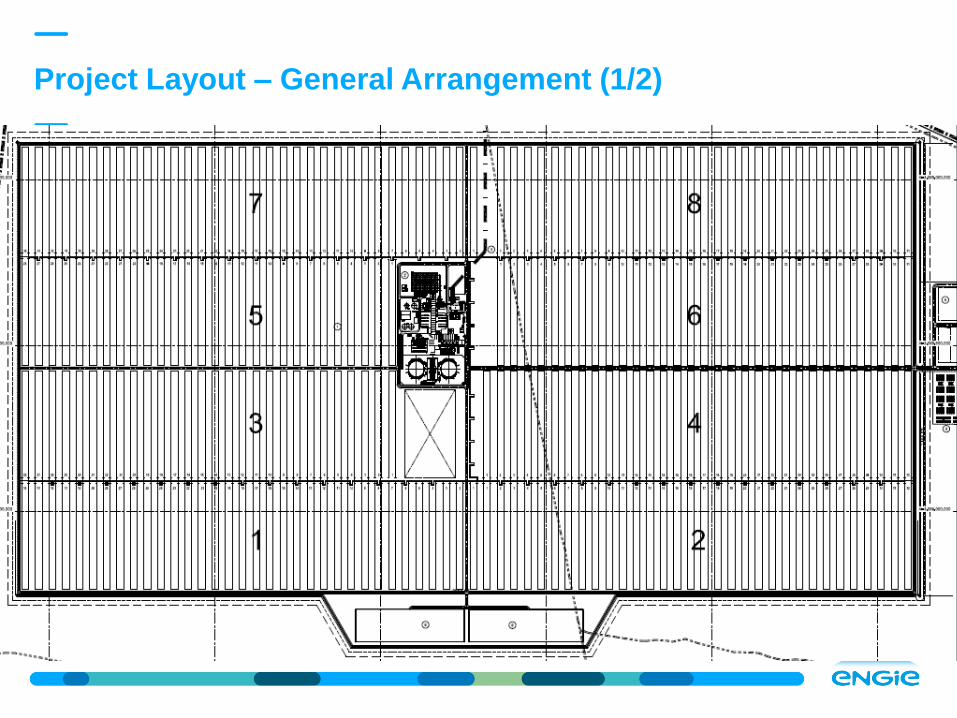
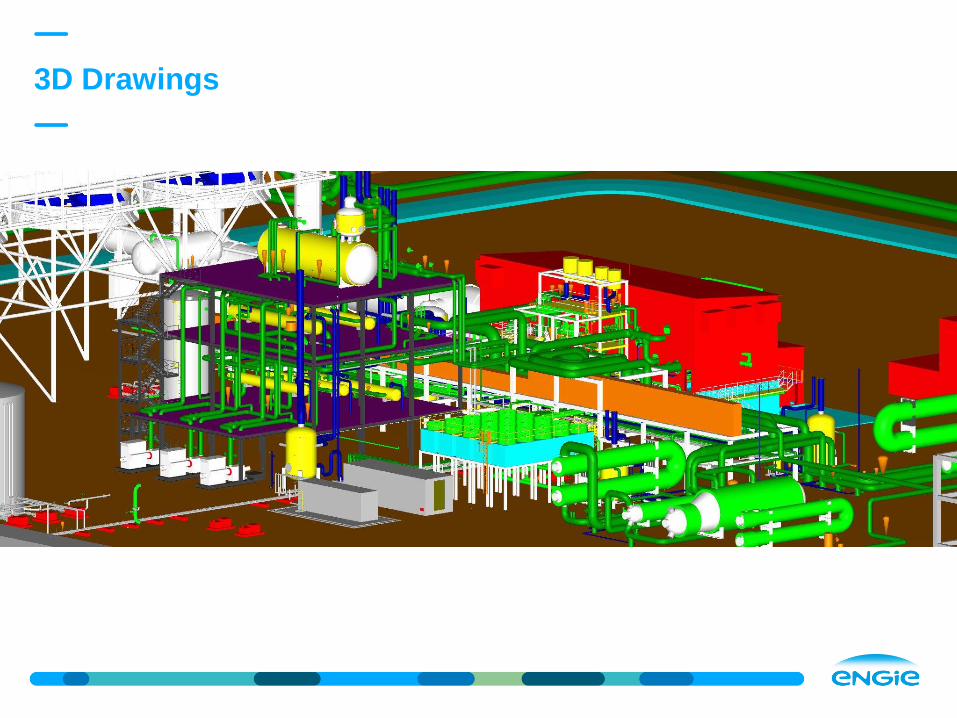
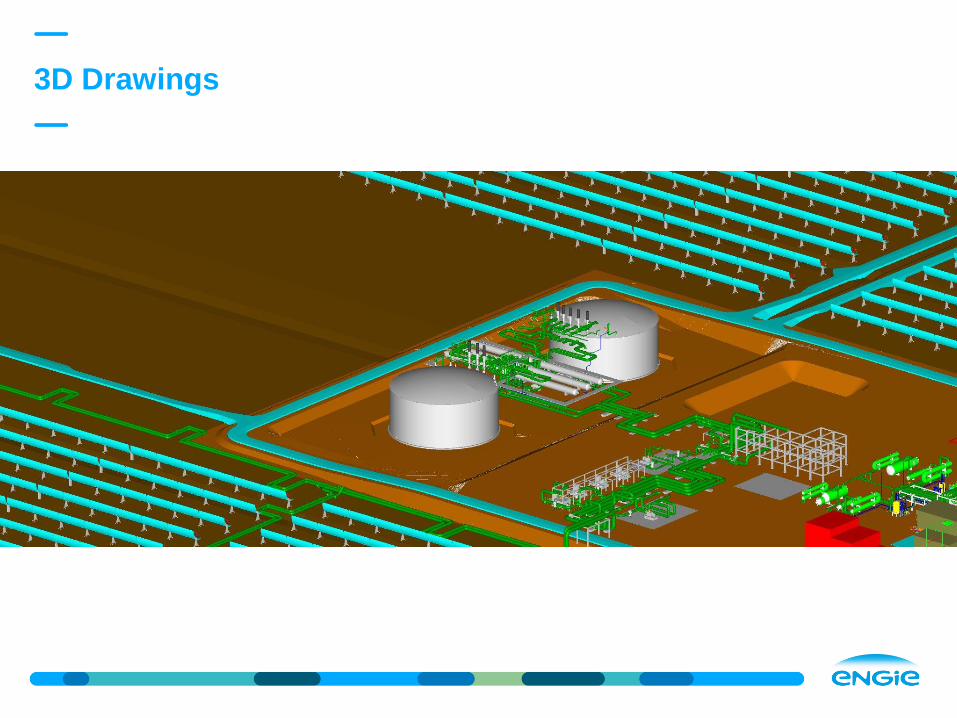
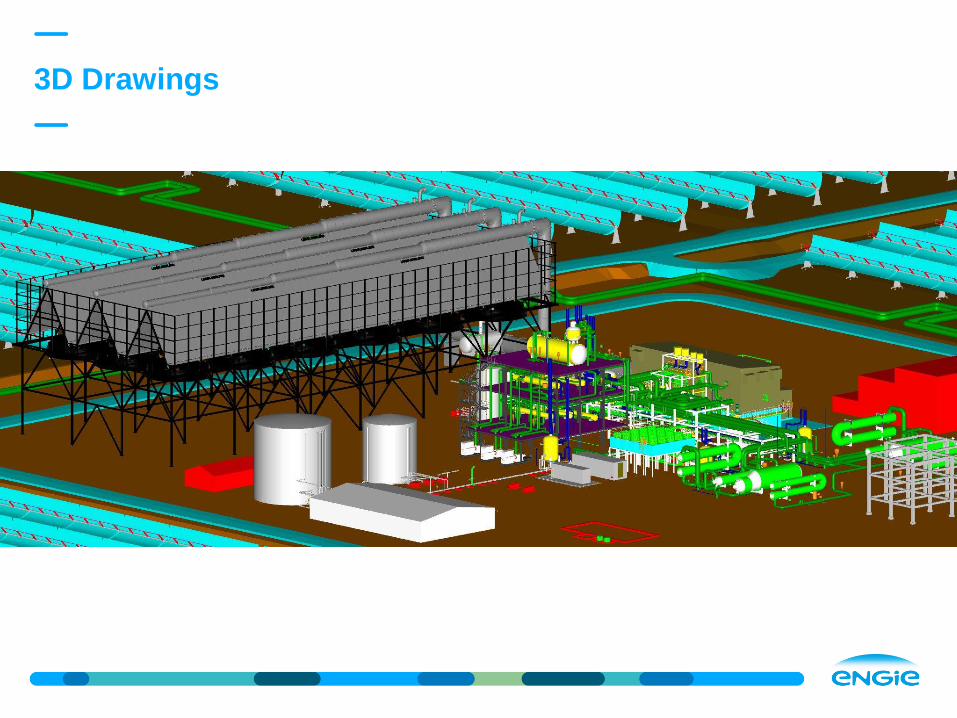
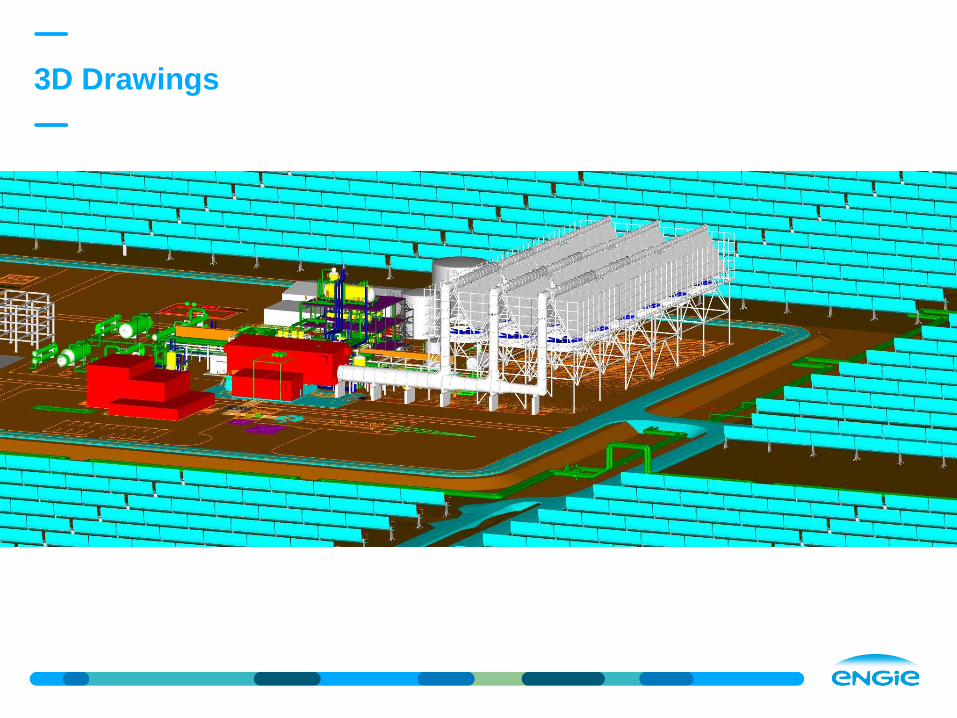
Project Layout – General Arrangement (1/2)
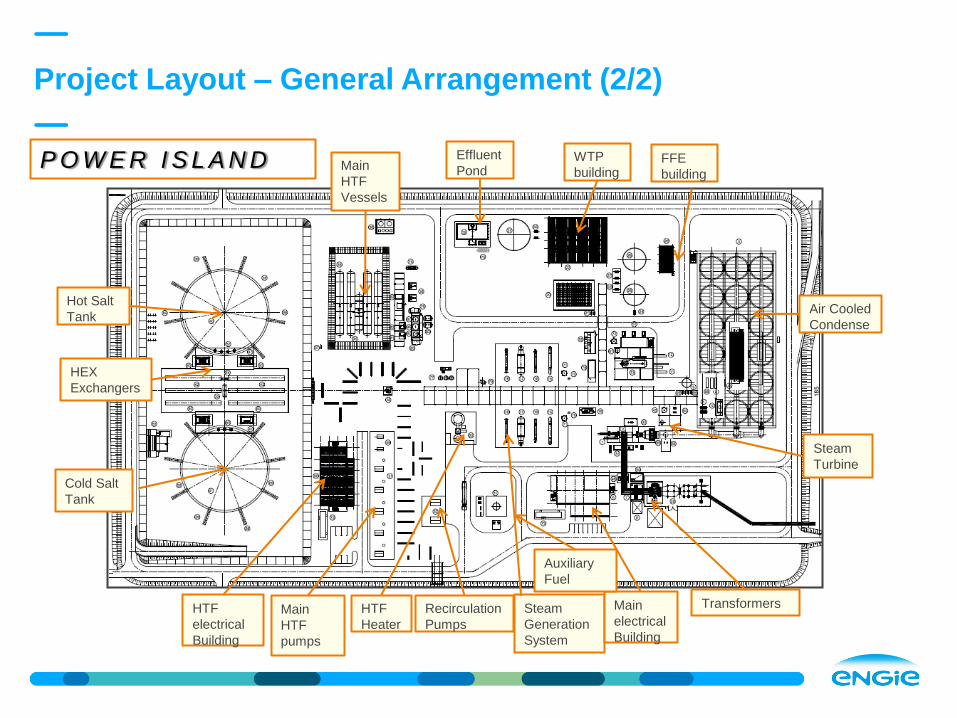
Project Layout – General Arrangement (2/2)
P O W E R I S L A N D
Hot Salt
Tank Air Cooled
Condense
r
Steam
Turbine
Cold Salt
Tank
HEX
Exchangers
Steam
Generation
System
Main
HTF
Vessels
HTF
electrical
Building
Main
electrical
Building
Transformers
WTP
building FFE
building
HTF
Heater
Auxiliary
Fuel
Effluent
Pond
Main
HTF
pumps
Recirculation
Pumps
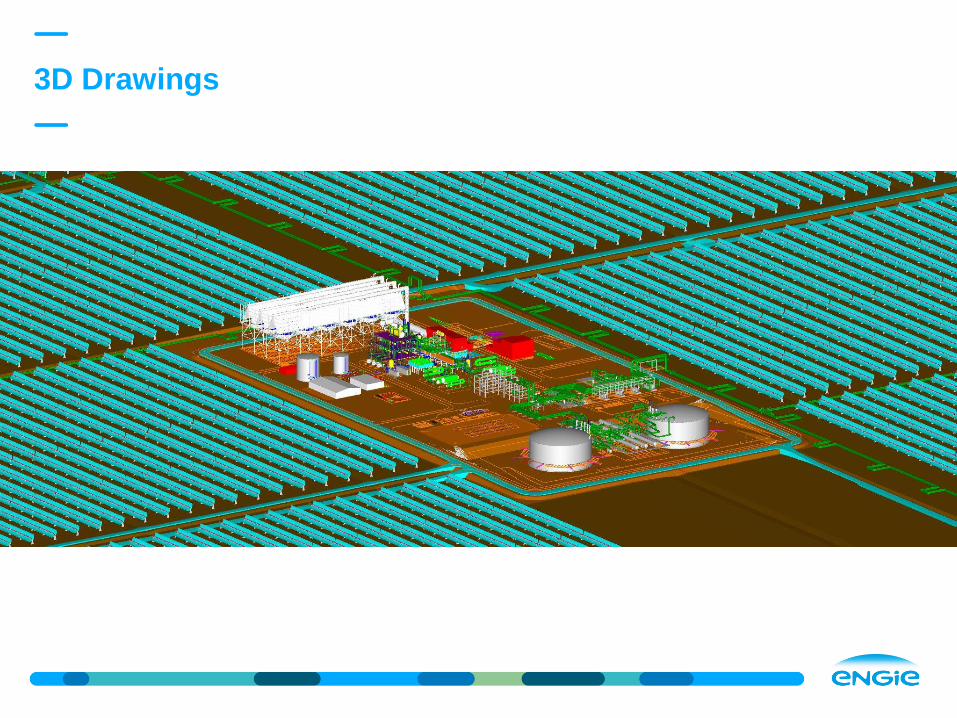
3D Drawings
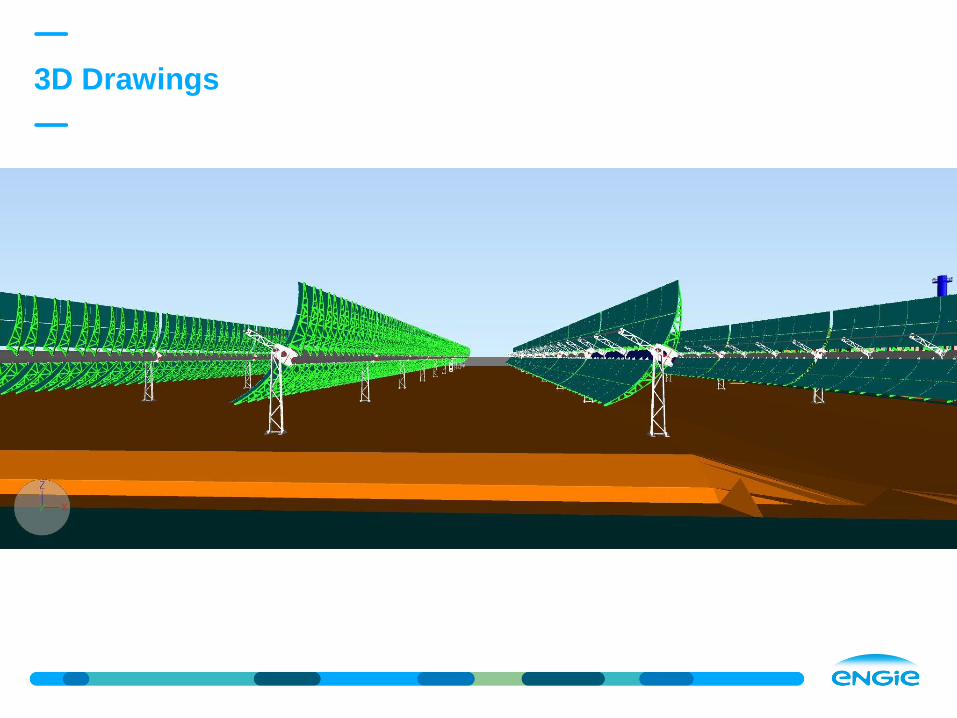
3D Drawings
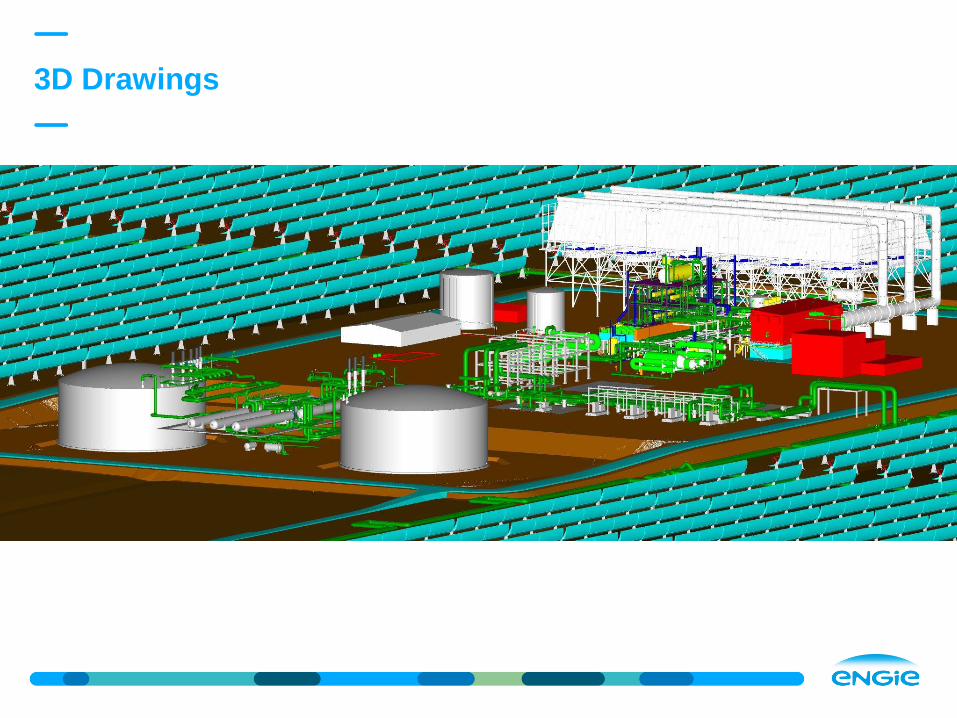
3D Drawings
3D Drawings
3D Drawings
3D Drawings
3D Drawings
Visit engie.com for more information.


![Increasing performance & reducing cost April 2014... · Peak load [MW] Base load [MW] 22 000 24 000 ... Utility-scale PV [Wind and CSP] power and ... STERG at Crescent Dunes, Nevada](https://img.pdfslide.us/doc/110x75/5b944d4e09d3f2df3f8cacce/increasing-performance-reducing-april-2014-peak-load-mw-base-load-mw.jpg)