Embed Size (px)
Citation preview

CSP & Solar Resource AssessmentCSP Today South Africa 2013
2nd Concentrated Solar Thermal Power Conference and Expo4 - 5 February, Pretoria, Southern Sun Pretoria Hotel
Mr Riaan MeyerOn behalf of
Centre for Renewable and Sustainable Energy Studies – University of Stellenbosch
Contents
• Solar Maps and what’s available
• GHI & DNI
• Satellite derived data
• How to bring a CSP project to bankability from a solar resource perspective
• On-site Solar Measurements: Options for CSP developers
• When things go wrong
• World DNI Map
• CSP related research at Stellenbosch University
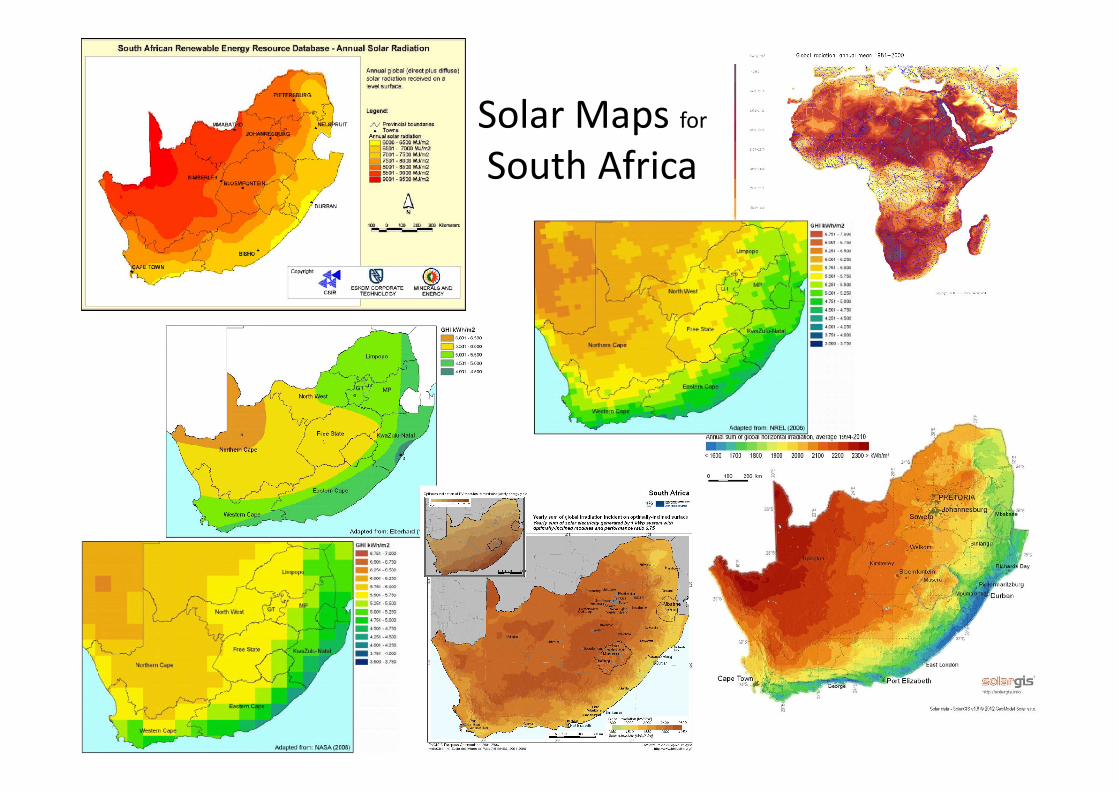
Solar Maps for
South Africa
4
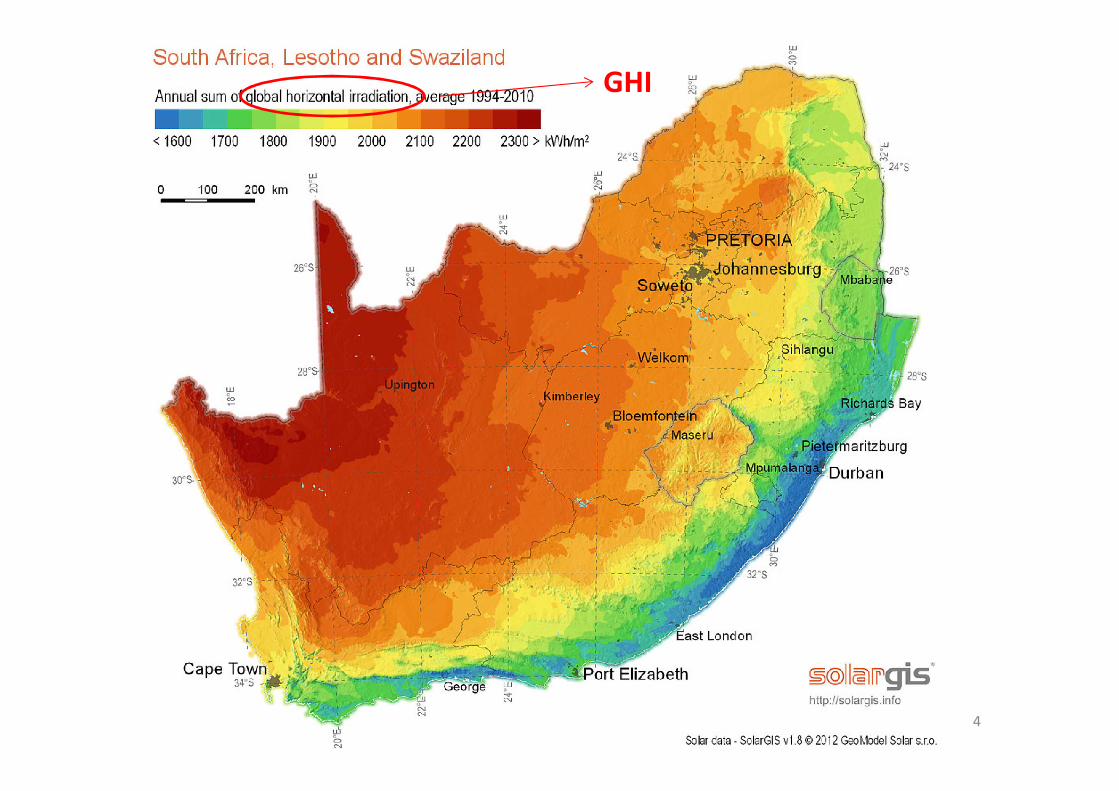
GHI
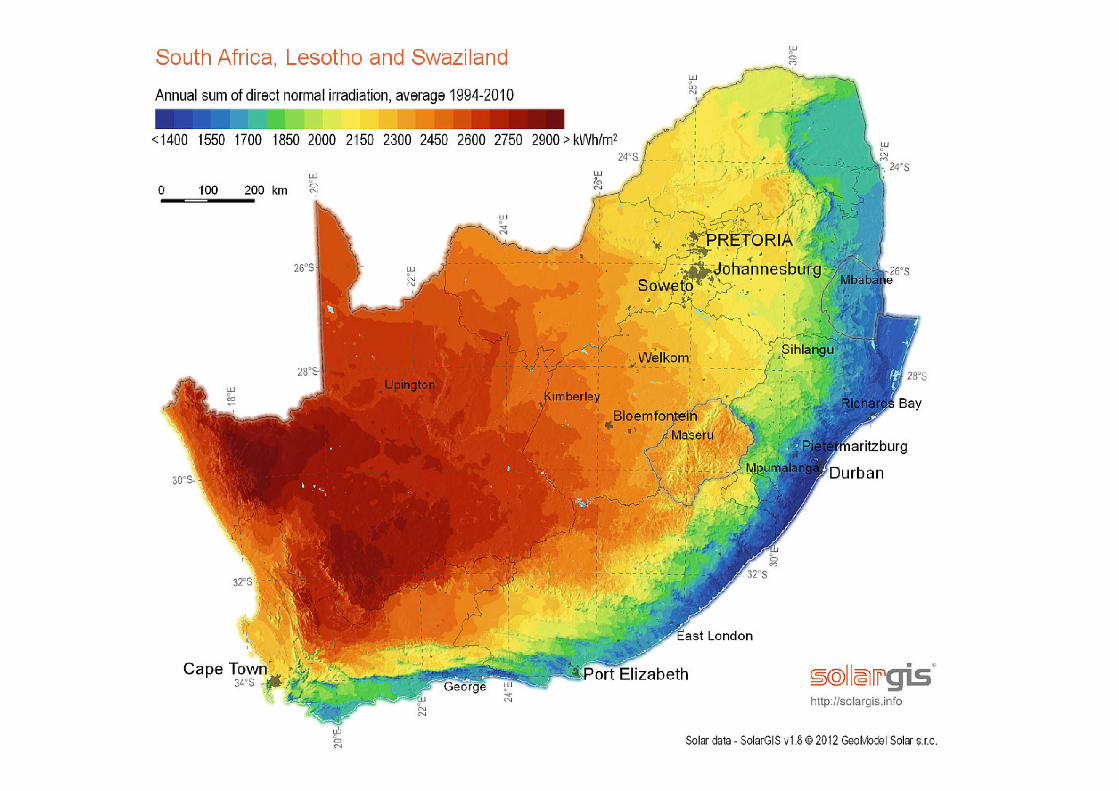
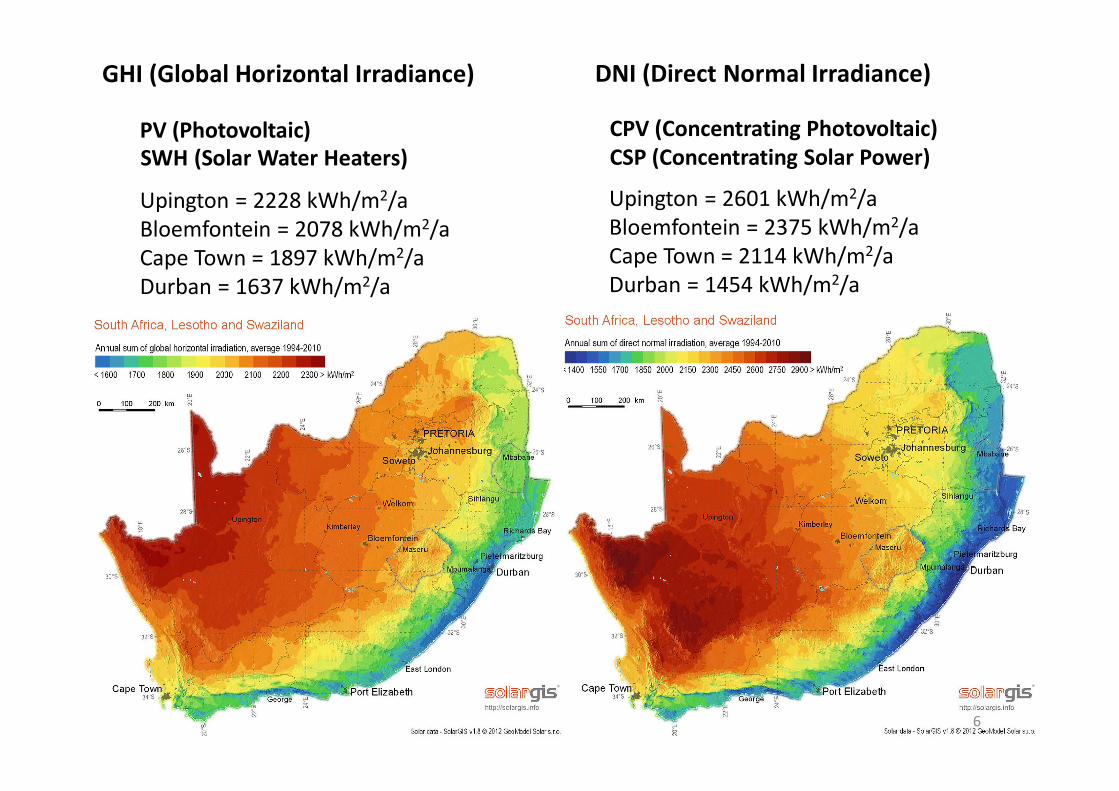
DNI (Direct Normal Irradiance)
CPV (Concentrating Photovoltaic)CSP (Concentrating Solar Power)
Upington = 2601 kWh/m2/aBloemfontein = 2375 kWh/m2/aCape Town = 2114 kWh/m2/aDurban = 1454 kWh/m2/a
6
GHI (Global Horizontal Irradiance)
PV (Photovoltaic)SWH (Solar Water Heaters)
Upington = 2228 kWh/m2/aBloemfontein = 2078 kWh/m2/aCape Town = 1897 kWh/m2/aDurban = 1637 kWh/m2/a
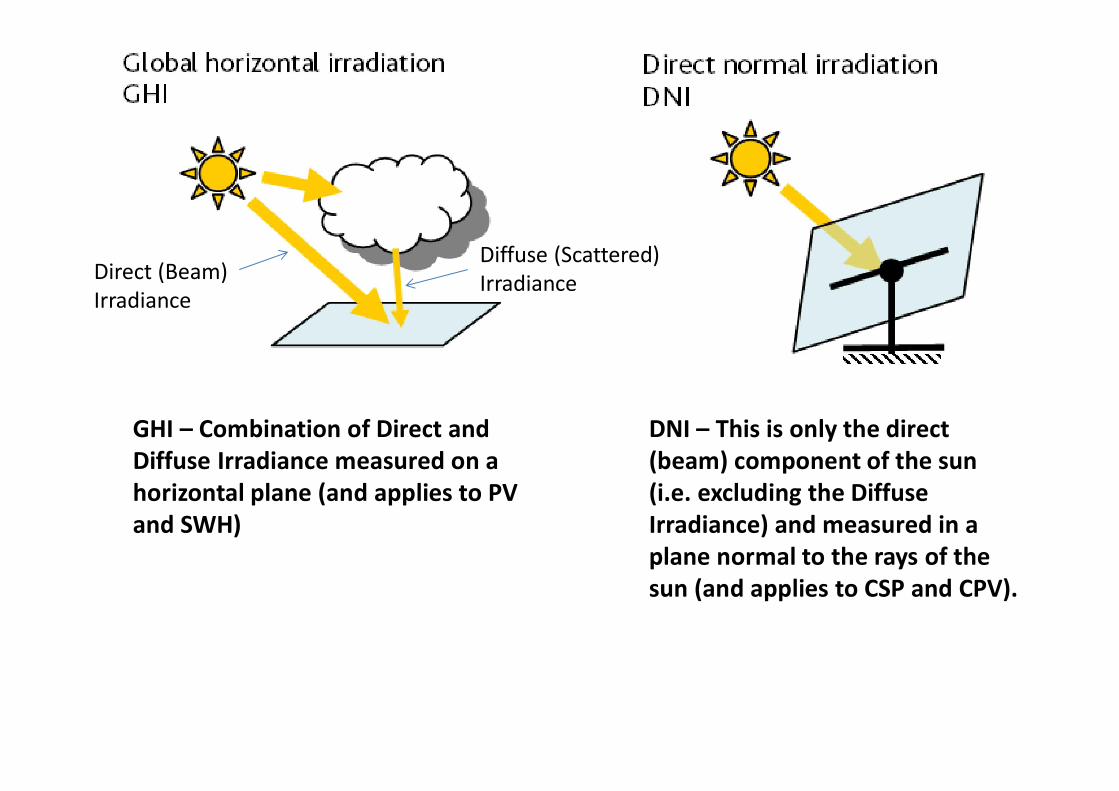
Direct (Beam)Irradiance
Diffuse (Scattered)Irradiance
GHI – Combination of Direct and Diffuse Irradiance measured on a horizontal plane (and applies to PV and SWH)
DNI – This is only the direct (beam) component of the sun (i.e. excluding the Diffuse Irradiance) and measured in a plane normal to the rays of the sun (and applies to CSP and CPV).
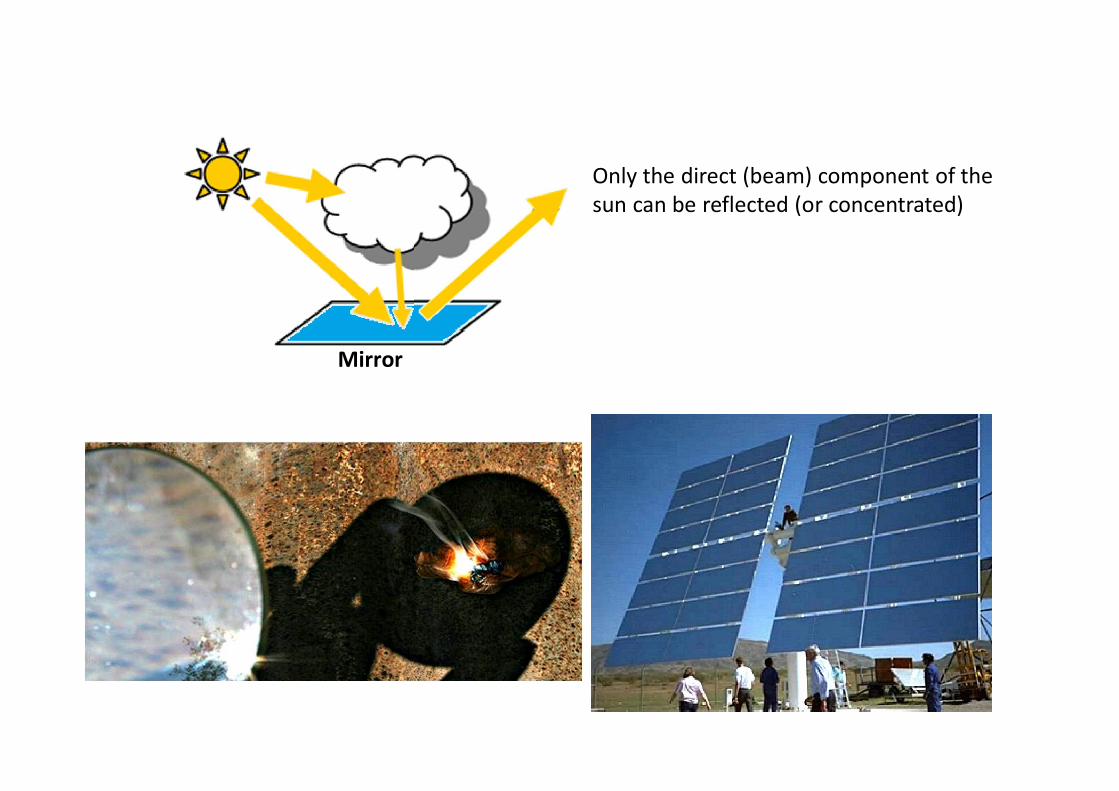
Only the direct (beam) component of the sun can be reflected (or concentrated)
Mirror
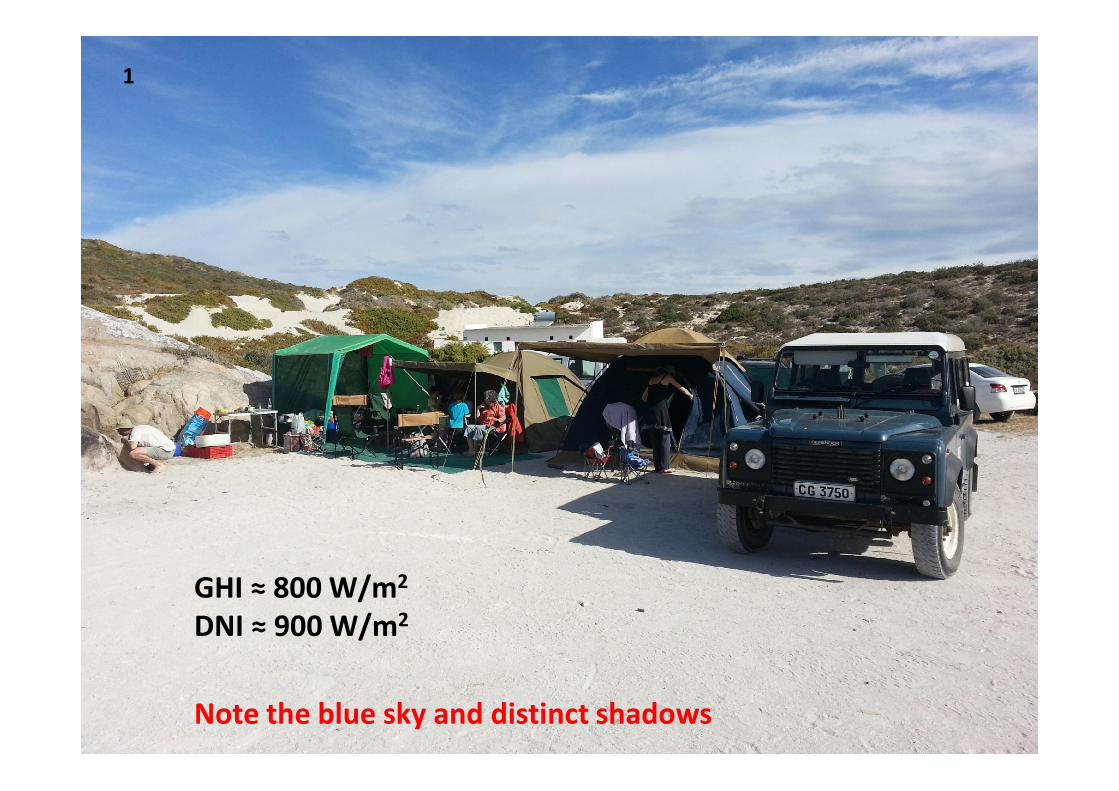
GHI ≈ 800 W/m2
DNI ≈ 900 W/m2
1
Note the blue sky and distinct shadows
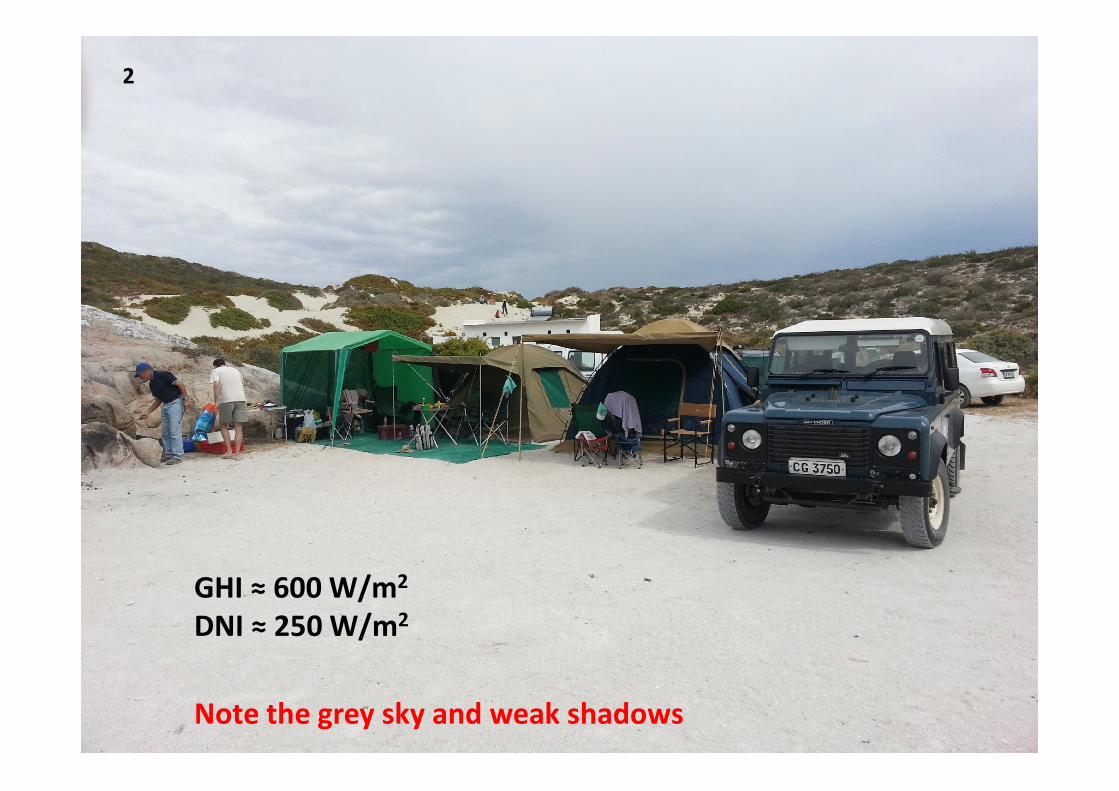
GHI ≈ 600 W/m2
DNI ≈ 250 W/m2
2
Note the grey sky and weak shadows
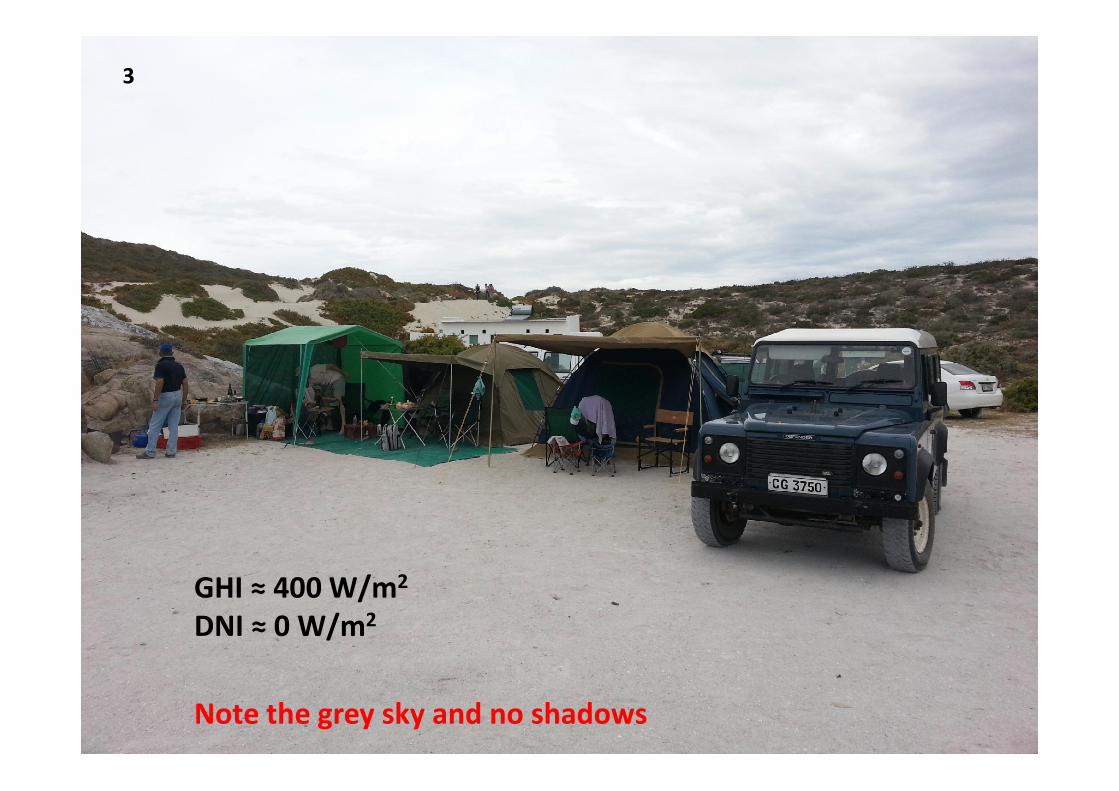
GHI ≈ 400 W/m2
DNI ≈ 0 W/m2
3
Note the grey sky and no shadows
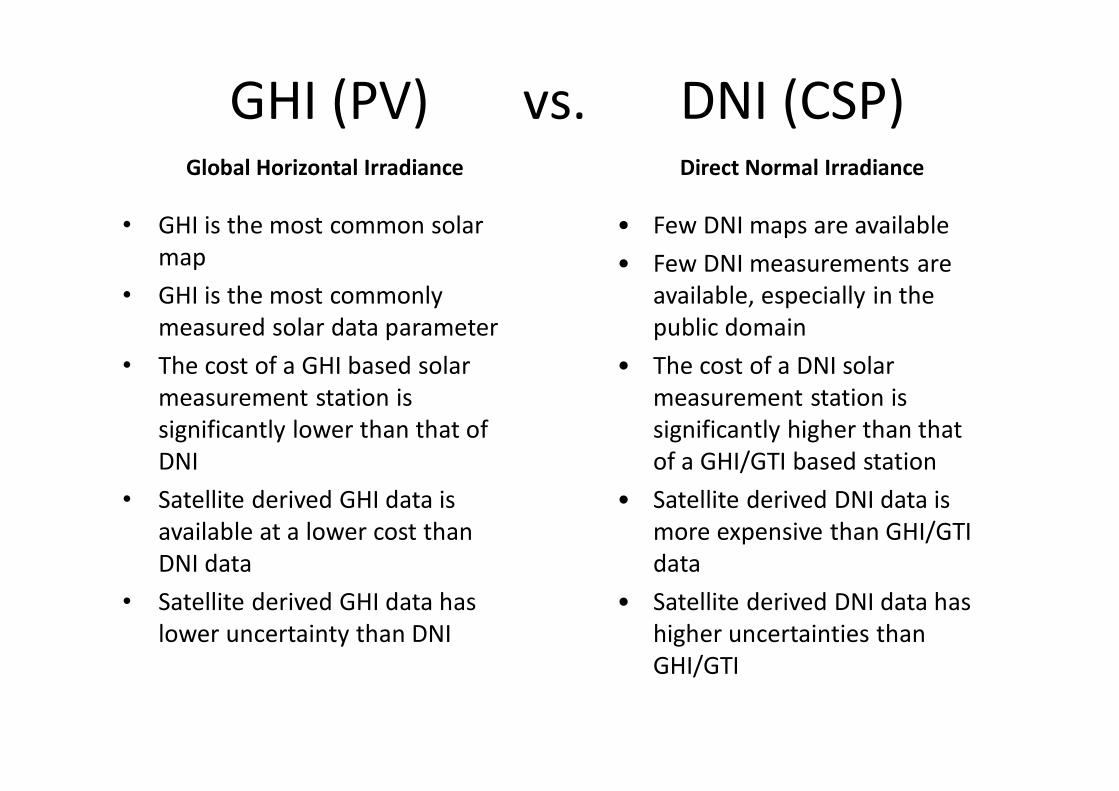
GHI (PV) vs. DNI (CSP)
• GHI is the most common solar map
• GHI is the most commonly measured solar data parameter
• The cost of a GHI based solar measurement station is significantly lower than that of DNI
• Satellite derived GHI data is available at a lower cost than DNI data
• Satellite derived GHI data has lower uncertainty than DNI
• Few DNI maps are available
• Few DNI measurements are available, especially in the public domain
• The cost of a DNI solar measurement station is significantly higher than that of a GHI/GTI based station
• Satellite derived DNI data is more expensive than GHI/GTI data
• Satellite derived DNI data has higher uncertainties than GHI/GTI
Global Horizontal Irradiance Direct Normal Irradiance
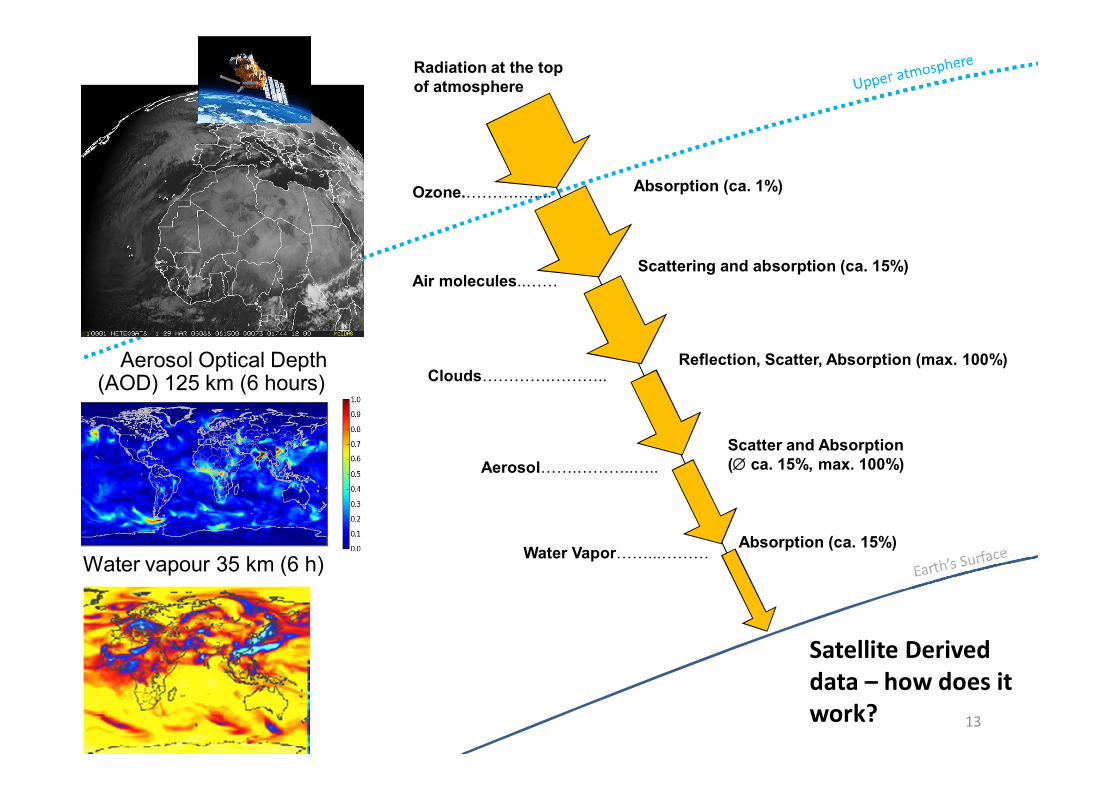
Scattering and absorption (ca. 15%)
Absorption (ca. 1%)
Scatter and Absorption ( ca. 15%, max. 100%)
Reflection, Scatter, Absorption (max. 100%)
Absorption (ca. 15%)
Ozone.……….…....
Aerosol…….………..…..
Water Vapor……...………
Clouds………….………..
Air molecules..……
Radiation at the top of atmosphere
Aerosol Optical Depth(AOD) 125 km (6 hours)
Water vapour 35 km (6 h)
Satellite Derived data – how does it work? 13
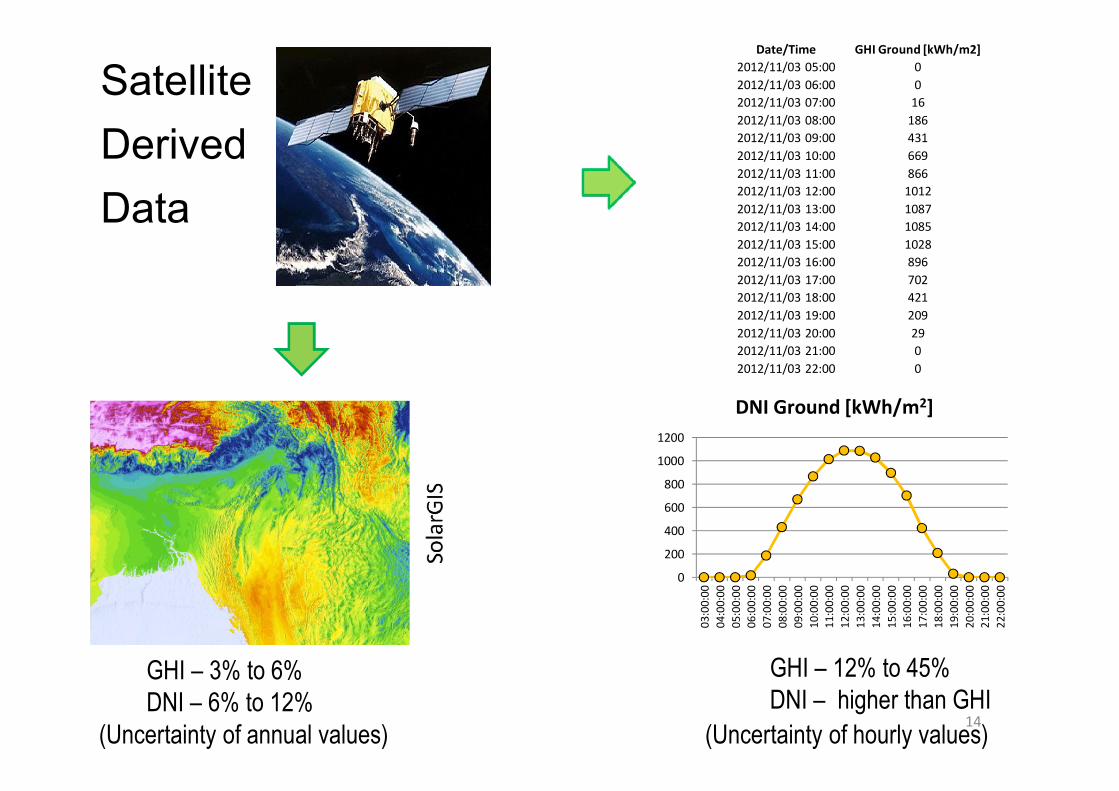
Satellite
Derived
Data
14
Date/Time GHI Ground [kWh/m2]
2012/11/03 05:00 0
2012/11/03 06:00 0
2012/11/03 07:00 16
2012/11/03 08:00 186
2012/11/03 09:00 431
2012/11/03 10:00 669
2012/11/03 11:00 866
2012/11/03 12:00 1012
2012/11/03 13:00 1087
2012/11/03 14:00 1085
2012/11/03 15:00 1028
2012/11/03 16:00 896
2012/11/03 17:00 702
2012/11/03 18:00 421
2012/11/03 19:00 209
2012/11/03 20:00 29
2012/11/03 21:00 0
2012/11/03 22:00 0
0
200
400
600
800
1000
1200
03:
00:
00
04:
00:
00
05:
00:
00
06:
00:
00
07:
00:
00
08:
00:
00
09:
00:
00
10:
00:
00
11:
00:
00
12:
00:
00
13:
00:
00
14:
00:
00
15:
00:
00
16:
00:
00
17:
00:
00
18:
00:
00
19:
00:
00
20:
00:
00
21:
00:
00
22:
00:
00
DNI Ground [kWh/m2]
(Uncertainty of hourly values)
GHI – 12% to 45%DNI – higher than GHI
GHI – 3% to 6%DNI – 6% to 12%
(Uncertainty of annual values)
How to bring a project to bankability from a solar resource perspective
• You install a high quality solar measurement station with the best instruments you can get and you measure for 20 years.
• During this period you maintain the station wellby keeping the instruments clean and performing regular calibration.
• At the end of 20 years you will have a bankable time series.
4.5
5
5.5
6
6.5
7
7.5
8
Jan-03 Jan-04 Jan-05 Jan-06 Jan-07 Jan-08 Jan-09 Jan-10 Jan-11 Jan-12
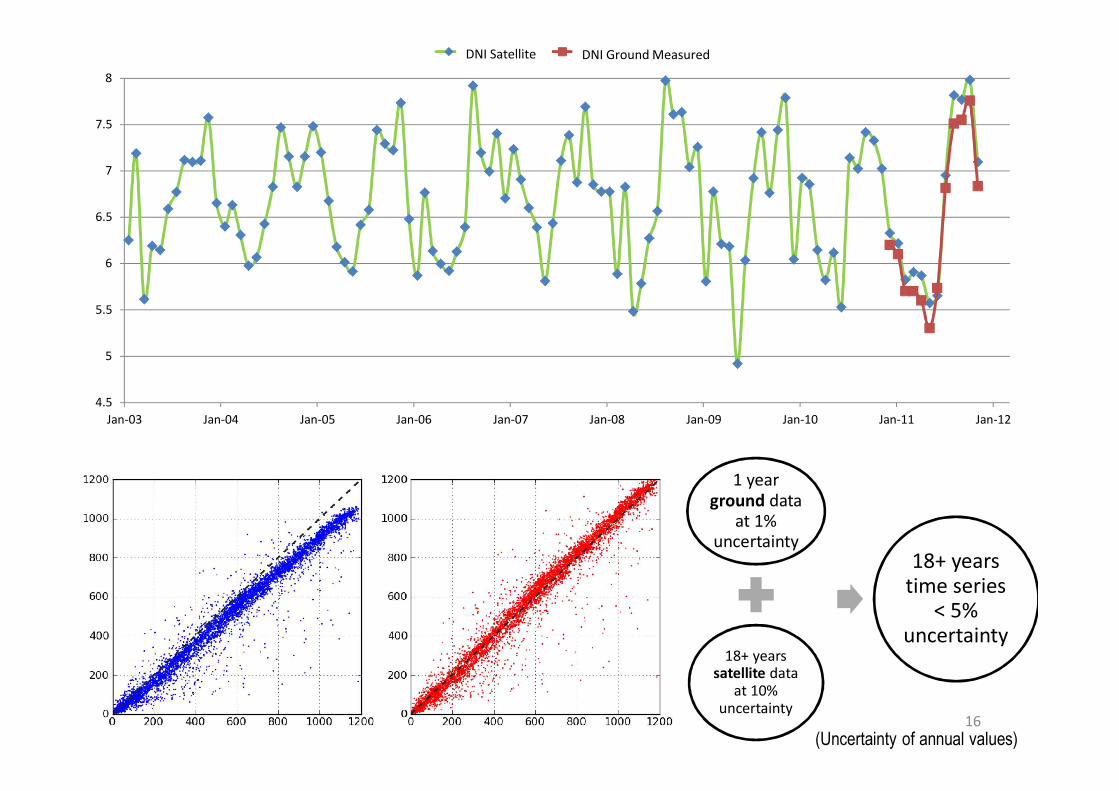
GTI Satellite GTI Ground MeasuredDNI Ground Measured
1 year ground data
at 1% uncertainty
18+ years satellite data
at 10% uncertainty
18+ years time series
< 5% uncertainty
(Uncertainty of annual values)16
DNI Satellite
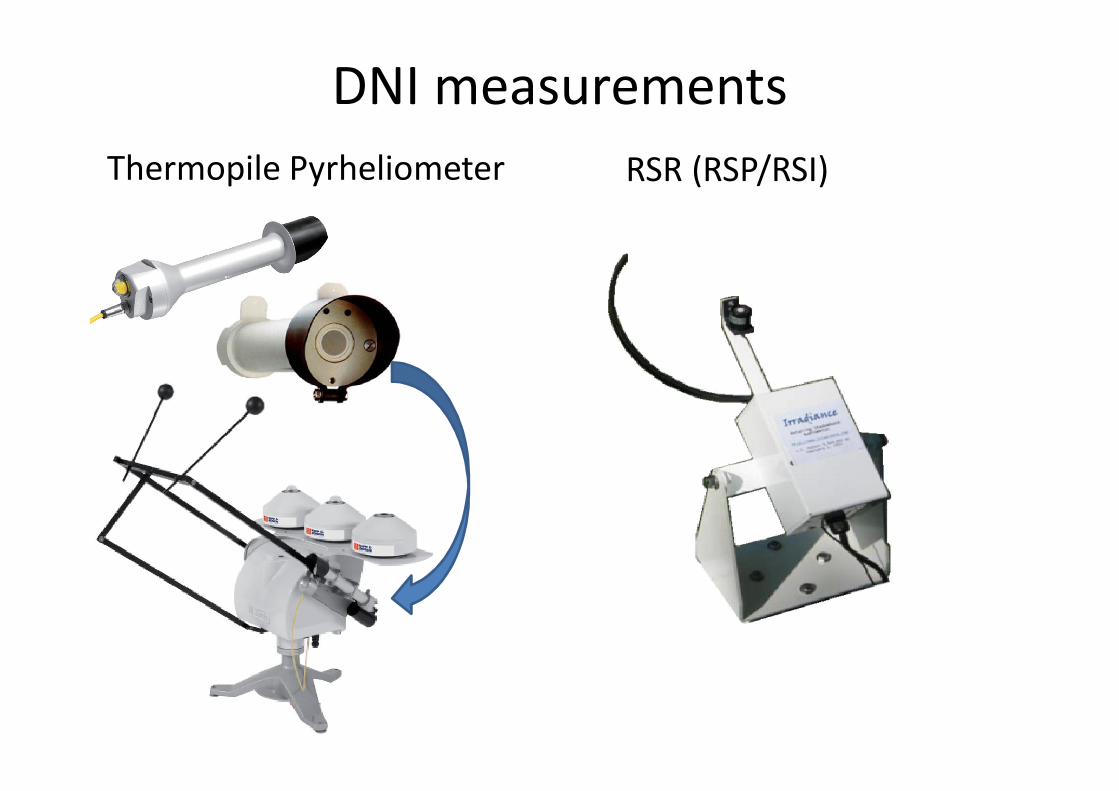
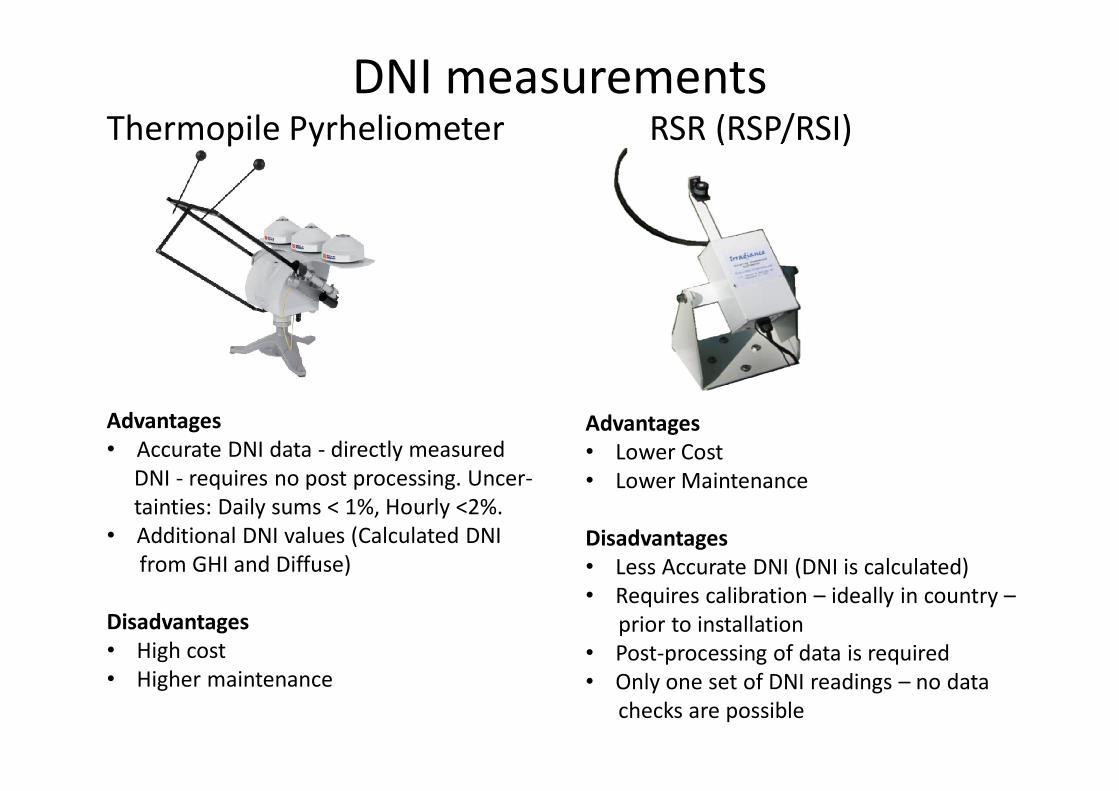
DNI measurements
Thermopile Pyrheliometer RSR (RSP/RSI)
DNI measurementsThermopile Pyrheliometer RSR (RSP/RSI)
Advantages• Accurate DNI data - directly measured
DNI - requires no post processing. Uncer-tainties: Daily sums < 1%, Hourly <2%.
• Additional DNI values (Calculated DNIfrom GHI and Diffuse)
Disadvantages• High cost• Higher maintenance
Advantages• Lower Cost• Lower Maintenance
Disadvantages• Less Accurate DNI (DNI is calculated) • Requires calibration – ideally in country –
prior to installation • Post-processing of data is required• Only one set of DNI readings – no data
checks are possible
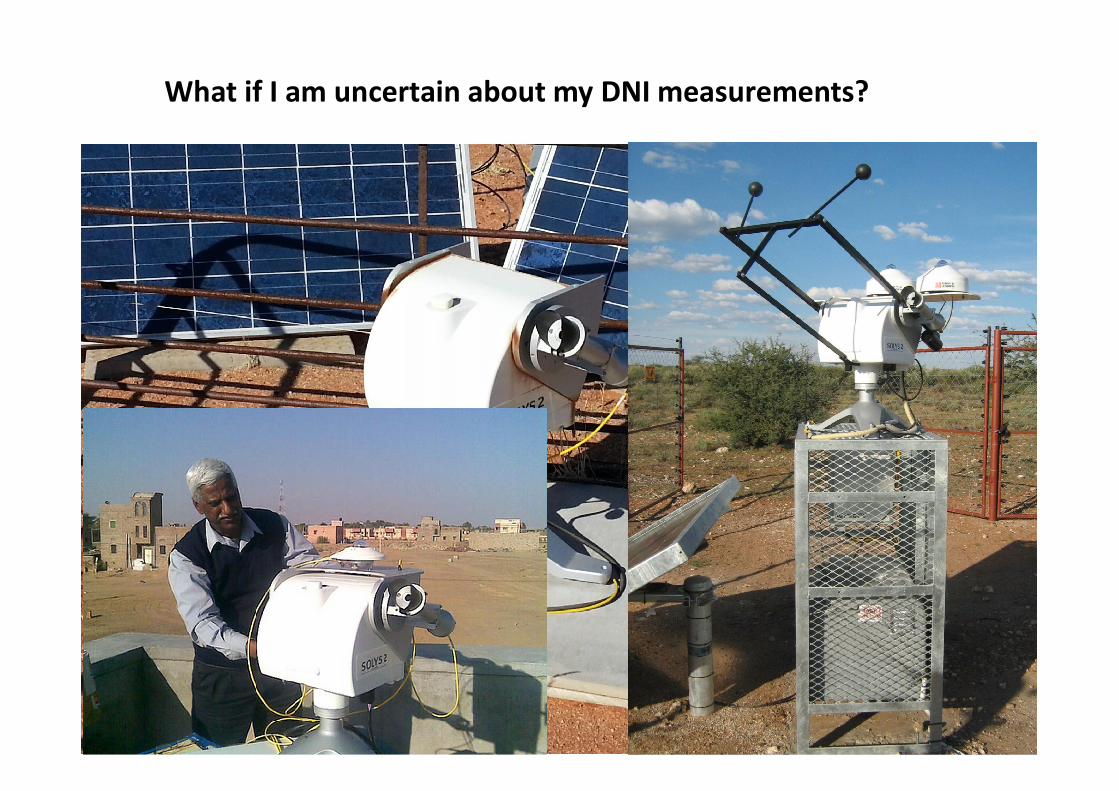
What if I am uncertain about my DNI measurements?
0
200
400
600
800
1000
1200
1400
14/02/2012 15/02/2012 16/02/2012 17/02/2012 18/02/2012 19/02/2012 20/02/2012 21/02/2012 22/02/2012
DN
I [W
h/m
2]
Client DNI Data
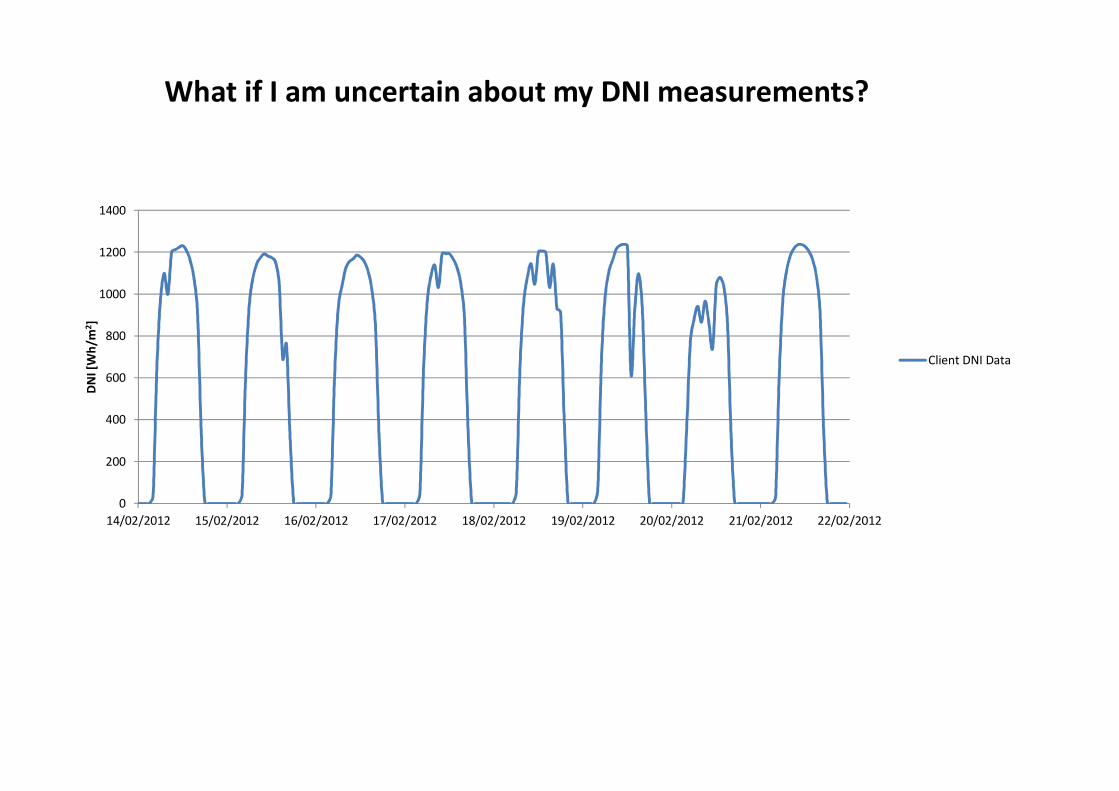
What if I am uncertain about my DNI measurements?
0
200
400
600
800
1000
1200
1400
14/02/2012 15/02/2012 16/02/2012 17/02/2012 18/02/2012 19/02/2012 20/02/2012 21/02/2012 22/02/2012
DN
I [W
h/m
2]
Client DNI Data
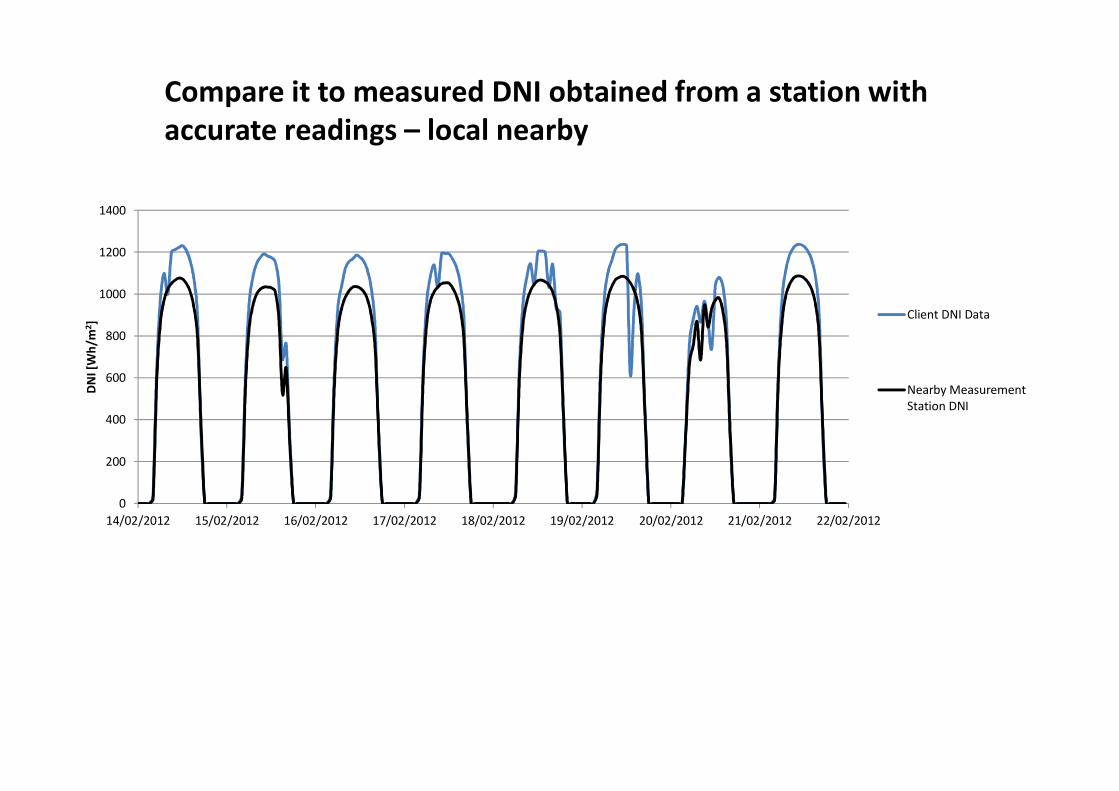
Compare it to measured DNI obtained from a station with accurate readings – local nearby
0
200
400
600
800
1000
1200
1400
14/02/2012 15/02/2012 16/02/2012 17/02/2012 18/02/2012 19/02/2012 20/02/2012 21/02/2012 22/02/2012
DN
I [W
h/m
2] Client DNI Data
Nearby MeasurementStation DNI
0
200
400
600
800
1000
1200
1400
14/02/2012 15/02/2012 16/02/2012 17/02/2012 18/02/2012 19/02/2012 20/02/2012 21/02/2012 22/02/2012
DN
I [W
h/m
2]
Client DNI Data
Nearby MeasurementStation DNI
Nearby MeasurementStation Calculated DNI
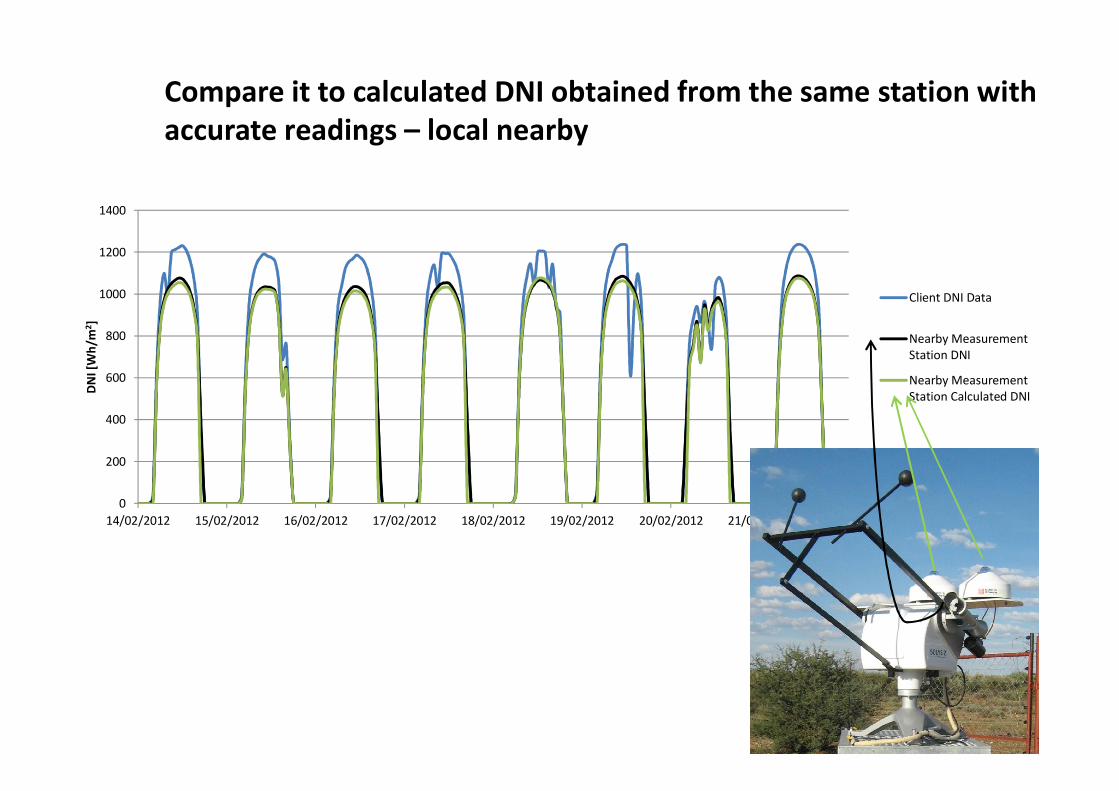
Compare it to calculated DNI obtained from the same station with accurate readings – local nearby
0
200
400
600
800
1000
1200
1400
14/02/2012 15/02/2012 16/02/2012 17/02/2012 18/02/2012 19/02/2012 20/02/2012 21/02/2012 22/02/2012
DN
I [W
h/m
2]
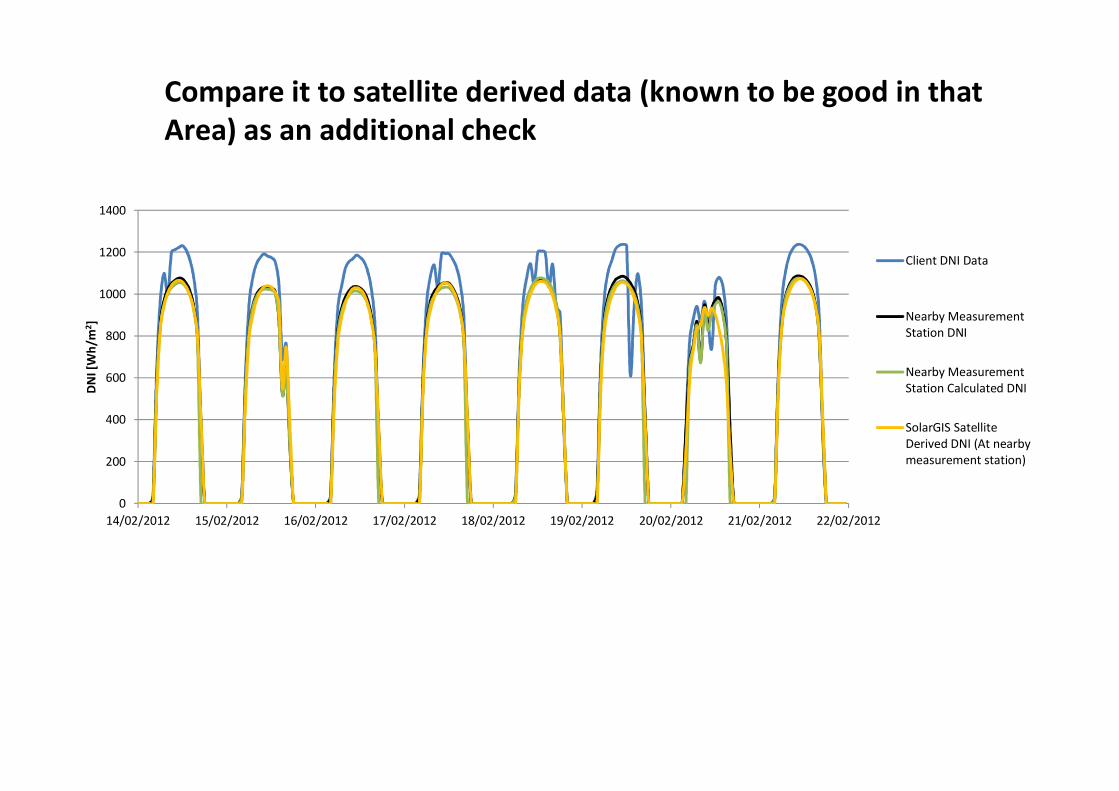
Client DNI Data
Nearby MeasurementStation DNI
Nearby MeasurementStation Calculated DNI
SolarGIS SatelliteDerived DNI (At nearbymeasurement station)
Compare it to satellite derived data (known to be good in that Area) as an additional check
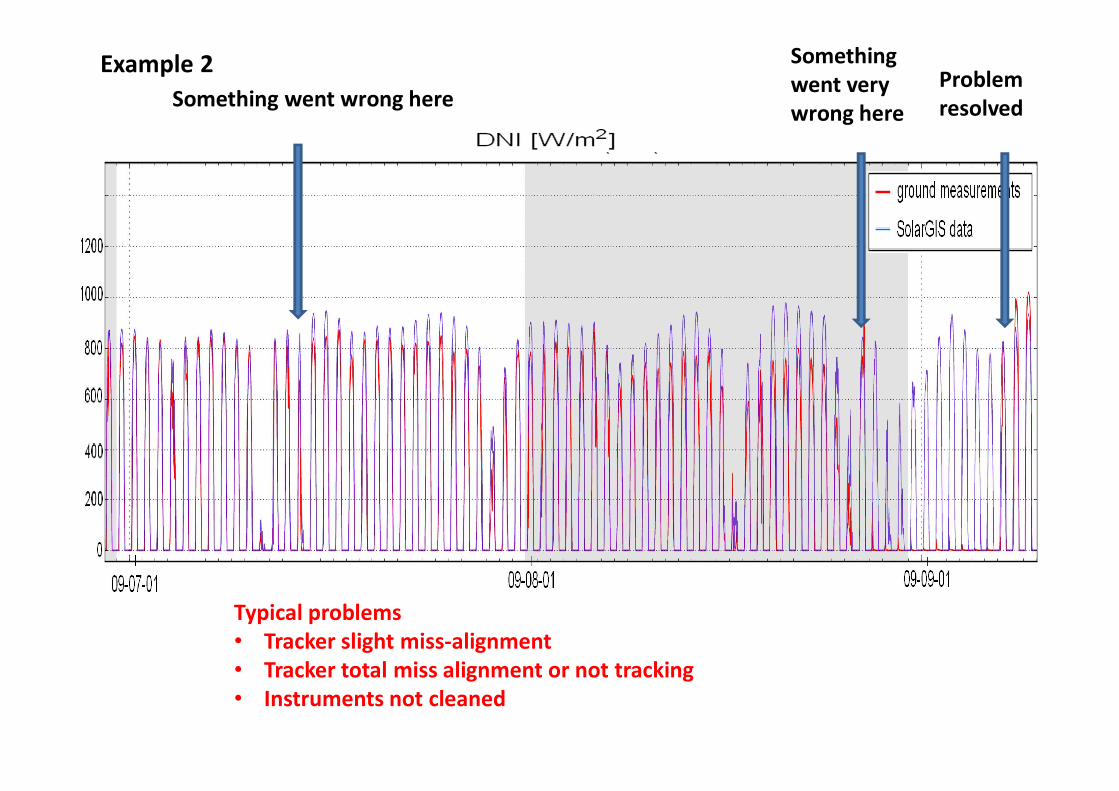
Something went wrong here
Something went very wrong here
Problem resolved
Typical problems• Tracker slight miss-alignment• Tracker total miss alignment or not tracking• Instruments not cleaned
Example 2
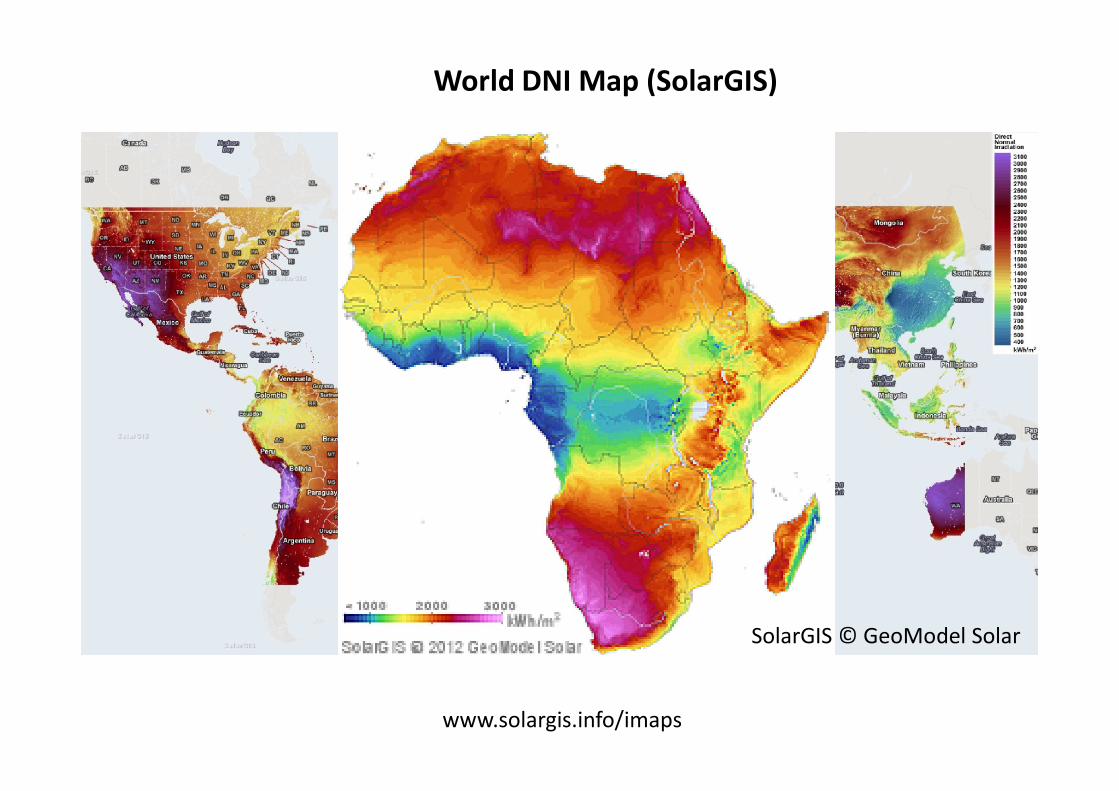
World DNI Map (SolarGIS)
www.solargis.info/imaps
SolarGIS © GeoModel Solar
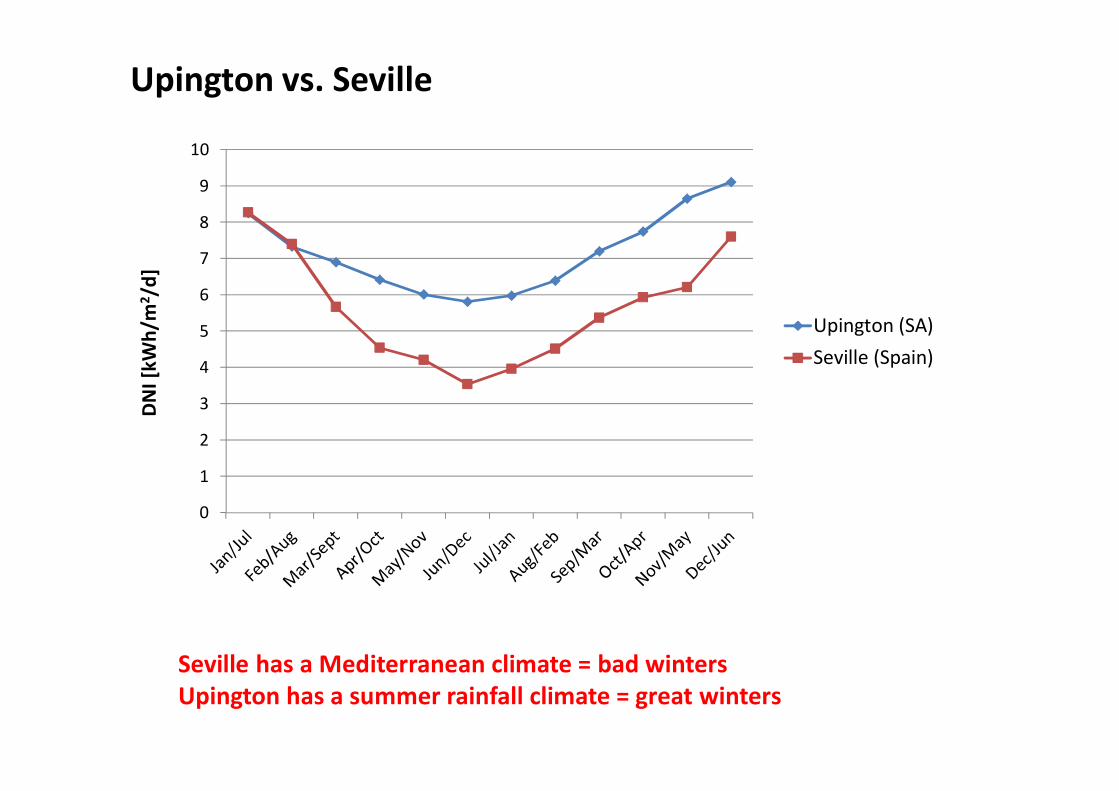
0
1
2
3
4
5
6
7
8
9
10D
NI [
kWh
/m2 /
d]
Upington (SA)
Seville (Spain)
Upington vs. Seville
Seville has a Mediterranean climate = bad wintersUpington has a summer rainfall climate = great winters
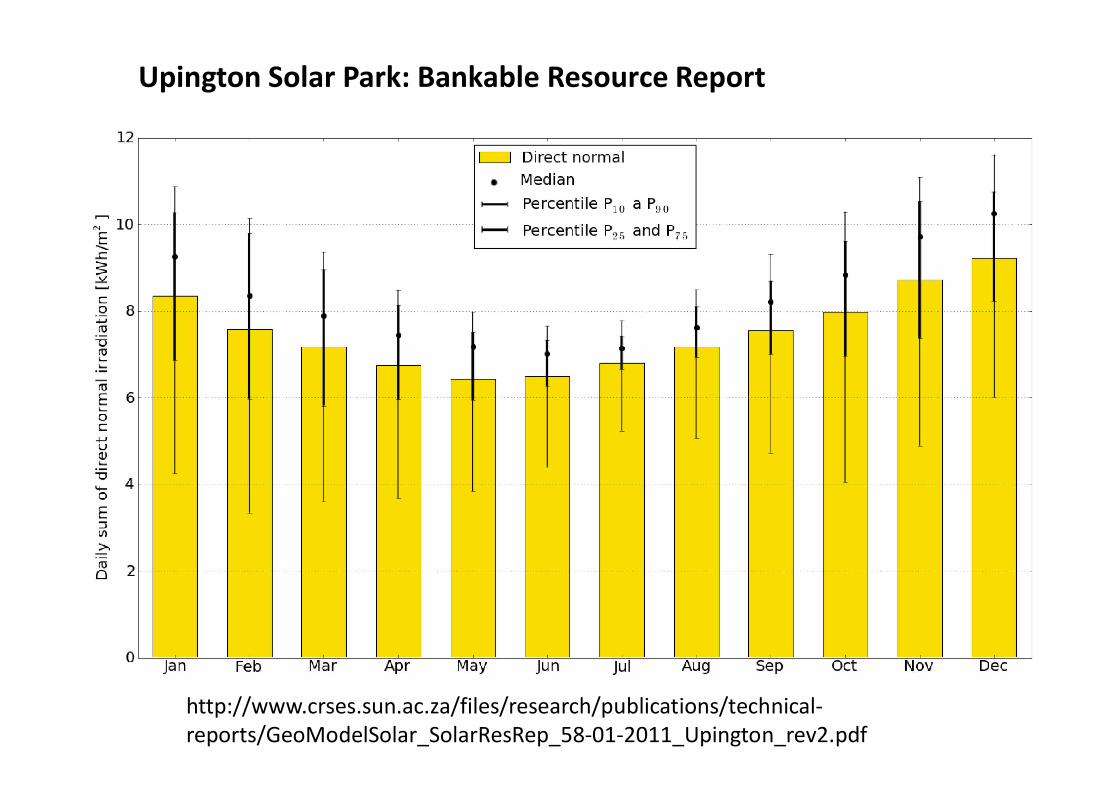
http://www.crses.sun.ac.za/files/research/publications/technical-reports/GeoModelSolar_SolarResRep_58-01-2011_Upington_rev2.pdf
Upington Solar Park: Bankable Resource Report


![LARGE SCALE SOLAR PV & CSP · Concentrated Solar Power (CSP). Figure 2: Ground based Solar PV System [4] Concentrated Solar Power (CSP) in contrast is a complicated technology and](https://img.pdfslide.us/doc/110x75/5f083bf37e708231d420ffde/large-scale-solar-pv-csp-concentrated-solar-power-csp-figure-2-ground.jpg)