Embed Size (px)
Citation preview
International Journal of Computer Applications (0975 – 8887)
Volume 107 – No. 3, December 2014
38
Stereo Vision Distance Estimation Employing SAD with
Canny Edge Detector
Raad H. Thaher College of Engineering
Al-Mustansiriyah University Baghdad /Iraq
Zaid K. Hussein College of Engineering
Al-Mustansiriyah University
ABSTRACT
Stereo vision system used to reconstruct a 3D scene from 2D
images taken by a pair of optical cameras (left and right
images) and it is used to estimate the distance of the object.
The modified version for the (SAD) algorithm is called the
Canny Block Matching Algorithm (CBMA) to find the
Disparity map, the algorithm consist of two parts the Canny
edge detector and Block matching technique with Sum of
Absolute Difference (SAD) to determine disparity map to
reduce the execution time. The system has been implemented
using two cameras arranged in a manner to enhance the
detection range of objects from (30cm to 4m). The results
show good outputs with less error percentage, as compared
with the real objects depth and the Execution time is
approximated to the real–time performance. The algorithms
implemented using MATLAB (8.0) technical programing
language.
Keywords
Stereo Vision, Disparity, Epipolar geometry, SAD,
CBMA.
1. INTRODUCTION Stereoscopic vision is a technique for inferring the 3D
position of objects from two or more simultaneous images of
a scene. Mobile robots can take advantage of a stereo vision
system as a reliable and effective way to extract 3D data from
the environment. [1]
Reconstruction of the world seen (3D information) by stereo
vision cameras can be divided into two steps:
1-Correspondence problem: For each point in image and the
corresponding point in the other image and compute the
disparity distance in pixels of these points.
2-Triangulation: Given the disparity map and focal distance of
the two cameras and the geometry of the stereo setting relative
position and orientation of the cameras compute the world
coordinates of each point in the images [1].
The depth is obtained from computing stereo matching
between two images. The technique is triangulation, which
represents the process of finding coordinates of a 3D point
based on its corresponding stereo image points [2].
A number of studies have been reported on the disparity
estimation problem since 1970’s like Marr-Poggio In 1976
and 1979, [3][4]they first work in stereo vision system and
used a cooperative algorithm to extracting disparity
information from stereo image pairs.. Many researches in the
literature deals with scope of this work, as "Eric" and
"Grimson" in 1984. [5], "Hakkarainen" and "Lee", In 1993.
[6], "Labayirade" and "Aubert" In 2002. [7],"Vatansever "In
2006. [8], and "Fengjun HU" and "Yanwei ZHAO" in 2013
[9].
Extracting depth map from stereo image pairs is achieved by
applying matching algorithm, which is based on two criteria
that represent the main challenges of stereo vision system, the
main criteria are:
1. The execution time: the execution of algorithm should be
fast.
2. Reliability: the information about objects should be
accurate enough to recognize.
2. STEREO VISION SYSTEM The term stereo vision refers to the theory that is two cameras
properly configured can be used to map objects within a 2D
scene into three 3D spaces.
The computer compares the images while shifting the two
images together over top of each other to find the parts that
match or are similar, and the shifted amount is called
(disparity) that is related to the object distance the higher
disparity of the object pixel means that the object is closer to
the cameras and the less disparity means the object is far from
the cameras [10] [11]. Disparity maps can be visualized in
greyscale. Close objects result in a large disparity value. This
is translated into light greyscale values. Objects further away
will appear darker.
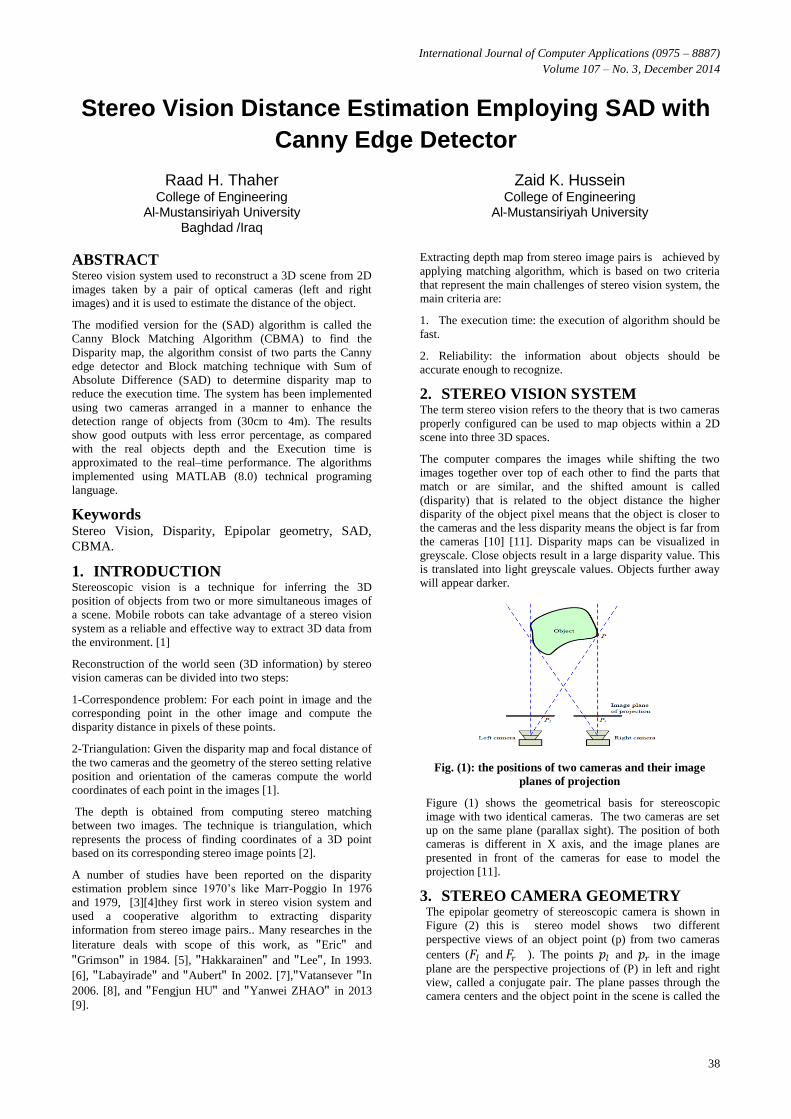
Fig. (1): the positions of two cameras and their image
planes of projection
Figure (1) shows the geometrical basis for stereoscopic
image with two identical cameras. The two cameras are set
up on the same plane (parallax sight). The position of both
cameras is different in X axis, and the image planes are
presented in front of the cameras for ease to model the
projection [11].
3. STEREO CAMERA GEOMETRY The epipolar geometry of stereoscopic camera is shown in
Figure (2) this is stereo model shows two different
perspective views of an object point (p) from two cameras
centers (𝐹𝑙 and 𝐹𝑟 ). The points 𝑝𝑙 and 𝑝𝑟 in the image
plane are the perspective projections of (P) in left and right
view, called a conjugate pair. The plane passes through the
camera centers and the object point in the scene is called the
International Journal of Computer Applications (0975 – 8887)
Volume 107 – No. 3, December 2014
39
epipolar plane, correspondences at point 𝑝𝑙and 𝑝𝑟must lie on
the epipolar line.
Fig. (2): The epipolar geometry of stereoscopic vision.
The simplest stereo camera geometry has optical axes that is
parallel and is normal to the baseline; that line is connected to
the lens centers of the cameras.
b=Baseline
Optical Axis
f = focal length f = focal length
Image plane Image plane
CL= Optical Center CR= Optical Center
XL XR
Z=depth
P (x,y,z)
PL PR
Left camera Right camera
X
UL UR
O
Fig. (3): Epipolar geometry with parallel optical axes (top
view)
As shown in Figure (3) the stereo camera coordinate system
considered to be midway between the left and right camera
coordinate systems. Assuming idealistic (pin-hole) cameras,
so the stereo camera coordinate system can be written, from
similar triangles in Figure (3), for the left and right camera we
have:
𝒛 = 𝒃∗𝒇
𝒙𝑳−𝒙𝑹=
𝒃∗𝒇
𝒅 (1)
The quantity (d = 𝑥𝐿 − 𝑥𝑅) is called the disparity, (b) is the
base line and (f) is the focal length of the cameras. The
Relation (1) indicates that the depth is inversely proportional
to disparity. The larger disparity value is closer to the object
point to the camera base line and the smaller disparity value is
the more distant to the object point from the camera baseline,
and for the same depth a larger disparity is obtained when a
camera system with a larger focal length or a larger baseline
length is used [12].
4. SUM OF ABSOLUTE DIFFERENCE
ALGORITHM (SAD) Sum of Absolute Difference (SAD) technique is the most
common matching criteria in stereo matching algorithms
cause by its low complexity, good performance and ease of
hardware implementation.
The (SAD) calculates the differences between two selected
windows the search is done by moving the reference window
pixel-by-pixel (full search) over the target windows that
minimizes the associated error, the SAD equation is [13]:
SAD= │IL (i, j) – IR (i , j + d)│(i,j)∊W (x,y) (2)
Where IL and IR are the intensity for the pixel of the left and
right image, respectively. W(x, y) is square window that
surrounds the location (x, y) for the pixel. And d is the
disparity value. In order to implement a reliable algorithm
and to demonstrate its effectiveness, it has been tested with
many real and rectified stereo image pairs, provided as
database [14] with ground-truth (true disparity map) that is
required to calculate the percentage error. One of the stereo
pairs called (Tsukuba) with size of (384×288), as shown in
Figure (4).
Fig. (4): Tsukuba stereo image pair and true disparity
map.
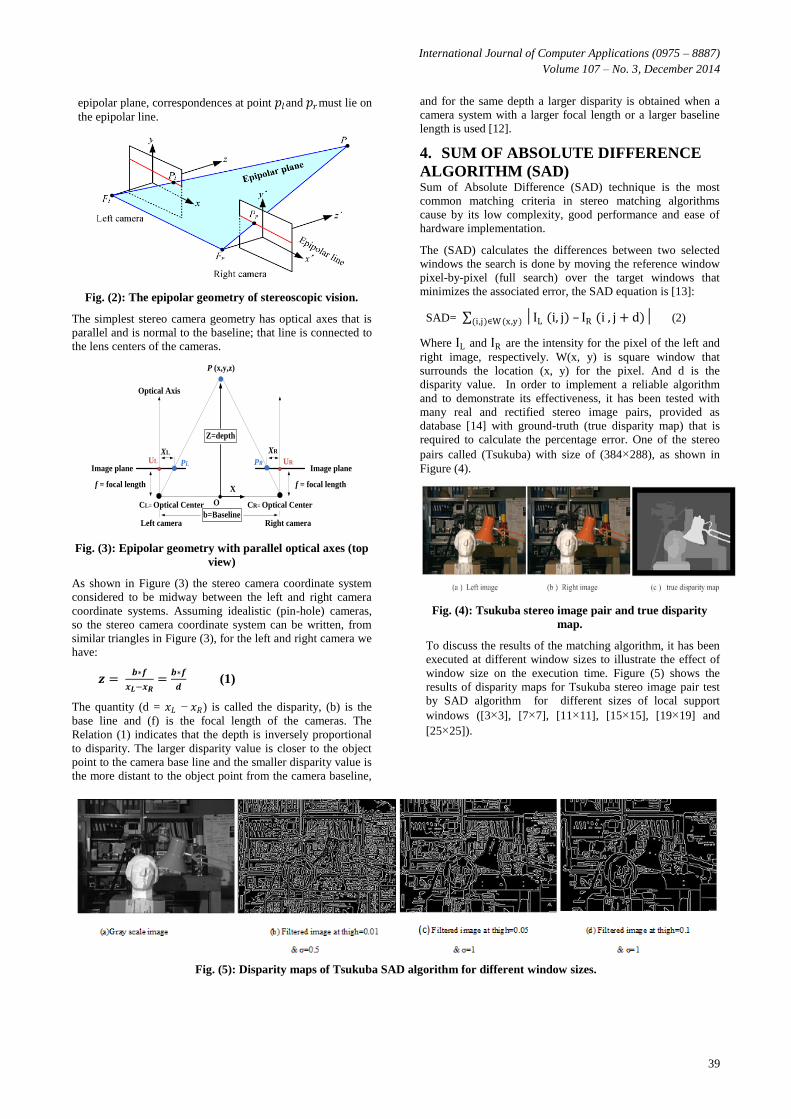
To discuss the results of the matching algorithm, it has been
executed at different window sizes to illustrate the effect of
window size on the execution time. Figure (5) shows the
results of disparity maps for Tsukuba stereo image pair test
by SAD algorithm for different sizes of local support
windows ([3×3], [7×7], [11×11], [15×15], [19×19] and
[25×25]).
Fig. (5): Disparity maps of Tsukuba SAD algorithm for different window sizes.
International Journal of Computer Applications (0975 – 8887)
Volume 107 – No. 3, December 2014
40
Table (1): The execution time and error
calculationaccording to SAD
Window-
size
Error percentage
(%)
Execution time
(Sec.)
[3×3] 23.7957 1.1540
[5×5] 17.4613 2.3169
[7×7] 15.2788 4.0723
[9×9] 12.3796 6.2336
[11×11] 11.3608 8.7930
[13×13] 11.5203 11.8933
[15×15] 10.9002 15.4039
[17×17] 10.9211 19.2220
[19×19] 10.5556 23.5235
[21×21] 11.4709 27.9363
[23×23] 10.7036 33.3579
[25×25] 11.6620 38.4058
[27×27] 10.9185 44.2607
From Figure (5), and the results of shown in Table (1), It can
be noticed that, the optimal window size is approximately
from [19×19] since it gives less error percentage (10.5556%)
and execution time is (23.5235 sec) , but when we take the
near value of the less error percentage is (10.9002%) at
window size is [15x15] and execution time is (15.4039 sec)
the time is less than that in the window size is [19x19]. The
result of stereo vision algorithm is a grayscale disparity map
which indicates the disparity for each pixel with
corresponding intensity. The lighter areas in Figure (5) are
closer to the camera, darker ones further away.
5. CANNY BLOCK MATCHING
ALGORITHM (CBMA) The algorithm is consists of two stages from first stage a
Canny edge detector and the second stage is Block matching
technique using SAD for determined the disparity map.
5.1 Canny Edge Detector The Canny edge detector is an edge detection operator which
is using a multi-stage algorithm to detect a wide range of
edges in the images. The Canny edge detector uses the first
derivative of a Gaussian; so to begin with, the raw image is
convolved with a Gaussian filter. The result is a slightly
blurred version of the original, and the edge direction angle
is rounded to one of four angles representing vertical,
horizontal and the two diagonals. [15][16]
Canny uses thresholding with hysteresis, and they require
two thresholds (high and low). And making the assumption
that is the important edge should be along continuous curves
in the image allows to follow a faint section of a given line
and to discard a few noisy pixels that do not constitute a line
but have produced large gradients; therefore, begin by
applying a high threshold.[17]
The Canny operator has three variables (Sigma standard
deviation of Gaussian (σ) and two thresholds (tlow and
thigh)): sigma range from (0.5 - 5), thigh range from (0.01-
0.2), and tlow is depending on thigh as tlwo=0.4xthigh.
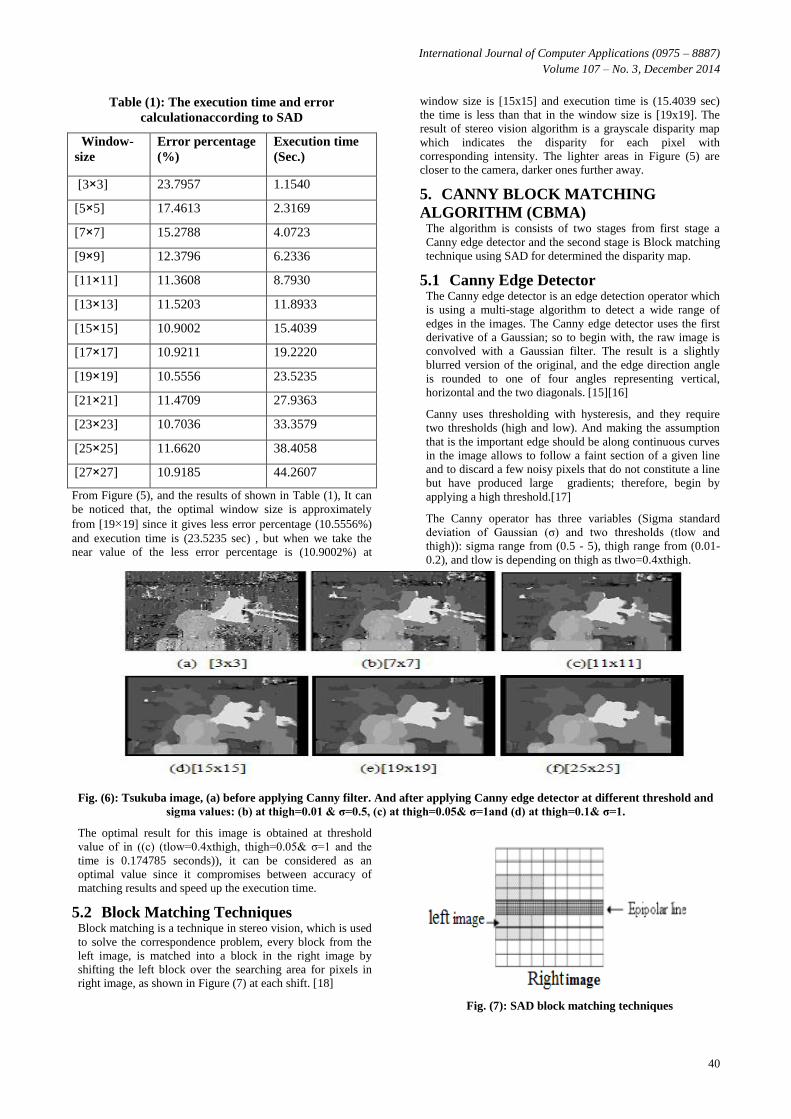
Fig. (6): Tsukuba image, (a) before applying Canny filter. And after applying Canny edge detector at different threshold and
sigma values: (b) at thigh=0.01 & σ=0.5, (c) at thigh=0.05& σ=1and (d) at thigh=0.1& σ=1.
The optimal result for this image is obtained at threshold
value of in ((c) (tlow=0.4xthigh, thigh=0.05& σ=1 and the
time is 0.174785 seconds)), it can be considered as an
optimal value since it compromises between accuracy of
matching results and speed up the execution time.
5.2 Block Matching Techniques Block matching is a technique in stereo vision, which is used
to solve the correspondence problem, every block from the
left image, is matched into a block in the right image by
shifting the left block over the searching area for pixels in
right image, as shown in Figure (7) at each shift. [18]
Fig. (7): SAD block matching techniques
International Journal of Computer Applications (0975 – 8887)
Volume 107 – No. 3, December 2014
41
In order to reduce the computational time, in which the
search for the matched blocks is performed by moving the
reference window of the reference image block-by-block
over the target image, and the disparity value calculated for
the central pixel of the window represents the same disparity
value for all window's pixels neighboring the central pixel.
By this method large amount of SAD computation time can
be reduced.
5.3 Algorithm Steps The CBMA algorithm can be summarized as several major
steps, as follows:
Step1. Read the two real and rectified images (right image and
left image).
Step2. Convert both images from (RGB scale) color image to
Gray scale image.
Step3. Set the value of Standard deviation of Gaussian (σ=1)
Step4. Set the values of Canny edge detector thresholds
(thigh=0.05) and tlow=0.4thigh.
Step5. Set the value of “Search Range” (d = 0,…., dmax=16)
that represents the search range within a loop.
Step6.Set the size of the two matching window (block) for
search rows and columns.
Step7. Prepare a 3D array (x, y, d) for disparity map.
Step8. Set initial match value (Initial SAD) using a function
of image intensities calculated by sum of absolute
differences
Initial SAD = 2^16 -1=65535
Step9. Compute SAD between reference window and
candidate windows at each shift (value of dmax) according
to the Equation (2).
Step10. Iteratively update the initial SAD value with every
new minimum SAD computed, until the match value
converges. Note that the matching is computed for minimum
SAD value since; it represents the mean error value.
Step11. For each pixel (x, y) of the reference image, find the
disparity element (x, y, d), where the disparity value at
which minimum SAD is obtained. The set of disparity values
represents the disparity map.
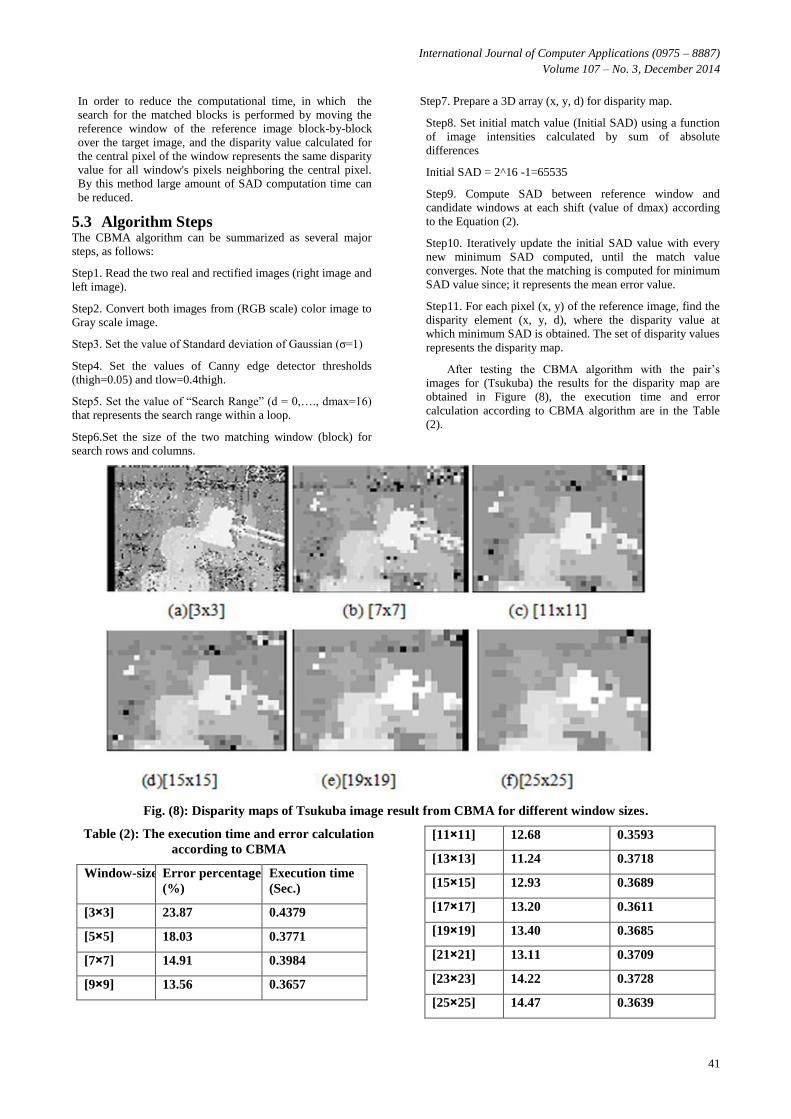
After testing the CBMA algorithm with the pair’s
images for (Tsukuba) the results for the disparity map are
obtained in Figure (8), the execution time and error
calculation according to CBMA algorithm are in the Table
(2).
Fig. (8): Disparity maps of Tsukuba image result from CBMA for different window sizes.
Table (2): The execution time and error calculation
according to CBMA
Window-size Error percentage
(%)
Execution time
(Sec.)
[3×3] 23.87 0.4379
[5×5] 18.03 0.3771
[7×7] 14.91 0.3984
[9×9] 13.56 0.3657
[11×11] 12.68 0.3593
[13×13] 11.24 0.3718
[15×15] 12.93 0.3689
[17×17] 13.20 0.3611
[19×19] 13.40 0.3685
[21×21] 13.11 0.3709
[23×23] 14.22 0.3728
[25×25] 14.47 0.3639
International Journal of Computer Applications (0975 – 8887)
Volume 107 – No. 3, December 2014
42
[27×27] 13.40 0.3655
From Table (2) by this method, large amount of SAD
computation can be reduced, consequently the computation
time is dramatically reduced as shown the execution time
between (0.4379 and 0.3593) sec is good for application to
robots. The Error percentage with different windows shows
the optimal window as [13x13] and gives the less error
percentage with execution time which is (0.3718) sec. So, the
algorithm (CBMA) has reduced the execution time, but the
Error percentage is slightly larger than the other algorithms,
but the window [13x13] is taken good to do the work to
compute the disparity map.
5.4 Comparison of the Results The error percentage and the execution time results from the
(SAD) and (CBMA) algorithms are carried out for Tsukuba
image pair is compared. So, the values of the error percentage
and the values of the execution time are taken from Tables (1)
and (2) and used in Figures (9) and (10) respectively.
Fig. (9): Compare Results Error percentage between
SAD & CBMA
As shown in Figure (9), the Error percentage of SAD is
slightly better than the CBMA about (2%), the smallest value
of the error percentage in SAD is (10.55%) with execution
time (23.523sec) at window which is [19x19] and the smallest
value of the error for CBMA is (11.24%) with execution time
(0.372 sec) at window [13x13] so the advantage can be taken
for the smallest execution time achieve with the CBMA.
Fig. (10): Comparison Results Execution time
between SAD & CBMA
As shown in Figure (10) the large amount of reduction in
execution time for CBMA has been achieved with different
image pairs. This reduction is attributed to the search for the
matched blocks technique (Block-by-Block) instead of (pixel-
by-pixel) search technique used in SAD algorithm. The
reduction CBMA algorithm between (0.4379 - 0.3593) sec is
very large, and the relation between the window size and the
execution in the SAD algorithm is removed when the window
size large and the execution time are large too, but in CBMA
algorithm, the window size effect the error percentage only
and no big change on the execution time.
6. STEREO VISION HARDWARE The vision system hardware used is composed of two
identical models USB web cameras connected to PC with
USB cable, as shown in Figure(11).The camera specification,
High Resolution CMOS Color Sensor, Resolution: 1300k
pixel (interpolated 5M), Interface: 2.0, Photo quality of 3
Megapixels. The system operates at a resolution of 320×240.
This is generally suitable for vision system and actually
reduces the number of pixels that requires more computation
time. The selected value of baseline enables to a working area
of stereo vision (FOV) 4.45m width at range of 4m.
Fig. (11): The implemented stereo vision system
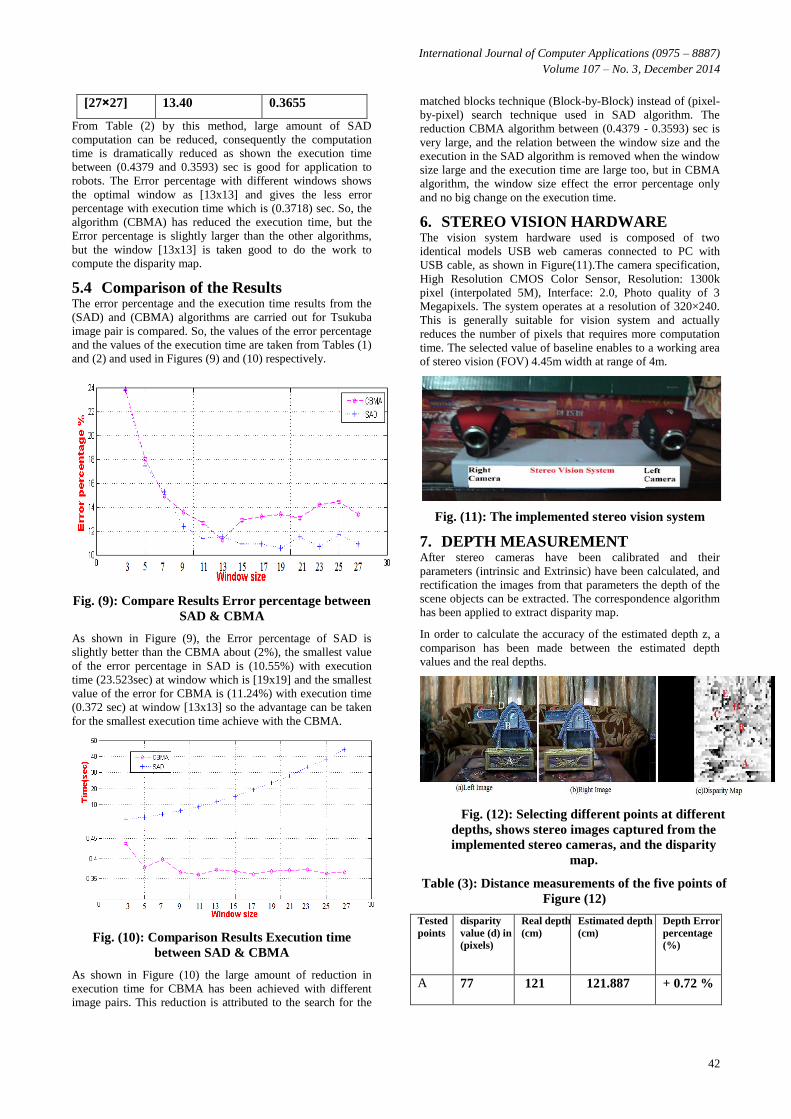
7. DEPTH MEASUREMENT After stereo cameras have been calibrated and their
parameters (intrinsic and Extrinsic) have been calculated, and
rectification the images from that parameters the depth of the
scene objects can be extracted. The correspondence algorithm
has been applied to extract disparity map.
In order to calculate the accuracy of the estimated depth z, a
comparison has been made between the estimated depth
values and the real depths.
Fig. (12): Selecting different points at different
depths, shows stereo images captured from the
implemented stereo cameras, and the disparity
map.
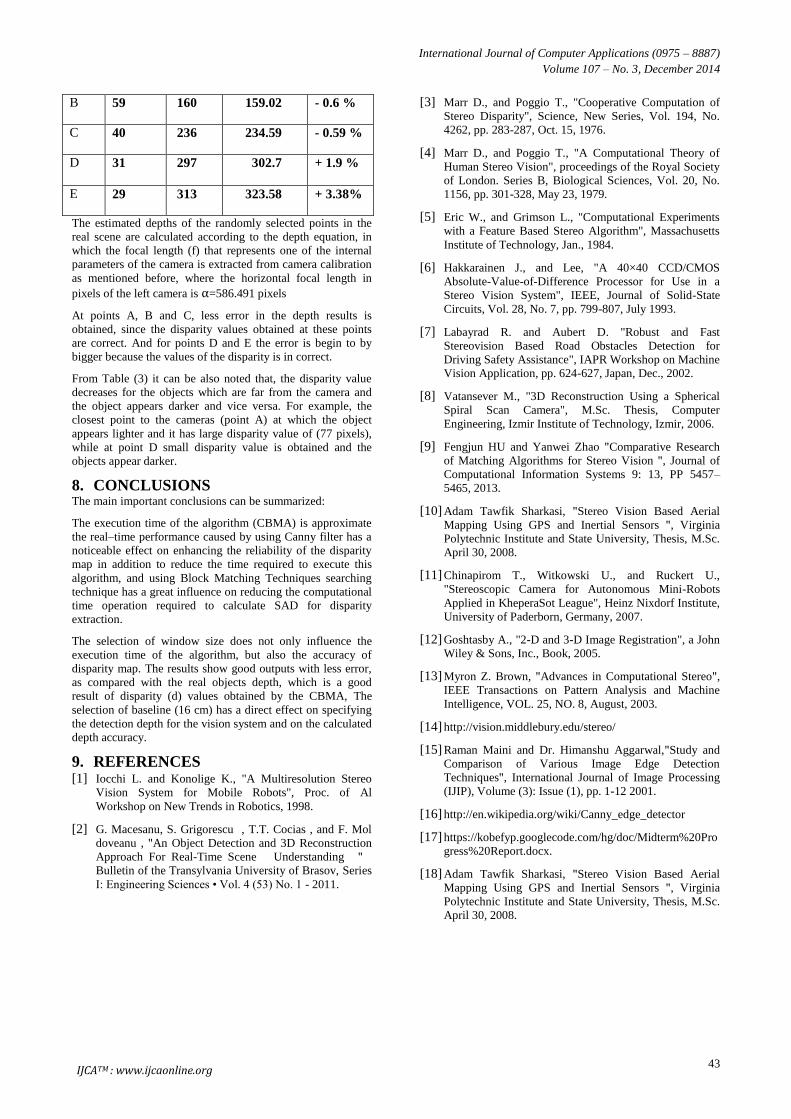
Table (3): Distance measurements of the five points of
Figure (12)
Tested
points
disparity
value (d) in
(pixels)
Real depth
(cm)
Estimated depth
(cm)
Depth Error
percentage
(%)
A 77 121 121.887 + 0.72 %
International Journal of Computer Applications (0975 – 8887)
Volume 107 – No. 3, December 2014
43
B 59 160 159.02 - 0.6 %
C 40 236 234.59 - 0.59 %
D 31 297 302.7 + 1.9 %
E 29 313 323.58 + 3.38%
The estimated depths of the randomly selected points in the
real scene are calculated according to the depth equation, in
which the focal length (f) that represents one of the internal
parameters of the camera is extracted from camera calibration
as mentioned before, where the horizontal focal length in
pixels of the left camera is α=586.491 pixels
At points A, B and C, less error in the depth results is
obtained, since the disparity values obtained at these points
are correct. And for points D and E the error is begin to by
bigger because the values of the disparity is in correct.
From Table (3) it can be also noted that, the disparity value
decreases for the objects which are far from the camera and
the object appears darker and vice versa. For example, the
closest point to the cameras (point A) at which the object
appears lighter and it has large disparity value of (77 pixels),
while at point D small disparity value is obtained and the
objects appear darker.
8. CONCLUSIONS The main important conclusions can be summarized:
The execution time of the algorithm (CBMA) is approximate
the real–time performance caused by using Canny filter has a
noticeable effect on enhancing the reliability of the disparity
map in addition to reduce the time required to execute this
algorithm, and using Block Matching Techniques searching
technique has a great influence on reducing the computational
time operation required to calculate SAD for disparity
extraction.
The selection of window size does not only influence the
execution time of the algorithm, but also the accuracy of
disparity map. The results show good outputs with less error,
as compared with the real objects depth, which is a good
result of disparity (d) values obtained by the CBMA, The
selection of baseline (16 cm) has a direct effect on specifying
the detection depth for the vision system and on the calculated
depth accuracy.
9. REFERENCES [1] Iocchi L. and Konolige K., "A Multiresolution Stereo
Vision System for Mobile Robots", Proc. of Al
Workshop on New Trends in Robotics, 1998.
[2] G. Macesanu, S. Grigorescu , T.T. Cocias , and F. Mol
doveanu , "An Object Detection and 3D Reconstruction
Approach For Real-Time Scene Understanding "
Bulletin of the Transylvania University of Brasov, Series
I: Engineering Sciences • Vol. 4 (53) No. 1 - 2011.
[3] Marr D., and Poggio T., "Cooperative Computation of
Stereo Disparity", Science, New Series, Vol. 194, No.
4262, pp. 283-287, Oct. 15, 1976.
[4] Marr D., and Poggio T., "A Computational Theory of
Human Stereo Vision", proceedings of the Royal Society
of London. Series B, Biological Sciences, Vol. 20, No.
1156, pp. 301-328, May 23, 1979.
[5] Eric W., and Grimson L., "Computational Experiments
with a Feature Based Stereo Algorithm", Massachusetts
Institute of Technology, Jan., 1984.
[6] Hakkarainen J., and Lee, "A 40×40 CCD/CMOS
Absolute-Value-of-Difference Processor for Use in a
Stereo Vision System", IEEE, Journal of Solid-State
Circuits, Vol. 28, No. 7, pp. 799-807, July 1993.
[7] Labayrad R. and Aubert D. "Robust and Fast
Stereovision Based Road Obstacles Detection for
Driving Safety Assistance", IAPR Workshop on Machine
Vision Application, pp. 624-627, Japan, Dec., 2002.
[8] Vatansever M., "3D Reconstruction Using a Spherical
Spiral Scan Camera", M.Sc. Thesis, Computer
Engineering, Izmir Institute of Technology, Izmir, 2006.
[9] Fengjun HU and Yanwei Zhao "Comparative Research
of Matching Algorithms for Stereo Vision ", Journal of
Computational Information Systems 9: 13, PP 5457–
5465, 2013.
[10] Adam Tawfik Sharkasi, "Stereo Vision Based Aerial
Mapping Using GPS and Inertial Sensors ", Virginia
Polytechnic Institute and State University, Thesis, M.Sc.
April 30, 2008.
[11] Chinapirom T., Witkowski U., and Ruckert U.,
"Stereoscopic Camera for Autonomous Mini-Robots
Applied in KheperaSot League", Heinz Nixdorf Institute,
University of Paderborn, Germany, 2007.
[12] Goshtasby A., "2-D and 3-D Image Registration", a John
Wiley & Sons, Inc., Book, 2005.
[13] Myron Z. Brown, "Advances in Computational Stereo",
IEEE Transactions on Pattern Analysis and Machine
Intelligence, VOL. 25, NO. 8, August, 2003.
[14] http://vision.middlebury.edu/stereo/
[15] Raman Maini and Dr. Himanshu Aggarwal,"Study and
Comparison of Various Image Edge Detection
Techniques", International Journal of Image Processing
(IJIP), Volume (3): Issue (1), pp. 1-12 2001.
[16] http://en.wikipedia.org/wiki/Canny_edge_detector
[17] https://kobefyp.googlecode.com/hg/doc/Midterm%20Pro
gress%20Report.docx.
[18] Adam Tawfik Sharkasi, "Stereo Vision Based Aerial
Mapping Using GPS and Inertial Sensors ", Virginia
Polytechnic Institute and State University, Thesis, M.Sc.
April 30, 2008.
IJCATM : www.ijcaonline.org