Embed Size (px)
Citation preview
1
Stephanie M. Day
12/10/12
6th Grade Mathematics
2
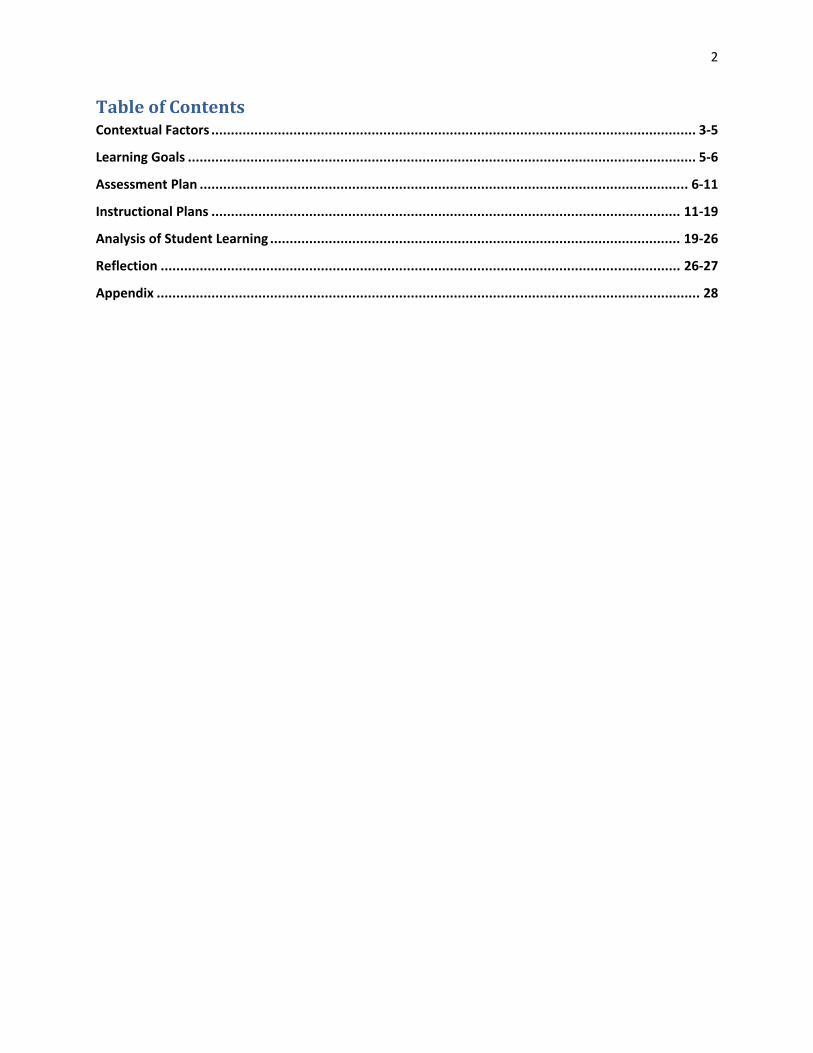
TableofContentsContextual Factors ............................................................................................................................ 3‐5
Learning Goals .................................................................................................................................. 5‐6
Assessment Plan ............................................................................................................................. 6‐11
Instructional Plans ........................................................................................................................ 11‐19
Analysis of Student Learning ......................................................................................................... 19‐26
Reflection ..................................................................................................................................... 26‐27
Appendix ........................................................................................................................................... 28

3
Contextual Factors
The Math and Science Magnet School is part of the Jonesboro Public School District.
Math and Science is located at 213 East Thomas Green Road in Jonesboro, Arkansas. This is on
the western part of town. Because it is a magnet school, the students that attend are in grades
first through sixth. Between these grades, the student population is about 600 students. An
indicator of the socio‐economic status of the school is that 96% of the students are on free and
reduced lunches. The student population is made of many different race/ethnicities. Based
upon the sixth grade classes that I taught approximately 31.6% were Caucasian, 51.9% were
African American, 11.4% were Hispanic, and 1.3% were from the Middle East. In regards to
community support for education, I was able to observe parent‐teacher conference after school
on two days during my internship. Out of a class of twenty‐six students, we only had about ten
parents show up between the two days. My cooperating teacher also posted the bonus answer
for the upcoming test on his website, and we found that not one parent viewed the information
because none of the students answered the question correctly. An example of positive support
for the community would be that Math and Science Magnet instituted a “Dads Bring Your Child
to School Day” where they had almost 90 fathers sign‐in their students.
There is one marker board at the front of the room. At the very back of the room, there
are open cubbies for the students to hang their coats, backpacks, and place folders. Storage
cabinets and a sink are along the left wall in the room with bookshelves holding books for
student check‐out on the right wall. The only bulletin board in the room is located at the front
of the room by the door. All of the emergency plans are posted on this board with the school
schedule, lunch calendar, and mission statement. Technology is easily accessible at Math and
Science. There is a projector, screen, and teacher computer that has SMART Notebook
software on it and a Sympodium. My cooperating teacher also had a classroom set of clickers
and a student computer in the room. The school has a computer lab of computers that are
compatible with both MAC and Windows. The climate in the classroom is one where the
students feel comfortable discussing ideas and asking questions. Some of the rules of the
classroom include: no chewing gum, raising your hand to ask a question/talk, and coming to
class prepared. The normal routine during a class includes doing their bell ringer, checking
homework, and discussing the lesson. A bell does not signal the change of classes at Math and
Science, so the classes may let out late at times. They are a little more lenient with letting
students leave the classroom to go to the bathroom or get a drink because they are not allowed
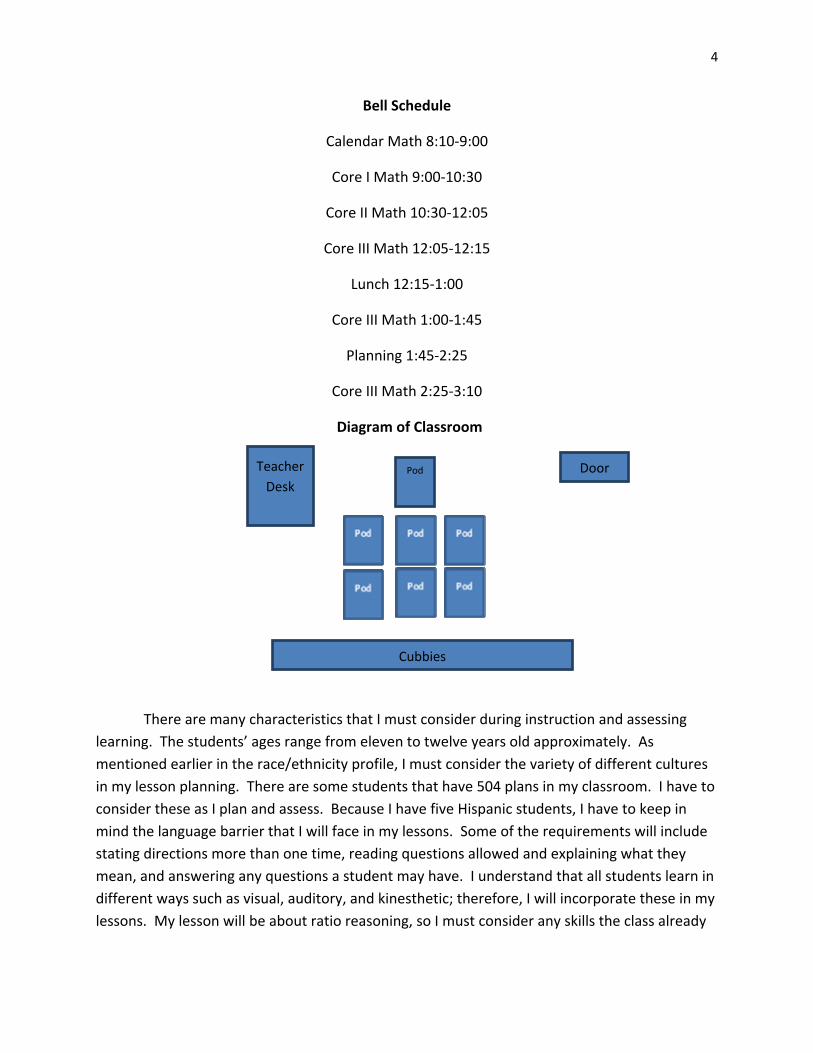
to do anything between classes. The entire sixth grade class sits in groups called “pods” where
they have desks that face each other. They are grouped by putting lower level learners in
groups with average and higher level learners.
4
Bell Schedule
Calendar Math 8:10‐9:00
Core I Math 9:00‐10:30
Core II Math 10:30‐12:05
Core III Math 12:05‐12:15
Lunch 12:15‐1:00
Core III Math 1:00‐1:45
Planning 1:45‐2:25
Core III Math 2:25‐3:10
Diagram of Classroom
Pod Door
Teacher
Desk
Cubbies
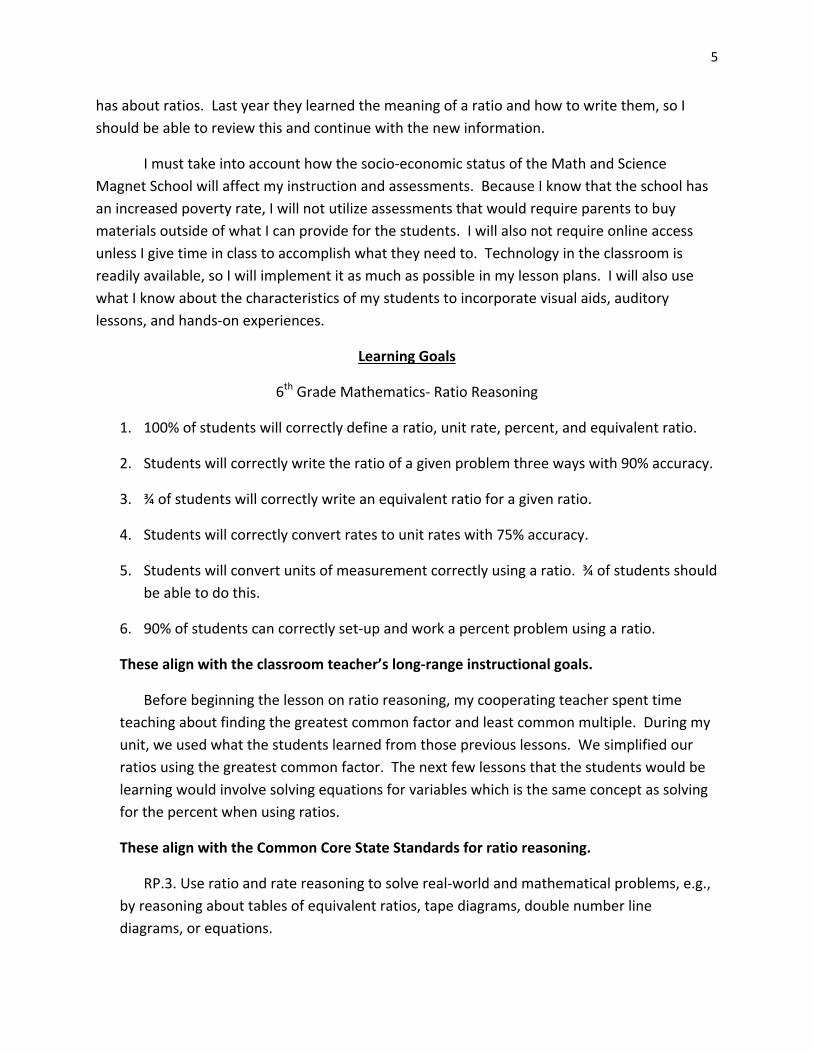
There are many characteristics that I must consider during instruction and assessing
learning. The students’ ages range from eleven to twelve years old approximately. As
mentioned earlier in the race/ethnicity profile, I must consider the variety of different cultures
in my lesson planning. There are some students that have 504 plans in my classroom. I have to
consider these as I plan and assess. Because I have five Hispanic students, I have to keep in
mind the language barrier that I will face in my lessons. Some of the requirements will include
stating directions more than one time, reading questions allowed and explaining what they
mean, and answering any questions a student may have. I understand that all students learn in
different ways such as visual, auditory, and kinesthetic; therefore, I will incorporate these in my
lessons. My lesson will be about ratio reasoning, so I must consider any skills the class already
5
has about ratios. Last year they learned the meaning of a ratio and how to write them, so I
should be able to review this and continue with the new information.
I must take into account how the socio‐economic status of the Math and Science
Magnet School will affect my instruction and assessments. Because I know that the school has
an increased poverty rate, I will not utilize assessments that would require parents to buy
materials outside of what I can provide for the students. I will also not require online access
unless I give time in class to accomplish what they need to. Technology in the classroom is
readily available, so I will implement it as much as possible in my lesson plans. I will also use
what I know about the characteristics of my students to incorporate visual aids, auditory
lessons, and hands‐on experiences.
Learning Goals
6th Grade Mathematics‐ Ratio Reasoning
1. 100% of students will correctly define a ratio, unit rate, percent, and equivalent ratio.
2. Students will correctly write the ratio of a given problem three ways with 90% accuracy.
3. ¾ of students will correctly write an equivalent ratio for a given ratio.
4. Students will correctly convert rates to unit rates with 75% accuracy.
5. Students will convert units of measurement correctly using a ratio. ¾ of students should
be able to do this.
6. 90% of students can correctly set‐up and work a percent problem using a ratio.
These align with the classroom teacher’s long‐range instructional goals.
Before beginning the lesson on ratio reasoning, my cooperating teacher spent time
teaching about finding the greatest common factor and least common multiple. During my
unit, we used what the students learned from those previous lessons. We simplified our
ratios using the greatest common factor. The next few lessons that the students would be
learning would involve solving equations for variables which is the same concept as solving
for the percent when using ratios.
These align with the Common Core State Standards for ratio reasoning.
RP.3. Use ratio and rate reasoning to solve real‐world and mathematical problems, e.g.,
by reasoning about tables of equivalent ratios, tape diagrams, double number line
diagrams, or equations.
6
a. Make tables of equivalent ratios relating quantities with whole‐number measurements,
find missing values in the tables, and plot the pairs of values on the coordinate plane.
Use tables to compare ratios.
b. Solve unit rate problems including those involving unit pricing and constant speed. For
example, if it took 7 hours to mow 4 lawns, then at that rate, how many lawns could be
mowed in 35 hours? At what rate were lawns being mowed?
c. Find a percent of a quantity as a rate per 100 (e.g., 30% of a quantity means 30/100
times the quantity); solve problems involving finding the whole, given a part and the
percent.
d. Use ratio reasoning to convert measurement units; manipulate and transform units
appropriately when multiplying or dividing quantities.
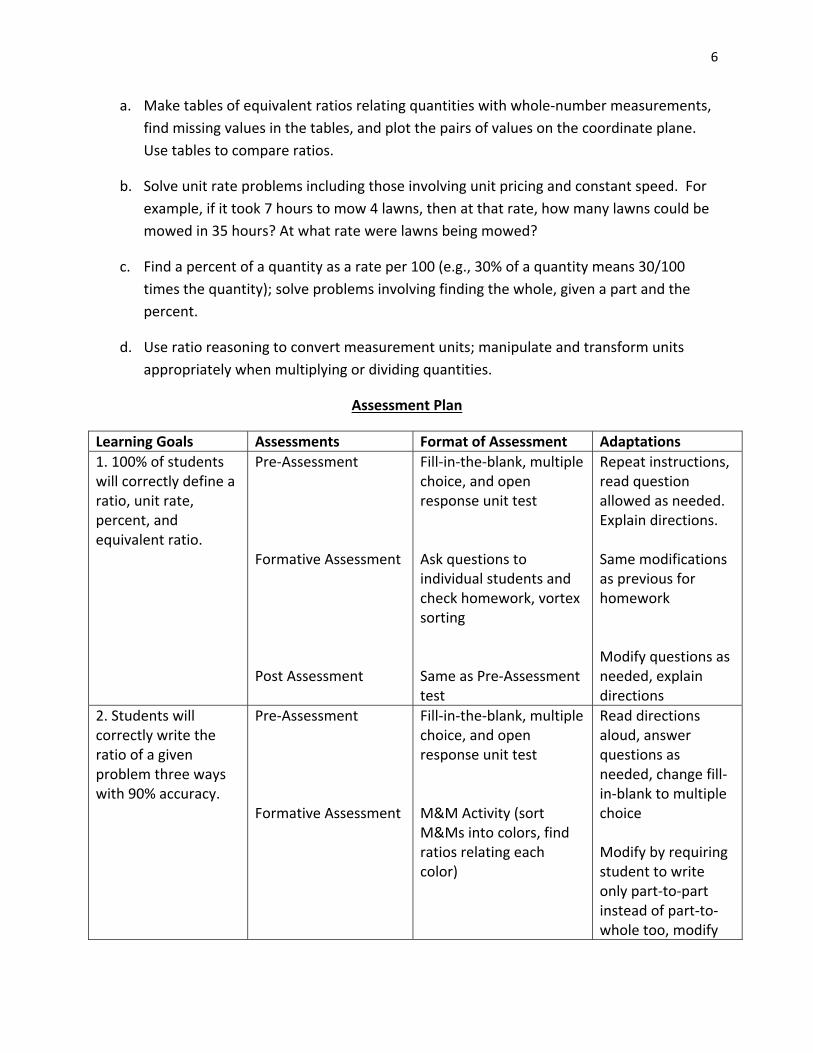
Assessment Plan
Learning Goals Assessments Format of Assessment Adaptations
1. 100% of students will correctly define a ratio, unit rate, percent, and equivalent ratio.
Pre‐Assessment Formative Assessment Post Assessment
Fill‐in‐the‐blank, multiple choice, and open response unit test Ask questions to individual students and check homework, vortex sorting Same as Pre‐Assessment test
Repeat instructions, read question allowed as needed. Explain directions. Same modifications as previous for homework Modify questions as needed, explain directions
2. Students will correctly write the ratio of a given problem three ways with 90% accuracy.
Pre‐Assessment Formative Assessment
Fill‐in‐the‐blank, multiple choice, and open response unit test M&M Activity (sort M&Ms into colors, find ratios relating each color)
Read directions aloud, answer questions as needed, change fill‐in‐blank to multiple choice Modify by requiring student to write only part‐to‐part instead of part‐to‐whole too, modify
7
Post‐Assessment
Same as Pre‐Assessment test
groups as needed Modify by making fill‐in‐the‐blank have choices, less choice on multiple choice, same modifications a pre‐assessment
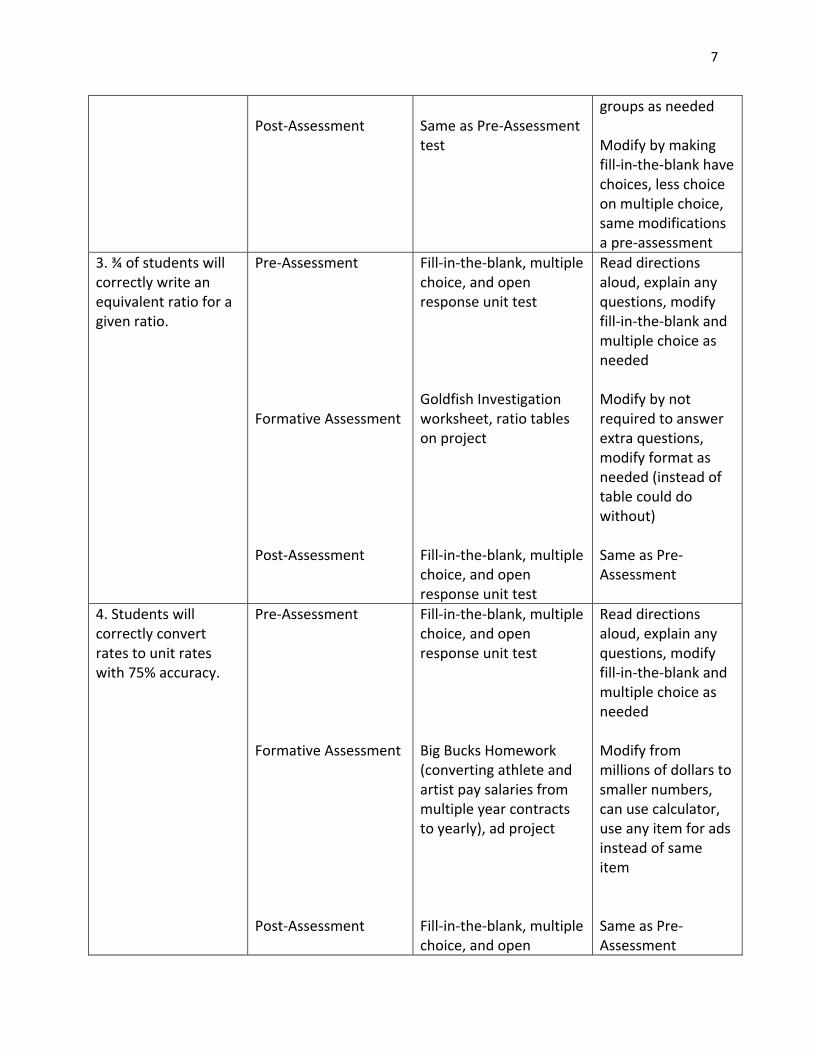
3. ¾ of students will correctly write an equivalent ratio for a given ratio.
Pre‐Assessment Formative Assessment Post‐Assessment
Fill‐in‐the‐blank, multiple choice, and open response unit test Goldfish Investigation worksheet, ratio tables on project Fill‐in‐the‐blank, multiple choice, and open response unit test
Read directions aloud, explain any questions, modify fill‐in‐the‐blank and multiple choice as needed Modify by not required to answer extra questions, modify format as needed (instead of table could do without) Same as Pre‐Assessment
4. Students will correctly convert rates to unit rates with 75% accuracy.
Pre‐Assessment Formative Assessment Post‐Assessment
Fill‐in‐the‐blank, multiple choice, and open response unit test Big Bucks Homework (converting athlete and artist pay salaries from multiple year contracts to yearly), ad project Fill‐in‐the‐blank, multiple choice, and open
Read directions aloud, explain any questions, modify fill‐in‐the‐blank and multiple choice as needed Modify from millions of dollars to smaller numbers, can use calculator, use any item for ads instead of same item Same as Pre‐Assessment
8
response unit test
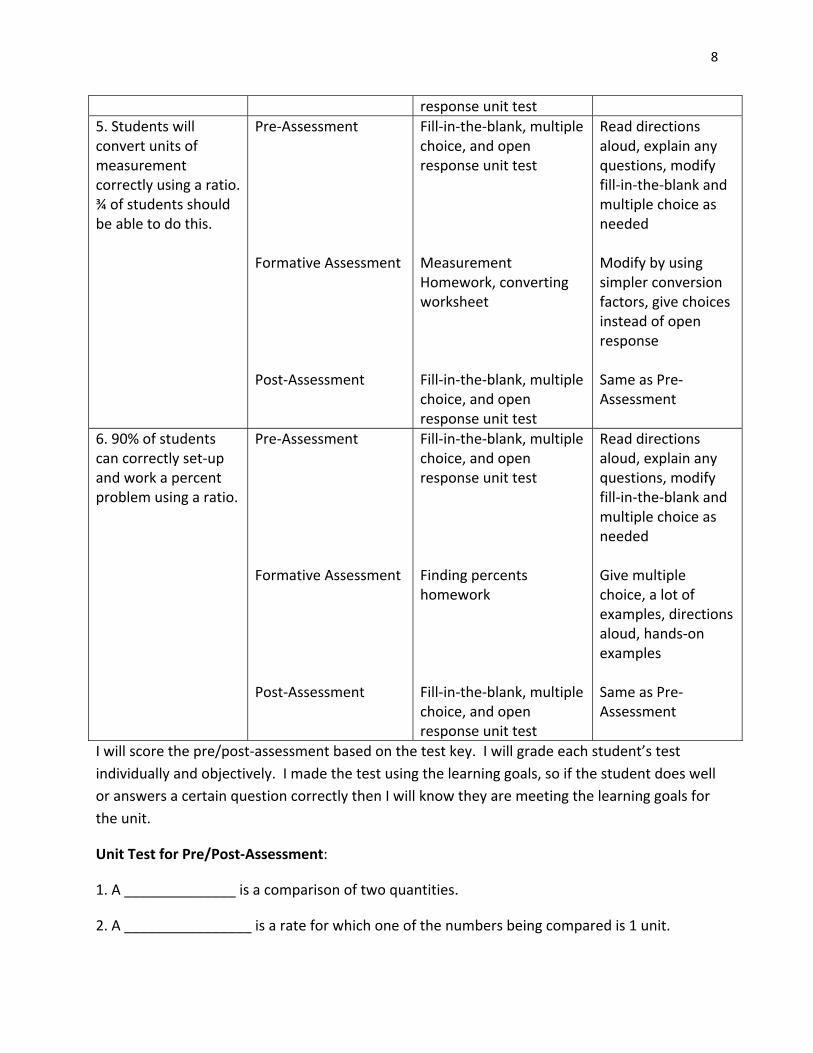
5. Students will convert units of measurement correctly using a ratio. ¾ of students should be able to do this.
Pre‐Assessment Formative Assessment Post‐Assessment
Fill‐in‐the‐blank, multiple choice, and open response unit test Measurement Homework, converting worksheet Fill‐in‐the‐blank, multiple choice, and open response unit test
Read directions aloud, explain any questions, modify fill‐in‐the‐blank and multiple choice as needed Modify by using simpler conversion factors, give choices instead of open response Same as Pre‐Assessment
6. 90% of students can correctly set‐up and work a percent problem using a ratio.
Pre‐Assessment Formative Assessment Post‐Assessment
Fill‐in‐the‐blank, multiple choice, and open response unit test Finding percents homework Fill‐in‐the‐blank, multiple choice, and open response unit test
Read directions aloud, explain any questions, modify fill‐in‐the‐blank and multiple choice as needed Give multiple choice, a lot of examples, directions aloud, hands‐on examples Same as Pre‐Assessment
I will score the pre/post‐assessment based on the test key. I will grade each student’s test
individually and objectively. I made the test using the learning goals, so if the student does well
or answers a certain question correctly then I will know they are meeting the learning goals for
the unit.
Unit Test for Pre/Post‐Assessment:
1. A ______________ is a comparison of two quantities.
2. A ________________ is a rate for which one of the numbers being compared is 1 unit.
9
3. The word _______________ means “out of 100”.
4. If two ratios have the same value when simplified, they are called ______________ ratios.
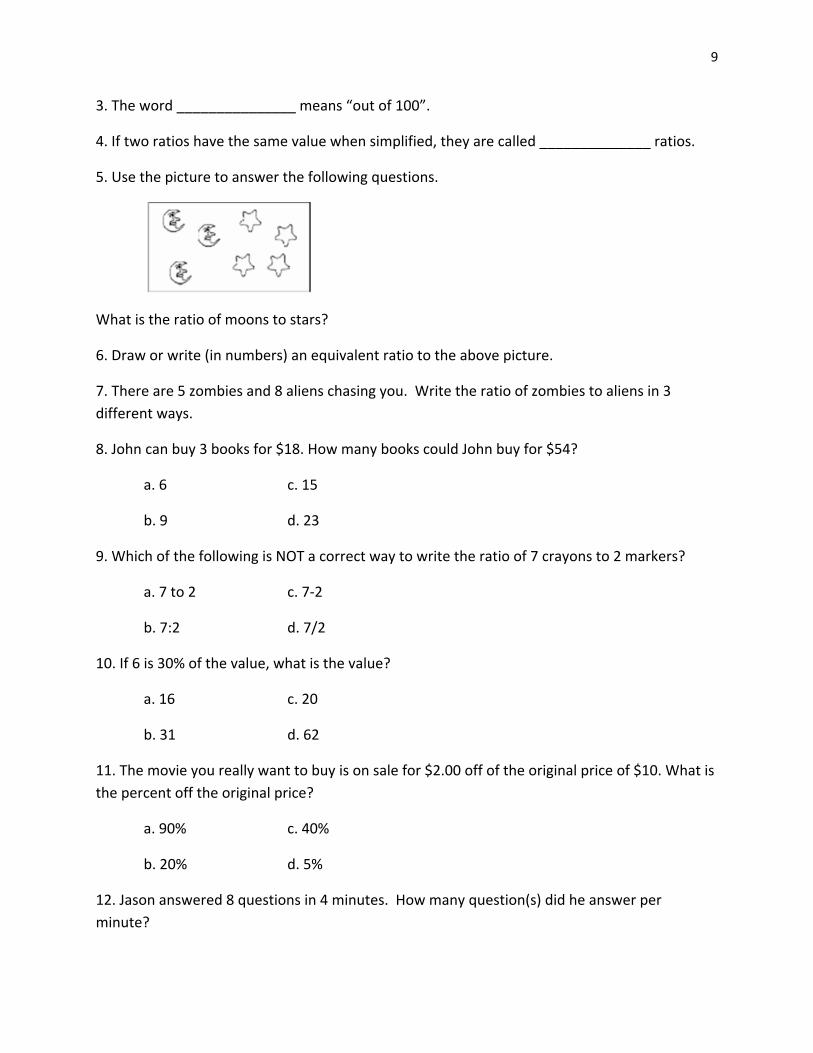
5. Use the picture to answer the following questions.
What is the ratio of moons to stars?
6. Draw or write (in numbers) an equivalent ratio to the above picture.
7. There are 5 zombies and 8 aliens chasing you. Write the ratio of zombies to aliens in 3
different ways.
8. John can buy 3 books for $18. How many books could John buy for $54?
a. 6 c. 15
b. 9 d. 23
9. Which of the following is NOT a correct way to write the ratio of 7 crayons to 2 markers?
a. 7 to 2 c. 7‐2
b. 7:2 d. 7/2
10. If 6 is 30% of the value, what is the value?
a. 16 c. 20
b. 31 d. 62
11. The movie you really want to buy is on sale for $2.00 off of the original price of $10. What is
the percent off the original price?
a. 90% c. 40%
b. 20% d. 5%
12. Jason answered 8 questions in 4 minutes. How many question(s) did he answer per
minute?
10
a. 1 c. 3
b. 2 d. 4
13. If Michelle needed 14 inches of ribbon to create one hair bow, what is the largest amount of
hair bows that she could create if she had 6 feet of ribbon?
a. 5 c. 10
b. 6 d. 11
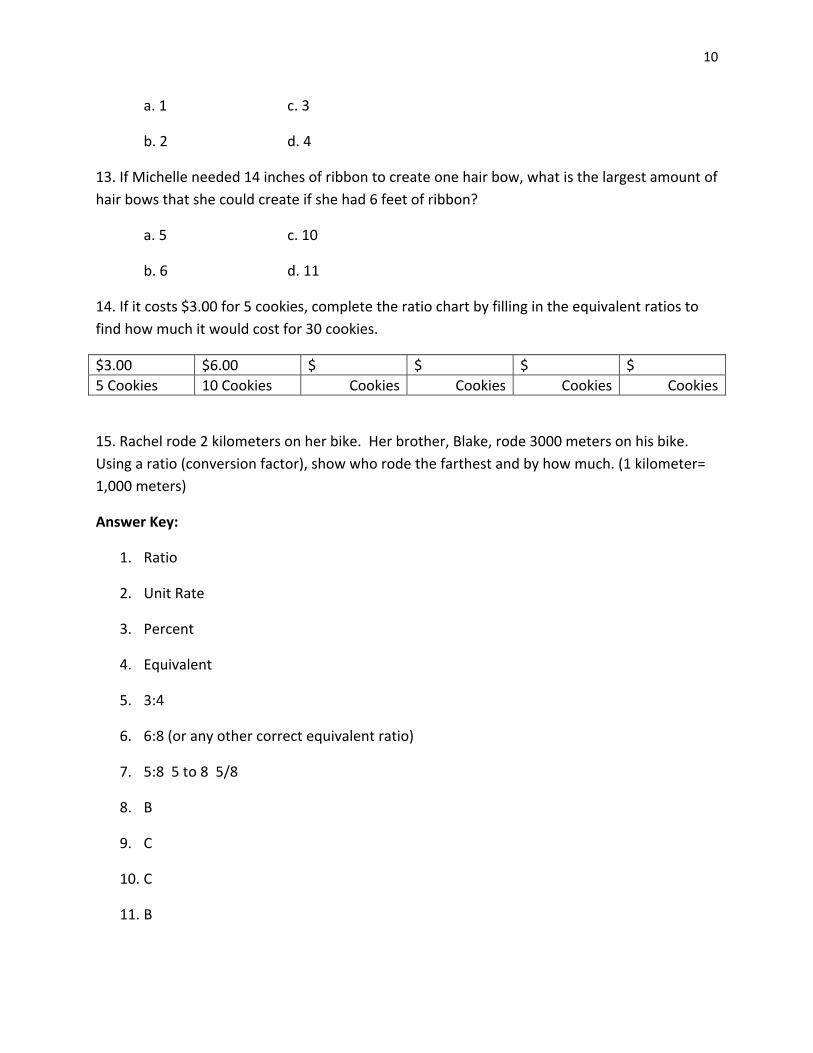
14. If it costs $3.00 for 5 cookies, complete the ratio chart by filling in the equivalent ratios to
find how much it would cost for 30 cookies.
$3.00 $6.00 $ $ $ $
5 Cookies 10 Cookies Cookies Cookies Cookies Cookies
15. Rachel rode 2 kilometers on her bike. Her brother, Blake, rode 3000 meters on his bike.
Using a ratio (conversion factor), show who rode the farthest and by how much. (1 kilometer=
1,000 meters)
Answer Key:
1. Ratio
2. Unit Rate
3. Percent
4. Equivalent
5. 3:4
6. 6:8 (or any other correct equivalent ratio)
7. 5:8 5 to 8 5/8
8. B
9. C
10. C
11. B
11
12. B
13. A
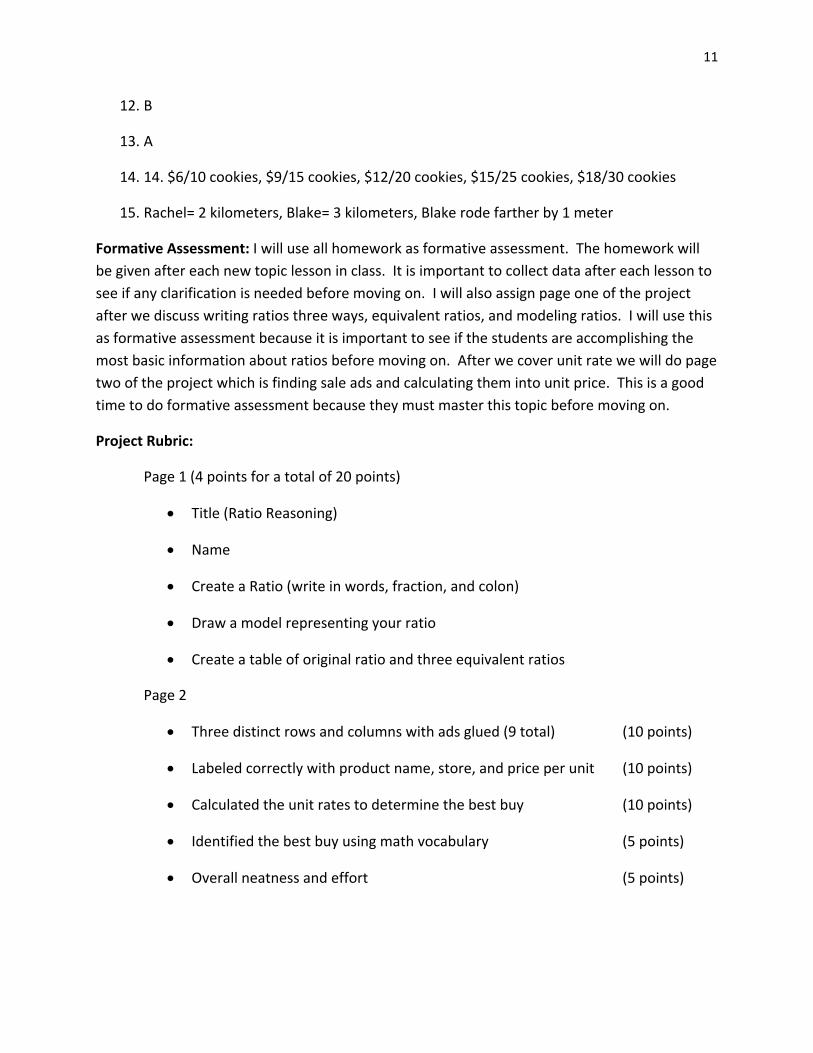
14. 14. $6/10 cookies, $9/15 cookies, $12/20 cookies, $15/25 cookies, $18/30 cookies
15. Rachel= 2 kilometers, Blake= 3 kilometers, Blake rode farther by 1 meter
Formative Assessment: I will use all homework as formative assessment. The homework will
be given after each new topic lesson in class. It is important to collect data after each lesson to
see if any clarification is needed before moving on. I will also assign page one of the project
after we discuss writing ratios three ways, equivalent ratios, and modeling ratios. I will use this
as formative assessment because it is important to see if the students are accomplishing the
most basic information about ratios before moving on. After we cover unit rate we will do page
two of the project which is finding sale ads and calculating them into unit price. This is a good
time to do formative assessment because they must master this topic before moving on.
Project Rubric:
Page 1 (4 points for a total of 20 points)
Title (Ratio Reasoning)
Name
Create a Ratio (write in words, fraction, and colon)
Draw a model representing your ratio
Create a table of original ratio and three equivalent ratios
Page 2
Three distinct rows and columns with ads glued (9 total) (10 points)
Labeled correctly with product name, store, and price per unit (10 points)
Calculated the unit rates to determine the best buy (10 points)
Identified the best buy using math vocabulary (5 points)
Overall neatness and effort (5 points)
12
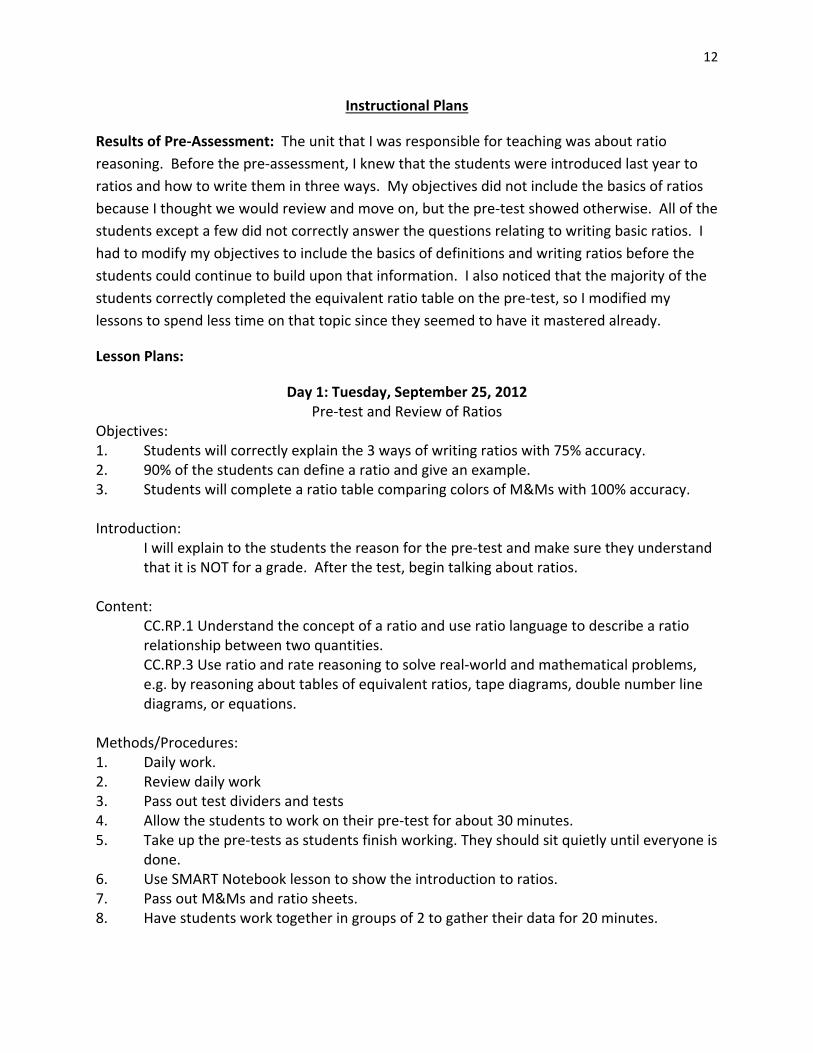
Instructional Plans
Results of Pre‐Assessment: The unit that I was responsible for teaching was about ratio
reasoning. Before the pre‐assessment, I knew that the students were introduced last year to
ratios and how to write them in three ways. My objectives did not include the basics of ratios
because I thought we would review and move on, but the pre‐test showed otherwise. All of the
students except a few did not correctly answer the questions relating to writing basic ratios. I
had to modify my objectives to include the basics of definitions and writing ratios before the
students could continue to build upon that information. I also noticed that the majority of the
students correctly completed the equivalent ratio table on the pre‐test, so I modified my
lessons to spend less time on that topic since they seemed to have it mastered already.
Lesson Plans:
Day 1: Tuesday, September 25, 2012 Pre‐test and Review of Ratios
Objectives: 1. Students will correctly explain the 3 ways of writing ratios with 75% accuracy. 2. 90% of the students can define a ratio and give an example. 3. Students will complete a ratio table comparing colors of M&Ms with 100% accuracy. Introduction:
I will explain to the students the reason for the pre‐test and make sure they understand that it is NOT for a grade. After the test, begin talking about ratios.
Content: CC.RP.1 Understand the concept of a ratio and use ratio language to describe a ratio relationship between two quantities. CC.RP.3 Use ratio and rate reasoning to solve real‐world and mathematical problems, e.g. by reasoning about tables of equivalent ratios, tape diagrams, double number line diagrams, or equations.
Methods/Procedures: 1. Daily work. 2. Review daily work 3. Pass out test dividers and tests 4. Allow the students to work on their pre‐test for about 30 minutes. 5. Take up the pre‐tests as students finish working. They should sit quietly until everyone is
done. 6. Use SMART Notebook lesson to show the introduction to ratios. 7. Pass out M&Ms and ratio sheets. 8. Have students work together in groups of 2 to gather their data for 20 minutes.
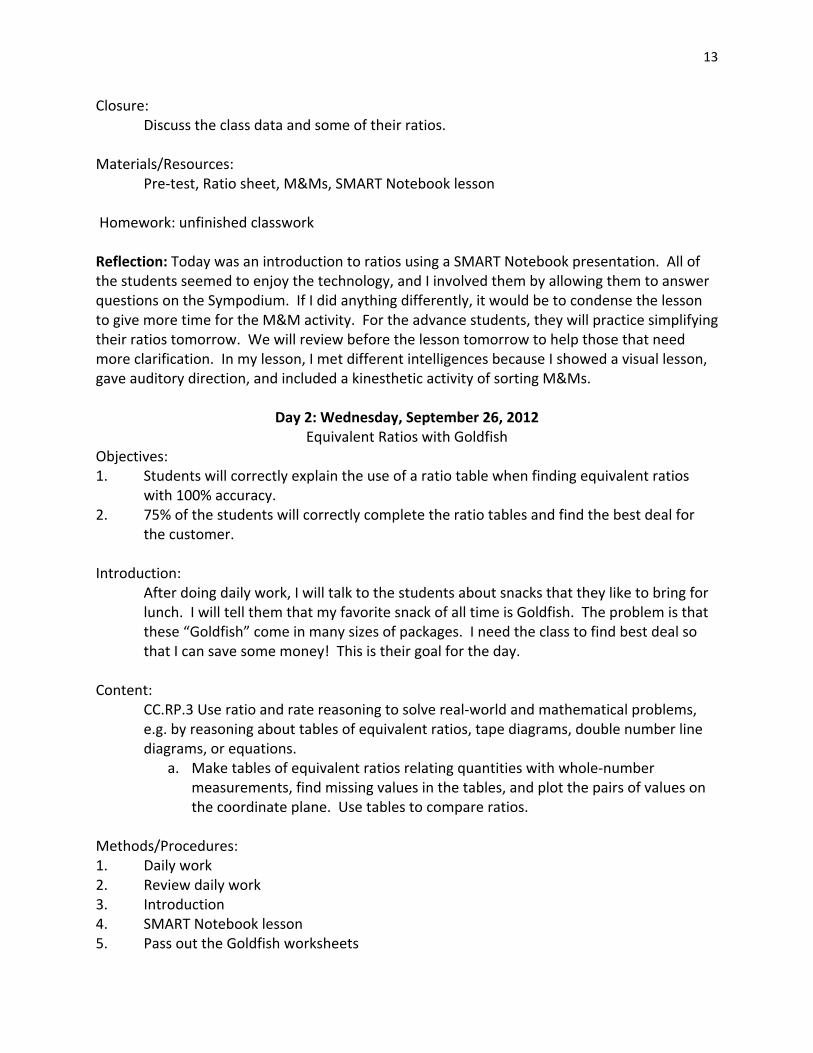
13
Closure: Discuss the class data and some of their ratios. Materials/Resources: Pre‐test, Ratio sheet, M&Ms, SMART Notebook lesson Homework: unfinished classwork Reflection: Today was an introduction to ratios using a SMART Notebook presentation. All of the students seemed to enjoy the technology, and I involved them by allowing them to answer questions on the Sympodium. If I did anything differently, it would be to condense the lesson to give more time for the M&M activity. For the advance students, they will practice simplifying their ratios tomorrow. We will review before the lesson tomorrow to help those that need more clarification. In my lesson, I met different intelligences because I showed a visual lesson, gave auditory direction, and included a kinesthetic activity of sorting M&Ms.
Day 2: Wednesday, September 26, 2012 Equivalent Ratios with Goldfish
Objectives: 1. Students will correctly explain the use of a ratio table when finding equivalent ratios
with 100% accuracy. 2. 75% of the students will correctly complete the ratio tables and find the best deal for
the customer. Introduction:
After doing daily work, I will talk to the students about snacks that they like to bring for lunch. I will tell them that my favorite snack of all time is Goldfish. The problem is that these “Goldfish” come in many sizes of packages. I need the class to find best deal so that I can save some money! This is their goal for the day.
Content: CC.RP.3 Use ratio and rate reasoning to solve real‐world and mathematical problems, e.g. by reasoning about tables of equivalent ratios, tape diagrams, double number line diagrams, or equations.
a. Make tables of equivalent ratios relating quantities with whole‐number measurements, find missing values in the tables, and plot the pairs of values on the coordinate plane. Use tables to compare ratios.
Methods/Procedures: 1. Daily work 2. Review daily work 3. Introduction 4. SMART Notebook lesson 5. Pass out the Goldfish worksheets
14
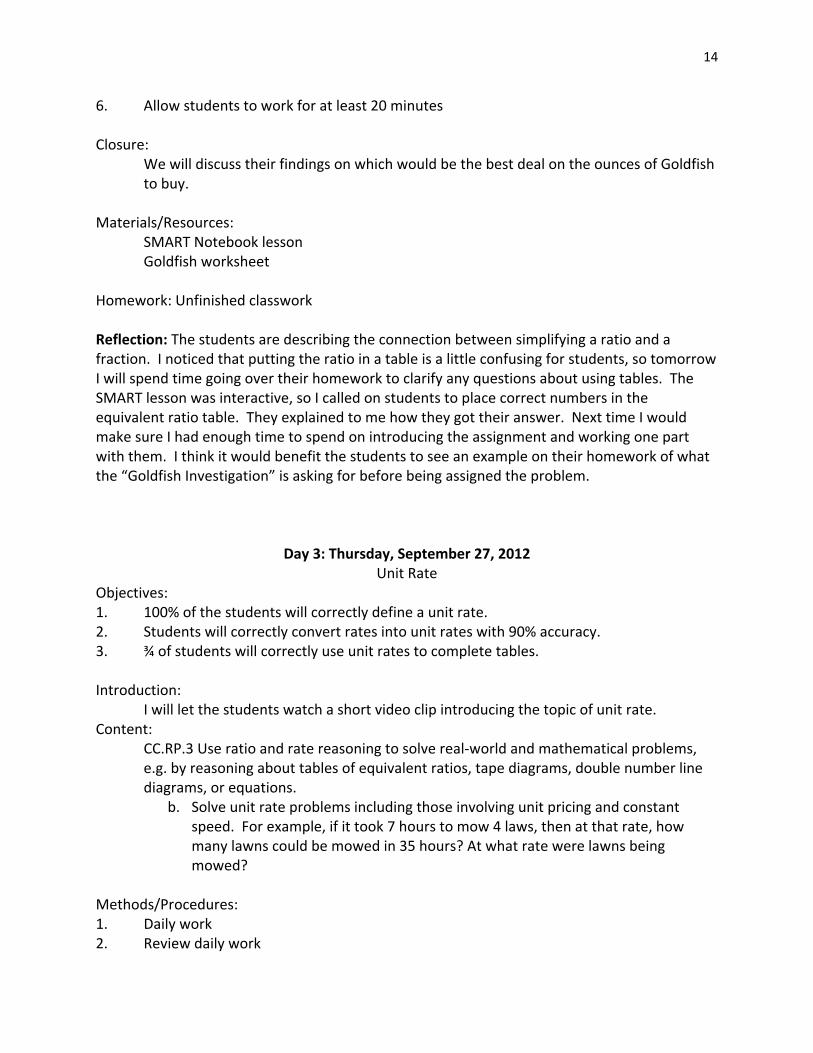
6. Allow students to work for at least 20 minutes Closure:
We will discuss their findings on which would be the best deal on the ounces of Goldfish to buy.
Materials/Resources: SMART Notebook lesson Goldfish worksheet Homework: Unfinished classwork Reflection: The students are describing the connection between simplifying a ratio and a fraction. I noticed that putting the ratio in a table is a little confusing for students, so tomorrow I will spend time going over their homework to clarify any questions about using tables. The SMART lesson was interactive, so I called on students to place correct numbers in the equivalent ratio table. They explained to me how they got their answer. Next time I would make sure I had enough time to spend on introducing the assignment and working one part with them. I think it would benefit the students to see an example on their homework of what the “Goldfish Investigation” is asking for before being assigned the problem.
Day 3: Thursday, September 27, 2012 Unit Rate
Objectives: 1. 100% of the students will correctly define a unit rate. 2. Students will correctly convert rates into unit rates with 90% accuracy. 3. ¾ of students will correctly use unit rates to complete tables. Introduction: I will let the students watch a short video clip introducing the topic of unit rate. Content:
CC.RP.3 Use ratio and rate reasoning to solve real‐world and mathematical problems, e.g. by reasoning about tables of equivalent ratios, tape diagrams, double number line diagrams, or equations.
b. Solve unit rate problems including those involving unit pricing and constant speed. For example, if it took 7 hours to mow 4 laws, then at that rate, how many lawns could be mowed in 35 hours? At what rate were lawns being mowed?
Methods/Procedures: 1. Daily work 2. Review daily work
15
3. Show video clip as introduction to unit rate 4. Begin with SMART lesson of unit rate 5. Have students work in their learning groups to complete the “Big Bucks” investigation. Closure:
Discuss with the students how they found which entertainers made the most money. How much did they make per game? How much did they make per movie? Which entertainers made the most, and how do you know?
Materials/Resources: Video Clip, SMART Presentation, Big Bucks investigation Reflection: The students had a lot of questions about their Goldfish homework, so I thought it best to spend time clarifying how to use a ratio table. After that, I had just enough time to discuss the idea of unit rate/price with the students and examples of each. For the students that understand simplifying fractions, the concept is pretty easy. To challenge them I will give them larger numbers to deal with and have them do the long division by hand. For the other students, they will need to practice simplifying fractions.
Day 4: Friday, September 28, 2012
Yesterday we did not finish the Big Bucks investigation, so we worked on it in class today. The lesson plan continues from yesterday. We had plans of going to the computer lab to begin the first page of their project today, but the class was misbehaving. Reflection: I think it was better to work on the investigation today because it gave the students class time to ask questions. I noticed that a lot of students were picking up the concept to find unit rate but were struggling more with the simple division that had to be done. For these students, I will start making an emphasis on how to do long division in my lessons.
Day 5: Monday, October 1, 2012 Review/Discuss project/Begin project
Objectives: 1. Students will correctly represent their ratio using pictures with 100% accuracy. 2. ¾ of students will correctly make a ratio table and find the next 4 equivalent ratios. 3. 100% of the students will write their ratio correctly 3 different ways. Introduction:
After going over morning work, I will show the rubric to the students on the board. I will explain the requirements for the first page of the assignment before passing out colored pencils and paper.
Content: CC.RP.3 Use ratio and rate reasoning to solve real‐world and mathematical problems, e.g. by reasoning about tables of equivalent ratios, tape diagrams, double number line diagrams, or equations.
16
Methods/Procedures: 1. Daily work 2. Review daily work 3. Go over homework 4. Introduce project 5. Explain rubric 6. Show sample 7. Pass out colored pencils and paper to complete first page of project 8. Turn in first page Closure:
Ask students how they used what we learned about ratios to complete the first page of their assignment. Ask for any questions. Tell students that we will be working on the project again next week.
Resources/Materials: Rubric, Example, Colored pencils Homework: Any unfinished classwork Reflection: The project went well. I used today’s lesson as formative assessment because it included everything on it that we have covered so far. The students enjoyed the hands‐on learning as well. Because none of the students were struggling, we will continue to a new topic tomorrow.
Day 6: Wednesday, October 3, 2012 Converting Measurements
Objectives: 1. Students will correctly convert units of measurement with 75% accuracy. 2. ¾ of the students will explain the role of ratios in converting measurements correctly. Introduction:
Review with students what we learned last week. Ask about how we could use ratios to help us convert measurements.
Content: CC.RP.3 Use ratio and rate reasoning to solve real‐world and mathematical problems, e.g. by reasoning about tables of equivalent ratios, tape diagrams, double number line diagrams, or equations. d. Use ratio reasoning to convert measurement units; manipulate and transform units appropriately when multiplying or dividing quantities.
Methods/Procedures: 1. Daily work 2. Review daily work
17
3. Review previous week 4. Discuss how using ratios could help in converting measurements 5. Open SMART Notebook 6. Example: How to calculate the number of centimeters in 9 inches. 7. Begin problem 1.4 (allow to work for 20 mins.) Closure:
Discuss with the students how they used ratios in their work. Ask how we could use ratios in both converting from a large to small measurement and the opposite. Check their work.
Resources/Materials: Book, SMART Notebook Homework: Unfinished Classwork or Exercises 39‐45 Reflection: I only had 30 minutes today to discuss converting measurements using ratios, and I could tell that the classes were not grasping the concept. They were able to convert without using a ratio, so I gave them homework just to try. I told them we will talk more about it tomorrow. I see where the students get confused on how you use a ratio as a fraction. It requires skills on how to multiply and divide fractions which is a weak skill for them. In my future lessons, I will revisit multiplication and division of fractions while talking about ratios to relate to their previous knowledge.
Day 7: Thursday, October 4, 2012 Today was a continued lesson from yesterday. We did the investigation at the end together in class to help clarify for the students how to use a ratio to convert measurements. Reflection: I felt better after the lesson today on converting measurements. For the students that are excelling in this topic, I will give them conversions requiring less common conversion factors. For those still struggling, I will give problems involving more known conversion factors (such as inches in a foot, centimeters in an inch) that way they can check their answer.
Day 8: Friday, October 5, 2012 Ratio Project
Objectives: 1. Students will correctly convert sale ad fractions into unit rates. 90% of students should
do this correctly. 2. ¾ of the students will describe the best buy after finding the unit rates using
mathematical language. Introduction:
Show the students the rubric for this part of the project. Explain the directions and show an example.
18
Content:
CC.RP.3 Use ratio and rate reasoning to solve real‐world and mathematical problems, e.g. by reasoning about tables of equivalent ratios, tape diagrams, double number line diagrams, or equations. a. Make tables of equivalent ratios relating quantities with whole‐number measurements, find missing values in the tables, and plot the pairs of values on the coordinate plane. Use tables to compare ratios. b. Solve unit rate problems including those involving unit pricing and constant speed. For example, if it took 7 hours to mow 4 laws, then at that rate, how many lawns could be mowed in 35 hours? At what rate were lawns being mowed? c. Find a percent of a quantity as a rate per 100 (e.g., 30% of a quantity means 30/100 times the quantity); solve problems involving finding the whole, given a part and the percent. d. Use ratio reasoning to convert measurement units; manipulate and transform units appropriately when multiplying or dividing quantities.
Methods/Procedures: 1. Daily work 2. Review daily work 3. Review previous lessons 4. Introduce project 5. Pass out scissors, glue, ads 6. Walk around and answer questions. Allow students to work until last 10 minutes Closure:
Revisit the instructions for the project and get feedback about where they are at. Ask for questions.
Resources/Materials: Online example, Glue, Scissors, Ads, Rubric Reflection: The students cut out and pasted examples of sale ads using rates and converted them to unit rates. I think they enjoyed the lesson and learned the real‐world application for unit rates. The only problem the students seemed to run into was finding rates on the sale ads.
Day 9: Monday, October 8, 2012 The students finished working on their ratio projects in class. Reflection: I had planned on them being finished already and moving on to percents today, but they were nowhere near finished. For the students that needed more time, I allowed them to work. For the students that were finished, they helped the others at their pod that were not complete. If I could do anything differently, I would have a review assignment for the students that finished their projects before the others. This would have benefited me because I could
19
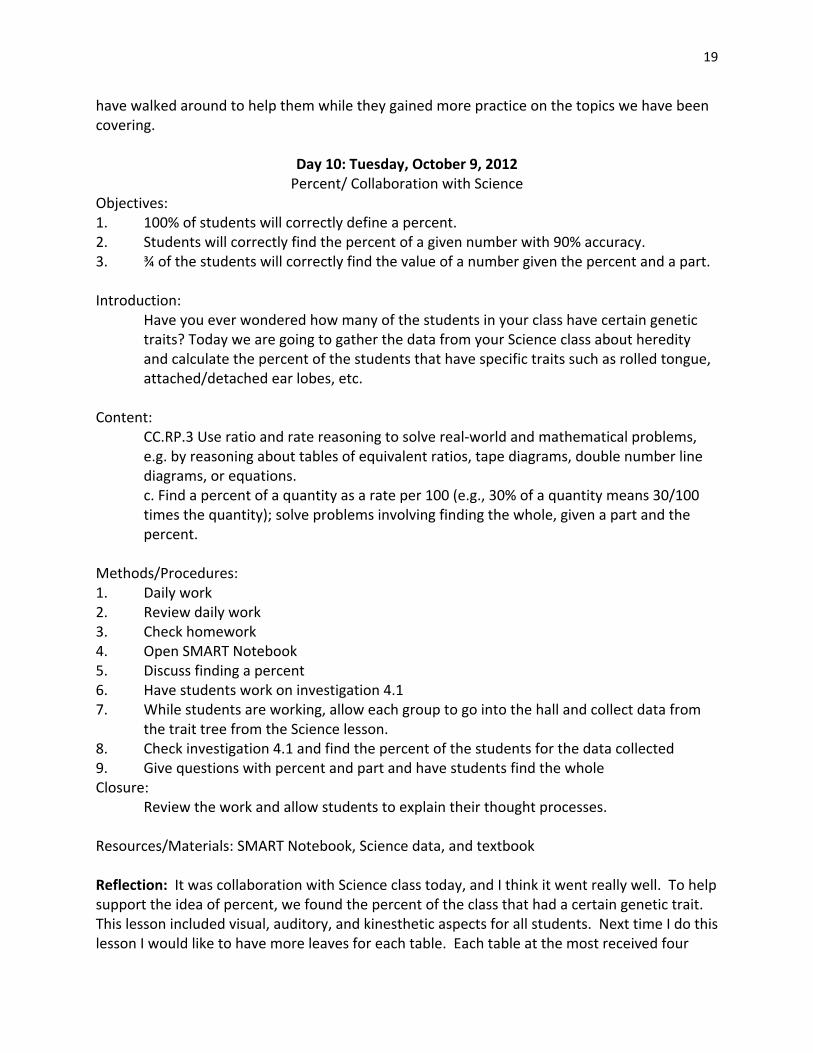
have walked around to help them while they gained more practice on the topics we have been covering.
Day 10: Tuesday, October 9, 2012 Percent/ Collaboration with Science
Objectives: 1. 100% of students will correctly define a percent. 2. Students will correctly find the percent of a given number with 90% accuracy. 3. ¾ of the students will correctly find the value of a number given the percent and a part. Introduction:
Have you ever wondered how many of the students in your class have certain genetic traits? Today we are going to gather the data from your Science class about heredity and calculate the percent of the students that have specific traits such as rolled tongue, attached/detached ear lobes, etc.
Content: CC.RP.3 Use ratio and rate reasoning to solve real‐world and mathematical problems, e.g. by reasoning about tables of equivalent ratios, tape diagrams, double number line diagrams, or equations. c. Find a percent of a quantity as a rate per 100 (e.g., 30% of a quantity means 30/100 times the quantity); solve problems involving finding the whole, given a part and the percent.
Methods/Procedures: 1. Daily work 2. Review daily work 3. Check homework 4. Open SMART Notebook 5. Discuss finding a percent 6. Have students work on investigation 4.1 7. While students are working, allow each group to go into the hall and collect data from
the trait tree from the Science lesson. 8. Check investigation 4.1 and find the percent of the students for the data collected 9. Give questions with percent and part and have students find the whole Closure: Review the work and allow students to explain their thought processes. Resources/Materials: SMART Notebook, Science data, and textbook Reflection: It was collaboration with Science class today, and I think it went really well. To help support the idea of percent, we found the percent of the class that had a certain genetic trait. This lesson included visual, auditory, and kinesthetic aspects for all students. Next time I do this lesson I would like to have more leaves for each table. Each table at the most received four
20
leaves, and that is sufficient data for each table to work with. The lesson could have been more meaningful if given more numbers to work with. We will review everything tomorrow for our unit test.
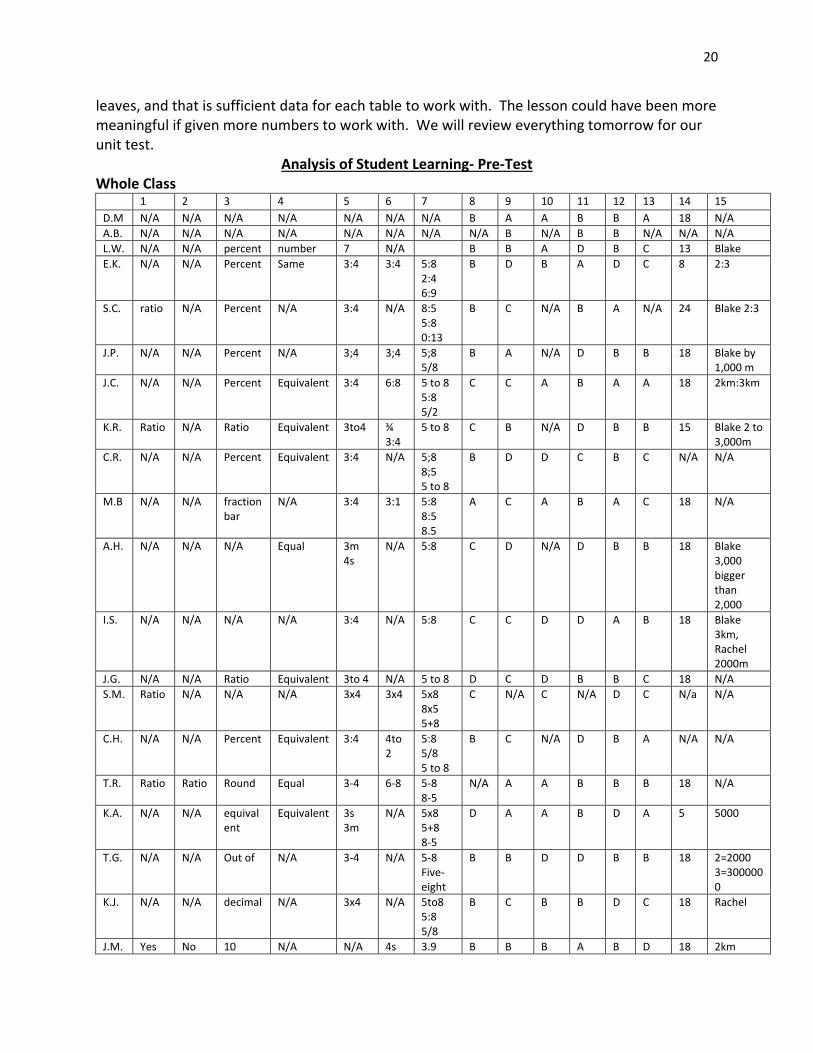
Analysis of Student Learning‐ Pre‐Test Whole Class 1 2 3 4 5 6 7 8 9 10 11 12 13 14 15
D.M N/A N/A N/A N/A N/A N/A N/A B A A B B A 18 N/A
A.B. N/A N/A N/A N/A N/A N/A N/A N/A B N/A B B N/A N/A N/A
L.W. N/A N/A percent number 7 N/A B B A D B C 13 Blake
E.K. N/A N/A Percent Same 3:4 3:4 5:8 2:4 6:9
B D B A D C 8 2:3
S.C. ratio N/A Percent N/A 3:4 N/A 8:5 5:8 0:13
B C N/A B A N/A 24 Blake 2:3
J.P. N/A N/A Percent N/A 3;4 3;4 5;8 5/8
B A N/A D B B 18 Blake by 1,000 m
J.C. N/A N/A Percent Equivalent 3:4 6:8 5 to 8 5:8 5/2
C C A B A A 18 2km:3km
K.R. Ratio N/A Ratio Equivalent 3to4 ¾ 3:4
5 to 8 C B N/A D B B 15 Blake 2 to 3,000m
C.R. N/A N/A Percent Equivalent 3:4 N/A 5;8 8;5 5 to 8
B D D C B C N/A N/A
M.B N/A N/A fraction bar
N/A 3:4 3:1 5:8 8:5 8.5
A C A B A C 18 N/A
A.H. N/A N/A N/A Equal 3m 4s
N/A 5:8 C D N/A D B B 18 Blake 3,000 bigger than 2,000
I.S. N/A N/A N/A N/A 3:4 N/A 5:8 C C D D A B 18 Blake 3km, Rachel 2000m
J.G. N/A N/A Ratio Equivalent 3to 4 N/A 5 to 8 D C D B B C 18 N/A
S.M. Ratio N/A N/A N/A 3x4 3x4 5x8 8x5 5+8
C N/A C N/A D C N/a N/A
C.H. N/A N/A Percent Equivalent 3:4 4to2
5:8 5/8 5 to 8
B C N/A D B A N/A N/A
T.R. Ratio Ratio Round Equal 3‐4 6‐8 5‐8 8‐5
N/A A A B B B 18 N/A
K.A. N/A N/A equivalent
Equivalent 3s 3m
N/A 5x8 5+8 8‐5
D A A B D A 5 5000
T.G. N/A N/A Out of N/A 3‐4 N/A 5‐8 Five‐eight
B B D D B B 18 2=2000 3=3000000
K.J. N/A N/A decimal N/A 3x4 N/A 5to8 5:8 5/8
B C B B D C 18 Rachel
J.M. Yes No 10 N/A N/A 4s 3.9 B B B A B D 18 2km
21
3m 2.9 2000m
C.D. N/A N/A multiply
N/A 7 out of 7
N/A 5z 8a D A D B D A 18 Km are more
A.E. N/A N/A Percent N/A ¾ N/A 5/8 C A N/A B B N/A N/A N/A
J.F. N/A N/A N/A N/A 6 total
3/3 5/8 5:8 5 to 8
B C C B A C N/A N/A
J.W. Composite
Prime
Percent N/A 3:4 4:3 5:8 7 to 8 7‐2
B C A B D B 18 Blake by 1,000m
B.C. Ratio Ratio Percent Multiple ¾ N/A 5/8 8% 5%
B A D A A C 18 N/A
C.M. Number
N/A Out of N/A 4/3 3/7
N/A N/A D D N/A N/A C N/A N/A N/A
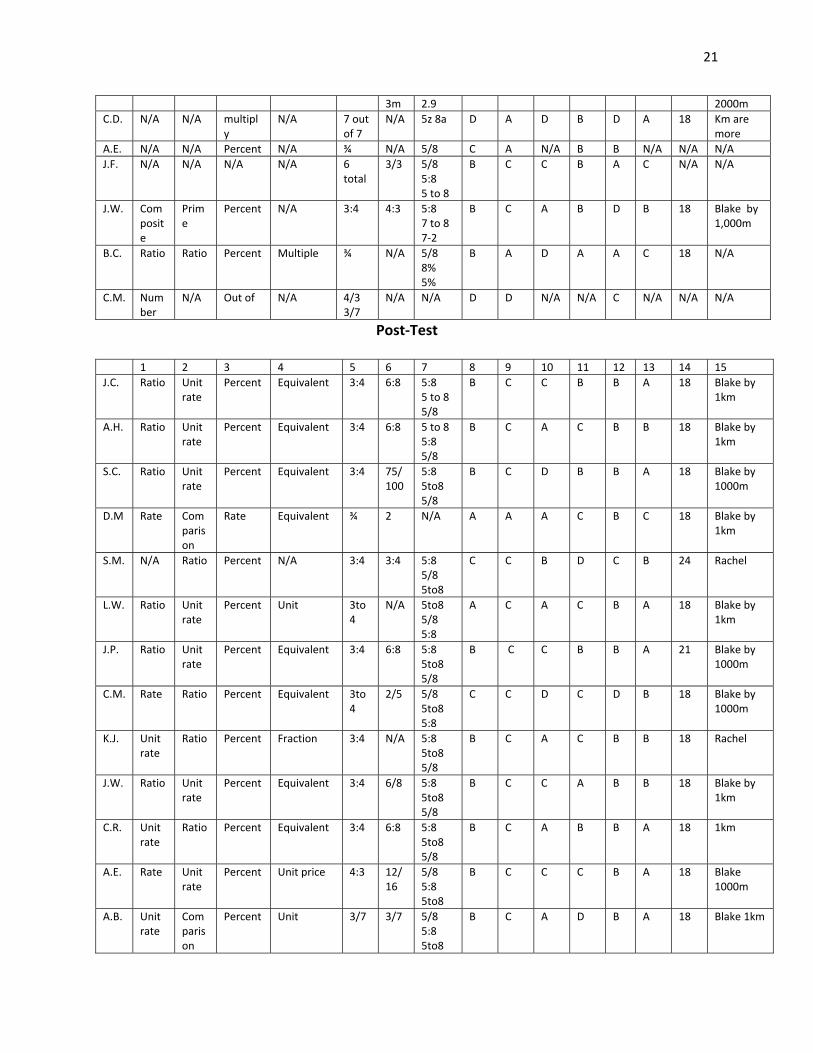
Post‐Test 1 2 3 4 5 6 7 8 9 10 11 12 13 14 15
J.C. Ratio Unit rate
Percent Equivalent 3:4 6:8 5:8 5 to 8 5/8
B C C B B A 18 Blake by 1km
A.H. Ratio Unit rate
Percent Equivalent 3:4 6:8 5 to 8 5:8 5/8
B C A C B B 18 Blake by 1km
S.C. Ratio Unit rate
Percent Equivalent 3:4 75/100
5:8 5to8 5/8
B C D B B A 18 Blake by 1000m
D.M Rate Comparison
Rate Equivalent ¾ 2 N/A A A A C B C 18 Blake by 1km
S.M. N/A Ratio Percent N/A 3:4 3:4 5:8 5/8 5to8
C C B D C B 24 Rachel
L.W. Ratio Unit rate
Percent Unit 3to4
N/A 5to8 5/8 5:8
A C A C B A 18 Blake by 1km
J.P. Ratio Unit rate
Percent Equivalent 3:4 6:8 5:8 5to8 5/8
B C C B B A 21 Blake by 1000m
C.M. Rate Ratio Percent Equivalent 3to4
2/5 5/8 5to8 5:8
C C D C D B 18 Blake by 1000m
K.J. Unit rate
Ratio Percent Fraction 3:4 N/A 5:8 5to8 5/8
B C A C B B 18 Rachel
J.W. Ratio Unit rate
Percent Equivalent 3:4 6/8 5:8 5to8 5/8
B C C A B B 18 Blake by 1km
C.R. Unit rate
Ratio Percent Equivalent 3:4 6:8 5:8 5to8 5/8
B C A B B A 18 1km
A.E. Rate Unit rate
Percent Unit price 4:3 12/16
5/8 5:8 5to8
B C C C B A 18 Blake 1000m
A.B. Unit rate
Comparison
Percent Unit 3/7 3/7 5/8 5:8 5to8
B C A D B A 18 Blake 1km
22
B.C. Ratio Unit rate
Percent N/A ¾ 3to4
5:8 5/8 5to8
C C A B B B 18 1000m Blake
E.K. Rate Ratio Percent Equivalent 3:3 1/1 5/8 5:8 60/100
C C C B B B 18 Blake by 1km
M.B.
Rate Unit rate
Percent Converting 3:4 6/8 5:8 5/8 5to8
B C B A B A 18 Blake 3000m Rachel 2km
C.D. Unit Unit rate
Percent Whole 3to4
5+8 +58
N/A C A D C D B 21 1000m
T.G. Ratio Unit rate
Percent Congruent 3to4
6:8 5to8 5:8 5/8
B C A B B B 18 1km
J.F. Ratio Ratio Percent Equivalent 3to4
¾ 5to8 5:8 5/8
B C D C B C 18 N/A
K.R. Unit rate
Fraction
Fraction bar
Comparison
3:4 6to14
5/8 5:8 5to8
B C B B B B 18 Blake 3000 greater than 2000
I.S. Ratio Ratio Ratio Quantities 3:4 1:2 5:8 5/8 5to8
A C A C B A 18 3km is more than 2 km so Blake
J.M. Ratio 2 Comparison
Rate ¾ 2 2z 5a B C A D D B 18 N/A
J.G. Ratio Equivalent
Percent Unit ¾ 3:4 5/8 5:8 5to8
D C B B D A 18 1000m 2km
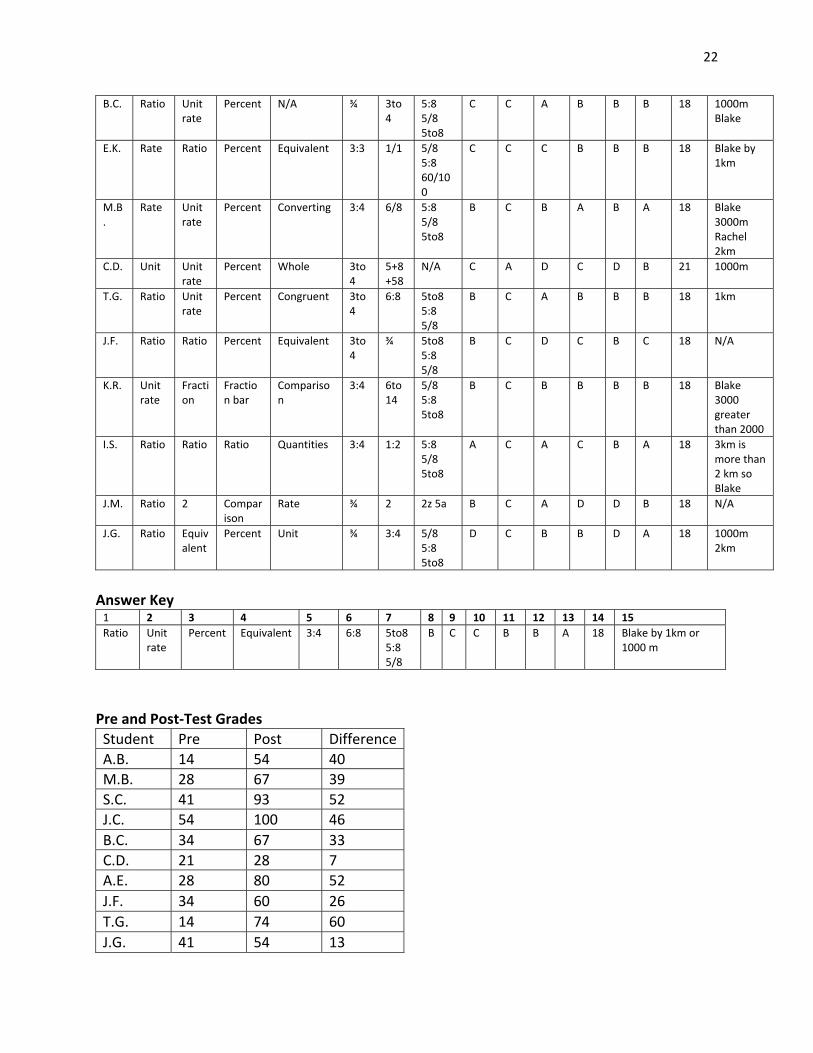
Answer Key 1 2 3 4 5 6 7 8 9 10 11 12 13 14 15
Ratio Unit rate
Percent Equivalent 3:4 6:8 5to8 5:8 5/8
B C C B B A 18 Blake by 1km or 1000 m
Pre and Post‐Test Grades
Student Pre Post Difference
A.B. 14 54 40
M.B. 28 67 39
S.C. 41 93 52
J.C. 54 100 46
B.C. 34 67 33
C.D. 21 28 7
A.E. 28 80 52
J.F. 34 60 26
T.G. 14 74 60
J.G. 41 54 13
23
A.H. 21 80 59
K.J. 34 41 7
E.K. 21 47 26
D.M. 34 28 ‐6
C.M. 0 47 47
S.M. 14 28 14
J.M. 21 34 13
J.P. 34 93 59
K.R. 21 47 26
C.R. 34 74 40
I.S. 21 54 33
L.W. 21 67 46
J.W. 47 87 40
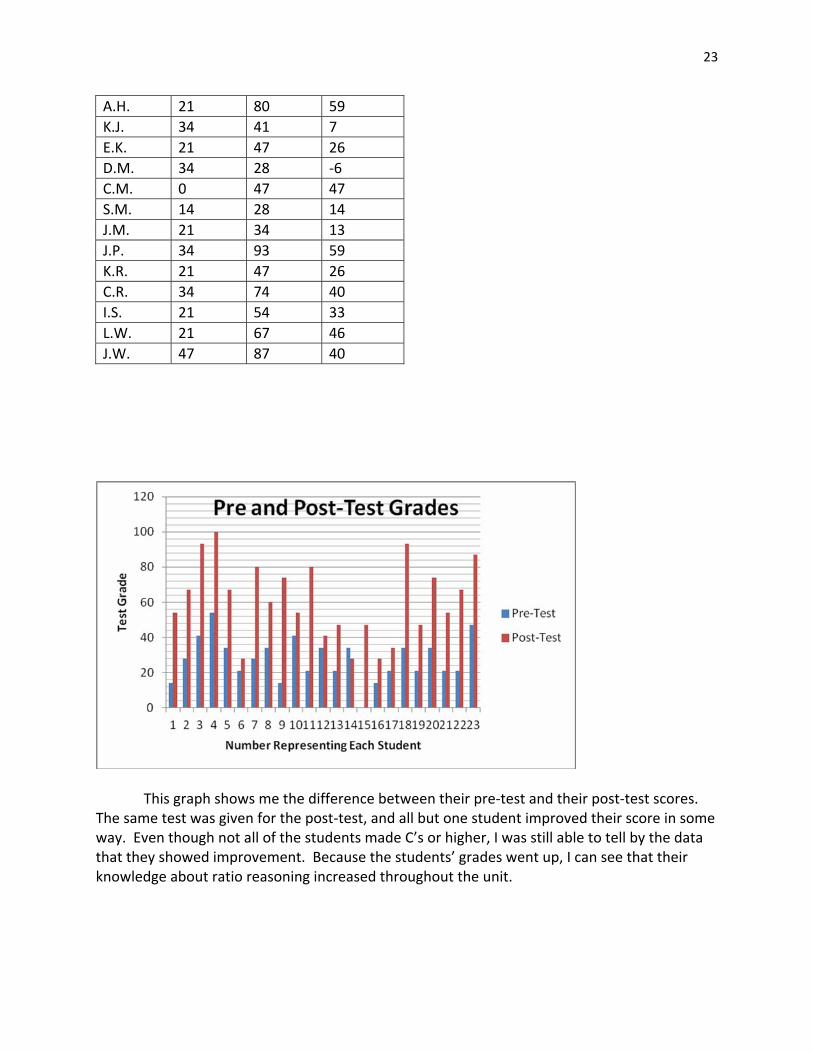
This graph shows me the difference between their pre‐test and their post‐test scores. The same test was given for the post‐test, and all but one student improved their score in some way. Even though not all of the students made C’s or higher, I was still able to tell by the data that they showed improvement. Because the students’ grades went up, I can see that their knowledge about ratio reasoning increased throughout the unit.
24
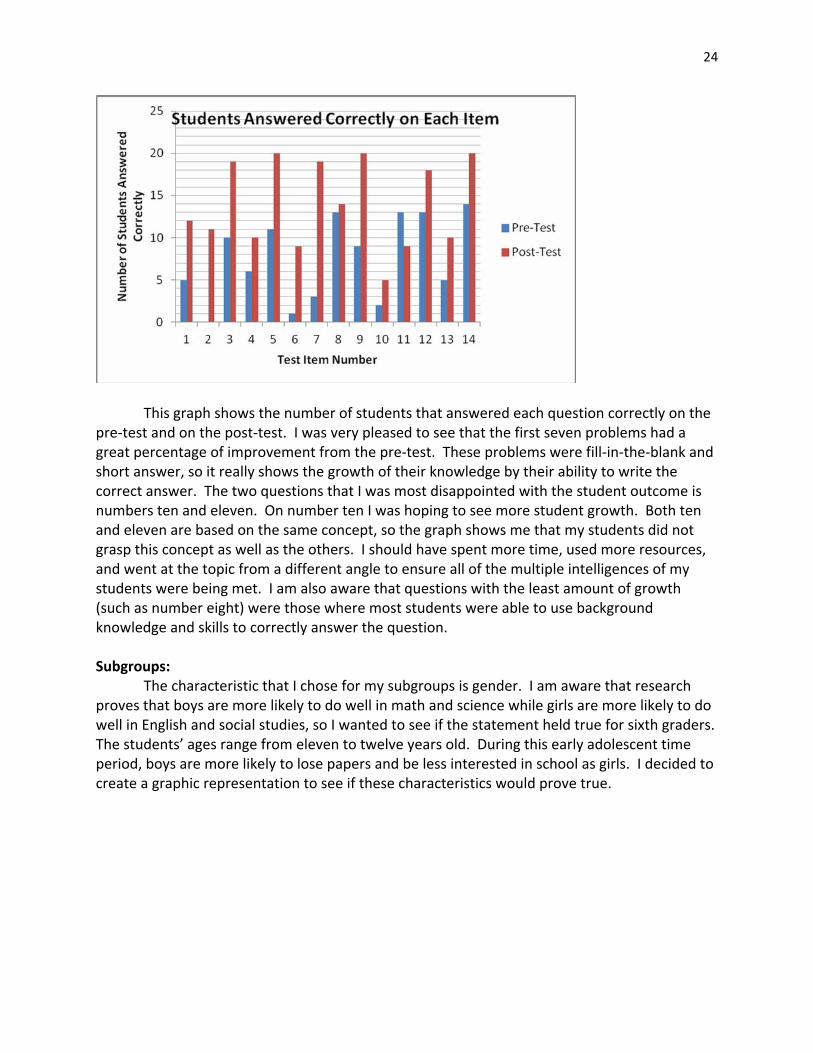
This graph shows the number of students that answered each question correctly on the pre‐test and on the post‐test. I was very pleased to see that the first seven problems had a great percentage of improvement from the pre‐test. These problems were fill‐in‐the‐blank and short answer, so it really shows the growth of their knowledge by their ability to write the correct answer. The two questions that I was most disappointed with the student outcome is numbers ten and eleven. On number ten I was hoping to see more student growth. Both ten and eleven are based on the same concept, so the graph shows me that my students did not grasp this concept as well as the others. I should have spent more time, used more resources, and went at the topic from a different angle to ensure all of the multiple intelligences of my students were being met. I am also aware that questions with the least amount of growth (such as number eight) were those where most students were able to use background knowledge and skills to correctly answer the question. Subgroups:
The characteristic that I chose for my subgroups is gender. I am aware that research proves that boys are more likely to do well in math and science while girls are more likely to do well in English and social studies, so I wanted to see if the statement held true for sixth graders. The students’ ages range from eleven to twelve years old. During this early adolescent time period, boys are more likely to lose papers and be less interested in school as girls. I decided to create a graphic representation to see if these characteristics would prove true.
25
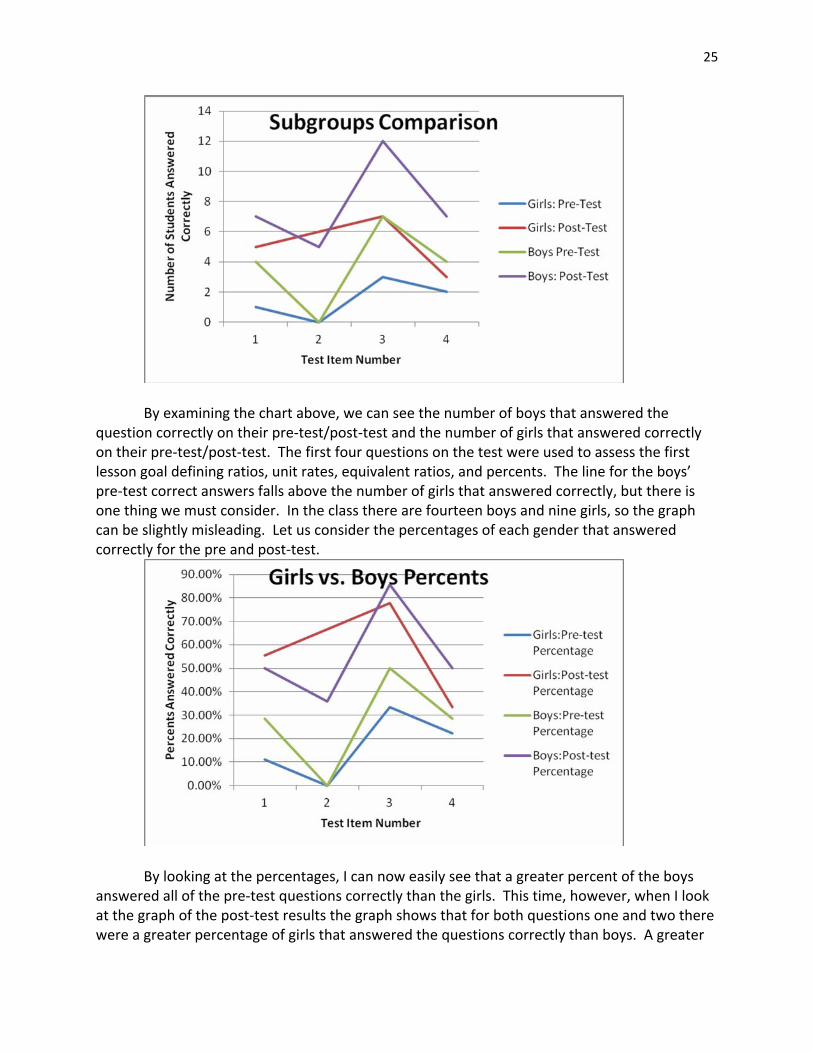
By examining the chart above, we can see the number of boys that answered the
question correctly on their pre‐test/post‐test and the number of girls that answered correctly on their pre‐test/post‐test. The first four questions on the test were used to assess the first lesson goal defining ratios, unit rates, equivalent ratios, and percents. The line for the boys’ pre‐test correct answers falls above the number of girls that answered correctly, but there is one thing we must consider. In the class there are fourteen boys and nine girls, so the graph can be slightly misleading. Let us consider the percentages of each gender that answered correctly for the pre and post‐test.
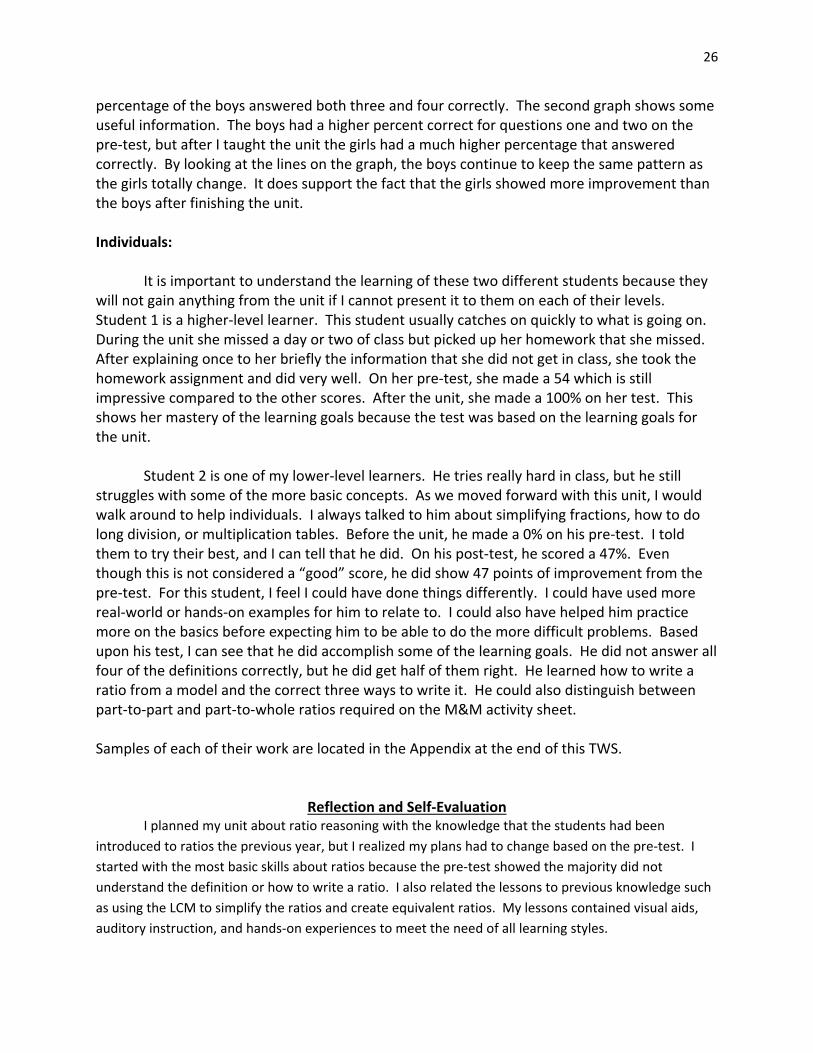
By looking at the percentages, I can now easily see that a greater percent of the boys answered all of the pre‐test questions correctly than the girls. This time, however, when I look at the graph of the post‐test results the graph shows that for both questions one and two there were a greater percentage of girls that answered the questions correctly than boys. A greater
26
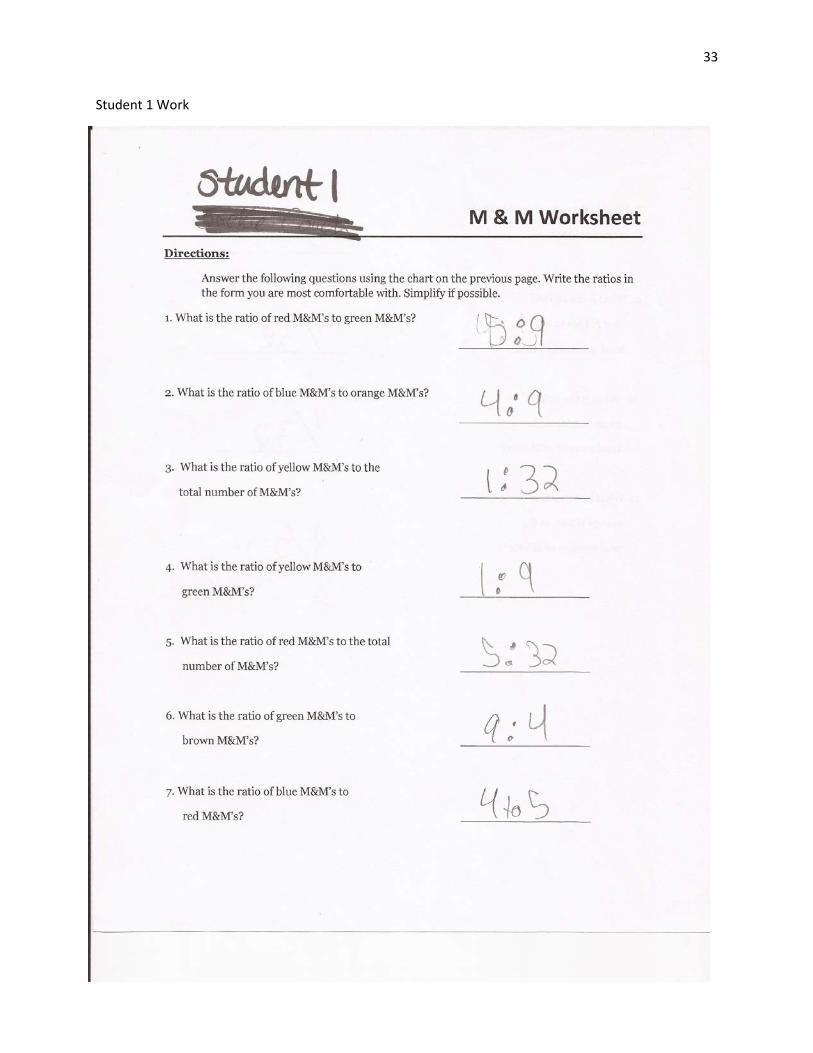
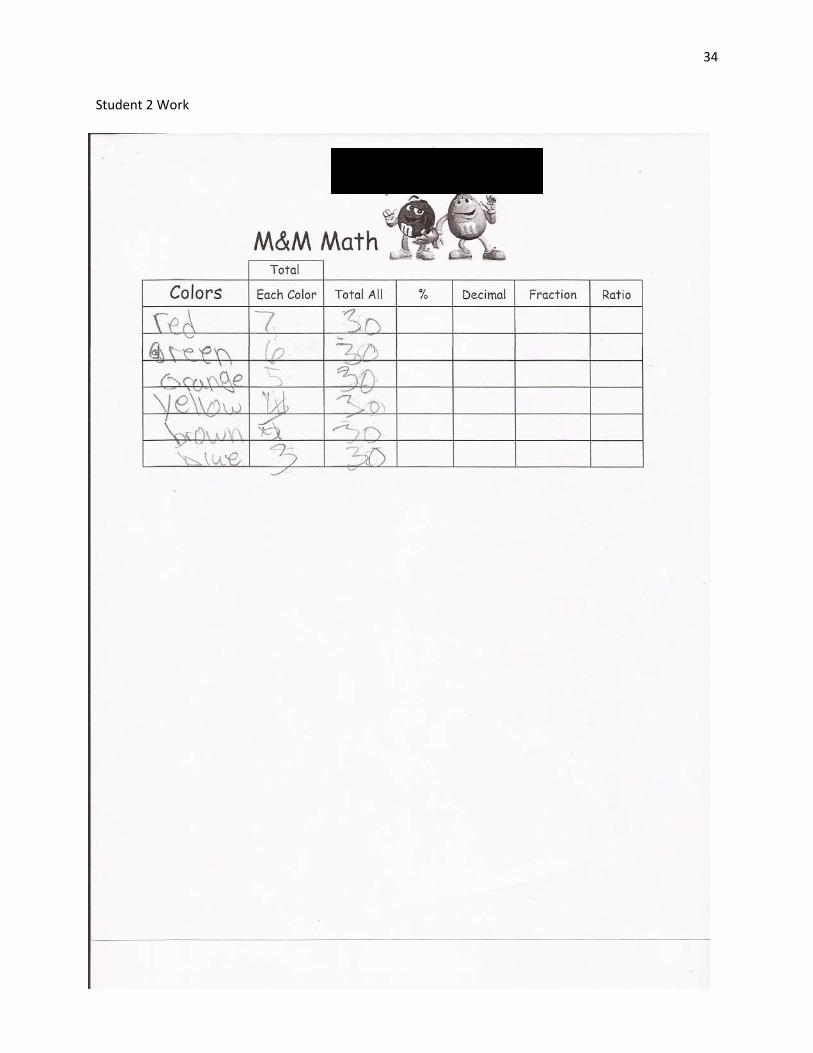
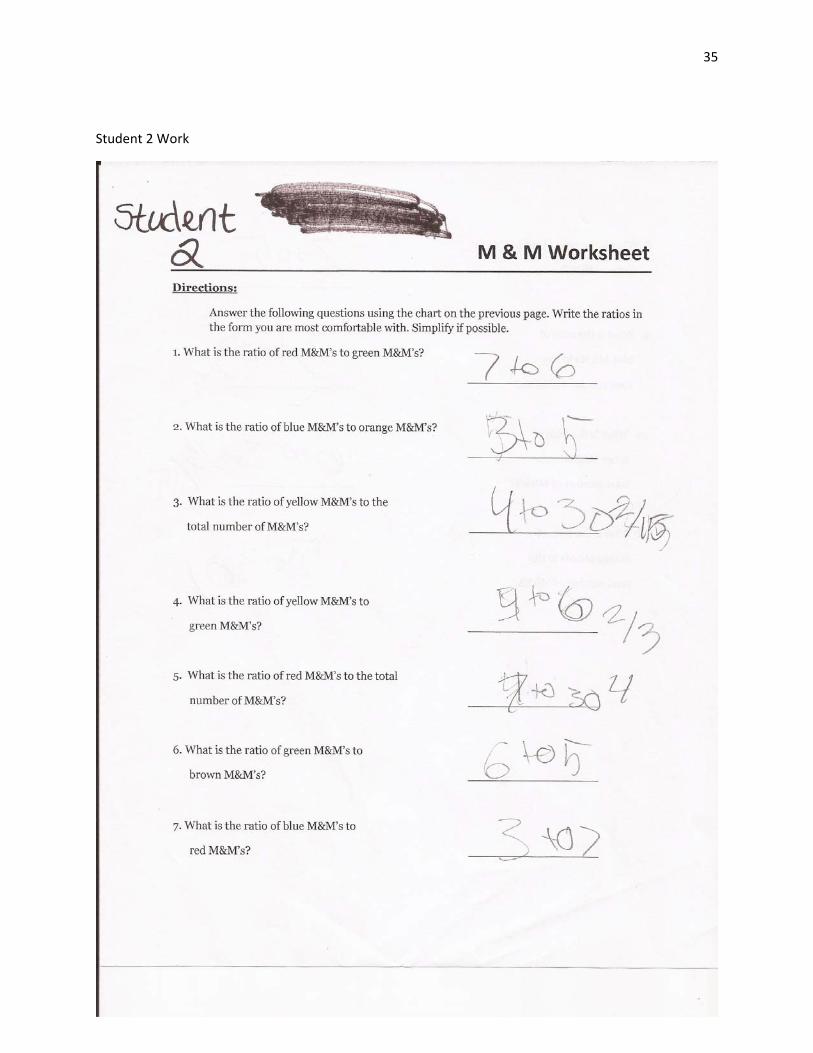
percentage of the boys answered both three and four correctly. The second graph shows some useful information. The boys had a higher percent correct for questions one and two on the pre‐test, but after I taught the unit the girls had a much higher percentage that answered correctly. By looking at the lines on the graph, the boys continue to keep the same pattern as the girls totally change. It does support the fact that the girls showed more improvement than the boys after finishing the unit. Individuals: It is important to understand the learning of these two different students because they will not gain anything from the unit if I cannot present it to them on each of their levels. Student 1 is a higher‐level learner. This student usually catches on quickly to what is going on. During the unit she missed a day or two of class but picked up her homework that she missed. After explaining once to her briefly the information that she did not get in class, she took the homework assignment and did very well. On her pre‐test, she made a 54 which is still impressive compared to the other scores. After the unit, she made a 100% on her test. This shows her mastery of the learning goals because the test was based on the learning goals for the unit. Student 2 is one of my lower‐level learners. He tries really hard in class, but he still struggles with some of the more basic concepts. As we moved forward with this unit, I would walk around to help individuals. I always talked to him about simplifying fractions, how to do long division, or multiplication tables. Before the unit, he made a 0% on his pre‐test. I told them to try their best, and I can tell that he did. On his post‐test, he scored a 47%. Even though this is not considered a “good” score, he did show 47 points of improvement from the pre‐test. For this student, I feel I could have done things differently. I could have used more real‐world or hands‐on examples for him to relate to. I could also have helped him practice more on the basics before expecting him to be able to do the more difficult problems. Based upon his test, I can see that he did accomplish some of the learning goals. He did not answer all four of the definitions correctly, but he did get half of them right. He learned how to write a ratio from a model and the correct three ways to write it. He could also distinguish between part‐to‐part and part‐to‐whole ratios required on the M&M activity sheet. Samples of each of their work are located in the Appendix at the end of this TWS.
Reflection and Self‐Evaluation
I planned my unit about ratio reasoning with the knowledge that the students had been
introduced to ratios the previous year, but I realized my plans had to change based on the pre‐test. I
started with the most basic skills about ratios because the pre‐test showed the majority did not
understand the definition or how to write a ratio. I also related the lessons to previous knowledge such
as using the LCM to simplify the ratios and create equivalent ratios. My lessons contained visual aids,
auditory instruction, and hands‐on experiences to meet the need of all learning styles.
27
The students did extremely well at filling in the blanks of the definitions. I think they were
successful with this learning goal because they wrote notes about them, gave examples of each, and did
a kinesthetic routine with words. The majority were successful because we talked about this one
learning goal in many different ways. This would meet the learning needs of each student and provide
differentiation of the topic. Those students that did not meet the learning goal may have had difficulty
with filling in the blank on the assessment. I had a few Hispanic students, so they may have known the
answer but had difficulty filling in the blank due to spelling and reading the sentence. The other
students may have still been struggling with the most basic part about ratios and could not get passed
the first definition.
The learning goal where the majority of the students were least successful would be correctly
finding a percent using a ratio. I think the problem arose when they had to cross multiply and use long
division to answer the question. A lot of the students still struggle with their multiplication and long
division, so this may have been a barrier. It may also have been difficult for the students to know how
to set up the problems. It all depended on whether it was a part‐to‐part or part‐to‐whole, and they may
have had difficulty deciding which one. Those students that were successful at this goal were those that
knew their multiplication, long division, and could distinguish between part‐to‐part and part‐to‐whole
ratios. Next time I would like to spend more time on this topic, use more resources, and make sure the
students have learned all of the background information before discussing this topic. Using a hands‐on
example or real‐world example would benefit greatly here.
One professional learning goal is to approach one objective or topic in multiple ways to ensure I
will meet the multiple intelligences in the classroom. The second professional learning goal is to include
more real‐world applications in my teaching. I find it important for students to see the long‐term use of
their knowledge as well as the short‐term. The first step to improve my performance is to attend
professional development workshops about Common Core because it is all project‐based real‐world
application. The next step is to read more professional magazines and journals to gain ideas from other
professionals in the teaching field.
28
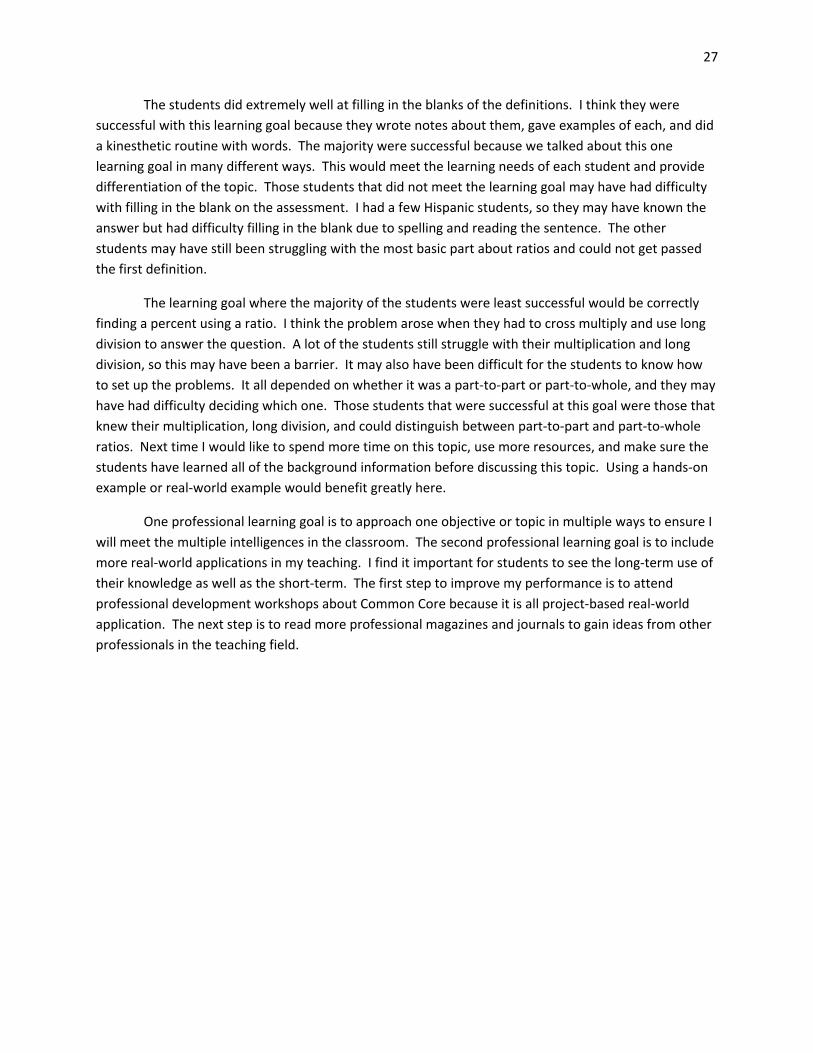
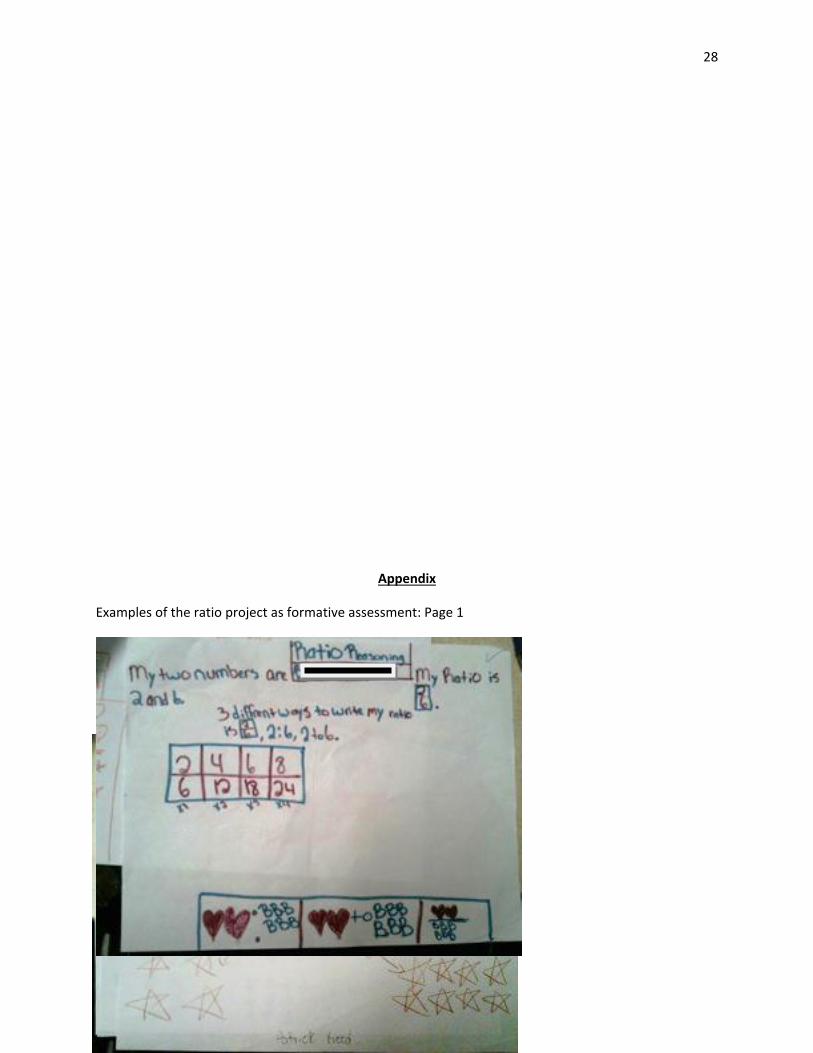
Appendix
Examples of the ratio project as formative assessment: Page 1
29
30
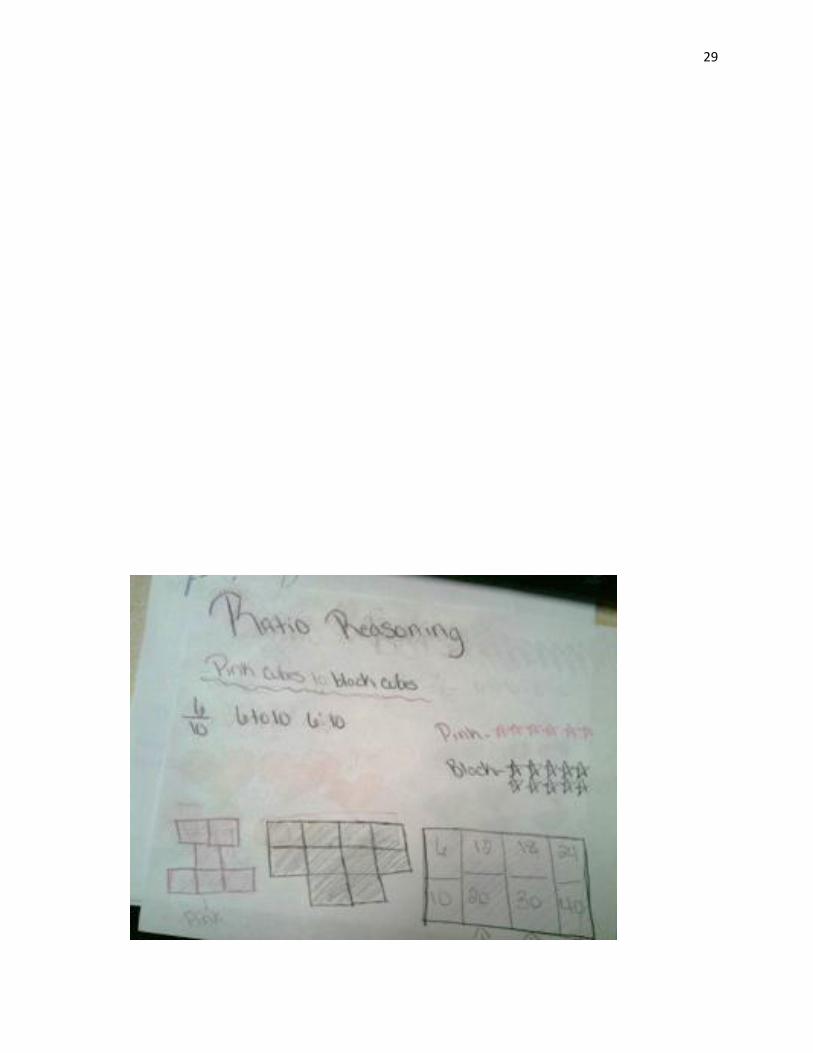
Page 2 Examples: Finding Unit Rate with Sale Ads (Front)
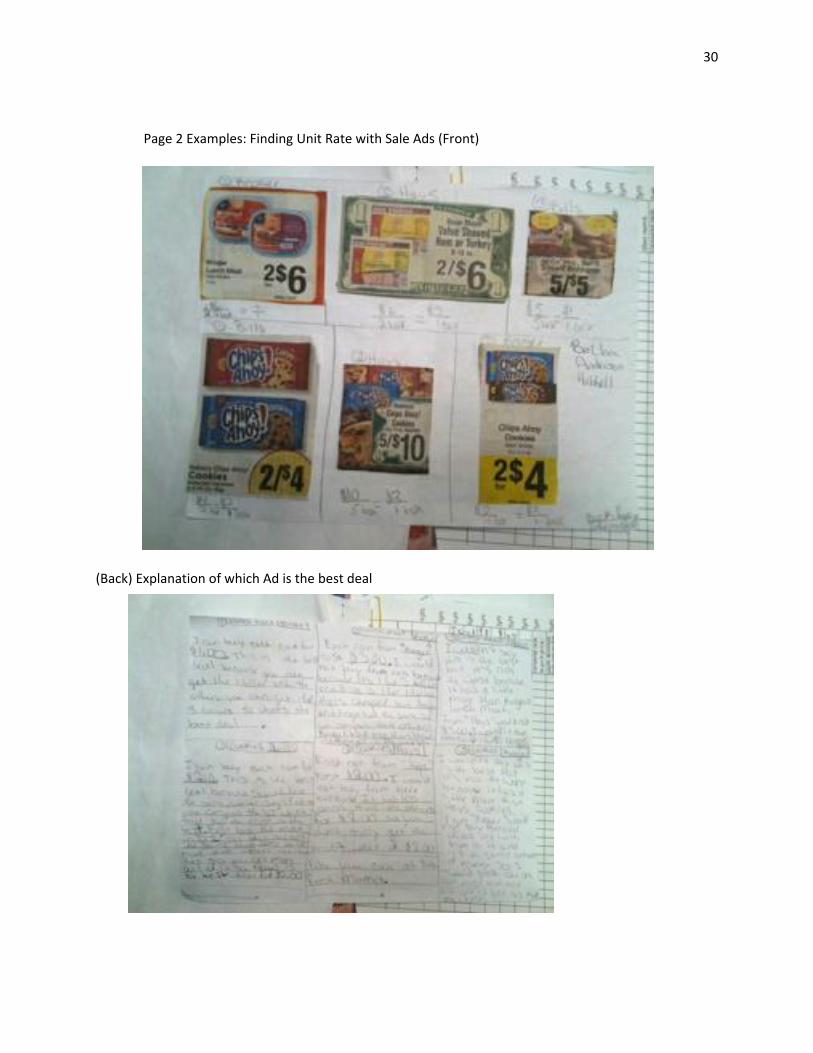
(Back) Explanation of which Ad is the best deal

31
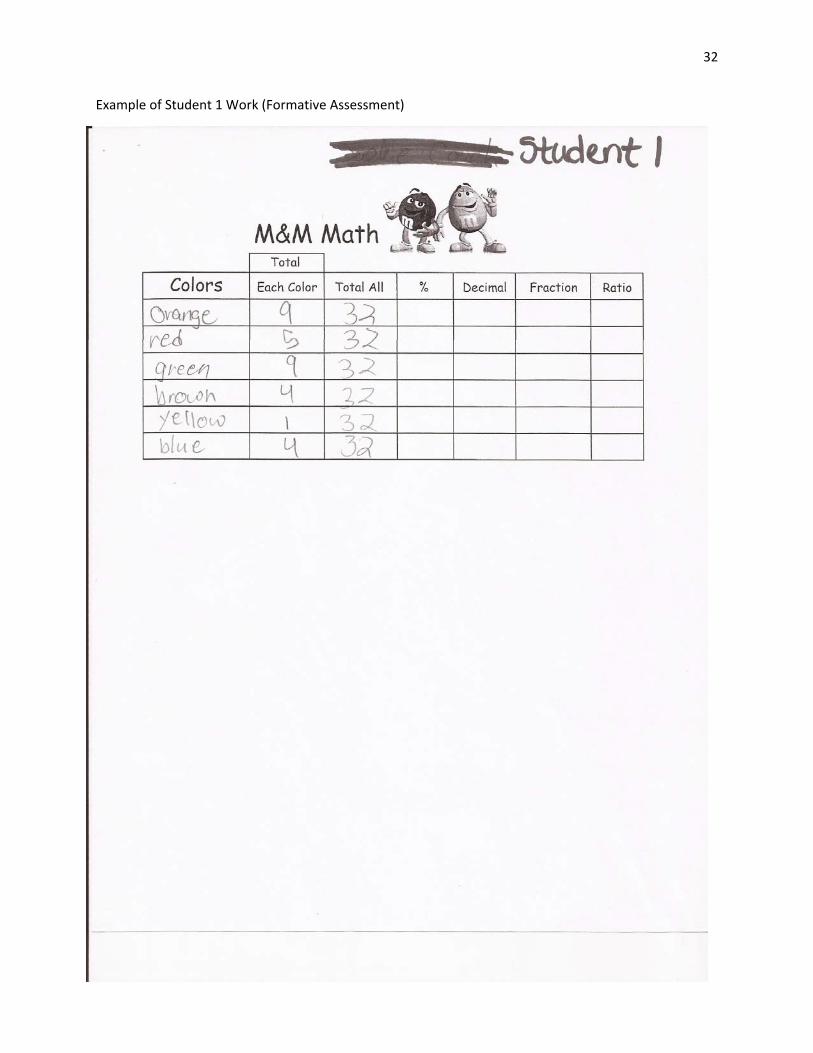
32
Example of Student 1 Work (Formative Assessment)
33
Student 1 Work
34
Student 2 Work
35
Student 2 Work
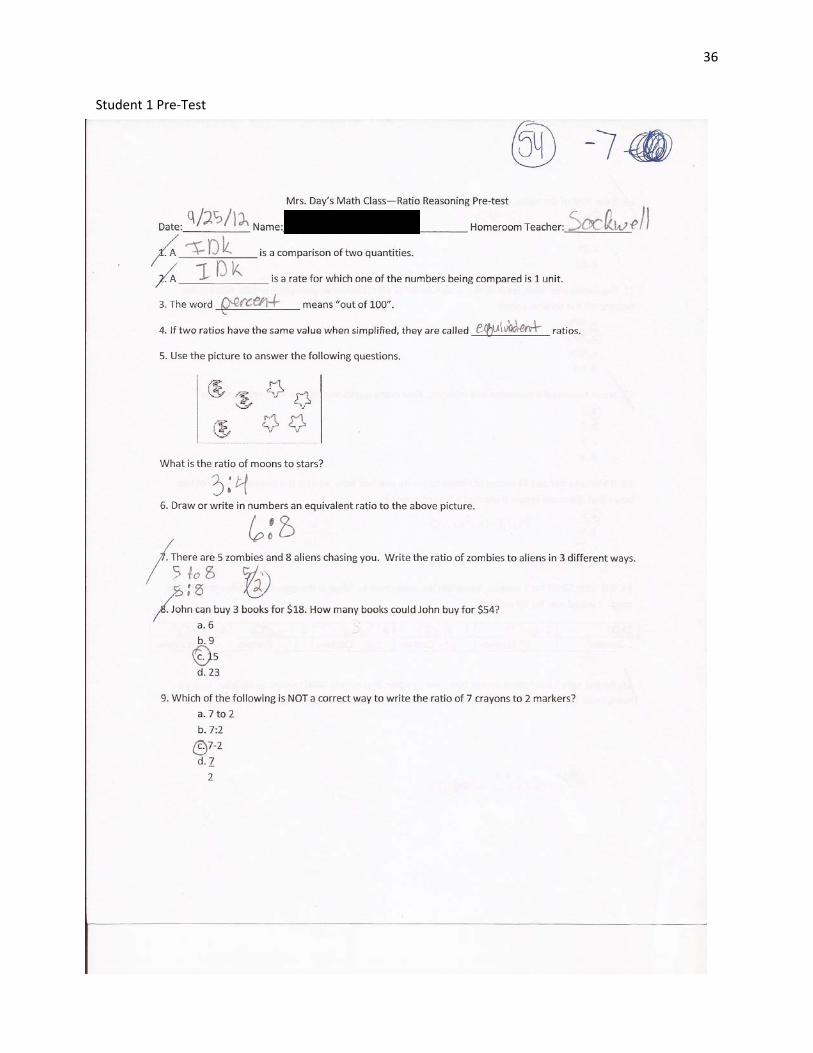
36
Student 1 Pre‐Test
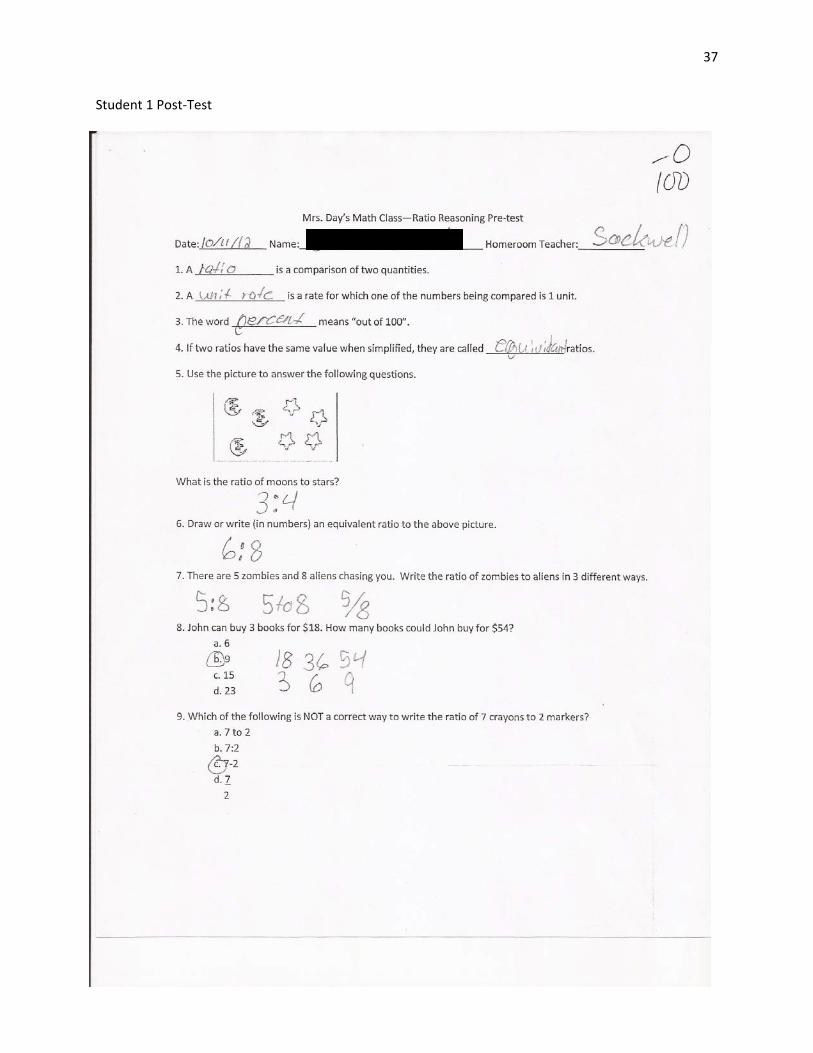
37
Student 1 Post‐Test
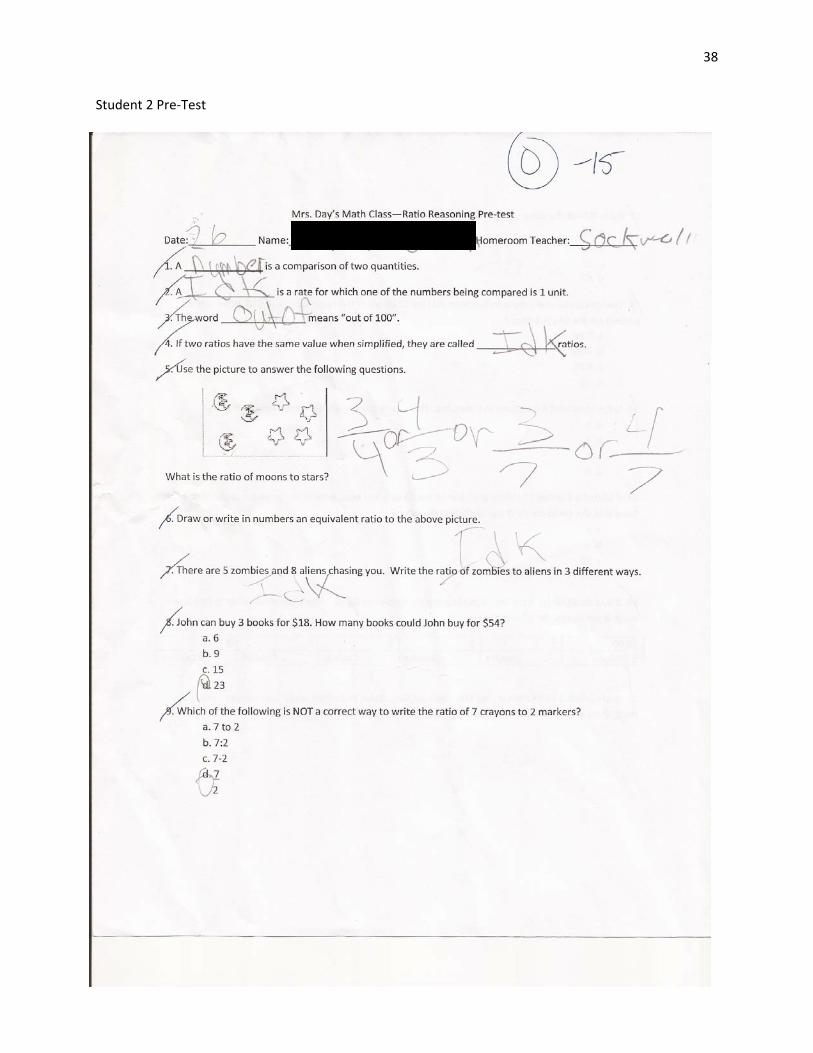
38
Student 2 Pre‐Test
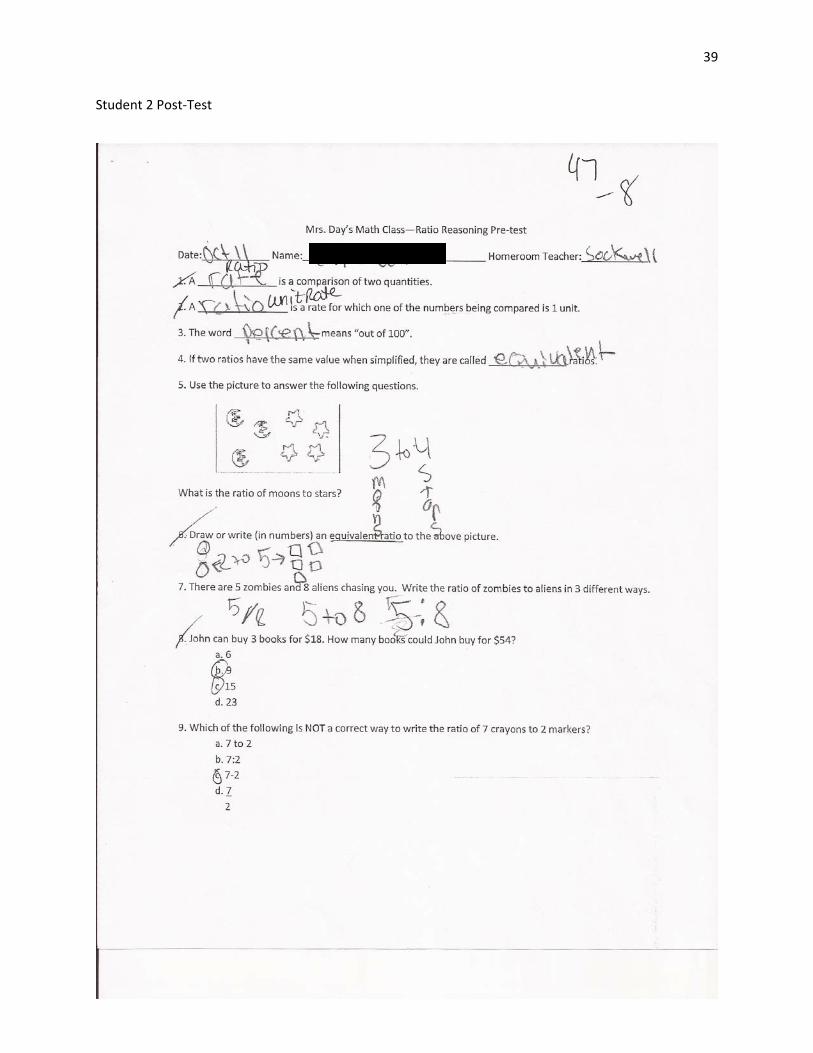
39
Student 2 Post‐Test