Embed Size (px)
Citation preview
FINAL REPORT
STELLER’S EIDER SURVEY NEAR BARROW, ALASKA, 2008
TIM OBRITSCHKEWITSCH
ROBERT J. RITCHIE
PREPARED FOR
U.S. BUREAU OF LAND MANAGEMENTFAIRBANKS, ALASKA
AND
CONOCOPHILLIPS ALASKA, INC.ANCHORAGE, ALASKA
PREPARED BY
ABR, INC.–ENVIRONMENTAL RESEARCH & SERVICESFAIRBANKS, ALASKA

Printed on recycled paper.
STELLER’S EIDER SURVEY NEAR BARROW, ALASKA, 2008
FINAL REPORT
Prepared for
U.S. Bureau of Land Management1150 University Ave.Fairbanks, AK 99709
and
ConocoPhillips Alaska, Inc.P.O. Box 100360
700 G Street, ATO #1902Anchorage, AK 99510-0360
Prepared by
Tim ObritschkewitschRobert J. Ritchie
ABR, Inc.—Environmental Research and ServicesP.O. Box 80410
Fairbanks, AK 99708
March 2009

iii Steller’s Eider Surveys Near Barrow, Alaska, 2008
TABLE OF CONTENTS
LIST OF FIGURES ......................................................................................................................................iiiLIST OF TABLES........................................................................................................................................iiiLIST OF APPENDICES...............................................................................................................................iiiACKNOWLEDGMENTS ............................................................................................................................ ivINTRODUCTION ......................................................................................................................................... 1STUDY AREA .............................................................................................................................................. 1METHODS.................................................................................................................................................... 2RESULTS AND DISCUSSION.................................................................................................................... 3
STELLER’S EIDERS................................................................................................................................. 3HABITAT CONDITIONS AND BREEDING PHENOLOGY............................................................... 3ABUNDANCE AND DISTRIBUTION .................................................................................................. 3SURVEY EFFICACY.............................................................................................................................. 5
OTHER EIDERS ........................................................................................................................................ 7SPECTACLED EIDER............................................................................................................................ 7KING EIDER ........................................................................................................................................... 8
OTHER SPECIES....................................................................................................................................... 9SNOWY OWL ......................................................................................................................................... 9TUNDRA SWAN................................................................................................................................... 10
SUMMARY AND CONCLUSIONS.......................................................................................................... 11LITERATURE CITED................................................................................................................................ 12
LIST OF FIGURES
Figure 1. Survey area for Steller’s Eiders near Barrow, Alaska, June 1999–2008.................................. 1
Figure 2. Locations of Steller’s Eiders in the Barrow area, northern Alaska, 16–21 June 2008 ............. 5
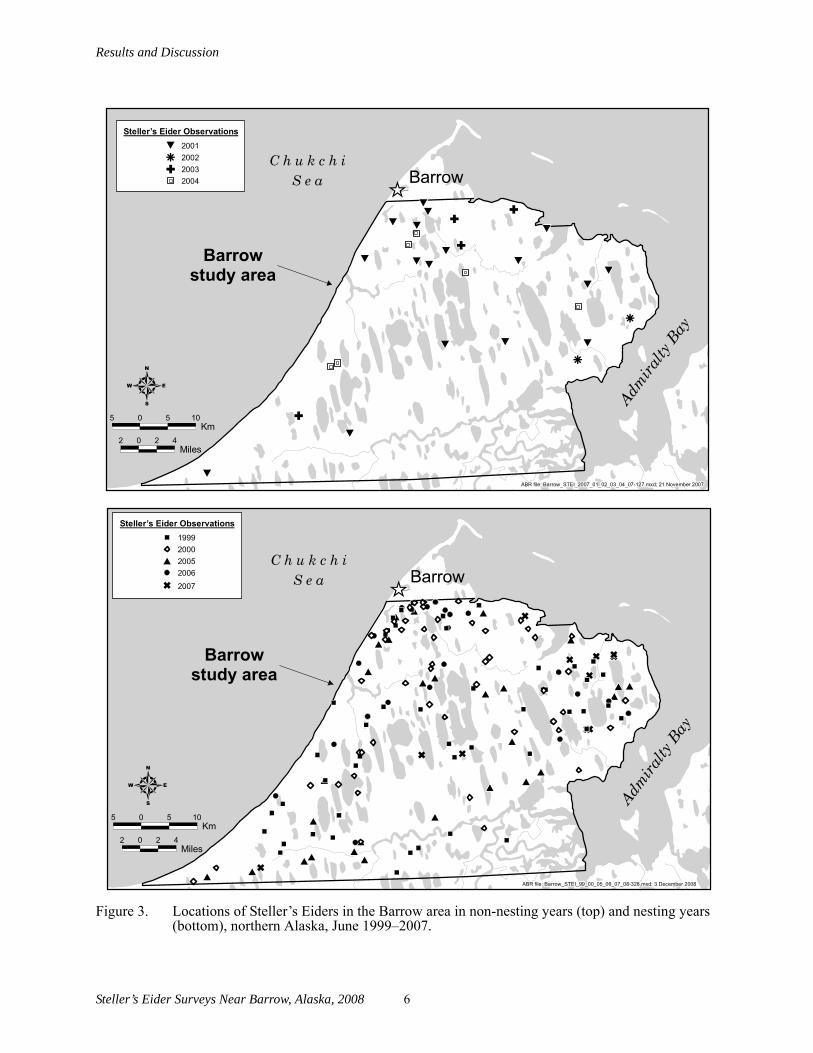
Figure 3. Locations of Steller’s Eiders in the Barrow area in non-nesting years and nesting years, northern Alaska, June 1999–2007.................................................................................. 6
Figure 4. Comparison of the numbers of male Steller’s Eiders recorded during USFWS ground surveys USFWS aerial surveys, and ABR aerial surveys, Barrow area, 1999–2008............... 7
Figure 5. Locations of Spectacled Eiders in the Barrow area, northern Alaska, 16–21 June 2008 ......... 8
Figure 6. Locations of King Eiders in the Barrow area, northern Alaska, 16–21 June 2008 .................. 9
Figure 7. Locations of Snowy Owls in the Barrow area, northern Alaska, 16–21 June 2008 ............... 10
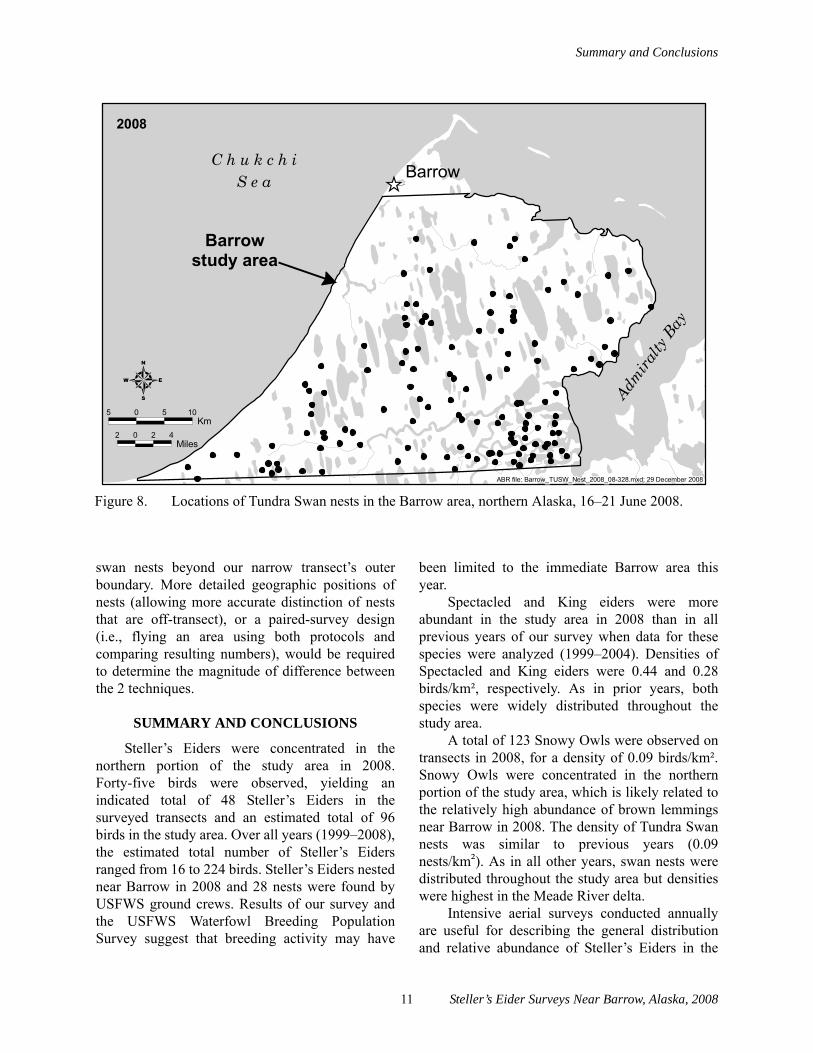
Figure 8. Locations of Tundra Swan nests in the Barrow area, northern Alaska, 16–21 June 2008 ..... 11
LIST OF TABLES
Table 1. Steller’s Eider observations, estimated populations, and densities from aerial surveys near Barrow, Alaska, June 1999–2008........................................................................ 4
LIST OF APPENDICES
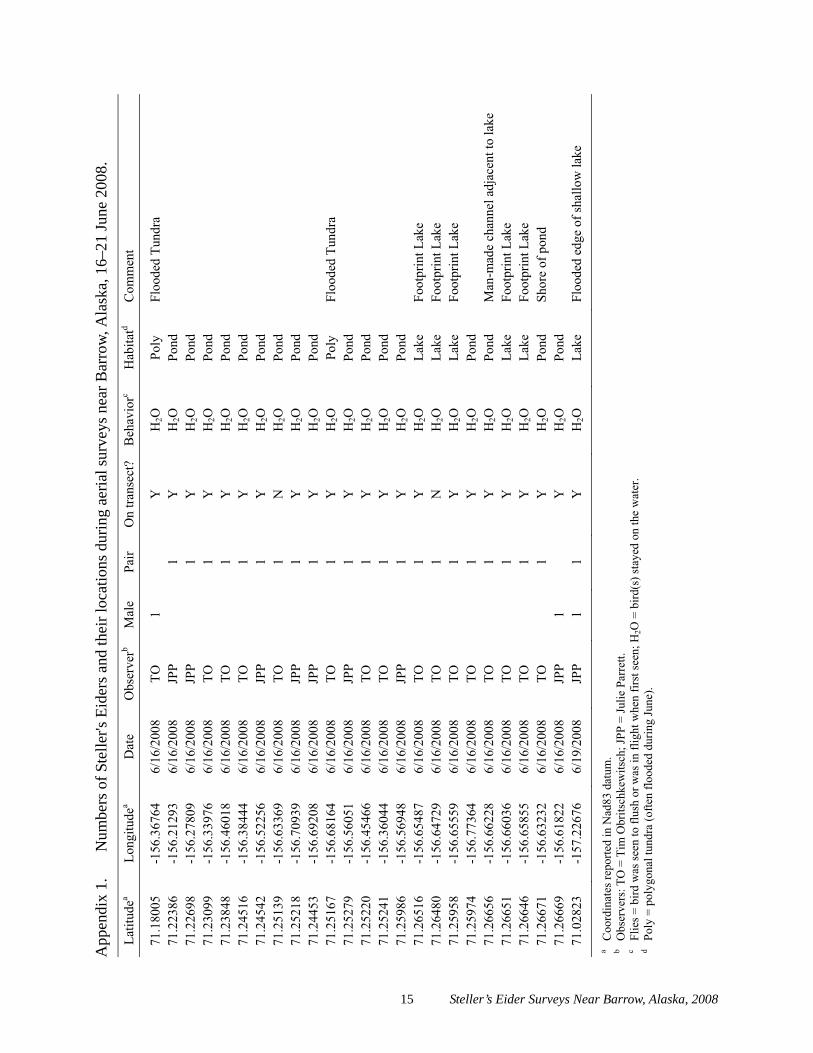
Appendix 1. Numbers of Steller's Eiders and their locations during aerial surveys near Barrow, Alaska, 16–21 June 2008 .................................................................................. 15
Steller’s Eider Surveys Near Barrow, Alaska, 2008 iv
ACKNOWLEDGMENTS
Funding for the 2008 survey came from the U.S. Bureau of Land Management (BLM), NorthernDistrict Office, Fairbanks, and ConocoPhillips Alaska, Inc. (CPAI). Additional support was provided bythe North Slope Borough Department of Wildlife Management in the form of logistics and housing inBarrow. We particularly express our gratitude to Debbie Nigro, BLM; Caryn Rea, CPAI; and RobertSuydam, NSB; who were critical to the success of the project. Julie Parrett, of ABR, assisted with aerialsurveys. Bill Larned and Jewel Bennett, USFWS biologists, provided unpublished data and information onconditions in 2008 for eiders in the vicinity of Barrow. UAF researchers Emily Weiser and Steffen Oppelcontributed observations of lemming abundance on the North Slope. Sandy Hamilton, Arctic Air Alaska,piloted the survey aircraft. At ABR, Bob Burgess provided editorial review, Dorte Dissing preparedfigures, Mark Winterstein compiled and digitized geographic data, and Pamela Odom produced the report.
Introduction
INTRODUCTION
The Alaska breeding population of Steller’sEider (Polysticta stelleri) was classified asthreatened under the Endangered Species Act inJune 1997 (USFWS 2002). Recent records suggestthat the species’ current breeding range in northernAlaska has been greatly reduced and now isrestricted mostly to the vicinity of Barrow(Quakenbush et al. 2002). Results of aerial surveysin the past decade verify this distribution pattern(e.g., Larned et al. 1999, Obritschkewitsch et al.2008, Ritchie and King 2001).
The U.S. Fish and Wildlife Service (USFWS),in partnership with the Department of WildlifeManagement of the North Slope Borough (NSB),has conducted studies on the breeding biology ofSteller’s Eiders near Barrow since 1991(Quakenbush et al. 2000; Obritschkewitsch et al.2001; Obritschkewitsch and Martin 2002a, 2002b;Rojek and Martin 2003; Rojek 2007, 2008). ABRcollaborated with these groups and conductedaerial surveys for Steller’s Eiders during thepre-nesting season in 1999–2007 (see Ritchie and
King 2004). The U.S. Bureau of LandManagement (BLM) provided support for theseaerial surveys in 2004–2008, and ConocoPhillipsAlaska, Inc. (CPAI) provided additional support in2006–2008. In 2008, ABR conducted the tenthyear of aerial surveys for Steller’s Eiders in theBarrow area. Our major objective in 2008 andprevious years was to estimate the number ofSteller’s Eiders in the region using an intensive,low-level aerial survey.
STUDY AREA
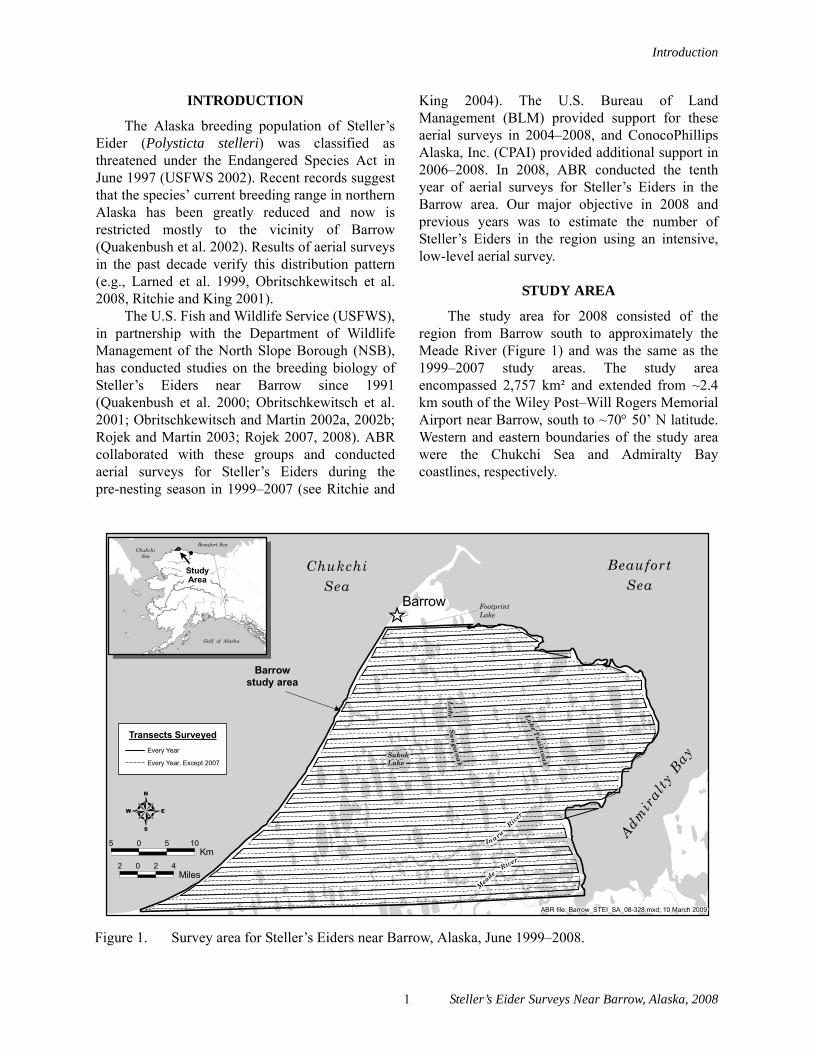
The study area for 2008 consisted of theregion from Barrow south to approximately theMeade River (Figure 1) and was the same as the1999–2007 study areas. The study areaencompassed 2,757 km² and extended from ~2.4km south of the Wiley Post–Will Rogers MemorialAirport near Barrow, south to ~7050’ N latitude.Western and eastern boundaries of the study areawere the Chukchi Sea and Admiralty Baycoastlines, respectively.
Figure 1. Survey area for Steller’s Eiders near Barrow, Alaska, June 1999–2008.
[_
ChukchiSea
Barrowstudy area
Admir
alty
Bay
Barrow
BeaufortSea
Inaru
River
Lake Sun
govoak
SukokLake
Lake Tusikvoak
Meade
River
FootprintLake
ABR file: Barrow_STEI_SA_08-328.mxd; 10 March 2009
5 0 5 10Km
42 0 2 4
Miles
ChukchiSea
Beaufort Sea
StudyArea
Gulf of Alaska
$
Transects SurveyedEvery Year
Every Year, Except 2007
1 Steller’s Eider Surveys Near Barrow, Alaska, 2008
Methods
The study area is characteristic of the ArcticCoastal Plain of Alaska, being poorly drained andcovered by numerous thaw lakes (Gallant et al.1995). Wetlands include drained-lake basins, smallponds and lakes, beaded streams, and wetmeadows in both nonpatterned and polygonizedtundra. Eriophorum tussock and some dwarf scrubcommunities occupy drier soils, which are morecommon in the southern portion of the study area.In addition, greater topographic relief andmicrohabitats, such as sand dunes and riparianwillow habitats, occur along the Meade River nearthe southern boundary of the study area.
METHODS
We conducted an aerial survey for breedingpairs of Steller’s Eiders during 16–21 June 2008.Surveys have been conducted annually during asimilar time period since 1999. Survey flights werenot possible on 17–18 June 2008 due to fog. Thesurvey aircraft was a Cessna 185 with the samepilot (Sandy Hamilton, Arctic Air Alaska) used in1999–2003 and 2005–2007. Observers were TimObritschkewitsch (observer in 2005–2007) andJulie Parrett (experienced aerial eider observer butnew to this survey in 2008).
As in previous years, we followed standardprotocols for breeding-pair waterfowl surveys(USFWS 1987). Transects were oriented in aneast–west direction, were spaced at 0.8-kmintervals, and were 400 m wide (200 m on eachside of the aircraft) to achieve 50% coverage of thestudy area. Survey coverage was consistent with allprior years except 2007, which was flown at 25%coverage.
During the winter of 2004–2005, the EiderRecovery Team discussed measures to reduce thecosts of this survey by reducing sampling coverageand aircraft hours (N. Rojek, USFWS, pers.comm.; see Prichard and Ritchie 2005), alsoreducing carbon emissions. Because Steller’sEiders breed near Barrow in some years but not inothers, and because various conditions identifiableto ground observers early in the season seem toindicate whether breeding will occur, the EiderRecovery Team decided that, starting in 2005, ifUSFWS ground crews in Barrow determined that
Steller’s Eiders probably were not nesting, then ouraerial survey would be reduced to every othertransect (25% sampling coverage). Indicators inearly June suggested that 2008 was a nesting year,so we conducted the survey at normal samplingcoverage (50%).
We flew along each transect centerline at analtitude of ~40 m above ground level (agl) and atan airspeed of 140–160 km/h. GPS waypoints weregenerated from digital base maps of the area toidentify flight-lines and we used an onboard GlobalPositioning System (GPS) for navigation and torecord all Steller’s Eider locations. Before startingthe survey, we flew 2 practice transects north of thestudy area to acquaint our new observer to dataprocedures and to practice identifying Steller’sEiders from the air.
We recorded the numbers, sex, and behavior(e.g., stayed on water, in flight) of all Steller’sEiders observed on transect. Each observer alsorecorded Steller’s Eider sightings on1:63,360-scale USGS maps. We also mapped thelocations of other eiders (King Eider, Somateriaspectabilis; and Spectacled Eider, S. fischeri),Snowy Owls (Bubo scandiacus), and TundraSwans (Cygnus columbianus). “Indicated” totalnumbers of eiders on transect were derived byapplying the USFWS standard equation (USFWS1987):
Indicated total birds = (pairs × 2) + (lone males × 2) + (flocked males [≤ 4 males] × 2) + number in mixed groups.
Indicated total birds were doubled to estimatethe population of Steller’s Eiders in the study areaand to calculate densities. No correction factors orsightability indices were used. We calculateddensities (birds/km²) by dividing the estimatedpopulation by the total area within the study area.The USFWS protocol (1987) excludes flying birdsunless their flight is known to originate orterminate within the transect boundaries. Wefollowed this protocol, but for less conservativeestimates we also calculated density of all eidersrecorded on transect (including all flying birds).All birds observed on-transect in 2008 originatedwithin the transect.
Steller’s Eider Surveys Near Barrow, Alaska, 2008 2

Results and Discussion
RESULTS AND DISCUSSION
STELLER’S EIDERS
HABITAT CONDITIONS AND BREEDING PHENOLOGY
Snow depths at Barrow in May 2008 were thedeepest on record (dating back to 1973 at theNOAA weather station at Wiley Post–Will RogersAirport, Barrow Alaska; National Climate DataCenter [NCDC] Global Surface Summary of theDay). The maximum May snow depth was 24.0inches in 2008, compared to the average maximumMay snow depth of 8.4 inches. Snow levelsdecreased rapidly during the second half of May, toa depth of 3.9 inches on 1 June (30-year average0.84 inches).
Snow cover on the tundra continued todecrease rapidly in early June, from an estimated60–100% cover on 7 June to <5% on 12 June(Attanas and Johnson 2008). Snow-melt wasnearly complete when we arrived on 15 June, withmuch open water on most lakes. Meantemperatures were warmer than average for theentire months of May (+1.4° F) and June (+1.3° F),while precipitation was slightly above average(+0.07 inches in May and +0.10 inches in June,NCDC Global Surface Summary of the Day).
In spring 2008, Steller’s Eiders were firstobserved in Barrow on 5 June, in thawed areas nearroads and in thawed sections of streams andlagoons (J. Bennett, USFWS, pers. comm.). A nestwith 3 eggs was found on 14 June, indicating nestinitiation on about 11–12 June, which was withinthe range of first initiation dates documented for2005, 2006, and 2007 (17, 10, and 12 June,respectively; Rojek 2006, 2007, 2008).
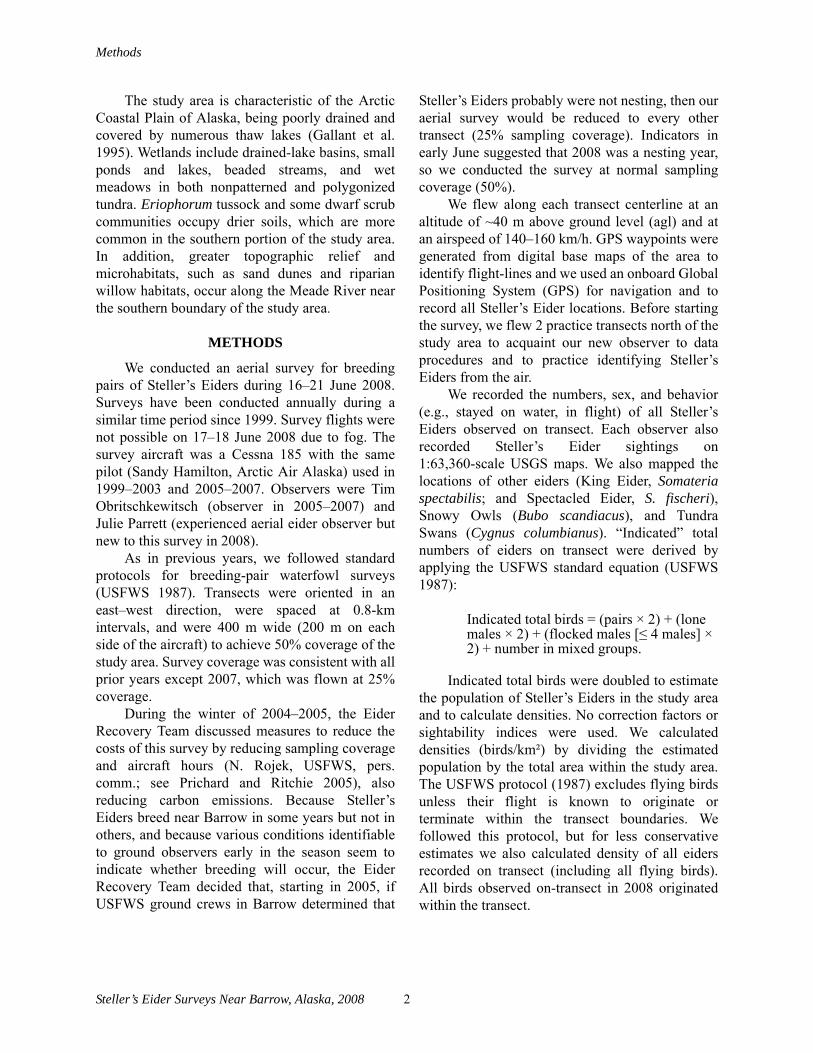
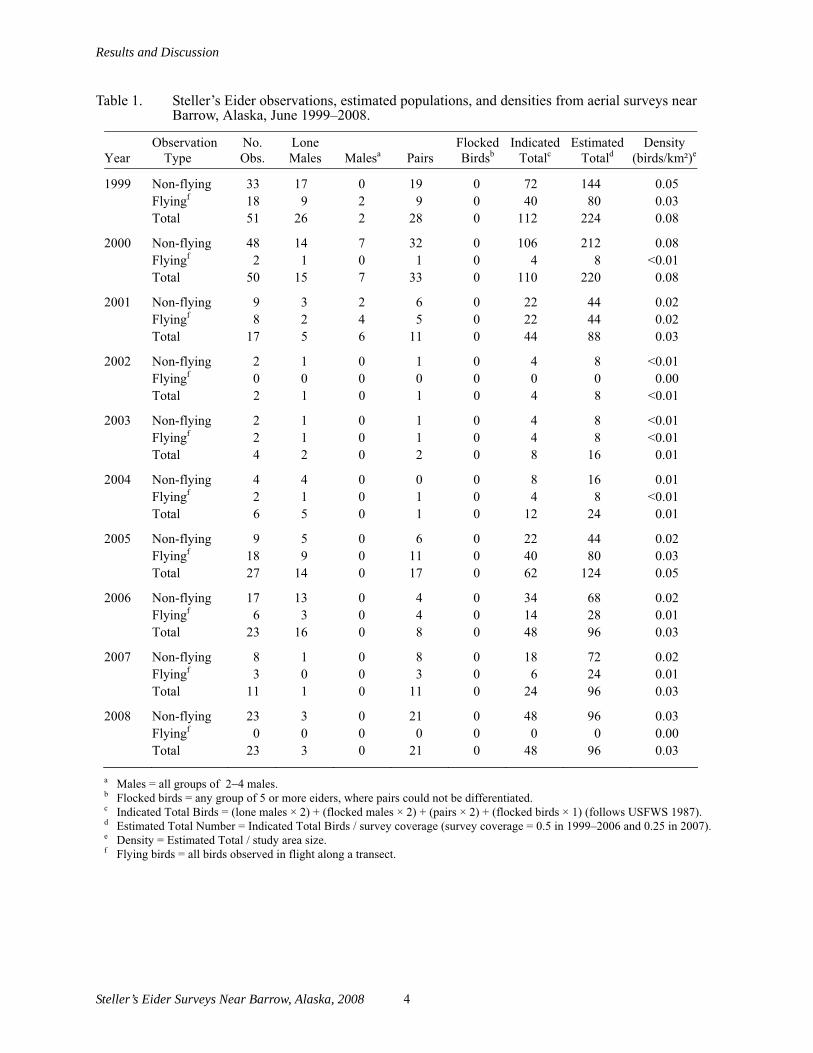
ABUNDANCE AND DISTRIBUTIONWe recorded 45 Steller’s Eiders at 23
locations on transect in 2008 (Table 1, Figure 2,Appendix 1). Observations consisted of 21 pairsand 3 single males for an indicated total of 48Steller’s Eiders in surveyed transects, or anestimated population of 96 Steller’s Eiders in thestudy area. An additional 2 pairs were observedoff-transect. All but 2 observations were locatedalong the 7 most northern transect lines. Twenty(80%) Steller’s Eider observations occurred withinthe region searched annually by USFWS ground
crews near Barrow (Rojek 2008), and 7 (28%)were clustered within 1 km of Footprint Lake(Figure 2), a waterbody near Barrow commonlyused by Steller’s Eiders during the pre-nestingperiod.
In breeding years, Steller’s Eiders typicallyare widely distributed throughout the survey area,but the highest densities occur near Barrow (Figure3, bottom). In non-breeding years, birds usually arepresent in low numbers in the vicinity of Barrowand are very sparse throughout the rest of the studyarea (Figure 3, top). The high density of Steller’sEiders near Barrow in 2008 was consistent withother breeding years; however the near absence ofSteller’s Eiders from the rest of the study area wasunusual, suggesting that breeding may have beenlimited to the Barrow area this year. The USFWSWaterfowl Breeding Population Survey on theArctic Coastal Plain (a new survey initiated in2007 combining the former Eider BreedingPopulation Survey and Aerial Breeding PairSurvey of the Arctic Coastal Plain; Larned et al.2008) also found very low densities of Steller’sEiders away from Barrow. Only 1 Steller’s Eiderwas recorded on that survey, between Lonely andTeshekpuk Lake (outside our survey area; B.Larned, USFWS, pers. comm.). The USFWS aerialsurvey is conducted at low sampling intensity (9.6km transect spacing for 4.2% coverage of thesurvey area in the Barrow stratum; Larned et al.2008) which might explain why the tight cluster ofbirds at Barrow was missed this year.
Steller’s Eiders were twice as abundant in thestudy area during the first 2 years of surveys(1999–2000) than they have been in any year since(Table 1). Estimated total numbers in 1999 and2000 were 224 and 220 eiders, respectively. Since2000, eiders have been much less common, withestimated totals of ≤24 eiders in 2002, 2003, and2004 and moderately higher numbers in 2001 and2005–2008 (88–124 estimated birds; Table 1).
The density of Steller’s Eiders decreased from0.08 birds/km² in 1999 and 2000 to 0.03 birds/km²in 2001 and to <0.01 birds/km² in 2002–2004(Table 1). In 2005, the estimated density increasedto 0.04 birds/km², about half of that observed in1999 and 2000, and since then (2006–2008) theestimated density of Steller’s Eiders has beenstable at 0.03 birds/km². Not surprisingly, lower
3 Steller’s Eider Surveys Near Barrow, Alaska, 2008
Results and Discussion
Steller’s Eider Surveys Near Barrow, Alaska, 2008 4
Table 1. Steller’s Eider observations, estimated populations, and densities from aerial surveys near Barrow, Alaska, June 1999–2008.
Year Observation
Type No. Obs.
Lone Males Malesa Pairs
Flocked Birdsb
Indicated Totalc
Estimated Totald
Density (birds/km²)e
1999 Non-flying 33 17 0 19 0 72 144 0.05 Flyingf 18 9 2 9 0 40 80 0.03 Total 51 26 2 28 0 112 224 0.08
2000 Non-flying 48 14 7 32 0 106 212 0.08 Flyingf 2 1 0 1 0 4 8 <0.01 Total 50 15 7 33 0 110 220 0.08
2001 Non-flying 9 3 2 6 0 22 44 0.02 Flyingf 8 2 4 5 0 22 44 0.02 Total 17 5 6 11 0 44 88 0.03
2002 Non-flying 2 1 0 1 0 4 8 <0.01 Flyingf 0 0 0 0 0 0 0 0.00 Total 2 1 0 1 0 4 8 <0.01
2003 Non-flying 2 1 0 1 0 4 8 <0.01 Flyingf 2 1 0 1 0 4 8 <0.01 Total 4 2 0 2 0 8 16 0.01
2004 Non-flying 4 4 0 0 0 8 16 0.01 Flyingf 2 1 0 1 0 4 8 <0.01 Total 6 5 0 1 0 12 24 0.01
2005 Non-flying 9 5 0 6 0 22 44 0.02 Flyingf 18 9 0 11 0 40 80 0.03 Total 27 14 0 17 0 62 124 0.05
2006 Non-flying 17 13 0 4 0 34 68 0.02 Flyingf 6 3 0 4 0 14 28 0.01 Total 23 16 0 8 0 48 96 0.03
2007 Non-flying 8 1 0 8 0 18 72 0.02 Flyingf 3 0 0 3 0 6 24 0.01 Total 11 1 0 11 0 24 96 0.03
2008 Non-flying 23 3 0 21 0 48 96 0.03 Flyingf 0 0 0 0 0 0 0 0.00 Total 23 3 0 21 0 48 96 0.03
a Males = all groups of 2�4 males. b Flocked birds = any group of 5 or more eiders, where pairs could not be differentiated. c Indicated Total Birds = (lone males × 2) + (flocked males × 2) + (pairs × 2) + (flocked birds × 1) (follows USFWS 1987). d Estimated Total Number = Indicated Total Birds / survey coverage (survey coverage = 0.5 in 1999–2006 and 0.25 in 2007). e Density = Estimated Total / study area size. f Flying birds = all birds observed in flight along a transect.
Results and Discussion
densities of Steller’s Eiders typically are recordedby the USFWS from broad regional aerial surveysof all eider species on the Arctic Coastal Plain(Barrow Survey Stratum: 0–0.02 Steller’sEiders/km²; Larned et al. 2001). Nonetheless, theUSFWS surveys do confirm higher numbers in theBarrow area than in other parts of the ArcticCoastal Plain.
SURVEY EFFICACYFlight conditions were very good on 16 and
21 June: winds were calm to moderate (<15 knots),skies were overcast and visibility along transectswas not restricted. Conditions were fair to good on19–20 June, with calm to moderate winds andovercast skies interspersed with periods of brightsun and glare to the south. High winds and poorvisibility have negatively affected samplingabilities along only small portions of a fewtransects during previous seasons (Ritchie andKing 2001, 2004).
As in previous years, the survey was timed tocoincide with the short period when Steller’s
Eiders are paired and widely dispersed over thenesting area. Phenological data collected duringground-based surveys in the Barrow area since1991 have identified mid-June as the optimalperiod in most years (Quakenbush et al. 1995,Rojek 2008). In 2008 and prior years, we alsocommunicated with USFWS personnel to obtaintheir current-year observations from ground-basedsurveys in the Barrow area and from regional aerialsurveys in northern Alaska, in an attempt tofine-tune survey timing. Although groundobservations near Barrow were used to time thesurvey in 2008, subsequent observations suggestthat some pairs had not yet dispersed to breedingsites at the time of the survey. For example,although ground surveys identified an active neston 11–12 June 2008, 42 Steller’s Eiderssubsequently were observed on Footprint Lakeduring ground surveys on 16 June (J. Bennett,USFWS, pers. comm.), the day of our aerial surveyin that area. Ultimately, only 3 of 28 nests found inthe Barrow area in 2008 were located in theimmediate vicinity of Footprint Lake (J. Bennett,
Figure 2. Locations of Steller’s Eiders in the Barrow area, northern Alaska, 16–21 June 2008.
[_
C h u k c h iS e a
Barrowstudy area
Admira
lty B
ay
Barrow
ABR file: Barrow_STEI_2008_08-328.mxd; 29 December 2008
5 0 5 10Km
4
2008
"
2 0 2 4Miles
5 Steller’s Eider Surveys Near Barrow, Alaska, 2008
Results and Discussion
Steller’s Eider Surveys Near Barrow, Alaska, 2008 6
Figure 3. Locations of Steller’s Eiders in the Barrow area in non-nesting years (top) and nesting years (bottom), northern Alaska, June 1999–2007.
[_
#
## #
## #
##
##
## ##
##
##
##
##
## ##
#
G
G G GG
G
GG
G G
G
C h u k c h iS e a
Barrowstudy area
Admira
lty B
ay
Barrow
ABR file: Barrow_STEI_99_00_05_06_07_08-328.mxd; 3 December 2008
5 0 5 10Km
42 0 2 4
Miles
Steller’s Eider Observations19992000
# 20052006
G 2007
[_
#
##
#
# #
#
#
#
#
##
#
#
#
#
#
h
h
G
GG
G
C h u k c h iS e a
Barrowstudy area
Admira
lty B
ay
Barrow
ABR file: Barrow_STEI_2007_01_02_03_04_07-127.mxd; 21 November 2007
5 0 5 10Km
42 0 2 4
Miles
Steller’s Eider Observations
#
2001h 2002G 2003
2004

Results and Discussion
USFWS, pers. comm.), suggesting that some pairshad not yet dispersed to breeding sites at the timeof our survey. This has likely occurred to someextent in all nesting years because we target oursurvey for the period of pair dispersal to avoidmissing early failed breeders and departing males.Although survey timing may have contributed tothe concentration of Steller’s Eiders observed on afine-scale within the Barrow area in 2008, webelieve that pre-nesting pairs are recorded somedistance away from their eventual nestingterritories every year and that our results in 2008are comparable to earlier years.
A comparison of 3 overlapping surveysconducted annually 1999–2008 in the Barrow area(the ABR aerial survey, the USFWS groundsearches, and the USFWS Eider BreedingPopulation Survey) reveals fairly goodcorrespondence overall (Figure 4). Variation inrelative numbers among the 3 surveys appears toresult mainly from shifts in the distribution of
Steller’s Eiders from year to year. For example, in2008, Steller’s Eiders were clustered near Barrow,mostly within the USFWS ground search area,resulting in higher numbers on ground searchescompared to the aerial surveys. In contrast,Steller’s Eiders were concentrated on the east sideof our survey area in 2007 (outside the USFWSground search area) resulting in higher numbers onthe ABR aerial survey. The USFWS slope-wideeider survey can detect eiders well outside thecoverage of either of the other surveys, but becauseSteller’s Eiders exhibit patchy distribution duringthe nesting season, that low intensity survey mayfail to encounter substantial numbers of Steller’sEiders in some years.
OTHER EIDERS
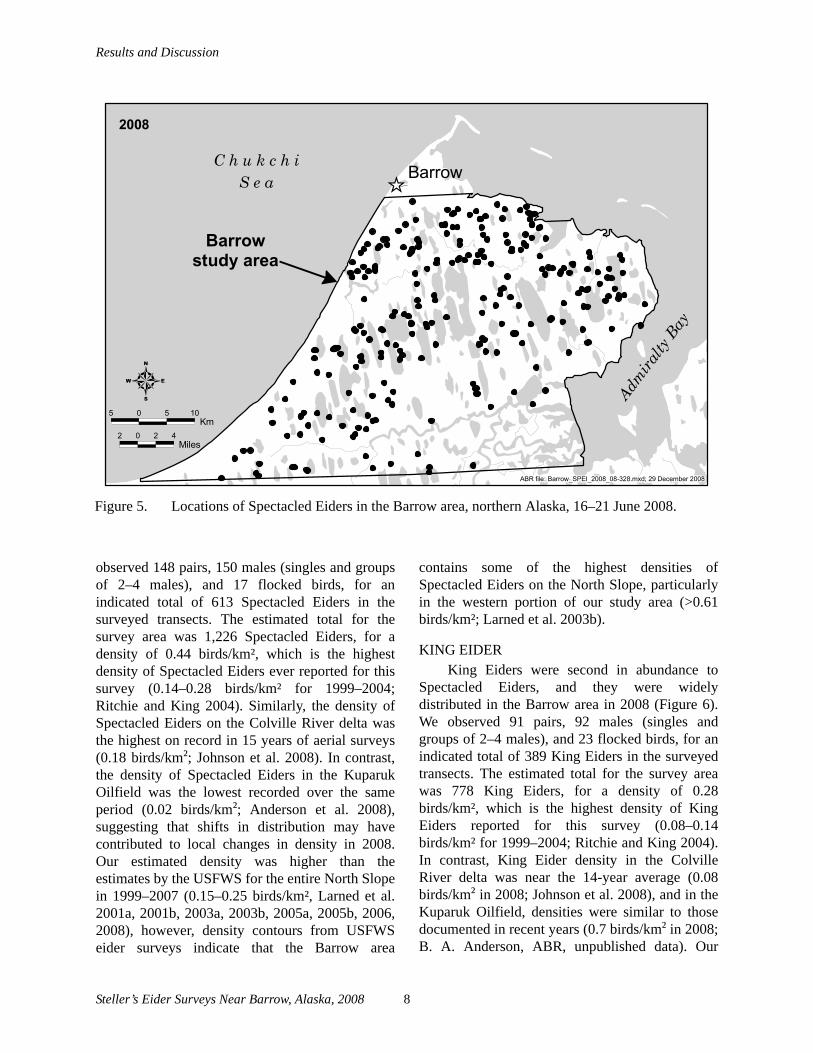
SPECTACLED EIDERAs in previous years, Spectacled Eiders were
widely distributed and were the most abundanteider in the Barrow area in 2008 (Figure 5). We
Figure 4. Comparison of the numbers of male Steller’s Eiders recorded during USFWS ground surveys (immediate Barrow area), USFWS aerial surveys (Arctic Coastal Plain), and ABR aerial surveys, Barrow area, 1999–2008. ABR counts were doubled in 2007 to adjust for reduced survey coverage (25% versus 50% in other years). Steller’s Eider nesting years at Barrow are denoted with asterisks.
1999 ** 2000 ** 2001 2002 2003 2004 2005 ** 2006 ** 2007 ** 2008 **
FWS AerialABR Aerial
FWS Ground0
20
40
60
80
100
120
140
No.
Mal
es
7 Steller’s Eider Surveys Near Barrow, Alaska, 2008
Results and Discussion
Steller’s Eider Surveys Near Barrow, Alaska, 2008 8
observed 148 pairs, 150 males (singles and groupsof 2–4 males), and 17 flocked birds, for anindicated total of 613 Spectacled Eiders in thesurveyed transects. The estimated total for thesurvey area was 1,226 Spectacled Eiders, for adensity of 0.44 birds/km², which is the highestdensity of Spectacled Eiders ever reported for thissurvey (0.14–0.28 birds/km² for 1999–2004;Ritchie and King 2004). Similarly, the density ofSpectacled Eiders on the Colville River delta wasthe highest on record in 15 years of aerial surveys(0.18 birds/km²; Johnson et al. 2008). In contrast,the density of Spectacled Eiders in the KuparukOilfield was the lowest recorded over the sameperiod (0.02 birds/km²; Anderson et al. 2008),suggesting that shifts in distribution may havecontributed to local changes in density in 2008.Our estimated density was higher than theestimates by the USFWS for the entire North Slopein 1999–2007 (0.15–0.25 birds/km², Larned et al.2001a, 2001b, 2003a, 2003b, 2005a, 2005b, 2006,2008), however, density contours from USFWSeider surveys indicate that the Barrow area
contains some of the highest densities ofSpectacled Eiders on the North Slope, particularlyin the western portion of our study area (>0.61birds/km²; Larned et al. 2003b).
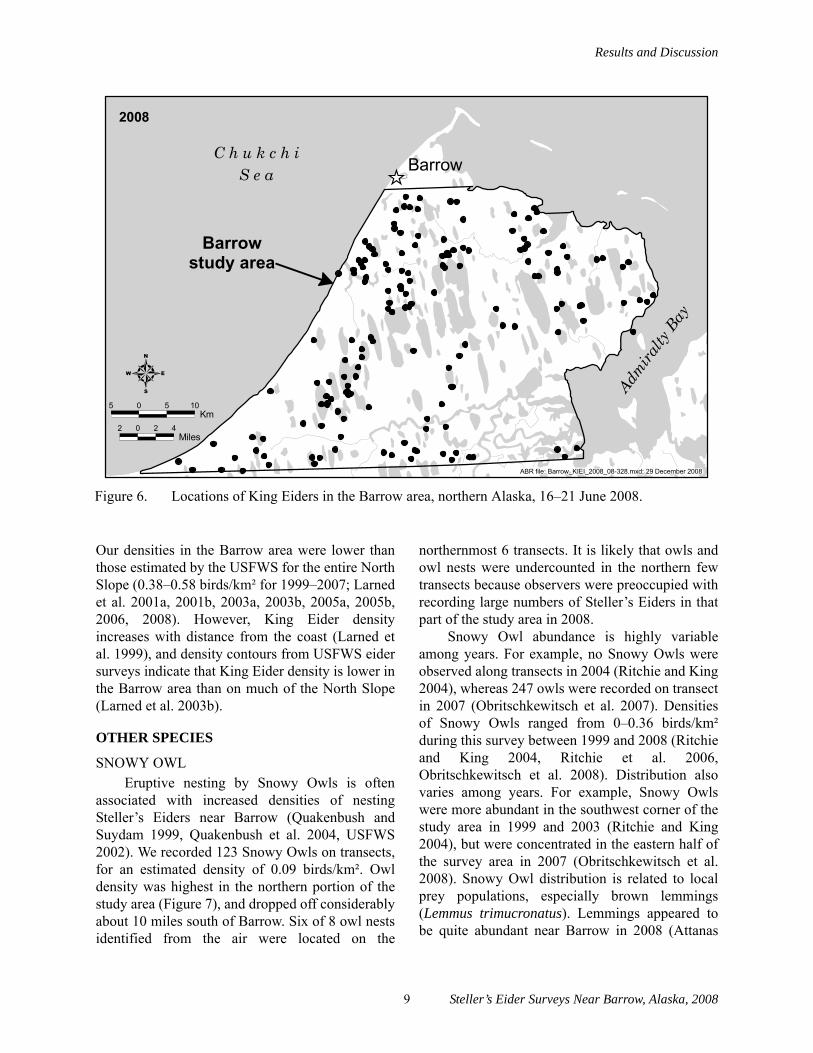
KING EIDERKing Eiders were second in abundance to
Spectacled Eiders, and they were widelydistributed in the Barrow area in 2008 (Figure 6).We observed 91 pairs, 92 males (singles andgroups of 2–4 males), and 23 flocked birds, for anindicated total of 389 King Eiders in the surveyedtransects. The estimated total for the survey areawas 778 King Eiders, for a density of 0.28birds/km², which is the highest density of KingEiders reported for this survey (0.08–0.14birds/km² for 1999–2004; Ritchie and King 2004).In contrast, King Eider density in the ColvilleRiver delta was near the 14-year average (0.08birds/km² in 2008; Johnson et al. 2008), and in theKuparuk Oilfield, densities were similar to thosedocumented in recent years (0.7 birds/km² in 2008;B. A. Anderson, ABR, unpublished data). Our
Figure 5. Locations of Spectacled Eiders in the Barrow area, northern Alaska, 16–21 June 2008.
[_
C h u k c h iS e a
Barrowstudy area
Admira
lty B
ay
Barrow
ABR file: Barrow_SPEI_2008_08-328.mxd; 29 December 2008
5 0 5 10Km
4
2008
"
2 0 2 4Miles
Results and Discussion
Our densities in the Barrow area were lower thanthose estimated by the USFWS for the entire NorthSlope (0.38–0.58 birds/km² for 1999–2007; Larnedet al. 2001a, 2001b, 2003a, 2003b, 2005a, 2005b,2006, 2008). However, King Eider densityincreases with distance from the coast (Larned etal. 1999), and density contours from USFWS eidersurveys indicate that King Eider density is lower inthe Barrow area than on much of the North Slope(Larned et al. 2003b).
OTHER SPECIES
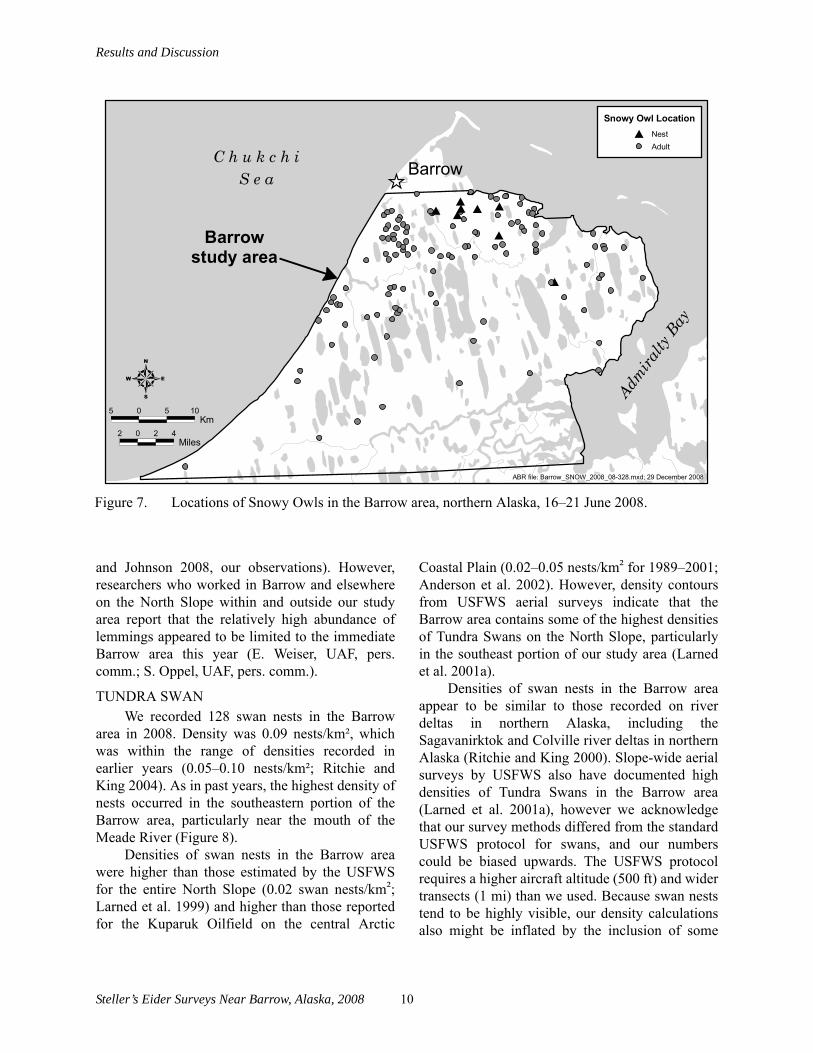
SNOWY OWLEruptive nesting by Snowy Owls is often
associated with increased densities of nestingSteller’s Eiders near Barrow (Quakenbush andSuydam 1999, Quakenbush et al. 2004, USFWS2002). We recorded 123 Snowy Owls on transects,for an estimated density of 0.09 birds/km². Owldensity was highest in the northern portion of thestudy area (Figure 7), and dropped off considerablyabout 10 miles south of Barrow. Six of 8 owl nestsidentified from the air were located on the
northernmost 6 transects. It is likely that owls andowl nests were undercounted in the northern fewtransects because observers were preoccupied withrecording large numbers of Steller’s Eiders in thatpart of the study area in 2008.
Snowy Owl abundance is highly variableamong years. For example, no Snowy Owls wereobserved along transects in 2004 (Ritchie and King2004), whereas 247 owls were recorded on transectin 2007 (Obritschkewitsch et al. 2007). Densitiesof Snowy Owls ranged from 0–0.36 birds/km²during this survey between 1999 and 2008 (Ritchieand King 2004, Ritchie et al. 2006,Obritschkewitsch et al. 2008). Distribution alsovaries among years. For example, Snowy Owlswere more abundant in the southwest corner of thestudy area in 1999 and 2003 (Ritchie and King2004), but were concentrated in the eastern half ofthe survey area in 2007 (Obritschkewitsch et al.2008). Snowy Owl distribution is related to localprey populations, especially brown lemmings(Lemmus trimucronatus). Lemmings appeared tobe quite abundant near Barrow in 2008 (Attanas
Figure 6. Locations of King Eiders in the Barrow area, northern Alaska, 16–21 June 2008.
[_
C h u k c h iS e a
Barrowstudy area
Admira
lty B
ay
Barrow
ABR file: Barrow_KIEI_2008_08-328.mxd; 29 December 2008
5 0 5 10Km
4
2008
"
2 0 2 4Miles
9 Steller’s Eider Surveys Near Barrow, Alaska, 2008
Results and Discussion
and Johnson 2008, our observations). However,researchers who worked in Barrow and elsewhereon the North Slope within and outside our studyarea report that the relatively high abundance oflemmings appeared to be limited to the immediateBarrow area this year (E. Weiser, UAF, pers.comm.; S. Oppel, UAF, pers. comm.).
TUNDRA SWANWe recorded 128 swan nests in the Barrow
area in 2008. Density was 0.09 nests/km², whichwas within the range of densities recorded inearlier years (0.05–0.10 nests/km²; Ritchie andKing 2004). As in past years, the highest density ofnests occurred in the southeastern portion of theBarrow area, particularly near the mouth of theMeade River (Figure 8).
Densities of swan nests in the Barrow areawere higher than those estimated by the USFWSfor the entire North Slope (0.02 swan nests/km²;Larned et al. 1999) and higher than those reportedfor the Kuparuk Oilfield on the central Arctic
Coastal Plain (0.02–0.05 nests/km² for 1989–2001;Anderson et al. 2002). However, density contoursfrom USFWS aerial surveys indicate that theBarrow area contains some of the highest densitiesof Tundra Swans on the North Slope, particularlyin the southeast portion of our study area (Larnedet al. 2001a).
Densities of swan nests in the Barrow areaappear to be similar to those recorded on riverdeltas in northern Alaska, including theSagavanirktok and Colville river deltas in northernAlaska (Ritchie and King 2000). Slope-wide aerialsurveys by USFWS also have documented highdensities of Tundra Swans in the Barrow area(Larned et al. 2001a), however we acknowledgethat our survey methods differed from the standardUSFWS protocol for swans, and our numberscould be biased upwards. The USFWS protocolrequires a higher aircraft altitude (500 ft) and widertransects (1 mi) than we used. Because swan neststend to be highly visible, our density calculationsalso might be inflated by the inclusion of some
Figure 7. Locations of Snowy Owls in the Barrow area, northern Alaska, 16–21 June 2008.
[_# #
## #
#
#
#
C h u k c h iS e a
Barrowstudy area
Admira
lty B
ay
Barrow
ABR file: Barrow_SNOW_2008_08-328.mxd; 29 December 2008
5 0 5 10Km
4
"
2 0 2 4Miles
Snowy Owl Location
# NestAdult
Steller’s Eider Surveys Near Barrow, Alaska, 2008 10
Summary and Conclusions
swan nests beyond our narrow transect’s outerboundary. More detailed geographic positions ofnests (allowing more accurate distinction of neststhat are off-transect), or a paired-survey design(i.e., flying an area using both protocols andcomparing resulting numbers), would be requiredto determine the magnitude of difference betweenthe 2 techniques.
SUMMARY AND CONCLUSIONS
Steller’s Eiders were concentrated in thenorthern portion of the study area in 2008.Forty-five birds were observed, yielding anindicated total of 48 Steller’s Eiders in thesurveyed transects and an estimated total of 96birds in the study area. Over all years (1999–2008),the estimated total number of Steller’s Eidersranged from 16 to 224 birds. Steller’s Eiders nestednear Barrow in 2008 and 28 nests were found byUSFWS ground crews. Results of our survey andthe USFWS Waterfowl Breeding PopulationSurvey suggest that breeding activity may have
been limited to the immediate Barrow area thisyear.
Spectacled and King eiders were moreabundant in the study area in 2008 than in allprevious years of our survey when data for thesespecies were analyzed (1999–2004). Densities ofSpectacled and King eiders were 0.44 and 0.28birds/km², respectively. As in prior years, bothspecies were widely distributed throughout thestudy area.
A total of 123 Snowy Owls were observed ontransects in 2008, for a density of 0.09 birds/km².Snowy Owls were concentrated in the northernportion of the study area, which is likely related tothe relatively high abundance of brown lemmingsnear Barrow in 2008. The density of Tundra Swannests was similar to previous years (0.09nests/km²). As in all other years, swan nests weredistributed throughout the study area but densitieswere highest in the Meade River delta.
Intensive aerial surveys conducted annuallyare useful for describing the general distributionand relative abundance of Steller’s Eiders in the
Figure 8. Locations of Tundra Swan nests in the Barrow area, northern Alaska, 16–21 June 2008.
[_
C h u k c h iS e a
Barrowstudy area
Admira
lty B
ay
Barrow
ABR file: Barrow_TUSW_Nest_2008_08-328.mxd; 29 December 2008
5 0 5 10Km
4
2008
"
2 0 2 4Miles
11 Steller’s Eider Surveys Near Barrow, Alaska, 2008

Literature Cited
Barrow region and these surveys complementUSFWS ground searches and the extensiveUSFWS aerial surveys used to monitor theSteller’s Eider population regionally. Intensivefixed-wing surveys in other small areas on theNorth Slope would provide more accurate data onnest distribution and regional population size, butwe believe that Barrow should remain the primaryarea for intensive surveys for Steller’s Eiders, atleast for the time-being. Important questionsremain, however, regarding the detectability ofbirds on aerial surveys. We believe that additionaleffort focused on post-aerial survey groundsearches or on an additional helicopter-supportedsurvey in all or portions of the same search areawould improve population and density estimatesfor Steller’s Eiders in the region.
LITERATURE CITED
Anderson, B. A., R. J. Ritchie, A. A. Stickney, andA. M. Wildman. 2002. Avian studies in theKuparuk Oilfield, Alaska, 2001. Report forConocoPhillips Alaska, Inc., Anchorage, AK,by ABR, Inc., Fairbanks, AK. 77 pp.
Anderson, B. A., A. A. Stickney, T.Obritschkewitsch, J. E. Shook, and P. E.Seiser. 2008. Avian studies in the KuparukOilfield, Alaska, 2008. Draft data summaryreport for ConocoPhillips Alaska, Inc.,Anchorage, AK, by ABR, Inc., Fairbanks,AK.
Attanas, L. B., and C. B. Johnson. 2008. Eidersurveys at the Wiley Post–Will RogersMemorial Airport in Barrow, Alaska, 2008.Report for Alaska Department ofTransportation and Public Facilities andTravis/Peterson Environmental Consulting,Inc., Fairbanks, by ABR, Inc., Fairbanks, AK.11 pp.
Gallant, A., E. Binnian, J. Omernik, and M.Shasby. 1995. Ecoregions of Alaska. U.S.Geological Survey Professional Paper 1567.73 pp.
Johnson, C. B., A. M. Wildman, J. P. Parrett, J. R.Rose, T. Obritschkewitsch, and A. A.Stickney. 2008. Avian studies for the AlpineSatellite Development Project, 2008. Draftsixth annual report for ConocoPhillips Alaska,Inc., and Anadarko Petroleum Corporation,Anchorage, by ABR, Inc., Fairbanks, AK.
Larned, B., T. Tiplady, R. Platte, and R. Stehn.1999. Eider breeding population survey,Arctic Coastal Plain, Alaska, 1997–1998.Unpubl. report, U.S. Fish and WildlifeService, Anchorage, AK. 22 pp.
Larned, B., R. Platte, and R. Stehn. 2001a. Eiderbreeding population survey, Arctic CoastalPlain, Alaska, 1999–2000. Unpubl. report,U.S. Fish and Wildlife Service, Anchorage,AK. 42 pp.
Larned, B., R. Stehn, J. Fischer, and R. Platte.2001b. Eider breeding population survey,Arctic Coastal Plain, Alaska, 2001. Unpubl.report, U.S. Fish and Wildlife Service,Anchorage, AK. 48 pp.
Larned, B., R. Stehn, and R. Platte. 2003a. Eiderbreeding population survey, Arctic CoastalPlain, Alaska, 2002. Unpubl. report, U.S. Fishand Wildlife Service, Anchorage, AK. 19 pp.+ appendices.
Larned, B., R. Stehn, and R. Platte. 2003b. Eiderbreeding population survey, Arctic CoastalPlain, Alaska, 2003. Unpubl. report, U.S. Fishand Wildlife Service, Anchorage, AK. 44 pp.
Larned, B., R. Stehn, and R. Platte. 2005a. Eiderbreeding population survey, Arctic CoastalPlain, Alaska, 2004. Unpubl. report, U.S. Fishand Wildlife Service, Anchorage, AK. 48 pp.
Larned, B., R. Stehn, and R. Platte. 2005b. Eiderbreeding population survey, Arctic CoastalPlain, Alaska, 2005. Unpubl. report, U.S. Fishand Wildlife Service, Anchorage, AK. 49 pp.
Larned, B., R. Stehn, and R. Platte. 2006. Eiderbreeding population survey, Arctic CoastalPlain, Alaska, 2006. Unpubl. report, U.S. Fishand Wildlife Service, Anchorage, AK. 53 pp.
Steller’s Eider Surveys Near Barrow, Alaska, 2008 12

Literature Cited
Larned, B., R. Stehn, and R. Platte. 2008.Waterfowl breeding population survey, ArcticCoastal Plain, Alaska, 2007. Unpubl. report,U.S. Fish and Wildlife Service, Anchorage,AK. 42 pp.
National Climatic Data Center, NESDIS, NOAA,U.S. Department of Commerce. 2008. GlobalSurface Summary of the Day —ftp://ftp.ncdc.noaa.gov/pub/data/gsod/
Obritschkewitsch, T., P. D. Martin, and R. S.Suydam. 2001. Breeding biology of Steller’sEiders nesting near Barrow, Alaska,1999–2000. U.S. Fish and Wildlife Service,Ecological Services, Fairbanks, AK.Technical Report NAES-TR-01-04. 113 pp.
Obritschkewitsch, T., and P. D. Martin. 2002a.Breeding biology of Steller’s Eiders nestingnear Barrow, Alaska, 2001. U.S. Fish andWildlife Service, Ecological Services,Fairbanks, AK. Technical ReportNAES-TR-02-01. 43 pp.
Obritschkewitsch, T., and P. D. Martin. 2002b.Breeding biology of Steller’s Eiders nestingnear Barrow, Alaska, 2002. U.S. Fish andWildlife Service, Fairbanks Fish and WildlifeField Office, Fairbanks, AK. TechnicalReport. 33 pp.
Obritschkewitsch, T., R. J. Ritchie, and J. King.2008. Steller’s Eider surveys near Barrow,Alaska, 2007. Report for Bureau of LandManagement (BLM), Fairbanks, AK andConocoPhillips Alaska, Inc., Anchorage, byABR, Inc., Fairbanks, AK. 11 pp.
Prichard, A. K., and R. J. Ritchie. 2005. Analysisof ABR aerial survey methods to locateSteller’s Eiders near Barrow, Alaska,1999–2004. Report for U.S. Fish and WildlifeService, Fairbanks Fish and Wildlife FieldOffice, by ABR, Inc., Fairbanks, AK. 15 pp.
Quakenbush, L. T., R. H. Day, B. A. Anderson, F.A. Pitelka, and B. J. McCaffery. 2002.Historical and present breeding seasondistribution of Steller’s Eiders in Alaska.Western Birds 33: 99–120.
Quakenbush, L. T., and R. Suydam. 1999. Periodicnonbreeding of Steller’s Eiders near Barrow,Alaska, with speculations on possible causes.Canadian Wildlife Service, Occasional PaperNo. 100: 34–40.
Quakenbush, L. T., R. Suydam, K. M. Fluetsch,and C. Donaldson. 1995. Breeding biology ofSteller’s Eiders nesting near Barrow, Alaska,1991–1994. Unpubl. report, U.S. Fish andWildlife Service, Fairbanks, AK. 53 pp.
Quakenbush, L. T., R. Suydam, T.Obritschkewitsch, and M. Deering. 2004.Breeding biology of Steller’s Eiders(Polysticta stelleri) near Barrow, Alaska,1991–99. Arctic 57: 166–182.
Quakenbush, L. T., R. Suydam, and T.Obritschkewitsch. 2000. Habitat use bySteller’s Eiders during the breeding seasonnear Barrow, Alaska, 1991–1996. Unpubl.report, U.S. Fish and Wildlife Service,Fairbanks AK.
Ritchie, R. J., and J. G. King. 2000. Tundra Swans.Pages 197–220. in Truett, J. C., and S. R.Johnson (eds.). Natural History of an ArcticOil Field. Academic Press, NY.
Ritchie, R. J., and J. G. King. 2001. Results ofSteller’s Eider surveys near Barrow,Admiralty Bay, and Meade River, Alaska,1999 and 2000. Report for North SlopeBorough, Wildlife Department, Barrow, AK,by ABR, Inc., Fairbanks, AK. 19 pp.
Ritchie, R. J., and J. G. King. 2004. Steller’s Eidersurveys near Barrow, Alaska, 2004. Report forU.S. Fish and Wildlife Service, Fairbanks Fishand Wildlife Field Office, AK; North SlopeBorough, Barrow, AK; and Alaska ArmyNational Guard, Fort Richardson, AK, byABR, Inc., Fairbanks, AK. 15 pp
Ritchie, R. J., T. Obritschkewitsch, and J. G. King.2006. Steller’s Eider surveys near Barrow,Alaska, 2006. Report for Bureau of LandManagement, Fairbanks, AK, andConocoPhillips Alaska, Inc., Anchorage, byABR, Inc., Fairbanks, AK. 9pp.
13 Steller’s Eider Surveys Near Barrow, Alaska, 2008
Literature Cited
Rojek, N. A., and P. D. Martin. 2003. Breedingbiology of Steller’s Eiders nesting nearBarrow, Alaska, 2003. U.S. Fish and WildlifeService, Fairbanks Fish and Wildlife FieldOffice, Fairbanks, AK. Technical Report. 35pp.
Rojek, N. A. 2006. Breeding biology of Steller’sEiders nesting near Barrow, Alaska, 2005.U.S. Fish and Wildlife Service, Fairbanks Fishand Wildlife Field Office, Fairbanks, AK.Technical Report. 53 pp.
Rojek, N. A. 2007. Breeding biology of Steller’sEiders nesting near Barrow, Alaska, 2006.U.S. Fish and Wildlife Service, Fairbanks Fishand Wildlife Field Office, Fairbanks, AK.Technical Report. 53 pp.
Rojek, N. A. 2008. Breeding biology of Steller’sEiders nesting near Barrow, Alaska, 2007.U.S. Fish and Wildlife Service, Fairbanks Fishand Wildlife Field Office, Fairbanks, AK.Technical Report. 45 pp.
U.S. Fish and Wildlife Service. 1987. Standardoperating procedures for aerial waterfowlbreeding ground population and habitatsurveys in North America. Unpubl. report,U.S. Fish and Wildlife Service andEnvironment Canada, Canadian WildlifeService.
U.S. Fish and Wildlife Service. 2002. Steller’sEider recovery plan. Fairbanks, AK. 27 pp.
PERSONAL COMMUNICATIONS
Jewel Bennett, Wildlife Biologist, U.S. Fish andWildlife Service, Fairbanks, AK.
William Larned, Wildlife Biologist, U.S. Fish andWildlife Service, Anchorage, AK.
Nora Rojek, Wildlife Biologist, U.S. Fish andWildlife Service, Fairbanks, AK.
Steffen Oppel, Ph.D. University of Alaska,Fairbanks, AK.
Emily Weiser, M.S. candidate, University ofAlaska, Fairbanks, AK.
Steller’s Eider Surveys Near Barrow, Alaska, 2008 14
15 Steller’s Eider Surveys Near Barrow, Alaska, 2008
App
endi
x 1.
Num
bers
of
Stel
ler's
Eid
ers
and
thei
r lo
cati
ons
duri
ng a
eria
l sur
veys
nea
r B
arro
w, A
lask
a, 1
6–21
Jun
e 20
08.
Latit
udea
Long
itude
a D
ate
Obs
erve
rb M
ale
Pair
On
trans
ect?
B
ehav
iorc
Hab
itatd
Com
men
t
71.1
8005
-1
56.3
6764
6/
16/2
008
TO
1
Y
H2O
Po
ly
Floo
ded
Tund
ra
71.2
2386
-1
56.2
1293
6/
16/2
008
JPP
1
Y
H2O
Po
nd
71
.226
98
-156
.278
09
6/16
/200
8 JP
P
1 Y
H
2O
Pond
71.2
3099
-1
56.3
3976
6/
16/2
008
TO
1
Y
H2O
Po
nd
71
.238
48
-156
.460
18
6/16
/200
8 TO
1 Y
H
2O
Pond
71.2
4516
-1
56.3
8444
6/
16/2
008
TO
1
Y
H2O
Po
nd
71
.245
42
-156
.522
56
6/16
/200
8 JP
P
1 Y
H
2O
Pond
71.2
5139
-1
56.6
3369
6/
16/2
008
TO
1
N
H2O
Po
nd
71
.252
18
-156
.709
39
6/16
/200
8 JP
P
1 Y
H
2O
Pond
71.2
4453
-1
56.6
9208
6/
16/2
008
JPP
1
Y
H2O
Po
nd
71
.251
67
-156
.681
64
6/16
/200
8 TO
1 Y
H
2O
Poly
Fl
oode
d Tu
ndra
71
.252
79
-156
.560
51
6/16
/200
8 JP
P
1 Y
H
2O
Pond
71.2
5220
-1
56.4
5466
6/
16/2
008
TO
1
Y
H2O
Po
nd
71
.252
41
-156
.360
44
6/16
/200
8 TO
1 Y
H
2O
Pond
71.2
5986
-1
56.5
6948
6/
16/2
008
JPP
1
Y
H2O
Po
nd
71
.265
16
-156
.654
87
6/16
/200
8 TO
1 Y
H
2O
Lake
Fo
otpr
int L
ake
71.2
6480
-1
56.6
4729
6/
16/2
008
TO
1
N
H2O
La
ke
Foot
prin
t Lak
e 71
.259
58
-156
.655
59
6/16
/200
8 TO
1 Y
H
2O
Lake
Fo
otpr
int L
ake
71.2
5974
-1
56.7
7364
6/
16/2
008
TO
1
Y
H2O
Po
nd
71
.266
56
-156
.662
28
6/16
/200
8 TO
1 Y
H
2O
Pond
M
an-m
ade
chan
nel a
djac
ent t
o la
ke
71.2
6651
-1
56.6
6036
6/
16/2
008
TO
1
Y
H2O
La
ke
Foot
prin
t Lak
e 71
.266
46
-156
.658
55
6/16
/200
8 TO
1 Y
H
2O
Lake
Fo
otpr
int L
ake
71.2
6671
-1
56.6
3232
6/
16/2
008
TO
1
Y
H2O
Po
nd
Shor
e of
pon
d 71
.266
69
-156
.618
22
6/16
/200
8 JP
P 1
Y
H
2O
Pond
71.0
2823
-1
57.2
2676
6/
19/2
008
JPP
1 1
Y
H2O
La
ke
Floo
ded
edge
of s
hallo
w la
ke
a C
oord
inat
es re
porte
d in
Nad
83 d
atum
. b
Obs
erve
rs: T
O =
Tim
Obr
itsch
kew
itsch
; JPP
= Ju
lie P
arre
tt.
c Fl
ies =
bird
was
seen
to fl
ush
or w
as in
flig
ht w
hen
first
seen
; H2O
= b
ird(s
) sta
yed
on th
e w
ater
. d
Poly
= p
olyg
onal
tund
ra (o
ften
flood
ed d
urin
g Ju
ne).