Embed Size (px)
Citation preview
The isotopic and hydrologic response of small, closed-basin lakes to climate forcing
from predictive models: Simulations of stochastic and mean-state
precipitation variations
Byron A. Steinman,* Michael F. Rosenmeier, and Mark B. Abbott
Department of Geology and Planetary Science, University of Pittsburgh, Pittsburgh, Pennsylvania
Abstract
A hydrologic and isotope mass-balance model is applied to two small, closed-basin lakes, Castor and Scanlon,in north-central Washington to describe the influence of hydroclimatic forcing on lake hydrologic and isotopicevolution. Simulations of lake responses to the combined effects of stochastic variability (i.e., random interannualfluctuations) and long-term (i.e., multidecade to century), mean-state changes in precipitation were conductedusing 300 yr of randomly generated precipitation data as model inputs. Simulation results demonstrate thataverage (long-term) closed-basin, lake-water, oxygen-isotope values are dependent largely upon lake-wateroutseepage (i.e., subsurface outflow) rates, with lower (higher) outseepage resulting in decreased (increased)isotopic sensitivity to long term precipitation changes, and that the lake basin surface-area-to-volume (SA : V)ratio changes with depth influence the direction of the isotopic response. Simulation results also suggest that, asaverage lake volume decreases as a consequence of decreasing mean-state precipitation amounts, interannuallake-water isotopic variability in response to stochastic forcing will increase. Conversely, as the average lakevolume increases in response to increasing mean-state precipitation amounts, interannual lake-water isotopicvariations associated with stochastic forcing will decrease. Additional model experiments demonstrate thatincreased (decreased) variance in precipitation leads to increased (decreased) water volume within lakes over thelong term, which (if stochastic variance changes are large enough) could result in decreased (increased) lake-wateroxygen-isotopic sensitivity to stochastic precipitation.
The oxygen isotope composition of closed-basin lakewater is controlled by many factors including net ground-water flux, catchment size and soil characteristics, lakebasin morphology, and hydroclimatic forcing throughstochastic variability (i.e., random interannual fluctua-tions), and mean-state changes (i.e., changes in multi-decade to century averages) in precipitation, relativehumidity, and temperature (Gat 1970; Leng 2004; Steinmanet al. 2010). In regions with highly seasonal climates such asthe Pacific Northwest, precipitation and evaporation ratessubstantially vary intra-annually, whereas lake-basin mor-phology, lake seepage rates, and catchment hydrologicparameters such as soil thickness and depth, vary only ondecadal and longer time scales, largely in response tointerannual climate forcing (Johnson and Watson-Stegner1987; Phillips 1993; Rosenmeier et al. in press). Changes inaverage climatic states, such as long-term increases in thevariance of precipitation about an established annualmean, or the shifting of precipitation from one season toanother, add additional complexity to the geochemicalevolution and, more specifically, the isotopic composition,of lake water (Vassiljev 1998; Leng et al. 2001; Pham et al.2009). Only by simulating lake sensitivity to these factorsusing quantitative models can the isotopic response ofclosed-basin lakes to climate change be predicted, a factthat has considerable relevance to paleoclimate interpreta-tions of sediment core oxygen isotope (d18O) records(Ricketts and Johnson 1996; Cross et al. 2001; Jones etal. 2005).
Groundwater flow regimes and associated lake seepagerates are of particular importance in the control of steady-state lake-water d18O values (Donovan et al. 2002; Smith etal. 2002; Shapley et al. 2008). In closed-basin systems thatare isolated from regional groundwater (i.e., perched lakes),the origin of subsurface inflow is often precipitation fallingon or very near the catchment (Almendinger 1993). Inseasonal climates, under these conditions, base flow has anisotopic composition that is approximately equal to theweighted average isotopic composition of mean annualprecipitation and, therefore, can effectively be consideredrunoff with an extended transit time (Henderson andShuman 2009). In contrast, subsurface inflows to lakesystems that are not isolated from regional groundwateraquifers can potentially undergo a much more complexisotopic evolution during transport to a lake (Smith et al.1997).
Subsurface outflow from closed-basin lakes occurs asseepage through the lake bed at rates that are typically verylow due to the low hydraulic conductivity of silt and clay-rich lake sediment. Outseepage, a potentially minimalhydrologic flux, is in all cases a fundamental control onthe steady-state isotopic composition of closed-basin lakewater because, through interaction with lake-basin mor-phology, it determines the proportion of water that leaves alake through fractionating (evaporation) and nonfrac-tionating (outseepage) pathways (Steinman et al. 2010).
In this study, a numeric, hydrologic and isotope mass-balance model was applied to Castor and Scanlon Lakes,north-central Washington, and was used to simulate lake-water hydrologic and isotopic responses to changes in* Corresponding author: [email protected]
Limnol. Oceanogr., 55(6), 2010, 2246–2261
E 2010, by the American Society of Limnology and Oceanography, Inc.doi:10.4319/lo.2010.55.6.2246
2246
mean-state and stochastic precipitation. In the first set ofexperiments, intra-annual variations in lake depth and d18Ovalues, as well as interannual lake transient and steady-state responses to mean-state precipitation forcing, weresimulated by applying long-term increases and decreases(6 50%) in monthly precipitation values. In the second setof experiments, the model structure was modified to includestochastic changes in precipitation, in order to morerealistically simulate hydroclimatic forcing conditions. Inthis series of tests, a precipitation data set was randomlygenerated using the mean and standard deviation of 20th-century precipitation values recorded at local weatherstations and applied over three 100-yr periods during whichvarying long-term precipitation changes were used tosimulate the gradual shift from one hydroclimatic meanstate to another. To augment these analyses, and to testmodel-derived hypotheses across a diversity of lakemorphologies and hydrologic settings, model simulationswere also conducted on two hypothetical, hypsographicallyand hydrologically distinct lakes, representing variationson both Castor and Scanlon Lakes. In the third series ofexperiments, the standard deviation of interannual precip-itation forcing factors (established in the second series oftests) was varied over three 100-yr periods in order tosimulate the lakes’ hydrologic and isotopic responses tochanges in the variance of stochastic variability in theabsence of mean-state forcing.
Methods
Study sites and regional climate—Scanlon Lake (SL) andCastor Lake (CL) are located in the Limebelt region ofnorth-central Washington on a terrace margin of theOkanogan River. The lake catchments are small (, 1 km2)and occupy a topographic high isolated from regionalgroundwater. Climate in the area is seasonal, semiarid, andlargely controlled by the interaction between the Pacificwesterly winds and the Aleutian low-pressure system andnorth Pacific high-pressure system.
Model structure—The hydrologic and isotope mass-balance of CL and SL are calculated in the model usingthe following equations:
dVL
dt~SI{SO ð1Þ
d VLdLð Þdt
~SIdI{SOdO ð2Þ
where VL is lake volume, SI and SO are the total surfaceand below ground inflows to and outflows from the lakes,and d is the isotopic composition of the inflows andoutflows. These equations provide the basis for a system of12 ordinary differential equations, compiled using Stella(isee systems) software, that describe water and isotopedynamics for the lake catchment systems. More specifically,the hydrologic model is defined by six separate differentialequations corresponding to unique water reservoirs (catch-ment groundwater, snowpack, shallow and deep lake
volumes, etc.). Volumetric fluxes to the reservoirs aredescribed by model subroutines for lake stratification, soil-moisture availability, snowpack, and surface and subsur-face inflows. Additional detail regarding calculation of theflux components as well as all other aspects of the modelis provided by Steinman et al. (2010). All model simulationswere conducted with the Stella software using the fourth-order Runge-Kutta numerical integration method.
Mean-state precipitation forcing simulation structure—Inthe first series of model simulations, monthly averageclimate data and modern catchment parameter data setswere used to approximate the monthly and seasonalvariability of CL and SL water levels, and to evaluate thetransient (i.e., short-lived) and longer term, steady-statesensitivity of the lakes to precipitation changes. Each set ofsensitivity simulations was conducted on a monthly timestep over , 63 model years, using modern catchmentparameters and average climate data for the 20th cen-tury. At simulation month 501, the precipitation ratewas either increased or decreased by 50% and main-tained at the altered value for the remainder of the test inorder to simulate large changes in mean hydroclimaticconditions.
Stochastic precipitation forcing simulation structure—Toexplore the interplay between stochastic variability andmean-state change in hydroclimate on closed-basin lake-water balance and d18O values, hydrologic forcing simula-tions were conducted in which randomly adjusted precip-itation rates (i.e., stochastic variations in precipitation)were superimposed upon long-term changes in meanprecipitation levels. Specifically, for each simulation year,a forcing factor was produced using a random numberalgorithm and applied to each month during the year.Random forcing factors were generated using a standarddeviation equal to the coefficient of variation of annualprecipitation over the 20th century (0.28) calculated fromlocal weather station data sets (Steinman et al. 2010). Thismethod is fundamentally similar to that of the moresophisticated daily stochastic weather generators appliedby global climate models but is simpler because random-ness in monthly, rather than daily, precipitation and onlyone climate variable (in this case, precipitation) aresimulated (Richardson 1981; Katz 1996; Mearns et al.1997).
For the combined mean-state and stochastic variabilitytests, steady-state conditions were achieved during the first25 yr of each experiment, after which precipitation rateswere randomly adjusted on an interannual basis, asdescribed above, to simulate stochastic climate variability.During the first 100-yr simulation period (i.e., duringmodel years 25 to 125), no mean-state precipitation forcingwas applied. In the subsequent 100-yr period (model years125–225), the average precipitation value was graduallyincreased or decreased toward a fixed percentage (6 50%of modern) to simulate variation in the mean hydroclimatestate. During the third 100-yr simulation period (modelyears 225–325), precipitation values were held at theadjusted mean-state value (again, either 50% above or
Climate effects on closed-basin lakes 2247

below modern) achieved at model year 225 to simulate theeffects of stochastic variability within an altered long-termaverage precipitation amount. Only 1 set of 100 stochasticforcing factors was applied in each simulation in order toensure that the standard deviation of precipitation values ineach simulation period were identical and to therebymaintain consistency in the simulations.
Similarly, to investigate the influence of changes in thevariance of stochastic forcing in the absence of mean-statechange, simulations were conducted in which the standarddeviation of randomly adjusted precipitation rates wasincreased over the course of the tests. The general structureof the stochastic forcing variance change simulations wasidentical to the combined mean-state and stochastic forcingsimulations, with the exceptions that no mean-state forcingwas applied and that the standard deviation of theprecipitation forcing factors increased from 0.21 to 0.35
(i.e., from 225% to +25% of 0.28, the 20th-centurycoefficient of variation of precipitation) from the first tothe third simulation periods, respectively.
Results
Simulation of mean-state precipitation forcing—Steady-state simulations predicted extensive intra-annual isotopicvariability at SL (Fig. 1A,B) and CL (Fig. 1C,D), withd18O variations of approximately 17% and 12%, respec-tively, between winter and summer months and a maximumsummer d18O value at SL , 5% greater than that of CLprior to precipitation forcing at model month 501. Thesepredictions are consistent with modern observations ofintra-annual hydrologic and isotopic variability at CL andSL (Steinman et al. 2010).
Fig. 1. Depth (dashed lines) and lake-water d18O value changes (solid lines) at SL and CL in response to mean-state precipitationincreases of 50% (gray lines) and decreases of 50% (black lines) over model simulation months 450 to 750 (A and C, respectively) with anexpanded view of model months 732–744 (B and D, respectively) following reestablishment of steady state. In both lake simulationsprecipitation changes were initiated at month 501.
2248 Steinman et al.

After a 50% decrease in precipitation at month 501,both CL and SL exhibited transient annual maximumd18O increases of , 5% and 6%, respectively, with CLtaking longer (relative to SL) to achieve transient maximaand steady-state d18O values. In contrast, after a 50%increase in precipitation, both CL and SL exhibited short-lived maximum annual d18O decreases of , 2% and 4%,respectively. After achieving transient maxima or minima,annual d18O values at both lakes transitioned to newsteady-state values corresponding to the precipitationchange initiated at month 501. In the decreased precipi-tation scenario, new annual maximum steady-state d18Ovalues were higher than the values prior to precipitationforcing, although the values at CL were appreciablyhigher than at SL (an increase of , 2.6% and 0.7%,respectively). In the increased precipitation scenario, newsteady-state d18O values were also higher than the valuesprior to precipitation forcing, although the increase at SL(, 0.2%) was significantly smaller than that of CL(, 1.3%).
Simulation of combined mean-state and stochasticprecipitation forcing—During the course of the SL simula-tions, stochastic variability in precipitation led to largeinterannual fluctuations in average summer (June–August)lake volume and d18O values. In the mean-state precipita-tion decrease scenario, the magnitude of these fluctuationsincreased during the second 100-yr simulation period andreached a maximum during the third simulation period(Fig. 2; Table 1). Conversely, in the precipitation increasescenario, the magnitude of these fluctuations decreasedduring the second 100-yr simulation period and reached aminimum during the third simulation period (Fig. 3). Inresponse to mean-state precipitation change, SL summeraverage d18O values increased slightly over the course ofboth simulations, with a larger magnitude increaseoccurring during the precipitation reduction scenario(Table 1).
The response of CL to stochastic variability in precip-itation was similar to that of SL, in that the magnitude ofinterannual d18O and lake-volume changes increased fromthe first to the third simulation period in response to amean-state precipitation decrease (Fig. 4; Table 1). In theprecipitation increase scenario, the smallest magnitudeinterannual d18O and volume changes occurred during thethird 100-yr period (Fig. 5; Table 1). The response of CL tomean-state precipitation changes was, however, differentthan that of SL, in that average summer d18O valuessubstantially increased from one simulation period to thenext in response to mean-state precipitation increases anddecreases.
At both CL and SL, large changes in residence time,surface-area-to-volume (SA : V) ratio values, and outflowproportions occurred in response to both stochastic andmean-state precipitation variability forcing (Figs. 2–5;Table 1). In all cases, residence time values exhibited astrong association with lake SA : V ratio values andevaporative outflow proportions, with residence timesdecreasing in response to increases in evaporative outflowproportions and SA : V ratio values.
Simulation of combined mean-state and stochastic precip-itation forcing within hypothetical lakes—Model simulationswere also conducted on two hypothetical lakes, represent-ing variations on the bathymetric and outseepage charac-teristics of Castor and Scanlon Lakes, and denoted CL2and SL2, respectively. In the CL2 configuration, SA : Vratio values above a depth of 12 meters were changed suchthat values decreased with increasing depth (from theactual, opposite, configuration of increasing values withdepth increases). In the SL2 configuration the seepage ratewas increased to 1.5 times that of CL to a value of 2.4% ofmonthly lake volume (Steinman et al. 2010).
In the CL2 configuration, the d18O response tostochastic variability forcing was similar to that of CL,with standard deviations for both configurations within0.1% for all three simulation periods (Fig. 6; Table 1). Thelake-water d18O response to a mean-state precipitationincrease was dissimilar, however, with a lower averagevalue (relative to the actual bathymetric configuration ofCastor Lake) during the third simulation period. In theCL2 configuration, the SA : V ratio over the thirdsimulation period decreased in response to increasingvolume while seepage and evaporation outflow proportionsincreased and decreased, respectively.
The lake-water d18O response to stochastic variability inthe SL2 model test was also similar to that of SL, withstandard deviations for both configurations within 0.4%over all three simulation periods (Fig. 7; Table 1). Thed18O responses of lake water to mean-state precipitationforcing likewise differed, with the average d18O value in theSL2 configuration appreciably lower in all three simulationperiods and increasing from one period to the next. Seepageand evaporation outflow proportions of total lake volumewere also markedly different between the true ScanlonLake and SL2 configurations, with a higher outseepageproportion and a lower evaporation proportion in the SL2configuration over all three simulation periods.
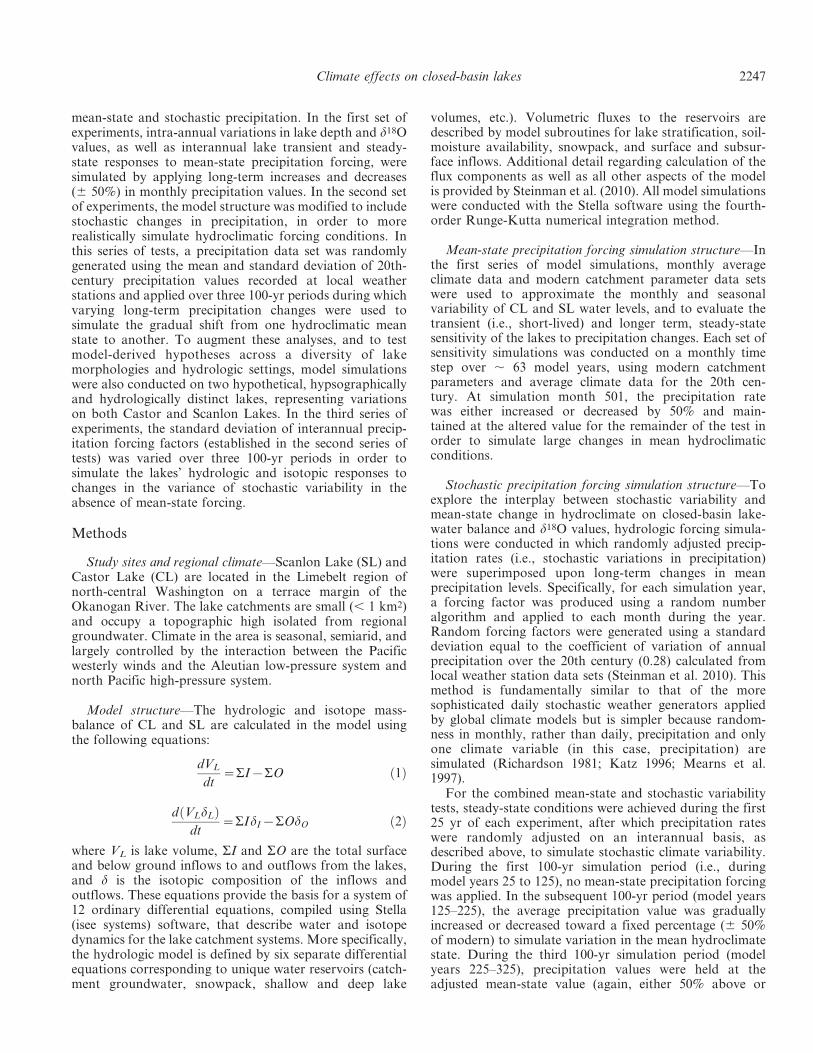
Simulation of variance changes in stochastic precipitationforcing—In the case of both CL and SL, changes in thestandard deviation of interannual precipitation forcing ledto commensurate changes in the standard deviation ofinterannual lake-water d18O values and volume changes(Figs. 8, 9; Table 1). No large-scale deviations from mean-state values for any of the analyzed lake parameters wereobserved with the exception of lake volume, whichincreased by approximately 6% at SL and 3% at CLbetween the first and third simulation periods.
Discussion
Lake responses to mean-state precipitation forcing—Mean-state precipitation simulation results demonstratethat SL has a higher maximum annual d18O value relativeto CL as a result of the larger proportion of water lostthrough evaporation, a fractionating pathway, in compar-ison to outseepage, a nonfractionating pathway (Table 1)(Steinman et al. 2010). SL also exhibits a stronger transientresponse to precipitation forcing. The slower equilibrationtime of CL occurs because the higher residence time,
Climate effects on closed-basin lakes 2249

Fig. 2. SL responses to the superimposition of stochastic variations and a mean-state precipitation decrease of 50%. Between years 0and 25, no changes in precipitation were applied. Between years 25 and 125, precipitation was varied stochastically with a mean andstandard deviation equal to observed 20th-century values. Between years 125 and 225, mean-state precipitation was incrementallydecreased by 50% while maintaining stochastic variations applied in years 25–125. Between years 225 and 325, mean-state precipitationwas maintained at a value 50% below the 20th-century average while again maintaining the stochastic variations applied in the prior 100-yr simulation periods. (A) Superimposed stochastic and mean-state precipitation forcing factors (gray line) and residence times (blackline). (B) Average summer (June–August) surface-water d18O values (gray line) and lake volumes (black line) resulting from describedprecipitation changes. (C) Lake SA : V ratio values (gray line) and the proportions of water lost to evaporation (black line) andoutseepage (dashed line). Vertical lines delineate 100-yr simulation periods identified in Table 1.
2250 Steinman et al.

Table
1.
Av
era
ge
sum
mer
(Ju
ne–
Au
gu
st)
va
lues
for
lak
ev
ari
ab
les
for
each
sim
ula
tio
n(s
im.)
per
iod
inre
spo
nse
tost
och
ast
ica
nd
mea
n-s
tate
pre
cip
ita
tio
nv
ari
ati
on
s.
Mea
np
reci
pit
ati
on
cha
ng
eS
im.
per
iod
Vo
lum
e(m
3)
Av
era
ge
inte
r-a
nn
ua
l%
vo
lum
etri
cch
an
ge
Dep
th(c
m)
Su
rfa
cela
ke
d1
8O
(%)
Su
rfa
cela
ke
d1
8O
sta
nd
ard
dev
iati
on
(%)
Ev
ap
ora
tio
np
rop
ort
ion
Ou
tsee
pa
ge
pro
po
rtio
nS
A:V
rati
o(m
21)
Res
iden
ceti
me
(yr)
CL 0
.5(2
50%
)1
31
1,5
29
9.1
11
65
23
.38
1.3
60
.53
0.4
70
.19
2.4
32
18
3,8
28
14
.88
57
22
.65
2.3
60
.58
0.4
20
.24
2.1
73
62
,77
83
5.2
46
02
1.1
34
.05
0.7
20
.28
0.5
01
.48
1.5
(+5
0%
)1
31
1,5
29
9.1
11
65
23
.38
1.3
60
.53
0.4
70
.19
2.4
32
43
7,1
07
7.3
13
37
23
.09
1.1
00
.55
0.4
50
.20
2.3
23
57
3,3
61
5.1
14
80
22
.46
0.6
90
.58
0.4
20
.23
2.1
8
SL 0
.5(2
50%
)1
11
4,2
16
11
.77
62
1.3
31
.99
0.8
40
.16
0.3
71
.94
26
0,3
39
19
.45
81
1.9
42
.91
0.8
70
.13
0.4
91
.58
32
0,6
00
43
.63
72
2.3
74
.64
0.9
10
.09
0.7
61
.12
1.5
(+5
0%
)1
11
4,2
16
11
.77
62
1.3
31
.99
0.8
40
.16
0.3
71
.94
21
74
,93
68
.58
87
1.1
91
.48
0.8
30
.17
0.3
42
.05
32
30
,05
25
.19
80
1.6
50
.74
0.8
40
.16
0.3
61
.96
CL
2 1.5
(+5
0%
)1
32
6,0
03
9.3
11
96
23
.74
1.4
10
.51
0.4
90
.17
2.5
32
50
8,8
80
7.2
14
63
24
.32
1.1
00
.48
0.5
20
.15
2.7
03
73
9,6
98
4.6
17
47
24
.65
0.7
00
.45
0.5
50
.13
2.8
8
SL
2 0.5
(25
0%
)1
71
,46
71
5.6
64
12
1.3
11
.73
0.6
40
.36
0.4
31
.26
23
9,7
64
26
.04
94
20
.42
2.7
30
.69
0.3
10
.57
1.0
83
14
,75
25
3.5
32
30
.83
4.2
50
.77
0.2
30
.90
0.8
1
CL
* 22
5%
13
07
,00
57
.01
16
42
3.5
11
.03
0.5
30
.47
0.1
82
.45
02
31
0,3
66
9.3
11
63
23
.40
1.3
70
.53
0.4
70
.19
2.4
3+2
5%
33
15
,25
61
1.6
11
64
23
.26
1.7
20
.54
0.4
60
.19
2.4
12
25
%1
11
0,1
68
9.1
37
56
1.2
71
.54
0.8
40
.16
0.3
71
.93
02
11
3,6
33
12
.07
61
1.3
22
.00
0.8
40
.16
0.3
71
.94
+25%
31
16
,79
21
4.7
76
51
.42
2.4
70
.84
0.1
60
.37
1.9
4
*S
toch
ast
icfo
rcin
gv
ari
an
cech
an
ge
sim
ula
tio
ns.
Per
cen
tag
ech
an
ge
inth
est
an
da
rdd
evia
tio
ns
for
each
10
0-y
rp
erio
da
red
isp
layed
inth
em
ean
pre
cip
ita
tio
nch
an
ge
colu
mn
.
Climate effects on closed-basin lakes 2251

greater volume, and the relatively low SA : V ratio result ininterannual volumetric fluxes that are, in proportion tolake volume, smaller. This in turn results in a lesspronounced transient lake-water d18O response and a
slower return to steady-state conditions. Additionally, CLexhibits a posttransient maximum annual steady-state d18Ovalue that is, in both positive and negative forcingscenarios, larger relative to the preforcing value, while
Fig. 3. SL responses to the superimposition of stochastic variations and a mean-state precipitation increase of 50%. Between years 0and 25, no changes in precipitation were applied. Between years 25 and 125, precipitation was varied stochastically, with a mean andstandard deviation equal to observed 20th-century values. Between years 125 and 225, mean-state precipitation was incrementallyincreased by 50% while maintaining stochastic variations applied in years 25–125. Between years 225 and 325, mean-state precipitationwas maintained at a value 50% above the 20th-century average while again maintaining stochastic variations applied in the prior 100-yrsimulation periods. (A) Superimposed stochastic and mean-state precipitation forcing factors (gray line) and residence times (black line).(B) Average summer (June–August) surface-water d18O values (gray line) and lake volumes (black line) resulting from describedprecipitation changes. (C) Lake SA : V ratio values (gray line) and the proportions of water lost to evaporation (black line) andoutseepage (dashed line).
2252 Steinman et al.

SL, in contrast, exhibits a posttransient maximum annualsteady-state value that is nearly identical to the preforcingvalue (Fig. 1). This is again due to disparities in the outflowproportions, in that the greater proportion of seepage
outflow at CL (and the consequently smaller evaporativeoutflow proportion) result in a greater sensitivity of steady-state d18O values to SA : V ratio changes with changingdepth. Specifically, as lake level either increases or decreases
Fig. 4. CL responses to the superimposition of stochastic variations and a mean-state precipitation decrease of 50%. Between years0 and 25, no changes in precipitation were applied. Between years 25 and 125, precipitation was varied stochastically with a mean andstandard deviation equal to observed 20th-century values. Between years 125 and 225, mean-state precipitation was incrementallydecreased by 50% while maintaining stochastic variations applied in years 25–125. Between years 225 and 325, mean-state precipitationwas maintained at a value 50% below the 20th-century average while again maintaining stochastic variations applied in the prior 100-yrsimulation periods. (A) Superimposed stochastic and mean-state precipitation forcing factors (gray line) and residence times (black line).(B) Average summer (June–August) surface-water d18O values (gray line) and lake volumes (black line) resulting from describedprecipitation changes. (C) Lake SA : V ratio values (gray line) and the proportions of water lost to evaporation (black line) andoutseepage (dashed line).
Climate effects on closed-basin lakes 2253

Fig. 5. CL responses to the superimposition of stochastic variations and a mean-state precipitation increase of 50%. Between years 0and 25, no changes in precipitation were applied. Between years 25 and 125, precipitation was varied stochastically with a mean andstandard deviation equal to observed 20th-century values. Between years 125 and 225, mean-state precipitation was incrementallyincreased by 50% while maintaining stochastic variations applied in years 25–125. Between years 225 and 325, mean-state precipitationwas maintained at a value 50% above the 20th-century average while again maintaining stochastic variations applied in the prior 100-yrsimulation periods. (A) Superimposed stochastic and mean-state precipitation forcing factors (gray line) and residence times (black line).(B) Average summer (June–August) surface-water d18O values (gray line) and lake volumes (black line) resulting from describedprecipitation changes. (C) Lake SA : V ratio values (gray line) and the proportions of water lost to evaporation (black line) andoutseepage (dashed line).
2254 Steinman et al.

Fig. 6. CL2 responses to the superimposition of stochastic variations and a mean-state precipitation increase of 50%. Between years0 and 25, no changes in precipitation were applied. Between years 25 and 125, precipitation was varied stochastically with a mean andstandard deviation equal to observed 20th-century values. Between years 125 and 225, mean-state precipitation was incrementallyincreased by 50% while maintaining stochastic variations applied in years 25–125. Between years 225 and 325, mean-state precipitationwas maintained at a value 50% above the 20th-century average while again maintaining stochastic variations applied in the prior 100-yrsimulation periods. (A) Superimposed stochastic and mean-state precipitation forcing factors (gray line) and residence times (black line).(B) Average summer (June–August) surface-water d18O values (gray line) and lake volumes (black line) resulting from describedprecipitation changes. (C) Lake SA : V ratio values (gray line) and the proportions of water lost to evaporation (black line) andoutseepage (dashed line).
Climate effects on closed-basin lakes 2255

Fig. 7. SL2 responses to the superimposition of stochastic variations and a mean-state precipitation decrease of 50%. Between years0 and 25, no changes in precipitation were applied. Between years 25 and 125, precipitation was varied stochastically with a mean andstandard deviation equal to observed 20th-century values. Between years 125 and 225, mean-state precipitation was incrementallydecreased by 50% while maintaining stochastic variations applied in years 25–125. Between years 225 and 325, mean-state precipitationwas maintained at a value 50% below the 20th-century average while again maintaining stochastic variations applied in the prior 100-yrsimulation periods. (A) Superimposed stochastic and mean-state precipitation forcing factors (gray line) and residence times (black line).(B) Average summer (June–August) surface-water d18O values (gray line) and lake volumes (black line) resulting from describedprecipitation changes. (C) Lake SA : V ratio values (gray line) and the proportions of water lost to evaporation (black line) andoutseepage (dashed line).
2256 Steinman et al.
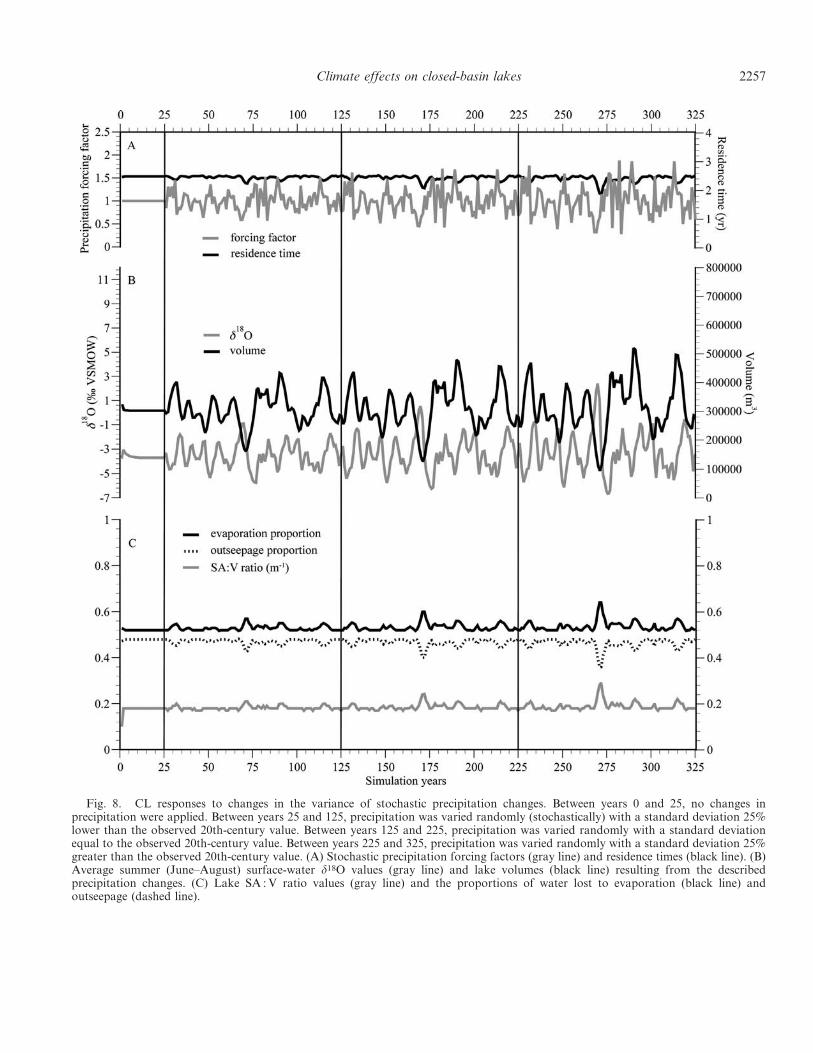
Fig. 8. CL responses to changes in the variance of stochastic precipitation changes. Between years 0 and 25, no changes inprecipitation were applied. Between years 25 and 125, precipitation was varied randomly (stochastically) with a standard deviation 25%lower than the observed 20th-century value. Between years 125 and 225, precipitation was varied randomly with a standard deviationequal to the observed 20th-century value. Between years 225 and 325, precipitation was varied randomly with a standard deviation 25%greater than the observed 20th-century value. (A) Stochastic precipitation forcing factors (gray line) and residence times (black line). (B)Average summer (June–August) surface-water d18O values (gray line) and lake volumes (black line) resulting from the describedprecipitation changes. (C) Lake SA : V ratio values (gray line) and the proportions of water lost to evaporation (black line) andoutseepage (dashed line).
Climate effects on closed-basin lakes 2257

Fig. 9. SL responses to changes in the variance of stochastic precipitation changes. Between years 0 and 25, no changes inprecipitation were applied. Between years 25 and 125, precipitation was varied randomly (stochastically) with a standard deviation 25%lower than the observed 20th-century value. Between years 125 and 225, precipitation was varied randomly, with a standard deviationequal to the observed 20th-century value. Between years 225 and 325, precipitation was varied stochastically with a standard deviation25% greater than the observed 20th-century value. (A) Stochastic precipitation forcing factors (gray line) and residence times (black line).(B) Average summer (June–August) surface-water d18O values (gray line) and lake volumes (black line) resulting from the describedprecipitation changes. (C) Lake SA : V ratio values (gray line) and the proportions of water lost to evaporation (black line) andoutseepage (dashed line).
2258 Steinman et al.

at CL, the SA : V ratio increases, which leads to an increasein the proportion of water leaving the lake throughevaporation. At SL, however, the response is different inthat the low outseepage rate results in an evaporationoutflow proportion that is high regardless of the SA : V ratio,resulting in a minimal steady-state d18O change.
Lake responses to combined mean-state and stochasticprecipitation forcing—A comparison of the SL and CLprecipitation variability simulation results reveals severaldifferences between the isotopic and hydrologic responsesof the two lakes. Perhaps most notably, in every simulationperiod of the precipitation change scenarios (both +50%and 250%), the standard deviation of the average summerisotopic d18O values at SL was higher than the correspond-ing value for CL (Table 1). This can be explained by thestronger transient response to hydrologic forcing at SL (seeLake responses to mean-state precipitation forcing), whichresults from the lower volume and residence time andhigher SA : V ratio values. A related observation is that, forboth SL and CL, as lake volume increases in response toincreasing mean-state precipitation, the standard deviationof the summer average d18O values decreases, and viceversa. At both CL and SL, as the mean annualprecipitation total increases, and the standard deviationof precipitation values remains unchanged, lake level andvolume will increase, resulting in volumetric fluxes associ-ated with stochastic variability that are proportionallysmaller in comparison to total lake volume. As precipita-tion amounts decrease, in contrast, the volumetric fluxesassociated with stochastic precipitation changes becomelarger relative to total lake volume.
The summer average d18O values of CL and SL alsoshow dissimilarities. Most notably, in every simulationperiod SL d18O values are comparatively higher than CLvalues. This occurs primarily because SL has a loweroutseepage rate and consequently, an evaporative outflowproportion that is higher than that of CL, which leads togreater overall evaporative enrichment of SL lake watersregardless of the precipitation forcing scenario (Table 1).
The similarity in the direction of the SL and CL steady-state responses to mean-state precipitation changes is alsoconspicuous, in that long-term precipitation increases resultin increased lake volumes and summer average d18O values,a somewhat counterintuitive result given that decreasingd18O values are typically associated with increasing lakevolumes. This result can be explained by the interplaybetween the outseepage flux proportions and the SA : Vratio values which at SL and CL increase with increasingdepth above , 8.5 m and 12 m, respectively (see Lakeresponses to mean-state precipitation forcing, above).
The CL precipitation reduction scenario provides anexample of how the direction of the SA : V ratio caninfluence lake steady-state d18O values. Over the first halfof the second simulation period (simulation years 125–175),lake volume decreased while the SA : V ratio varied onlyslightly, which in turn led to only a small change in thesteady-state summer average d18O value (Fig. 4). Not untilsimulation year 175, when lake volume decreased to theextent that the SA : V ratio value began to rapidly increase,
did the large increase in the steady-state CL summeraverage d18O value begin.
Additionally, for both CL and SL, a decrease inresidence time occurred in response to 50% increases anddecreases in mean-state precipitation. In both cases, thiscan be explained in part by the increase in the SA : V ratiowith both increasing and decreasing depth. As lake volumeincreases, surface area increases to a proportionally greaterextent, allowing greater volumetric loss through evapora-tion and a larger lake-volume–to–outflow ratio.
Hypothetical lake responses to combined mean-state andstochastic precipitation forcing—In the hypothetical CL2configuration, in which SA : V ratio values increased withincreasing depth above 12 m, mean-state precipitationincreases resulted in a decrease in steady-state d18O values,a response opposite that of the CL configuration under thesame precipitation-forcing scenario (Fig. 6). This oppositeresponse can again be explained by the interplay betweenSA : V ratio values and outseepage flux proportions. In theCL2 configuration, as lake volume increased, SA : V ratiovalues decreased rather than increased (as in the CLconfiguration), leading to a decrease in the proportion ofwater lost through evaporation. Summer average d18Ovalues therefore decreased in response to the decrease inevaporative enrichment and the consequent increase inwater lost through outseepage.
In the hypothetical SL2 configuration the outseepagerate was increased by a factor of three (i.e., from 0.007 to0.021) relative to the estimated value for Scanlon Lake.Consequently, the average summer d18O values prior tomean-state precipitation forcing were lower due to therelative decrease in the proportion of water lost throughevaporation (Fig. 7). Just as the small outseepage rate inthe SL simulations resulted in a minimal response to mean-state hydrologic forcing, the relatively large outseepage ratein the SL2 simulations resulted in a substantial isotopicresponse. This inference is supported by the large increasein summer average d18O values and in the evaporationoutflow proportion observed during the second and thirdsimulation periods (Table 1).
Lake responses to variance changes in stochasticprecipitation forcing—Hydrologic responses to changes instochastic precipitation were similar at CL and SL in thatan increase in the standard deviation of interannualprecipitation values led to an increase in average lakevolume (Table 1). This apparent steady-state hydrologicsensitivity to stochastic forcing can be explained bymechanisms controlling water delivery to the lake. Inaccordance with fundamental catchment hydrologic pro-cesses, the model calculates runoff on the basis of availablewater capacity (AWC) and the intra-annual water surplusesand deficits resulting from seasonal variability in precipi-tation and evapotranspiration. Specifically, when precipi-tation exceeds evapotranspiration, catchment AWC isreached (i.e., soils are saturated), and runoff to the lakeoccurs. Conversely, when precipitation does not exceedevapotranspiration, catchment AWC is not reached, andrunoff does not occur. One consequence of this simple
Climate effects on closed-basin lakes 2259

hydrologic process is a nonlinear relationship betweenprecipitation and runoff. For example, when soils aresaturated, increasing precipitation will result in increasingrunoff until precipitation rates decrease (or evapotranspi-ration rates increase) to a level at which soils are no longersaturated. At this point, further decreases in precipitationare irrelevant in determining the runoff rate, which remainszero until precipitation rates increase (or evapotranspira-tion rates decrease) to the point at which soils are againsaturated. Long-term average lake volume is thereforeinfluenced to a greater extent by the magnitude of positivehydrologic forcing (i.e., precipitation increases) than by themagnitude of negative hydrologic forcing, such thatincreases in the variance of stochastic forcing result inmore frequent high-volume precipitation and runoff eventsthat increase long-term lake volume.
Implications for paleoclimate studies—In the interpreta-tion of closed-basin lake sediment oxygen isotope records afrequent assumption is that long-term (century- to millen-nial-scale) increases in d18O values correspond to decreasesin effective moisture or precipitation–evaporation balance.The model simulations of stochastic and mean-stateprecipitation changes presented here demonstrate that thisassumption may not always be valid, as the interplaybetween outseepage rates and the effect of SA : V ratiochanges with depth on evaporative flux proportions caninfluence steady-state lake-water d18O values. Specifically, inlakes with appreciable outseepage rates (such as CL), theextent to which volumetric adjustments will affect evapora-tion and seepage outflow proportions is in part controlled bythe magnitude of the SA : V ratio change. Conversely, inlakes with minimal outseepage (such as SL), the SA : V ratiochanges that result from volumetric adjustments will notaffect steady-state water d18O values because evaporationoutflow proportions remain far greater than seepage outflowproportions (no matter the SA : V ratio). Simulation resultsadditionally demonstrate that variability in lake-water d18Ovalues is largely controlled by total lake volume and theconsequent percentage change in lake volume in response tostochastic variability in hydroclimate. The implications ofthis inference are twofold, in that given similar catchments,smaller (volumetrically) closed-basin lakes (e.g., SL) willexhibit a larger standard deviation of annual lake-waterd18O values than will volumetrically larger closed-basin lakes(e.g., CL), and that the standard deviation of annual d18Ovalues will increase as lake volume decreases and theconsequent percentage changes in lake volume increase inresponse to stochastic forcing (and vice versa). This latterimplication is especially relevant to paleoclimate studies, aschanges in the magnitude of closed-basin lake sediment-coreoxygen-isotopic variability may reflect past variations in themean state of hydroclimate and not stochastic variability.When mean-state climate changes are not applied, however,model simulations suggest that lake volumes are controlledlargely by stochastic variability, with greater variance inprecipitation resulting in greater average lake volume (andvice versa) (Figs. 8, 9; Table 1). Given large enough variancechanges and, as a consequence, significantly greater lakevolume, this relationship could result in a reduced lake-water
oxygen-isotopic response to stochastic forcing (see Lakeresponses to combined mean-state and stochastic precipita-tion forcing, above).
Given the observations and constraints described above,records of stochastic variability in hydroclimate should ideallybe generated from sedimentary deposits within closed-basinlakes with low outseepage rates, high SA : V ratios, and smallvolumes, all characteristics that lead to large, short-termpercentage volumetric changes and correspondingly largeisotopic responses. Conversely, mean-state changes in hydro-climate should be reconstructed using sediment records fromclosed-basin lakes with relatively high outseepage rates, largevolumes, and SA : V ratios that vary considerably withchanging lake level. In some cases, a lake may be useful forboth stochastic and mean-state hydroclimate analyses. CL,for example, has an outseepage rate high enough to causesubstantial responses to mean-state, hydroclimatic forcing aswell as a small enough volume and high enough SA : V ratio tostrongly respond to stochastic forcing.
In many cases, robust paleoclimatic reconstructions maynot be developed without isolating the individual compo-nents of hydroclimatic change (i.e., mean-state and stochas-tic variability) by coupling analyses from nearby closed-basin lakes with disparate morphologies, outseepage rates,and consequently varying responses to stochastic and mean-state hydrologic forcing. In the cases such as Scanlon Lakeand Castor Lake, which have differing morphologies andoutflow dynamics, analysis of sediment core d18O recordscan provide insight into past hydroclimatic conditions and,more importantly, into controlling synoptic-scale climatepatterns such as the Pacific Decadal Oscillation (generally,positive PDO phases generally correlate to drought in theColumbia River basin) (Mantua and Hare 2002; Gedalof etal. 2004; Knapp et al. 2004). This is only possible, however,when the hydrologic and isotopic responses of the analyzedlake systems to climate change are well understood.
AcknowledgmentsWe thank Nathan Stansell, Chris Helander, Jeremy Moberg,
Broxton Bird, and Jon Riedel for assistance in the field. We alsothank two anonymous reviewers for thoughtful remarks on themanuscript. This work was funded by National Science Founda-tion Earth System History program grant 0401948 and smallgrants from the Geological Society of America and the Universityof Pittsburgh’s Henry Leighton Memorial Scholarship andInternational Studies Fund.
References
ALMENDINGER, J. E. 1993. A groundwater model to explain pastlake levels at Parkers Prairie, Minnesota, USA. Holocene 3:105–115, doi:10.1177/095968369300300202
CROSS, S. L., P. A. BAKER, G. O. SELTZER, S. C. FRITZ, AND R. B.DUNBAR. 2001. Late quaternary climate and hydrology oftropical South America inferred from an isotopic andchemical model of Lake Titicaca, Bolivia and Peru. Quater-nary Res. 56: 1–9, doi:10.1006/qres.2001.2244
DONOVAN, J. J., A. J. SMITH, V. A. PANEK, D. R. ENGSTROM, AND
E. ITO. 2002. Climate-driven hydrologic transients in lakesediment records: calibration of groundwater conditions using20th century drought. Quat. Sci. Rev. 21: 605–624,doi:10.1016/S0277-3791(01)00042-7
2260 Steinman et al.

GAT, J. R. 1970. Environmental isotope balance of Lake Tiberias,p. 109–127. In Isotopes in hydrology. IAEA.
GEDALOF, Z., D. L. PETERSON, AND N. J. MANTUA. 2004. ColumbiaRiver flow and drought since 1750. J. Am. Water Resour. As.40: 1579–1592, doi:10.1111/j.1752-1688.2004.tb01607.x
HENDERSON, A. K., AND B. N. SHUMAN. 2009. Hydrogen andoxygen isotopic compositions of lake water in the westernUnited States. Geol. Soc. Am. Bull. 121: 1179–1189,doi:10.1130/B26441.1
JOHNSON, D. L., AND D. WATSON-STEGNER. 1987. Evolutionmodel of pedogenesis. Soil Sci. 143: 349–366, doi:10.1097/00010694-198705000-00005
JONES, M. D., M. J. LENG, N. ROBERTS, M. TURKES, AND R.MOYEED. 2005. A coupled calibration and modeling approachto the understanding of dry-land lake oxygen isotope records.J. Paleolimnol. 34: 391–411, doi:10.1007/s10933-005-6743-0
KATZ, R. W. 1996. Use of conditional stochastic models togenerate climate change scenarios. Climatic Change 32:237–255, doi:10.1007/BF00142464
KNAPP, P. A., P. T. SOULE, AND H. D. GRISSINO-MAYER. 2004.Occurrence of sustained droughts in the interior Pacificnorthwest (A.D. 1733–1980) inferred from tree-ring data. J.Climate. 17: 140–150, doi:10.1175/1520-0442(2004)017,0140:OOSDIT.2.0.CO;2
LENG, M., P. BARKER, P. GREENWOOD, N. ROBERTS, AND J. REED.2001. Oxygen isotope analysis of diatom silica and authigeniccalcite from Lake Pinarbasi, Turkey. J. Paleolimnol. 25:343–349, doi:10.1023/A:1011169832093
———, AND J. D. MARSHALL. 2004. Paleoclimate interpretation ofstable isotope data from lake sediment archives. QuaternarySci. Rev. 23: 811–831, doi:10.1016/j.quascirev.2003.06.012
MANTUA, N. J., AND S. R. HARE. 2002. The Pacific deca-dal oscillation. J. Oceanogr. 58: 33–44, doi:10.1023/A:1015820616384
MEARNS, L. O., C. ROSENZWEIG, AND R. GOLDBERG. 1997. Meanand variance change in climate scenarios: Methods, agricul-tural applications, and measures of uncertainty. ClimaticChange 35: 367–396, doi:10.1023/A:1005358130291
PHAM, S. V., P. R. LEAVITT, S. MCGOWAN, B. WISSEL, AND L. I.WASSENAAR. 2009. Spatial and temporal variability of prairielake hydrology as revealed using stable isotopes of hydrogenand oxygen. Limnol. Oceanogr. 54: 101–118.
PHILLIPS, J. D. 1993. Progressive and regressive pedogenesis andcomplex soil evolution. Quaternary Res. 40: 169–176,doi:10.1006/qres.1993.1069
RICHARDSON, C. W. 1981. Stochastic simulation of daily precip-itation, temperature, and solar radiation. Water Resourc.Res. 17: 182–190, doi:10.1029/WR017i001p00182
RICKETTS, R. D., AND T. C. JOHNSON. 1996. Climate change in theTurkana basin as deduced from a 4000-yr long d18O record.Earth Planet. Sc. Lett. 142: 7–17, doi:10.1016/0012-821X(96)00094-5
ROSENMEIER, M. F., M. BRENNER, D. A. HODELL, J. B. MARTIN,AND M. W. BINFORD. In press. Quantitative assessments ofHolocene environmental change in Peten, Guatemala: Pre-dictive models of catchment hydrology and lake-water d18Ovalues. Quaternary Res.
SHAPLEY, M. D., E. ITO, AND J. J. DONOVAN. 2008. Isotopicevolution and climate paleorecords: modeling boundaryeffects in groundwater-dominated lakes. J. Paleolimnol. 39:17–33, doi:10.1007/s10933-007-9092-3
SMITH, A. J., J. J. DONOVAN, E. ITO, AND D. R. ENGSTROM. 1997.Ground-water processes controlling a prairie lake’s responseto middle Holocene drought. Geology 25: 391–394,doi:10.1130/0091-7613(1997)025,0391:GWPCAP.2.3.CO;2
———, ———, ———, ———, AND V. A. PANEK. 2002. Climate-driven hydrologic transients in lake sediment records: multi-proxy record of mid-Holocene drought. Quat. Sci. Rev. 21:625–646, doi:10.1016/S0277-3791(01)00041-5
STEINMAN, B. A., M. F. ROSENMEIER, M. B. ABBOTT, AND D. J.BAIN. 2010. The isotopic and hydrologic response of small,closed-basin lakes to climate forcing from predictive models:application to paleoclimate studies in the upper ColumbiaRiver basin. Limnol. Oceanogr. 55: 2231–2245.
VASSILJEV, J. 1998. The simulated response of lakes to changes inannual and seasonal precipitation: implication for Holocenelake-level changes in northern Europe. Clim. Dynam. 14:791–801, doi:10.1007/s003820050255
Associate editor: Roland Psenner
Received: 31 December 2009Accepted: 31 May 2010Amended: 15 July 2010
Climate effects on closed-basin lakes 2261