Embed Size (px)
Citation preview

STEEL MARKET DEVELOPMENTS
Q4 2016
STEEL MARKET DEVELOPMENTS - Q4 2016
2
STEEL MARKET DEVELOPMENTS
Q4 2016
by Anthony de Carvalho and Filipe Silva
OECD, Paris
This document, as well as any data and any map included herein, are without prejudice to the status of or sovereignty over any territory, to the delimitation of international frontiers and boundaries and to the name of any territory, city or area.
Note for Israel The statistical data for Israel are supplied by and under the responsibility of the relevant Israeli authorities. The use of such data by the OECD is without prejudice to the status of the Golan Heights, East Jerusalem and Israeli settlements in the West Bank under the terms of international law.
© OECD/OCDE, 2017 Cover photo: courtesy of JFE Steel Corporation
Applications for permission to reproduce or translate all or part of this material should be made to: OECD Publications, 2 rue André-Pascal, 75775 Paris, Cedex 16, France; e-mail: [email protected]

STEEL MARKET DEVELOPMENTS - Q4 2016
3
FOREWORD
This document provides a short overview of recent steel market developments. The OECD Steel Committee discussed a draft of the report at its meeting on 8 September 2016 and has approved it for declassification following comments from delegates. The report will be made available on the Steel Committee website: oe.cd/stlmktdev and is available on OLIS under the reference code: DSTI/SU/SC(2016)3/FINAL.

STEEL MARKET DEVELOPMENTS - Q4 2016
4
TABLE OF CONTENTS
RECENT MARKET DEVELOPMENTS IN THE GLOBAL STEEL INDUSTRY ...................................... 5
Summary ...................................................................................................................................................... 5 Recent developments ................................................................................................................................... 6
The economic outlook remains weak ....................................................................................................... 6 Steel market sentiment ............................................................................................................................. 8 Steel consumption .................................................................................................................................. 10 Steel production ...................................................................................................................................... 13 World steel trade .................................................................................................................................... 14 Steel prices ............................................................................................................................................. 16 Steelmaking costs and raw material market developments .................................................................... 17 Financial performance ............................................................................................................................ 24
The steel market outlook ............................................................................................................................ 29 Concluding remarks ................................................................................................................................... 31
ANNEX: FINANCIAL DATA ..................................................................................................................... 32
ENDNOTES .................................................................................................................................................. 32 Tables
Table 1. OECD Economic Projections, June 2016 ................................................................................ 8 Table 2. World crude steel production developments in 2016 ............................................................ 14 Table 3. Steel export developments in 2016 (annualised to latest month available in 2016) .............. 16 Table 4. Latest forecasts for regional apparent steel use by the World Steel Association .................. 30
Figures
Figure 1. World industrial production, trade, and trade prices ............................................................... 6 Figure 2. Steel Purchasing Managers’ indices (PMIs) ............................................................................ 9 Figure 3. TSI survey of steel demand expectations (next three months) .............................................. 10 Figure 4. Consumption of hot-rolled steel products, major economies ................................................ 11 Figure 5. Value added by sector, China ................................................................................................ 12 Figure 6. World exports of steel: monthly volume (mmt) and export ratio (% of production) ............ 15 Figure 7. World steel prices (latest month November 2015) ................................................................ 17 Figure 8. Key raw material price indicators .......................................................................................... 18 Figure 9. The global iron ore market: production, consumption and trade by major economies ......... 19 Figure 10. Iron ore prices: selected grades ......................................................................................... 20 Figure 11. The global metallurgical coal market: production, consumption and trade by major economies 21 Figure 12. Coking coal prices ............................................................................................................. 22 Figure 13. Ferrous scrap prices ........................................................................................................... 23 Figure 14. Margin between steel and raw materials prices ................................................................. 24 Figure 15. Evolution of operating profits between 2000 and 2015 ..................................................... 25 Figure 16. Evolution of net profits between 2000 and 2015 ............................................................... 26 Figure 17. Distribution of net profits in selected years ....................................................................... 27 Figure 18. Evolution of indebtedness between 2000 and 2015 .......................................................... 28 Figure 19. Announcements of closures, production cutbacks and layoffs .......................................... 29

STEEL MARKET DEVELOPMENTS - Q4 2016
5
RECENT MARKET DEVELOPMENTS IN THE GLOBAL STEEL INDUSTRY
Summary
Steel market conditions have improved slightly in some regions, but crisis conditions continue to prevail in some economies. It is uncertain whether the positive momentum observed earlier this year is robust and sustainable. Significant headwinds related to financial vulnerabilities and unaddressed overcapacity cloud the outlook. This document provides a short overview of recent market developments and provides detailed information about steelmaking raw material markets and financial vulnerabilities in the steel sector. Some key developments discussed in this report include:
− The economic outlook remains weak and OECD forecasts have been revised down since November 2015. However, the forecasts suggest a gradual improvement in world economic growth in the near term.
− Steel market sentiment is still bearish, but has improved slightly during the first half of 2016, amid an upturn in steel demand and prices.
− Monthly steel consumption figures have rapidly decreased in some major steel-consuming economies during the course of 2015. Demand for steel products has shown tentative signs of recovery in a few economies in the beginning of 2016.
− Growth in world crude steel production has decelerated significantly in the past three years. World steel production continued to decline sharply during the first months of 2016, but since then the rate of decline has diminished. In July 2016, world production registered an increase in year-on-year terms.
− After a surge in exports during 2015, steel export volumes have gradually started to adjust downwards. Trade measures may have started to have an effect on the import volumes in certain economies while in others imports continue to rise.
− Steel prices responded positively to the modest upturn in steel demand during the first half of 2016, even in a context of ample supply. The world steel price index, which had been trending downwards since the second quarter of 2011, bottomed out in December 2015 and has been recovering since then.
− Prices of key steelmaking raw materials fell sharply in 2015, but began to stabilise in the beginning of 2016. Since then, prices have shown significant monthly gains, though scrap prices have receded again recently.
− The financial situation in the steel sector is very fragile. Large liabilities have been weighing on steelmakers' balance sheets, reducing their margin of manoeuvre to restructure as needed. Continued subdued financial performance in a context of already very fragile balance sheets pose serious risks to the steel sector and could affect other parts of the economy.

STEEL MARKET DEVELOPMENTS - Q4 2016
6
− The three-year period from 2015 to 2017 is expected to be characterised by a gradual bottoming out of global steel demand growth, according to the World Steel Association's October 2016 Short Range Outlook. World steel demand is projected to start recovering already in 2016 by 0.2% followed by 0.5% in 2017.
Recent developments
The economic outlook remains weak
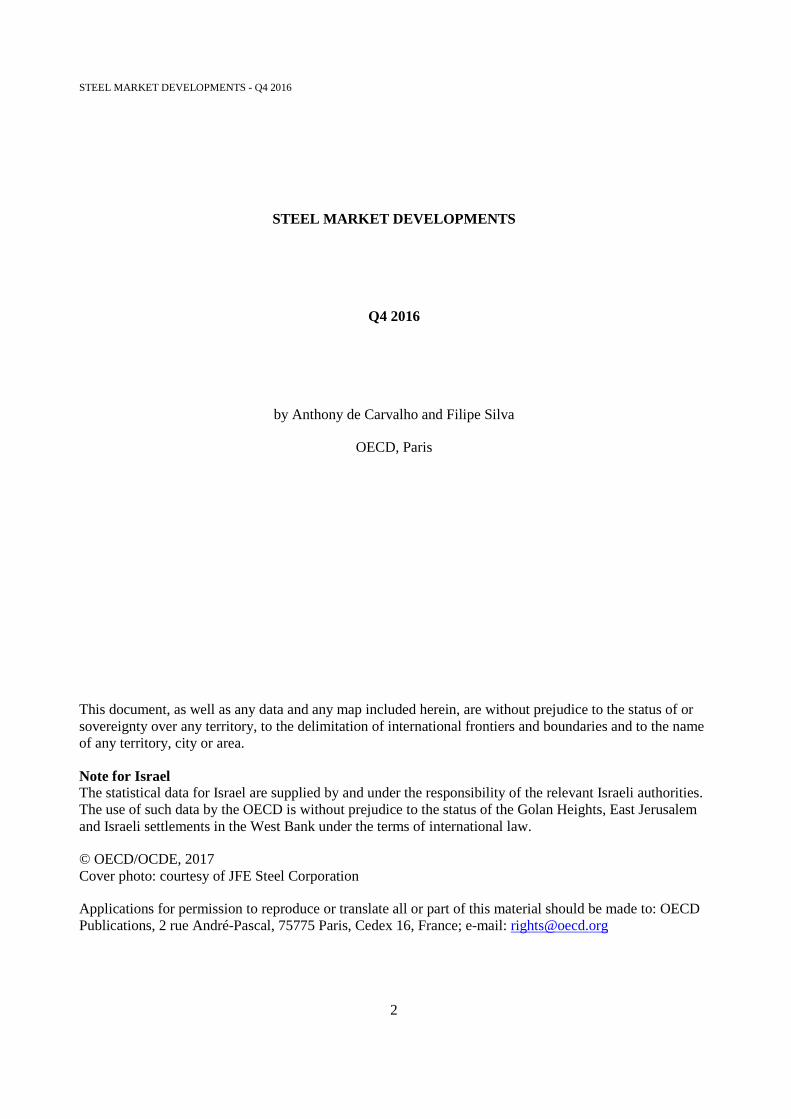
Recent months have been characterized by subdued domestic demand and productivity growth in advanced economies amid a further growth slowdown in many emerging economies. Commodity prices have stabilized and financial market sentiment has slightly improved after considerable volatility earlier in the year. World industrial production has been driven mostly by advanced economies in recent months, whereas the economic slowdown in emerging economies has weighed on industrial production growth as well as on global trade (Figure 1). According to the OECD’s latest Economic Outlook (released on 1 June 2016), world GDP growth is projected to remain weak, despite a gradual improvement in 2017 to 3.3%, from a rate of 3% in 2016. The forecasts for global growth were revised downwards compared to the projections made in November 2015. At that time, world GDP growth was forecast at 3.3% in 2016 and 3.6% in 2017. (See Table 1 below for the latest GDP growth forecasts.)
Figure 1. World industrial production, trade, and trade prices
% change from one year earlier
Source: Netherlands Bureau for Economic Policy Analysis (CPB).
In the euro area, the ongoing moderate recovery is projected to continue, with GDP growth reaching 1.6% in 2016 and 1.7% in 2017. Growth in the region is being supported by accommodative monetary policy and low oil prices, but being partially offset by the effects of the slowdown in emerging economies. After a robust first quarter of 2016, GDP growth will gradually improve throughout 2016 and 2017. Industrial production growth has moderated somewhat in recent months. Investment growth is being held back by global headwinds and economic and political uncertainties.
In the U.S., total output remains on a moderate growth trajectory sustained by gains in employment, income and household spending, despite an expected slowdown of economic activity during 2016 reflecting transitory downward pressures on domestic demand and net exports. Growth in the first quarter of 2016 has been weak (0.8% on annualized basis), but is expected to recover to above 2% in the second quarter of the year. GDP is forecast to grow slowly from 1.8% in 2016 to 2.2% in 2017, after having grown
-20
-15
-10
-5
0
5
10
15
20
%Industrial production (3 month moving average )
World Advanced economies Emerging & Developing economies
-25
-20
-15
-10
-5
0
5
10
15
20
25
%World trade and unit price in USD (3 month average )
World trade Trade prices (unit value in USD)

STEEL MARKET DEVELOPMENTS - Q4 2016
7
at a rate of 2.4% in 2015. Industrial production declined sharply during the last months of 2015, but the rate of decline has moderated during the first half of 2016, from -1.3% in January to -0.7% in June, year-on-year. Employment growth is forecast to slow from 2.1% in 2015 and 2016 to 1.5% during 2017, but with the unemployment rate falling below 5%.
In Japan, economic growth remains sluggish reflecting the slowdown in demand from the People's Republic of China (hereafter “China”) and other Asian economies and weak private consumption. After a contraction of 1.8% during the last quarter of 2015 (q-o-q, annual rate), the Japanese economy was expected to grow at a rate of 1.7% and 1% during the first and second quarters of 2016, respectively. The OECD forecasts point to a deceleration in GDP growth from 0.7% in 2016 to 0.4% in 2017, with the effects of the planned consumption tax hike being partially offset by a pick-up in exports (export growth should accelerate to 3.6% in 2017 compared to 1.1% in 2016). Despite a decline in industrial production during the first and second quarters of 2016, business investment is expected to increase, supported by large corporate profits (and cash holdings) and the corporate tax cut.
In emerging economies, economic performance is expected to vary widely reflecting countries' exposure to commodity markets and prices, progress with the implementation of structural reforms, the extent of financial vulnerabilities, and differences in policy support. In China, real GDP growth slowed to 6.7% y-o-y in the first quarter of 2016, down marginally from 6.8% in the fourth quarter of 2015. Economic growth is expected to continue to moderate slowly as the economy rebalances from manufacturing to services. The OECD projections for Chinese GDP growth have been revised down in the latest Economic Outlook of June 2016, from 6.8% to 6.5% in 2016. The OECD forecasts that economic growth will gradually decline to 6.2% in 2017. The economy has benefited from fiscal policy measures introduced during the beginning of 2016 to stimulate infrastructure and real estate investment, even though such policies may have implications for the rebalancing process as well as add to growing concerns with respect to financial tensions. Industrial production growth in China has remained broadly stable during the first half of 2016 at around 6%. According to the Chinese National Bureau of Statistics, growth eased somewhat in year-on-year terms to 6.0% in July from 6.2% in June. These data could suggest weaker investment momentum going into the second half of 2016 as the effects of strong public spending in the first half of the year start to fade.
In India, economic growth is projected to remain strong. The OECD forecasts point to GDP growth rates of 7.4% in 2016 and 7.5% in 2017, supported by a large planned increase in public spending. On the other hand, the Russian economy is not expected to return to positive growth (in annual terms) until 2017, as a result of low commodity prices. Russian GDP is forecast to grow by 0.5% in 2017, after declining by 1.7% in 2016. The recession is expected to continue in Brazil, where GDP is forecast to decrease by 4.3% in 2016, easing off to a 1.7% reduction by 2017. The economy also faces commodity-related challenges that add to the high political uncertainty, reducing the chances for noticeable momentum on policy reforms in the near term.
STEEL MARKET DEVELOPMENTS - Q4 2016
8
Table 1. OECD Economic Projections, June 2016
Real GDP growth (year-on-year)
Notes: 1. Moving nominal GDP weights using purchasing power parities. 2. Fiscal years starting in April. Source: OECD Economic Outlook, June 2016.
Steel market sentiment
Steel market sentiment has improved slightly during the first half of 2016 amid an upturn in steel prices, but this could prove temporary given the unaddressed underlying structural balances and subdued demand. One indicator of general sentiment is the global Steel Purchasing Managers’ Index (PMI), compiled monthly by Markit Economics. The index has been gradually increasing since August 2015 but is still below the threshold reading of 50 (that separates contraction from expansion). In June 2016, it edged up to 49.8 (Figure 2). Market sentiment has been stronger in the U.S. and Europe, however with considerable volatility in the indices. Steel market sentiment remains weaker in Asia, with a PMI reading of 49.5 points in June 2016.
2015 2016 2017
World 1 3.0 3.0 3.3United States 2.4 1.8 2.2Euro area 1.6 1.6 1.7
Germany 1.4 1.6 1.7France 1.2 1.4 1.5Italy 0.6 1.0 1.4Spain 3.2 2.8 2.3
Japan 0.6 0.7 0.4United Kingdom 2.3 1.7 2.0Mexico 2.5 2.6 3.0Korea 2.6 2.7 3.0Canada 1.2 1.7 2.2Turkey 4.0 3.9 3.7Australia 2.5 2.6 2.9China 6.9 6.5 6.2India 2 7.4 7.4 7.5Russia -3.7 -1.7 0.5Brazil -3.9 -4.3 -1.7Indonesia 4.8 5.2 5.9South Africa 1.3 0.7 1.4OECD 1 2.1 1.8 2.1Non-OECD 1 3.7 3.9 4.4World real trade growth 2.6 2.1 3.2

STEEL MARKET DEVELOPMENTS - Q4 2016
9
Figure 2. Steel Purchasing Managers’ indices (PMIs)
Trend
Source: Markit Economics.
Other indicators of market sentiment include the TSI survey of steel demand expectations. The survey asks industry participants to assess changes in steel demand in their regions over the next three months. Figure 3 displays the survey results as of 29 June 2016. They indicate that expectations are currently quite negative, with the 72% of respondents expecting steel demand to remain unchanged or to decline and 45% of the respondents expecting steel prices to decline. The reading from 29 June suggests that more than 70% of respondents expected Asian demand to contract in the following three months, while in Europe and North America most respondents expect demand to remain unchanged.
35
40
45
50
55
60Global Steel PMI
30
35
40
45
50
55
60
Steel PMIs by selected economies
Europe US Asia

STEEL MARKET DEVELOPMENTS - Q4 2016
10
Figure 3. TSI survey of steel demand expectations (next three months)
as of 29 June 2016
Source: Platts McGraw Hill Financial.
Steel consumption
After the sharp decline seen throughout 2015, demand for steel products has shown tentative signs of recovery during the first half of 2016. Year-on-year steel consumption growth figures have rebounded to positive terrain during the early months of 2016. Figure 4 presents the year-on-year per cent change in the combined consumption of hot-rolled products for eight of the world’s largest steel-consuming economies in Asia, the CIS region, Europe, North America, and South America, which together account for approximately 72% of global steel demand.1 In the first three months of this year, the monthly consumption indicator for the major steel-consuming economies has shown a modest improvement in growth, from an average of -4.7% in 2015 to -2.5% in January 2016, and with growth becoming positive in February and March at 0.8 and 0.5%, respectively. This brings the combined annualized level of consumption in these economies to 1.18 billion tonnes in the first quarter of 2016. However, it is still early to say whether demand has bottomed out and growth will be sustained, notably if the temporary nature of
0 20 40 60 80 100
North America
Europe
Asia
Global
% of respondents
Steel demand expectations
Decrease No change Increase
0 20 40 60 80 100
North America
Europe
Asia
Global
% of respondents
Steel price expectations
Decrease No change Increase

STEEL MARKET DEVELOPMENTS - Q4 2016
11
the stimulus measures introduced in China earlier this year and the subdued global macroeconomic outlook are taken into consideration.
Figure 4. Consumption of hot-rolled steel products, major economies
Year-on-year % changes
Note: Combined consumption of the following economies: Brazil, China, Germany, India, Japan, Korea, Russia and the United States. Consumption of hot-rolled products defined as the sum of production and net imports. Source: ISSB.
The modest upturn in demand observed in the beginning of 2016 was not felt in all the selected major steel-consuming economies. The steel demand upturn in China reflects temporary measures to stimulate aggregate demand, more specifically the real estate market, as well as restocking of steel inventories. Data from the National Bureau of Statistics of China indicates that the value of sales of rolled steel contracted during the four previous quarters up to June 2016, on a y-o-y basis. Chinese steel demand continues to be affected by the ongoing economic rebalancing process that is taking place.
The economic rebalancing is seen in the decoupling of China’s steel demand from GDP growth, and in the diminishing role of industrial activity relative to services. Figure 5 shows that the services sector overtook industry as the major driver of economic growth around 2012, and its share of GDP has continued to increase since then.
-10%
-8%
-6%
-4%
-2%
0%
2%
4%
6%

STEEL MARKET DEVELOPMENTS - Q4 2016
12
Figure 5. Value added by sector, China
Annual data, % of GDP Quarterly data, year-on-year changes
Source: National Bureau of Statistics of China and OECD calculations.
Several emerging economies are experiencing very difficult market conditions. In Brazil, the steel sector is facing a very severe crisis, with crude steel production, domestic steel sales and apparent consumption all down sharply in the first months of this year. The Brazilian Steel Institute recently indicated that it expects apparent steel consumption to contract by 14.4% in 2016, bringing the level of consumption back to where it was in 2006. The steel crisis in Brazil is the result of cyclical factors - due to weak demand for steel in the automotive, civil engineering and machinery sectors - as well as structural factors related to the sector's loss of competitiveness. South America's second largest steel producer, Argentina, is also adjusting to difficult market conditions, as automotive production slumps and construction activity increases slowly. Low oil prices that negatively impact oil exploration have also had a significant impact on domestic pipe and tube producers. Overall, the country's steel sector has seen crude steel output fall by nearly 16% in the first seven months of 2016, in year-on-year terms, and producers operating at very low rates of capacity utilization.
In the CIS region, Russian apparent demand for finished steel products fell by 8.4% in 2015, in response to the economic recession. Weak construction activity, which accounts for around two-thirds of steel consumption in Russia, and declining automotive production are weighing heavily on steel demand. In the first six months of this year, passenger car production declined by 18%, according to the Federal Statistics Service. Following several years of falling new car sales in Russia, automotive manufacturers are now looking to expand exports to markets outside of the CIS region. The rouble's depreciation last year and in the beginning of 2016 has helped support Russian exports and may be preventing a steeper decline in production, but high inflation rates in the country are having offsetting effects on price competitiveness. Indeed, crude steel production in Russia continued its gradual decline in the first seven months of 2016.
India, on the other hand, has better steel consumption prospects compared to other major emerging market economies. Expectations of consumption growth are still optimistic, in view of the ongoing economic reform process, infrastructure development, the implementation of “Make in India”, and smart city initiatives. However, recent demand developments have disappointed as the reforms and infrastructure investment are still lagging. This adds to the financial challenges faced by domestic producers.
Across the OECD, steel demand developments have varied, though there have been important improvements in some economies. For example, in the EU, apparent steel consumption increased by 3.1% in the first quarter of 2016, supported by growth in business activity in downstream industries, particularly the automotive sector. However, much of the apparent consumption growth in the EU was explained by import growth. Turkey remains the most vibrant steel market within the OECD, despite the recent political
0%
10%
20%
30%
40%
50%
60%
70%
80%
90%
100%
Primary Scondary Tertiary
0%
2%
4%
6%
8%
10%
12%
14%
16%
GDP Primary Secondary Tertiary

STEEL MARKET DEVELOPMENTS - Q4 2016
13
instability. The Turkish Steel Producers' Association has indicated that Turkey's consumption of steel end-products increased by 5.2% in the first seven months of 2016, climbing to 20.8 million tonnes from 19.8 million tonnes in the corresponding time period of 2015. In the United States, steel demand appeared to be in decline in the first months of the year. However, increases in domestic prices, and some upward tendency in production, capacity utilization rates and profit margins in the beginning of the year, albeit from very low levels, have provided some relief to producers. In Japan, declining industrial production, falling housing starts and sluggish private consumption in the beginning of the year are likely to have dampened steel demand developments. Indeed, monthly indicators of Japanese consumption of hot-rolled products declined by 5.7% in the first quarter of 2016, in year-on-year terms. Steel demand prospects for the second and third quarters, as reported by the Ministry of Economy, Trade and Industry, point to continued demand weakness in year-on-year terms.2 Korea, which experienced an increase in finished steel demand in 2015 to 56 million tonnes, is facing challenges as domestic demand begins to wane and exports decline.
Steel production
Growth in world crude steel production has decelerated significantly in the past three years. Following growth of 5.8% in 2013 (to 1.65 billion tonnes), production growth slowed to 1.2% in 2014 and then fell by 2.9% in 2015 to 1.62 billion tonnes, thus contracting for the first time since the financial crisis. World steel production continued to decline sharply during the first two months of 2016, doing so by 5.2% year-on-year, but then a sharp improvement in March led to a near-stabilization in the production level from a year earlier. In April, May and June, the year-on-year world production declines gradually diminished, and by July 2016 positive growth of 1.4%. The gradual improvement means that world production for the first seven months of this year is only 1.2% below the January-July 2015 level (Table 2).3
The production performance so far this year has been diverse across the different regions of the world. North American production has declined by 0.2%, with positive growth in Canada, partially offsetting falling production in Mexico and the United States.
Production in the EU has fallen by 5.8% so far in 2016 (y-o-y), mainly due to output declines in several of the largest producers in the region including the UK, France Poland, Spain and Germany due to disruptions at steel mills. Steel output in the UK declined by a steep 36.4% in 2016, reflecting the challenges for steelmakers in the country amid considerable political, economic as well as steel-specific uncertainties. Output declined by 12.7% in Poland and is down by 10.6% in France, 8% in Spain and 2% in Italy. The Italian steel industry has recovered from the recession in 2016, with steel output increasing by 3.9% in 2016. French output fell by 7.2% in 2015.
The so-called Other Europe region and the CIS economies have now started to recover, with Turkish steel output up by 3.6% and Ukrainian production up 10.3% so far in 2016. In Turkey, increases in domestic demand continue to be met by foreign supply, to a large extent. With exports facing greater competition on world markets, Turkey is moving towards becoming a net importer of steel. Ukrainian production continues to suffer from the instability in the country, as well as infrastructure damage in the eastern part of the country and difficult economic conditions, but production has started to recover amid additional security spending and improved access to steelmaking raw materials. Russian output has however also declined so far in the year albeit only slightly (0.8%), reflecting weak internal demand.
In Asia, production is in decline in most of the region’s economies, although at a slower pace than in 2015. Overall, Output contracted by 0.3% during the first half of 2016, with Chinese production contracting by 0.5%, Japan by -0.8%, South Korea by 2.7% and Chinese Taipei by 4.5%. India continues to be the bright spot amongst major Asian steel producers, growing at a rate of 4.8% so far this year.

STEEL MARKET DEVELOPMENTS - Q4 2016
14
Despite the mild decline in output during the first half of 2016, Chinese production has outperformed expectations in recent months (since March) and steel markets are welcoming the strong increase in domestic steel prices in China. A number of mothballed facilities have restarted production in response to the positive price signals.
In South America, the industry continues in recession, with the two largest producing economies, Brazil and Argentina, experiencing substantial production decreases amounting to 12% and 15.7%, respectively, so far in 2016. In Brazil, considerable domestic demand downturn, has led to production cuts, amid political uncertainties and the deep economic recession. A number of temporary and foreseen permanent capacity closures have occurred in Brazil as low market prices have depressed the industry’s profitability. Like other parts of the world, South American steel producers continue to adjust to greater import competition. The region overall has registered a decline of 13.3% in steel production during the first six months of 2016. However there are some bright spots amongst smaller steel producing economies, such as Colombia and Chile that have seen their steel output increase by more than 9% during 2016.
In the Middle East, production declined during the first seven months of 2016. The decline was across the board, with the exception of Iran (4.7% annualised growth rate). Vulnerabilities related to the oil market downturn still affect steel demand and production via lowered income growth and demand for pipes and tubes. Saudi Arabia, United Arab Emirates and Qatar all have been facing output declines so far in the year. Declining oil revenues have also translated into reduced government expenditure on construction projects in some countries, which had been a major driver of steel demand in recent years.
African steel production in the first 6 months of 2016 has been contracted considerably, owing to the .production decline in in South Africa in the last few months (9.1%, amid very uncertain conditions and plant closures) and decline in Egypt (26.7%). In South Africa, the local industry is facing very uncertain conditions and possible plant closures. Energy shortages and political disturbances are contributing to production declines in northern Africa, with Egypt facing additional challenges in the currency market.
Table 2. World crude steel production developments in 2016
Source: World Steel Association.
World steel trade
After a surge in exports during 2015, steel export volumes have gradually started to adjust. Monthly data from ISSB, taking into account internal EU and other inter-regional trade, point to global steel exports of 382 thousand tonnes, annualized, during the first five months of 2016, down from 452 thousand tonnes
% change, year-on-yearJuly 2016 2015 July 2016 2015 Jan-Jul 2016 / 2015
EU 12,986 166,090 -10.7 -1.9 -5.8Other Europe 2,881 33,991 -4.8 -6.1 3.4CIS 8,772 101,353 5.4 -4.3 1.1North America 9,722 110,668 1.6 -8.7 -0.2South America 3,444 43,895 -7.1 -2.5 -13.3Africa 936 13,988 -7.4 -1.8 -15.6Middle East 2,232 26,938 -9.4 -3.9 -3.2Asia, of which: 92,244 1,096,163 -1.0 -2.2 -0.3
China 66,807 803,825 -3.1 -2.3 -0.5Oceania 526 5,717 9.2 4.6 -1.9World 133,742 1,598,804 -1.9 -2.9 -1.2
% change, year-on-yearLevel, thousand mmt
STEEL MARKET DEVELOPMENTS - Q4 2016
15
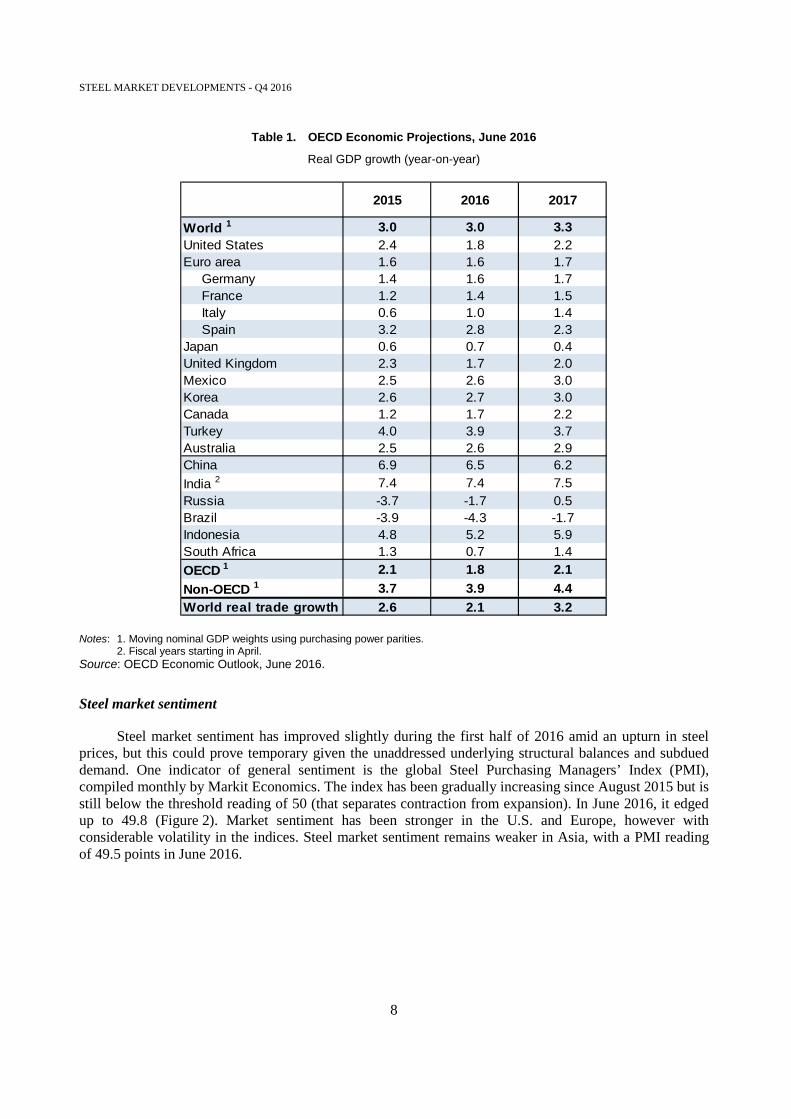
in 2015. The world steel export ratio, i.e. exports as a share of production, has remained relatively stable at around 28-29% during the early months of 2016 (Figure 6, Panel A). Excluding intra-EU trade, the overall trends are roughly similar, with total exports contracting 11% in January-May 2016, in year-on-year terms, and a decrease in the world export ratio from around 23% in early May 2015 to 14% in May 2015 (Figure 6, Panel B).
Figure 6. World exports of steel: monthly volume (mmt) and export ratio (% of production)
(3-month moving averages)
Including intra-EU trade Excluding intra-EU trade
Source: OECD calculations based on data from ISSB.
Table 3 presents export developments during 2016 in the six largest steel-exporting economies. The latest month for which trade data are available varies across economies, ranging from March to April 2015. After reaching a record high of 110.9 mmt in 2015, China has seen its exports of steel products decline by roughly 1 mmt during the first half of 2016, in annualized terms. Chinese exports to Asian and Middle-East economies are up significantly this year, in contrast with a decline of steel volumes exported to other regions and economies, notably NAFTA and Brazil. While Japanese exports have shown some modest signs of recovery earlier this year, growing at an annualized rate of 0.1%, Ukrainian steel exports increased significantly to 18.8 mmt or 6.2%, but are still below the levels of 2013 (24.6 mmt), before the conflict. Korea and the EU have seen their annualised export volumes decline by 4.1% and 15.1% respectively. A contraction in exports to Brazil and loss of market in the Middle East underline the reduction in Korean exports, while in the case of the EU, exports fell to all major destinations.
In the context of weak domestic demand conditions, export developments seem to continue to result in additional trade cases in recent months, in many economies and regions around the world [DSTI/SU/SC(2016)4]. Trade measures may have started to have an effect on the import volumes of certain economies while in others imports continue on the rise — e.g., in NAFTA imports declined about 32% in January-May 2016, year-on-year and in South America 18% in January-March); and in Asia excluding China imports stabilized while they kept increasing in the EU (22.9% in January-April) although slowing down in the months up to April 2016.
20.0%
24.0%
28.0%
32.0%
32
34
36
38
40
42
Exports, mmt (left scale) Exports/production, % (right scale)
mmt
20.0%
21.0%
22.0%
23.0%
24.0%
25.0%
26.0%
23
25
27
29
31
Exports, mmt (left scale) Exports/production, % (right scale)
mmt

STEEL MARKET DEVELOPMENTS - Q4 2016
16
Table 3. Steel export developments in 2016 (annualised to latest month available in 2016)
Largest steel exporting economies, thousands of metric tonnes
Note: The definition of steel used in this table is HS 7206 to 7302, 7304-7306, and 7307.21-7307.99 excluding some forgings (7326.19), points and switches/crossings (7302.30 and 7302.90), some forged cold finished sections (7216.69 and 7216.99), some cold formed sections (7216.61 and 7216.91), welded shapes and sections (7301.20) and steel castings (7325.99). This definition differs somewhat from the total steel exports figures provided by ISSB in Figure 6 above. Source: OECD calculations based on data from ISSB.
Steel prices
The modest uptake in steel demand during the first half of 2016 has seen prices respond rapidly, even in a context of ample supply. The world steel price index,4 which had been trending downwards since the second quarter of 2011, reached a floor during December 2015 and has been recovering since then to levels close to 170 during Q2 2016. World hot-rolled coil (HRC) prices have increased by 36% and rebar prices 19% from their levels at the beginning of 2016. In June 2016, the world average HRC price stood at USD 449 (up from USD 329 in January 2016) and the world rebar price at USD 442 per tonne (up from USD 370 in January 2016). However, it is important to note that June prices remain below those registered during the recent financial crisis (Figure 7).
Exporter 20152016
annualised (latest month)
Change(2016/2015)
Change(2016/2015)
%
China (May) 110,928 109,852 -1,076 -1.0
Japan (May) 40,720 40,747 26 0.1
EU, ecternal trade (Mar) 32,998 28,010 -4,988 -15.1
Korea (May) 31,077 29,817 -1,260 -4.1
Russia (Apr) 29,605 29,509 -96 -0.3
Ukraine (Mar) 17,705 18,802 1,097 6.2

STEEL MARKET DEVELOPMENTS - Q4 2016
17
Figure 7. World steel prices (latest month November 2015)
Source: Platts Steel Business Briefing.
Steelmaking costs and raw material market developments
Prices of key steelmaking raw materials have declined over the past several years, helping to bring steel production costs down significantly (Figure 8). However, prices stabilized in the beginning of 2016, and have since shown significant monthly gains. The iron ore market has been in oversupply, reflecting reduced demand due to subdued world production of steel and supply increases particularly from Australia. Iron ore prices, spot and contract, in the first eight months of 2016 were still down some 9% or more compared to the same period in 2015, but have increased from the lows seen at the start of this year. For example, the spot price of 62% Fe fines has bounced back to USD 60 in August 2016, up from a level of USD 41 in January 2016. The coking coal market has recovered rapidly, and prices are currently at their highest level this year. Seaborne spot prices of coking coal increased by almost 16% in August 2016 and more recently by 68% in September, month-on-month, bringing the price to USD 182, a level that is about 133% higher than in the beginning of the year. Scrap prices increased sharply in March, April and May of this year, but have since receded. During the first nine months of 2016, a number of scrap reference prices were down by 11%-18% from their average levels during the first nine months of 2015. The latest reading for scrap prices in September indicate a level of USD 200 per tonne, FOB Chicago, and USD 198 per tonne, FOB Rotterdam, both for the same quality (#1 HMS).
300
400
500
600
700
800
900
1000
1100
1200
0
50
100
150
200
250
300
350
400
450USD/tonne
World steel price index (LHS)HRC world price (RHS)Rebar world price (RHS)

STEEL MARKET DEVELOPMENTS - Q4 2016
18
Figure 8. Key raw material price indicators
Source: Commodity Research Unit.
Iron ore market developments
In the last few years, the world's iron ore market has been characterized by slower growth, lower prices, and tighter margins for mining companies. The main factor contributing to this development has been a slowdown in the growth of world demand for iron ore, in line with a decline in pig iron production in many regions of the world. Global pig iron production, which can serve as a good proxy for iron ore use, declined from 1,188 million metric tonnes (mmt) in 2014 to 1156 mmt in 2015, a decline of 2.8%. China's pig iron production, accounting for approximately 60% of the world's total, declined by an even steeper 3.5% in 2015.
Supply developments have also contributed to an easing of the iron ore market balance, though trends have differed significantly across economies. Production has increased most notably in Australia, the world's largest producing country, doing so by 7% in 2015 following an expansion of nearly 22% in 2014. Production in the other main producing economy, Brazil, has increased moderately, at a pace of 4.3% in 2014 and almost 6% 2015. Iron ore production has been declining elsewhere, for example in China, India, South Africa and Canada. China, the world's third largest producer, has experienced sharp declines in iron ore production in the past few years, reflecting a number of mine closures. India's iron ore output is down considerably compared to its 2009 peak, but the trend seems to be turning, with a number of iron ore mines having reopened in India in the first half of 2016 after years of suspension. Indeed, in the first quarter of 2016, Indian production increased by 13.5%. In Africa, iron production declined slightly in South Africa in 2015, but significantly so in Sierra Leone as some of the biggest producers ceased operations there.
Turning to trade developments, seaborne iron ore trade increased slightly in 2015, supported mostly by growth in Chinese imports and, to much lesser extent, Korean imports. Many iron ore mines in China have declining ore grades and are uncompetitive relative to lower-cost imports (Resources and Energy Quarterly, June 2016). Quality-adjusted production is declining significantly in China, which may continue to support imports in the future. Another noticeable trend in recent years has been the sharp decline in Indian exports of iron ore, from a level above 36.5 mmt in 2012 to 3.4 mmt in 2015. However, with recent
0
100
200
300
400
500
600
700
800USD/tonne
Iron ore Fines, 62% Fe, SPOT, CFRChinaHard coking coal spot, FOB Australia
Scrap, #1 HMS, FOB Rotterdam

STEEL MARKET DEVELOPMENTS - Q4 2016
19
steps to remove duties on exports of iron ore, outward shipments are now beginning to increase. In the first quarter of 2016, Indian exports of fines more than doubled from year-ago levels.
Figure 9. The global iron ore market: production, consumption and trade by major economies
Source: Commodity Research Unit.
Reflecting the weakening iron ore demand situation, spot prices of iron ore fell to around USD 40 per tonne in the beginning of 2016, reaching their lowest levels in about a decade. As noted above, since the beginning of this year, prices for a number of grades have been rising particularly for lump iron ore from Australia (see Figure 10). The rise in prices has been supported by steel production gains in China, which has prompted iron ore buying and inventory restocking amongst some steel mills. The price of higher-grade iron ore fines are now at levels of USD 56 or above (September 2016) while lumps are at levels above USD 68 per tonne, slightly higher than year-ago levels observed in September 2015. Market observers note that, in response to slightly better profitability conditions that are prompting steel mills to use more productive materials in their blast furnaces, price differentials have widening in favour of the higher-grade iron ore raw materials in recent weeks.
0
50
100
150
200
250
2014Q1
2014Q2
2014Q3
2014Q4
2015Q1
2015Q2
2015Q3
2015Q4
2016Q1
Major iron ore producers
Australia Brazil China India South Africa
0
50
100
150
200
250
300
350
400
2014Q1
2014Q2
2014Q3
2014Q4
2015Q1
2015Q2
2015Q3
2015Q4
2016Q1
Major iron ore consumers
China EU Japan Korea North America
0
50
100
150
200
250
2014Q1
2014Q2
2014Q3
2014Q4
2015Q1
2015Q2
2015Q3
2015Q4
2016Q1
Major iron ore exporters
Australia Brazil South Africa India
0
50
100
150
200
250
300
2014Q1
2014Q2
2014Q3
2014Q4
2015Q1
2015Q2
2015Q3
2015Q4
2016Q1
Major iron ore importers
China EU Japan Korea Chinese Taipei

STEEL MARKET DEVELOPMENTS - Q4 2016
20
Figure 10. Iron ore prices: selected grades
Source: Commodity Research Unit
Metallurgical coal
The supply-demand balance for metallurgical coal has tightened and prices have rallied in recent months. Metallurgical coal includes various grades of coal that are suitable for making coke (which is used with iron ore in the blast furnace to produce iron) and so-called pulverized coal injection (PCI) coal that can be used in combination with coke in the steelmaking process. Metallurgical coal is usually higher grade and has fewer impurities than thermal coal.
World metallurgical coal production declined by 1.8% to 1 158 mmt in 2015, and production declines have continued into 2016. In the first quarter of 2016, metallurgical coal production fell in major producing economies, doing so by 8.8% in China, 2.7% in Australia, 15.6% in the United States, and by 5.9% in Canada.
Seaborne trade in metallurgical coal declined in 2015 in response to weak demand from the steel industry. Major importers experienced significant declines in inward shipments of coking coal, with Chinese imports contracting by 23% and Japanese imports down by around 5%. Coking coal deliveries to India and Korea, however, were up by 6% and 8%, respectively, but remained flat in the EU.
There are some indications that global trade may be starting to stabilize as market activity begins to pick up. China, currently the world's second largest importer of metallurgical coal, recorded a significant increase in imports in the first several months of this year as demand from the steel sector picked up and domestic supply conditions tightened further in response to some coal mine closures. In Shanxi, the largest metallurgical coal producing region in China, the top five local coal companies are reported to have closed over 100 metallurgical coal mines with annual production capacity of around 100 million tonnes (Resources and Energy Quarterly, June 2016).
0
50
100
150
200
Jan-14 Apr-14 Jul-14 Oct-14 Jan-15 Apr-15 Jul-15 Oct-15 Jan-16 Apr Jul
USD/tonne
Fines, 62% Fe (CFR China) Lump, 62% Fe (CFR China, ex-Australia)
Fines, 63.5% Fe (FOB India) Fines, 58% Fe (CFR China)

STEEL MARKET DEVELOPMENTS - Q4 2016
21
India's metallurgical coal imports declined in early 2016, in year-on-year terms, as steel production growth slowed, but some expect future prospects to be characterized by significant growth in Indian coking coal demand and imports, because domestic coal resources are usually high in ash and low in energy. For instance, an April 2016 report by Australia's Department of Industry, Innovation and Science (DIIS) expects Indian imports to increase by 8% per year in the period to 2021, supported by growth in the steel sector.5 DIIS expects that, in the near term (2016-17), Korean imports of metallurgical coal will register moderate growth, remain approximately stable in Japan and the EU, and decline in China.6
Tightening market conditions have led to strong increases in prices in recent months. Supply side disruptions, such as accidents in some Australian mines this summer, have also contributed to the market tightness. In September 2016, metallurgical coal spot prices reached their highest levels since mid-2012, with the price of hard coking coal from Australia rising to USD 182 per tonne, up from levels of less than USD 80 early in the year. This remarkable increase in cocking coal prices over the last tow months has mostly been driven by a combination of different factors including a shortage of Chinese supply and constraints in seaborne supply, strong demand (notably in China and India), as well as market speculation.
Figure 11. The global metallurgical coal market: production, consumption and trade by major economies
Source: Commodity Research Unit.
0
50
100
150
200
250
2014Q1
2014Q2
2014Q3
2014Q4
2015Q1
2015Q2
2015Q3
2015Q4
2016Q1
Major metallurgical coal producers
China Australia Russia United States Canada
0
50
100
150
200
250
2014Q1
2014Q2
2014Q3
2014Q4
2015Q1
2015Q2
2015Q3
2015Q4
2016Q1
Major metallurgical coal consumers
China EU Japan India Korea
0
10
20
30
40
50
60
2014Q1
2014Q2
2014Q3
2014Q4
2015Q1
2015Q2
2015Q3
2015Q4
2016Q1
Major metallurgical coal exporters
Australia United States Canada Russia Mongolia
0
5
10
15
20
25
2014Q1
2014Q2
2014Q3
2014Q4
2015Q1
2015Q2
2015Q3
2015Q4
2016Q1
Major metallurgical coal importers
Japan China EU India Korea

STEEL MARKET DEVELOPMENTS - Q4 2016
22
Figure 12. Coking coal prices
Source: Commodity Research Unit.
Ferrous scrap
Ferrous scrap is consumed mainly in electric-arc furnaces (EAF), which produced 25.1% of the world's steel in 2015. Scrap-intensive EAFs play an important role in the steel industry in Turkey, where they account for 65% of crude steel production, NAFTA (62.1% of crude steel production) and, to a lesser extent, in the EU (39.4%). The Middle East and North Africa also have very high shares of EAF in steel production, but many of these mills use direct reduced iron as a principal feedstock for the EAF. Varying amounts of scrap (up to around 30%) are also combined with iron in the blast oxygen furnace (BOF) to reduce levels of heat in the furnace and fine tune the production process.
Scrap is sourced from the steel mills themselves during the steelmaking process (so-called “home scrap”), during the manufacturing processes of industrial plants that manufacture, e.g., machines, electrical appliances and automobiles plants (“prompt industrial scrap”), and through the collection of old steel from demolished buildings, scrapped automobiles, ships and other steel products (“obsolete scrap”). The amount of generation is influenced by the economic situation, in particular industrial production activity. Scrap collection tends to respond quickly to changes in scrap prices; these fluctuations in supply can create significant price volatility.
Demand for scrap weakened in 2015 due to the decline in global steel production. Demand weakness had a significant impact on scrap trade, visible in the decline in world exports of 12.2% in 2015. The largest scrap exporter, the United States, recorded a 15.3% decline in exports. Other major exporters, such as Germany, also saw outward scrap shipments decline. In Asia, the major exporter of scrap is Japan, which experienced an increase in outward shipments of 0.4 mmt, despite reports that many EAF steel producers in the region were opting to re-roll imported billets instead of producing their own steel.
Demand weakness resulted in scrap price declines throughout 2015, and for the year as whole prices were down by 36%-38% (for #1 HMS grade) from levels in 2014. However, after bottoming out in the
50
100
150
200
Jan-14 Apr-14 Jul-14 Oct-14 Jan-15 Apr-15 Jul-15 Oct-15 Jan-16 Apr Jul
USD/tonne
Premium, low-vol hard coking coal (FOB Australia)
Premium, low-vol hard coking coal, quarterly contract (FOB Australia)
STEEL MARKET DEVELOPMENTS - Q4 2016
23
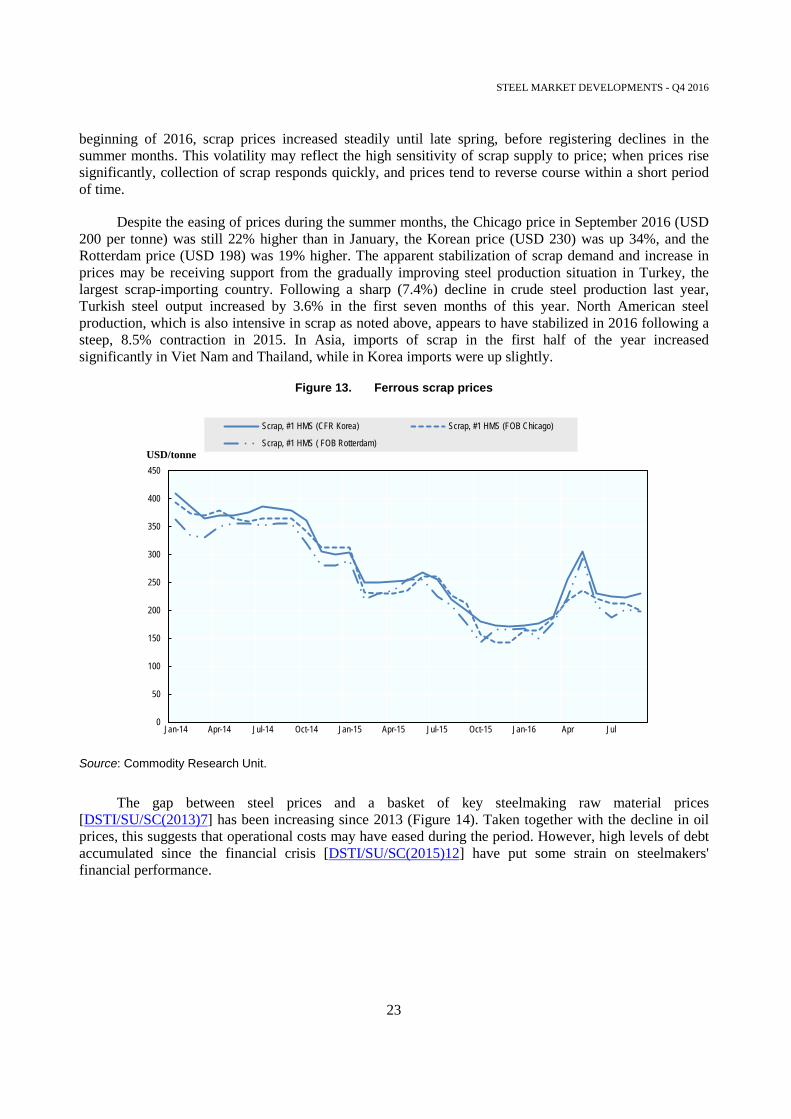
beginning of 2016, scrap prices increased steadily until late spring, before registering declines in the summer months. This volatility may reflect the high sensitivity of scrap supply to price; when prices rise significantly, collection of scrap responds quickly, and prices tend to reverse course within a short period of time.
Despite the easing of prices during the summer months, the Chicago price in September 2016 (USD 200 per tonne) was still 22% higher than in January, the Korean price (USD 230) was up 34%, and the Rotterdam price (USD 198) was 19% higher. The apparent stabilization of scrap demand and increase in prices may be receiving support from the gradually improving steel production situation in Turkey, the largest scrap-importing country. Following a sharp (7.4%) decline in crude steel production last year, Turkish steel output increased by 3.6% in the first seven months of this year. North American steel production, which is also intensive in scrap as noted above, appears to have stabilized in 2016 following a steep, 8.5% contraction in 2015. In Asia, imports of scrap in the first half of the year increased significantly in Viet Nam and Thailand, while in Korea imports were up slightly.
Figure 13. Ferrous scrap prices
Source: Commodity Research Unit.
The gap between steel prices and a basket of key steelmaking raw material prices [DSTI/SU/SC(2013)7] has been increasing since 2013 (Figure 14). Taken together with the decline in oil prices, this suggests that operational costs may have eased during the period. However, high levels of debt accumulated since the financial crisis [DSTI/SU/SC(2015)12] have put some strain on steelmakers' financial performance.
0
50
100
150
200
250
300
350
400
450
Jan-14 Apr-14 Jul-14 Oct-14 Jan-15 Apr-15 Jul-15 Oct-15 Jan-16 Apr Jul
USD/tonne
Scrap, #1 HMS (CFR Korea) Scrap, #1 HMS (FOB Chicago)
Scrap, #1 HMS ( FOB Rotterdam)

STEEL MARKET DEVELOPMENTS - Q4 2016
24
Figure 14. Margin between steel and raw materials prices
Note: The raw materials basket for steel production includes 70% of the usual quantities of iron ore (1.6 tonne) and coking coal (0.77 tonne) needed to produce steel in the integrated process and 30% of the quantity of ferrous scrap (1.07 tonne) needed to produce steel in the electric arc furnace process [DSTI/SU/SC(2013)7]. Prices used are as follows: Iron ore Fines, 62% Fe, SPOT, CFR China; Hard coking coal spot, FOB Australia; Scrap, #1 HMS, FOB Rotterdam. The basket is compared against HRC world prices. The margin is defined as the per cent difference between the steel price and the raw materials basket price.
Source: OECD calculations based on Commodity Research Unit and Platts Steel Business Briefing.
Financial performance
Profitability
Average operating profitability (EBITDA to sales ratio) in the steelmaking industry decreased from 20% in 2004 to 8% in 2012 (Figure 1). Despite slightly recovering to 10% in 2014, operating profitability is still below sustainable levels [DSTI/SU/SC(2015)12]. It should be highlighted that average operating profitability is very close to the third quartile of the distribution (upper dashed line), crossing it in 2014. This suggests that a small number of companies that remain resilient to the crisis are pushing average profitability up, while the large majority of companies are experiencing difficulties. Indeed, while the long-dashed line in Figure 15 indicates that 50% of the companies have operating profitability levels below 5.2%, while the bottom dashed line shows that almost 25% of the steelmaking companies face severe difficulties and incur in operating losses.
0
200
400
600
800
1000
1200
0%
20%
40%
60%
80%
100%
120%
140%
160%
180%
Margin (LHS,%) Basket (RHS) Steel (RHS) USD/tonne

STEEL MARKET DEVELOPMENTS - Q4 2016
25
Figure 15. Evolution of operating profits between 2000 and 2015
Note: The square dashed lines provide information on the distribution (first and third quartiles) of operating profitability across the firms in the sample: 25% of the companies have operating profitability below (above) the first (third) quartile line. The long dash line provides information on median operating profitability across firms in the sample: this line divides the distribution in two halves with 50% of the companies having operating profitability below the line. The heavy line depicts the industry average operating profitability.
Source: OECD calculations based on data from Thomson Reuters Eikon.
After deducting all expenses, including tax, interest, depreciation and amortization, from operating profits, Figure 16 shows that the average net profit margin of companies has been decreasing since reaching a peak in 2004 at 10%. Net profits seem to have stabilised at a low level of around 2% since 2012. Interestingly, the extent of the plunge in net margins differs significantly across the distribution. The third quartile of the distribution, above which stand the most profitable companies (upper dashed line in Figure 16) barely drops and has remained at a level of around 3.5% for the past few years. Conversely, median net margins have dropped from 1% to 0% and the net margin for the first quartile of the distribution (lower dashed line) dropped sharply from 0% to -7% between 2014 and 2015. In other words, while 50% of steelmaking companies in the sample face net losses, the least profitable 25% face net losses above 7%. This uneven drop in net profit margins clearly shows that some companies suffer more than the others.
0%
5%
10%
15%
20%
25%
Average Quartiles 1&3 Quartile 2

STEEL MARKET DEVELOPMENTS - Q4 2016
26
Figure 16. Evolution of net profits between 2000 and 2015
Note: The square dashed lines provide information on the distribution (first and third quartiles) of net profits across the firms in the sample: 25% of the companies have net profits below (above) the first (third) quartile line. The long dash line provides information on median net profits across firms in the sample: this line divides the distribution in two halves with 50% of the companies having net profits below the line. The heavy line depicts the industry average net profits.
Source: OECD calculations based on data from Thomson Reuters Eikon.
Overall, net profit margins across different quartiles of the distribution indicate that 25% of the companies in the sample (upper dashed line) are able to make some profit, and another 25% of companies are barely making any profit (area between the upper dashed line and middle dashed line). In addition, half of the companies in the sample are making losses and 25% of the companies (lower dashed line) are operating at a considerable loss.
Looking more closely at the distribution of net profits across steelmaking companies, Figure 17 below shows the evolution of profitability between selected years (2000, 2007 and 2015). It is clear that there is a shift in the distribution towards the left (i.e. lower profitability) between 2000 and 2015. Figure 17 also shows that the left tail of the distribution became heavier — in other words, there are now more firms with lower profitability levels. It is also shown that the reduction in average profitability depicted in Figure 16 above was felt across the board, with the exception of those firms at the top of the profitability distribution, as small number of companies remains profitable as indicated by the circled area in Figure 17.
-10%-8%-6%-4%-2%0%2%4%6%8%
10%12%
Average Quartiles 1&3 Quartile 2

STEEL MARKET DEVELOPMENTS - Q4 2016
27
Figure 17. Distribution of net profits in selected years
2000, 2007 and 2015
Note: This figure plots the distributions of net profit margin in different years using kernel density estimates. The kernel density estimate gives an approximation of the probability density function of a given distribution — up to a given point x in the horizontal axis, the area under this function provides the percentage of observations that have values that are lower or equal to x. The total area below the curve for each year equals one. For presentation purposes, the x net profit values shown in the chart range between -100% and 100%.
Source: OECD calculations based on data from Thomson Reuters Eikon.
Indebtedness
The indebtedness of steelmaking companies has been increasing over the last decade (Figure 18), in line with decreasing profitability as discussed above. The average share of debt on total assets has increased from 26% in the early 2000s to around 40% in 2012 and has fluctuated around that level since then. However, the trend of indebtedness also diverges significantly across quartiles. While the most indebted companies (upper dashed line) continue to show an increasing indebtedness trend, other companies (middle and lower dashed lines) have recently started to slowly reduce their debt exposure.
Large liabilities have been weighing on steelmakers' balance sheets, reducing their margin of manoeuvre to restructure as needed. Continued subdued financial performance in a context of already very fragile balance sheets would likely fuel debt defaults, with possible implications for the financial sector as well as other parts of the economy. Any avoidance of bankruptcies and firm exit in this context will only add to the challenge.

STEEL MARKET DEVELOPMENTS - Q4 2016
28
Figure 18. Evolution of indebtedness between 2000 and 2015
Note: The square dashed lines provide information on the distribution (first and third quartiles) of indebtedness across the firms in the sample: 25% of the companies have debt to assets ratios (above) the first (third) quartile line. The long dash line provides information on median indebtedness across firms in the sample: this line divides the distribution in two halves with 50% of the companies having debt to assets ratios below the line. The heavy line depicts the industry average indebtedness.
Source: OECD calculations based on data from Thomson Reuters Eikon.
Lower demand forecasts coupled with further increases in steelmaking capacity over the next few years, amid low steel prices, will likely put additional strain on steelmaking companies' already fragile financial situation and possibly spill over to other parts of the economy, should supply not be allowed to adjust.
Closures
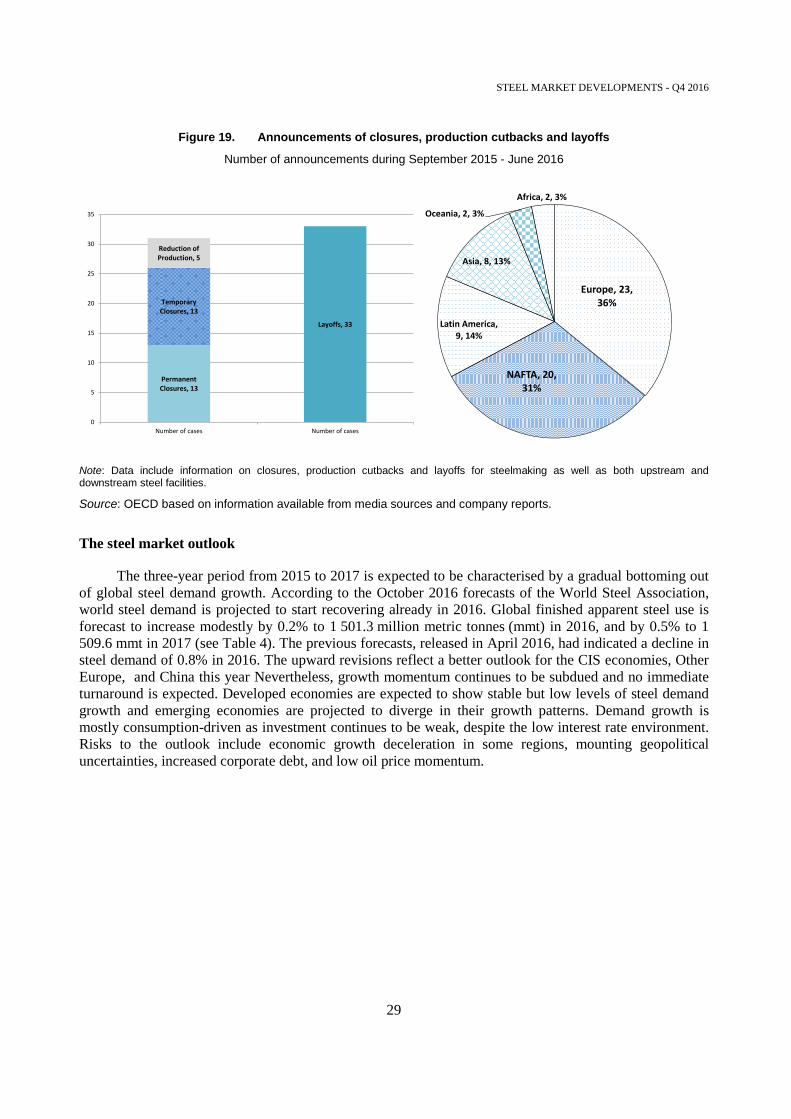
During the last few months, the industry has announced a number of temporary and permanent plant closures, cutbacks in production, and layoffs of steel workers, as shown in Figure 19 below. Since September 2015, 13 cases of permanent closures and 18 cases of temporary closures or production cut-backs, along with several episodes of lay-offs that are affecting communities, have been identified by the Secretariat. Many of these announcements have occurred in Europe and North America, but they are affecting many other regions as well. The temporary rebound in steel prices during the first half of 2016 has seen a number of idle production facilities restarting operations. However, given the extent of the supply-demand imbalances in the sector amid a fragile corporate financial situation, further closures are expected to be announced over the short to medium term.
0%
10%
20%
30%
40%
50%
60%
Average Quartiles 1&3 Quartile 2
STEEL MARKET DEVELOPMENTS - Q4 2016
29
Figure 19. Announcements of closures, production cutbacks and layoffs
Number of announcements during September 2015 - June 2016
Note: Data include information on closures, production cutbacks and layoffs for steelmaking as well as both upstream and downstream steel facilities.
Source: OECD based on information available from media sources and company reports.
The steel market outlook
The three-year period from 2015 to 2017 is expected to be characterised by a gradual bottoming out of global steel demand growth. According to the October 2016 forecasts of the World Steel Association, world steel demand is projected to start recovering already in 2016. Global finished apparent steel use is forecast to increase modestly by 0.2% to 1 501.3 million metric tonnes (mmt) in 2016, and by 0.5% to 1 509.6 mmt in 2017 (see Table 4). The previous forecasts, released in April 2016, had indicated a decline in steel demand of 0.8% in 2016. The upward revisions reflect a better outlook for the CIS economies, Other Europe, and China this year Nevertheless, growth momentum continues to be subdued and no immediate turnaround is expected. Developed economies are expected to show stable but low levels of steel demand growth and emerging economies are projected to diverge in their growth patterns. Demand growth is mostly consumption-driven as investment continues to be weak, despite the low interest rate environment. Risks to the outlook include economic growth deceleration in some regions, mounting geopolitical uncertainties, increased corporate debt, and low oil price momentum.
Permanent Closures, 13
Temporary Closures, 13
Reduction of Production, 5
Layoffs, 33
0
5
10
15
20
25
30
35
Number of cases Number of cases
Europe, 23, 36%
NAFTA, 20, 31%
Latin America, 9, 14%
Asia, 8, 13%
Oceania, 2, 3%
Africa, 2, 3%

STEEL MARKET DEVELOPMENTS - Q4 2016
30
Table 4. Latest forecasts for regional apparent steel use by the World Steel Association
Millions of tonnes of finished steel
Source: World Steel Association’s Short Range Outlook, released in October 2016.
The outlook for steel demand differs significantly across regions, according to the World Steel Association. In Europe, the EU is set to experience an increase in steel demand from 153.6 mmt in 2015 to 156.9 mmt in 2017, with positive growth rates of 0.8% and 1.4% in 2016 and 2017, respectively. Important developments in the region include the approval, by the German government, of a EUR 270 billion budget plan for the modernisation of road, rail and motorways. Steel demand in Germany is forecast to grow 2% in 2016 and 1% in 2017, when it is expected to reach 40.4 mmt. It will also be important to follow the developments regarding the Brexit process, as well as the reconstruction in Italy in the aftermath of the earthquake.
Other Europe is expected to continue growing, albeit at a more modest rate, from 9.6% in 2015 to 4.1% in 2016 and 3.7% in 2017. In Turkey, interest rate cuts on home loans and other policies affecting the real estate sector may result in new steel orders from the construction sector. News is not as bright for the automotive sector, which has seen production falling in recent months after a strong start of the year. Demand is set to recover in the CIS, with the region reverting back to growth (2.1%) in 2017 after a steep steel demand contraction during 2015 (-9.8%) and a more modest reduction in 2016 (-1.6%). Demand in the region is mostly supported by improvements in Russia as well as a substantial increase in security expenditure in Ukraine (around 5% of GDP) that could provide further stimulus to steel demand.
In the Americas, the NAFTA region is expected to recover faster than Central and South American economies. Steel demand in the NAFTA region is expected to increase from 133.7 mmt in 2015 to 137.4 mmt in 2017, remaining practically unchanged during 2016 compared to 2015 (-0.1% change) and growing at a rate of 2.9% in 2017. In Central and South America, steel demand is forecast to continue to decline during 2016 (10.4% y-o-y) and then recover by 4.1% during 2017 to 42.5 mmt, but remaining below 2015 levels (45.6 mmt). In South America, the steel sector could start to show signs of improvement after the
2015 2016 (f) 2017(f) % Ch 2015 % Ch 2016 (f) % Ch 2017 (f)
EU-28 153.6 154.8 156.9 2.9 0.8 1.4
Other Europe 40.4 42.1 43.7 9.6 4.1 3.7
CIS 50.5 49.6 50.7 -9.8 -1.6 2.1
NAFTA 133.7 133.6 137.4 -8.2 -0.1 2.9
Central & South America 45.6 40.8 42.5 -6.7 -10.4 4.1
Africa 38.7 39.5 41.1 3.5 2.2 3.9
Middle East 52.9 53.0 53.1 -1.2 0.3 0.1
Asia & Oceania 983.4 987.9 984.3 -3.3 0.5 -0.4of which:China 672.3 665.6 652.3 -5.4 -1.0 -2.0India 80.1 84.4 89.1 5.3 5.4 5.7
World total 1,498.7 1,501.3 1,509.6 -3.0 0.2 0.5World excl. China 826.4 835.7 857.3 -0.9 1.1 2.6

STEEL MARKET DEVELOPMENTS - Q4 2016
31
deep steel recession and in anticipation of some economic recovery in major countries in the region, like Brazil and Argentina, as some political instabilities fade. The economic impacts of a peace deal in Colombia would be interesting to follow in terms of its impacts on the economy and steel demand.
In the Middle East, steel demand is expected to stabilise or grow very slowly up to 2017, after a modest 1.2% decline in 2015. Demand in the region is forecast to grow by 0.3% in 2016 and 0.1% in 2017, reaching 53.1 mmt by the end of 2017. A recently signed cooperation deal with China will allow Iran to finance a series of infrastructure projects that could boost steel demand in the country. The outlook for steel demand in African economies looks positive, with the region's demand forecast to increase by 2.2% and 3.9% in 2016 and 2017, respectively.
The outlook for steel demand in Asia and Oceania has been revised upwards since World Steel Association's forecasts in April. October's forecasts still suggest an increase in steel consumption during 2016, to 987.9 mmt from 983.4 mmt in 2015. However, steel demand is expected to contract again by 0.4% in 2017 to 984.3 mmt. In China, domestic steel demand is likely to continue to contract, albeit at a lower rate than it was expected earlier in the year. Some analysts see some risks in the construction sector, notably given the extent of financial leverage in that sector. Demand from the machinery sector is more stable but expected to decline this year, along with an expected contraction of steel consumption used in the shipbuilding sector, which is also troubled by overcapacities. Conversely, steel consumption in the car industry is expected to improve after a poor performance in 2015. In its latest forecast, the World Steel Association points to a 1% contraction in Chinese steel demand during 2016 and 2% decline in 2017 — down from April's forecast of 4% and 3 % for 2016 and 17, respectively. Recently announced mergers and acquisitions in China could help the industry to consolidate and address part of the supply-demand imbalances. Moreover, the implementation of policy announcements in China aimed at addressing the excess capacity challenge could significantly help the domestic as well as international markets.
Japanese demand for steel products is forecast to decline by 0.4% during 2016, but then recover by 1.4% in 2017. In Korea, shipbuilding orders are down and could be a drag on steel demand growth in the short to medium runSteel demand growth in Korea is expected to remain in positive terrain during with 2016 (1%), but then decline by 3.1% in 2017. Steel demand in India should continue to be robust. Steel consumption is expected to increase from 80.1 mmt in 2015 to 89.1 mmt in 2017 (growing 5.4% in 2016 and 5.7% in 2017). In the Asian region, it would also be important to highlight the large steel demand growth potential in Viet Nam, as a result of a highly performant construction sector and the inflow of investment for infrastructure development.
Concluding remarks
In summary, the market situation in the steel industry has improved slightly. Recovery in demand in some regions, and relatively minor adjustments in supply with some capacity closures and mothballing of steelmaking facilities, suggest that steel markets could be bottoming out. However, it is still uncertain whether the positive momentum is robust. Even if so, significant headwinds related to financial vulnerabilities and unaddressed overcapacity cloud the outlook. The extent to which demand growth reflects the effects of policy-driven stimulus could mask underlying imbalances that may later surface again and possibly introduce additional distortions in steel markets, eventually adding to the structural adjustment challenge. It seems therefore important that steel markets and policymakers make use of the space to work out the necessary supply-side adjustments. Necessary supply-side reforms will include facilitating the exit of the least efficient steel producers, addressing corporate financial vulnerabilities before they spill over to other parts of the economy and preparing effective programmes to ensure that social costs are properly dealt with.

STEEL MARKET DEVELOPMENTS - Q4 2016
32
ANNEX: FINANCIAL DATA7
The firm-level dataset of steel companies' financials used in this paper is constructed from both active and inactive listed steelmaking companies that are included in both NAICS classification (codes 3311 and 3312) and Thomson Reuters Activity classification (5120102010 and 5120102013-6) between 2000 and 2016. Financials were retrieved from Thomson Reuters Eikon and were used as given. For the purpose of the analysis in this paper and to ensure a high representativeness of companies covered, the analysis focuses on data from 2000 to 2015, with valid sample size varying from 230 to 516. Changes in sample size are a result of the combined effect of data availability and market entry and exit.
Three key indicators are used to analyse the profitability and indebtedness of steelmaking companies between 2000 and 2015. These include EBITDA to sales ratio, net profit margin and the share of total debt on total asset. In order to shed some light on the distributional properties of each indicator, different statistical measures are calculated: i) the weighted industry average, ii) the industry median and iii) the first and third quartiles of the distribution. The industry average is calculated using each company's market share as weights, while the first, second (median) and third quartile of the distribution are directly obtained from the firm-level observation. All computations are performed using STATA.
EBITDA is calculated by deducting all expenses from revenue except interest, tax, depreciation and amortization. It serves as a good core profitability measure across companies, regardless of their cost structure and operating leverage. EBITDA to sales ratio shows the share of the sales of a company that can be translated to EBITDA.
Unlike EBITDA, net profit takes into account all expenses, including tax, interest, depreciation and amortization. Net profit margin measures the overall profitability of a company. It shows how much of each dollar collected by a company as revenue translates into profit.
The share of debt on total asset is a measure of indebtedness. This indicator shows the percentage of a company’s assets that have been financed through debt. Accordingly, it measures the degree of leverage of a firm, including both short- and long-term debt.

STEEL MARKET DEVELOPMENTS - Q4 2016
33
ENDNOTES
1 The economies are Brazil, China, Germany, India, Japan, Korea, Russia and the United States.
2 See http://www.meti.go.jp/english/press/2016/0707_01.html.
3 All monthly crude steel production data in this section are obtained from the World Steel Association. Corresponding y-o-y percent changes refer to the period January-July 2016, compared to the same period in 2017.
4 The world prices referred to here are publicly available on the Platts Steel Business Briefing website: www.steelbb.com.
5 http://www.industry.gov.au/Office-of-the-Chief-Economist/Publications/Documents/req/REQ-March-2016.pdf
6 http://www.industry.gov.au/Office-of-the-Chief-Economist/Publications/Documents/req/REQ-June-2016.pdf
7 The authors are very grateful to Sze Man Chow for her statistical and analytical work on steelmaking companies' financial performance.

STEEL MARKET DEVELOPMENTS
June
Stay informed by subscribing to our newsletter
OECD News and Innovation, Science Technology and Industry: http://oe.cd/stinews
http://www.oecd.org/sti/ind/steel.htm @ Front cover image courtesy of JFE Steel Corporation
2015
@OECDInnovation
Steel Market Developments provide up-to-date information on global and regional steel markets. Reviewed and approved by the OECD Steel Committee, they are disseminated approximately twice a year to allow policymakers, industry, media and academia to keep abreast of the main trends and recent developments taking place in steel markets.
The reports provide an overview of recent supply and demand developments and, when available, forecasts from publicly available sources. Topics of special interest are occasionally covered, such as developments in steel-related raw material markets, steelmaking capacity trends or updates on specific regions that are important for the global steel market.


![Developments in Steel Cathodes1[1] ISA](https://img.pdfslide.us/doc/110x75/5525ef344a7959b6488b4dac/developments-in-steel-cathodes11-isa.jpg)