Embed Size (px)
Citation preview

31/05/2012
1
Market developments
and trends in key steel-
using industries
DSTI/SU/SC(2012)5
72nd Steel Committee Meeting
Paris
31 May-1 June 2012
Agenda: trends in key steel-using industries
• Steel consumption by sector – in tonnage
– in value added
• Recent production trends and baseline short-term forecasts
• Long-term trends – Factors influencing steel consumption on the long-term
– Long-term (2021) forecasts by steel-using industries
• Risk related to some steel-using industries – Chinese construction sector
– Automotive sector in some developed economies

31/05/2012
2
Global steel consumption by sector in
tonnage (2007)
Construction50%
Transport16%
Machinery 14%
Metal products
14%
Domestic appliances
3%
Electrical equipment
3%
Source: World Steel Association
Global steel consumption by sector in
value added (2010)
Construction24%
Motor Vehicles
10%
Other transport
5%
Mechanical engineering
24%
Electrical & high-tech
11%
All other26%
Source: Oxford Economics

31/05/2012
3
Tonnage vs. Value added
• Measurement differences (VA uses I/O tables)
• Value added per tonne depends on the sector. – Construction sector consumes mainly structural
sections and bars which are lower value-added steel products compared to those typically consumed in other sectors.
• The approach in value uses intermediate consumption numbers, not final demand. – The wholesale sector accounts for a greater share
of the construction sector's intermediate consumption compared to that of other key sectors.
Construction
• Includes civil engineering, buildings, repair and maintenance, global value added USD 2,294 billion in 2010 (at 2005 prices & exchange rates)
• Gross output – before netting off the cost of inputs – was broadly 2¼ times that amount.

31/05/2012
4
Construction
2005-2009 2010 2011e 2012f
EU 15 -1.0 -1.7 0.4 -0.4
US -5.9 -3.2 -1.0 4.7
Japan -3.2 -2.2 -1.2 3.2
Developed countries -2.6 -1.4 0.3 2.0
Brazil 3.7 11.8 3.5 4.0
Russia 5.4 -0.2 3.6 9.2
India 9.5 8.3 4.4 8.4
China 15.5 11.3 12.6 8.3
Emerging markets 7.9 6.3 6.2 6.3
World 0.3 1.2 2.4 3.6
Construction value added, annual growth rate in %
Source: Oxford Economics
Mechanical engineering
• In 2010, global mechanical engineering value added amounted to USD 828 billion
• 10% of world manufacturing
–Special purpose machinery 5%
–General purpose machinery 4%
–Domestic appliances 1%.
31/05/2012
5
Mechanical engineering
2005-2009 2010 2011e 2012f
EU 15 -2.9 8.6 8.0 -1.8
US -2.0 12.0 9.6 6.3
Japan -3.4 19.8 5.3 1.2
Developed countries -2.7 11.8 7.5 1.2
Brazil -1.3 22.7 -0.2 -9.0
Russia -6.1 11.6 -1.7 -5.1
India 4.3 12.8 0.9 3.2
China 15.1 15.9 14.1 10.8
Emerging markets 7.7 16.8 11.0 6.3
World 0.3 13.5 8.8 3.1
Mechanical engineering sector’ value added, annual growth rate in %
Source: Oxford Economics
Motor vehicles
• Value added of USD 638 billion in 2010 (at 2005 prices)
• 7.7% of world manufacturing
–64.4% is produced in developed countries, notably in Japan, the US and Germany
–35.6% in emerging countries

31/05/2012
6
Motor Vehicles
2005-2009 2010 2011e 2012f
EU 15 -6.1 20.9 11.8 -3.8
US -9.3 33.4 7.7 5.7
Japan -2.5 27.6 -11.9 16.9
Developed countries -5.9 26.2 1.3 5.8
Brazil 3.2 25.8 3.5 1.9
Russia -4.7 32.0 16.7 8.0
India 6.3 38.3 13.1 4.6
China 15.9 24.2 2.4 9.8
Emerging markets 6.3 22.8 9.6 4.7
World -2.4 25.0 4.3 5.4
Motor vehicles sector’s value added, annual growth rate in %
Source: Oxford Economics
Other means of transport
• Value added of USD 304 billion in 2010 (at 2005 prices)
• 3.7% of world manufacturing. – Aerospace: USD 137 billion,
– Ships, rolling stock, etc. USD 167 billion
• Share of developed countries: 56%

31/05/2012
7
World Shipbuiding completions
-
10,000
20,000
30,000
40,000
50,000
60,000
2000 2001 2002 2003 2004 2005 2006 2007 2008 2009 2010 2011
Others 6,196 6,153 6,508 6,103 6,083 6,394 7,631 8,203 8,713 7,952 8,194 6,273
China 1,145 1,367 1,561 2,599 2,929 4,343 5,112 6,795 9,347 12,749 18,966 19,737
Korea 6,482 6,095 6,650 7,167 8,348 10,136 11,764 11,277 14,600 14,411 15,012 15,954
Japan 6,409 6,477 6,570 6,887 7,996 8,479 9,598 8,913 9,793 9,625 9,863 9,162
CG
T (
,00
0)
Sources: IHS-Fairplay, World shipbuilding Statistics – various editions, OECD
Long-term trends of steel using industries
• Issues that will influence the level and location of steel consumption both over the next decade and over the longer term – Costs of using substitute materials
– Climate change policy
– Demographics
– Changing consumption patterns

31/05/2012
8
Costs of using substitute materials
• Steel competes with other materials, examples: – aluminium in motor vehicles
– plastics in food & beverage packaging;
– timber in housing frames;
– concrete in reinforced concrete.
• Substitution depends notably on: – the capacity to change the production process;
– the sensitivity of demand to price.
Climate change policy (1/2)
• Big impact for motor vehicles and energy
• Motor vehicles impacted by the implementation of fuel efficiency targets
– It favours alternative, lighter materials such as aluminium or carbon
– But is also boosting technological progress in the steel industry
• Green cars’ sales in total automobile sales expected to range from 2% to 12% by 2020

31/05/2012
9
Climate change policy (2/2): Energy sector
• Energy production +1/3 from 2010 to 2035
• Global investment in the energy supply infrastructure : USD 38 trillion (in year-2010 dollars) 2011 to 2035 (2/3 outside of the OECD).
• Non-hydro renewable energies, (mostly wind and solar energies), which are more steel-intensive than other energy sources, will increase from 3% of the total in 2009 to over 15% in 2035.
Source: IEA’s Energy Outlook 2011:
Demographics
• World population is expected to reach 7.7 billion people by 2021 (vs. 6.9 bn in 2011).
• The increase in population is likely, other things being equal, to lead to higher steel consumption as more goods and services are consumed.
• However, population trends vary significantly across countries.
• The construction sector may feel the burden of a falling population more acutely than manufacturing.

31/05/2012
10
Changing consumption patterns (1/2)
• Changes in the composition of private consumption: key drivers for steel demand.
• As emerging markets grow and become more prosperous, demand for consumer goods as a whole will increase.
Changing consumption patterns (2/2)
0
5000
10000
15000
20000
25000
30000
35000
40000
45000
0 100 200 300 400 500 600 700 800 900 1000
personal vehicles per '000 driving population
GDP per capita (US$ 2005 prices)
US
UK
Germany
Italy
JapanKorea
Spain
China
TurkeyMexico
Brazil
India
Egypt
Slovakia
South Africa
Poland
Personal vehicle density and GDP - 2010
Sources: Oxford Economics, JD Power.

31/05/2012
11
Long-term forecasts by sector
• Compound annual growth rate 2011-2021 of the global value added for selected steel using industries:
–Construction +5.1%
–Motor vehicles +5.4%
–Other means of transport +5.8%
Long-term forecasts by sector
ConstructionMechanical
engineering
Motor
Vehicles
Other means
of transport
China 11.2>16.3 18.0>36.0 14.2>23.3 22.1>30.5
India 4.0>6.0 1.5>2.0 0.8>1.1 3.0>4.4
Japan 9.8>6.7 15.0>13.0 24.4>17.2 4.5>2.9
US 17.8>19.8 14.6>9.0 13.3>16.0 23.9>19.3
"EU 5" 22.8>16.6 24.4>16.0 20.7>16.4 20.4>16.8
Share of global value added Value added in 2010>2021 (in %)

31/05/2012
12
Risks: Chinese construction (1/2)
-20
-10
0
10
20
30
40
50
94
96
98
100
102
104
106
108
Real Estate Climate Index, LHS
Steel production annual growth rate, RHS, %
Sources: CEIC, World steel Association.
Risks: Chinese construction (2/2)
-20
0
20
40
60
80
100
Floor space sold (commodity building), yearly growth rate, %
31/05/2012
13
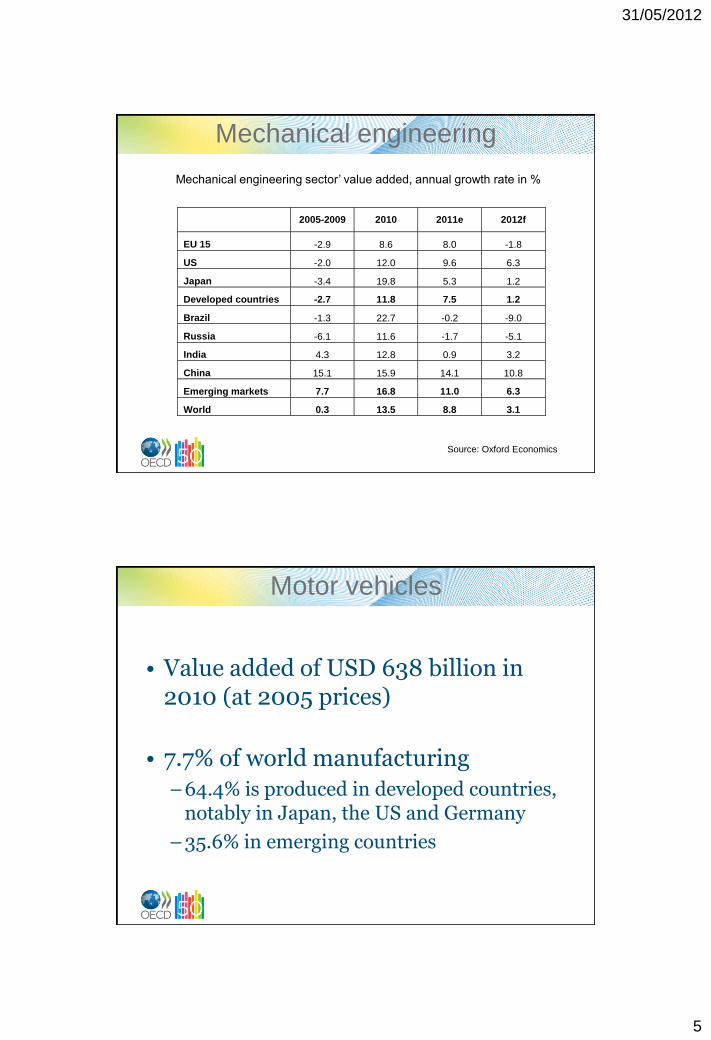
Risks: Auto in developed economies
2
4
6
8
10
12
14
16
18
20
EU 15 (new car registrations)
USA (new car sales)
China (new car sales)
New car registrations in the EU 15, new car sales in the US and in China
Last 12 months, moving sum, millions of units
Thank you