Embed Size (px)
Citation preview

1 23
International Journal of CivilEngineering ISSN 1735-0522 Int. J. Civ. Eng.DOI 10.1007/s40999-016-0036-z
Steel Bridge Service Life Prediction UsingBootstrap Method
Mohammad Reza Saberi, Ali Reza Rahai,Masoud Sanayei & Richard M. Vogel

1 23
Your article is protected by copyright and all
rights are held exclusively by Iran University
of Science and Technology. This e-offprint is
for personal use only and shall not be self-
archived in electronic repositories. If you wish
to self-archive your article, please use the
accepted manuscript version for posting on
your own website. You may further deposit
the accepted manuscript version in any
repository, provided it is only made publicly
available 12 months after official publication
or later and provided acknowledgement is
given to the original source of publication
and a link is inserted to the published article
on Springer's website. The link must be
accompanied by the following text: "The final
publication is available at link.springer.com”.
RESEARCH PAPER
Steel Bridge Service Life Prediction Using Bootstrap Method
Mohammad Reza Saberi1,2 • Ali Reza Rahai1 • Masoud Sanayei2 • Richard M. Vogel2
Received: 16 November 2014 / Revised: 23 August 2015 / Accepted: 19 September 2015
� Iran University of Science and Technology 2016
Abstract Steel bridges play an important role in the
transportation system of many countries. To ensure that
bridges are structurally sound, engineers monitor their
performance, which is known as structural health moni-
toring. Historical evidence indicates that bridge damage is
pervasive and that the service life of bridges is decreasing.
To manage safety and costs, engineers must be able to
accurately predict the service life of bridges. A statistical
method to predict service life for steel bridges is presented,
which can assist bridge engineers, bridge owners, and state
officials in the objective assessment of deteriorated bridges
for retrofit or replacement. Timely repair and retrofit of
bridges increase their safety levels and decrease costs. A
nonparametric statistical approach based on the bootstrap
method for stress analysis for fatigue life prediction of steel
bridge components is proposed. The bootstrap provides a
simple approach for the reproduction of the extremely
complex probability distribution of measured strain data. It
is completely automated numerical method which requires
no theoretical calculations and it is not based on the
asymptotic results. The service life index is introduced
which quantifies the fatigue life of steel bridges under daily
traffic loads. A regression model is developed for the
prediction of remaining service life of steel bridges using a
service life function. The predicted remaining service life
derived from the function can contribute to effective
management of steel bridges.
Keywords Steel bridges � Service life � Bootstrap � Servicelife index � Regression � Simulated strains and stresses
1 Introduction
Bridges play a significant role in the expansion of public
transportation network infrastructure in the world. The
development of bridges establishes new network connec-
tions, which can enhance the economic progress of a
country. What is very clear is that damage appears in many
of the bridge’s components with the passage of time.
Therefore, damage detection of bridges is a key issue for
managing cost-effective decisions regarding bridge man-
agement systems (BMS). Since structural health monitor-
ing (SHM) is becoming increasingly useful and applied in
BMS, it is now vital for managing bridges throughout
construction, operation and maintenance. One of the sig-
nificant areas of bridge SHM is service life prediction or
bridge prognosis. Changes in properties of structure com-
ponents during their service life relate to damage of
structures that are monitored in SHM. Extensive research
has been conducted on service life evaluation of steel
bridges using damage detection and fatigue assessment
methods. However, as our literature review below reveals,
few studies have developed a bridge service life index
which considered the damage and fatigue which results
from variations in actual daily traffic patterns, which is the
primary goal of this research.
There has been a considerable interest worldwide in the
field of bridge engineering and much research has been
carried out on bridge topics. Wang et al. [1] studied finite
element based fatigue assessment of corrugated steel web
beams in highway bridges. Their paper presented a finite
element analysis and its related experimental test of
& Ali Reza Rahai
1 Department of Civil and Environmental Engineering,
Amirkabir University of Technology, Tehran, Iran
2 Department of Civil and Environmental Engineering, Tufts
University, Medford, MA 02155, USA
123
Int. J. Civ. Eng.
DOI 10.1007/s40999-016-0036-z
Author's personal copy
corrugated steel web beams subjected to fatigue loading.
Results showed that it is possible to expect the fatigue
crack failure arising at the weld root or weld toe corre-
sponding to sections with reference angle using the effec-
tive notch stress analysis [1]. Grandic et al. [2] presented
evaluation of torsional stiffness in beam and slab bridge
decks based on load testing. The results of load testing
conducted on series of bridges in Croatia are compared
with results obtained on different numerical grillage mod-
els in which torsional stiffness of main structural elements
was varied. According to conducted analyses, a design
value of the coefficient of torsional stiffness reduction for
the verification of serviceability limit state of main struc-
tural elements of beam and slab bridge deck is proposed
[2]. Tarighat [3] focused on model based damage detection
of concrete bridge deck using an adaptive neuro-fuzzy
inference system. In this paper, an adaptive neuro-fuzzy
inference system (ANFIS) is used to detect the possible
damage location in a concrete bridge deck modeled by
finite element method. Results showed that this method can
decrease the time and cost of visual inspections and be used
as real-time damage detection caution system in practice
[3]. Service life prediction of bridges has been developed
and evaluated in many fields. One of the fields is fatigue
evaluation for service life prediction. Miner and Calif [4]
proposed the ‘‘damage cumulative’’ rule. It was proposed
as a simple and conservative life prediction based on the
concept of cumulative fatigue damage. Using this concept,
they tested different types of aluminum alloy specimens
with different stress ratios and different combinations of
loading cycles. A percentage of failure at a specified stress
level was defined by a number of loading cycles. Accord-
ing to this concept, total damage occurs when the number
of cycles reaches 100 percent leading to fatigue failure of
the specimen [4]. Soliman et al. [5] studied fatigue
assessment and service life prediction of existing steel
bridges by integrating SHM into a probabilistic bilinear S–
N approach. Soliman et al. (2013) demonstrated that the
present methods for fatigue remaining life prediction of
steel bridges can be conservative. In their study, a bilinear
S–N approach was proposed. They investigated how dif-
ferent slopes above and below the constant amplitude
fatigue threshold (CAFT) related to S–N curves for better
prediction of fatigue life [5].
In service life prediction of bridges based on monitoring
data, measured strain is an important indicator of bridge
fatigue behavior. Zhou [6] presented a method for assess-
ment of bridge remaining fatigue life evaluation through
field strain measurements. Zhou [6] reported that a large
number of bridges appear to have an infinite fatigue life
[6]. Also, Ye et al. [7] conducted a statistical analysis of
stress spectra for fatigue life assessment of steel bridges
with structural health monitoring data. They developed a
method for fatigue life assessment of steel bridges using
long-term measured dynamic strain data [7]. Alampalli and
Lund [8] proposed a method for estimating fatigue life of
bridge components using measured strains. Alampalli and
Lund [8] show that most of the critical components had an
infinite fatigue life and others had a substantial fatigue life
[8]. Likewise, Sanayei et al. [9] performed instrumentation,
nondestructive testing, and finite element model updating
for bridge evaluation using strain measurements. There-
fore, a baseline finite element model was developed and
calibrated with nondestructive test data that could be used
in fatigue studies [9].
Others have introduced approaches for fatigue reliability
assessment of steel bridges in service life prediction. For
example, Ni et al. (2013) proposed a monitoring-based
fatigue reliability assessment of steel bridges. In the pro-
posed method, they developed a fatigue reliability model of
steel bridges using long-term monitoring data. The relia-
bility index and failure probabilities which are related to
fatigue life were then determined from the joint probability
density function of the hot spot stresses [10]. Wang et al.
[11] studied fatigue reliability to update fatigue life eval-
uation of existing steel bridges. There, a probabilistic
fracture mechanics method based on the Bayes theorem
was used to update relevant parameters of crack growth
models using information from nondestructive inspection.
A procedure was proposed for assessing and updating
fatigue reliability of existing steel bridge components [11].
Sahrapeyma et al. [12] performed a study on life-cycle
prediction of steel bridges using reliability-based fatigue
deterioration profile. The effects of repair, rehabilitation,
and maintenance on the deterioration profile were specified
by a numerical approach. In addition, a reliability index
was recommended with a plan for maintenance of an
existing bridge [12].
Another field of research used to predict service life of
bridges is deterioration due to chloride effects. Oh et al.
[13] presented a realistic assessment for safety and service
life of reinforced concrete deck slabs with steel girder
bridges. A deterioration model due to chloride ingress was
established. For structural evaluation, the service life pre-
diction of deck slabs due to loading and environmental
effects were presented based on materials used [13]. Also,
Cheung et al. [14] studied service life prediction of rein-
forced concrete deck bridge structures exposed to chlo-
rides. In this research, variations in reinforced concrete
deck surfaces were studied considering local climate con-
ditions [14].
Our literature review reveals that previous studies did
not consider actual changes in the average daily traffic. At
best, they define average daily traffic using a constant
annual rate [8, 15]. This research proposes a quantitative
service life index which can be computed from actual
Int. J. Civ. Eng.
123
Author's personal copy

strain measurements associated with average daily traffic.
This service life index can be used for the estimation of
the ultimate fatigue life of existing steel bridges and to
consider traffic-induced stress variations. The approach is
to obtain the nominal stresses at a specific location (or
critical location) using measured strains under daily
traffic. Then, a set of new measured strain samples is
derived by a statistical approach, termed the bootstrap
method. The bootstrap produces new samples of measured
strains, which reproduce extremely complex statistical
properties of the available strain observations. The boot-
strap is used to predict future strain ranges considering the
relevant number of cycles that define the service life of a
steel bridge. In addition, a life index is defined for ulti-
mate service life prediction of existing steel bridges.
Since service life prediction of bridges is a key issue for
managing effective decisions by BMS, a regression model
is developed using stresses and the associated number of
cycles for service life prediction by examining changes in
the service life index. These changes lead to a service life
function that is defined as the number of cycles experi-
enced by a steel bridge under actual changes of daily
traffic using only measured strains. The proposed
regression model can be used to evaluate the ultimate
fatigue life and remaining fatigue life at critical locations
on the existing steel bridges. Here, service life and fatigue
life are assumed to have the same meaning.
2 Fatigue Theory
Fatigue damage is a cumulative process related to the
number of loading cycles experienced by each specimen
through the load carrying system of a structure. The
number of loading cycles experienced by each specimen is
expressed as a percentage of the failure life at a given stress
level, which is proportional to the expected remaining life.
All fatigue cycles are converted to the same stress level and
the cumulative effects are determined. Miner and Calif
(1945) suggest that, ‘‘when the total damage, as defined by
this concept, reaches 100 percent of the fatigue life, then
the structural element would fail’’ [4]. Bridges are sub-
jected to a high number of heavy trucks loading cycles
during their service life. As a result, bridge steel compo-
nents are directly subjected to this cyclic loading, which
can lead to fatigue damage, in particular, at steel
connections.
The damage (D) is a function of the number of loading
cycles applied to the failure at a specific stress level. It can
be shown as, Di = f (ni/Ni), where, ni is the number of
cycles applied at a specific stress level (ri) and Ni is the
number of cycles applied at the same stress level to fatigue
failure. The relationship between stresses and the number
of cycles is linear based on Miner’s rule. Miner assumed
when the summation of increments of damage, ni/Ni, for
different stress levels is equal to unity then fatigue failure
occurs [16]. This protocol for the estimation of fatigue life
in steel structures is computed as,X
Di ¼X ni
Ni
¼ 1 ð1Þ
There is a constant amplitude fatigue threshold (CAFT)
for each S–N curve. CAFT is also called endurance limit,
fatigue limit, and fatigue strength. It is a threshold value of
stress range, below which the specimen will not develop
fatigue cracks during the expected life of the bridge. When
the stress is below this limit, the material may endure an
infinite number of cycles without failure, ‘‘therefore, a
requirement on higher-traffic-volume bridges that the
maximum stress range experienced by a detail be less than
the constant amplitude fatigue threshold provides a theo-
retically infinite fatigue life, leading to heavier and more
expensive steel structures. Instead, the maximum stress
range experienced by a detail which is more than the CFAT
estimates a theoretically finite fatigue life’’ [17].
In this paper, it is assumed that critical components are
free of cracks. However, if such components suffer from
cracks, the cycles below the CAFT should be considered
for service life prediction using results of other researchers
[5]. The provided S–N curve protocol estimates the fatigue
damage when the maximum stress range experienced by a
bridge component exceeds the CAFT. Fatigue endurance
strain is related to fatigue endurance stress through
Hooke’s law for uniaxial linear elasticity. This is a nec-
essary ingredient for comparison of analytical strains with
measured strains of steel specimens.
3 Assessment of Bridge Failure
Failure is a general term that refers to two conditions:
collapse and distress (unserviceability). It is defined as the
inability of a constructed facility; in this case a bridge or its
components, to perform as specified in the construction and
by design documents [18]. Bridge collapse refers to the
failure of all or a substantial part of a bridge that then
requires full or partial replacement [19]. Collapse is the
loss of integrity and it occurs when the entire or a sub-
stantial part of a structure comes down, in which the
structure loses the ability to perform its function in carrying
a designed load. Collapse can be further classified into two
categories: catastrophic collapse and partial collapse.
Catastrophic collapse implies that several primary struc-
tural members of a span have fallen down, such that no
travel lane is passable. Partial collapse suggests a condition
where some of the primary structural members of a span
Int. J. Civ. Eng.
123
Author's personal copy
have fallen down, where such a condition endangers the
lives of those traveling on or under the structure. Distress is
the unserviceability of a structure or its components. Dis-
tress may or may not result in a collapse. In this situation,
the structure undergoes some deformation without losing
whole structural integrity. Loss of serviceability refers to a
condition where there are no signs of structural distress or
collapse; however, large deformations can lead to a loss of
function and the bridge may be closed. In summary, bridge
collapse and distress (unserviceability) are subsets of
failure.
Bridges are fabricated and constructed with many
structural components and there are numerous welded and
bolted connections. These connections are mostly the
critical locations for fatigue damage and failure; therefore,
special attention must be given to structural connections.
Values of fatigue damage in the vicinity of welded and
bolted connections are compared for detection of possible
fatigue failure locations [20]. The fatigue behavior is
investigated at critical locations of steel bridges. Since
failure of connections in fracture critical steel components
can result in bridge failures, then service life of the steel
bridge and predicted life of the critical components can be
the same. A fracture critical bridge is defined by the
FHWA as a steel member in tension, or with a tension
element, whose failure would probably cause a portion of
or the entire bridge to collapse. In this paper, a method-
ology for service life prediction of steel bridges is pre-
sented by an evaluation of steel connection fatigue failure
as critical locations under high-cycle fatigue analysis using
a proposed service life function.
4 Service Life Function
A primary goal in this paper is to develop a service life
function, f(l), to predict service life of existing steel
bridges, which accounts for the daily variation in bridge
loads. Each S–N curve contains many points and failure of
each steel component can occur at one of these points,
which are unknown for each component. It is possible to
predict service life of a steel component if that point on S–
N curve can be found. This is called the equivalent point,
which is determined by the service life function. Steel
components endure many variable stress cycles in their
service life. The stress cycles are determined at each crit-
ical location on a steel component and are converted into
an equivalent point on corresponding S–N curve using
Miner’s rule. Then the service life of steel component can
be evaluated by the service life function of that point on the
S–N curve. The service life function is a decreasing
function of the life index. It would be possible to assess
service life of steel bridges if measured responses were
available for their entire service life. Although not all
variable stresses of steel components, which are related to
their service life, can be determined, some of the stresses
can be calculated by measured strains. Here, all other
stresses are calculated from actual stress measurements
using the bootstrap. Then, the bootstrap method is
employed to generate all variable stresses of steel compo-
nents. As a result, the service life of existing steel bridges is
predicted based on the service life function. This function
is not a damage index to depict safe or unsafe condition of
bridges rather the service life function illustrates the rela-
tionship between our experiences of the percentage of
elapsed service life against ultimate service life of steel
bridges. It is used for the calculation of the remaining
service life of steel bridges.
5 Bridge Survival Distribution Function WithHeavy Truck Events Using Bootstrap Method
Our proposed method requires monitoring of steel bridges
with strain gages. When trucks are moving over bridges
instrumented with strain gages mounted on steel compo-
nents close to structural connections, the data acquisition
system gathers strain measurements. These measured
strains are represented by a single random variable ei. Thebehavior of the magnitude and frequency of this random
variable is completely and uniquely determined by its
probability density function (PDF), f(e), which denotes the
probability of occurrence of the random variable e. Thecumulative distribution function (CDF), F(e), describes thenon-exceedance probability that the random variable ei isless than or equal to some value x. The CDF is used to
define its complement, known as the survival distribution
function (SDF). The survival distribution function of x
describes the exceedance probability associated with x such
that,
S eð Þ ¼ 1� F eð Þ ¼ P e� xð Þ ¼Z1
x
f eð Þde ð2Þ
where, e = measured strain, f eð Þ = probability density
function (PDF), F eð Þ = cumulative distribution function
(CDF), S eð Þ = survival distribution function (SDF)
The SDF is also known as the survival function. Life-
times of various processes are described using the SDF
[21–23], which is simply the complement of the CDF.
Knowledge of the SDF for the measured strains is needed
to predict the service life of steel bridges. There are two
main categories of statistical approaches for the estimation
of the SDF, parametric and nonparametric. A parametric
method assumes a theoretical distribution function that
requires selection of a suitable form for the SDF and
Int. J. Civ. Eng.
123
Author's personal copy

estimation of the SDF’s model parameters. Researchers
have shown that the SDF of bridge strain data exhibits very
complex shapes, which are challenging to model using
traditional analytic SDF models [24]. Instead, a nonpara-
metric statistical approach, the bootstrap method, is used to
estimate the SDFs from lifetime data, which, in this case,
are the strain measurements.
The bootstrap method is a computational approach that
replaces complex analytical statistical theory with com-
puter intensive resampling of the available data. It can be
used to solve nearly any traditional statistical problem.
Bootstrapping is implemented by resampling observations
from an independent and identically distributed set of
observed data, with replacement to create additional data
sets. The bootstrap samples will have the same properties
as the original measurements as long as the resampled
observations are independent and identically distributed.
The bootstrap samples can then be used in further sta-
tistical analysis. The bootstrap can be used to reliably
distinguish changes in SDFs associated with bridge strain
measurements during its service life as was shown by
Follen et al. [25]. An SDF and its sampling properties are
readily determined using the bootstrap resampling
method. In the field of structural engineering, Bigerelle
and Iost [26] and Bigerelle et al. [27] employed bootstrap
analysis for fatigue life prediction. Their research showed
that the bootstrap is a powerful tool for modeling prob-
ability density function of fatigue life time prediction
[26, 27]. The theory of the bootstrap has shown that, for
independent and identically distributed random variables,
such resampling with replacement preserves all the sta-
tistical properties of an independent data set, including its
SDF and CDF [28].
Here, the estimation of the service life function is
described using the bootstrap method. It provides a simple
approach for the reproduction of the extremely complex
probability distribution of measured strain data. It is
completely automated numerical method which requires no
theoretical calculations and it is not based on the asymp-
totic results. The estimation is accomplished by randomly
drawing a large number of samples of size m from the
original sample (measured strain data), with replacement.
Here, the variable of interest is the strain associated steel
components during their service life. Each bootstrap sam-
ple could include some of the original data points more
than once, and possibly some observations may not be
resampled. Therefore, each of these bootstrap samples will
randomly depart from the original sample, yet theoreti-
cally, will exhibit the same probabilistic structure as the
original sample [28]. Consider a random sample of size m,
which is observed from an unknown probability distribu-
tion F,
Xi ¼ ei;Xi �F i ¼ 1 to m ð3Þ
where, Xi is identically and independently distributed
according to some unknown probability distribution. F and
ei are observed random sample of size m from measured
strain data.
The use of the bootstrap method for generating new
samples of length m from the measured data is as follows:
(1) Create the sample probability distribution F̂, putting
numerical mass 1/m at each point e1, e2, e3,…, em.
(2) Draw a random sample of size m from F̂ with F̂
fixed, as,
X�i ¼ e�i ;X
�i � F̂ i ¼ 1; 2; . . .;m ð4Þ
Call this the bootstrapped sample j where
X� ¼ X�1 ;X
�2 ; . . .;X
�m
� �, e� ¼ e�1; e
�2; . . .; e
�m
� �[29].
Two common questions, which arise during the boot-
strap process, are: (1) determining how large of a sample is
required (m) to fully specify the SDF, and (2) figuring out
how many bootstrap samples are needed to construct
confidence intervals for the resulting SDF. Both of these
issues are addressed by Follen et al. [25] and in the dis-
cussion below.
6 Histograms of Maximum Strain Outputsfrom Recorded Truck Events
An important aspect measured data quality is the noise that
is present during measurements. Because the maximum
strain measurement from each sensor is used for each truck
event in this method, the signal-to-noise ratio is always
high. As long as the signal-to-noise ratio is high in the
Fig. 1 Schematic histogram of maximum strains for measured truck
events
Int. J. Civ. Eng.
123
Author's personal copy
measurements that make up the signature distribution,
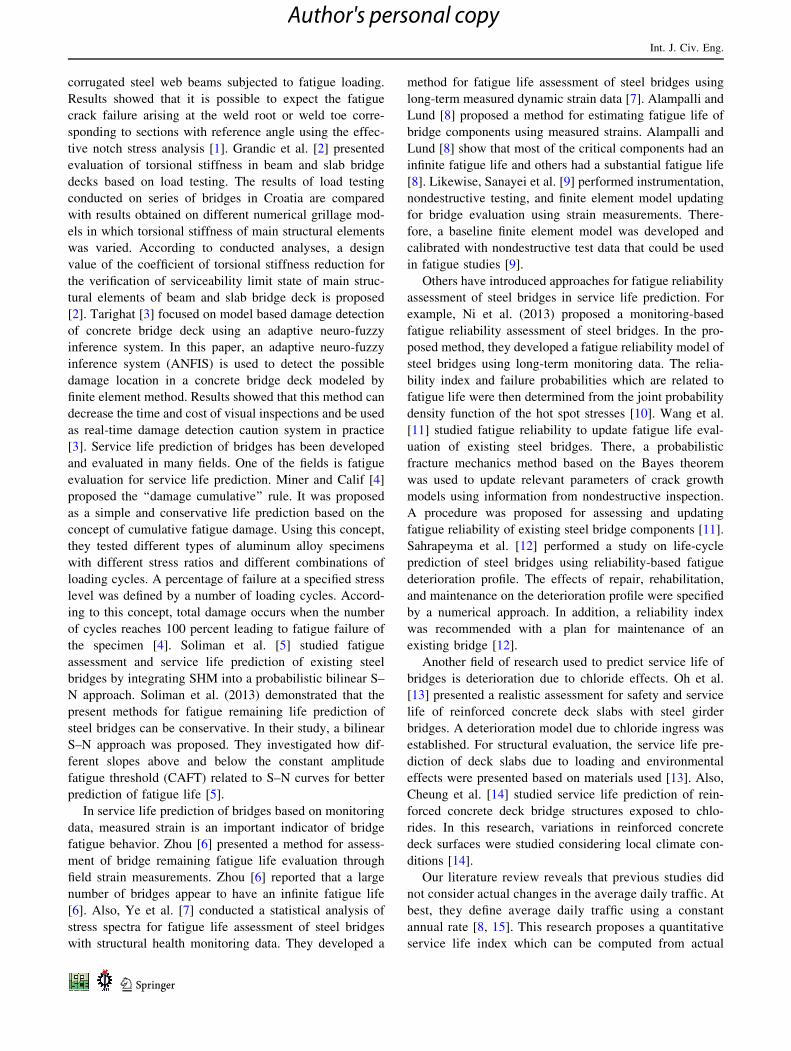
measurement noise is unimportant [25]. Figure 1 illustrates
an example histogram of the maximum strain output per
event. Based on the histogram, a heavy truck event is
defined as an event from which the maximum strain output
is greater than eCAFT, with corresponding live load stress
level of rCAFT. This histogram represents the PDF of
maximum strain output of heavy truck events, and defines
the PDF f(e), where e is the measured strain. The shape of
such a PDF is extremely complex. To avoid the need for
specifying a theoretical PDF, the bootstrap is employed as a
nonparametric alternative because the bootstrap can repro-
duce the properties of any PDF, no matter how complex.
7 Defining Heavy Truck Events Using the StrainThreshold
The strain monitoring system is currently set up to depict
strain data for vehicles weighing more than eCAFT. As
stated, fatigue damage is cumulative and can occur at
different stress levels based on the number of cycles.
Highway trucks apply different weights based on truck type
and cargo weight. As a result, the stress levels received at a
critical location on a steel component may vary from cycle
to cycle. The significant feature of the cumulative damage
concept lies in the hypothesis that failure occurs whenPniNi¼ 1. Where n is number of cycles for each truck
event, which can be equal to 1, 1.5, 2 or 5 [30]. N is the
number of cycles to fatigue failure applied at a specified
stress level. It is noted, if there is a continuous time history
for measured strain data, a rainflow method will be used for
counting number of fatigue cycles. The rainflow method
would be beneficial for counting the actual number of
induced cycles [31].
8 Construction of SDF of Maximum StrainOutputs
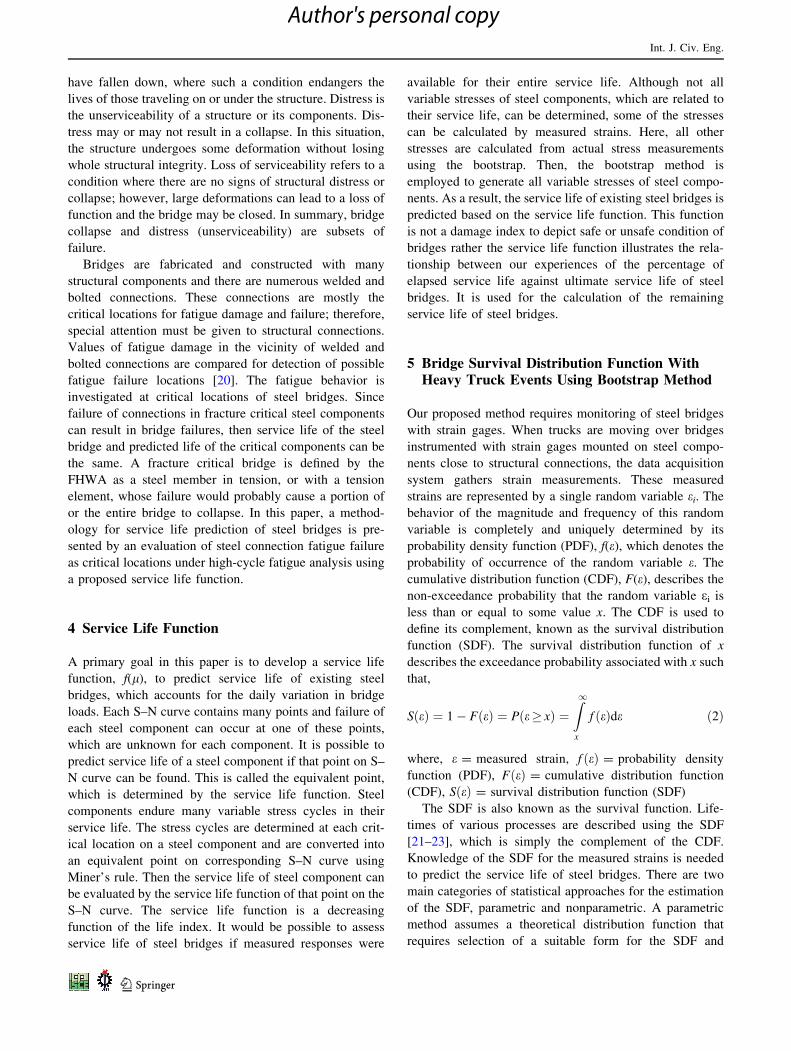
For m heavy truck events at a hot spot and i = 1 to m, the
absolute maximum strain values per event, e(i), are ranked
such that e(1) is the largest observed value (emax) and e(m) isthe smallest (eCAFT), as shown in Fig. 2. The SDF is a plot
of the ranked values of absolute maximum strain output per
heavy truck event against its probability of exceedance (pi)
based on a Weibull plotting position pi = i/(m?1), where
m is the sample size, and i is the rank of the observation.
The Weibull plotting position is suitable because it pro-
vides an unbiased estimate of the exceedance probabilities
regardless of the theoretical PDF from which the obser-
vations arise [32].
9 Sample Size Needed for StatisticallyStable and Independent SDFs
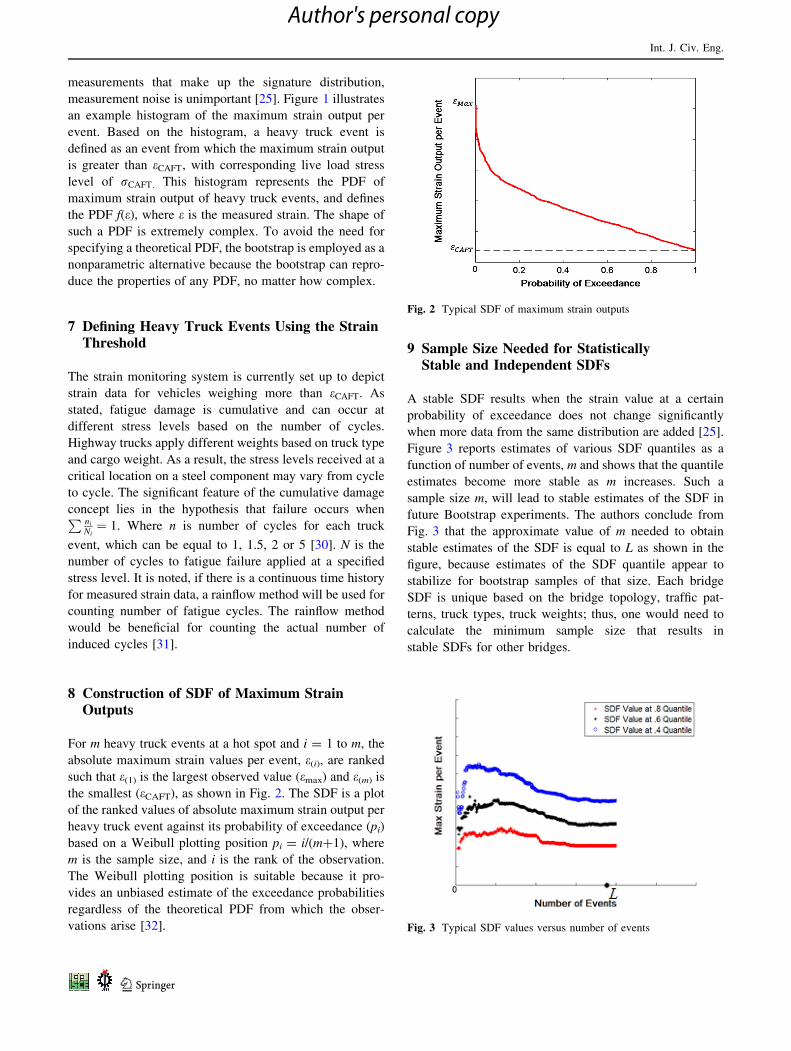
A stable SDF results when the strain value at a certain
probability of exceedance does not change significantly
when more data from the same distribution are added [25].
Figure 3 reports estimates of various SDF quantiles as a
function of number of events, m and shows that the quantile
estimates become more stable as m increases. Such a
sample size m, will lead to stable estimates of the SDF in
future Bootstrap experiments. The authors conclude from
Fig. 3 that the approximate value of m needed to obtain
stable estimates of the SDF is equal to L as shown in the
figure, because estimates of the SDF quantile appear to
stabilize for bootstrap samples of that size. Each bridge
SDF is unique based on the bridge topology, traffic pat-
terns, truck types, truck weights; thus, one would need to
calculate the minimum sample size that results in
stable SDFs for other bridges.
Fig. 2 Typical SDF of maximum strain outputs
Fig. 3 Typical SDF values versus number of events
Int. J. Civ. Eng.
123
Author's personal copy

10 SDF of Maximum Stress Outputs for MeasuredStrains
The relation between stress and strain for most steel
materials used in steel bridges is a linear elastic behavior,
known as Hooke’s Law. The relation between the strain
amplitude and fatigue life cycles is usually given as stress-
number of cycles curves (S–N curves); therefore, it is
necessary to compute stress levels using measured strains.
As a result, stresses are defined as a function of measured
strains. Recall that Fig. 2 illustrates, for L heavy truck
events (i = 1 to L), the SDF of maximum stress output for
each event is defined as the ordered values of the maximum
stress output per heavy truck event (r(i)) plotted against
their probability of exceedance (pi) using a Weibull plot-
ting position pi = i/(L ? 1) as shown in Fig. 4. Here,
values of r(i) are ranked such that r(1) is the largest
observed stress associated with emax and r(L) is the smallest
associated with eCAFT. Figure 4 provides the first SDF,
which is termed g1, based on the necessary sample size L.
11 Conversion of stresses to maximum stressbased on Miner’s rule
All stresses in Fig. 4 are converted into their maximum r(1)using Miner’s rule to calculate N�
g1. Then, all the cycles
associated with each stress level are converted into a ref-
erence number of cycles N�g1
� �which is given as,
N�g1 ¼ n1ð Þg1þ
XL
i¼1
N1ð Þg1Nið Þg1
nið Þg1 ð5Þ
where, n1ð Þg1 = number of stress cycles applied at a given
stress level r1 associated with the heaviest truck event,
N1ð Þg1 = number of cycles until fatigue failure applied at
stress level r1 according to S–N curve, nið Þg1 = number of
stress cycles applied at a given stress level ri,Nið Þg1 = number of cycles until fatigue failure applied at
stress level ri associated with each truck event.
Now, N1ð Þg1 and N�g1 are compared. If
N�g1
N1ð Þg1� 1, then
N�g1 will be used to calculate the service life, otherwise, the
algorithm will continue to generate more number of cycles
until total damage reaches 100 percent; therefore, the first
point of life index graph is determined as r1ð Þg1;N�g1
� �.
Again, r1ð Þg1 is the largest observed stress associated with
emax in the first graph illustrated in Fig. 4.
12 Development of Heavy Truck Events Basedon Bootstrap Method
The goal of this section is to develop numerous SDF’s of
maximum stress outputs using the bootstrap method. The
bootstrap method is used to develop new sets of resampled
data comprising maximum stress outputs from the mea-
sured maximum stress data. Each new bootstrap sample is
then used to develop an SDF corresponding to that boot-
strap sample similar to the approach suggested by Follen
et al. [25]. Similar to Fig. 4, the SDF of bootstrapped
maximum stress outputs is plotted as a new graph, g2.
Figure 5 illustrates two estimates of the SDF of maximum
stress outputs, one is derived from use of the bootstrap and
one is based on the original sample. The two estimates are
based on the same sample size L. The SDF’s are sorted in
descending order as shown in Fig. 5 where j is the number
of each graph after sorting. Previous sections will repeat for
the new graph. At first, N related to maximum stress in the
new graph will be calculated according to S–N curve,
referred to as N1ð Þg2. Then, stresses will be converted into
Fig. 4 Typical SDF of maximum stress outputs based on required
sample size (g1) Fig. 5 Typical decreasing SDFs of maximum stress outputs
Int. J. Civ. Eng.
123
Author's personal copy

maximum stress r1ð Þg2 to calculate of N�g2. In Fig. 5;
r1ð Þj¼1¼ r1ð Þlarger and r1ð Þj¼2¼ r1ð Þsmaller.
N�g2 is a conversion of all cycles for each stress level
into a reference number of cycles based on the specified
number of cycles of stress data points, which is expressed
as,
N�g2 ¼ n1ð Þg2þ
XL
i¼1
N1ð Þg2Nið Þg2
nið Þg2 ð6Þ
where, n1ð Þg2 = number of stress cycles applied at a given
stress level r1 in bootstrapped graph, N1ð Þg2 = number of
cycles until fatigue failure applied at stress level r1 in
bootstrapped graph, nið Þg2 = number of stress cycles
applied at a given stress level ri in bootstrapped graph,
Nið Þg2 = number of cycles until fatigue failure applied at
stress level ri in bootstrapped graph.
Then, the calculated number of cycles using Miner’s
rule are compared. IfN�ð Þj¼1
Nð Þj¼1þ N�ð Þj¼2
Nð Þj¼2� 1, the N�ð Þj¼1 and
N�ð Þj¼2 will be used to estimate the bridge connection
service life. Otherwise, the algorithm will continue to
generate more cycles until total damage reaches 100 per-
cent. In this section, the second point of the life index graph
is determined as r1ð Þg2;N�g2
� �. As a result, the algorithm
will continue untilPk
j¼1
N�ð ÞjNð Þj
¼ 1, where j is the number of
sorted graphs in descending order as; j = 1 is the largest
graph and j = k is the smallest graph and k is the number of
repetitions of the stress history to failure using bootstrap
method. r1ð Þj are sorted decreasing graphs including r1ð Þgias i = 1, 2, 3, …, k.
13 Life Index and Cumulative Number of Cycles
According to the obtained points, a graph of the maximum
stresses vs. cumulative number of cycles will be plotted.
Therefore, for all the points the absolute maximum stress
values and dependent number of cycles will be ranked from
the largest to the smallest. Then Ncumulative is given as,
Ncumulative ¼ N�j¼1 þ
Xk
j¼1
Nð Þj¼1
Nð Þj¼k
N�j¼k ð7Þ
where, N�j¼1 = number of stress cycles applied at the lar-
gest maximum stress level r1ð Þj¼1, Nð Þj¼1 = number of
cycles until fatigue failure applied at the largest maximum
stress level r1ð Þj¼1, N�j¼k = number of stress cycles applied
at the smallest maximum stress level r1ð Þj¼k,
Nð Þj¼k = number of cycles until fatigue failure applied at
the smallest maximum stress level r1ð Þj¼k:
The service life index (lj) is defined by mapping all the
stresses on a range of [0, 1] as,
lj ¼ðr1Þj � ðr1Þmaxj
ðr1Þminj � ðr1Þmaxj
for j ¼ 1; 2; 3; . . .; k ð8Þ
where, r1ð Þj is the maximum stress level for each boot-
strapped graph, similar to Fig. 5. The min j and max
j indices values are equal to 1 and k, respectively.
Aging of a steel bridge over a period of time can be
calculated by the piecemeal decrease of life index. This
means that the service life index will gradually decrease as
the steel bridge ages until fatigue failure.
The service life index starts from unity. Unity is the first
point of life index, which shows a steel bridge is undam-
aged and no repair is deemed necessary. On the other
hand, when the service life index is less than one, the steel
bridge is subjected to fatigue cycles, with a collapse pre-
dicted as lj, which is equal to zero, and approaches
Ncumulative. The service life index can be used as a reliable
fatigue signature to evaluate the age condition of existing
steel bridges under load cycles and can also be used to
predict the remaining service life. This is documented
below how the service life index can be used as an indi-
cator for steel bridge service life prediction subjected to
cyclic loadings.
14 Determination of Service Life Basedon Regression Analysis Using Service LifeFunction
A curve is fitted through the points (lj vs. Ncumulative) using
ordinary least squares regression to fit the function f lð Þ.The function f lð Þ is defined as the service life function.
Regression analysis identifies and quantifies the function
f lð Þ that determines the number of stress cycles applied at
the maximum stress levels. This function represents actual
changes of average daily traffic (ADT), a unique feature of
this research. Average daily traffic is equal to the total
heavy truck traffic volume during a given time period,
ranging from one day to one year, divided by the number of
days in that time period. It should be noted that this value
will vary year to year. In fact, due to an increasing demand,
the ADT for a given bridge generally increases. Hence, the
number of cycles can change throughout the service life of
steel bridges. When the life index of a specific bridge is
calculated based on measured stresses, and then the number
of cycles related to actual changes of traffic will be
determined by substituting the value of calculated life
index into the service life function. The measured stresses
are experienced based on actual traffic loads. The following
inverse exponential function f lð Þ is proposed for modeling
Int. J. Civ. Eng.
123
Author's personal copy

service life because it captures the shape relationship
between the service life indices and cumulative number of
cycles.
f lð Þ ¼ a� ln 1� lð Þb
� �c
ð9Þ
where, constants a, b, and c are specific values for each
steel bridge and f(l) represents the number of stress cycles
applied at the maximum stress levels for a given service
life index l.The function f lð Þ in Eq. (9) is also useful as an
approximating function for possibly an algebraically
complex a nonlinear relationship in terms of the life index.
It is applicable to data sets, which are naturally related to
bending curvature, and can be used to fit trends with
complex curvature with no particular theoretical function.
The estimated function f lð Þ can be used for service life
predictions. If daily strain values for truck events are
measured on a bridge, then the actual change in ADT can
be determined for each year. Hence, the number of cycles
can change throughout a bridge’s service life. To consider
the actual change in ADT, the extracted, measured, maxi-
mum stress level of the bridge will be calculated due to
heavy truck events after a specific time interval. Then, a
life index corresponding to this stress level is calculated
using Eq. (8). The induced number of cycles at this stress
level is determined by Eq. (9) based on the actual change
of ADT. Steel bridge remaining service life at the equiv-
alent point is estimated as,
T ¼ Ncumulativeð Þ � f lð ÞNADTð ÞHeavytrucks
ð10Þ
where, NADTð Þ represents the number of cycles for average
daily traffic in one year for heavy trucks. The presented
theory for service life prediction of existing steel bridges
using measured strain data is summarized in the
flowchart as shown in Fig. 6.
In summary, for the application of the presented pro-
cedure for service life prediction to a full-scale steel bridge,
first, all the critical components are determined. Then,
measured strains are gathered for all the critical locations
on the critical components. Probability density function,
cumulative distribution function, and survival distribution
function of measured strain data are determined. After,
determining the required sample size for a stable statistical
survival distribution function, maximum stresses are cal-
culated from measured strain data for each truck passage.
SDF of maximum stress data are plotted and all the stress
data are converted into their maximum r1ð Þg1 using
Miner’s rule. Also, the number of cycles associated with
each maximum stress level is converted into a reference
number of cycles, N�g1. Using the bootstrap method, max-
imum stress data are extended to more data as future
events. Similar to SDF of maximum stress data, all the
SDFs of bootstrapped stress data are plotted. Then, the
maximum stress data associated with each bootstrapped
SDF is converted into its maximum stress for each SDF.
Maximum stress values and associated number of cycles
Fig. 6 Procedure for steel bridge service life prediction
Int. J. Civ. Eng.
123
Author's personal copy

N�gi, which is labeled N�
j are ranked from the largest to the
smallest. The cumulative number of cycles is calculated
from the associated number of cycles for each truck pas-
sage and then life indexes are determined by a mapping the
stresses into a range of [0, 1]. After plotting the life index
points vs. cumulative number of cycles, a service life
function is fitted through the points using regression anal-
ysis. Finally, remaining service life of the steel bridge is
determined using the cumulative number of cycles, the
service life function, and the average daily traffic volume
related to the bridge.
15 Conclusions
A simple and reliable statistical method is presented for
service life prediction of steel bridges which is based on
measured strain data gathered from a real-time structural
health monitoring system over a specified time period. The
following innovations were used in the proposed method:
1. A nonparametric bootstrap method is employed for
generation of new samples of measured strain data,
which are then used to simulate stresses of steel
bridges under daily traffic loads. This paper presents
describes how the bootstrap method can be used to
predict possible future fatigue cycles as a nonparamet-
ric statistical tool. This method uses computer simu-
lations to replace the complex theoretical probabilistic
assumptions and models required for most statistical
approaches used to summarize probability
distributions.
2. A service life index is introduced based on the survival
distribution function of the maximum stresses, using
Miner’s rule according to the steel linear elastic
behavior. This quantitative index enables the predic-
tion of the ultimate service life of existing steel bridges
based on the number of cycles.
3. Also, a service life function as a nonlinear service life
function is proposed for the prediction of remaining
service life of steel bridges. This function can be used
for modeling relationships between life index and
cumulative number of cycles using regression analysis.
The proposed service life function can predict the
remaining service life for any arbitrary future time
period within the range of values considered in the
experiments. The fitted service life function was
capable of considering the actual changes in the
average daily traffic for the prediction of remaining
service life.
4. In a structural health monitoring program, service life
of a steel bridge can be calculated using the proposed
function based on regression analysis which presents a
powerful tool for determining accuracy of statistical
functions. As a result, this method predicts the number
of cycles under fatigue behavior which a steel bridge
can endure in its service time period. The proposed
service life prediction can contribute to effective
management of steel bridges.
References
1. Wang ZY, Wang QY, Jiang RJ (2015) Finite element based
fatigue assessment of corrugated steel web beams in highway
bridges. Int J Civ Eng 13(4A):419–431
2. Grandic IS, Grandic D, Bjelanovic A (2015) Evaluation of tor-
sional stiffness in beam and slab bridge decks based on load
testing. Int J Civ Eng 13(3A):255–266
3. Tarighat A (2013) Model based damage detection of concrete
bridge deck using adaptive neuro-fuzzy inference system. Int J
Civ Eng 11(3):170–181
4. Miner MA, Calif SM (1945) Cumulative damage in fatigue.
J Appl Mech 12:A159–A164
5. Soliman M, Frangopol DM, Kown K (2013) Fatigue assessment
and service life prediction of existing steel bridges by integrating
SHM into a probabilistic bilinear S-N approach. J Struct Eng
139:1728–1740
6. Zhou YE (2006) Assessment of bridge remaining fatigue life
through field strain measurement. J Bridg Eng 11:737–744
7. Ye XW, Ni YQ, Wong KY, Ko JM (2012) Statistical analysis of
stress spectra for fatigue life assessment of steel bridges with
structural health monitoring data. Eng Struct 45:166–176
8. Alampalli S, Lund R (2006) Estimating fatigue life of bridge
components using measured strains. J Bridg Eng 11:725–736
9. Sanayei M, Phelps JE, Sipple JD, Bell ES, Brenner BR (2012)
Instrumentation, nondestructive testing, and finite-element model
updating for bridge evaluation using strain measurements. J Bridg
Eng 17:130–138
10. Ni YQ, Ye XW, Ko JM (2010) Monitoring-based fatigue relia-
bility assessment of steel bridges: analytical model and applica-
tion. J Struct Eng 136:1563–1573
11. Wang CS, Hao L, Fu BN (2012) Fatigue reliability updating
evaluation of existing steel bridges. J Bridg Eng 17:955–965
12. Sahrapeyma A, Hosseini A, Marefat MS (2013) Life-cycle pre-
diction of steel bridges using reliability-based fatigue deteriora-
tion profile: case study of neka bridge. Int J Steel Struct
13(2):229–242
13. Oh BH, Lew Y, Choi YC (2007) Realistic assessment for safety
and service life of reinforced concrete decks in girder bridges.
J Bridg Eng 12:410–418
14. Cheung MS, Juan Z, Chan YB (2009) Service life prediction of
RC bridge structures exposed to chloride environments. J Bridg
Eng 14:164–178
15. Kwon K, Frangopol DM, Soliman M (2010) Bridge fatigue
reliability assessment using probability density functions of
equivalent stress range based on field monitoring data. Int J
Fatigue 32:1221–1232
16. Huckelbridge A, Kafali C, Gilmore D (2002) Implementation of
field strain measurements for fatigue lifetime evaluation,
Department of Civil Engineering Case Western Reserve
University Cleveland, Ohio 44106
17. Fisher JW, Mertz DR, Zhong A (1983) Steel bridge members
under variable amplitude. Long Life Fatigue Loading NCHRP
Project 4:12–15
Int. J. Civ. Eng.
123
Author's personal copy

18. Wardhana K, Hadipriono FC (2003) Instrumentation, nondestruc-
tive testing, and finite-element model updating for bridge evalua-
tion using strain measurements. J Perform Constr 17:144–150
19. US Department of Transportation Federal Highway Administra-
tion, Framework for Improving Resilience of Bridge Design,
FHWA-IF-11-016 (2011)
20. Chan THT, Li ZC, Ko JM (2001) Fatigue analysis and life pre-
diction of bridges with structural health monitoring data—part II:
application. Int J Fatigue 23:55–64
21. Domma F, Condin F (2014) A new class of distribution functions
for lifetime data. Preprint Submitt Reliab Eng Syst Saf. doi:10.
1016/j.ress.2014.04.026
22. Sakin R, Ay I (2008) Statistical analysis of bending fatigue life
data using Weibull distribution in glass-fiber reinforced polyester
composites. Mater Des 29:1170–1181
23. Belzunce F, Riquelme CM, Ruiz J (2013) On sufficient condi-
tions for mean residual life and related orders. Comput Stat Data
Anal 61:199–210
24. Hartzell AL (2011) Lifetime prediction. MEMS Reliab. doi:10.
1007/978-1-4419-6018-4_2
25. Follen C, Sanayei M, Brenner B, Vogel R (2014) Statistical
bridge signatures. J Bridg Eng. doi:10.1061/(ASCE)BE.1943-
5592.0000596,04014022
26. Bigerelle M, Iost M (1999) Bootstrap analysis of FCGR, appli-
cation to the Paris relationship and to lifetime prediction. Int J
Fatigue 21:299–307
27. Bigerelle M, Najjar D, Fournier B, Rupin N, Ios A (2006)
Application of lambda distributions and bootstrap analysis to the
prediction of fatigue lifetime and confidence intervals. Int J
Fatigue 8:223–236
28. Efron B (1981) Censored data and the bootstrap. J Am Stat Assoc
76:312–319
29. Efron B (1979) Bootstrap methods: another look at the jackknife.
Ann Stat 7(1):1–26
30. American Association of State Highway and Transportation
Officials, Interim Revision to the AASHTO LRFD Bridge Design
Specification, 6th edition, Washington, DC (2013)
31. Downing SD, Socie DF (1982) Simple rainflow counting algo-
rithms. Int J Fatigue 4(1):31–40
32. Stedinger JR, Vogel RM, Foufoula-Georgiou E (1993) Frequency
Analysis of Extreme Events, Chapter 18, Handbook of Hydrol-
ogy, McGraw-Hill Book Company, David R. Maidment, Editor-
in-Chief, 1993
Int. J. Civ. Eng.
123
Author's personal copy