Embed Size (px)
Citation preview
Li, Li, Chen and Sun
TRB 2016 Annual Meeting
Bridge Deterioration Prediction Using Markov-Chain Model Based 1
on the Actual Repair Status in Shanghai 2
3
4
Li LI 5
Associate Professor 6
Key Laboratory of Road and Traffic Engineering of the Ministry of Education 7
Tongji University 8
No. 4800 Cao’an Road, Jiading District, 201804, Shanghai, China 9
TEL:(+8621) 69580491, E-mail: [email protected] 10
11
Feng LI 12
Associate Professor 13
Key Laboratory of Road Structure and Material of the Ministry of Transport 14
Research Institute of Highway, Ministry of Transport 15
No. 8 Xitucheng Road, Haidian District, 100088, Beijing, China 16
TEL:(+8610) 62079161, E-mail: [email protected] 17
(Corresponding Author) 18
19
Zhang CHEN 20
Associate Professor 21
Key Laboratory of Road and Traffic Engineering of the Ministry of Education 22
Tongji University 23
No. 4800 Cao’an Road, Jiading District, 201804, Shanghai, China 24
TEL:(+8621) 69580491, E-mail: [email protected] 25
26
Lijun SUN 27
Professor 28
Key Laboratory of Road and Traffic Engineering of the Ministry of Education 29
Tongji University 30
No. 4800 Cao’an Road, Jiading District, 201804, Shanghai, China 31
TEL:(+8621) 69583810, E-mail: [email protected] 32
33
34
35
Submitted for Presentation and Publication at the 2016 Annual Meeting of the 36
Transportation Research Board 37
38
39
Submission date: July 31, 2015 40
Revision date: November 15, 2015 41
Word count: 6977 with 3 tables and 4 figures 42
Li, Li, Chen and Sun
TRB 2016 Annual Meeting
ABSTRACT 43
Bridge condition prediction is crucial in preparing future conservation budgets and five-year 44
capital programs for the construction and maintenance of bridges in Shanghai. A bridge 45
management system (BMS) has been formally used and promoted for urban bridge management 46
in Shanghai since 2004 and 16,623 bridge records have been accumulated. Although there are a 47
large amount of data records, predicting bridge deterioration precisely is difficult because the data 48
composition is complicated and the maintenance history is varied. Therefore, a Markov-chain 49
model was applied as a decision aid to consider the different conservation strategies. More than 50
66,000 data records were used to calibrate the model. The modeling considered two conservation 51
regimes: routine maintenance and minor repair, and medium and major repair. The repair rate was 52
obtained through an actual conservation survey. Besides the influence of spatial distribution, 53
different characteristics of bridges also were considered. Bridge conservation efforts were uneven 54
at the city level in Shanghai. The condition of bridges in the central city is much better than those 55
in suburban areas, although the proportion (55.6%, 2014) of suburban bridges is larger. 56
Furthermore, based on the present status of Shanghai bridges, conservation efforts have been 57
insufficient generally, and even worse in suburban areas. The medium and major repair level at 58
present has had a significant impact on deck systems and superstructure, but quite a small impact 59
on substructure and the whole bridge. Thus, the present conservation efforts cannot improve the 60
overall bridge condition fundamentally. As a result, the condition of bridges in Shanghai has 61
deteriorated rapidly. 62
63
Key words: Markov chains; Bridge deterioration; Bridge prediction; Bridge repair 64
65
66
67
68
69
70
71
72
73
74
75
76
77
78
79
80
81
82
83
84

Li, Li, Chen and Sun
TRB 2016 Annual Meeting
INTRODUCTION 85
The condition assessment and prediction of bridge infrastructure is crucial in preparing future 86
conservation budgets and five-year capital programs for the construction and maintenance of 87
bridges in Shanghai. A bridge management system (BMS) has been formally in use for urban 88
bridge management in Shanghai since 2004, following an initial trial of the BMS in 2002. At 89
present, the stable version of the BMS has successfully worked more than 11 years. All of the 90
bridges are inspected once a year and 16,623 bridge assessment records have been accumulated. 91
As small and moderately sized bridges make up the majority of the urban bridges, the data records 92
in the Shanghai BMS all describe bridges belonging to categories II to V according to the Chinese 93
technical code of urban bridges management CJJ 99-2003 [1], which excludes the super-large 94
bridges (bridges with total span more than 1000 meters or single span more than 100 meters.). 95
The technical status of bridges in the Shanghai BMS is quite complicated because bridges 96
with different structure types and different material properties are included in the same database. 97
Besides, the bridge age span is also large, as shown in Figure 1, which means that bridges at 98
different stages of development coexist. Any reasonable performance assessment method should 99
avoid the bias caused by this large span in bridge age. Apart from this, the bridge conservation 100
status also exists in various forms, including routine maintenance and minor repair, medium repair, 101
major repair and even reconstruction. Consequently, the precise prediction of bridge deterioration 102
has become a challenge. A meaningful prediction modeling approach for such infrastructure is 103
usually on the network-level, considering the necessary size of the data sample. The outcomes of 104
network-level deterioration models are the prediction of condition changes with time of the given 105
bridge network and can be used to plan maintenance, including repair and rehabilitation of bridges, 106
and to calculate bridge life cycle cost [2]. This study only considered network-level deterioration 107
modeling. Also, a prediction approach considering a variety of impact factors will be used. 108
109
110
Figure 1 Bridge Age Span in Shanghai, China (as of 2014) 111
112
A prediction approach was sought that was capable of considering a variety of impact factors. 113
Deterministic and stochastic methods are the most common ways by which to develop such a 114
prediction method. The deterministic model assumes that the bridge deterioration tendency is 115
certain, so regression analysis is commonly used to determine the infrastructure decay rate; an 116
0
100
200
300
400
500
600
700
10
20
30
40
50
60
70
80
90
10
0
11
0
12
0
13
0
140
15
0
Oth
erNu
mb
er o
f bri
dge
(2014)
Bridge age (year)

Li, Li, Chen and Sun
TRB 2016 Annual Meeting
exponential regression model is widely used [3–5]. Typically, these models are relatively 117
convenient to calculate but fail to consider uncertainty and randomness of the bridge deterioration 118
process [6]. Besides, a high quality data set is also required for regression analysis, which is 119
usually hard to satisfy, and the preprocessing of data may cause too much risk of subjective 120
judgement [3]. Comparatively, stochastic models are better in such aspects. Engineering 121
experience can be used to describe the uncertain factors [7]. Although the deterioration processes 122
of bridge components are continuous, discrete condition ratings are often used to reduce the 123
complexity of continuous condition monitoring; this approach has been proved effective [8]. The 124
discrete probability models are represented by the Markov process, which is based on the concept 125
of probabilistic cumulative damage [9] and now commonly used in the performance prediction of 126
infrastructure facilities [10]. It is believed that models based on the Markov process have three 127
advantages [11]. Firstly, such models are able to reflect uncertainties of various aspects [12]. 128
Secondly, the prediction of a future state is based on the present state, so the model is incremental 129
[8]. And lastly, Markov-based models can be applied at network level with many facilities 130
involved, improving calculation efficiency [13, 14]. Some bridge management systems, such as 131
Pontis and BRIDGIT [15, 16], have adopted Markov models to predict the performance of 132
bridges. 133
Although the Markov process has been widely used in bridge performance prediction, most 134
applications focus only on a particular bridge component such as a deck, or directly consider the 135
bridge as a whole [11]. Besides, the sample size is not large enough in most applications [17]. 136
Some research has attempted to model the different deterioration characteristics of different bridge 137
components under certain maintenance regimes, but the bridge repair rates are all based on 138
assumption or empirical estimation, which is not rigorous enough to reflect the real performance 139
of bridges [18]. So there is often a performance gap between predictions and reality. Furthermore, 140
in some big cities or large infrastructure networks, infrastructure status in the central city and 141
suburban areas may be totally different due to the difference in the conservation investment level 142
or in the importance of traffic infrastructure. So it is not so reasonable to consider the bridges in 143
such situations as a whole even though the prediction is usually made on a network level. Rather, 144
the effect of infrastructure distribution should be taken into account. 145
The motivation of this study was to satisfy the need for a Markov-chain model that reflects 146
the real impact of actual bridge conservation status in Shanghai and that can predict the 147
performance deterioration tendency of different components of bridges in different areas (i.e., 148
central city and suburban areas). As for the Markov model, the key problem was to estimate the 149
transition probability matrixes (TPMs), a process also known as calibrating Markov models [19]. 150
A stationary Markov model uses time-independent TPMs by assuming a homogeneous 151
infrastructure deterioration pattern for a selected data set. Deterioration patterns of data sets with 152
similar characteristics, without medium or major repair in between, can be assumed to be 153
homogeneous when limited condition-rating data are available [2], and the stationary Markov 154
model could be considered in this situation. In other words, a single TPM can be used. 155
Therefore the actual objectives of this study were to calibrate a Markov-chain model using 156
bridge condition-rating records in Shanghai to predict the deterioration process of local bridge 157
infrastructures on a network level. To obtain actual bridge conservation data, a conservation 158

Li, Li, Chen and Sun
TRB 2016 Annual Meeting
survey was also conducted by searching the BMS database and accessing the infrastructure 159
industry reports from 2004 to 2013 [20]. 160
161
162
MODEL AND ASSUMPTIONS 163
Markov-chain model 164
A Markov process describes a system that can be in one of several states. Each state can pass to 165
another at each time step according to fixed probabilities. A Markov-chain model is a special case 166
of the Markov process for which time and state parameters are both discrete. A Markov chain can 167
be treated as a series of state transitions based on certain probabilities. A stochastic process whose 168
transition probability of a future state depends only on the present state is defined as a first-order 169
Markov process [21]. For a stochastic process {𝑋(𝑡), 𝑡 ∈ 𝑇}, if the conditional probability can be 170
expressed as Equation (1), {𝑋(𝑡), 𝑡 ∈ 𝑇} is a Markov chain having discrete parameters. 171
172
𝑃(𝑋𝑡+1 = 𝑖𝑡+1|𝑋0 = 𝑖0, 𝑋1 = 𝑖1, ⋯ , 𝑋𝑡 = 𝑖𝑡) = 𝑃(𝑋𝑡+1 = 𝑖𝑡+1|𝑋𝑡 = 𝑖𝑡) (1) 173
174
In Equation (1), 𝑖𝑡 is the process state at time t; and P is the conditional probability of a 175
future event. There are two assumptions about Markov chains. First, the future state of a stochastic 176
process depends only on the present state and has nothing to do with the past. Second, the 177
transition probability between two states should be constant. So the time step needs to be 178
determined properly to assure simple-state transition. 179
As mentioned above, urban bridges in Shanghai are inspected once a year, so the time 180
interval for the model was set to one year. As the bridge condition is usually evaluated using 181
several rating levels, the transition probabilities should be expressed as a transition probability 182
matrix. A typical TPM, P, is shown in Equation (2). 183
184
𝑃 = [(
𝑝11 ⋯ 𝑝1𝑛
⋮ ⋱ ⋮𝑝𝑛1 ⋯ 𝑝𝑛𝑛
)] {𝑝𝑖𝑗 ≥ 0 𝑖, 𝑗 ∈ 𝐼
∑ 𝑝𝑖𝑗 = 1𝑗∈𝐼 𝑖 ∈ 𝐼 (2) 185
186
In Equation (2), n is the number of bridge condition states; matrix element 𝑝𝑖𝑗 represents the 187
probability that the bridge condition will pass from state 𝑖 to state 𝑗 during a certain time step. 188
Therefore, if the initial bridge condition is known, the future condition after t time intervals can be 189
obtained using Equation (3), where C is the condition vector [22]. 190
191
𝐶(𝑡) = 𝐶(0) × 𝑃𝑡 (3) 192
193
The TPM is the key of the Markov-chain model and is commonly obtained by statistically 194
analyzing the bridge condition data. Two methods can be used to calculate the transition 195
probability matrix: the regression method based on nonlinear optimization [17, 23], and the 196
percentage method [24]. The regression method is affected significantly by the prior maintenance 197
actions, for which records may not be readily available. In the percentage method, the transition 198
probability is estimated by the proportion of number of state changes to the total number of states 199

Li, Li, Chen and Sun
TRB 2016 Annual Meeting
before the change. Thus, this method requires at least two consecutive condition records without 200
any maintenance interventions [11], which usually reduces the magnitude of data processing. 201
Because the requirement of the percentage method is comparatively easy to achieve, it was 202
selected for use in this study. 203
204
Model assumption and matrices simplification 205
In China, urban bridge conditions are graded by five levels for small and moderate bridges [1], as 206
shown in Table 1. For bridges with grades A to C, only routine maintenance and minor repair are 207
needed. According to the conservation requirements in the Chinese technical regulation [1], the 208
main work of the routine maintenance and minor repair is to mark the damaged area, find the 209
suspicious damage and keep the affected areas tidy. Thus, in such a situation, the condition rating 210
(CR) of a bridge should either maintain the original level or decay to the next lower level between 211
two consecutive years. In other words, the bridge CR grade cannot decay more than one grade in a 212
subsequent year. For bridges with grade D or E, more maintenance efforts are required, including 213
medium or major repair and even reconstruction. In this case, the bridge condition can be 214
improved, and thus the CR grade should be raised to any higher level according to the actual 215
repair efforts. According to the Shanghai bridge conservation investigation conducted in this study, 216
some universal principles can be summarized as follows: first, the medium repair is mainly for 217
D-grade bridges and the major repair is for E-grade bridges; second, both D- and E-grade bridges 218
will be improved to grade A after repair. However, there is also a situation that major repair is 219
implemented on grade D bridges if there is a surplus maintenance budget after all of the grade E 220
bridges are repaired. 221
222
Table 1 Urban Bridge Condition Ratings in China 223
Grade Definition Score
(100 mark system) Maintenance recommendations
A Intact 90-100 Routine maintenance
B Good 80-89 Routine maintenance and minor repair
C Qualified 66-79 Minor repair
D Unqualified/Bad 50-65 Medium or major repair
E Dangerous <50 Major repair or reconstruction
224
Therefore, three basic assumptions were made in this study based on the analysis above. 225
Assumption 1: in the circumstances of routine maintenance and minor repair, the CR of 226
a bridge should maintain the original level or decay to the next lower level between two 227
consecutive years. 228
Assumption 2: medium repair is mainly for grade D bridges and major repair is for 229
grade E bridges, but if there is a surplus maintenance budget, the major repair could be 230
implemented on grade D bridges. 231
Assumption 3: both D- and E-grade bridges will be improved to grade A after medium 232
or major repair. 233
Based on the CR definition in Table 1 and the assumptions above, the TPM in Equation (2) 234
Li, Li, Chen and Sun
TRB 2016 Annual Meeting
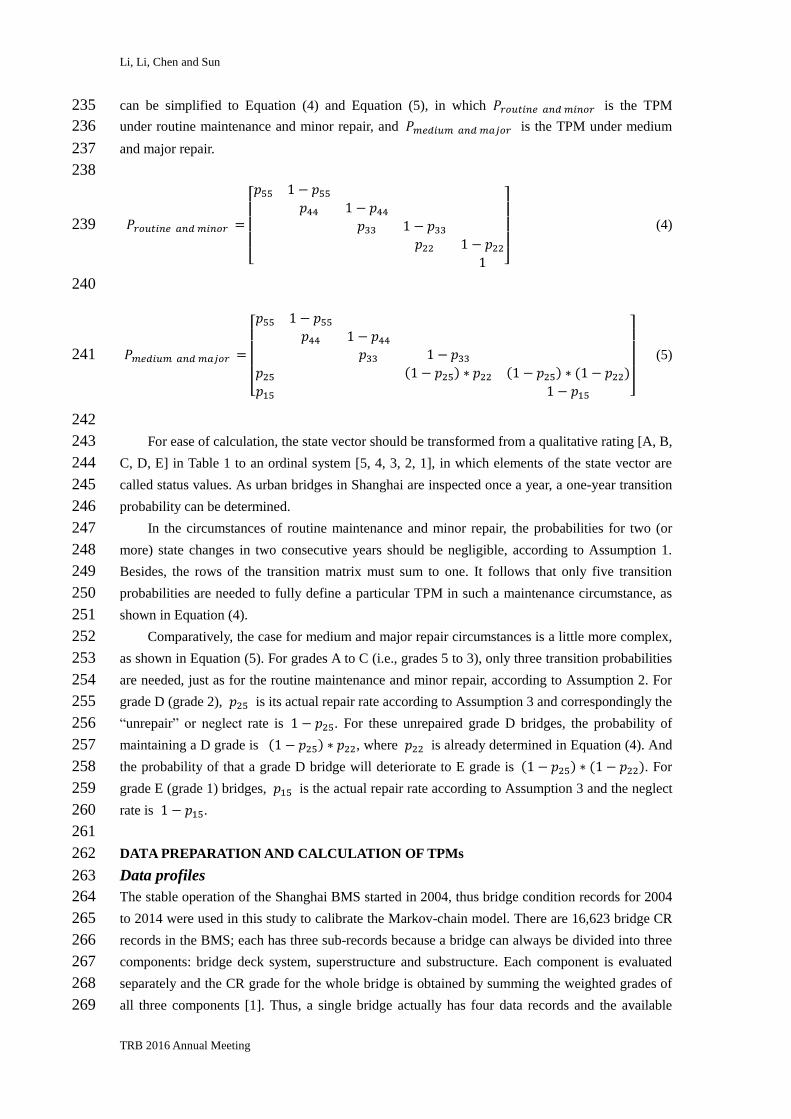
can be simplified to Equation (4) and Equation (5), in which 𝑃𝑟𝑜𝑢𝑡𝑖𝑛𝑒 𝑎𝑛𝑑 𝑚𝑖𝑛𝑜𝑟 is the TPM 235
under routine maintenance and minor repair, and 𝑃𝑚𝑒𝑑𝑖𝑢𝑚 𝑎𝑛𝑑 𝑚𝑎𝑗𝑜𝑟 is the TPM under medium 236
and major repair. 237
238
𝑃𝑟𝑜𝑢𝑡𝑖𝑛𝑒 𝑎𝑛𝑑 𝑚𝑖𝑛𝑜𝑟 =
[ 𝑝55 1 − 𝑝55
𝑝44 1 − 𝑝44
𝑝33 1 − 𝑝33
𝑝22 1 − 𝑝22
1 ]
(4) 239
240
𝑃𝑚𝑒𝑑𝑖𝑢𝑚 𝑎𝑛𝑑 𝑚𝑎𝑗𝑜𝑟 =
[ 𝑝55 1 − 𝑝55
𝑝44 1 − 𝑝44
𝑝33 1 − 𝑝33
𝑝25 (1 − 𝑝25) ∗ 𝑝22 (1 − 𝑝25) ∗ (1 − 𝑝22)
𝑝15 1 − 𝑝15 ]
(5) 241
242
For ease of calculation, the state vector should be transformed from a qualitative rating [A, B, 243
C, D, E] in Table 1 to an ordinal system [5, 4, 3, 2, 1], in which elements of the state vector are 244
called status values. As urban bridges in Shanghai are inspected once a year, a one-year transition 245
probability can be determined. 246
In the circumstances of routine maintenance and minor repair, the probabilities for two (or 247
more) state changes in two consecutive years should be negligible, according to Assumption 1. 248
Besides, the rows of the transition matrix must sum to one. It follows that only five transition 249
probabilities are needed to fully define a particular TPM in such a maintenance circumstance, as 250
shown in Equation (4). 251
Comparatively, the case for medium and major repair circumstances is a little more complex, 252
as shown in Equation (5). For grades A to C (i.e., grades 5 to 3), only three transition probabilities 253
are needed, just as for the routine maintenance and minor repair, according to Assumption 2. For 254
grade D (grade 2), 𝑝25 is its actual repair rate according to Assumption 3 and correspondingly the 255
“unrepair” or neglect rate is 1 − 𝑝25. For these unrepaired grade D bridges, the probability of 256
maintaining a D grade is (1 − 𝑝25) ∗ 𝑝22, where 𝑝22 is already determined in Equation (4). And 257
the probability of that a grade D bridge will deteriorate to E grade is (1 − 𝑝25) ∗ (1 − 𝑝22). For 258
grade E (grade 1) bridges, 𝑝15 is the actual repair rate according to Assumption 3 and the neglect 259
rate is 1 − 𝑝15. 260
261
DATA PREPARATION AND CALCULATION OF TPMs 262
Data profiles 263
The stable operation of the Shanghai BMS started in 2004, thus bridge condition records for 2004 264
to 2014 were used in this study to calibrate the Markov-chain model. There are 16,623 bridge CR 265
records in the BMS; each has three sub-records because a bridge can always be divided into three 266
components: bridge deck system, superstructure and substructure. Each component is evaluated 267
separately and the CR grade for the whole bridge is obtained by summing the weighted grades of 268
all three components [1]. Thus, a single bridge actually has four data records and the available 269

Li, Li, Chen and Sun
TRB 2016 Annual Meeting
data size is actually 66,492. All records had to be preprocessed before using them in TPM 270
calculations because (1) there may have been inspection errors in the BMS, and (2) all records had 271
to be subjected to the three assumptions used in this study to make sure the single TPM was valid 272
[2]. 273
The result of data preparation is shown in Table 2. The number of valid data records for the 274
bridge deck system was the smallest, probably because the deck inspections are based on visual 275
observation and this technique has the greatest variability. On the contrary, the number of records 276
for the inspection of substructure is steadiest over time, which means the decay of the substructure 277
is slow or the defects are hard to inspect. 278
279
Table 2 Number of valid data records 280
Bridge parts
Time interval
2004
2005
2005
2006
2006
2007
2007
2008
2008
2009
2009
2010
2010
2011
2011
2012
2012
2013
2013
2014
Deck system 627 859 879 1058 1227 1161 1153 1276 1366 1320
Superstructure 785 1094 1149 1227 1359 1386 1393 1410 1361 1499
Substructure 866 1133 1185 1309 1391 1480 1449 1499 1565 1632
281
It must be noted that although the bridge type and its material characteristics are varied in the 282
Shanghai BMS, data for concrete girder bridges comprise the majority (83.4% in terms of 283
structure type) of the entire data set, while records for reinforced concrete bridges and pre-stressed 284
concrete bridges accounted for 88.5% of the data set in terms of material type. Therefore the TPM 285
calculation based on these data could be considered homogeneous [2] and all the discussions in 286
this study mainly reflect the characteristics of such bridges in Shanghai. 287
288
TPMs Calculation 289
The 66,492 CR records of urban bridges in the Shanghai BMS from 2004 to 2014 (Table 2) were 290
used to calculate the TPMs. All of the data were preprocessed and validated before being used in 291
TPM calculations. 292
The analysis of Equations (4) and (5) above shows that the transition probabilities in the 293
circumstances of routine maintenance and minor repair are the basis of all calculations. Therefore 294
the calculation of TPMs started using Equation (4). Besides, as mentioned before, each bridge 295
component, as well as the whole bridge, usually has different deterioration characteristics, and the 296
bridge conditions in the central city and suburban areas may also be different in Shanghai; thus, 297
the TPMs should be calculated separately. 298
Circumstances of routine maintenance and minor repair 299
In this case, only four transition probabilities are needed for each situation. Every two-year 300
period (consecutive years) has a group of transition probabilities. However, the final TPMs under 301
routine maintenance and minor repair should be single for each bridge component and the whole 302
bridge [2]. So the calculation results need to be further processed. 303
As the distribution of transition probabilities for each grade is not uniform, the average value 304
and standard deviation were used in this study to analyze these data. The transition probabilities 305

Li, Li, Chen and Sun
TRB 2016 Annual Meeting
that exceeded the valid range were excluded, and the final transition probabilities are the average 306
value of all valid values, as shown in Equation (6). This method has been proved effective for 307
obtaining stable transition probabilities [18]. 308
309
{𝑅𝑖 = 𝑝
𝑖𝑖± 𝑠𝑖
𝑝𝑖𝑖 = 𝑝𝑖𝑖𝑣𝑎𝑙𝑖𝑑 𝑝𝑖𝑖
𝑣𝑎𝑙𝑖𝑑 ∈ 𝑅𝑖
𝑖 ∈ [5,4,3,2] (6) 310
311
In Equation (6), 𝑅𝑖 is the valid range of transition probabilities for each grade i; 𝑝𝑖𝑖 and 312
𝑠𝑖 are the average value and standard deviation, respectively, of transition probabilities through all 313
years for each grade i; 𝑝𝑖𝑖 is the final transition probabilities for each grade i; and 𝑝𝑖𝑖𝑣𝑎𝑙𝑖𝑑 is the 314
valid probabilities for each grade i. The data processing results can be found in Table 3. 315
316
Table 3 Final transition probabilities under routine maintenance and minor repair and 317
under medium and major repair 318
Category
Final probability
(routine maintenance and minor repair )
Final probability
(medium and major repair )
Element Entire
city
Central
city Suburbs Element
Entire
city
Central
city Suburbs
Bridge
deck
system
𝑝55 0.856 0.860 0.847 𝑝25 0.148 0.244 0.048
𝑝44 0.670 0.693 0.598 𝑝15 0.814 1.000 0.167
𝑝33 0.771 0.773 0.797 - - - -
𝑝22 0.865 0.887 0.887 - - - -
Super-
structure
𝑝55 0.945 0.945 0.943 𝑝25 0.148 0.244 0.048
𝑝44 0.789 0.764 0.823 𝑝15 0.814 1.000 0.167
𝑝33 0.803 0.810 0.821 - - - -
𝑝22 0.836 0.824 0.807 - - - -
Sub-
structure
𝑝55 0.943 0.932 0.956 𝑝25 0.148 0.244 0.048
𝑝44 0.903 0.914 0.892 𝑝15 0.814 1.000 0.167
𝑝33 0.982 1.000 0.944 - - - -
𝑝22 1.000 1.000 1.000 - - - -
Whole
bridge
𝑝55 0.920 0.900 0.917 - - - -
𝑝44 0.885 0.898 0.904 𝑝25 0.148 0.244 0.048
𝑝33 0.923 0.952 0.900 𝑝15 0.814 1.000 0.167
𝑝22 0.925 0.973 0.986 - - - -
319
Circumstances of medium and major repair 320
The case for medium and major repair is a little more complex because the probabilities of 321
CR grades D and E for more than two state jumps in two years must be taken into consideration 322
based on the actual repair rate. As noted previously, a conservation investigation was conducted to 323
acquire the actual repair rate [20]. The transition probabilities for grades A to C are same as those 324
under routine maintenance and minor repair, while the transition probabilities for grades D and E 325
were calculated based on the actual repair rate. The final probabilities reflecting medium and 326
major repair can also be found in Table 3. As shown in Table 3, the transition probabilities for 327
bridges in the central city were much higher than those for bridges in suburban areas, indicating 328

Li, Li, Chen and Sun
TRB 2016 Annual Meeting
that the bridge conservation intensity in the central city was greater than that in the suburban areas. 329
The better economic development state of the central city may be the main reason for this result. 330
It is should be noted that the transition probabilities named 𝑝25 and 𝑝15 in Table 3 were 331
calculated based only on the survey results of whole bridge repair because more detailed 332
conservation data about individual bridge components were not available. Thus, in this study all 333
bridge components were considered to have the same repair rate as the whole bridge. 334
335
BRIDGE DETERIORATION PREDICTION 336
CR prediction based on present status of Shanghai 337
Using the Markov TPMs and present status of urban bridges, the future status of bridge conditions 338
at any year can be predicted. Taking the bridge condition in 2014 as the present status 𝐶(0), the 339
status vector is defined by Equation (7), in which bridges in different locations are considered 340
separately. Then the bridge condition during next t years 𝐶(𝑡) can be predicted using Equation 341
(8), in which 𝑃𝑐𝑖𝑟is the Markov TPM in a particular circumstance. 342
343
𝐶(0) = {
[0.617, 0.289, 0.083, 0.011, 0] (𝑖𝑓 𝑒𝑛𝑡𝑖𝑟𝑒 𝑐𝑖𝑡𝑦 )[0.531, 0.336, 0.111, 0.021, 0] (𝑖𝑓 𝑡ℎ𝑒 𝑠𝑢𝑏𝑢𝑟𝑏)[0.685, 0.251, 0.060, 0.004, 0] (𝑖𝑓 𝑐𝑒𝑛𝑡𝑟𝑎𝑙 𝑐𝑖𝑡𝑦)
(7) 344
𝐶(𝑡) = 𝐶(0) × (𝑃𝑐𝑖𝑟)𝑡 𝑡 = 1, 2, 3, 4, 5 (8) 345
346
The prediction results of all three bridge components and the whole bridge for the two 347
conservatism regimes are displayed in Figure 2 and Figure 3. The prediction period is 10 years 348
(i.e., 2014–2024). 349
350

Li, Li, Chen and Sun
TRB 2016 Annual Meeting
351
Figure 2 Bridge prediction results under routine maintenance and minor repair. Letters A, B, 352
C, D and E represent bridge grades according to the Chinese technical regulation. 353
354

Li, Li, Chen and Sun
TRB 2016 Annual Meeting
355
Figure 3 Bridge prediction results under medium and major repair. Letters A, B, C, D and E 356
represent bridge grades according to the Chinese technical regulation. 357
358
CR prediction for a new bridge 359
The deterioration process under different conservation regimes can be predicted using the 360
Markov-chain model above for a new bridge with intact condition status in Shanghai. The 361

Li, Li, Chen and Sun
TRB 2016 Annual Meeting
calculation method is described in Equation (9). In Equation (9), 𝐶(𝑡)∗ is the bridge CR grade 362
(status value) after t years; 𝐶(0)∗ is the status vector of the initial condition; 𝑃𝑚𝑎𝑖𝑛𝑡𝑎𝑖𝑛 is the 363
TPM in certain conservation circumstance; and CR is the bridge condition rating vector, which is a 364
constant vector in the case of new bridge. In this study CR= [5; 4; 3; 2; 1]. 365
366
𝐶(𝑡)∗ = 𝐶(0)∗ × (𝑃𝑚𝑎𝑖𝑛𝑡𝑎𝑖𝑛 )𝑡 × 𝐶𝑅 (9) 367
368
It was assumed that new bridges will deteriorate from the intact state during the forecast 369
period of 20 years. Thus, the initial status vector 𝐶(0)∗ was [1, 0, 0, 0, 0]. The bridge condition 370
deterioration tendency for different components and for the whole bridge can be found in Figure 4, 371
in which the ordinate scale 5 to 1 represents CR grades A to E, respectively. 372
373

Li, Li, Chen and Sun
TRB 2016 Annual Meeting
374
Figure 4 Deterioration prediction over 20 years for a new bridge in Shanghai. The ordinate 375 scale 5 to 1 (y axis) represents CR grades A to E, respectively. 376
377
DISCUSSION 378
Figure 2 and Figure 3 show that the bridge condition will deteriorate rapidly if only routine 379
maintenance and minor repair are implemented. Comparatively, the bridge deck system has the 380
fastest decline of the three bridge components analyzed. At the end of the prediction period (2024) 381
the proportion of bridge deck systems with grade A will be less than 20%, while the proportion of 382
grade E deck systems will be as much as 20%. This finding is quite worrying because the safety 383
rating of a grade E bridge is “dangerous”. Medium and major repairs seem to have a significant 384
positive impact on the bridge deck status in the central city, as shown in Figure 3(a) to Figure 3(f), 385

Li, Li, Chen and Sun
TRB 2016 Annual Meeting
but this positive impact is not apparent for the suburban bridges. The latest data in the Shanghai 386
BMS show that the proportion of suburban bridges is 55.6% (2014), thus their conditions have a 387
large impact on the overall state of transport infrastructure in the city. Because the medium and 388
major repair rate is too low in suburban areas of Shanghai (see Table 3), the bridge conditions in 389
these areas cannot be improved significantly. The cases for the superstructure, substructure and the 390
whole bridge are almost the same as for the bridge deck system. Bridges in the central city always 391
have a better performance than their suburban counterparts, and the suburban bridges reduce the 392
overall bridge quality level of the entire city, reflecting that investment on the repair of suburban 393
bridges in Shanghai is very insufficient. Even in the central city, the present repair rate cannot 394
fundamentally improve the technical condition of existing bridges. 395
The results portrayed in Figure 2 and Figure 3 indicate that bridges in Shanghai have entered 396
a rapid deterioration stage, and if the repair efforts cannot be strengthened from now, the future 397
state of these bridges will be quite worrying. This conclusion is also consistent with the empirical 398
findings of the Shanghai bridge management investigation conducted as part of this study. 399
Figure 4 displays the predicted deterioration of a new bridge based on the present bridge 400
conservation strategy in Shanghai. The medium and major repair efforts at present seem to have a 401
significant impact on the bridge deck system and the superstructure, as shown in Figure 4(a) and 402
Figure 4(b), and the impact will be apparent in 6–8 years. Regarding routine maintenance and 403
minor repair, the location of a new bridge seems to have no influence on the bridge deterioration 404
process. However, in the case of medium and major repair, the location effect is obvious and the 405
performance decline of new suburban bridges is predicted to be far more rapid than that of new 406
bridges in the central city. As with existing bridges, the present repair efforts are insufficient to 407
improve the state of the substructures and the whole bridges, as shown in Figure 4(c) and Figure 408
4(d). 409
410
CONCLUSIONS 411
Bridge condition data spanning approximately 11 years in the Shanghai BMS were used in this 412
study to calibrate a Markov-chain model to forecast the bridge condition, and also to find the 413
deterioration tendency, of urban bridges in Shanghai. The bridge CR grades were used to generate 414
the state vector space and the time step was set to one year, matching the bridge inspection 415
frequency and simplifying the form of Markov TPMs. 416
The modeling process considered two conservation strategies, and the actual repair rate was 417
obtained through a conservation survey. The influence of bridge location also was considered. 418
Results from the study support the following conclusions. 419
Bridge conservation efforts (or investment levels) are uneven across the city, with those in the 420
central city being much better than those in suburban areas, although the proportion of suburban 421
bridges is higher (55.6%). Furthermore, the present level of bridge conservation efforts in central 422
Shanghai is insufficient, and the condition in suburban areas is even worse. The medium and 423
major repair efforts at present have a significant positive impact on the deck system and the 424
superstructure of central city bridges, but the impact of these efforts on the substructure and the 425
whole bridge is quite small, indicating that the present conservation strategy cannot improve the 426
bridge conditions fundamentally. The positive impacts of conservation efforts on central city 427

Li, Li, Chen and Sun
TRB 2016 Annual Meeting
bridges do not extend to suburban bridges. Overall, bridges in Shanghai have entered a rapid 428
deterioration stage, and existing repair efforts need to be strengthened immediately. 429
430
ACKNOWLEDGEMENTS 431
This study was funded by The Ministry of Science and Technology of China (Grant Number: 432
2013DFA81910) and National Natural Science Foundation of China (Grant Number: 51378242 433
and 51508411). The authors would like to acknowledge this financial support. 434
435
REFERENCES 436
[1] Technical code of maintenance for city bridges, China, CJJ 99-2003 437
[2] Morcous G. and Hatami, A. Developing deterioration models for Nebraska bridges. Project 438
No. SPR-P1(11) M302, Final Report, Nebraska Department of Roads, Lincoln, NE, 2011 439
[3] Chen Z. Research on technology structure of transportation infrastructure management system. 440
PHD Dissertation. Shanghai: Tongji University, 2005 441
[4] Veshosky D, Beidleman C R and Bueton G W, et al. Comparative analysis of bridge 442
superstructure deterioration. Journal of Structural Engineering, 1994, 120(7): 2123–2136 443
[5] Yanev B and Chen X. Life-cycle performance of New York City bridges. Transportation 444
Research Record 1389, 1993: 17–24 445
[6] Ranjith S, Setunge S and Gravina R et al. Deterioration prediction of timber bridge elements 446
using the Markov chain. Journal of Performance of Constructed Facilities, 2013, 27(3): 447
319-325 448
[7] Wang D S, Zhu M, Zhong J R. Aided seismic damage prediction system for bridges using 449
statistical analysis methods. World Earthquake Engineering, 2003, 19(3): 117-122 450
[8] Madanat S, Mishalani R and Ibrahim W H W. Estimation of infrastructure transition 451
probabilities from condition rating data. Journal of Infrastructure Systems, 1995, 1(2): 452
120-125 453
[9] Bogdanoff I L. A new cumulative damage model—Part I. Journal of Applied Mechanics, 1978, 454
45(2): 246–250. 455
[10] Micevski T, Kuczera G and Coombes P. Markov model for storm water pipe deterioration. 456
Journal of Infrastructure Systems. 2002, 8(2): 49–56. 457
[11] Morcous G. Performance prediction of bridge deck systems using Markov chains. Journal of 458
Performance of Constructed Facilities, 2006, 20(2): 146-155 459
[12] Lounis Z. Reliability-based life prediction of aging concrete bridge decks. In Proceedings of 460
the International RILEM Workshop on Life Prediction and Aging Management of Concrete 461
Structures, Cannes, France, 2000: 229–238 462
[13] Morcous G and Rivard H. Computer assistance in managing the maintenance of low-slope 463
roofs. Journal of Computing in Civil Engineering, 2003, 17(4): 230-242 464
[14] Agrawal A K, Kawaguchi A, and Chen Z. Bridge element deterioration rates. Report No. 465
C-01-51, New York State DOT, Albany, NY, 2009 466
[15] Golabi K and Shepard R. Pontis: A system for maintenance optimization and improvement of 467
U.S. bridge networks. Interfaces, 1997,27: 71–88 468
[16] Hawk H and Small E P. The BRIDGIT bridge management system. Structural Engineering 469

Li, Li, Chen and Sun
TRB 2016 Annual Meeting
International, 1998, 8(4): 309-314(6) 470
[17] Cesare M, Santamarina C and Turkstra C, et al. Modeling bridge deterioration with Markov 471
chains. Journal of Transportation Engineering, 1992, 118(6): 820-833 472
[18] Li L, Lijun S, Guobao N. Deterioration Prediction of Urban Bridges on Network Level 473
Using Markov-Chain Model. Mathematical Problems in Engineering, 2014 474
[19] Tran H D. Investigation of deterioration models for stormwater pipe systems. Ph.D. thesis, 475
School of Architectural, Civil and Mechanical Engineering, Victoria University, Melbourne, 476
Australia, 2007 477
[20] Statistical Report of Highways Industry in Shanghai, 2004-2013 478
[21] Parzen E. Stochastic processes. Holden Day, San Francisco, 1962 479
[22] Collins L. An introduction to Markov chain analysis, Concepts and techniques in modern 480
geography. Geo Abstracts, 1975 481
[23] Butt A A, Shahin M Y and Feighan K J, et al. Pavement performance prediction model using 482
the Markov process. Transportation Research Record 1123, 1987: 12-19 483
[24] Jiang Y, Saito M and Sinha K C. Bridge performance prediction model using the Markov 484
chain. Transportation Research Record 1180, 1988: 25-32 485