Embed Size (px)
Citation preview
Steady-State Protection Study for the Application of Series Capacitors in the
Empangeni 400 kV Network
Graeme Topham Eskom Enterprises Technology Services International
Edmund Stokes-Waller Schweitzer Engineering Laboratories, Inc.
Presented at the 31st Annual Western Protective Relay Conference
Spokane, Washington October 19–21, 2004
1
STEADY-STATE PROTECTION STUDY FOR THE APPLICATION OF SERIES CAPACITORS IN THE EMPANGENI
400 KV NETWORK Graeme Topham
Eskom Enterprises Technology Services International, RSA
Edmund Stokes-Waller Schweitzer Engineering Laboratories, Inc. RSA
INTRODUCTION In order to strengthen the Empangeni 400 kV network (a section of the Eskom Main Transmission Network in South Africa), an option of relocating existing series capacitors from another part of the network into this area was considered. The main objective was to improve the power network quality of supply due to problems experienced with flicker in the region. Flicker is the impression of fluctuating intensity of light, occurring when the frequency of observed variation lies between a few hertz and the fusion frequency of images.
The normal project studies were conducted and successfully completed. Management approval for the project was virtually granted. A last minute study, conducted with the focus on protection issues, indicated “unexplained” power network behavior. To the dismay of the project team, project approval was delayed until this behavior could be explained and its influence on the protection studied in more detail. Additional detailed studies followed, and the behavior was eventually classified as current reversal (combined with voltage reversal) due to specific ratios of power network equipment impedance values, with respect to fault position.
The current and voltage reversal could adversely affect protection and result in incorrect protection operations, and, ultimately, power network blackouts. Therefore, different protection scheme philosophies, and the effect of such phenomena on each type of scheme, were considered, with reference to old and new protection technologies existing on the particular network. Quality information databases and their management also proved invaluable. It was finally concluded that project implementation could be catastrophic to the power network stability and security.
Various options for resolving the problem were studied, and finally the project was diverted to a more suitable alternative, with implementation pending financial justification based on sound engineering practices and principles. The best alternative proved to be strengthening the power network by installing an additional transmission feeder.
The studies conducted also indicated that strengthening power networks with VAR compensation devices has limitations that need to be carefully considered during network planning stages. An example is the sudden network voltage collapse during apparently healthy network conditions, with no prior warning to power network operators. This example also clearly demonstrates that power network expansion and refurbishment need to be considered from all aspects and not only from those aspects that may be directly related.
This paper consists of detailed descriptions of all elements of the project as well as the study results (from a power network protection perspective and from an operational perspective). Ignorance of sound engineering practices could have resulted in huge financial implications and losses to the company. This study indicated the value of skilled and well-equipped resources.
2
The paper is presented in chronological order as follows: • Empangeni 400 kV Network Description • Study Problem Statement • General Series Capacitor Influences on Power Network Protection • Basic Theory of Current and Voltage Reversal (including the effect of infeeds) • Effect of Current and Voltage Reversal on Impedance Relay Measurement • Study Methodology • Study Results • Study Analysis and Risk Considerations • Suitability of Existing Protection on the Empangeni Network Feeders • Options Considered • Conclusions
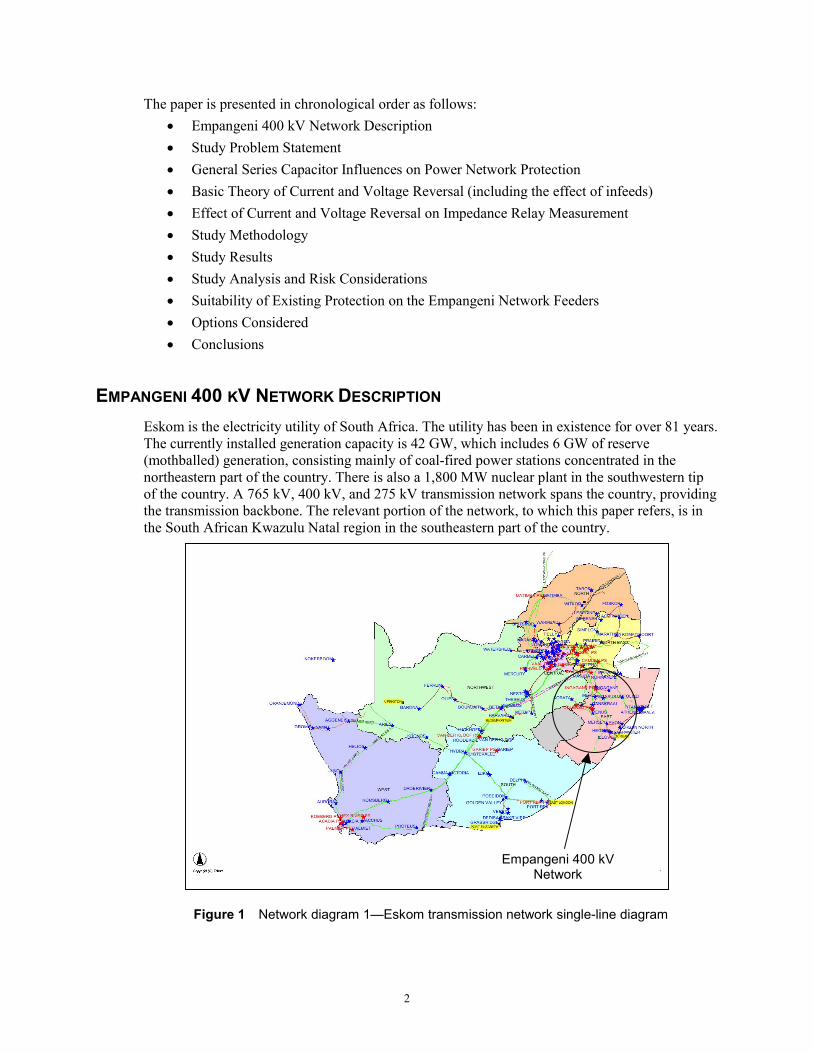
EMPANGENI 400 KV NETWORK DESCRIPTION Eskom is the electricity utility of South Africa. The utility has been in existence for over 81 years. The currently installed generation capacity is 42 GW, which includes 6 GW of reserve (mothballed) generation, consisting mainly of coal-fired power stations concentrated in the northeastern part of the country. There is also a 1,800 MW nuclear plant in the southwestern tip of the country. A 765 kV, 400 kV, and 275 kV transmission network spans the country, providing the transmission backbone. The relevant portion of the network, to which this paper refers, is in the South African Kwazulu Natal region in the southeastern part of the country.
Figure 1 Network diagram 1—Eskom transmission network single-line diagram
Empangeni 400 kV Network
3
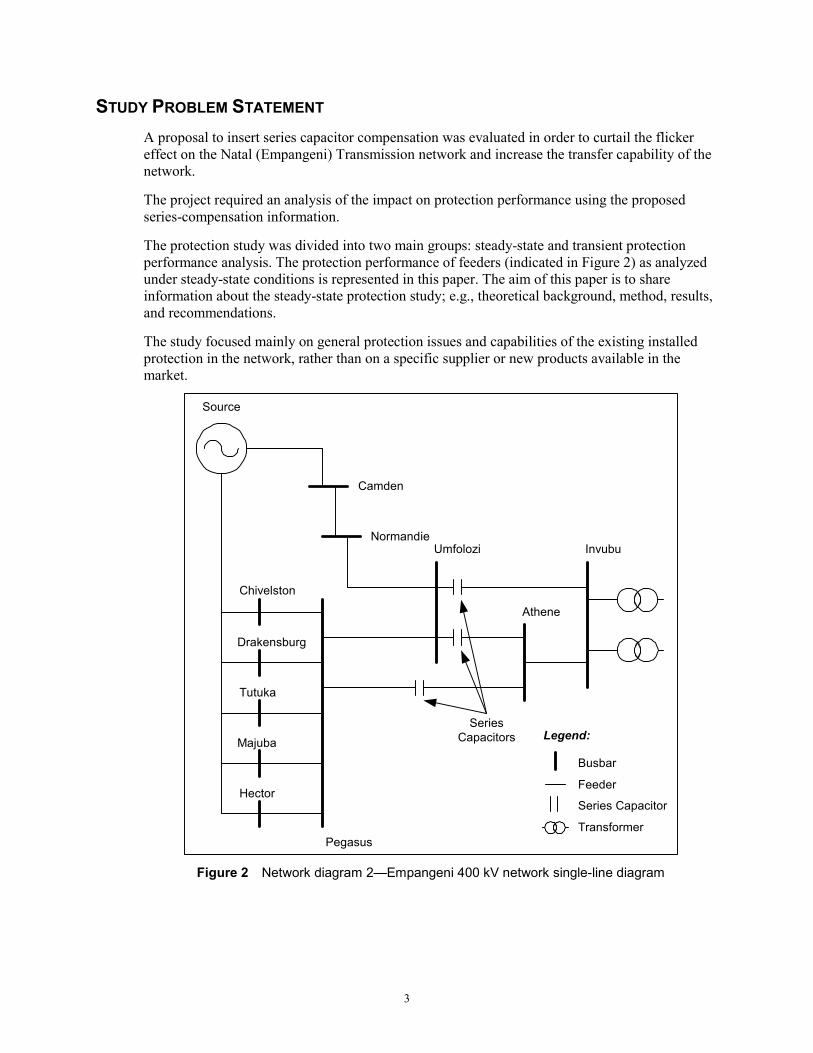
STUDY PROBLEM STATEMENT A proposal to insert series capacitor compensation was evaluated in order to curtail the flicker effect on the Natal (Empangeni) Transmission network and increase the transfer capability of the network.
The project required an analysis of the impact on protection performance using the proposed series-compensation information.
The protection study was divided into two main groups: steady-state and transient protection performance analysis. The protection performance of feeders (indicated in Figure 2) as analyzed under steady-state conditions is represented in this paper. The aim of this paper is to share information about the steady-state protection study; e.g., theoretical background, method, results, and recommendations.
The study focused mainly on general protection issues and capabilities of the existing installed protection in the network, rather than on a specific supplier or new products available in the market.
Legend:
Source
Camden
Normandie
Chivelston
Drakensburg
Tutuka
Majuba
Hector
Umfolozi Invubu
Athene
SeriesCapacitors
Pegasus
Busbar
Feeder
Series Capacitor
Transformer
Figure 2 Network diagram 2—Empangeni 400 kV network single-line diagram
4
GENERAL SERIES CAPACITOR INFLUENCES ON POWER NETWORK PROTECTION The addition of series capacitors in transmission feeders has a substantial effect on the transmission feeder protection, not only on the series-compensated feeders themselves but also on adjacent transmission feeders.
The following paragraphs consider the issues relating to the transmission feeder protection from a generic protection perspective.
Transmission feeders are inherently inductive in nature. The addition of series capacitors reduces the inductive impedance of the network and, in an extreme case, depending on the size of the series compensation, may cause the network to become capacitive in nature. This influences protection relay measurements during fault conditions.
The capacitive or apparent capacitive nature of the fault current can cause the transmission feeder protection to fail to operate, or to operate incorrectly unless the protection is specifically designed to cater to the problems introduced by the addition of the series capacitors. It is also important to note that, due to the capacitive nature of the fault loop, transmission feeder protection complications can arise both on the compensated feeder as well as on adjacent transmission feeders.
The problems introduced by the addition of series compensation to transmission feeders include, but are not limited to, the following.
Voltage Reversal
Voltage reversal occurs if the reactance magnitude of the series capacitor is greater than the reactance magnitude of the feeder, with reference from the relay position up to the fault location.
Current Reversal
Current reversal occurs if the reactance magnitude of the series capacitor is greater than the sum of the source reactance and the feeder reactance magnitudes, with reference from the relay position up to the fault location.
Gap Flashing Transients
Series capacitor banks are equipped with spark gaps that bridge the capacitor and are set on the Eskom transmission network to flash over at a voltage 2 to 3 times the nominal voltage of the bank. When the spark gaps flash over, the network is restored to an inductive nature. The spark gaps do not flash instantaneously following the occurrence of a fault, and may not flash over at all under some fault/network conditions. The time to gap flashing may be longer than the operating time of high-speed protection. It is therefore important to evaluate the effect of capacitive reactances even for faults that cause the gaps to flash over. Gap flashing also generates transients that can cause distance protection to either operate slowly or not operate at all. The frequency of the gap flashing transients may be on the order of 500 Hz.
Low-Frequency Transients
When a fault occurs on an uncompensated transmission feeder, the impedance presented to the relays jumps instantaneously from that representing the load to that representing the fault condition. Due to a decaying low-frequency transient component present in faults involving series-compensated feeders, the move from the load point to the fault point can follow a
5
logarithmic spiral. With large amounts of compensation, this transition may take as long as 5 cycles.
BASIC THEORY OF CURRENT AND VOLTAGE REVERSAL (INCLUDING THE EFFECT OF INFEEDS)
Purely reactive values are used in this section to simplify the description and for ease of illustration.
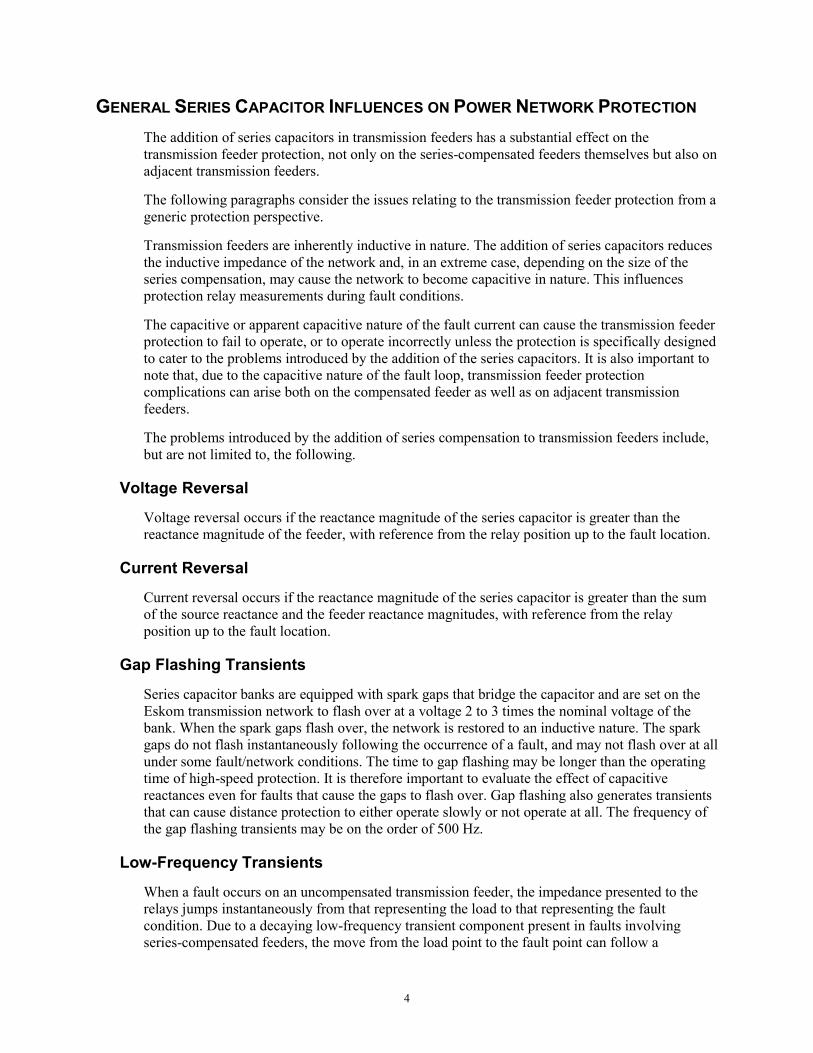
Figure 3 illustrates a typical single-line diagram of a network with series compensation and a fault applied at the end of the feeder. Distance impedance relays are situated at positions A and B.
XS XC XL
VS
IS
Thre
e-Ph
ase
Faul
t
Rel
ay A
Rel
ay B
Legend:XS = Source reactanceXL = Feeder reactance (excluding series-reactance)XC = Series capacitor reactanceX = XS + XL – XC
VS = Source voltageVr(A) = Voltage measured by relay at position AVr(B) = Voltage measured by relay at position BIS = Current flowing out of source voltageIr = Current measured by relay at position A
Figure 3 Single-line diagram of series-compensated network
For simplicity, assume XS and XL represent a series-inductive reactance value, and thus for the above circuit, where X is the total network reactance, we have:
jXV
XXXjV
I S
CLS
SS =
−+=
)( (1)
In Figure 3, the current IS lags or leads the voltage by 90 degrees, depending on the sign of X, because X is a pure reactance value.
6
In terms of the relay measurement, the following observations can be made.
Current Reversal
For the protective relay at position A, Ir = IS, where Ir is the fault current. The current IS will reverse direction when (XC > XS + XL). Both the relays at positions A and B will experience current reversal should this occur.
Voltage Reversal
For the Relay at Position A:
( ) ( ) ( )
⎟⎠
⎞⎜⎝
⎛ +−=
+−⎟⎟⎠
⎞⎜⎜⎝
⎛=+−=
XXX
V
XXjXV
jXXjIAV
LCS
LCS
LCSr
The voltage measured by the relay Vr(A), will reverse its sign when (XC > XL) and (X > 0) and (XC < XS + XL).
For the Relay at Position B:
Voltage reversal is not possible under the same criteria as for position A, because Vr(B) = jISXL. However, voltage reversal can occur as a consequence of current reversal.
Note that both the current and voltage reversal processes depend on the impedance ratios with reference to the relay and fault location.
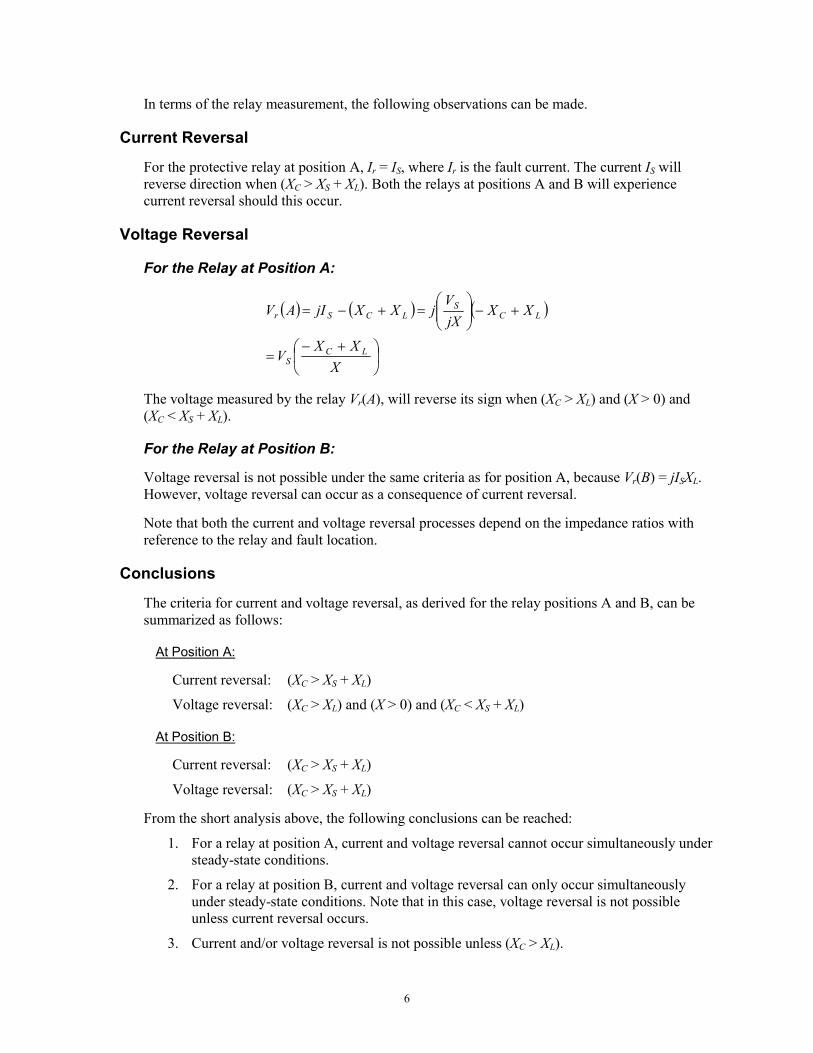
Conclusions
The criteria for current and voltage reversal, as derived for the relay positions A and B, can be summarized as follows:
At Position A:
Current reversal: (XC > XS + XL)
Voltage reversal: (XC > XL) and (X > 0) and (XC < XS + XL)
At Position B:
Current reversal: (XC > XS + XL)
Voltage reversal: (XC > XS + XL)
From the short analysis above, the following conclusions can be reached:
1. For a relay at position A, current and voltage reversal cannot occur simultaneously under steady-state conditions.
2. For a relay at position B, current and voltage reversal can only occur simultaneously under steady-state conditions. Note that in this case, voltage reversal is not possible unless current reversal occurs.
3. Current and/or voltage reversal is not possible unless (XC > XL).
7
4. If current reversal is possible, then a condition could follow where, depending on the fault position, (XC = XS + XL), thereby reducing the equivalent network impedance measured by the protection relay to zero ohms. In a normal power network (impedance includes resistance), the equivalent network impedance measured by a protective relay will be purely resistive under this same condition.
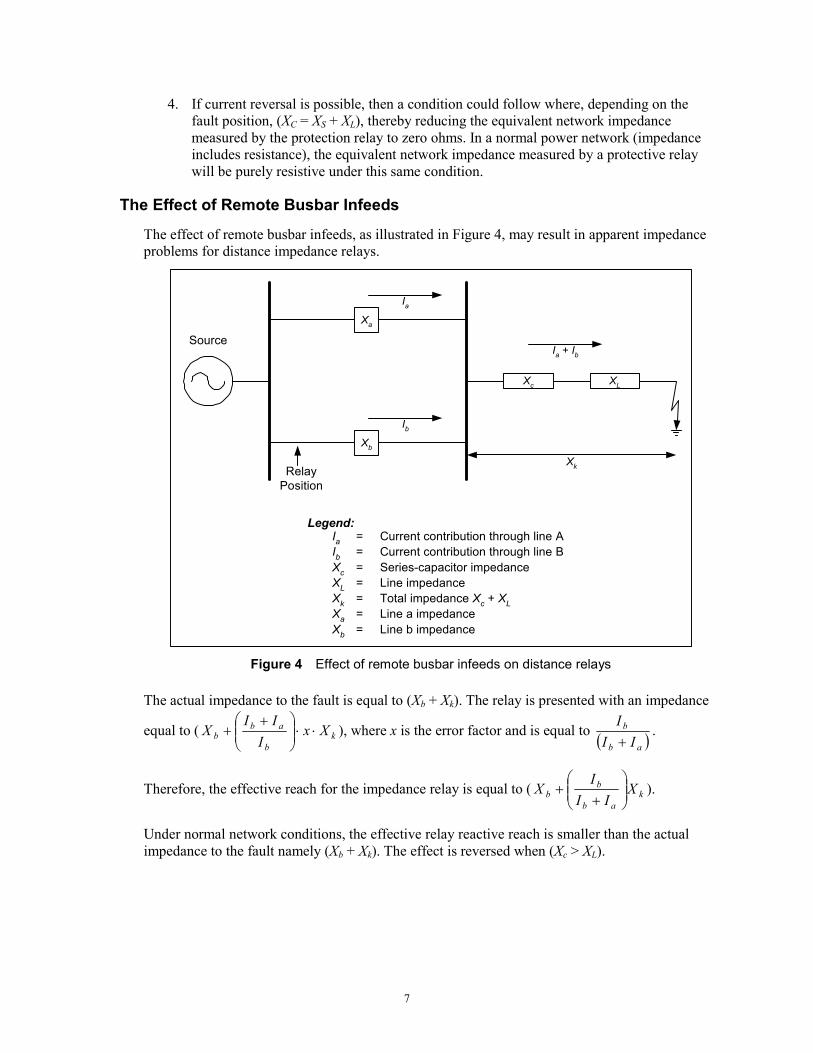
The Effect of Remote Busbar Infeeds
The effect of remote busbar infeeds, as illustrated in Figure 4, may result in apparent impedance problems for distance impedance relays.
Xc XL
Ia + Ib
Ia
Xb
Ib
Xk
Source
RelayPosition
Xa
Ia = Current contribution through line AIb = Current contribution through line BXc = Series-capacitor impedanceXL = Line impedanceXk = Total impedance Xc + XLXa = Line a impedanceXb = Line b impedance
Legend:
Figure 4 Effect of remote busbar infeeds on distance relays
The actual impedance to the fault is equal to (Xb + Xk). The relay is presented with an impedance
equal to ( kb
abb Xx
III
X ⋅⋅⎟⎟⎠
⎞⎜⎜⎝
⎛ ++ ), where x is the error factor and is equal to ( )ab
b
III+
.
Therefore, the effective reach for the impedance relay is equal to ( kab
bb X
III
X ⎟⎟⎠
⎞⎜⎜⎝
⎛+
+ ).
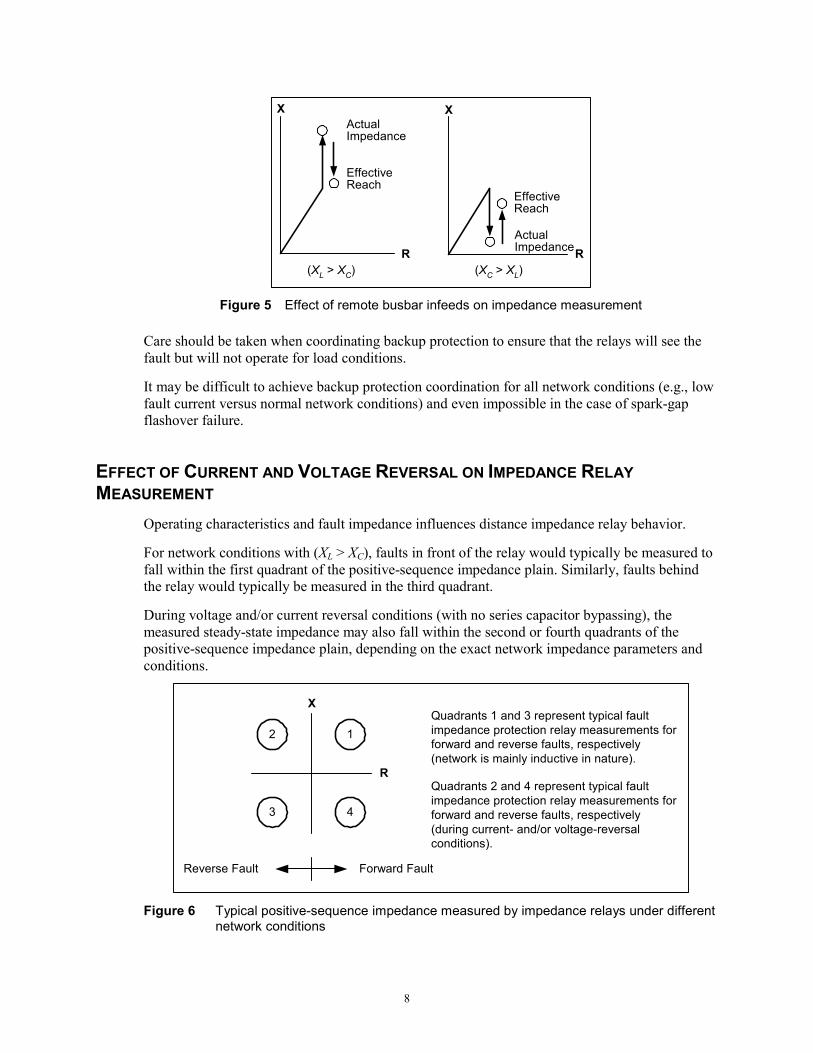
Under normal network conditions, the effective relay reactive reach is smaller than the actual impedance to the fault namely (Xb + Xk). The effect is reversed when (Xc > XL).
8
X
R
ActualImpedance
EffectiveReach
(XL > XC)
X
R(XC > XL)
EffectiveReach
ActualImpedance
Figure 5 Effect of remote busbar infeeds on impedance measurement
Care should be taken when coordinating backup protection to ensure that the relays will see the fault but will not operate for load conditions.
It may be difficult to achieve backup protection coordination for all network conditions (e.g., low fault current versus normal network conditions) and even impossible in the case of spark-gap flashover failure.
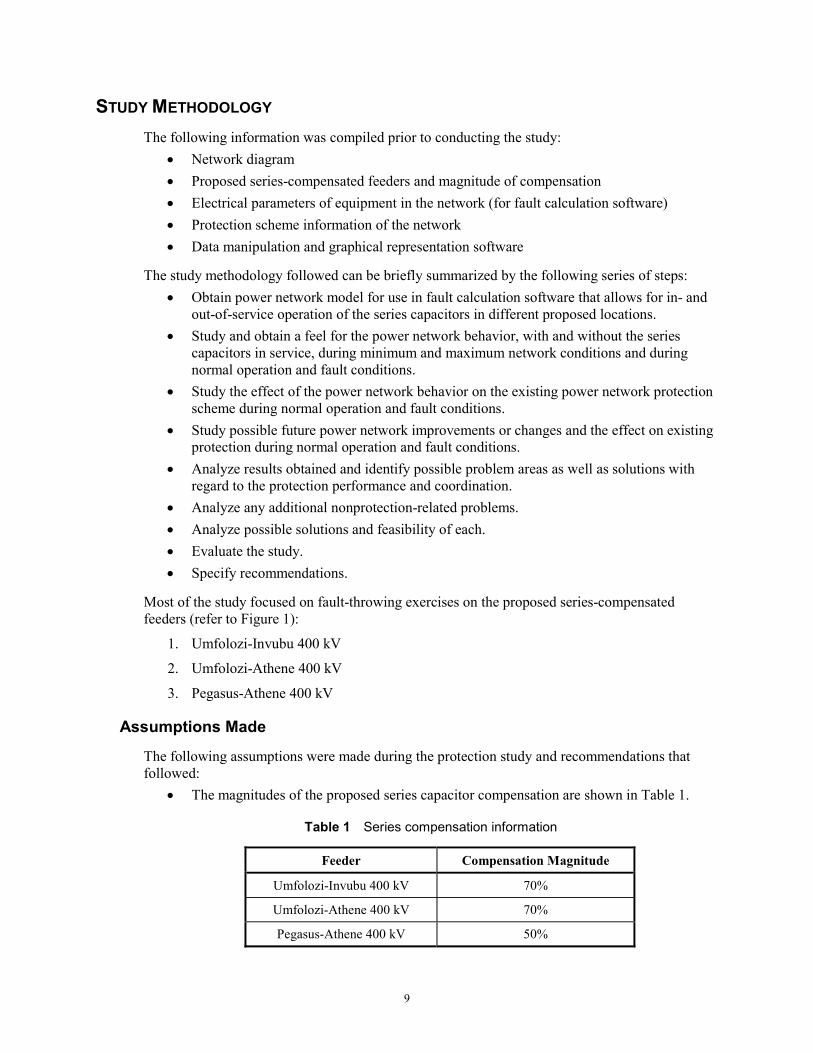
EFFECT OF CURRENT AND VOLTAGE REVERSAL ON IMPEDANCE RELAY MEASUREMENT
Operating characteristics and fault impedance influences distance impedance relay behavior.
For network conditions with (XL > XC), faults in front of the relay would typically be measured to fall within the first quadrant of the positive-sequence impedance plain. Similarly, faults behind the relay would typically be measured in the third quadrant.
During voltage and/or current reversal conditions (with no series capacitor bypassing), the measured steady-state impedance may also fall within the second or fourth quadrants of the positive-sequence impedance plain, depending on the exact network impedance parameters and conditions.
X
2
R
Reverse Fault Forward Fault
Quadrants 1 and 3 represent typical faultimpedance protection relay measurements forforward and reverse faults, respectively(network is mainly inductive in nature).
Quadrants 2 and 4 represent typical faultimpedance protection relay measurements forforward and reverse faults, respectively(during current- and/or voltage-reversalconditions).
1
3 4
Figure 6 Typical positive-sequence impedance measured by impedance relays under different
network conditions
9
STUDY METHODOLOGY The following information was compiled prior to conducting the study:
• Network diagram • Proposed series-compensated feeders and magnitude of compensation • Electrical parameters of equipment in the network (for fault calculation software) • Protection scheme information of the network • Data manipulation and graphical representation software
The study methodology followed can be briefly summarized by the following series of steps: • Obtain power network model for use in fault calculation software that allows for in- and
out-of-service operation of the series capacitors in different proposed locations. • Study and obtain a feel for the power network behavior, with and without the series
capacitors in service, during minimum and maximum network conditions and during normal operation and fault conditions.
• Study the effect of the power network behavior on the existing power network protection scheme during normal operation and fault conditions.
• Study possible future power network improvements or changes and the effect on existing protection during normal operation and fault conditions.
• Analyze results obtained and identify possible problem areas as well as solutions with regard to the protection performance and coordination.
• Analyze any additional nonprotection-related problems. • Analyze possible solutions and feasibility of each. • Evaluate the study. • Specify recommendations.
Most of the study focused on fault-throwing exercises on the proposed series-compensated feeders (refer to Figure 1):
1. Umfolozi-Invubu 400 kV
2. Umfolozi-Athene 400 kV
3. Pegasus-Athene 400 kV
Assumptions Made
The following assumptions were made during the protection study and recommendations that followed:
• The magnitudes of the proposed series capacitor compensation are shown in Table 1.
Table 1 Series compensation information
Feeder Compensation Magnitude
Umfolozi-Invubu 400 kV 70%
Umfolozi-Athene 400 kV 70%
Pegasus-Athene 400 kV 50%
10
• Suitable (high-voltage) unit type protection schemes that are capable of protecting the network under the proposed conditions are available on the market.
• The necessary digital communications network, with diverse routes for main 1 and main 2 protection, are in place and exist in the Empangeni 400 kV network.
• The spark gaps and bypass circuits of the proposed series capacitors are not 100% reliable.
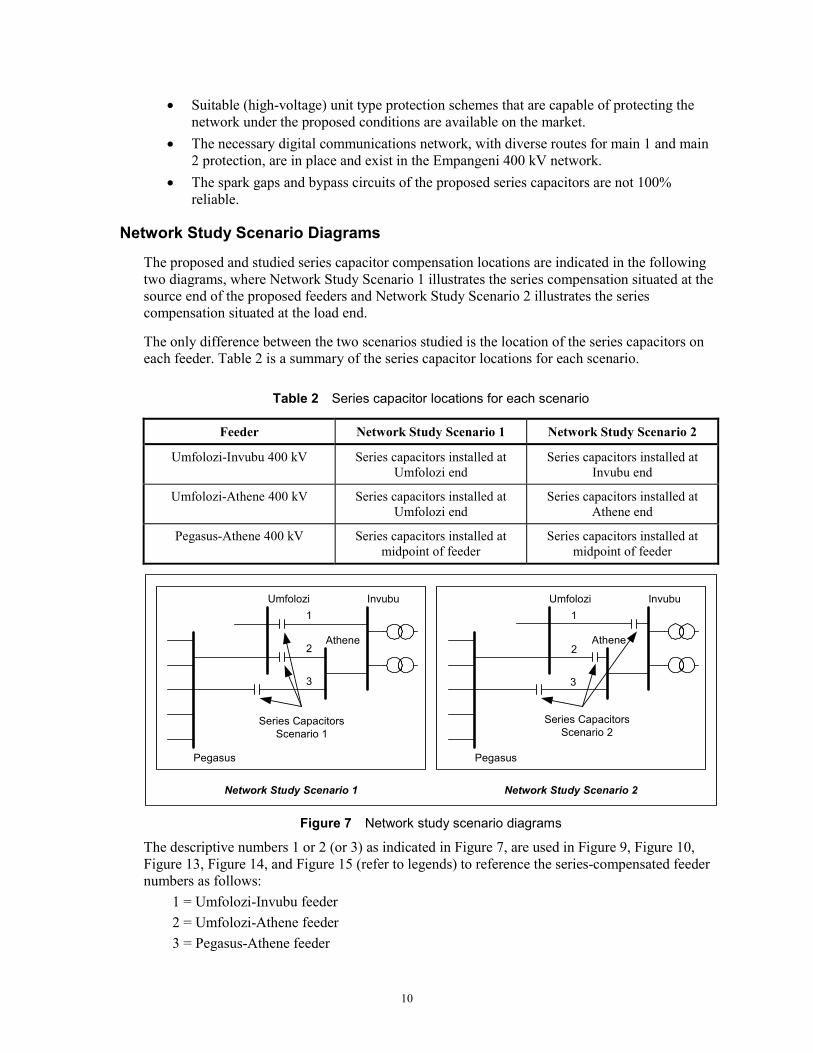
Network Study Scenario Diagrams
The proposed and studied series capacitor compensation locations are indicated in the following two diagrams, where Network Study Scenario 1 illustrates the series compensation situated at the source end of the proposed feeders and Network Study Scenario 2 illustrates the series compensation situated at the load end.
The only difference between the two scenarios studied is the location of the series capacitors on each feeder. Table 2 is a summary of the series capacitor locations for each scenario.
Table 2 Series capacitor locations for each scenario
Feeder Network Study Scenario 1 Network Study Scenario 2
Umfolozi-Invubu 400 kV Series capacitors installed at Umfolozi end
Series capacitors installed at Invubu end
Umfolozi-Athene 400 kV Series capacitors installed at Umfolozi end
Series capacitors installed at Athene end
Pegasus-Athene 400 kV Series capacitors installed at midpoint of feeder
Series capacitors installed at midpoint of feeder
Network Study Scenario 1
Umfolozi Invubu
Athene
Series CapacitorsScenario 2
Pegasus
1
2
3
Umfolozi Invubu
Athene
Series CapacitorsScenario 1
Pegasus
1
2
3
Network Study Scenario 2
Figure 7 Network study scenario diagrams
The descriptive numbers 1 or 2 (or 3) as indicated in Figure 7, are used in Figure 9, Figure 10, Figure 13, Figure 14, and Figure 15 (refer to legends) to reference the series-compensated feeder numbers as follows: 1 = Umfolozi-Invubu feeder 2 = Umfolozi-Athene feeder 3 = Pegasus-Athene feeder
11
Software Used
The steady-state study was compiled using PSS/E software (Power Network Simulator Version 24.19 by Power Technologies Incorporated).
A number of specialized software programs were compiled during the study in order to speed up manual processes, data manipulation, and representation. These included IPLAN programs and Microsoft Excel spreadsheets. Even with the additional software support, the study method was extremely time consuming.
Protection Scheme Information
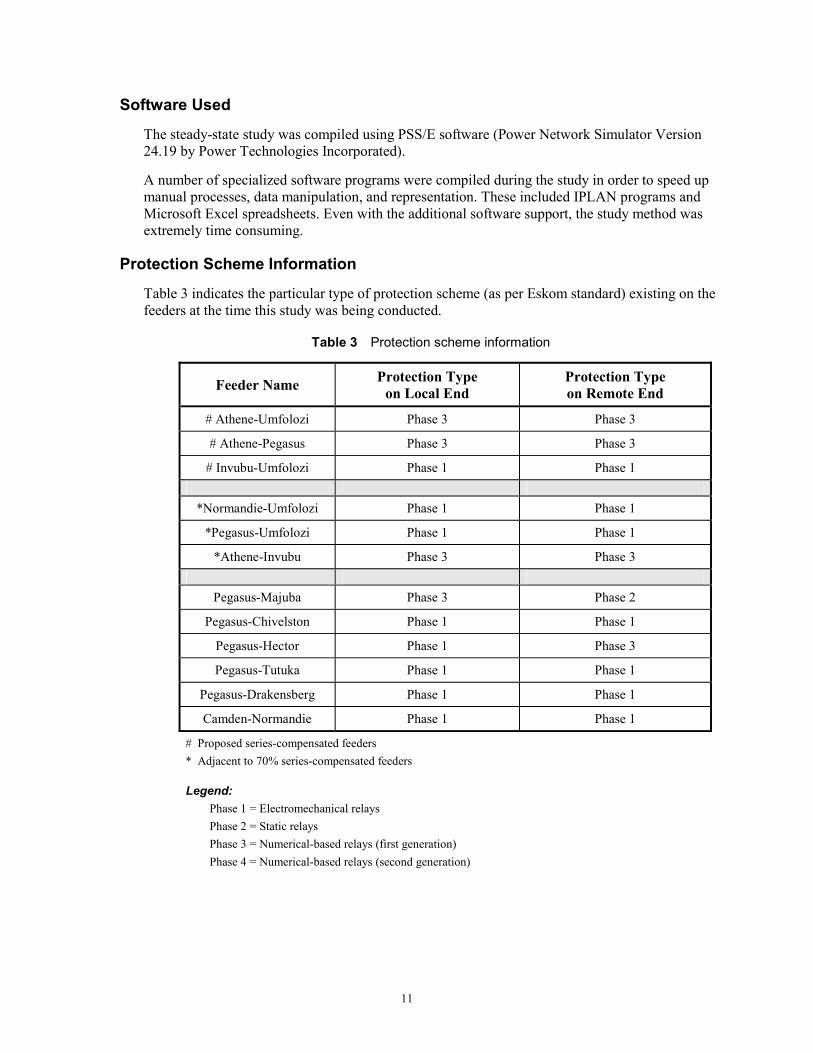
Table 3 indicates the particular type of protection scheme (as per Eskom standard) existing on the feeders at the time this study was being conducted.
Table 3 Protection scheme information
Feeder Name Protection Type on Local End
Protection Type on Remote End
# Athene-Umfolozi Phase 3 Phase 3
# Athene-Pegasus Phase 3 Phase 3
# Invubu-Umfolozi Phase 1 Phase 1
*Normandie-Umfolozi Phase 1 Phase 1
*Pegasus-Umfolozi Phase 1 Phase 1
*Athene-Invubu Phase 3 Phase 3
Pegasus-Majuba Phase 3 Phase 2
Pegasus-Chivelston Phase 1 Phase 1
Pegasus-Hector Phase 1 Phase 3
Pegasus-Tutuka Phase 1 Phase 1
Pegasus-Drakensberg Phase 1 Phase 1
Camden-Normandie Phase 1 Phase 1
# Proposed series-compensated feeders * Adjacent to 70% series-compensated feeders
Legend: Phase 1 = Electromechanical relays Phase 2 = Static relays Phase 3 = Numerical-based relays (first generation) Phase 4 = Numerical-based relays (second generation)
12
STUDY RESULTS The following results are mostly represented in graphical form with related discussion text. Throughout the study and result representations, it is the intention not to focus on the actual values obtained but rather on the behavior.
The results were typically compiled by fault throwing on a particular feeder (and moving the fault location on the same feeder from the local to remote end) and then measuring and displaying different quantities as seen either on the same feeder or elsewhere in the network. This process was repeated for different feeders and measuring locations and the summarized results are indicated in this section.
Series Capacitor Bypassed
Without the series compensation, the network behaves as usually expected, including the apparent impedances presented to the protection relays.
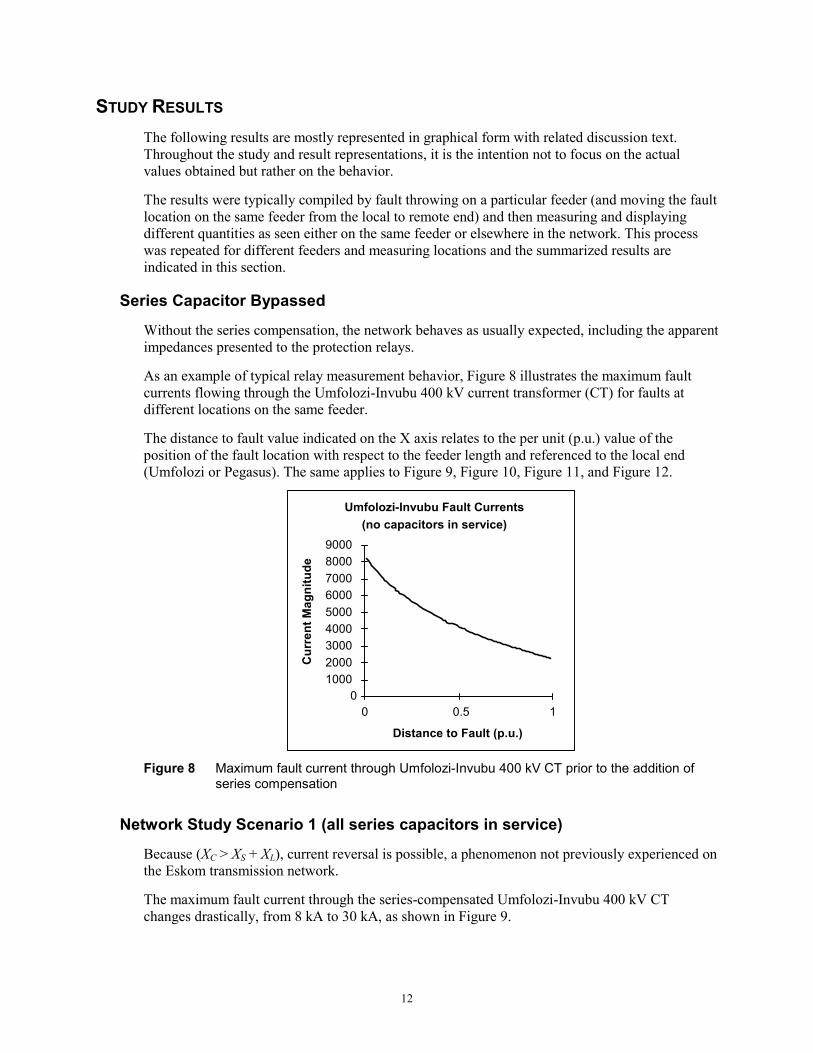
As an example of typical relay measurement behavior, Figure 8 illustrates the maximum fault currents flowing through the Umfolozi-Invubu 400 kV current transformer (CT) for faults at different locations on the same feeder.
The distance to fault value indicated on the X axis relates to the per unit (p.u.) value of the position of the fault location with respect to the feeder length and referenced to the local end (Umfolozi or Pegasus). The same applies to Figure 9, Figure 10, Figure 11, and Figure 12.
Umfolozi-Invubu Fault Currents(no capacitors in service)
0100020003000400050006000700080009000
0 0.5 1
Distance to Fault (p.u.)
Cur
rent
Mag
nitu
de
Figure 8 Maximum fault current through Umfolozi-Invubu 400 kV CT prior to the addition of
series compensation
Network Study Scenario 1 (all series capacitors in service)
Because (XC > XS + XL), current reversal is possible, a phenomenon not previously experienced on the Eskom transmission network.
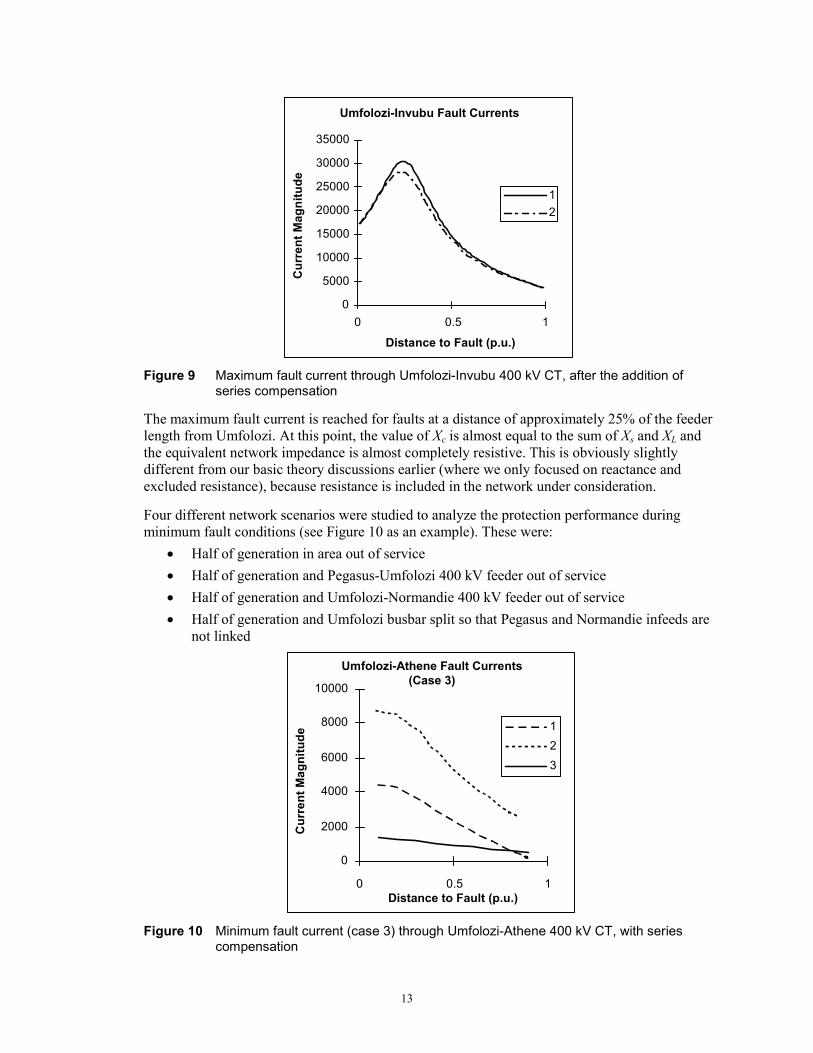
The maximum fault current through the series-compensated Umfolozi-Invubu 400 kV CT changes drastically, from 8 kA to 30 kA, as shown in Figure 9.
13
Umfolozi-Invubu Fault Currents
Distance to Fault (p.u.)
Cur
rent
Mag
nitu
de0
5000
10000
15000
20000
25000
30000
35000
0 0.5 1
12
Figure 9 Maximum fault current through Umfolozi-Invubu 400 kV CT, after the addition of
series compensation
The maximum fault current is reached for faults at a distance of approximately 25% of the feeder length from Umfolozi. At this point, the value of Xc is almost equal to the sum of Xs and XL and the equivalent network impedance is almost completely resistive. This is obviously slightly different from our basic theory discussions earlier (where we only focused on reactance and excluded resistance), because resistance is included in the network under consideration.
Four different network scenarios were studied to analyze the protection performance during minimum fault conditions (see Figure 10 as an example). These were:
• Half of generation in area out of service • Half of generation and Pegasus-Umfolozi 400 kV feeder out of service • Half of generation and Umfolozi-Normandie 400 kV feeder out of service • Half of generation and Umfolozi busbar split so that Pegasus and Normandie infeeds are
not linked
0
2000
4000
6000
8000
10000
0 0.5 1
Umfolozi-Athene Fault Currents(Case 3)
Distance to Fault (p.u.)
Cur
rent
Mag
nitu
de
123
Figure 10 Minimum fault current (case 3) through Umfolozi-Athene 400 kV CT, with series
compensation
14
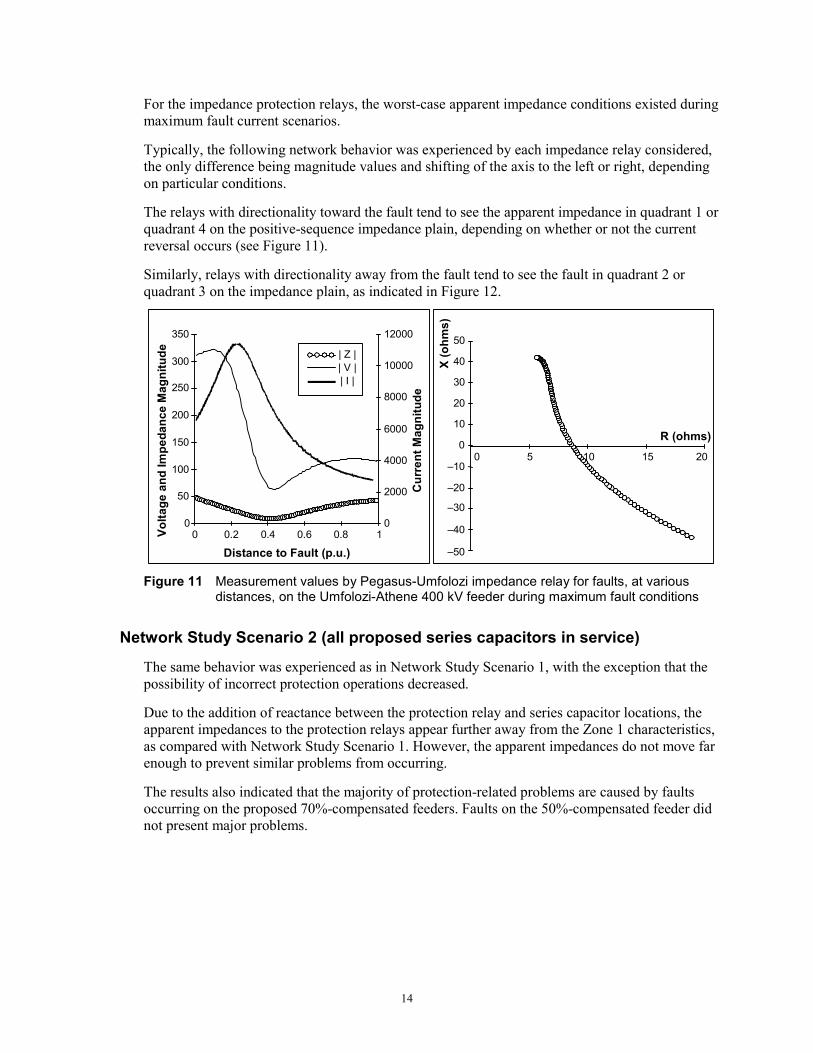
For the impedance protection relays, the worst-case apparent impedance conditions existed during maximum fault current scenarios.
Typically, the following network behavior was experienced by each impedance relay considered, the only difference being magnitude values and shifting of the axis to the left or right, depending on particular conditions.
The relays with directionality toward the fault tend to see the apparent impedance in quadrant 1 or quadrant 4 on the positive-sequence impedance plain, depending on whether or not the current reversal occurs (see Figure 11).
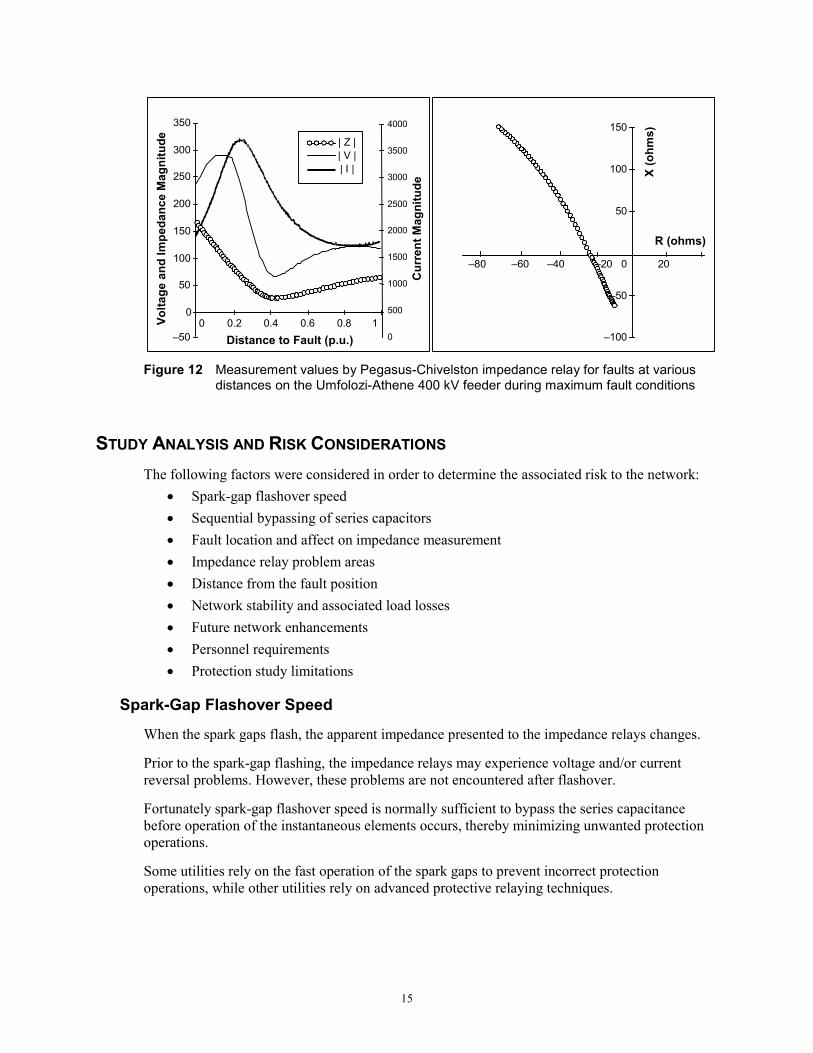
Similarly, relays with directionality away from the fault tend to see the fault in quadrant 2 or quadrant 3 on the impedance plain, as indicated in Figure 12.
Volta
ge a
nd Im
peda
nce
Mag
nitu
de
Distance to Fault (p.u.)
0
50
100
150
200
250
300
350
0 0.2 0.4 0.6 0.8 10
2000
4000
6000
8000
10000
12000
| Z || V || I |
Cur
rent
Mag
nitu
de
–10
0
10
20
30
40
50
0 5 10 15 20X
(ohm
s)R (ohms)
–20
–30
–40
–50
Figure 11 Measurement values by Pegasus-Umfolozi impedance relay for faults, at various distances, on the Umfolozi-Athene 400 kV feeder during maximum fault conditions
Network Study Scenario 2 (all proposed series capacitors in service)
The same behavior was experienced as in Network Study Scenario 1, with the exception that the possibility of incorrect protection operations decreased.
Due to the addition of reactance between the protection relay and series capacitor locations, the apparent impedances to the protection relays appear further away from the Zone 1 characteristics, as compared with Network Study Scenario 1. However, the apparent impedances do not move far enough to prevent similar problems from occurring.
The results also indicated that the majority of protection-related problems are caused by faults occurring on the proposed 70%-compensated feeders. Faults on the 50%-compensated feeder did not present major problems.
15
Volta
ge a
nd Im
peda
nce
Mag
nitu
de
Distance to Fault (p.u.)
Cur
rent
Mag
nitu
de
X (o
hms)
R (ohms)
0
500
1000
1500
2000
2500
3000
3500
4000
| Z || V || I |
50
100
150
200
250
300
350
00 0.2 0.4 0.6 0.8 1
–50
–80 –60 –40 20
50
100
150
–50
–100
–20 0
Figure 12 Measurement values by Pegasus-Chivelston impedance relay for faults at various
distances on the Umfolozi-Athene 400 kV feeder during maximum fault conditions
STUDY ANALYSIS AND RISK CONSIDERATIONS The following factors were considered in order to determine the associated risk to the network:
• Spark-gap flashover speed • Sequential bypassing of series capacitors • Fault location and affect on impedance measurement • Impedance relay problem areas • Distance from the fault position • Network stability and associated load losses • Future network enhancements • Personnel requirements • Protection study limitations
Spark-Gap Flashover Speed
When the spark gaps flash, the apparent impedance presented to the impedance relays changes.
Prior to the spark-gap flashing, the impedance relays may experience voltage and/or current reversal problems. However, these problems are not encountered after flashover.
Fortunately spark-gap flashover speed is normally sufficient to bypass the series capacitance before operation of the instantaneous elements occurs, thereby minimizing unwanted protection operations.
Some utilities rely on the fast operation of the spark gaps to prevent incorrect protection operations, while other utilities rely on advanced protective relaying techniques.
16
During the spark-gap flashover process, transients are induced, which may also be problematic for the impedance relays. This paper does not cover the effect of spark-gap operations and transients on impedance protection.
The impact of incorrect protection operations on the network can influence the decision to rely entirely on fast spark-gap flashover.
Sequential Bypassing of Series Capacitors
Due to the nature of the studied network and behavior under fault conditions (e.g., dynamic fault resistance), sequential bypassing of the series capacitors is possible, especially under low fault-level conditions.
This may result in prolonged dynamic and steady-state apparent impedances being presented to the relays, which may in turn result in incorrect protection operations.
Fault Location and Effect on Impedance Measurement
From the study results, it is evident that the fault location can dramatically influence the possibility of protection problems occurring.
The worst-case fault locations tend to move along the series-compensated feeders, depending on network configuration and fault characteristics.
Impedance Relay Problem Areas
The study results indicated three problem areas, in terms of apparent impedance measurements.
Area 1—Incorrect tripping in Zone 1 for faults on series-compensated feeders
R (sec)
1–40
–30
–20
–10
0
10
20
30
40
50
–40 –20 0 20 40
X (sec)
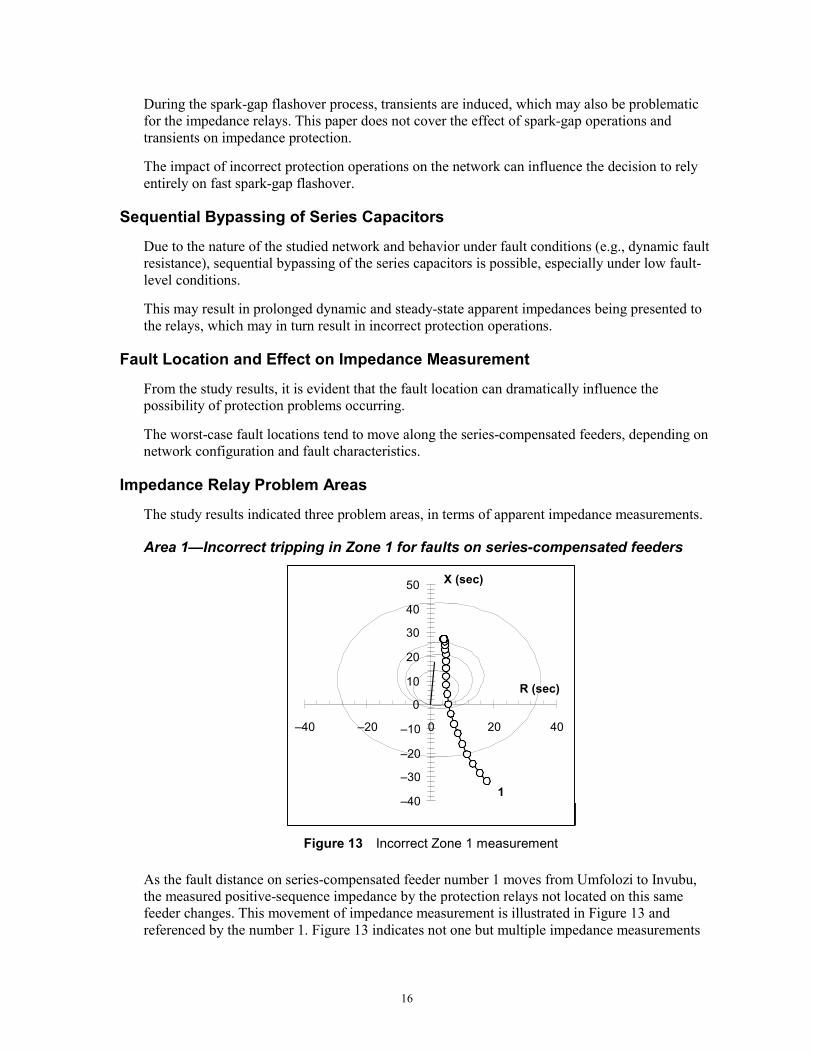
Figure 13 Incorrect Zone 1 measurement
As the fault distance on series-compensated feeder number 1 moves from Umfolozi to Invubu, the measured positive-sequence impedance by the protection relays not located on this same feeder changes. This movement of impedance measurement is illustrated in Figure 13 and referenced by the number 1. Figure 13 indicates not one but multiple impedance measurements
17
on the same graph for ease of illustration. The same principle is also indicated in Figure 11, Figure 12, Figure 14, and Figure 15.
Incorrect operation by the Zone 1 measuring elements could occur for faults on the series-compensated feeders. This would result in instantaneous tripping of the breaker and the loss of at least one supply route to the Kwazulu-Natal network. The incorrect operations could occur on protection relays looking towards (e.g., Tutuka-Pegasus) and away (e.g., Pegasus, Tutuka) from the series-compensated feeders. Any decrease of source impedance will tend to shift the fault impedance measured towards the Zone 1 impedance characteristic.
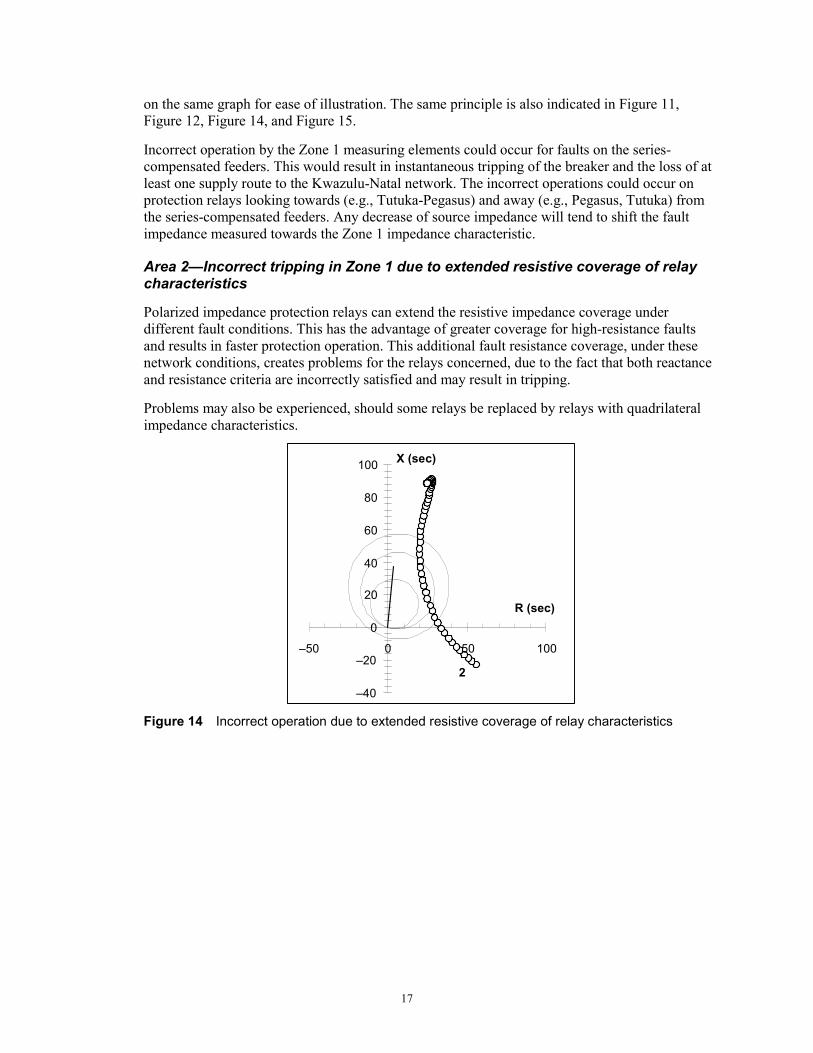
Area 2—Incorrect tripping in Zone 1 due to extended resistive coverage of relay characteristics
Polarized impedance protection relays can extend the resistive impedance coverage under different fault conditions. This has the advantage of greater coverage for high-resistance faults and results in faster protection operation. This additional fault resistance coverage, under these network conditions, creates problems for the relays concerned, due to the fact that both reactance and resistance criteria are incorrectly satisfied and may result in tripping.
Problems may also be experienced, should some relays be replaced by relays with quadrilateral impedance characteristics.
X (sec)
2
–40
–20
0
20
40
60
80
100
–50 0 50 100
R (sec)
Figure 14 Incorrect operation due to extended resistive coverage of relay characteristics
18
Area 3—Incorrect permissive tripping
3
–50
–40
–30
–20
–10
010
20
30
40
5060
–40 –20 0 20 40R (sec)
X (sec)
3
–10
0
10
20
30
40
50
60
70
80
90
–40 –20 0 20 40
R (sec)
X (sec)
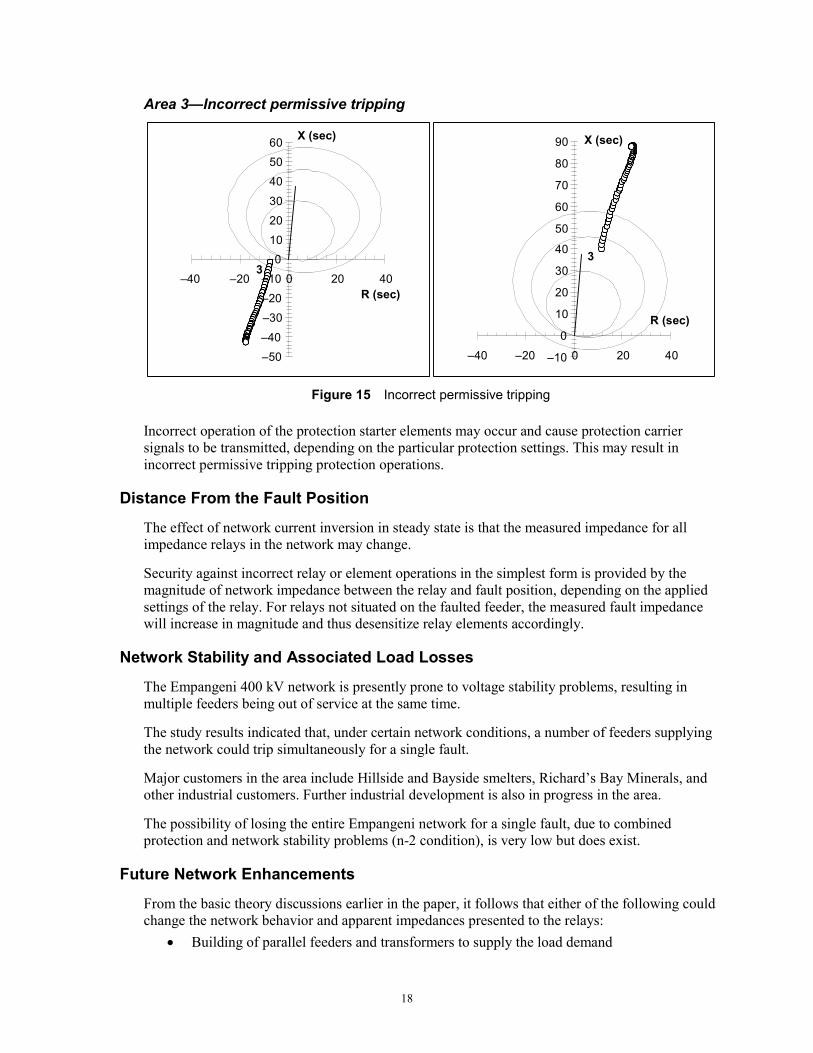
Figure 15 Incorrect permissive tripping
Incorrect operation of the protection starter elements may occur and cause protection carrier signals to be transmitted, depending on the particular protection settings. This may result in incorrect permissive tripping protection operations.
Distance From the Fault Position
The effect of network current inversion in steady state is that the measured impedance for all impedance relays in the network may change.
Security against incorrect relay or element operations in the simplest form is provided by the magnitude of network impedance between the relay and fault position, depending on the applied settings of the relay. For relays not situated on the faulted feeder, the measured fault impedance will increase in magnitude and thus desensitize relay elements accordingly.
Network Stability and Associated Load Losses
The Empangeni 400 kV network is presently prone to voltage stability problems, resulting in multiple feeders being out of service at the same time.
The study results indicated that, under certain network conditions, a number of feeders supplying the network could trip simultaneously for a single fault.
Major customers in the area include Hillside and Bayside smelters, Richard’s Bay Minerals, and other industrial customers. Further industrial development is also in progress in the area.
The possibility of losing the entire Empangeni network for a single fault, due to combined protection and network stability problems (n-2 condition), is very low but does exist.
Future Network Enhancements
From the basic theory discussions earlier in the paper, it follows that either of the following could change the network behavior and apparent impedances presented to the relays:
• Building of parallel feeders and transformers to supply the load demand

19
• Any additional generation in the area (e.g., Majuba)
Any reduction of source impedance will increase the possibility of incorrect protection operations.
Personnel Requirements
The proposed network and associated behavior are complex, and they impact the personnel requirements in the following areas:
• Protection settings • Fault investigations • Planning • Feeder personnel • Maintenance
A concern was also raised during the study about the importance of continuous future management of the identified problems.
Protection Study Limitations
Due to the complexity of the network configuration and behavior, it was not feasible to study all possible scenarios that include future enhancements.
Most of the study focused on worst-case conditions and specifically single- and three-phase faults. Phase-to-phase and phase-to-phase-to-ground faults were not studied.
Other factors that may cause under- or overreaching problems, such as mutual coupling between adjacent feeders and differences between phase-to-phase and phase-to-ground impedances during phase-to-phase-to-ground faults, were not considered.
The protection study described in this paper focused on steady-state conditions.
Some assumptions were made prior to the study and are mentioned earlier in the paper.
Even with all the energy and effort put into the study, not all potential problem areas may have been identified. This adds an unknown risk factor to be considered.
SUITABILITY OF EXISTING PROTECTION ON THE EMPANGENI NETWORK FEEDERS
Series-Compensated Feeders
Umfolozi-Athene and Pegasus-Athene
The presently installed transmission feeder protection on these two feeders is Eskom Phase III type scheme (first generation numerical technology) that was specified and model power network tested for the protection of series-compensated transmission feeders. With the addition of the series capacitors to the above two feeders and correct relay setting changes, this protection is capable of handling voltage reversal but not current reversal.
20
Umfolozi-Invubu
The protection on this feeder is Eskom pre-Phase II type scheme (early generation solid-state technology). This protection is not capable of protecting the series-compensated feeder due to its inherent design limitations that include, but are not limited to, the lack of voltage memory, the use of cross polarizing, and the lack of suitable transient filtering. This protection would therefore need to be changed.
Adjacent Feeders
Umfolozi-Normandie and Umfolozi-Pegasus
These feeders are adjacent to the two proposed series-compensated feeders (70% compensation factor) with the series capacitors located at Umfolozi substation. The protection on these two adjacent feeders is Eskom pre-Phase II type schemes.
None of these relays are equipped with polarizing memory and will therefore not be capable of handling the voltage-reversal problem created by faults on the proposed series-compensated feeders. The situation is most onerous for three-phase faults. These voltage reversals can occur if the series capacitor protective gaps do not flash and also during the transition period when the gaps are in the process of flashing. The problem associated with single- and double-phase faults can differ for the three relay types used, due to differences in the polarizing quantities used. Positive-sequence polarizing is the least susceptible to the problem, and faulted-phase polarizing is the most susceptible. (Two of the relay types use cross polarizing, which can cause these relays to overtrip for some fault conditions).
The relays are also potentially vulnerable to gap flashing transients that can cause the relays to either operate slowly or, in some cases, not at all.
A third issue is the vulnerability of these relays to low-frequency transients, which can cause overreaching of Zone 1 elements at the remote terminals looking into the capacitors.
As there is a risk of the series capacitor gaps not flashing for certain network scenarios and/or fault conditions, the risk of one or more adjacent feeders tripping for a fault on one of the series-compensated feeders should be considered in the overall risk assessment.
Pegasus-Chivelston, Pegasus-Tutuka, Pegasus-Drakensburg, and Pegasus-Hector
These feeders are adjacent to the Pegasus-Athene feeder, which has the proposed series capacitor located approximately midway and with a proposed compensation factor of 50%. The problems mentioned in the previous section are less severe for these cases but could still exist. Detailed network studies would be required to show the risk conditions. Reducing the percentage compensation such that no voltage reversal was possible would help to mitigate against the adjacent feeder relaying problems.
Pegasus-Majuba
This adjacent feeder is protected using Eskom Phase III type scheme (first generation numerical technology) and with the correct relay settings changes, this protection is capable of handling voltage reversal but not current reversal.
21
OPTIONS CONSIDERED The following options were considered for replacement of protection schemes in the network immediately surrounding the proposed series capacitor feeder installations and were based on steady-state results only. Each option was then analyzed in terms of financial cost and associated steady-state risk factors that were manually estimated from analysis of the studies conducted.
The uncertainty of transient or dynamic behavior to more remote protection schemes also added weight to the risk evaluation criteria.
In the end, it was concluded that the immediate upgrade cost, as well as the added risk, did not justify the installation of the proposed series capacitors. Discussed below are three options that were considered based only on the analysis of the steady-state conditions that excluded risk considerations because of transient or dynamics presented to the network protection schemes.
The costs associated with each option can be summarized by: • Protection scheme and relay replacements • Relay evaluation and testing overseas (including costs for travel and subsistence for two
people)
Option 1: Series Capacitors Positioned at Umfolozi 400 kV Substation
Risk: Low (to feeders north of Camden 400 kV substation)
Implementation Period: ±1.5 years
Approximate Cost (USD): $2–2.5 million
Option 2: Series Capacitors Positioned at Invubu and Athene 400 kV Substation
Risk: Low/Medium (to the following feeders) • Chivelston-Pegasus 400 kV • Drakensberg-Pegasus 400 kV • Tutuka-Pegasus 400 kV • Majuba-Pegasus 400 kV • Camden-Normandie 400 kV
Implementation Period: ±1 year
Approximate Cost (USD): $1.25–1.5 million
Option 3: Series Capacitors Positioned at Invubu and Athene 400 kV Substation
Risk: No increased risk
Implementation Period: ±1.5 years
Approximate Cost (USD): $1.95–2.2 million
22
CONCLUSIONS 1. The study conducted indicated potential problem areas to impedance protection relays in the
Empangeni 400 kV network.
2. For the proposed network conditions, it was identified that impedance protection is notsuitable on a number of 400 kV feeders without increasing the risk of incorrect protectionoperations and subsequent network stability problems.
3. Unit type protection schemes, combined with Option 3, are recommended forimplementation.
4. Various options for consideration were given with associated risk levels and approximateimplementation costs.
REFERENCES [1] CIGRÉ application guide, “Protection of Complex Transmission Network Configurations,”
1999.
[2] E. Stokes-Waller and P. Keller, “Power Network and Protection Performance Analysis on the Eskom Transmission Network Based on Digital Fault Records,” Southern African Power Network Protection Conference, South Africa, 1998.
[3] E. Stokes-Waller, “Automated Protection Performance Analysis From Digital Fault Recordings on the Eskom Transmission Network,” CIGRÉ 4th International Regional Conference, South Africa, 2000.
BIOGRAPHIES Graeme Topham has a B. Sc. (Eng.) degree from the University of the Witwatersrand (South Africa) and is registered with the Engineering Council of South Africa as a Professional Engineer. He is a member of the South African Institute of Electrical Engineers and holds the position of Corporate Consultant (Protection) in Eskom Enterprises—Technology Services International. He joined Eskom in 1978 and has 25 years experience in Eskom in the electrical protection field. He is the South African Member of CIGRÉ SCB5 (Protection and Automation), a member of CIGRÉ Working Groups B5.01, B5.10, B5.14, and B5.15, and has authored numerous technical papers.
Edmund Stokes-Waller has a B. Eng. and an M. Eng. in Electrical Engineering from the University of Pretoria (South Africa). He is registered as a Professional Engineer with the Engineering Council of South Africa. He has published numerous papers in the areas of power network protection, including its performance, monitoring, and evaluation. He received recognition for best paper and presentation at the Southern African Power Network Protection Conference in 2000. He has 10 years of experience in power network protection and has a passion for the continuous improvement of power network protection performance in practical power network applications. He joined Schweitzer Engineering Laboratories in 2003 in the position of International Application Engineer.
© 2004 Eskom Enterprises Technology Services International and Schweitzer Engineering Laboratories, Inc.
20041001 • TP6177