Embed Size (px)
Citation preview

2 0 1 4 C A P B E N C H M A R K R E P O R T
Staying the course, with an eye on the future
S P O N S O R E D B Y

2 Staying the course, with an eye on the future 2014 CAP Benchmark Repor t
Working in partnership with Great-West Life, your organization can help build a more
secure financial future for your employees. Our easy plan administration and account
management, superior services and customized plan features combine to create a plan
that’s right for you and your plan members.
Great-West administers defined contribution retirement and savings plans, offering clients
the support of a cross-Canada network of group retirement specialists. Our clients benefit
from first-class service and products, supported by a strong and stable organization
that focuses on accuracy and dependability.
Serving the financial security needs of more than 12 million people across Canada,
Great-West Life and its subsidiaries, London Life and Canada Life, have more than
$341 billion* in assets under administration. The companies’ assets under investment
management in the pension and group savings marketplace exceed $42.2 billion.*
Great-West and its subsidiaries are members of the Power Financial Corporation group
of companies. In the U.S., our sister company, Great-West Life & Annuity Insurance
Company (Great-West Financial) is the second-largest group retirement record keeper,
with US $400 billion* in assets under administration and nearly 7 million participants
in the U.S. defined contribution market.
Together with our subsidiaries, we offer:
• Registered retirement savings plans
• Registered pension plans (defined contribution)
• Deferred profit sharing plans
• Simplified pension plans (available in Quebec and Manitoba)
• Non-registered savings plans
• Tax-free savings accounts
• Pooled registered pension plans
• Voluntary retirement savings plans
Every business situation is unique. We look forward to working with you to develop a plan
as distinctive as your organization.
*as of Dec. 31, 2013
Great-West LifeA B O U T
Canadian Institutional Investment Net work Staying the course, with an eye on the future 3
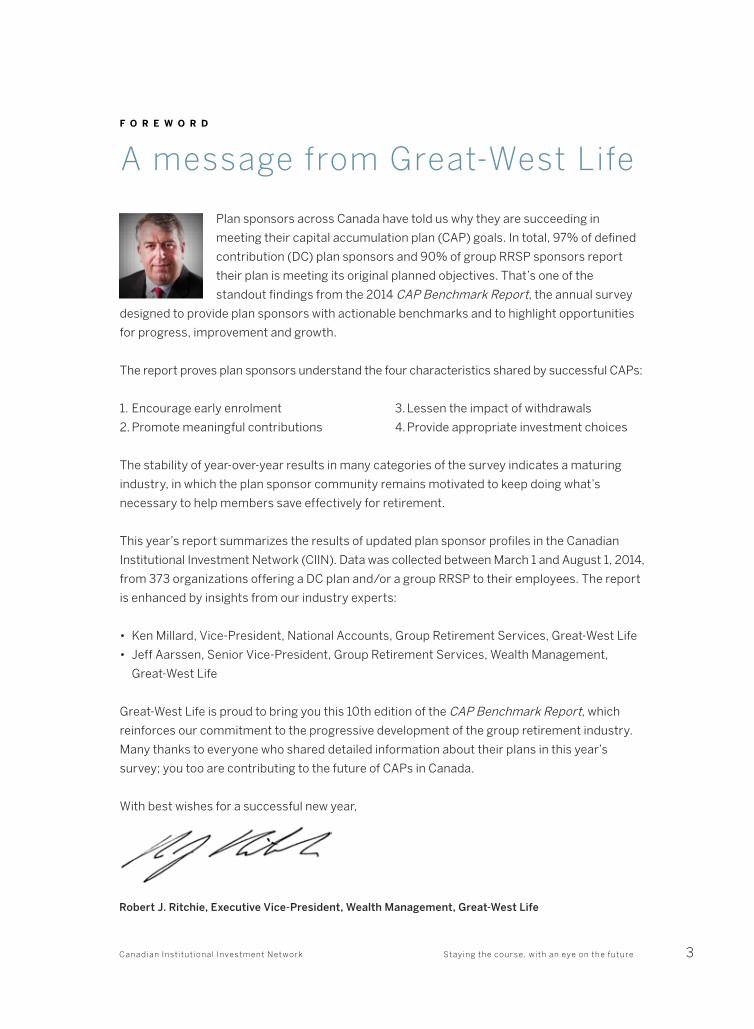
Plan sponsors across Canada have told us why they are succeeding in
meeting their capital accumulation plan (CAP) goals. In total, 97% of defined
contribution (DC) plan sponsors and 90% of group RRSP sponsors report
their plan is meeting its original planned objectives. That’s one of the
standout findings from the 2014 CAP Benchmark Report, the annual survey
designed to provide plan sponsors with actionable benchmarks and to highlight opportunities
for progress, improvement and growth.
The report proves plan sponsors understand the four characteristics shared by successful CAPs:
1. Encourage early enrolment 3. Lessen the impact of withdrawals
2. Promote meaningful contributions 4. Provide appropriate investment choices
The stability of year-over-year results in many categories of the survey indicates a maturing
industry, in which the plan sponsor community remains motivated to keep doing what’s
necessary to help members save effectively for retirement.
This year’s report summarizes the results of updated plan sponsor profiles in the Canadian
Institutional Investment Network (CIIN). Data was collected between March 1 and August 1, 2014,
from 373 organizations offering a DC plan and/or a group RRSP to their employees. The report
is enhanced by insights from our industry experts:
• Ken Millard, Vice-President, National Accounts, Group Retirement Services, Great-West Life
• Jeff Aarssen, Senior Vice-President, Group Retirement Services, Wealth Management,
Great-West Life
Great-West Life is proud to bring you this 10th edition of the CAP Benchmark Report, which
reinforces our commitment to the progressive development of the group retirement industry.
Many thanks to everyone who shared detailed information about their plans in this year’s
survey; you too are contributing to the future of CAPs in Canada.
With best wishes for a successful new year,
A message from Great-West LifeF O R E W O R D
Robert J. Ritchie, Executive Vice-President, Wealth Management, Great-West Life

4 Staying the course, with an eye on the future 2014 CAP Benchmark Repor t
u p f r o n t
A snapshot of CAPs in CanadaNote: Some response categories do not add up to 100%. This is due either to rounding or to questions that allowed respondents to provide multiple responses.
Organization details
Type of plan
Participation rate
Primary business
Market value of plan ($ millions)
Target date as default
Number of employees
Mandatory vs. voluntary
Average contribution rates
Corporation/private enterprise 65%Multi-employer 9%Other 9%Union 6%Public 1%University (education) 10%
65%9%
9%
6%
1%10%
Base: All respondents answering n=373
Base: All respondents answering n=373
Base: All respondents answering: DC plans n=173/41; group RRSPs n=53/93
Base: All respondents answering: DC plans 2010 n=202; 2011 n=225; 2012 n=308; 2013 n=257; 2014 n=235; group RRSPs 2010 n=118; 2011 n=145; 2012 n=180; 2013 n=122; 2014 n=164
Base for DC plans: Employees contribute n=168; Company contributes n=191; Base for group RRSPs: Employee contributes n=65; Company contributes n=63
Base: DC plans n=284; group RRSPs n=200Base: All respondents answering: DC plans n=245; group RRSPs n=173
Base: All respondents answering n=373
n Corporation/private enterprisen Multi-employern Othern Unionn Publicn University (education)
n 1–99n 100–199n 200–499n 500–999n 1,000+
n DC RPP onlyn Group RRSP onlyn DC RPP & Group RRSP
n NGO/non-profit/public sector/greater public sector
n Finance/business servicesn Manufacturingn Natural resourcesn Services/hospitalityn Transportation/
communications/utilities
26%
20%20%
13%
12%
10%22%
10%
13%9%
46%
46%
24%
30%
$156
$69
$0
$50
$100
$150
DC plans
Group RRSPs
71%
13%
29%
87%
DC plans
Group RRSPs
0%
20%
40%
60%
80%
n Mandatory n Voluntary
n Mandatory n Voluntary n DC plans n Group RRSPs n Company contributes n Employee contributes
DC plans
Group RRSPs
79%
51%
0%
20%
40%
60%
80%
100%
74%
98%
0%
10%
20%
30%
2010 2011 2012 2013 2014
6%
4%
15%
23% 21%
30%
33%
28%28%
16%
DC plans
Group RRSPs
3%
4%
5%
5.2%
4.3% 4.3%4.0%
Base: All respondents answering n=357

Canadian Institutional Investment Net work Staying the course, with an eye on the future 5
s e c t i o n 1
How quickly can members participate?
This year’s survey saw a year-over-year increase in the average number of plan
participants for both DC plans and group RRSPs. In 2014, the surveyed organizations
reported an average of 2,223 active plan participants and 144 terminated/retired
participants (total = 2,367) in DC plans, compared to a total of 1,877 in 2013. For group
RRSPs, there was an average of 1,476 active plan participants and 213 terminated/
retired participants (total = 1,689), compared to a total of 1,402 in 2013.
The participation rate among eligible employees for DC plans rose to 94% in 2014
from 91% in the previous year, and declined for group RRSPs from 65% in 2013
to 53% in 2014. It’s important to note that group RRSPs are much less likely to be
mandatory: 13% for group RRSPs versus 71% for DC plans in 2014. Also, voluntary
plans have significantly lower participation rates: 79% for voluntary DC plans and
51% for voluntary group RRSPs, compared to 98% for mandatory DC plans and 74%
for mandatory group RRSPs in 2014.
Interestingly, organization size makes a big difference in the voluntary/mandatory split
for DC plans, with 79% of organizations with 500-plus employees offering a mandatory
DC plan, compared to just 61% of smaller organizations. However, for group RRSPs
the numbers are much closer, with 14% of organizations with 500-plus employees
offering a mandatory group RRSP, compared to 12% of smaller organizations. Looking
towards the future, very few organizations with a voluntary plan in place are considering
implementing a mandatory plan: just 1% for those with DC plans, and 2% for those with
group RRSPs.
That said, organizations with voluntary plans are actively engaged in initiatives to
increase participation. For example, one plan sponsor schedules annual group and
one-on-one meetings to educate staff on the benefits of the plan, and requires
employees who do not wish to enrol to sign off on their decision. Another sends
eligibility letters to employees to ensure they’re aware they can sign up. A third makes
a special effort to guide new members through the complexities of the sign-up process.
Many organizations highlight the value of contribution matching by the plan sponsor
– and the missed opportunity when this money is left on the table.
6 Staying the course, with an eye on the future 2014 CAP Benchmark Repor t
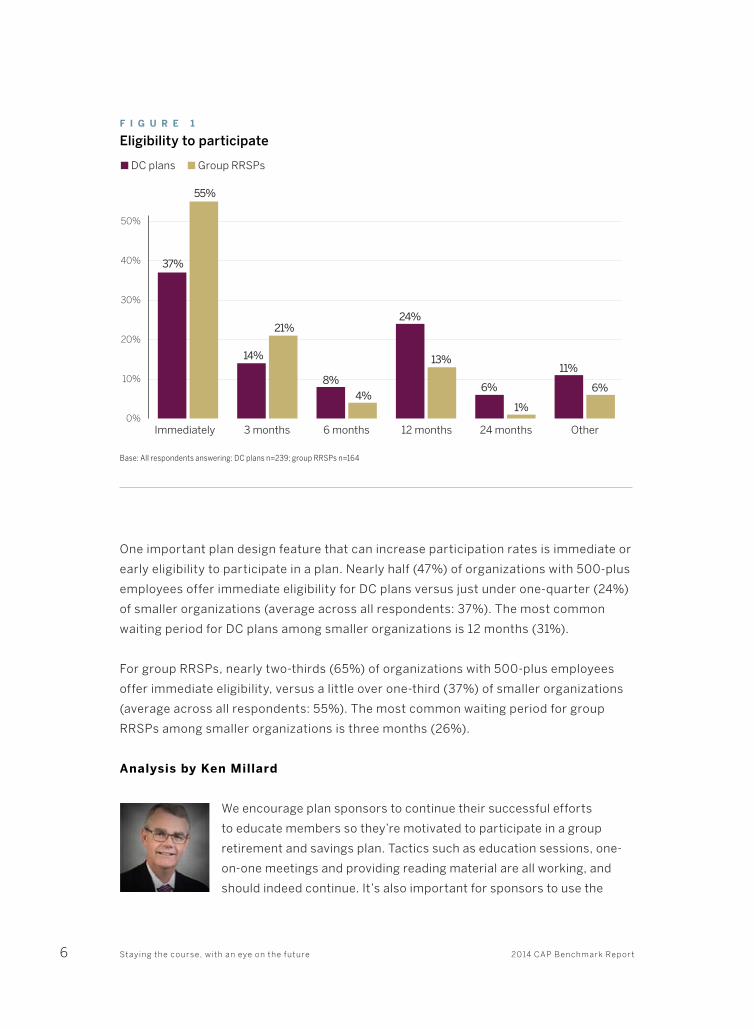
One important plan design feature that can increase participation rates is immediate or
early eligibility to participate in a plan. Nearly half (47%) of organizations with 500-plus
employees offer immediate eligibility for DC plans versus just under one-quarter (24%)
of smaller organizations (average across all respondents: 37%). The most common
waiting period for DC plans among smaller organizations is 12 months (31%).
For group RRSPs, nearly two-thirds (65%) of organizations with 500-plus employees
offer immediate eligibility, versus a little over one-third (37%) of smaller organizations
(average across all respondents: 55%). The most common waiting period for group
RRSPs among smaller organizations is three months (26%).
Analysis by Ken Millard
We encourage plan sponsors to continue their successful efforts
to educate members so they’re motivated to participate in a group
retirement and savings plan. Tactics such as education sessions, one-
on-one meetings and providing reading material are all working, and
should indeed continue. It’s also important for sponsors to use the
Immediately 3 months 6 months 12 months 24 months Other
37%
55%
14%
21%
8%
4%
24%
13%
6%
1%
11%
6%
0%
10%
20%
30%
40%
50%
n DC plans n Group RRSPs
F i g U R E 1
Eligibility to participate
Base: All respondents answering: DC plans n=239; group RRSPs n=164

Canadian Institutional Investment Net work Staying the course, with an eye on the future 7
many types of education materials at their disposal to better engage their members.
Using online, print and in-person education covers members’ various learning styles and
preferences; the more ways we present information to members, the more likely we are to
make an impact on their decisions.
While there are a number of options sponsors can use to structure their group plans,
offering early eligibility appears to be an effective way to increase overall participation
rates. Sponsors may want to consider the benefits of decreasing the waiting period for
plan eligibility to increase the likelihood of member participation.
The research shows that few organizations are looking to switch from a voluntary plan
to a mandatory one. If sponsors don’t intend to switch to a mandatory plan, they’ll likely
need to work harder to overcome employee inertia.
One of the most frequent causes of member inactivity is the natural tendency for people
to place a higher value on an immediate reward over one that will come in the distant
future. Someone in his or her 20s will pay less attention to saving for the future than
someone closer to retirement. That 20-year-old is likely attracted to more immediate
investment returns and shorter-term compound growth.
With this behavioural pattern in mind, it may be wise for plan sponsors to engage younger
members by educating them about saving using a group TFSA. Such a strategy would
provide these members with more flexibility while they’re young, while getting them used
to, and committed to, setting aside a small fraction of their earnings.
Another way to encourage employees to participate in a group plan is by educating them
about its typically lower investment management fees, compared to a retail savings
account. Our My Group Advantage calculator allows members to see how much money
they’re saving due to the lower fees associated with a group plan, and explains the
concept of the combined purchasing power of a group of investors.
While the above strategies are essential for a high participation rate, it’s important for
sponsors first to define their plans’ objectives before tackling decisions such as eligibility
to participate. These objectives should align with overall compensation, hiring and
retention strategies.
Looking towards the future, it’s also important for sponsors to keep in mind the
introduction of new plan types, such as the VRSP and PRPP, when designing their group
plans. These plans will, in most cases, include immediate eligibility for members.

8 Staying the course, with an eye on the future 2014 CAP Benchmark Repor t
s e c t i o n 2
How much do sponsors and members contribute?
In 2014, the average market value of plan assets was $156 million for DC plans and $69 million
for group RRSPs.
Average contributions were a mixed story in 2014. Employee contributions remained
relatively stable at 4.3% of salary for DC plans and 4.0% of salary for group RRSPs
(compared to 4.4% and 3.9%, respectively, in 2013). However, plan sponsor contributions to
DC plans dropped to 5.2% of salary, after rising steadily over the past few years to 6.5% in
2013. Meanwhile, plan sponsor contributions to group RRSPs rose to 4.3% after stalling at
just under 4.0% over the past few years.
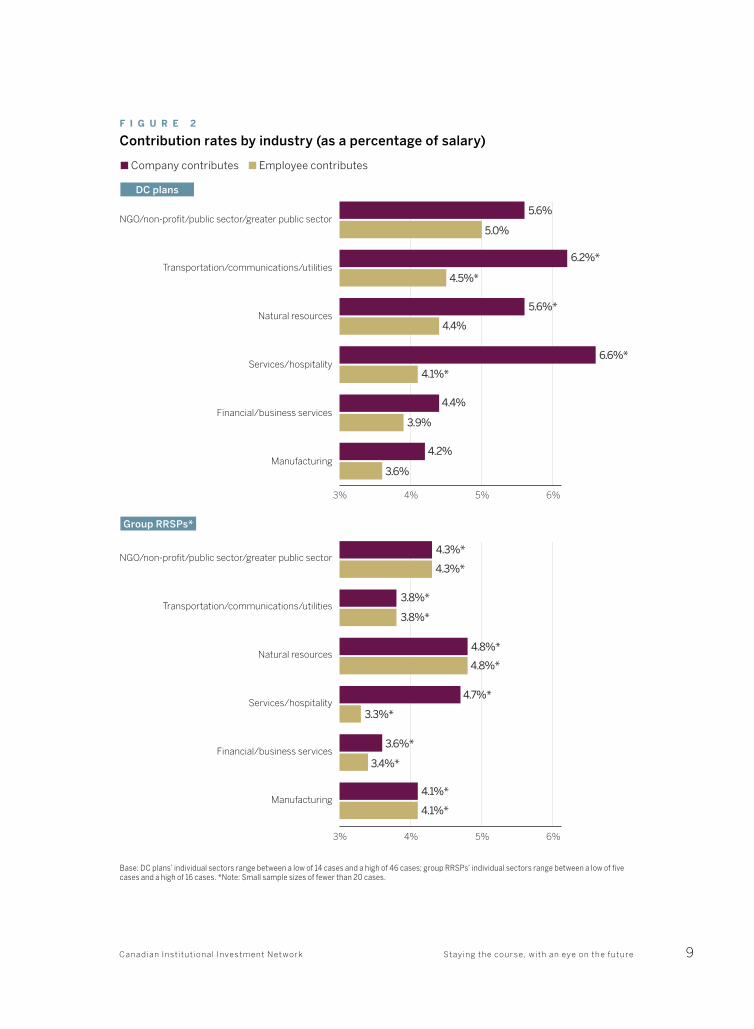
Plan sponsor contributions are a function of a variety of factors. DC plans most commonly
base contributions on employee earnings (78%); group RRSPs most commonly base
contributions on employee contributions (62%). They also vary by both organization size and
industry. Organizations with 500-plus employees contributed an average of 5.4% to DC plans
and 4.4% to group RRSPs in 2014; smaller organizations contributed an average of 5.0% to
DC plans and 4.2% to group RRSPs in 2014. With the caveat that some of these averages are
based on a very small number of survey responses, the highest plan sponsor contributions
by industry were in the services sector for DC plans (6.6%) and natural resources for
group RRSPs (4.8%). The lowest were in the manufacturing sector for DC plans (4.2%) and
financial/business services for group RRSPs (3.6%).
Another important question: are participants in both DC plans and group RRSPs securing the
maximum company match? The answer is yes for 73.9% of DC plan participants and 62.8%
of group RRSP participants on average. It’s a stronger yes for DC plan participants at smaller
organizations (80.8%, versus 68.3% at organizations with 500-plus employees) than for
group RRSP participants at organizations with 500-plus employees (66.4%, versus 61.9% at
smaller organizations).
In general, more participants maximized the company match in the years immediately following
the financial crisis of 2008; numbers have declined over the past couple of years. It’s possible
that a greater sense of financial security makes plan participants feel freer to address other
financial priorities, but the result is that they are leaving more money on the table.
Canadian Institutional Investment Net work Staying the course, with an eye on the future 9
5.6%
5.0%
6.2%*
5.6%*
6.6%*
4.5%*
4.4%
4.1%*
4.4%
3.9%
4.2%
3.6%
4.3%*
4.3%*
3.8%*
3.8%*
4.8%*
4.8%*
4.7%*
3.3%*
3.6%*
3.4%*
4.1%*
4.1%*
NGO/non-profit/public sector/greater public sector
Transportation/communications/utilities
Natural resources
Services/hospitality
Financial/business services
Manufacturing
NGO/non-profit/public sector/greater public sector
Transportation/communications/utilities
Natural resources
Services/hospitality
Financial/business services
Manufacturing
3% 4% 5% 6%
3% 4% 5% 6%
n Company contributes n Employee contributes
F i g U R E 2
Contribution rates by industry (as a percentage of salary)
DC plans
Group RRSPs*
Base: DC plans’ individual sectors range between a low of 14 cases and a high of 46 cases; group RRSPs’ individual sectors range between a low of five cases and a high of 16 cases. *Note: Small sample sizes of fewer than 20 cases.

10 Staying the course, with an eye on the future 2014 CAP Benchmark Repor t
n Company contributes n Employee contributes
F i g U R E 3
Contribution rates over time (as a percentage of salary)
DC plans
3%
4%
5%
6%
7%
8%
3%
4%
5%
6%
7%
8%
2010 2011 2012 2013 2014 2010 2011 2012 2013 2014
5.0% 5.1%
3.8% 3.8% 3.9% 4.0%
4.3%3.9%
4.3%3.9%
7.6%
4.8%
5.6%
6.5%
5.2%
4.6%4.2%
4.5% 4.4% 4.3%
Group RRSPs
Base: 2014 DC plans n=168; group RRSPs n=65
Analysis by Jeff Aarssen
Although employee contributions to both DC plans and group RRSPs
have remained relatively stable from 2013 to 2014, it’s beneficial to
examine why some plan members aren’t contributing. Tools that allow
sponsors to look into their members’ contribution data help employers
understand trends that may affect contribution rates. For example, our
Sponsor resource centre can display data by age or plan type.
To increase members’ contributions, plan sponsors can educate their employees about
the impact regular contributions have on their retirement savings. There are several
tools and calculators that help members understand that just a small increase to their
contributions will make a large difference to their future savings.
Offering automatic escalation of member contributions over time has proven to be another
effective way to increase members’ contributions and ready them for retirement, particularly
in the U.S.* However, it’s important that employees have the choice to opt out of escalation.
*www.401khelpcenter.com/cw/cw_auto_enroll.html#.VEk6NSLF8a4

Canadian Institutional Investment Net work Staying the course, with an eye on the future 11
We see in Figure 2 that, in some industries, employee contributions come quite close to
the amount sponsors contribute, suggesting that these organizations’ matching programs
are attractive to members. In other sectors, sponsors may want to ask why company
and employee contributions are further apart. It may be that these organizations have
an opportunity to better promote their matching programs as a benefit that’s part of an
employee’s overall compensation package.
We know that contribution amount and an early start to contributing have the greatest
benefit to a member’s retirement savings, no matter what the investment returns. It’s
important for sponsors to educate employees about the significance of these two concepts,
using the variety of interactive tools available to them.
F i g U R E 4
Basis for company’s plan contribution
Base: Those whose companies contribute to plan: DC plans n=244; group RRSPs n=123
DC plans group RRSPs
Employee’s earnings 78% 53%
Employee’s contributions 36% 62%
Years of service 17% 13%
Company’s earnings 5% 7%
Other 11% 6%
F i g U R E 5
Maximizing the company match
Base: For DC plans, all respondents answering: 2014 n=121; for group RRSPs, those whose company contributes: 2014 n=57
50%
60%
70%
80%
2008 2009 2010 2011 2012 2013 2014
75.3%
74.5%
81.5%
80.0%
81.8%
62.6%
77.4%
82.5%80.0%
74.2%
73.5%
73.1%
73.9%
62.8%
n DC plans n Group RRSPs

12 Staying the course, with an eye on the future 2014 CAP Benchmark Repor t
s e c t i o n 3
Are plans future-focused?
The organizations surveyed are working hard to keep participants on the right
path towards a successful retirement. Among DC plan sponsors, 91% provide
information, 81% provide education and 48% provide advice. Among group
RRSP sponsors, 90% provide information, 76% provide education and 53%
provide advice.
The biggest difference between what is provided by organizations with 500-plus
employees and what is provided by smaller organizations lies in the area of advice.
Smaller organizations take the lead, with 55% of smaller organizations with DC plans
(versus 44% of larger organizations) offering advice, and 65% of smaller organizations
with group RRSPs (versus 45% of larger organizations) offering advice.
F i g U R E 6
Areas targeted for improvement
0%
25%
50%
75%
63%
52%48%
60%
14% 15%
6%8%
10%7%
Member Member Investment Plan Plan engagement education selection administration governance
63% 52%48% 60%14% 15%6% 8%10% 7%
Base: All respondents answering: DC plans n=126; group RRSPs n=126
n DC plans n Group RRSPs

Canadian Institutional Investment Net work Staying the course, with an eye on the future 13
While 97% of DC plan sponsors and 90% of group RRSP sponsors are satisfied their plan
is achieving its original planned objectives, it’s not surprising that member engagement
and member education are the two top areas plan sponsors are looking to improve. For
DC plans, 63% of plan sponsors would like to enhance member engagement, while 48%
would like to enhance member education. For group RRSPs, 52% would like to enhance
member engagement, while 60% would like to enhance member education.
Beyond engagement and education, restricting withdrawals is one way to help
participants remain focused on the long term. We included a new question in our survey
this year to benchmark restrictions on withdrawals. Across both DC plans and group
RRSPs, nearly half (49%) of plan sponsors do not permit withdrawals during active
employment. Meanwhile, 16% only permit withdrawals for government programs such
as the Home Buyers’ Plan and Lifelong Learning Plan, 7% only permit withdrawals with
employer consent, and 21% only permit withdrawals of employee money (not employer
money). One in 10 (10%) suspend employer contributions following withdrawal by an
employee. On the other hand, three in 10 (31%) place no restrictions on withdrawals.
F i g U R E 7
Restricting withdrawals
Base: All respondents answering n=164
No withdrawals while employed
No restrictions on withdrawals
No withdrawals of employer money
No withdrawals except through government programs
Suspension of employer contributions following withdrawal
Other restrictions imposed
No withdrawals without employer consent
0% 10% 20% 30% 40% 50%
7%
10%
10%
16%
21%
31%
49%

14 Staying the course, with an eye on the future 2014 CAP Benchmark Repor t
Analysis by Ken Millard
Plan members learn in many different ways. That’s why it’s necessary
to offer education in a variety of formats. Some people retain
information better when it comes in the form of personal, one-on-one
advice, while others prefer to learn on their own. Still others benefit
from a group setting with the opportunity for a question-and-answer
session with an educator. Plan sponsors should continue to expend efforts in all areas
of member education and advice.
It’s surprising that 31% of survey respondents put no restrictions on withdrawals. Plan
sponsors may want to consider applying some of the design elements used by defined
benefit (DB) plans to limit withdrawals. DB plan members have no opportunity for early
withdrawal or to cash in their pension, which begs the question, “Why allow DC plan and
RRSP members to do so?”
Plan sponsors that don’t intend to place restrictions on withdrawals need to diligently
monitor their plans’ activity to ensure early withdrawals are the exception, rather than
the rule. Because withdrawals eliminate the opportunity for future compound growth,
it’s crucial to explain to members that taking money out of their group plan before
retirement can have significant negative repercussions.
Our animated video explains to members that early withdrawals from savings can
hurt in the long term (www.youtube.com/user/GreatWestGRS). For example, if they
withdrew $10,000 at age 37, they would have $51,000 less when they retire. If they
withdrew money closer to retirement – $10,000 at age 47 – they’d have $28,000 less in
savings when they retire.
On the flip side of the retirement spectrum, organizations should also educate
members nearing retirement about their decumulation options. With this knowledge,
employees can make informed choices about participating in any payout products
sponsors may offer. These options may provide more guarantees and lower fees
than those available through retail products. There are many educational tools and
resources tailored for members who are getting ready to retire that can help guide them
through financial decisions for retirement.

Canadian Institutional Investment Net work Staying the course, with an eye on the future 15
s e c t i o n 4
What investment choices do plans offer?
Almost nine in 10 (89%) DC plans and almost all (98%) group RRSPs allow members to
make their own investment decisions, with an average of 18.6 investment options offered in
DC plans and 21.3 investment options offered in group RRSPs. These numbers have been
relatively stable over the past few years.
The five most popular investment categories, each offered in a majority of plans, are the
same for DC plans and group RRSPs: Canadian equity funds, balanced funds, fixed income
funds, foreign equity funds, and cash and equivalent funds. While target date and target
risk asset allocation funds are gaining popularity as the default investment option, they are
offered in a minority of plans. Target date funds appear in 27% of DC plans and 33% of group
RRSPs, while target risk funds appear in 16% of DC plans and 20% of group RRSPs.
As defaults, target date funds sit at the top of the list for DC plans (33%) and group RRSPs
(30%) – closely followed by balanced funds (30% for DC plans and 22% for group RRSPs).
Momentum appears to be on the side of target date funds, which saw a year-over-year
increase to 33% from 28% in 2013, while balanced funds remained static at 30%. Target risk
funds remain a significantly less popular default option, sitting at just 7% for both DC plans
and group RRSPs.
The average number of investments held by members has declined in recent years
and reached 3.1 for both DC plans and group RRSPs in 2014. The maximum number of
investments held by members has also dropped to 14 for DC plans and 15 for group RRSPs in
2014 – down from a peak of 24 for DC plans in 2012 and a peak of 31 for group RRSPs in 2013.
Analysis by Jeff Aarssen
Plan sponsors that don’t offer target date funds – which are the majority –
have an opportunity to improve their investment choices for members by
investigating this option. These funds are an ideal choice for members who
don’t want to continually revisit their investment decisions over time. Also
suitable for default investment options, target date funds automatically
adjust underlying investment options to suit the member’s chosen retirement date.

16 Staying the course, with an eye on the future 2014 CAP Benchmark Repor t
F i g U R E 8
Investment options available to members
4%
3%
5%
1%
11%
16%
20%
16%
33%
27%
27%
20%
54%
61%
58%
52%
56%
61%
56%
63%
66%
58%Canadian equity funds
Balanced funds
Fixed income funds
Cash and cash equivalent funds
Foreign equity funds
Specialty equity funds
Target date funds
Target risk funds
Combination target date/target risk funds
Employer stock
Other
0% 10% 20% 30% 40% 50% 60%
Base: All respondents answering: DC plans n=283; group RRSPs n=200
n DC plans n Group RRSPs

Canadian Institutional Investment Net work Staying the course, with an eye on the future 17
The handful of sponsors that have set money market funds as the default investment
option for their plans would see their members benefit if they chose a different default fund.
Money market funds are best used as a short-term investment option, and don’t generate
sufficient returns over the long run. If the members of these plans don’t choose an alternative
investment, they likely aren’t maximizing their savings potential. It’s disappointing to see that
more than 10% of plans offer money market funds as the default, particularly while interest
rates remain low.
Behavioural economics research tells us that some people tend to delay decisions when they
are faced with too many choices. Data shows the probability of member participation drops
when plans offer too many investment options.* Reducing the number of investment choices
is a positive trend that simplifies decisions for members. Plan sponsors should do as much as
possible to eliminate barriers to, and excuses for, inaction among members, including limiting
the number of investments available in their plan.
F i g U R E 9
Default investment option
Base: All respondents answering: DC plans n=235; group RRSPs n=164
30%
22%15%
7%
12%
9%
33%
30%
12%
7%
6%
6%
2% 3% 2% 3%
n Target date fundn Balanced fundn Money market fundn Target risk fund
n Cash/daily interest accountn Combination target date/target risk fundn GICn Other
DC plans Group RRSPs
*www.ebri.org/pdf/briefspdf/EBRI_IB_01-20071.pdf

L o o k i n g a h e a d
From accumulation to decumulation
With the baby boom generation poised to enter retirement en masse, it’s more important
than ever for capital accumulation plans to make asset decumulation as much of a priority
as asset accumulation.
Plan sponsors are adapting to meet the needs of an increasing number of employees
approaching retirement by offering a range of services. The top three for both DC plans
and group RRSPs are dedicated call centre support, seminars for members, and advice.
However, most plans (64% of DC plans and 71% of group RRSPs) require members to
leave their plan and transfer their savings out when they retire (or following termination).
Continuing plans offered by the same provider can offer continuity in services that
otherwise wouldn’t be available.
Watch for an expanded focus on how plan sponsors are managing members’ transition
into retirement and implementing solutions for asset decumulation in next year’s
CAP Benchmark Report.
18 Staying the course, with an eye on the future 2014 CAP Benchmark Repor t

S P O N S O R E D B Y
This supplement is published by Rogers Publishing Ltd., One Mount Pleasant Road, 7th Floor, Toronto, Ontario M4Y 2Y5.
Telephone: (416) 764-2000; Fax: (416) 764-3943. No part of this publication may be reproduced, in whole or in part,
without the written permission of the publisher. Copyright © 2014

4C
Raquel Mullen
Shireen Kok
None
100% of Final Size
7.875” x 10.75” 7” x 10” 7.875” x 10.75”
8.375” x 11.25”
NoneNone
7.875” x 10.75”
None
None3
129215-1129215
Cyan
Magenta Yellow
Black
Cossette Great West Life
GWL February 2014 Print Campaign
129215-1_GWL_BENEFITS_E.indd
3-24-2014 3:17 PM
Aravi Jegatheeswaran
Shireen Kok / Shireen Kok
Jordan Smith
Unlock your employees’ retirement goals with the right plan.Visit www.grsaccess.com to learn more.
Every company is unique. That’s why we partner with you to understand your company’s needs and develop tailored solutions.
With Canada’s largest network of group retirement ofces, our dedicated team will work with you to help your employees reach their retirement goals.
CONTACT
Ken Millard
Vice President, National Accounts
Great-West Life Group Retirement Services
(519) 435 6096
RETIREMENT SOLUTIONS THAT NEVER STOP WORKING
Great-W ement Solutions that never stop working” are trademarks of The Great-W .
T:7.875”T
:10
.75
”