Embed Size (px)
Citation preview

ANNUAL REPORT 2018For the year ended April 30, 2018
Staying Ahead of Change

AIN HOLDINGS ANNUAL REPORT 2018 1
We are rolling out new retail formats for women under our ainz & tulpe brand. Brand power and earnings are both increasing by the year, thanks to a strategy of opening new stores in prime locations in the Tokyo metropolitan area and using interesting retail displays that keep customers coming back. We are confident our cosmetic and drug store business will become a second key source of earnings for the AIN Group.
Contents
1 AIN HOLDINGS at a Glance
2 Message from the President
8 Growth Strategy 8 Dispensing Pharmacy Business 8 Operating environment 10 Top-line growth 12 Supporting the government’s vision for
patient-focused dispensing pharmacies 14 Recruit and train personnel 16 Cosmetic and Drug Store Business 16 Standing out in the market 18 Brands
20 ESG– Supporting Value Creation 20 Responding to ESG Issues 22 Corporate Governance
24 Board of Directors and Corporate Auditors
26 Financial Section 26 Management’s Discussion and Analysis of Financial Condition and Results of Operations 26 11-year Financial Summary 30 Consolidated Balance Sheet 32 Consolidated Statement of Income 32 Consolidated Statement of Comprehensive Income 33 Consolidated Statement of Changes in Net Assets 34 Consolidated Statement of Cash Flows 35 Notes to Consolidated Financial Statements 59 Independent Auditor’s Report
60 Investor Information
Forward-looking Statements
This annual report contains forecasts and projections concerning the plans, strategies and performance of AIN HOLDINGS INC. and its subsidiaries and affiliates. These forecasts and projections constitute forward-looking statements that are not historical facts, but are based on assumptions and beliefs in accordance with data currently available to management. These forward-looking statements are subject to a number of risks and uncertainties that include, but are not limited to, economic conditions, intense competition in the healthcare industry, demand, foreign exchange rates, tax systems, and laws and regulations. As such, AIN HOLDINGS INC. wishes to caution readers that actual results may differ materially from those projected.
Cosmetic and Drug Store Business
AIN HOLDINGS at a Glance
Dispensing Pharmacy Business
Hope, Beauty and Compassion
Other Businesses ¥5,623 million (2.1%)
Dispensing Pharmacy Business¥238,645 million (88.9%)
Cosmetic and Drug Store Business¥24,117 million (9.0%)
Fiscal 2018 Consolidated
Net Sales¥268,385 million
AIN HOLDINGS operates Japan’s leading dispensing pharmacy business and a unique cosmetic and drug store business focused on women. Over the years, we have achieved sustained growth by expanding these businesses while consistently anticipating and responding flexibly to changes in the operating environment.
Starting in fiscal 2018, AIN HOLDINGS selected Audrey Hepburn as its
communication icon.
As an actress, Audrey Hepburn embodies beauty, vigor and glamour, and as
a mother, strength and purity. She is also seen as an independent woman with
elegance and grace. In her later years, Audrey Hepburn was a UNICEF Goodwill
Ambassador. In that role and through other humanitarian work, she became
known for her kindness, warmth and compassion in the way she treated others.
Even today, she remains one of the world’s best-loved actresses.
To live life to the full and with the level of generosity that Audrey Hepburn
displayed over the years is the dream of many people. AIN HOLDINGS is no
different. We want to contribute to society as a company that supports people
everywhere, making that an integral part of the way we do business, just as
Audrey Hepburn led her life.
We have chosen her image and words to represent the AIN Group, which will
be used widely to connect with customers across the Group through advertising
and posters in ainz & tulpe stores and in our dispensing pharmacies.
The dispensing pharmacy sector is one of Japan’s few growth markets. We aim to reinforce our position as the dominant player in the sector by responding to new demands on dispensing pharmacies and by playing a key role in society as part of Japan’s healthcare system.
The leader in Japan’s
dispensing pharmacy market
Beauty products account for more than
80%of store merchandise
Net sales (¥ million)
8.0
7.0
6.0
5.0
4.0
3.0
1.0
0.0
2.0
40,000 80,000 160,000120,0000 200,000 280,000240,000
AIN HOLDINGSO
pera
ting
mar
gin
(%)
NIHON CHOUZAI
Qol
SOGO MEDICAL
MEDICAL SYSTEM NETWORK
Notes:1. Net sales and operating margin are compiled by AIN HOLDINGS based on each
company’s summary of financial statements for FY 3/18 (AIN HOLDINGS: FY 4/18) .2. Size of circle is proportional to market capitalization as of July 31, 2018.
Net Sales by Segment
Market distribution of dispensing pharmacies in Japan— Comparison of net sales and operating margin among major
companies operating dispensing pharmacies in Japan
ainz & tulpe Grand Emio TOKOROZAWA

2 AIN HOLDINGS ANNUAL REPORT 2018 AIN HOLDINGS ANNUAL REPORT 2018 3
Message from the President
Record operating income and net income
For fiscal 2018, ended April 30, 2018, we reported net sales of ¥268,385 million, up 8.2% year
on year, operating income of ¥19,622 million, up 34.7%, and profit attributable to owners
of parent of ¥10,567 million, up 32.9%. Profits were a record high. The dispensing pharmacy
business did not face revisions to drug prices or dispensing fees in fiscal 2018, and internal
measures implemented to address the previous round of revisions in April 2016 yielded significant
results. The cosmetic and drug store business moved into profit, one year earlier than our April
2019 target. That reflected a strong performance by existing stores opened through 2017, as well
as an improvement in brand power and store profitability.
The dispensing pharmacy sector stands at a major turning point Pharmacies now allowed on hospital sites, business conditions becoming more challenging
Japan’s dispensing pharmacy sector stands at a major turning point. One reason is the end of
restrictions on dispensing pharmacies on hospital sites, although private pharmacies are still not
allowed inside hospital buildings. Before the ban was lifted in 2016, the key to success in the
sector was opening dispensing pharmacies in prime locations near hospitals, providing easy access
for patients. However, that dynamic no longer holds true, as pharmacies located within hospital
sites have a clear advantage over those located outside hospitals. Large public hospitals are
Kiichi OtaniPresident and Representative Director
currently leading efforts to attract pharmacies to their premises, and the shift to onsite dispensing
pharmacies, including at private hospitals, is likely to accelerate over the next two or three years.
Revisions to dispensing fees are also driving far-reaching changes to existing approaches in
the sector. In the April 2018 revisions, dispensing fees were reduced, and changes to technical
fees are set to have a significant impact on earnings at major dispensing pharmacy operators,
including the AIN Group. In addition, small and medium size dispensing pharmacy companies face
the prospect of being forced out of business or selling their operations. Many are struggling to
adapt to the government’s vision for patient-focused pharmacies, and they are also finding it hard
to attract enough pharmacists and identify successors to run their businesses.
However, those developments are likely to trigger sector restructuring, which we view as an
opportunity to reinforce our position as the dominant player in the dispensing pharmacy sector.
Dispensing pharmacy business growth strategy Leverage advantages in quality, personnel and finances to become the pharmacy chain of choice
The deregulation of onsite pharmacies presents a significant risk for dispensing pharmacies
located in prime locations near hospitals, as they could struggle to attract business if patients
choose to use pharmacies on hospital premises. However, as a relatively late entrant to the sector,
we operate only a handful of dispensing pharmacies near major university hospitals nationwide.
That means the recent end to restrictions on onsite pharmacies offers the AIN Group new market
opportunities.
Hospitals that want pharmacies to locate on their premises are looking for companies with
sound finances and good prospects for long-term viability. Onsite pharmacies also have to be
open 24 hours throughout the year, and pharmacies at large hospitals need a large staff of skilled
and experienced pharmacists who can handle complex medicines such as anticancer drugs.
History of Growth
300,000
250,000
200,000
150,000
100,000
50,000
0
(¥ million)
25,000
20,000
15,000
10,000
5,000
0
(¥ million)
Net sales Net sales Ordinary income
93/4 95/4 01/4 06/4 11/4 19/4
Ordinary income
• Opened pharmacies in prime locations
• Built modern dispensing system
• Opened drug stores with dispensing pharmacy functions
• Opened pharmacies across Japan
• Rebuilt the drug store chain
• Improved ef�ciency and safety at pharmacies
• Actively opened pharmacies, used M&A
• Established WHOLESALE STARS
• Expanded the ainz & tulpe chain
• Promoted sales of generic drugs
• Created Yubari home healthcare model
• Tightened cost control
• Open pharmacies in prime locations including on hospital premises, M&A
• Increase pharmacy capabilities
• Recruit and train personal
• Expand the ainz & tulpe chain
Fiscal 1995 Fiscal 2001 Fiscal 2006 Fiscal 2011 Fiscal 2019 (plan)
Topics
Staying Ahead of Change

4 AIN HOLDINGS ANNUAL REPORT 2018 AIN HOLDINGS ANNUAL REPORT 2018 5
Message from the President
At the Ain Pharmacy Engaru, which was opened on the premises
of the Engaru-Kosei General Hospital in Hokkaido in April 2018, we
have deployed 21 pharmacists and 17 administrative staff. Opening
pharmacies in regional areas like Engaru requires significant upfront
investment, including the cost of securing accommodation for
employees. From a cost perspective as well, only a handful of companies
in the sector have the resources to open onsite pharmacies in regional
areas on a sustained basis.
I believe AIN HOLDINGS is well-placed to meet all those criteria, thanks
to our efforts over the years to expand our business, increase the quality
and number of pharmacists, and build a sound financial base. Our track
record in fostering close links with medical institutions as part of our
pharmacy opening program also gives us a competitive advantage in the sector. I believe those
strengths will start to yield clear results over the next two or three years.
There is considerable demand for onsite pharmacies from major hospitals. They also fit the
government’s vision for patient-focused dispensing pharmacies, allowing us to leverage the
AIN Group’s strengths. And they could generate solid profits if the onsite pharmacy business
gains momentum. Given those factors, we aim to respond appropriately to developments in
onsite pharmacies as the leading company in the sector. We plan to open more than 10 onsite
pharmacies each year, mainly in the Tokyo area and at large regional hospitals. We raised capital
through a share issue in August 2017. The funds will mainly be used to facilitate the opening of
dispensing pharmacies on hospital sites. In other words, to invest in growth.
We will also use the funds to improve efficiency in pharmacy operations, such as investing
in automation, in order to boost profitability at existing pharmacies and across our dispensing
pharmacy network as a whole.
Dispensing pharmacy business growth strategy Continue to use strategic M&A deals
Some investors have asked us whether we are slowing down our M&A activity. As a company that
has aggressively expanded its business using M&A, many investors appear to see the number of
M&A deals as a proxy for the AIN Group’s growth.
In fiscal 2018, we acquired 11 dispensing pharmacies through M&A deals. That represents
a significant decline from numbers in recent years, but it reflects careful due diligence of each
potential deal based on more rigorous criteria than before. » See pages 10-11 for more details M&A deals are vital to driving growth in our business and we will continue to use them strategically, provided
they offer real value for money.
Dispensing pharmacy business growth strategy Leverage all the Group’s resources to secure the necessary personnel
One of the reasons we are now the leader in the dispensing pharmacy sector is our continuous
emphasis on recruiting the best dispensing pharmacists. That has been our focus since the first
days of the Company.
In April 2018, we hired 279 new pharmacists, which fell short of our target. That disappointing
result prompted us to strengthen our recruitment systems. » See pages 14-15 for more details Specifically, we are stepping up efforts across the Group, such as giving a greater role in
recruitment to personnel responsible for pharmacy operations, including area managers and
pharmacy managers. We aim to hire at least 400 pharmacists in fiscal 2019. Going forward, we
will devote even more energy to hiring and training pharmacists in order to increase corporate
value and drive sustained growth.
Cosmetic and drug store business growth strategyStand out in the market and strengthen the brand
Our cosmetic and drug store business is performing well, with profits at existing ainz & tulpe
stores growing at an average rate of 20%. Profits are up by around 50% at new format stores
that were opened from 2015 as part of our push into the Tokyo metropolitan market, such as ainz
& tulpe SHINJUKU HIGASHIGUCHI.
Fiscal 2017 (¥ million)
AIN HOLDINGS
Average of 3 competitors
Market capitalization 252,075 64,212
Cash on hand in banks 29,775 15,401
Interest-bearing debt 27,402 46,819
Net cash 2,371 (31,418)
Shareholders’ equity ratio 38.4% 28.1%
Fiscal 2018 (¥ million)
AIN HOLDINGS
Average of 3 competitors
Market capitalization 282,859 59,386
Cash on hand in banks 63,779 20,940
Interest-bearing debt 19,303 42,335
Net cash 45,551 (20,723)
Shareholders’ equity ratio 52.7% 31.3%
Notes:1. Market capitalization data are as of July 31, 2017 and July 31, 2018.2. Interest-bearing debt = Short- and long-term debts + Corporate bonds (excluding Lease obligations)3. Net cash = Cash on hand and in banks – Interest-bearing debt4. 3 competitors: NIHON CHOUZAI Co., Ltd., SOGO MEDICAL CO., LTD., Qol Co., Ltd.Source: Compiled by AIN HOLDINGS from the above companies’ financial results for fiscal 2017 and fiscal 2018.
Dispensing pharmacy business Cosmetic and drug store business
Top-line growthSupport government’s
vision for patient-focused dispensing pharmacies
Grow the ainz & tulpe chain
Recruit and train personnel
Top-line growth
Dispensing pharmacy business Cosmetic and drug store business
Support government’s vision for patient-focused
pharmaciesGrow the ainz & tulpe chain
Recruit and train personnel
AIN Group’s growth strategy Sound financial structure —Comparison of financial indexes among major companies operating dispensing pharmacies in Japan

6 AIN HOLDINGS ANNUAL REPORT 2018 AIN HOLDINGS ANNUAL REPORT 2018 7
One factor behind that growth is our success in attracting more customer traffic. We are
starting to see concrete results from our decision to select prime locations for all ainz & tulpe
stores, and from efforts to increase brand visibility. Also, in the previous fiscal year, new store
opening costs weighed heavily on profits, but that negative factor dropped out in the fiscal year
under review. We also worked to optimize purchasing costs. Overall, we reduced costs in the
cosmetic and drug store business by several hundred million yen.
Over the last few years, we have exited suburban drug store locations and focused on
establishing new ainz & tulpe formats. Our store opening program will continue to target the fast-
growing Tokyo metropolitan market.
Our new retail formats are aimed at young women as part of a strategy to stand apart from
conventional drug stores and department stores. We want to create fun and interesting stores
with a wide choice of cosmetics and original brand products that encourage women to stay and
browse for a couple of hours.
One area we want to improve is the ratio of original brands, which currently accounts for about
10% of products in our stores. We also plan to expand the business by accelerating the pace of
store openings. Our goal is to increase sales from the current ¥25 billion to ¥50 billion as soon
as possible, while also achieving a profit margin of 7%. The cosmetic and drug store business
achieved a profit margin of 2.7% in fiscal 2018, which followed losses of ¥866 million in fiscal
2017. For fiscal 2019, our goal is to grow the business to generate segment operating income of
¥1 billion.
Actively implementing ESG initiatives Fulfilling our corporate social responsibility
AIN HOLDINGS takes a proactive stance on environmental, social and governance (ESG) issues.
We have reinforced corporate governance in various ways, such as appointing outside directors,
overhauling the Board of Directors and its decision-making processes, promoting women to
senior positions, and actively disclosing information. We also launched a pharmacy-led project in
2012 in which frontline pharmacists are taking the initiative in improving operational efficiency at
more than 1,000 pharmacies. The head office plays a supporting role in the bottom-up project,
which is yielding results in various areas. From a social perspective, moves by the dispensing
pharmacy business to improve its capabilities will help strengthen and enhance local healthcare
provision and address challenges associated with Japan’s aging society. Another area we are
focusing on is empowering women, who make up a large proportion of our employees. We are
putting in place maternity and childcare leave systems that make it easier for them to return to
work and increasing the ratio of women in management positions. We are also actively creating
better workplace environments that motivate all our employees. Our long-term contribution to
society can also be seen in our support for joint research and course endowments at universities
and research institutions and through sponsorships for sports teams, events and organizations.
Meanwhile, the cosmetic and drug store business is constantly working to improve its stores,
products and services to help people lead healthier and fuller lives.
Going forward, we plan to step up our ESG activities with the help of experts in the field.
Basic policy on shareholder returnsInvesting in growth and paying stable dividends
The AIN Group’s growth potential is attractive for investors. We plan to
continue investing in growth to increase corporate value and meet the
expectations of all shareholders and investors.
For the fiscal year ended April 30, 2018, we paid a full-year dividend
of ¥50 per share. For the next fiscal year, we plan to increase the
dividend to ¥55.
We will continue to pay stable dividends in line with earnings, while
also aiming to maintain a dividend payout ratio at least 20%.
Navigating turbulent times Aiming to live up to our name as Japan’s leading dispensing pharmacy group
Starting Fiscal 2018, we chose Audrey Hepburn as the person to represent our brand. Even 25 years
after she passed away, Audrey Hepburn remains hugely popular among many generations due
to her performance in many famous movies, which showed her maturing from a young woman
into a confident adult. She remained beautiful and elegant into her later years, while also working
tirelessly to help the disadvantaged through her UNICEF humanitarian activities. Those characteristics
encapsulate our vision for the ainz & tulpe brand in our cosmetic and drug store business and our
dispensing pharmacy business, which plays a vital role in healthcare provision in Japan.
As already outlined above, Japan’s dispensing pharmacy sector stands at a major turning point.
However, as the leading player in the sector, we believe our competitive advantages will remain
intact. Despite our leading position, the AIN Group’s market share currently stands at 3%, so there
is still substantial room for us to grow. And while brand visibility and profits are improving steadily in
the cosmetic and drug store business, our next challenge is to grow the business into a second key
source of earnings.
Leveraging the AIN Group’s unique strengths, we will work to meet the needs of patients and
create attractive retail environments that exceed the expectations of customers.
We remain convinced that those strengths can only come from maximizing the potential of our
employees and strategically harnessing their capabilities.
We want to live up to our name as the leading dispensing pharmacy and cosmetics and drug
store group in Japan – for customers, employees and all our other stakeholders – and everyone
in the AIN Group will work together to realize that goal. I hope we can count on your continued
support and trust for many years ahead.
Message from the President
July 31, 2018
Kiichi OtaniPresident and Representative Director
8 AIN HOLDINGS ANNUAL REPORT 2018 AIN HOLDINGS ANNUAL REPORT 2018 9
Dispensing pharmacy company market share
(Fiscal 2018)
Top 50 major companies29.3%
Top 5 major companies*11.5%
Others70.7%
*Top 5 major companies: AIN HOLDINGS INC., NIHON CHOUZAI Co., Ltd., KRAFT Inc., Qol Co., Ltd., WELCIA HOLDINGS CO., LTD.
Source: AIN HOLDINGS estimates, based on data from DRUG Magazine (July 1, 2018) and FY2016 dispensing fee statistics released by the Ministry of Health, Labour and Welfare.
The dispensing pharmacy business is our core business, generating roughly 90% of sales. Based on scale, the quality of our pharmacies, earnings and other measures, we are the leader in Japan’s dispensing pharmacy market. The market is one of only a few in Japan with prospects for growth over the medium to long term. However, the dispensing pharmacy business faces various risks, such as pressure from government policy requiring pharmacies to play a greater role in healthcare, revisions to dispensing fees and a shortage of qualified pharmacists. Those factors mean the sector is heading for a major turning point – a period of full-blown restructuring. In this section, we look at the characteristics of Japan’s dispensing pharmacy market and the key points of our business strategy.
Japan’s dispensing pharmacy market has developed in unique ways, driven by factors such as the government’s efforts to promote non-hospital dispensing services under a policy launched in 1994. The government is aiming to curb national healthcare costs, but per capita spending continues to rise due to Japan’s aging society, increasingly advanced medical treatments and the launch of new drugs. The dispensing pharmacy market in Japan was worth roughly ¥8 trillion as of March 31, 2017, but we estimate the market is on track to reach ¥10 trillion.
A growth market
Source: AIN HOLDINGS estimates, based on data from the Japan Pharmaceutical Association, dispensing cost trends issued by the Ministry of Health, Labour and Welfare, Population Estimates of the Ministry of Internal Affairs and Communications Statistical Bureau, and Cabinet Office White Paper on the Aging Society.
Market growth
1989 1990 1995 20072000 20172010 2025 (April to March year)
0
20
40
60
80
(%)
0
2
4
6
8
10
12
(¥ trillion)
2007-2016: annualized growth
of 4.2%
2017 onwards: annualized growth
of 3.0–5.0%
27.7%
72.8%
7.5
21.5%
5.1
30.3%
80.0%
11.0%11.5%
0.47
Dispensing pharmacy market value Non-hospital dispensing ratio Ratio of elderly people
57.2%
Japan’s d ispens ing pharmacy sector i s fragmented, with the top five companies accounting for only 11.5% of the market, including the Group’s leading share of about 3%. Approximately 30% of pharmacies in Japan are run by individuals. As the shortage of pharmacists becomes more acute and small operators struggle to keep up with regulatory changes, we expect the pace of M&A activity and business closures to accelerate in the sector. Those broader trends, along with recent changes to rules that allow onsite dispensing pharmacies, mean there is still significant room for growth in the market for the AIN Group.
A fragmented market
Japan has three main types of dispensing pharmacy: pharmacies located near hospitals, pharmacies not located near hospitals, and drug stores with dispensing pharmacy functions. People are free to choose any type of dispensing pharmacy to fill their prescription, regardless of their health insurance provider. However, dispensing pharmacies located near hospitals are the most common in
Japanese cities, as limited car use means they are more convenient for patients. Many pharmacies near hospitals also satisfy the government’s conditions for primary care dispensing pharmacies. Onsite pharmacies which were permitted from October 2016 are also included in this category.
1989 1990 1995 20052000 20152010 2020 (April to March year)
0
20
40
60
80
(%)
0
2
4
6
8
10
12
(¥ trillion)
2005-2014: annualized growth of 5.1%
13 onwards: annualized growth of 3.0–5.0%
25.9%
70.0%
7.2
20.2%
4.629.1%
80.0%
11.0%11.5%
0.47
Dispensing pharmacy market value Non-hospital dispensing ratio Ratio of elderly people
Government policies Management capabilities
Drug price revisions • Case by case ............................
Drug procurement • Low cost, high volume ................ • High cost, low volume ................
Scale (number of prescriptions and pharmacies) • Increase ...................................... • Decrease .....................................
Dispensing fee revisions (criteria for additional reimbursement points) • Looser ........................................ • Tighter ........................................
Hiring and training pharmacists • Higher quality (secure premiums) . • Lower quality ..............................
Inventory management • Optimized inventories .................. • Excess inventories .......................
Productivity at pharmacies • Improvement: lower personnel costs ................. • Deterioration: higher personnel costs ................
Head of�ce costs • Consolidation and streamlining.... • Uncontrolled increase ..................
Purchasing cost of drugs
Drug price margin Store operation costs + Store labor costs
Operating income
SG&A expenses
Total store sales*1
Dispensing pharmacy earning model
Gro
ss p
ro�t
Pharmaceutical management fees
Technical fees(includes premiums for generic drug dispensing) Increase earnings Decrease earnings
Sale
s fr
om d
rugs
Dis
pens
ing
fees
*2
*1: Dispensing pharmacies receive 0-30% of medical expenses depending on the type of insurance of customers. Dispensing pharmacies then charge the remainder of medical expenses to health insurance bodies such as national health insurance.*2: Dispensing fees comprise pharmaceutical management fees and technical fees for pharmacists.
These fees are added depending on the services at pharmacies.
80
60
20
-40
0
40
-20
(%)
15-1Q 2Q
3Q
4Q
16-1Q 2Q
3Q
4Q
17-1Q 2Q
3Q
4Q
18-1Q 2Q
3Q
4Q
Fiscal year after revision
Fiscal year with revision
Fiscal year after revision
Fiscal year with revision
In principle, the government revises drug prices and dispensing fees once every two years. After revisions in April 2018, the next round is scheduled for April 2020, but we expect the government to announce additional revisions before then to adjust for a planned increase in consumption tax in October 2019. Profits tend to drop sharply at dispensing pharmacies in years when revisions are carried out. However, in response, we implement measures to improve pharmacy efficiency and enhance the skills of our pharmacists, supporting an early recovery in profits and a strong rebound in earnings in the year after drug price and dispensing fee revisions.
Dispensing fee revisions once every two years
Note: Graph shows year-on-year change in the consolidated operating income of AIN HOLDINGS from fiscal 2015 to fiscal 2018.
Impact of drug price and dispensing fee revisions on profits
Factors that affect dispensing pharmacy profitability
Dispensing pharmacies are being asked to play a radically different role in healthcare provision to address Japan’s super-aging society and rising healthcare expenses. Pharmacies now need to provide higher quality services, such as the management of left over
medicines, cooperation with healthcare providers and support for patient health management. The government is revising dispensing fees in a way that only pharmacies capable of providing these services will be able to generate profits.
Dispensing pharmacy earnings model
Pharmacies located near hospitals are the most common format
Growth Strategy: Dispensing Pharmacy Business
Operating environment
A major turning point in the market
Market structure —Breakdown by company size
Support government’s vision for patient-focused
dispensing pharmaciesRecruit and train personnelTop-line growth
» See pages 12-13 » See pages 14-15
Increase ef�ciency + Improve workplace environment(Pharmacy-led project)
M&A Pharmacyopenings
Focus on pharmacies near or on hospital premises » See pages 10-11
» See pages 14-15
Support government’s vision for patient-focused
pharmaciesRecruit and train personnelTop-line growth
» See pages 12-13 » See pages 14-15
Increase ef�ciency + improve workplace environment(Pharmacy-led project)M&A Pharmacy
openings
Focus on pharmacies near or on hospital premises
» See pages 10-11.
» See pages 14-15
Dispensing pharmacy business growth strategy of the AIN Group
9.8%50-499 pharmacies18.2%10-49 pharmacies
6.4%500 or more pharmacies
63.8%9 or fewer pharmacies
Small and medium size pharmacies account for more than 60% of the market
Notes:1. The above figure dose not include1.7% of no response.
2. AIN HOLDINGS estimates based on data from a random survey conducted by the Ministry of Health, Labour and Welfare in August 2016 (1,000 dispensing pharmacies surveyed, 46.7% response rate).
Source: Report on Creating Dispensing Pharmacies for Patients, Ministry of Health, Labour and Welfare, March 31, 2017

10 AIN HOLDINGS ANNUAL REPORT 2018 AIN HOLDINGS ANNUAL REPORT 2018 11
Changes to AIN Group’s M&A criteria
M&A criteria(Before)
M&A criteria(From FY4/18)
Pharmacy size Annual sales of ¥120 million or higher
Single pharmacy: Annual sales of at least ¥200 millionPharmacy chains: Annual sales of at least ¥120 million
EV/EBITDA multiple
5-7 times 5-7 times
Contribution to consolidated earnings
Fiscal year following deal
Fiscal year following deal
Potential risks None Onsite pharmaciesCompliance issues
Top-line growth
Growth Strategy: Dispensing Pharmacy Business
Achieving growth in the dispensing pharmacy business largely depends on responding appropriately to changes in government policy. Key to success is securing prime locations for new pharmacies and recruiting and training
pharmacists. » See pages 13-14 for more details Until now, our strategy has been to channel management resources into dispensing pharmacies located near hospitals and grow our business by opening new pharmacies and using M&A. That approach reflected the realities of Japan’s social environment and systems, which made dispensing pharmacies located near hospitals the best option for
patients and our business. » See page 9 for more details For example, pharmacies located on prime sites near hospitals are much more profitable than those in other locations. In October 2016, the regulation was changed to allow dispensing pharmacies to open on hospital sites. In other words, the dispensing pharmacy sector now has the opportunity to use an even closer prime location. New onsite dispensing pharmacies are likely to lead to a dramatic drop in the number or prescriptions filled by existing pharmacies located near hospitals, potentially undermining profitability. However, the risk to our business from onsite pharmacies is limited, because as a relatively late entrant to the market, our network includes only a handful of dispensing pharmacies located near major hospitals, which are leading the push for onsite pharmacies. The deregulation of onsite drug dispensing is major opportunity for the AIN Group. Onsite pharmacies are beneficial for all parties. Hospitals receive rental income from the pharmacy operator, and the closer links between the hospital and pharmacy reduce the risk of dispensing errors and other issues, as well as improve cooperation in areas such as home healthcare provision. Onsite pharmacies will give companies like AIN HOLDINGS
the chance to leverage their competitive advantages, such as highly skilled pharmacists, and also lead to higher prescription volumes and additional reimbursement points. However, companies that want to open onsite pharmacies will have to show hospitals they can keep pharmacies open 24 hours and secure sufficient numbers of well-trained pharmacists. Hospitals will also look at their ability to sustain operations over the long-term, backed by access to funds and a sound financial position. Only a handful of companies in the sector will be able to meet those requirements. We believe AIN HOLDINGS is one of those companies, and we plan to open 10 onsite pharmacies each year. Japanese dispensing pharmacies have a different role and earnings structure to their counterparts in the US and other countries due to contrasting social welfare systems and business conditions. Japan has a system of universal healthcare. The system does not restrict treatment to certain hospitals or pharmacies based on the type of insurance held by patients or other criteria, allowing them to choose when and where they want their illness or injury to be treated. Also, because prescription refills are not permitted in Japan, the elderly and patients with serious conditions have to make regular and frequent visits to hospital. That means onsite pharmacies fit the government’s vision for patient-focused dispensing pharmacies in terms of both convenience and their capacity to provide high-quality, reliable services. Amid strong demand from hospitals, we have already started developing our strategy, which will be geared towards opening new pharmacies in onsite locations. M&A deals are a vital part of our growth strategy. Together with our pharmacy opening program, we will continue to use M&A to increase sales based on rigorous due diligence and an emphasis on investment efficiency.
EV/EBITDA multiplesNew store openingsPharmacies acquired through M&A deals
250
200
100
150
50
0
6.0
3.0
2.0
1.0
4.0
5.0
0
(times)
Num
ber o
f pha
rmac
ies EV/EBITDA m
ultiples
13/4 14/4 15/4 16/4 17/4 18/4
2511
3.96
5.50
Changing our pharmacy opening strategy
For hospitals For AIN HOLDINGS
Rental income Convenient and cost-competitive pharmacies
Reduces dispensing errors, other risks
Opportunity to leverage quality of pharmacists, other competitive advantages
Closer cooperation in home healthcare and provision of other local health services
Higher volume of prescriptions, additional reimbursement points
Japan US
Medical insurance (patient cost)
Universal healthcare (10-30%)
Private health insurance (depends on contract terms)
Freedom to select hospitals / pharmacies
No restrictions
Affiliated service providers
Non-hospital dispensing ratio
70% 100%
Drug prescriptions Refills × Mail order ×
Refills Mail order
Drug prices Set by the government (Usually revised once every two years)
Market price
Dispensing pharmacies now permitted on hospital sites
Merits of onsite dispensing pharmacies
AIN Group’s new store openings, pharmacies acquired through M&A deals and EV/EBITDA multiples
Differences between Japan and the US
Barriers removed to improve convenience for patientsPharmacies now permitted to be located on the same premises as hospitals
The following cases are still not permitted:
Located inside the same building
Connected by a private road or passage
Dispensing pharmacies separated from hospitals by fences or other barriers to prevent direct entry from hospitals
Public road
Entry/exit
Pharmacy
Hospital
Entry/exit
Public road
Entry/exit
Pharmacy
HospitalHospitalpremises
Entry/exit
Public road
Entry/exit
Pharmacy
Hospital
Entry/exit
Before
After
Public road
Entry/exit
Pharm
acy
Ho
spital
Entry/exit
AIN Pharmacy SHINDAIMAE
AIN Pharmacy ASAHIKAWAIDAI(Scheduled to open in October 2018)
AIN Pharmacy ENGARU

12 AIN HOLDINGS ANNUAL REPORT 2018 AIN HOLDINGS ANNUAL REPORT 2018 13
Supporting the government’s vision for patient-focused dispensing pharmacies
Growth Strategy: Dispensing Pharmacy Business
We understand that our dispensing pharmacies play an important role in society. That is why we have implemented a range of measures over the years to raise the standards of our dispensing pharmacies and improve the skills of our pharmacists. The government is currently promoting its vision for patient-focused dispensing pharmacies. As part of that approach, the government is stepping up its support for primary care dispensing pharmacies that can help deliver local healthcare services, such as adjusting the way additional reimbursement points are calculated for dispensing fees. To fulfill that primary care role, dispensing pharmacies have to offer higher quality services, such as promoting generic drugs, managing left over medicines, managing patient health, cooperating with local healthcare providers, providing 24-hour dispensing services and supporting home-based healthcare, in addition to their traditional role
of drug dispensing. » See page 13 for more details In order to deliver those services, our pharmacists need to improve their specialist skills and communicate more closely with patients and medical institutions. Primary care dispensing pharmacies offer an excellent opportunity for the AIN Group to leverage its competitive advantages gained from rais ing the qual ity of its pharmacists and dispensing pharmacies – an area where we have led the industry. Those efforts to create primary care dispensing pharmacies will also help us meet the rigorous criteria for opening onsite dispensing pharmacies. Consequently, we will actively work to convert all our dispensing pharmacies to the primary care format. In addition to internal training programs, our unique pharmacy-led project launched in 2012 is helping to lift standards. The project was launched to improve the
efficiency of dispensing pharmacy operations based on input from pharmacists at each location. As the project has been rolled out across the Group, we have seen efficiency gains and an increase in the time pharmacists have to communicate with patients and medical institutions, as well as improvements in the way pharmacists think and act in frontline situations. We are also seeing steady growth in home-based dispensing and generic drug dispensing. Growth in generic drug dispensing typically leads to a decline in sales in value terms, putting pressure on pharmacy profits. However, we established a generic drug wholesaling subsidiary called WHOLESALE STARS Co., Ltd. (WSS) in 2006, the year the government started actively promoting wider use of generic drugs. Through WSS, we negotiate prices and procure products directly with manufacturers. We already purchase more generic drugs than any other company in Japan and we have narrowed down our suppliers to just a few firms, further strengthening our buying power. WSS is one of our competitive advantages, because the subsidiary supports the Group’s profits while also helping the government achieve its policy goals.
Guidance for drug usage
(criteria for primary care dispensing pharmacies)
Integrated management of drug usage and other treatments
Pre-avoid activities
Management of leftover medicines
24-hour support
Support for home-based healthcareand nursing care
Promote generic drugs
Dispensing drugs
From now onIn the past
Focused on dispensing drug
Trends in Dispensing Fees
Conventionaldispensing services
receive lessreimbursement points
Primary care services receive
more reimbursement points
Guidance for drug usage
Dispensing drugs
Raising pharmacy standards further
The changing role of dispensing pharmacies
AIN Group’s initiatives for patient-oriented dispensing pharmacies
Total no. of patient consent formsNo. of primary care cases that resulted in additional reimbursement points
160
80
120
40
200
100
150
50
0 0
(thousands of cases)
(thousands of cases)
No. o
f prim
ary c
are c
ases
that
resu
lted
in add
itiona
l reim
burse
ment
point
s Total no. of consent forms
May 16 Oct.16 Apr.17 Oct.17 Mar.18
94
171
313
Data source: 1,018 dispensing pharmacies, excluding recently acquired pharmacies through M&A
Ratio of pharmacies providing home-based dispensingNo. of home-based dispensing cases
20,000
10,000
15,000
5,000
100
40
60
80
20
0 0
(No. of cases) (%)
No.
of h
ome-
base
d di
spen
sing
case
s Ratio of pharmacies providing
home-based dispensing
Apr.14 Oct.14 Apr.15 Oct.15 Apr.16 Oct.16 Apr.17 Oct.17 Apr.18
14,764
86.8
8,952
93.3
3,690
31.0
Data source: 1,018 pharmacies, excluding recently acquired pharmacies through M&A and cases involving delivery of medicines only
Average generic drug reimbursement pointsShare of total prescriptions
80
40
60
20
25
10
15
20
5
0 0
(%) (points)
Shar
e of
tota
l pre
scrip
tions Average generic drug
reimbursem
ent points
Apr.10
Mar.12
Apr.11
Apr.12
Apr.13
Apr.14
Apr.14
Apr.15
Apr.16
Mar.16
Apr.17
Mar.18
77.4
18.9
23.7
6.4
Data source: Four main Group companies (AIN PHARMACIEZ, AIN MEDIO, DAICHIKU, Asahi Pharmacy)
Number of prescription checks that resulted in additional reimbursement points
30,000
10,000
20,000
25,000
15,000
5,000
0
(No. of cases)
Apr.16 Oct.16Jul.16 Jan.17 Apr.17 Jul.17 Oct.117 Jan.18 Mar.18
25,656
11,176
Data source: All pharmacies (number of pharmacies �uctuates each year due to pharmacy openings and closures)
Provision of primary care services (monthly cases)
Home-based dispensing (monthly cases) Generic drug dispensing (monthly cases)
Prescription checks (monthly cases)
Maintains genericdrug pricemargins
Negotiates withand buys directly
from genericdrug makers
Selects preferred
generic drugs
Monitors andmanages total
generic drug usage across the Group
Genericdrug
makers
AINGroup
dispensing pharmacies
WSSLinks with Group’s dispensing pharmacies Generic drug procurement
Roles and merits of WSS

14 AIN HOLDINGS ANNUAL REPORT 2018 AIN HOLDINGS ANNUAL REPORT 2018 15
Recruit and train personnel
Our pharmacy-led project to improve efficiency and services is also enhancing the skills of our employees Pharmacists are being asked to play a greater role in healthcare in Japan’s super-aging society. Specifically, pharmacists need to acquire specialist knowledge to handle and manage anticancer drugs and strong medicines used to treat pain. They also need to know how to run pharmacies that are sustainable and highly convenient for patients. AIN HOLDINGS has been preparing for this operating environment for some time. In 2012, we launched a pharmacy-led project to radically overhaul dispensing pharmacy operations. We asked our pharmacy staff to explore ways of improving efficiency and providing the best-possible services to patients by identifying, acting on and then revisiting the most
important aspects of pharmacy operations, while also ensuring compliance with all laws and regulations. Efficiency gains in operations naturally feed through to improvements in profitability, but the “Think, Act and Think Again” cycle is also accelerating the personal growth and development of our dispensing pharmacy staff, translating into improvements that go beyond what we could achieve by simply following operational manuals. Deregulation in the dispensing pharmacy sector, which started with pharmacies located in the same premises as hospitals, means each one of our pharmacists needs to think more carefully about overall pharmacy operations as part of their job. Through their interaction with patients, our pharmacists have to decide themselves the best course of action to take for patients. That approach also leads to greater efficiency in pharmacy operations. These are fundamental aspects of a pharmacist’s job, but personnel who can help improve pharmacy operations are highly valued in the AIN Group. Through our pharmacy-led project, we are working to raise the quality of dispensing pharmacist activities and provide services to patients nationwide as a key part of Japan’s healthcare infrastructure.
Growth Strategy: Dispensing Pharmacy Business
Key outcomes from pharmacy-led project
Number of new pharmacist graduates hired Improvements to recruitment system
A Message from the Managing Director
Miya Oishi Managing Director and Senior General Manager, Operations Department
Increasing headcount and improving pharmacist skills
To fulfill the new role envisioned for dispensing pharmacies and to generate sustained growth, companies in the sector need to recruit more pharmacists and improve the skills of existing staff. Dispensing pharmacies and companies that fail to do that are likely to fall by the wayside. Since it was established, the AIN Group has consistently focused on hiring and training pharmacists. Our approach to recruitment is highly regarded by students and universities, thanks to our hiring track record and high-quality training systems. We also give pharmacists plenty of opportunities to fully demonstrate their skills due to the large number of complex prescriptions at our pharmacies. That reputation has helped us perform well in pharmacist recruitment. However, we need to increase headcount further to support our move into onsite dispensing pharmacies, which will require large teams of highly skilled pharmacists. Competition for pharmacists is also likely to become tougher in the sector. To address those challenges, we started reinforcing our recruitment systems in April 2017 as a top management priority. We have transferred responsibility for recruitment activities from the personnel division to the operations division, aiming to use input from our pharmacies and leverage frontline capabilities in recruitment. Our aim is to use a broad company-wide approach, supported by
improvements to our recruiter system and final interviews for candidates with area managers. After joining the AIN Group, our pharmacists have access to a range of training programs tailored to their career stage. We also run a number of unique initiatives to improve the motivation and skills of our pharmacists. One initiative is our pharmacy-led project, launched in autumn 2012. Under this project, pharmacists at all our dispensing pharmacies are asked to identify new ways of increasing efficiency, improving profitability and enhancing service provision at existing pharmacies. Originally designed to strengthen pharmacy operations, the project has delivered real improvements in frontline capabilities, such as optimization of in inventory value and patient wait times. But the project has also clarified other issues that need to be addressed and has delivered clear results, helping to change thinking among frontline personnel and boost motivation, leading to a lower level of staff turnover. The dispensing pharmacy sector faces a wave of restructuring as business conditions become tougher, but we view sector realignment as an excellent opportunity to drive top-line growth. We aim to meet society’s expectations and create new value by continuing to expand our dispensing pharmacy business while increasing the number and quality of our pharmacists.
700
600
200
400
500
300
100
0
12
6
4
2
8
10
0
(%)
14/4 15/4 16/4 17/4 19/4(plan)
18/4
400-450
210
279
152
10.0
Company's share of new pharmacists that joined dispensing pharmacies after graduation
New hires for cosmetic and drug store business and for general positionsPharmacists
(persons) 11.7
8.08.0
After (Present)Recruitment
activities closer to business frontline
Lead group
Approachesused toconnect with pharmacystudents
• Contact via recruiters, promoters, follow-up work by frontline pharmacists• Recruiters act as mentors
OperationsDivision
BeforeRecruitment
program run byhead of�ce
• Contact via recruitment of�cers
PersonnelDivision
Higher quality pharmacies and pharmacists
Responsive todispensing
fee revisions
• Changing thinking• More motivated• Lower staff turnover
Issues clari�ed
• Ef�cient store operations• Improved pro�tability
Inventoryoptimization
Pharmacy-led project
Notes:1. Inventory value is as of the end
of April each year. 2. Inventory value shown left is
largely unrelated to the value of inventories (products) shown on the balance sheet, as the balance sheet includes inventories from Group companies with different �scal year-ends.
3. Estimated inventory value is a pro rata calculation using inventory value and the number of pharmacies as of end-April 2013.
4. Number of pharmacies and inventory value as of end-April 2013 is for four main Group companies: AIN PHARMACIEZ, AIN MEDIO, DAICHIKU and Asahi Chozai. Number of pharmacies and inventory value as of end-April 2018 is for all companies in the AIN Group.
Inventory optimization
Actual total inventory valueEstimated inventory valueSales of dispensing pharmacy businessNumber of pharmacies at the end of month
13/4 18/4
8,356 7,986 (-4.4%)
15,828 (+89.4%)
Optimized inventory value
238,645(+73.8%)
137,291
539
1,021(+89.4%)

16 AIN HOLDINGS ANNUAL REPORT 2018 AIN HOLDINGS ANNUAL REPORT 2018 17
Standing out in the market
Our efforts to establish new retail formats are starting to bear fruit. The AIN Group has operated a drug store business since it was established, but a narrowing quality gap in retailing put pressure on margins. In response, in the last few years, we have exited suburban locations and rapidly switched to new retail formats. Today, our cosmetic and drug store business is focused on opening stores in highly convenient locations in the Tokyo metropolitan area under the ainz & tulpe brand. Our first real move into new retail formats came in the fiscal year ended April 2016, when we opened two flagship ainz & tulpe stores: ainz & tulpe SHINJUKU HIGASHIGUCHI (Shinjuku, Tokyo; retail space: roughly 1,290m2) and ainz & tulpe Le Trois (Sapporo, Hokkaido; retail space: roughly 990m2). Both are large stores in prime urban locations, helping them attract considerable attention from shoppers. The main target of our new retail formats are women in their 20s and 30s with a strong interest and curiosity in the latest trends. We are also using the product lineup to create a unique position in the market for the ainz & tulpe brand, with cosmetics, accessories and other beauty products accounting for more than 80% of products on sale. The idea is to avoid direct competition with conventional drug stores, which typically sell a mix of pharmaceuticals, food and daily necessities at discounted prices. Our new retail formats also differ to traditional department stores.
To encourage women to spend a few hours browsing our stores, we are expanding our range of lounge wear and accessories to complement the existing cosmetics lineup. By creating merchandise lineups and in-store displays to attract young women, we are setting ainz & tulpe apart from conventional drug stores. That gives our retail formats better access to tenant opportunities in fashion retail malls and department stores. Developing original brands is also part of our effort to stand out in the market. To coincide with the roll out of the new retail formats, we launched two original brands, a cosmetics brand called LIPS and HIPS and a beauty supply brand called cocodecica. We also acquired the popular AYURA cosmetics brand acquired from Shiseido Company, Limited. We are expanding the range of products under each brand, helping to lift the gross margin. We have also opened standalone LIPS and HIPS stores. Going forward, we plan to further increase the ratio of products sold under original brands to create unique merchandise lineups and achieve high profit margins. We also aim to tap into the expertise and experience of the many pharmacists in the AIN Group to develop highly functional products, helping to increase the number of product categories in our original brands. We will also create flagship products with dominant brand positions.
Growth Strategy: Cosmetic and Drug Store Business
ainz & tulpe SHINJUKU HIGASHIGUCHI
2.2%4.2%
Beauty products
ainz & tulpe *1 General drug stores *2
82.0%
11.6% 15.1%
30.3%
27.6%
27.0%
Drugs and sanitary productsFoods and health foods Daily necessities
*1 Data is for the fiscal year ended April 2018*2 Source: Monthly Report on the Current Survey of Commerce (May 2018),
Ministry of Economy, Trade and Industry
Creating a more distinct position in the market
ainz & tulpe Drug stores Department stores
Customer base
Young women Families, overseas visitors
High-income earners, including overseas visitors
Merchandise Beauty products account for 80% of lineup
Daily necessities and food account for more than 80% of lineup
Brand products only
Pricing Normal Discount Premium
Sales areas • Customers can personally try various beauty products in store
• Designed to encourage browsing for more than 1 hour
• Small retail areas, cluttered displays
• Brands sold through own boutique store, reducing convenience for shoppers
Urban ainz & tulpe stores
FY2005 FY2018
39.2%89.6%
Suburban drug stores
Comparison of ainz & tulpe and general drug stores: product mix
Product mix change of ainz & tulpe
Differences between ainz & tulpe and rival retail formats
AIN Group’s cosmetic and drug stores by type
LIPS and HIPS
ainz & tulpe Odakyu Department Store Machida
AYURA
100
60
80
40
20
0
(%)
02/4
44.6%
82.0%
18/4
Cosmetic and drug store business results of the AIN Group Sales Gross pro�t Sales ratio
5,8291,487
25.5%
24,1178,925
37.0%
Beauty products
Drugs and sanitary products
Foods and health foods
Daily necessities
(¥ million)

18 AIN HOLDINGS ANNUAL REPORT 2018 AIN HOLDINGS ANNUAL REPORT 2018 19
Brands
Gross marginNet sales
16,000
8,000
12,000
4,000
40.0
34.0
36.0
38.0
0 0
(¥ million) (%)
15/4 16/4 17/4 18/4
No. of stores 11 14 22 26
Net
sal
es
Gross m
argin
Brand power: Stores opened in the Tokyo metropolitan area
Expanding our chain of unique specialty stores with a broad range of cosmetics for a fast-changing marketSales promotion strategies in Japan’s cosmetics market have changed, with brands moving away from saturation advertising campaigns using TV commercials and other mainstream media to highly targeted promotions via social media. That has opened up the market to a raft of new products from less well-known manufacturers, and many of those products are gaining popularity among young women. In response, we are rapidly adjusting our in-store displays by closely watching the latest trends and introducing products from emerging manufacturers. Thanks to that merchandising
approach, ainz & tulpe is now recognized as a chain of specialty cosmetics stores that always stocks the latest trend-setting products. As that reputation has become more widespread, we have been able to attract more customers, as well as improve our negotiating position with manufacturers in product purchasing. That in turn has supported higher sales of original brands – a key factor behind the move into profit in the cosmetic and drug store business. We aim to expand the business further by opening new stores based on this retail concept, focusing on major cities. We are targeting sales of ¥50 billion, a gross margin of 42.0% and an operating margin of 7.0% in the fiscal year ending April 30, 2022. However, we are unlikely to achieve those goals with the current number of stores, SKUs and original brands. We will continue to open new stores, but to achieve our goals we also need to raise our game in other areas, such as pushing forward the development of private merchandise brands and working with national brands on product tie-ups.
Growth Strategy: Cosmetic and Drug Store Business
Kaori Ishikawa Executive Officer,Division Manager of Cosmetic and Drug Store Operations
A Message from the Executive Officer
Awareness of the ainz & tulpe brand has been growing steadily since 2015, thanks to large stores opened in prime locations across Tokyo, such as Shinjuku and Ginza. We are also opening smaller stores, such as ainz & tulpe KEIO DEPARTMENT STORE SHINJUKU (Shinjuku, Tokyo; retail space: roughly 260m2). The success of these small stores, as well as large locations, is another key feature of our new retail formats. Property developers have been taking a close interest in the formats, because they can attract young shoppers and are easily adapted to different types of tenant locations. As a result, we have received numerous requests to open new stores in urban retail facilities, station shopping centers and other prime locations. In April 2018, we opened four new stores, including ainz & tulpe Odakyu Department Store Machida (Machida, Tokyo; retail space: roughly 500m2), taking the total number of ainz & tulpe stores to 48. The increase in brand visibility and positive feedback has given us more power in lease negotiations with property owners, which along with strong demand for our original brands, is supporting a significant improvement in the gross margin. We have also put significant trust in our frontline sales staff, who rapidly identify the latest interests and trends in our target consumer groups. That information is
then used to design in-store sales areas and shared with other stores, helping to drive growth in customer traffic and profits at existing stores. Strong growth in customer traffic and improving profits at existing stores ensured the cosmetic and drug store business moved into profit in fiscal 2018, one year earlier than planned. Going forward, we will continue to open new stores in prime locations in the Tokyo metropolitan area while also relocating stores to other sites if needed, aiming to create stores that offer a fun retail experience for shoppers. We will also work to raise brand visibility further and create unique products and sales displays to avoid competition with conventional retail stores and cosmetics manufacturers. In the cosmetics and drug store business, we are targeting sales of ¥50 billion and an operating margin of 7% in fiscal 2022, ending April 30, 2022. To achieve those targets, we will continue to aggressively expand the business, establish new retail formats and strengthen the ainz & tulpe brand, so that in the long term our ainz & tulpe retail format and original brands are recognized in their own right. Everyone in the business is pushing themselves to achieve those objectives.
Establishing new brands
Operating margin Gross marginNet sales
500
300
400
200
100
50
20
30
40
10
0 0
(¥ million) (%)
16/4 17/4 18/4 19/4(plan)
20/4(plan)
21/4(plan)
22/4(plan)
500
42.037.337.0
34.6 35.6
270241
213208
No. of stores 52 52 48 55 65 80 100
7.03.72.5
Net
sal
es
Operating m
argin / Gross m
argin
Medium-term plan
• July 2015 ainz & tulpe SHINJUKU
HIGASHIGUCHI
• March 2016 ainz & tulpe OMIYA
MARUI
• June 2016 ainz & tulpe
Colette Mare SAKURAGICHO-B1• November 2016 ainz & tulpe GINZA NAMIKIDORI
• March 2017 ainz & tulpe
KEIO DEPARTMENT STORE SHINJUKU
• November 2017 ainz & tulpe MARUI KICHIJOJI
• December 2016 ainz & tulpe
Colette Mare SAKURAGICHO
• April 2017 ainz & tulpe YOKOHAMA JOINUS• August 2017 ainz & tulpe
Odakyu Department Store Machida
• March 2018 ainz & tulpe
Grand Emio TOKOROZAWA
ainz & tulpe Colette Mare SAKURAGICHO

20 AIN HOLDINGS ANNUAL REPORT 2018 AIN HOLDINGS ANNUAL REPORT 2018 21
Empowering women / Improving workplace environments
Cooperation between pharmacists – who stand at the frontline of healthcare – and educational and research institutions, will play a vital role in driving the development of the medical and pharmaceutical sectors. AIN HOLDINGS is actively working with the University of Tokyo, Kyoto University, Osaka University, Sapporo Medical University and Asahikawa Medical University through course endowments and joint research projects to support research and development in the medical and pharmaceutical fields. As part of efforts to improve local healthcare provision, we have also teamed up with universities and other partners to carry out advanced clinical simulations. Specifically, we are running simulations with Hokkaido University and Caress Sapporo to acquire knowledge and technologies for home healthcare, a promising growth field.
Dispensing errors are an inherent risk in pharmacy operations. We view dispensing errors as an issue that can affect the public’s trust in the AIN Group, so we respond rapidly to address any problem that arises. Written on the back of every employee name badge is the process that should be followed in the event of a dispensing error or complaint from a patient, ensuring our customers receive an immediate response (See the photograph lower right). In addition, supervising pharmacists, who are responsible for managing pharmacy operations, are required to contact the Company through a direct hotline in the event of a compliance violation in their pharmacy, in order to limit any damage from misconduct or other issues.
AIN HOLDINGS aims to create value by addressing social issues through its two core businesses – the dispensing pharmacy business, which plays a key role in society, and the cosmetic and drug store business, which helps people lead full lives through health and beauty. We are implementing a range of initiatives covering the environment, society and corporate governance (ESG). In this section, we focus on the Group’s social initiatives, which are backed by our business activities and strengths.
ESG – Supporting Value Creation
AIN HOLDINGS has a particularly high ratio of female employees (79.5% as of April 30, 2018). That is one reason we are actively supporting women’s participation and career advancement in the workplace. We have put in place systems to ensure our female employees can feel at ease about continuing to work for the AIN Group, even after major life events such as marriage or childbirth. We are also empowering women through training courses designed to support career advancement, aiming to increase the number of women in management positions. Our efforts in this area have been recognized by the government. AIN PHARMACIEZ, our main operating subsidiary, was awarded Kurumin certification in April 2015 due to its support for
parenting and childcare. The company was also awarded the highest Level 3 Eruboshi certification in March 2018 for supporting women’s participation and career advancement in the workplace Kurumi and Eruboshi marks are awarded by Japan’s Ministry of Health, Labour and Welfare. The AIN Group as a whole is also actively working to create better workplace environments to motivate its employees. To ensure our personnel achieve a proper work-life balance, we are encouraging them to take more paid holidays and cut back overtime hours. In addition to setting up personnel support systems, we are focusing on creating workplaces where our employees can actually use those systems.
Responding to ESG Issues
Helping to reduce environmental impact · Building a management system to ensure minimal use of resources · Creating an environmental risk management system at Group companies and businesses · Reducing environmental impact at outsourced manufacturers · Raising environmental awareness at pharmacies and cosmetic and drug stores · Reducing resource use and CO2 emissions at pharmacies and cosmetic and drug stores
Addressing social issues · Promoting diversity · Empowering women · Creating better working environments · Implementing our pharmacy-led project to improve efficiency · Providing endowments for university courses · Conducting joint research
Strengthening corporate governance · Evaluating the effectiveness of the Board of Directors · Reinforcing governance at pharmacies and cosmetic and drug stores · Adjusting the remuneration system for executives · Tightening selection criteria for executive candidates · Promoting diversity (increase of the female executive ratio) · Strengthening risk management (including measures to reduce dispensing errors) · Reinforcing compliance
Environment
Governance
Society Case Study 1
Case Study 2
Case Study 3
Case Study 3
Advanced clinical simulations
Preparations to ensure an immediate response by all staff
PDA devices to prevent selection of incorrect drugs from shelves
Ratio of women in management positions
All management positions*2 30.9%Directors 16.7%Executive officers 31.3%General managers 18.2%
Number of employees taking maternity, childcare and reduced working hours for childcare (employees)
Maternity leave 341Childcare leave 512Reduced working hours for childcare 630
Notes: 1. Data is for the fiscal year ended April 20182. All management positions: section leaders and higher management
grades in head office divisions, pharmacy managers and store managers
Social issue
Society
Creating better workplaces for womenAIN Group’s
initiatives
Supporting advances in healthcare, improving quality of dispensing pharmacies
Strengthening risk management/ Reinforcing compliance
Social issue
Social issue
Governance
University course endowments and joint research projects
AIN Group’s
initiatives
Reinforcing compliance in pharmacy operations
AIN Group’s
initiatives
Case Study 1
Society Case Study 2
Case Study 3

22 AIN HOLDINGS ANNUAL REPORT 2018 AIN HOLDINGS ANNUAL REPORT 2018 23
REMUNERATION FOR DIRECTORS AND AUDITORS
The maximum total amount of remuneration for directors was determined by a resolution at the 44th Ordinary General Meeting of Shareholders held on July 30, 2013 to be ¥300 million annually (does not include payments made to directors for their duties as employees; the maximum total amount for outside directors was determined to be ¥50 million annually). The maximum total amount of remuneration for corporate auditors was set at ¥30 million annually at the 22nd Ordinary General Meeting of Shareholders held on July 30, 1991. The actual amount each year is determined within this limit via discussions among the corporate auditors. The amount of remuneration for directors and corporate auditors for the year ended April 2018 is as follows:
STATUS OF ACCOUNTING AUDITS
Three certified public accountants from ERNST & YOUNG SHINNIHON LLC conducted the accounting audits of AIN HOLDINGS based on the Companies Act and Financial Instruments and Exchange Act. Audit fees for the year ended April 2018 are as follows:
OUTSIDE DIRECTORS AND OUTSIDE CORPORATE AUDITORS
The Board of Directors is comprised of twelve members, including four outside directors. Two of the Company’s three corporate auditors are outside corporate auditors. There are no conflicts of interest between the Company and its outside directors and outside corporate auditors. The outside directors and outside corporate auditors have a number of functions and roles to fulfill in the Group’s corporate governance system. Drawing on their specialist knowledge and experience, they contribute to the Group’s business strategy, discussions on board resolutions, and internal control mainly by monitoring business execution and providing input at meetings of the Board of Directors from a neutral, independent and objective standpoint. The Company has no specific standards in place at the moment, but the basic policy for appointing outside directors and outside corporate auditors is to ensure they can effectively fulfill the above roles. Four outside directors and one outside corporate auditor have been designated as independent officers in accordance with the provisions of the Tokyo Stock Exchange.
ItemTotal
remuneration(¥ million)
Remuneration by type (¥ million) Number
of eligible individualsBasic
remuneration Bonus
Directors (excluding outside directors)
181 141 39 6
Corporate auditors (excluding outside corporate auditors)
7 7 – 1
Outside directors and outside corporate auditors
21 21 – 4
AIN HOLDINGS assumes responsibility for people’s health and the well-being of the wider community through its business activities. We promote a highly efficient and transparent management system and implement ongoing initiatives toward enhancement of corporate governance.
Dispensing pharmacies and drug and cosmetic store chains are the key business areas being developed by AIN HOLDINGS. Both of these businesses are characterized by a responsibility towards people’s health, and as such, we recognize the indispensability of continuing with sound and transparent business activities that prioritize compliance. We have adopted a corporate auditor system to oversee not only key management decisions and the business execution of directors, but also general corporate management. In order to ensure the effective mutual management oversight of directors, the Board of Directors convenes more than once a
month, while a management meeting is held for directors and the standing corporate auditor on a weekly basis. To minimize potential risks, the Internal Audit Office ensures comprehensive compliance with basic pharmacy regulations, while the Safety Policy Office conducts analysis and implements measures to prevent drug dispensing errors. As part of efforts to enhance corporate governance, we have established a Compliance Committee to promote and embed systems that ensure compliance with business ethics, laws and regulations. The committee is made up of all the Company’s directors and auditors and legal advisors.
Board of DirectorsOutside Directors
Board ofManaging Directors
ManagementMeeting
Group Companies
Board ofCorporate Auditors Accounting Auditors
AppointmentAppointment
Audit Audit
Information Technology Division
Audit
Operational Support Division
Operating Management Division
Store DevelopmentDivision
Appointment
Reporting Cooperation
Reporting
Internal Audit Of�ce
Appointment Appointment Appointment
Reporting
ComplianceCommittee
RepresentativeDirectors
Business executionExecutive Of�cers
Guidance Reporting
General Meeting of Shareholders
(¥ thousand)
Compensation paid for audit certification activities
Compensation paid for * non-audit activities
The Company 39,700 –Consolidated subsidiaries 7,500 –
Total 47,200 –
ESG – Supporting Value Creation
(As of July 27, 2018)
Corporate governance structure Corporate Auditor System
Chairman of the Board Kiichi Otani
Number of directors 12 (including 4 outside directors)
Number of corporate auditors 3 (including 2 outside corporate auditors)
Board of Directors meetings* Number of meetings: 12Examples of resolutions: Annual budget, issues related to new businesses, store openings
Outside Director attendance at Board of Directors meetings* 97.8%
Outside Corporate Auditor attendance at Board of Directors meeting* 91.7%
Board of Corporate Auditor meetings* Number of meetings: 12Examples of resolutions: Audit policy, audit plans and business division audits
Management meetings* 52
Key meetings attended by corporate auditors Board of Directors meetings, Board of Corporate Auditor meetings, Management meetings
Independent director appointment Outside directors Ko Mori, Yasuyuki Hamada, Shigeki Kimura and Noriko Endo and outside corporate auditor Osamu Muramatsu have all been designated as independent officers in accordance with the provisions of the Tokyo Stock Exchange.
Systems to strengthen and promote Group management Group management meetings (weekly)
Accounting auditor ERNST & YOUNG SHINNIHON LLC
*Data is for the fiscal year ended April 2018.
Reasons for selection of outside directors
Ko Mori
Mr. Ko Mori was appointed as an outside director to broadly contribute to the Company’s activities by providing advice to the Board of Directors and other bodies and by monitoring business execution, drawing on his extensive knowledge and experience as the manager of a major trading company. Mr. Mori is judged to be a highly independent and objective appointment, as he has no affiliation with the parent company, its subsidiaries, major corporate shareholders or key customers of the Group.
Yasuyuki Hamada
Mr. Yasuyuki Hamada was appointed as an outside director to broadly contribute to the Company’s activities by providing advice to the Board of Directors and other bodies and by monitoring business execution. Although Mr. Hamada has no experience of business management, he is able to draw on his specialist knowledge and experience as an academic, particularly in the field of economics and finance. Since April 2010, Mr. Hamada has been an emeritus professor at Hokkaido University, which has received donations from the Company in the past. However, he is judged to be a sufficiently independent appointment, as the purpose of the donations was limited and they were not directly related to Mr. Hamada’s research activities.
Shigeki Kimura
Mr. Shigeki Kimura was appointed as an outside director to broadly contribute to the Company’s activities by providing advice to the Board of Directors and other bodies and by monitoring business execution, drawing on his specialist knowledge and experience from working in the accounting department of a major retailer. Mr. Sato works for Seven-Eleven Japan Co., Ltd., which has a business relationship and lease contracts with the Company. However, he is judged to be a sufficiently independent appointment, as the interdependence of Seven-Eleven Japan Co., Ltd. And the Company is low due to a minimal level of business between the two companies. He has no special interest in the Company.
Noriko Endo
Ms. Noriko Endo was appointed as an outside director to broadly contribute to the Company’s activities by providing advice to the Board of Directors and other bodies and by monitoring business activities, drawing on her extensive knowledge and experience from positions in the editing department of an economics magazine and a public research institution, as well as knowledge gained from market research in Japan and overseas. Ms. Endo previously worked for the Company in an advisory capacity, but the level of mutual dependence between Ms. Endo and the Company is low, as her contract was completed at the end of May 2018. There are no other affiliations that raise questions about Ms. Endo’s independence from the Company’s senior management team. Ms. Endo is judged to have no conflicts of interest with ordinary shareholders and has been designated as an independent officer.
Reasons for selection of outside corporate auditors
Akira Ibayashi
Mr. Akira Ibayashi was appointed as an outside corporate auditor to contribute to improvements in sound and efficient business management, drawing on his specialist knowledge from working at financial institutions and his experience in business management.
Osamu Muramatsu
Mr. Osamu Muramatsu was appointed as an outside corporate auditor to contribute to improvements in sound and efficient business management, drawing on his specialist knowledge from working at a major securities firm, experience in business management and track record as an outside auditor for the Group.
OUTLINE OF CORPORATE GOVERNANCE
BASIC POLICY FOR CORPORATE GOVERNANCE
Corporate Governance

24 AIN HOLDINGS ANNUAL REPORT 2018 AIN HOLDINGS ANNUAL REPORT 2018 25
Board of Directors and Corporate Auditors
(As of July 27, 2018)
Kiichi OtaniPresident and Representative Director (3,238,400 shares)
July 1980 President and Representative Director of Otani Corporation (now AIN HOLDINGS INC.)
November 1981 Director of newly established Daiichi Medical Testing Laboratories Co., Ltd. (now AIN HOLDINGS INC.)
July 1983 President and Representative Director of Daiichi Medical Testing Laboratories Co., Ltd.
May 1985 Managing Director of the CompanyMay 1988 President and Representative Director
(current post)
Masahito SakuraiRepresentative Senior Managing Director (1,000 shares)
April 1972 Joined Ministry of Health and Welfare (now Ministry of Health, Labour and Welfare)
April 1987 Head of Administration Section, Fund for Drug ADR Relief
July 1996 Head of Air Protection Section, Japan Environment Agency
July 1998 Head of Regional Medical Affairs Office for Tokai Hokuriku
January 2001 Retired from Ministry of Health and WelfareFebruary 2001 Commissioner of All-Japan Federation of
National Health Insurance OrganizationsOctober 2008 Joined the CompanyJuly 2009 Senior Managing DirectorNovember 2015 Senior Managing Director and
Representative Director (current post)
Rieko KimeiDirector In charge of Personnel Department (6,000 shares)
April 1986 Joined The Daiei, Inc. December 1995 Joined Daiichi Medical Testing
Laboratories Co., Ltd. (now AIN HOLDINGS INC.)
May 2003 General Manager of Cosmetic and Drug Store Business, Merchandising Business
May 2004 General Manager of Personnel Department
August 2009 Executive OfficerJuly 2014 Director (current post)July 2016 President and Representative Director of
AYURA LABORATORIES INC. (current post)
Hidehiro AwajiDirector (4,600 shares)
December 1983 Joined Daiichi Medical Testing Laboratories Co., Ltd. (now AIN HOLDINGS INC.)
December 2000 Manager of Tohoku BranchMay 2004 Manager of Hokkaido BranchAugust 2009 Executive OfficerMay 2010 Senior General Manager for Western JapanNovember 2015 Managing Director of AIN PHARMACIEZ INC.,
responsible for Western JapanMay 2018 Senior Managing Director of AIN
PHARMACIEZ INC., responsible for Western Japan (current post)
July 2018 Director of the Company (current post)
Masato SakaiDirector (7,400 shares)
April 1995 Joined Nisshin Oil Mills, Ltd. January 1999 Joined the CompanyMay 2004 Manager of Tohoku BranchMay 2006 Head of Corporate Planning OfficeJuly 2011 Executive OfficerJune 2014 President and Representative Director of
Asahi Pharmacy Co., Ltd. (current post) December 2016 Director of AIN PHARMACIEZ INC.,
responsible for Eastern Japan (current post) July 2018 Director of the Company (current post)
Ko MoriDirector Outside Independent (- shares)
April 1971 Joined Marubeni Corporation April 2002 Executive Officer and General Manager of
Chemicals DivisionApril 2004 Managing Executive OfficerJune 2006 Representative Director and Senior
Managing Executive Officer, Materials Division
June 2007 President and Representative Director of Marubeni Safenet Co., Ltd.
July 2012 Director of the Company (current post)
Shigeki KimuraDirector Outside Independent (- shares)
March 1986 Joined Seven-Eleven Japan Co., Ltd. March 2014 Executive Officer, Manager of Accounting Management
Department, Manager of Corporate Policy DepartmentDecember 2016 Executive Officer,
Senior Officer of Corporate Development Office of Seven & i Holdings Co., Ltd. (current post)
December 2016 Executive Officer, Manager of Secretarial Office of Seven-
Eleven Japan Co., Ltd.July 2017 Outside Director of the Company
(current post)
Noriko EndoDirector Outside Independent (200 shares)
June 1994 Joined DIAMOND, Inc.April 2004 Head and Director of Tokyo Office, Kyushu
UniversityApril 2006 Deputy Editor of Diamond Weekly,
DIAMOND, Inc.September 2013 Visiting Researcher at Policy Alternatives
Research Institute, University of Tokyo (current post)
April 2015 Project Professor, Graduate School of Media and Governance, Keio University (current post)
July 2018 Outside Director of the Company (current post)
Yasuyuki HamadaDirector Outside Independent (2,000 shares)
April 1991 Professor of Faculty of Economics, Hokkaido University
April 1997 Special Assistant for the president of same university
April 2003 Professor of Advanced Scientific Research Center, Hokkaido University (concurrent post)
April 2010 President of Sapporo International University Emeritus Professor of Hokkaido UniversityApril 2014 President and Chairman of Dohto UniversityDecember 2014 President of Hamanasu Foundation
(current post)July 2015 Outside Director of the Company
(current post)
Shoichi ShudoRepresentative Senior Managing Director In charge of development (9,400 shares)
April 1978 Joined Sapporo Medical Testing Laboratories Co., Ltd.
March 1982 Joined Daiichi Medical Testing Laboratories Co., Ltd. (Asahikawa, now AIN HOLDINGS INC.)
May 1993 Head of Corporate Planning Division July 2000 DirectorMay 2003 Managing DirectorMay 2004 General Manager of Dispensing Pharmacy
BusinessMay 2012 Senior Managing DirectorNovember 2015 Senior Managing Director and
Representative Director (current post)
Toshihide MizushimaRepresentative Senior Managing Director In charge of business operations, business support and information technology (27,600 shares)
April 1982 Joined SSP Co., Ltd. April 1986 Joined Otani Corporation (now AIN
HOLDINGS INC.)July 2000 DirectorFebruary 2001 General Manager of Cosmetic and Drug
Store BusinessMay 2003 Managing DirectorMay 2012 Senior Managing Director of the CompanyNovember 2015 Senior Managing Director and
Representative Director of the Company (current post)
July 2018 Head of Information and Technology Division (current post)
Miya OishiManaging Director Senior General Manager, Operations Department (5,000 shares)
September 1990 Joined KYOEIDO Co., Ltd. July 1993 Director of DAICHIKU Co., Ltd. (current
post)July 2008 Representative Director of same companyApril 2011 Vice President and Representative Director
of AIN MEDICAL SYSTEMS INC. (now AIN HOLDINGS INC.)
February 2012 President and Representative Director of same company
July 2012 Director of the CompanyJuly 2014 Managing Director (current post)November 2015 President and Representative Director of
AIN PHARMACIEZ INC. (current post)
Koichi KawamuraCorporate Auditor (full-time) (5,000 shares)
October 1985 Joined Daiichi Medical Testing Laboratories Co., Ltd. (now AIN HOLDINGS INC.)
July 1997 AuditorMay 2003 General Manager of Administrative
DepartmentJuly 2012 Corporate Auditor (current post)
Akira IbayashiCorporate Auditor Outside (- shares)
April 1963 Joined The Hokkaido Bank, Ltd. June 2001 Director, Executive Officer and Deputy
President June 2003 Retired from The Hokkaido Bank, Ltd.July 2012 Outside Corporate Auditor of the Company
(current post)
Osamu MuramatsuCorporate Auditor Outside Independent (- shares)
April 1972 Joined Nomura Securities Co., Ltd. June 1994 Head of Sapporo BranchJune 1996 DirectorOctober 2007 Retired from Nomura Securities Co., Ltd. August 2011 President and Representative Director of
Executive Partners, Inc.June 2012 Outside Corporate Auditor of Asahi
Pharmacy Co., Ltd. (current post)
July 2016 Outside Corporate Auditor of the Company (current post)
*Figures in brackets show the number of AIN HOLDINGS shares held as of April 30, 2018.
BOARD OF DIRECTORS CORPORATE AUDITORS

26 AIN HOLDINGS ANNUAL REPORT 2018 AIN HOLDINGS ANNUAL REPORT 2018 27
Financial Section
Management’s Discussion and Analysis of Financial Condition and Results of Operations
BUSINESS ENVIRONMENT SURROUNDING THE AIN HOLDINGS GROUP
The core business of the AIN HOLDINGS Group (the Group) is the dispensing pharmacy business that includes preparing and dispensing drugs based on prescriptions. Drug prices and dispensing fees* are stipulated by the Ministry of Health, Labour and Welfare. The Japanese government is progressively revising drug prices and dispensing fees as part of its policy to curb national medical expenses. Earnings at dispensing pharmacies are the total of dispensing fees and sales of drugs, so earnings are affected by these revisions. In drug price revisions in April 2018, the average drug price declined 1.36% on a government expenses basis and 6.17% on a drug price basis (including exceptional special reductions for high-cost drugs, the declines were 1.65% and 7.48%, respectively). Furthermore, the role of pharmacies located near hospitals was reviewed, with primary care dispensing pharmacies and pharmacists receiving a higher evaluation as part of government efforts to drive a structural shift from dispensing focused only on dispensing drugs to dispensing focused on services that contribute to local healthcare services. The gap in performance is widening between companies in the industry, which are struggling with changes to their profit structures resulting from revisions to dispensing fees. However,
the Group regards these changes in the operating environment as a perfect opportunity to push ahead with its strategy of further increasing profitability.
* Dispensing fees comprise pharmaceutical management fees and technical fees for pharmacists
BUSINESS OVERVIEW FOR THE FISCAL YEAR UNDER REVIEW
During the fiscal year ended April 30, 2018, the Japanese economy improved at a moderate pace amid signs of a pickup in consumer spending and improving corporate earnings and employment conditions. In this economic environment, the AIN HOLDINGS Group (the Group) worked to expand its business and increase earnings. Specifically, the Group opened new dispensing pharmacies and used M&A to expand the business. It also developed its cosmetic and drug store business. For the fiscal year under review, net sales rose 8.2% year on year to ¥268,385 million, operating income increased 34.7% to ¥19,622 million, ordinary income increased 33.5% to ¥20,129 million and profit attributable to owners of parent increased 32.9% year on year to ¥10,567 million. As of the end of the fiscal year, the number of stores in the Group totaled 1,077, a net decrease of 41 stores from the end of the previous fiscal year.
Effective from the fiscal year under review, the Group has changed the name of the drug and cosmetic store business to the cosmetic and drug store business. This is a change in name only and does not affect segment information.
BUSINESS RESULTS BY SEGMENT
Dispensing Pharmacy BusinessTo ensure our pharmacists and dispensing pharmacies fulfill their primary care role, the Group continues to build links with local medical service providers, strengthen pharmaceutical management and guidance based on the integrated and continuous management of drug information using patient medication notebooks and other means, and promote wider use of generic drugs. The shortage of pharmacists in the healthcare sector is becoming more serious. To address this issue, the Group is working to attract new graduates, with 279 new pharmacist graduates joining the Group in April 2018. The Group is also upgrading pharmacist training programs to enhance their capabilities so that they can fill their role as pharmacists at the heart of the community. In business development, the Group pushed ahead with business expansion by opening new dispensing pharmacies and using M&A deals. Store operations are also being overhauled. During the fiscal year under review, the dispensing pharmacy business reported sales and profit growth with sales rising 7.6% year on year to ¥238,645 million and segment income increasing 18.6% to ¥22,668 million. During the same period, the Group opened 36 new dispensing pharmacies, including those acquired through M&A deals, and closed 73 pharmacies, resulting in a total of 1,029.
Cosmetic and Drug Store BusinessIn the cosmetic and drug store business, the market environment remained challenging due to a narrowing competitive gap between companies in the sector and the emergence of new competitors from sector consolidation and realignment that also extends to other business sectors. Against this backdrop, the Group continued to open ainz & tulpe cosmetic and drug stores in the Tokyo metropolitan area and worked to make stores more appealing by refurbishing existing stores and strengthening merchandise lineups, particularly cosmetics and drug products. Earnings also improved, supported by lower costs due to greater business efficiency and by an increase in the gross margin due to active efforts to develop LIPS and HIPS, cocodecica and other original brands and an overhaul of procurement activities. As a result, for the fiscal year under review, the cosmetic and drug store business reported an increase in sales of 12.8% year on year to ¥24,117 million. And segment income was ¥657 million, compared with segment loss of ¥866 million a year earlier. During the fiscal year under review, the Group opened the ainz & tulpe Odakyu Department Store Machida (Machida City, Tokyo), ainz & tulpe MARUI KICHIJOJI (Musashino City, Tokyo), ainz & tulpe Grand Emio TOKOROZAWA (Tokorozawa City, Saitama) and ainz Grand Emio TOKOROZAWA (Tokorozawa City, Saitama) and closed eight stores, resulting in a total of 48 cosmetic and drug stores at the end of the fiscal year.
Other BusinessesNet sales from other businesses rose 14.2% year on year to ¥5,623 million and segment loss was ¥1,164 million compared with the loss of ¥1,496 million a year earlier.
2008/4 2009/4 2010/4 2011/4 2012/4 2013/4 2014/4 2015/4 2016/4 2017/4 2018/4For the year:
Net sales 106,231 115,387 125,495 129,387 142,790 154,560 170,225 187,904 234,843 248,110 268,385Selling, general and administrative expenses 9,203 9,948 10,744 11,981 12,839 14,740 15,635 17,509 23,915 27,529 28,370Operating income 4,444 5,296 6,492 8,107 10,253 9,701 10,113 11,452 14,619 14,563 19,622Profit attributable to owners of parent 1,615 2,127 3,131 3,916 4,899 5,075 5,259 6,197 7,917 7,949 10,567Capital expenditures 1,914 2,891 2,573 2,750 5,870 7,235 6,328 6,413 11,209 4,786 5,311Depreciation and amortization 968 1,119 1,286 1,560 1,749 2,212 2,258 2,553 3,259 3,687 3,596
At the end of the year:Equity capital*1 12,040 16,071 21,445 29,450 33,695 38,312 42,122 47,928 53,258 60,105 96,697Total net assets 12,707 16,109 21,492 29,498 33,745 38,356 42,240 48,046 53,324 60,178 96,733Total assets 57,546 62,032 65,898 76,940 85,908 95,839 101,382 114,149 139,888 156,323 183,435Number of shares outstanding (shares) 11,361,000 12,831,376 14,101,164 15,941,004 15,940,790 15,940,740 15,854,190 31,707,617 31,707,617 31,707,568 34,079,508Number of employees (persons) 2,582 2,741 2,918 3,104 3,326 3,551 3,806 4,429 5,511 6,469 6,498Number of stores: Dispensing pharmacy business 356 375 397 448 494 560 616 754 881 1,066 1,029Number of stores: Drug and cosmetic store business 45 46 49 53 56 61 59 56 52 52 48
Per share information (¥):Net income*2 71.18 85.37 114.04 127.83 153.67 159.18 165.04 195.45 249.69 250.71 310.08Net assets*2 529.89 626.27 760.40 923.73 1,056.89 1,201.71 1,328.43 1,511.57 1,679.69 1,895.63 2,729.44Cash dividends*2 10.0 15.0 20.0 22.5 25.0 30.0 30.0 30.0 40.0 50.0 50.0
Stock information (based on the closing price as of April 30) (¥):Stock price 1,490 1,481 2,920 3,115 4,290 4,765 4,495 4,245 5,340 7,720 7,300
Ratios (%):Operating margin 4.2 4.6 5.2 6.3 7.2 6.3 5.9 6.1 6.2 5.9 7.3Return on sales*3 1.5 1.8 2.5 3.0 3.4 3.3 3.1 3.3 3.4 3.2 3.9Return on assets (ROA)*4 3.0 3.6 4.9 5.5 6.0 5.6 5.3 5.8 6.2 5.4 6.2Return on equity (ROE)*5 14.2 15.1 16.7 15.4 15.5 14.1 13.1 13.8 15.6 14.0 13.5Shareholders’ equity ratio 20.9 25.9 32.5 38.3 39.2 40.0 41.5 42.0 38.1 38.4 52.7
11-YEAR FINANCIAL SUMMARY
Note: Amounts of less than one million yen were rounded down.
*1: Equity capital = Total net assets – Non-controlling interests
*2: The Company conducted a 2-for-1 stock split of common shares with an effective date of October 1, 2014. Net income per share, net assets per share and cash dividends per share have been adjusted retroactively to reflect the impact of the stock split.
*3: Return on sales = Profit attributable to owners of parent / Net sales × 100
*4: Return on assets = Profit attributable to owners of parent / Total assets (yearly average) × 100
*5: Return on equity = Profit attributable to owners of parent / Equity capital (yearly average) × 100
(¥ million)

28 AIN HOLDINGS ANNUAL REPORT 2018 AIN HOLDINGS ANNUAL REPORT 2018 29
Financial Section
FINANCIAL POSITION
The balance of total assets at the end of the fiscal year under review increased by ¥27,112 million from the end of the previous fiscal year to ¥183,435 million. That mainly reflected an increase in cash and deposits from the public offering and private placements. Current assets at the end of the fiscal year under review totaled ¥96,169 million, an increase of ¥30,749 million from ¥65,420 million at the end of the previous fiscal year. This mainly reflected an increase of ¥34,004 million in cash on hand and in banks to ¥63,779 million. Fixed assets at the end of the fiscal year under review totaled ¥87,162 million, a decline of ¥3,740 million from ¥90,902 million at the end of the previous fiscal year. The Company’s assets increased through investment in new stores and expansion in the asset base at consolidated subsidiaries that become part of the Group through M&A deals, but in the fiscal year under review, the decline in fixed assets mainly reflected a lack of M&A deals. The balance of current liabilities at the end of the fiscal year under review was ¥70,235 million, a decline of ¥2,720 million from ¥72,955 million at the end of the previous fiscal year, while the balance of long-term liabilities was ¥16,467 million, down ¥6,721 million from ¥23,188 million a year earlier. As a result, the balance of total liabilities was ¥86,702 million, a decline of ¥9,441 million from ¥96,144 million at the end of the previous fiscal year. The balance of net assets at the end of the fiscal year under review was ¥96,733 million, an increase of ¥36,555 million from ¥60,178 million at the end of the previous fiscal year. As a result, the shareholders’ equity ratio increased 14.3 percentage points to 52.7%, compared with 38.4% at the end of the previous fiscal year. ROA improved 0.8 of a percentage point to 6.2% and ROE declined 0.5 of a percentage point to 13.5%.
BASIC POLICIES FOR PROFIT DISTRIBUTION
The Company considers the return of profits to shareholders as an important management issue. Our basic policy is to repay our investors proportionate to the profit we make, and to maintain these payments at stable levels. Internal reserves are held to strengthen the corporate structure and in preparation for new store openings and future development of the business. We will make effective use of these funds to generate profits to be returned to shareholders in the future. The Company’s basic policy is to pay dividends from retained earnings once per year at the end of the fiscal year. For the fiscal year under review, the Company paid a dividend from retained earnings of ¥50 per share, the same as the previous fiscal year. In view of our profit forecasts, plans for investment and other factors, we intend to pay an ordinary dividend from retained earnings of ¥55 per share in the fiscal year ending April 30, 2019.
CASH FLOWS
In the fiscal year under review, cash and cash equivalents (“cash”) increased ¥33,998 million (116.3%) year on year to ¥63,233 million. This reflected operating cash flow generated by dispensing pharmacy and cosmetic and drug store businesses, which was
mainly used to actively invest in new store openings and M&A. Some cash was also retained to provide constant access to a certain level of funds. Cash flows from each category and their relevant factors are as follows:
Cash Flows from Operating ActivitiesNet cash provided by operating activities was ¥21,656 million, compared with net cash provided of ¥18,409 million in the previous fiscal year. The main items that were positive for cash flow were income before income taxes of ¥17,852 million, as well as depreciation and amortization of ¥3,596 million and amortization of goodwill of ¥3,937 million related to business expansion through new store openings and M&A. The main item negative for cash flow was income taxes paid of ¥5,487 million.
Cash Flows from Investing ActivitiesNet cash used in investing activities was ¥5,281 million, compared with net cash used of ¥11,183 million in the previous fiscal year. This mainly reflected payments of ¥3,134 million for purchases of property, plant and equipment related to the opening of new cosmetic and drug stores and dispensing pharmacies, and ¥1,310 million for purchases of shares in subsidiaries due to changes in the scope of consolidation related to shares acquired in seven companies through M&A deals.
Cash Flows from Financing ActivitiesNet cash provided by financing activities was ¥17,623 million, compared with net cash provided of ¥116 million in the previous fiscal year. The main cash inflow was ¥27,631 million from the issue of new shares and sale of treasury stock related to a public offering and private placements. The main cash outflows were net repayment of ¥7,775 million from short-term and long-term debt repayment and proceeds, and ¥1,585 million for cash dividends paid.
BUSINESS AND OTHER RISKS
The following factors may affect the Group’s operating results and financial position. Statements in the text referring to the future reflect the judgment of the Group at the end of the fiscal year under review.
1. Laws and regulations a. Regulations under the Law for Ensuring the Quality, Efficacy, and Safety of Pharmaceuticals and Medical Devices We operate the dispensing pharmacy business under various permits, licenses, registrations and notifications including those set forth by the Law for Ensuring the Quality, Efficacy, and Safety of Pharmaceuticals and Medical Devices (the Pharmaceutical and Medical Device Law), the Health Insurance Law, and the Pharmacists Law, under the supervision of the Ministry of Health, Labour and Welfare, and of prefectural health and welfare departments. The drugstore business in our cosmetic and drug store business also involves drug sales, which are similarly regulated under the Pharmaceutical and Medical Device Law.
b. Easing of drug sales regulationsIn sales of over-the-counter (OTC) drugs, the Pharmaceutical and Medical Device Law classifies drugs into different categories based on risk. Only qualified pharmacists are permitted to sell drugs requiring guidance and category 1 drugs, while registered sellers, as well as pharmacists, are permitted to sell category 2 and category 3 drugs. In addition, the “Law for Partial Revision of the Pharmaceutical Affairs Law” (enacted June 12, 2014) ended restrictions on the sale of OTC drugs online. Factors such as the entry into the market of firms from other industries as a result of a continuing trend in the future to deregulate drug sales may affect the Group’s performance.
2. Details of businessThe Group’s dispensing pharmacy business operates a chain of dispensing pharmacies. As the dispensing pharmacy business accounted for 88.9% of net sales in the fiscal year under review, we plan to continue the multi-store operation mainly based on dispensing pharmacies. Accordingly, the Group’s operating results may be affected by the success or failure of the store opening policies including M&A and by trends in store openings by competitors in the same industry. Furthermore, sales of dispensing pharmacies significantly depend on the medical institutions that write prescriptions. Therefore, uncertainties such as the issuance of non-hospital prescriptions by the medical institutions or suspension/discontinuation of operations thereof may affect the Group’s performance. In addition, due to seasonal outbreaks of influenza and other conditions, the number of prescriptions filled may be affected by seasonal trends.
3. Industry trendsThe revenues in our dispensing pharmacy business come from pharmacy operations involving the dispensing and supplying of drugs based on prescriptions. The drug prices and dispensing fees are set by the Ministry of Health, Labour and Welfare. As a way to contract medical expenses, both medical treatment fees and drug prices are being revised incrementally. In the future as well, changes in profit structure resulting from factors such as revisions in the medical treatment fee system could continue to affect the Group’s performance and financial position.
4. Securing qualified staffDispensing pharmacies and drugstores (Stores for Category 1 Drugs) are required by the Pharmaceutical and Medical Device Law to have a pharmacist on site; the Pharmacists Law stipulates that the dispensing of drugs must be handled by a pharmacist. The Group continues to have a policy of expansion by aggressively opening new stores, but if it becomes difficult to secure qualified pharmacists, this could affect our store openings and the Group’s performance.
5. Risks of loss of trust in the Companya. Dispensing operationIn our dispensing pharmacy business, pharmacists dispense and supply prescription drugs that affect the human body. This business carries the risk that medical accidents might be caused through dispensing errors. The Group recognizes that any medical accidents could have a severely damaging effect on society’s confidence in the Group, and we place the highest priority on measures to avoid the risk from all aspects.
b. Protection of personal dataWe possess patient data in the dispensing pharmacy business, including medical histories and prescription information, and we possess personal data in the cosmetic and drug store business obtained from the ainz & tulpe Point Card and Tulpe Mobile Club. The Group takes all possible steps to protect personal data through personal information protection systems and the rigorous enforcement of rules on the handling of such information. Also, key subsidiary AIN PHARMACIEZ INC. has acquired Privacy Mark accreditation in the healthcare, medical and social service fields. However, we believe it is possible that any accidental or illegal leakage of personal data may not only affect the Group’s performance but also lead to a loss of society’s confidence in the Group.
6. Risk in business strategyThe Group has promoted the expansion of the business scale of dispensing pharmacies through actively promoting new store openings and M&A. Our basic policies regarding M&A strategy require us to carefully examine target companies and determine the amount to be paid for acquisitions thereof in order to stably secure a profitability level that exceeds the amortization of goodwill to be incurred. If matters do not go as planned, however, we may incur losses on valuation of shares in subsidiaries and impairment losses on goodwill, which may have an adverse impact on the Group’s operating results and financial position.
7. Interest rate risksIn the Group’s promotion of business expansion based on actively promoting new store openings and M&A, costs for ordinary store openings are covered by internal funds within the range of operating cash flow, while in large-scale M&A, costs are sometimes financed by borrowings from financial institutions. In order to ensure flexible access to funds to support these activities, the Group maintains a certain level of liquidity on its balance sheet. As of the end of the fiscal year under review, cash on hand and in banks totaled ¥63,779 million, compared with a total balance of short- and long-term debt of ¥18,228 million. We focus on the possibility of return on investment and seek to reduce interest-bearing debt through efficient investment in implementing M&A deals. However, if the Group fails to secure an adequate return on its M&A investment, or due to interest rate fluctuations associated with conditions in financial markets, the Group’s financial position and operating results including interest payable may be affected.
8. Impact of consumption taxUnder Japan’s Consumption Tax Act, dispensing sales in the dispensing pharmacy business related to social insurance medical examinations are exempt from consumption tax. However, the business is required to pay consumption tax on pharmaceutical and other products that it procures. As a result, consumption tax borne by the Group is booked under cost of sales in the dispensing pharmacy business. In the past, when consumption tax was introduced and dispensing fees were revised, the government took into account the higher rate of consumption tax when it set drug prices. However, future revisions to the rate of consumption tax may not be reflected in drug prices, which could have an impact on the Group’s operating results.

30 AIN HOLDINGS ANNUAL REPORT 2018 AIN HOLDINGS ANNUAL REPORT 2018 31
ASSETS 2018 2017 2018 LIABILITIES AND NET ASSETS 2018 2017 2018
Current assets: Current liabilities:¥ 63,779 ¥ 29,775 $ 582,989 Accounts payable (Note 4) ¥ 38,728 ¥ 39,325 $ 354,003
Notes and accounts receivable (Note 4) 10,466 9,990 95,667 Short-term debt (Notes 4 and 7) 6,717 7,596 61,398Other accounts receivable 7,751 9,402 70,850 Accrued income taxes 4,947 2,898 45,219Inventories (Note 3) 9,580 11,668 87,568 Deposits received 12,675 14,223 115,859Deferred tax assets (Note 10) 1,611 1,166 14,725 Allowance for bonuses to employees 1,911 1,903 17,468Short-term loans 641 632 5,859 Allowance for bonuses to directors 16 16 146Other current assets 2,470 2,829 22,577 Reserve for reward obligations 420 410 3,839Allowance for doubtful accounts (131) (44) (1,197) Provision for sales returns 6 14 54 Total current assets 96,169 65,420 879,058 Other current liabilities 4,810 6,566 43,967
Total current liabilities 70,235 72,955 642,001
Property, plant and equipment (Note 6): Buildings and structures, net 14,934 15,365 136,508 Long-term liabilities:Land 10,041 9,958 91,782 Long-term debt (Notes 4 and 7) 11,511 18,254 105,219Construction in progress 118 316 1,078 Lease obligations 632 958 5,776
2,759 2,823 25,219 Net defined benefit liability (Note 9) 2,625 2,331 23,994 Total property, plant and equipment 27,853 28,464 254,597 Other long-term liabilities 1,698 1,644 15,521
Total long-term liabilities 16,467 23,188 150,521
Investments and other assets:Investment securities (Notes 4 and 5) 2,375 2,435 21,709 Net Assets: (Note 11) Deferred tax assets (Note 10) 2,216 2,167 20,255 Shareholders’ equity Net defined benefit asset (Note 9) 9 22 82 Common stock (Note 14) 21,894 8,682 200,127Long-term loans 789 1,194 7,212 Authorized - 44,000,000 shares in 2018 and 2017Deposits and guarantees 11,339 10,443 103,647 Issued - 35,428,212 shares in 2018 and 31,888,212 shares in 2017Goodwill 38,011 40,939 347,449 Capital surplus 20,500 6,367 187,385Other intangible fixed assets 2,121 2,170 19,387 Retained earnings 54,268 45,286 496,051Other investments and other assets 2,985 3,378 27,285 Treasury stock (688 shares in 2018 and 180,644 shares in 2017) (1) (419) (9)Allowance for doubtful accounts (540) (312) (4,936) Total shareholders’ equity 96,662 59,918 883,564 Total investments and other assets 59,309 62,438 542,129 Accumulated other comprehensive income:
Unrealized holding gains on securities 84 86 767Remeasurments of defined benefit plans (50) 101 (457)
Deferred Assets: Total accumulated other comprehensive income 34 187 310Share issuance cost 103 - 941 Non-controlling interests 36 73 329 Total deferred assets 103 - 941 Total net assets 96,733 60,178 884,213 Total assets ¥ 183,435 ¥ 156,323 $ 1,676,736 Total liabilities and net assets ¥ 183,435 ¥ 156,323 $ 1,676,736
See accompanying notes.
Thousands of Thousands of
AIN HOLDINGS INC. CONSOLIDATED BALANCE SHEET
AS OF APRIL 30, 2018
Cash on hand and in banks (Notes 2 and 4)
Other property, plant and equipment, net
U.S. dollars U.S. dollars Millions of yen (Note 1(1)) Millions of yen (Note 1(1))

32 AIN HOLDINGS ANNUAL REPORT 2018 AIN HOLDINGS ANNUAL REPORT 2018 33
2018 2017 2018Net sales (Note 15) ¥ 268,385 ¥ 248,110 $ 2,453,244Cost of sales 220,392 206,017 2,014,552
Gross profit 47,993 42,092 438,692Selling, general and administrative expenses 28,370 27,529 259,323
Operating income 19,622 14,563 179,360Other income (expense):
Interest and dividend income 101 108 923Gains on investments in partnership 136 63 1,243Commissions received 61 44 557Real estate rental revenue 181 193 1,654Consignment income 201 149 1,837Technical advisory fee 70 62 639Gains on sales of fixed assets 76 11 694Gains on sales of investment securities 8 264 73Gain on transfer of business 59 32 539Refund of premium for cancelled insurance 31 63 283Interest expenses (117) (143) (1,069)Losses on sales of accounts receivables (71) (67) (648)Rent expenses on real estates (88) (89) (804)Provision of allowance for doubtful accounts (200) - (1,828)Losses on disposal and sales of fixed assets (624) (488) (5,703)Impairment losses on fixed assets (1,175) (453) (10,740)Directors' retirement benefits (127) (11) (1,160)Bad debts written off - (216) -Loss on valuation of investments in capital (440) - (4,021)Other, net 148 220 1,352
(1,770) (255) (16,179)Profit before income taxes 17,852 14,307 163,180Income taxes (Note 10):
Current 7,863 6,040 71,873Deferred (540) 310 (4,936)
7,322 6,350 66,928Profit 10,530 7,956 96,252(Loss) profit attributable to non-controlling interests (37) 7 (338)Profit attributable to owners of parent ¥ 10,567 ¥ 7,949 $ 96,590
2018 2017 2018Profit ¥ 10,530 ¥ 7,956 $ 96,252Other comprehensive income:
Unrealized holding (losses) gains on securities (1) 149 (9)Remeasurements of defined benefit plans, net of tax (152) 16 (1,389)Total other comprehensive (loss) income (153) 166 (1,398)
Total comprehensive income 10,376 8,122 94,844
Comprehensive income attributable to owners of parent 10,413 8,115 95,182Comprehensive (loss) income attributable to non-controlling interests (37) 7 (338)
See accompanying notes.
Millions of yen (Note 1(1))
Millions of yen
AIN HOLDINGS INC.CONSOLIDATED STATEMENT OF INCOME
AIN HOLDINGS INC.CONSOLIDATED STATEMENT OF COMPREHENSIVE INCOME
YEAR ENDED APRIL 30, 2018
YEAR ENDED APRIL 30, 2018
U.S. dollars(Note 1(1))
Thousands of
Thousands of U.S. dollars
Thousands ofshares
Number ofshares of
common stockCommon stock Capital surplus Retained
earnings Treasury stockTotal
shareholders’equity
Unrealizedholding gains(losses) onsecurities
Remeasurmentsof defined
benefit plans
Totalaccumulated
othercomprehensiveincome (loss)
Non-controllinginterests Total net assets
Balance at April 30, 2016 31,888 ¥ 8,682 ¥ 6,367 ¥ 38,605 ¥ (419) ¥ 53,237 ¥ (63) ¥ 84 ¥ 21 ¥ 65 ¥ 53,324Profit attributable to owners of parent - - - 7,949 - 7,949 - - - - 7,949Cash dividends paid - - - (1,268) - (1,268) - - - - (1,268)Acquisition of treasury stock - - - - (0) (0) - - - - (0)Net change in items other than those in shareholders’ equity - - - - - - 149 16 166 7 173Net changes during the year - - - 6,681 (0) 6,680 149 16 166 7 6,854
Balance at April 30, 2017 31,888 8,682 6,367 45,286 (419) 59,918 86 101 187 73 60,178Issuance of new shares 3,540 13,212 13,212 - - 26,424 - - - - 26,424Profit attributable to owners of parent - - - 10,567 - 10,567 - - - - 10,567Cash dividends paid - - - (1,585) - (1,585) - - - - (1,585)Acquisition of treasury stock - - - - (0) (0) - - - - (0)Disposal of treasury stock - - 921 - 418 1,339 - - - - 1,339Net change in items other than those in shareholders’ equity - - - - - - (1) (152) (153) (37) (190)Net changes during the year 3,540 13,212 14,133 8,982 417 36,744 (1) (152) (153) (37) 36,554
Balance at April 30, 2018 35,428 ¥ 21,894 ¥ 20,500 ¥ 54,268 ¥ (1) ¥ 96,662 ¥ 84 ¥ (50) ¥ 34 ¥ 36 ¥ 96,733
Common stock Capital surplus Retainedearnings Treasury stock
Totalshareholders’
equity
Unrealizedholding gains(losses) onsecurities
Remeasurmentsof defined
benefit plans
Totalaccumulated
othercomprehensiveincome (loss)
Non-controllinginterests Total net assets
Balance at April 30, 2017 $ 79,360 $ 58,199 $ 413,948 $ (3,829) $ 547,696 $ 786 $ 923 $ 1,709 $ 667 $ 550,073Issuance of new shares 120,767 120,767 - - 241,535 - - - - 241,535Profit attributable to owners of parent - - 96,590 - 96,590 - - - - 96,590Cash dividends paid - - (14,488) - (14,488) - - - - (14,488)Acquisition of treasury stock - - - (0) (0) - - - - (0)Disposal of treasury stock - 8,418 - 3,820 12,239 - - - - 12,239Net change in items other than those in shareholders’ equity - - - - - (9) (1,389) (1,398) (338) (1,736)Net changes during the year 120,767 129,186 82,102 3,811 335,868 (9) (1,389) (1,398) (338) 334,131
Balance at April 30, 2018 $ 200,127 $ 187,385 $ 496,051 $ (9) $ 883,564 $ 767 $ (457) $ 310 $ 329 $ 884,213
See accompanying notes.
Thousands of U.S. dollars (Note 1(1))Shareholders' equity Accumulated other comprehensive income (loss)
AIN HOLDINGS INC.
YEAR ENDED APRIL 30, 2018
Millions of yenShareholders' equity Accumulated other comprehensive income (loss)
CONSOLIDATED STATEMENT OF CHANGES IN NET ASSETS

34 AIN HOLDINGS ANNUAL REPORT 2018 AIN HOLDINGS ANNUAL REPORT 2018 35
AIN HOLDINGS INC.CONSOLIDATED STATEMENT OF CASH FLOWS
YEAR ENDED APRIL 30, 2018
2018 2017 2018Cash flows from operating activities:
Profit before income taxes ¥ 17,852 ¥ 14,307 $ 163,180Depreciation and amortization 3,596 3,687 32,870Amortization of goodwill 3,937 3,654 35,987Impairment losses on fixed assets 1,175 453 10,740Loss on valuation of investments in capital 440 - 4,021Increase (decrease) in allowance for doubtful accounts 313 (15) 2,861Increase in net defined benefit liability 157 233 1,435Increase in allowance for bonuses to employees 0 197 0Interest and dividend income (101) (108) (923)Interest expenses 117 143 1,069Gains on investments in partnerships (135) (52) (1,234)Gains on sales of investment securities (2) (263) (18)Losses on disposal and sales of fixed assets 548 477 5,009(Increase) decrease in accounts receivable (25) 5,369 (228)Bad debts expenses - 216 -Decrease in inventories 2,278 449 20,822Decrease in other assets 64 2,536 585Decrease (increase) in other accounts receivable 1,685 (2,820) 15,402Decrease in accounts payable (1,076) (4,340) (9,835)(Decrease) increase in other liabilities (3,668) 2,007 (33,528)
Subtotal 27,157 26,135 248,235Interest and dividends received 104 112 950Interest paid (117) (143) (1,069)Income taxes paid (5,487) (7,695) (50,155)
Net cash provided by operating activities 21,656 18,409 197,952
Cash flows from investing activities: Payments for purchases of property, plant and equipment (3,134) (2,415) (28,647)Proceeds from sales of property, plant and equipment 421 513 3,848Proceeds from sales of investment securities 84 869 767Purchases of subsidiaries' shares resulting in obtaining controls (1,310) (9,697) (11,974)Payments for loans receivable (404) (349) (3,692)Proceeds from collections of loans receivable 482 448 4,405Payments for purchase of intangible fixed assets (574) (1,032) (5,246)(Increase) decrease in other investments (868) 13 (7,934)Proceeds from withdrawal of time deposits 152 534 1,389Other, net (128) (68) (1,170)
Net cash used in investing activities (5,281) (11,183) (48,272)
Cash flows from financing activities: Net repayments from short-term debts (119) (391) (1,087)Proceeds from long-term debts - 11,729 -Repayments of long-term debts (7,656) (9,217) (69,981)Repayments of lease obligations (646) (735) (5,904)Proceeds from issuance of common shares 26,292 - 240,329Proceeds from sales of treasury stock 1,339 - 12,239Cash dividends paid (1,585) (1,268) (14,488)Other, net (0) (0) (0)
Net cash provided by financing activities 17,623 116 161,087
Net increase in cash and cash equivalents 33,998 7,342 310,767Cash and cash equivalents at beginning of year 29,234 21,892 267,221Cash and cash equivalents at end of the year (Note 2) ¥ 63,233 ¥ 29,234 $ 577,998
See accompanying notes.
Thousands of U.S. dollars
Millions of yen (Note 1(1))
AIN HOLDINGS INC. NOTES TO CONSOLIDATED FINANCIAL STATEMENTS
YEARS ENDED APRIL 30, 2018 AND 2017 1. Summary of significant accounting policies (1) Basis of presenting consolidated financial statements The accompanying consolidated financial statements have been prepared in accordance with the provisions set forth in the Japanese Financial Instruments and Exchange Law and its related accounting regulations, and in conformity with accounting principles generally accepted in Japan ("Japanese GAAP"), which are different in certain respects as to application and disclosure requirements of International Financial Reporting Standards. The accompanying consolidated financial statements have been reclassified and translated into English from the consolidated financial statements of AIN HOLDINGS INC. (the “Company”) prepared in accordance with Japanese GAAP and filed with the appropriate Local Finance Bureau of the Ministry of Finance as required by the Financial Instruments and Exchange Law. Some supplementary information included in the statutory Japanese language consolidated financial statements, but not required for fair presentation, is not presented in the accompanying consolidated financial statements. The translations of the Japanese yen amounts into U.S. dollars are included solely for the convenience of readers outside Japan, using the prevailing exchange rate at April 30, 2018, which was ¥109.4 to U.S. $1. The convenience translations should not be construed as representations that the Japanese yen amounts have been, could have been, or could in the future be, converted into U.S. dollars at this or any other rate of exchange. As permitted by the Financial Instruments and Exchange Law of Japan, amounts of less than one million yen have been omitted. As a result, the totals shown in the accompanying consolidated financial statements (both in yen and U.S. dollars) do not necessarily agree with the sums of the individual amounts. (2) Consolidated statement of cash flows In preparing the consolidated statement of cash flows, cash on hand, readily-available deposits and short-term highly liquid investments with maturities not exceeding three months at the time of purchase are considered to be cash and cash equivalents. (3) Basis of consolidation and accounting for investments in affiliates The consolidated financial statements comprise the accounts of the Company and its 73 and 87 subsidiaries as of April 30, 2018 and 2017, respectively. All significant intercompany accounts and transactions have been eliminated in consolidation. All companies are required to consolidate all significant investees which are controlled through ownership of majority voting rights or existence of certain conditions. The investments in affiliates are stated at their underlying equity value. All companies are required to account for investments in affiliates (20% to 50% owned and certain others that are 15% to 20% owned) by the equity method, in principle. Of consolidated subsidiaries, AIN PHARMACIEZ INC., MEDIWEL Corp. and AYURA LABORATORIES INC. close its accounts on April 30. The account closing date for 10 consolidated subsidiaries in the dispensing pharmacy business is the end of January. The account closing dates for six consolidated subsidiaries in the dispensing pharmacy business are the end of February. The account closing dates for two consolidated subsidiaries in the dispensing pharmacy business are the end of August and September, respectively. The account closing date of other consolidated subsidiaries is the end of March 31. Financial statements as of these respective closing dates are used in preparing the consolidated financial statements. However, necessary adjustments are made to important transactions that occur between these subsidiaries’ account closing dates and the account closing date for the consolidated financial statements. (4) Securities The Company and its consolidated subsidiaries examine the intent of holding each security and classify those securities other than equity securities issued by subsidiaries and affiliates: (a) securities held for trading purposes (hereafter, "trading securities"), (b) debt securities intended to be held to maturity

36 AIN HOLDINGS ANNUAL REPORT 2018 AIN HOLDINGS ANNUAL REPORT 2018 37
(hereafter, "held-to-maturity debt securities"), (c) other securities that are not classified in any of the above categories (hereafter, "available-for-sale securities"). Trading securities are carried at fair value and held-to-maturity debt securities are carried at amortized cost. Marketable securities classified as available-for-sale securities are carried at fair value with changes in unrealized holding gains or losses, net of the applicable income taxes, included directly in net assets. Non-marketable securities classified as available-for-sale securities are carried at cost. Cost of securities sold is determined by the moving average method. (5) Inventories Dispensed drugs were stated at lower of cost or market, cost being determined using the gross average method. Merchandise was stated at lower of cost or market, cost being determined using the retail method. Supplies were stated at cost determined using the last purchase method. (6) Depreciation and amortization Depreciation of property, plant and equipment other than leased assets is computed by the declining-balance method at rates based on the useful lives, except that the straight-line method is applied to buildings acquired on or after April 1, 1998 and to facilities attached to buildings and structures acquired on or after April 1, 2016. The useful lives of major property, plant and equipment are summarized as follows: Buildings and structures: 10 to 50 years The straight-line method is applied over a three-year period for assets with an acquisition price of ¥100,000 or more and less than ¥200,000. Amortization of software other than leased assets used by the Company and its consolidated subsidiaries is computed by the straight-line method over the useful lives, five years. Amortization of long-term prepaid expenses is computed by the straight-line method. Amortization of goodwill is computed by the straight-line method over a period (5 to 20 years). Leased assets capitalized under finance leases are depreciated over the lease terms of the respective assets with no residual value. Finance lease transactions that do not transfer ownership that commenced prior to April 1, 2008, are accounted for under methods pertaining to standard lease transactions. (7) Impairment of fixed assets Fixed assets are reviewed for impairment whenever events or changes in circumstances indicate that the carrying amount may not be recoverable. When amounts of undiscounted future cash flows of fixed assets are less than the carrying amounts, the fixed assets are determined to be impaired. Then, an amount by which the carrying amount exceeds the recoverable amount is recognized as an impairment loss. The Company and its consolidated subsidiaries identify group of assets by store as the smallest identifiable group of assets that generates cash inflows from continuing use that are largely independent of the cash inflows from other assets or groups of assets. With respect to non-performing assets, real estate is regarded as an independent asset group. The recoverable amount of the asset group is measured by the respective net selling prices. The land is assessed based on the appraisal value by an independent real estate appraiser. The fair vaule of assets other than the land is the disposal value from which costs of disposal are deducted, and its value in use is calculated by discounting the future cash flows at a discount rate of 1.4%. (8) Deferred charges Amortization of share issuance cost is computed by the straight-line method over three years. (9) Allowance for doubtful accounts The Company and its consolidated subsidiaries provide an allowance for doubtful accounts for probable collection losses by applying the actual rate of bad debt losses experienced in a past reference period for normal receivables and by individual assessment of collectability for doubtful receivables.
(10) Bonuses to employees Allowance for bonus to employees is provided for payments to employees of the Company and its consolidated subsidiaries at the amount expected to be paid in respect of the calculation period ended on the balance sheet date. (11) Bonuses to directors Allowance for bonus to directors is provided for payments to directors of the Company and its consolidated subsidiaries at the amount expected to be paid in respect of the calculation period ended on the balance sheet date. (12) Reserve for reward obligations In terms of the estimated redeemable amount of the purchase points given in the parent company’s Cosmetic and Drug Store Business, the Company sets a reserve based on actual redemptions in the past. (13) Provision for sales returns As a provision for losses associated with sales returns, the Company and its consolidated subsidiaries record an estimated loss amount considering past return rates and distribution in the market. (14) Retirement benefits Retirement benefits covering all employees are provided through two plans: a lump-sum benefit plan and a defined-benefit pension plan. Upon retirement or termination of employment, employees are generally entitled to lump-sum or annuity payments based on their current rate of pay, length of service and cause of termination. The Company and some of its consolidated subsidiaries employ the simplified method when computing retirement benefit obligations. In calculating the retirement benefit obligation, the benefit formula basis is used to attribute the expected benefit attributable to the respective fiscal year. Unrecognized prior service cost is amortized on a straight-line basis over a period (six years) within the employees’ average remaining service period at incurrence. Unrecognized actuarial gains and losses are recognized in expenses using the declining-balance method over a period (six years) within the average of the estimated remaining service period, commencing from the year after the year in which they are incurred. (15) Income taxes Deferred tax assets and liabilities are determined based on the differences between financial reporting and the tax bases of the assets and liabilities and are measured using the enacted tax rates and laws which will be in effect when the differences are expected to reverse. (16) Amounts per share of common stock Basic earnings per share is computed based on the weighted average number of shares of common stock outstanding during the year. Diluted earnings per share is computed based on the weighted average number of shares of common stock outstanding each year after giving effect to the dilutive potential of common shares to be issued upon conversion of the convertible bonds. Net assets per share are computed based on the net assets excluding non-controlling interests, and the number of common stock outstanding at the year end. Cash dividends per share represent the actual amount declared as applicable to the respective years. (17) Consumption taxes The Company and its consolidated subsidiaries are accounted for using the tax excluded method. With regard to consumption taxes and other taxes that are not subject to deduction, the related expenses are reported in the fiscal year in which they are incurred.

38 AIN HOLDINGS ANNUAL REPORT 2018 AIN HOLDINGS ANNUAL REPORT 2018 39
However, consumption taxes and other taxes that are not subject to deduction but related to fixed assets are recorded in “Other investments and other assets” within “Investments and other assets” and amortized using the straight-line method. Accrued consumption taxes are indicated in the corresponding “other” sections within current assets and current liabilities. (18) Recoverability of deferred tax assets The Company and its consolidated subsidiaries have applied “Revised Implementation Guidance on Recoverability of Deferred Tax Assets” (Accounting Standards Board of Japan (“ASBJ”) Guidance No. 26 revised on March 28, 2016) from the beginning of the fiscal year ended April 30, 2017. (19) Unapplied accounting standards Tax Effect Accounting Implementation Guidance on Tax Effect Accounting (ASBJ Statement No. 28 issued February 16, 2018) Implementation Guidance on Recoverability of Deferred Tax Assets (ASBJ Guidance No. 26 revised February 16, 2018) The treatment of future taxable temporary differences pertaining to shares of subsidiaries in the non-consolidated financial statements has been revised. Also, the treatment of recoverability of deferred tax assets in companies classified into Category 1 has been clarified. The Company and its consolidated subsidiaries intend to adopt the Implementation Guidance from the beginning of the fiscal year ending April 30, 2019.
Effects of adoption of the Implementation Guidance are currently evaluated. Revenue Recognition Accounting Standard for Revenue Recognition (ASBJ Statement No. 29 issued March 30, 2018) Implementation Guidance on Accounting Standard for Revenue Recognition (ASBJ Guidance No. 30 issued March 30, 2018) The Accounting Standard and the Implementation Guidance provide comprehensive principles for revenue recognition. An entity applies the following five steps to recognize revenue. 1. Identify the contracts with a customer 2. Identify the separate performance obligations in the contract 3. Determine the transaction price 4. Allocate the transaction price to the performance obligations 5. Recognize revenue when or as the performance obligation is satisfied The Company and its consolidated subsidiaries intend to adopt the Accounting Standard and the Implementation Guidance from the beginning of the fiscal year ending April 30, 2022.
Effects of adoption of the Accounting Standard and the Implementation Guidance are currently evaluated. (20) Reclassification and restatement Certain prior year amounts have been reclassified to conform to the current year presentation. These reclassifications and restatement had no impact on previously reported results of operations.
2. Cash and cash equivalents (1) Reconciliations of cash on hand and in banks shown in the consolidated balance sheet and cash
and cash equivalents shown in the consolidated statement of cash flows as of and for the years ended April 30, 2018 and 2017 are as follows:
Thousands of Millions of yen U.S. dollars 2018 2017 2018 Cash on hand and in banks ¥ 63,779 ¥ 29,775 $ 582,989 Less: Time deposits with maturities
exceeding three months (546) (540) (4,990) Cash and cash equivalents ¥ 63,233 ¥ 29,234 $ 577,998
(2) The following table summarizes assets acquired and liabilities assumed through the acquisition of
shares of the companies relating acquisition cost and net disbursement:
(a) Major breakdown of assets and liabilities of companies newly included in the consolidated financial statements for the years ended April 30, 2018 and 2017 due to the acquisition of shares
(i) Acquisition of shares of seven companies in the dispensing pharmacy business and one other
company for the year ended April 30, 2018
The following is the summary of assets acquired and liabilities assumed through the acquisition of shares of the companies relating acquisition cost and net disbursement.
Thousands of Millions of yen U.S. dollars 2018 2018 Current assets ¥ 1,129 $ 10,319 Fixed assets 311 2,842 Goodwill 1,274 11,645 Current liabilities (917) (8,382) Long-term liabilities (137) (1,252) Acquisition cost of the companies 1,660 15,173
Historical costs of shares of affiliates that are not accounted for by the equity method
(2) (18)
Gain on step acquisition (49) (447) Cash and cash equivalents held by the companies
(298)
(2,723)
Net disbursement due to the acquisition
¥ 1,310
$ 11,974
(ii) Acquisition of shares of 38 companies in the dispensing pharmacy business and one other
company for the year ended April 30, 2017
The following is the summary of assets acquired and liabilities assumed through the acquisition of shares of the companies relating acquisition cost and net disbursement.
Millions of yen 2017 Current assets ¥ 9,019 Fixed assets 2,767 Goodwill 10,967 Current liabilities (8,332) Long-term liabilities (3,347) Acquisition cost of the companies 11,074
Cash and cash equivalents held by the companies
(1,377)
Net disbursement due to the acquisition
¥ 9,697
40 AIN HOLDINGS ANNUAL REPORT 2018 AIN HOLDINGS ANNUAL REPORT 2018 41
3. Inventories Inventories at April 30, 2018 and 2017 consisted of the following:
Thousands of Millions of yen U.S. dollars 2018 2017 2018 Merchandise ¥ 9,372 ¥ 11,402 $ 85,667 Supplies 208 266 1,901 ¥ 9,580 ¥ 11,668 $ 87,568
4. Financial instruments (1) Qualitative information on financial instruments
(a) Policies for using financial instruments The Company and its consolidated subsidiaries have expanded business by opening dispensing pharmacies and cosmetic and drug stores and through M&A activities. Operating cash flows provide the majority of the funds the Company and its consolidated subsidiaries require to fund its shop openings. The Company and its consolidated subsidiaries secure additional funding as needed for M&A activities through bank borrowings and issuance of new shares and invests in highly liquid financial assets.
(b) Details of financial instruments used and the exposures to risk and how they arise
Notes and accounts receivable, which relate to trade receivables, are mostly composed of prescription dispensing fees receivable from National Health Insurance associations and the Social Insurance Medical Care Fee Payment Fund. In addition, most of other accounts receivable are collected in a short period. Therefore, these do not entail any risk.
Investment securities, which are principally equity securities held for the purpose of maintaining operating relationships with other companies, involve the risk of market price fluctuations.
Lease deposits and guarantee deposits are primarily deposits placed with the owners of properties that the Company leases for the operation of dispensing pharmacies and cosmetic and drug stores. Such deposits involve lessor credit risk.
Notes and accounts payable, which relate to purchases, are payable within three months.
With respect to borrowings, the Company raises funds primarily as working capital or in relation to capital expenditures. Redemption periods on such debts are typically 17 years from the date of borrowing, at the longest.
(c) Policies and systems for risk management Management of credit risk (the risk that a business partner will default on its business transactions)
As the Company’s notes and accounts receivable, which relate to sales, are mostly composed of prescription dispensing fees receivable from National Health Insurance associations and the Social Insurance Medical Care Fee Payment Fund, and most of other accounts receivable are also collected in a short period, no particular risk management is employed.
Securities held to maturity are based on the Company’s Marketable Securities Investment Standards. Such investments are based on careful decisions, following internal screenings of investees and investment amounts. Furthermore, such investments are monitored regularly, determining the investee’s financial status throughout the investment period to quickly determine and minimize potential repayment difficulties.
The Company manages default risk on lease deposits and guarantee deposits through the credit control upon making contract periods and regular credit screening.
Management of market risk (the risk of exchange and interest rate fluctuations) The Company and its consolidated subsidiaries raise funds mainly through long-term debt. With regard to investment securities, the Company and its consolidated subsidiaries regularly check the financial conditions of the issuers of unlisted securities. The Company and its consolidated subsidiaries review on an ongoing basis the status of their holdings of listed securities, taking into consideration market conditions and their relationships with the issuing companies.
Management of liquidity risk associated with fund procurement (the risk of being unable to execute payments when due) To manage liquidity risk, the Company and its consolidated subsidiaries create cash flow plans based on annual capital expenditures forecasts. These plans are updated each month, based on revised operating performance and forecast figures. To ensure the Company’s ability to respond flexibly to sudden demands for funding in relation to M&A activities, the Company maintains a certain level of liquidity, including through issuance of new shares.

42 AIN HOLDINGS ANNUAL REPORT 2018 AIN HOLDINGS ANNUAL REPORT 2018 43
(2) Fair values of financial instruments Carrying values and fair values of the financial instruments on the consolidated balance sheet at April 30, 2018 and 2017 are summarized in the following table:
Assets Millions of yen
Thousands of U.S. dollars
2018 2017 2018 Carrying value
Cash on hand and in banks ¥ 63,779 ¥ 29,775 $ 582,989 Notes and accounts receivable 10,466 9,990 95,667 Other accounts receivable 7,751 9,402 70,850 Investment securities 1,521 1,542 13,903
Deposits and guarantees 11,282 10,386 103,126 Total 94,800 61,096 866,544
Fair value Cash on hand and in banks 63,779 29,775 582,989 Notes and accounts receivable 10,466 9,990 95,667 Other accounts receivable 7,751 9,402 70,850 Investment securities 1,524 1,545 13,930
Deposits and guarantees 11,211 10,353 102,477 Total 94,732 61,066 865,923
Difference Cash on hand and in banks - - - Notes and accounts receivable - - - Other accounts receivable - - - Investment securities 3 2 27
Deposits and guarantees (70) (32) (639) Total ¥ (67) ¥ (30) $ (612)
Liabilities
Millions of yen Thousands of
U.S. dollars 2018 2017 2018 Carrying value
Accounts payable ¥ 38,728 ¥ 39,325 $ 354,003 Short-term debt including current portion of long-term debt
6,717
7,596
61,398
Deposits received 12,675 14,223 115,859 Long-term debt 11,511 18,254 105,219
Total 69,633 79,400 636,499 Fair value
Accounts payable 38,728 39,325 354,003 Short-term debt including current portion of long-term debt
6,717
7,606
61,398
Deposits received 12,675 14,223 115,859 Long-term debt 11,486 18,288 104,990
Total 69,608 79,444 636,270 Difference
Accounts payable - - - Short-term debt including current portion of long-term debt
(0)
9
(0)
Deposits received - - - Long-term debt (24) 34 (219)
Total ¥ (24) ¥ 43 $ (219) Method of calculating the fair value of financial instruments and matters related to available-for-sale securities and derivative transactions: Assets: (a) Cash on hand and in banks, notes and accounts receivable, and other accounts receivable
As these instruments are settled in the short term, their carrying value approximates fair value.
(b) Investment securities The fair values of equity securities are determined by their prices on stock exchanges. The fair values of bonds are determined by the prices indicated by the counterparty financial institutions, or the Company determines credit risk from the standpoint of credit management, according to repayment amount and contract period, and these amounts are discounted to their present value using appropriate rates of interest.
(c) Deposits and guarantees The Company determines credit risk from the standpoint of credit management, according to repayment amount and contract period. These amounts are discounted to their present value using appropriate rates of interest.
Liabilities: (a) Accounts payable, short-term debt and deposits received
As these instruments are settled in the short term, their carrying value approximates fair value. The fair value of current portion of long-term debt included in short-term debt is determined by discounting the total amount of principal and interest by the assumed interest rate on new borrowings of the same type.
(b) Long-term debt
The fair value of long-term debt is determined by discounting the total amount of principal and interest by the assumed interest rate on new borrowings of the same type.
Financial instruments for which fair value is not readily determinable: The fair values of unlisted equity securities with carrying amounts of ¥854 million ($7,806 thousand) and ¥892 million as of April 30, 2018 and 2017, respectively, are not readily determinable.

44 AIN HOLDINGS ANNUAL REPORT 2018 AIN HOLDINGS ANNUAL REPORT 2018 45
The redemption schedule for monetary claims and securities with maturity dates as of April 30, 2018 and 2017 are summarized as follows:
Millions of yen 2018
1 year or less
More than 1
year but less than 5 years
More than 5
years but less than 10 years
More than 10 years
Cash on hand and in banks ¥ 63,240 ¥ - ¥ - ¥ - Notes and accounts receivable 10,466 - - - Other accounts receivable 7,751 - - - Investment securities
Debt securities 155 5 - - Deposits received 2,134 4,444 2,470 2,289
Total ¥ 83,747 ¥ 4,449 ¥ 2,470 ¥ 2,289
Thousands of U.S. dollars
2018
1 year or less
More than 1
year but less than 5 years
More than 5
years but less than 10 years
More than 10 years
Cash on hand and in banks $ 578,062 $ - $ - $ - Notes and accounts receivable 95,667 - - - Other accounts receivable 70,850 - - - Investment securities
Debt securities 1,416 45 - - Deposits received 19,506 40,621 22,577 20,923
Total $ 765,511 $ 40,667 $ 22,577 $ 20,923
Millions of yen 2017
1 year or less
More than 1
year but less than 5 years
More than 5
years but less than 10 years
More than 10 years
Cash on hand and in banks ¥ 29,295 ¥ - ¥ - ¥ - Notes and accounts receivable 9,990 - - - Other accounts receivable 9,402 - - - Investment securities
Debt securities 179 10 - - Deposits received 2,086 3,735 2,518 2,102
Total ¥ 50,953 ¥ 3,745 ¥ 2,518 ¥ 2,102
5. Securities (1) The following tables summarize acquisition costs, carrying values and differences of securities with
available fair values as of April 30, 2018 and 2017:
Other securities:
Securities with carrying values exceeding acquisition costs Thousands of
Millions of yen U.S. dollars 2018 2017 2018 Acquisition cost
Equity securities ¥ 369 ¥ 367 $ 3,372 Bonds - - - Limited partnerships and similar investments
9
17
82
Other - - - Total 378 384 3,455
Carrying value Equity securities 589 562 5,383 Bonds - - - Limited partnerships and similar investments
13
26
118
Other - - - Total 603 588 5,511
Difference
Equity securities 219 195 2,001 Bonds - - - Limited partnerships and similar investments
4
9
36
Other - - - Total ¥ 224 ¥ 204 $ 2,047

46 AIN HOLDINGS ANNUAL REPORT 2018 AIN HOLDINGS ANNUAL REPORT 2018 47
Other securities:
Securities with carrying values not exceeding acquisition costs
Thousands of Millions of yen U.S. dollars
2018 2017 2018 Acquisition cost
Equity securities ¥ 396 ¥ 412 $ 3,619 Bonds 160 189 1,462 Limited partnerships and similar investments
451
411
4,122
Other 9 19 82 Total 1,018 1,034 9,305
Carrying value Equity securities 297 333 2,714 Bonds 160 189 1,462 Limited partnerships and similar investments
451
411
4,122
Other 9 19 82 Total 918 954 8,391
Difference
Equity securities (99) (79) (904) Bonds - - - Limited partnerships and similar investments
-
-
-
Other (0) (0) (0) Total ¥ (99) ¥ (80) $ (904)
Stocks of non-consolidated subsidiaries and affiliates were ¥162 million ($1,480 thousand) and ¥115 million at April 30, 2018 and 2017, respectively.
(2) The following table summarizes total sales amounts of other securities sold, and amounts of the
related gains and losses in the years ended April 30, 2018 and 2017: Thousands of
Millions of yen U.S. dollars 2018 2017 2018 Total sales of
other securities sold ¥ 84 ¥ 869 $ 767 Related gains 8 264 73 Related losses 5 1 45
(3) The following table summarizes impairment losses on other securities in the years ended April 30,
2018 and 2017: Thousands of
Millions of yen U.S. dollars 2018 2017 2018 Other securities with fair value ¥ 1 ¥ - $ 9 Other securities without fair value 0 - 0
6. Leases The following table summarizes details of lease expenses, reversal of impairment losses for leased assets, depreciation, interest expense and impairment losses, if they had been capitalized:
Thousands of Millions of yen U.S. dollars
2018 2017 2018 Lease expense ¥ - ¥ 1 $ - Reversal of impairment losses for leased assets
-
-
-
Depreciation - 0 - Interest expense - 0 - Impairment losses - - -
Equivalent interest is calculated by applying the interest method to allocate for each fiscal year over the term of the lease the difference between the total lease amount and the equivalent acquisition price of the leased asset. Remaining lease expenses for non-cancellable operating lease transactions are as follows:
Thousands of Millions of yen U.S. dollars
2018 2017 2018 Due within one year ¥ 1,502 ¥ 1,508 $ 13,729 Due after one year 8,463 9,955 77,358 Total ¥ 9,966 ¥ 11,463 $ 91,096
7. Short-term debt and long-term debt Short-term debt and long-term debt at April 30, 2018 and 2017 consisted of the following:
Thousands of Millions of yen U.S. dollars 2018 2017 2018 Short-term bank loans with a weighted-average interest rate of 0.2%
¥ 56
¥ 151
$ 511
Current portion of long-term debt with a weighted-average interest rate of 0.3%
6,661
7,445
60,886
Current portion of lease obligation with a weighted-average interest rate of 1.1%
443
594
4,049
Long-term debt (2019-2034) with a weighted-average interest rate of 0.3%
11,511
18,254
105,219
Lease obligation (2019-2023) with a weighted-average interest rate of 1.2%
632
958
5,776
Total ¥ 19,304 ¥ 27,403 $ 176,453

48 AIN HOLDINGS ANNUAL REPORT 2018 AIN HOLDINGS ANNUAL REPORT 2018 49
At April 30, 2018 and 2017, the carrying amounts of assets pledged as collateral for long-term debt are as follows:
Assets pledged as collateral: Thousands of Millions of yen U.S. dollars 2018 2017 2018
Investment securities ¥ - ¥ 5 $ - Total ¥ - ¥ 5 $ -
Liabilities corresponding to collateral: Thousands of
Millions of yen U.S. dollars 2018 2017 2018
Accounts payable ¥ - ¥ 1 $ - Total ¥ - ¥ 1 $ -
The aggregate annual maturities of long-term debt at April 30, 2018 are as follows:
Thousands of Year ending April 30, Millions of yen U.S. dollars
2019 ¥ 6,661 $ 60,886 2020 5,501 50,283 2021 3,697 33,793 2022 1,601 14,634 2023 539 4,926
The aggregate annual maturities of lease obligations at April 30, 2018 are as follows:
Thousands of Year ending April 30, Millions of yen U.S. dollars
2019 ¥ 443 $ 4,049 2020 339 3,098 2021 187 1,709 2022 93 850 2023 12 109
8. Sales, disposal and impairment of fixed assets (1) Gains and losses on sales of fixed assets for the years ended April 30, 2018 and 2017 are as
follows: Gains on sales of fixed assets: Thousands of Millions of yen U.S. dollars 2018 2017 2018
Buildings and structures ¥ 16 ¥ 2 $ 146 Land 2 1 18 Other property, plant and equipment
14
8
127
Goodwill 41 - 374 Other intangible fixed assets 0 - 0 Other investments and other assets
1 - 9
Total ¥ 76 ¥ 11 $ 694
Losses on sales of fixed assets: Thousands of Millions of yen U.S. dollars 2018 2017 2018
Buildings and structures ¥ 55 ¥ 21 $ 502 Land 50 4 457 Other property, plant and equipment
3
10
27
Other intangible fixed assets 0 - 0 Other investments and other assets
42
3
383
Total ¥ 153 ¥ 39 $ 1,398 (2) Losses on disposal of fixed assets for the years ended April 30, 2018 and 2017 are as follows:
Thousands of
Millions of yen U.S. dollars 2018 2017 2018 Buildings and structures ¥ 242 ¥ 155 $ 2,212 Other property, plant and equipment
46
23
420
Goodwill 11 158 100 Other intangible fixed assets 48 6 438 Deposits and guarantees 84 67 767 Other investments and other assets
25
3
228
Disposal cost 13 34 118 Total ¥ 471 ¥ 449 $ 4,305
(3) For the years ended April 30, 2018 and 2017, the Company recognized impairment losses for the
following property groups: Thousands of Millions of yen U.S. dollars 2018 2017 2018 Property group Description of assets Stores Buildings and structures ¥ 538 ¥ 252 $ 4,917 Buildings and structures,
and goodwill
384
201
3,510 Land, Buildings and
structures, and goodwill
135
-
1,234 Real estate Land 9 - 82 Land, and Buildings and
structures
108
-
987 Total ¥ 1,175 ¥ 453 $ 10,740
50 AIN HOLDINGS ANNUAL REPORT 2018 AIN HOLDINGS ANNUAL REPORT 2018 51
9. Retirement benefits Defined-benefit pension plan (1) Reconciliation of the beginning and the ending balance of retirement benefit obligation (excluding
the amount of the simplified method)
Thousands of Millions of yen U.S. dollars 2018 2018 Balance as of May 1, 2017 ¥ 2,462 $ 22,504 Service costs 353 3,226 Interest cost on retirement benefit obligation 10 91 Actuarial losses incurred 103 941 Pension and severance payments (154) (1,407) Other 12 109 Balance as of April 30, 2018 ¥ 2,786 $ 25,466
Millions of yen 2017 Balance as of May 1, 2016 ¥ 2,300 Service costs 339 Interest cost on retirement benefit obligation 7 Actuarial gains incurred (93) Pension and severance payments (113) Other ¥ 21 Balance as of April 30, 2017 ¥ 2,462
(2) Reconciliation of the beginning and the ending balance of plan assets (excluding the amount of the
simplified method)
Thousands of Millions of yen U.S. dollars 2018 2018 Balance as of May 1, 2017 ¥ 808 $ 7,385 Expected return on plan assets 6 54 Actuarial gains incurred 8 73 Business owner’s contribution 96 877 Pension and severance payments (59) (539) Balance as of April 30, 2018 ¥ 859 $ 7,851
Millions of yen 2017 Balance as of May 1, 2016 ¥ 772 Expected return on plan assets 5 Actuarial losses incurred (16) Business owner’s contribution 85 Pension and severance payments (38) Balance as of April 30, 2017 ¥ 808
(3) Reconciliation of the beginning and the ending balance of liabilities of the simplified method
Thousands of Millions of yen U.S. dollars 2018 2018 Balance as of May 1, 2017 ¥ 655 $ 5,987 Retirement benefit expenses 170 1,553 Business owner’s contribution (22) (201) Pension and severance payments (96) (877) Increases due to a newly consolidated subsidiary
9
82
Other (28) (255) Balance as of April 30, 2018 ¥ 689 $ 6,297
Millions of yen 2017 Balance as of May 1, 2016 ¥ 525 Retirement benefit expenses 149 Business owner’s contribution (18) Pension and severance payments (71) Increases due to a newly consolidated subsidiary
5
Other 64 Balance as of April 30, 2017 ¥ 655
(4) Reconciliation of the retirement benefit obligation and plan assets to net defined benefit liability and
net defined benefit asset reported on the consolidated balance sheet
Thousands of Millions of yen U.S. dollars 2018 2017 2018 Funded retirement benefit obligation ¥ 1,266 ¥ 1,190 $ 11,572 Plan assets (1,015) (952) (9,277)
Subtotal 251 237 2,294 Unfunded retirement benefit obligation 2,364 2,071 21,608 Net of liability and asset reported on the consolidated balance sheet
2,616
2,309
23,912
Net defined benefit liability 2,625 2,331 23,994 Net defined benefit asset (9) (22) (82) Net of liability and asset reported on the consolidated balance sheet
¥ 2,616
¥ 2,309
$ 23,912
(5) Retirement benefit expenses for the years ended April 30, 2018 and 2017 comprised the following:
Thousands of Millions of yen U.S. dollars 2018 2017 2018 Service costs ¥ 353 ¥ 339 $ 3,226 Interest cost on retirement benefit obligation
10
7
91
Expected return on plan assets (6) (5) (54) Amortization of actuarial (gains) losses (10) 28 (91) Amortization of prior service costs (34) (34) (310) Retirement benefit expenses calculated under the simplified method
170
149
1,553
Retirement benefit expenses ¥ 483
¥ 484
$ 4,414

52 AIN HOLDINGS ANNUAL REPORT 2018 AIN HOLDINGS ANNUAL REPORT 2018 53
(6) Remeasurements of defined benefit plans The breakdown of remeasurements of defined benefit plans (before deducting tax effect) is as shown below:
(a) Current Thousands of Millions of yen U.S. dollars 2018 2017 2018 Prior service costs ¥ (34) ¥ (34) $ (310) Actuarial (losses) gains (104) 105 (950)
Total ¥ (139) ¥ 70 $ (1,270) (b) Accumulated
Thousands of Millions of yen U.S. dollars 2018 2017 2018 Unrecognized prior service costs ¥ (13) ¥ (48) $ (118) Unrecognized actuarial gains (losses) 87 (16) 795
Total ¥ 74 ¥ (64) $ 676 (7) Plan assets
(a) Percentages for major categories within total plan assets are as follows:
2018 2017 Bonds 21% 7% Stocks 13% 4% General account 46% 47% Separate account 15% - Other 5% 42%
Total 100% 100% (b) Method of establishing the long-term expected return on plan assets
The long-term expected return on plan assets is determined by taking into consideration current and expected allocation of plan assets, as well as the current and future long-term expected profitability of the diverse assets that constitute the plan assets.
(8) Actuarial assumptions used in accounting for the Company’s plans as of April 30, 2018 and 2017 are principally as follows:
2018 2017 Weighted average discount rate 0.61% 0.64% Weighted average expected rate of return on plan assets
0.75%
0.75%
Expected rates of salary increase 1.00%-4.24% 1.00%-4.24%
10. Income taxes The aggregate statutory income tax rates used for calculation of deferred income tax assets and liabilities for the years ended April 30, 2018 and 2017 were 30.6%. (1) The following table summarizes the significant differences between the statutory tax rate and the
effective tax rates for consolidated financial statement purposes for the years ended April 30, 2018 and 2017:
2018 2017 Statutory tax rate 30.6% 30.6%
Non-deductible expenses 0.6 1.0 Per capita inhabitant tax 0.4 0.7 Amortization of goodwill 6.3 6.6 Valuation allowance 0.4 0.4 Tax credits on tax system to expand income
(0.0)
(1.0)
Tax credits on tax system for promoting equipment and investment to improve productivity
-
(0.1) Different tax rates applied to consolidated subsidiaries
4.8
3.9
Other (2.0) 2.4 Effective tax rates 41.0% 44.4%
(2) Significant components of deferred tax assets and liabilities as of April 30, 2018 and 2017 are as
follows: Thousands of Millions of yen U.S. dollars 2018 2017 2018 Deferred tax assets:
Impairment losses ¥ 422 ¥ 330 $ 3,857 Excess of depreciation 582 485 5,319 Excess of allowance for bonuses 648 596 5,923 Excess of reserve for rewards obligation 143 140 1,307 Net defined benefit liabilities 901 741 8,235 Goodwill on transfer of business 440 555 4,021 Asset retirement obligations 326 296 2,979 Income taxes payable 463 242 4,232 Accrued expense 289 194 2,641 Tax loss carryforwards 720 1,545 6,581 Other 845 282 7,723
Sub-total deferred tax assets 5,784 5,412 52,870 Valuation allowance 1,586 1,869 14,497
Total deferred tax assets 4,197 3,542 38,363 Deferred tax liabilities:
Capitalized removal costs (178) (160) (1,627) Net unrealized holding gains on securities (37) (37) (338) Other accounts receivable (423) (309) (3,866) Other (15) (38) (137)
Total deferred tax liabilities (655) (545) (5,987) Net deferred tax assets ¥ 3,542 ¥ 2,997 $ 32,376
11. Net assets Under Japanese laws and regulations, the entire amount paid for new shares is required to be designated as common stock. However, a company may, by a resolution of the Board of Directors, designate an amount not exceeding one-half of the price of the new shares as additional paid-in capital, which is included in capital surplus. Under the Japanese Corporate Law (the “Law”), in cases where a dividend distribution of surplus is made, the smaller of an amount equal to 10% of the dividend or the excess, if any, of 25% of common stock over the total of additional paid-in-capital and legal earnings reserve must be set aside as additional paid-in capital or legal earnings reserve. The legal earnings reserve is included in retained earnings in the accompanying consolidated balance sheets.

54 AIN HOLDINGS ANNUAL REPORT 2018 AIN HOLDINGS ANNUAL REPORT 2018 55
Under the Law, the legal earnings reserve and additional paid-in capital could be used to eliminate or reduce a deficit or could be capitalized by resolution of the shareholders’ meeting. Additional paid-in capital and legal earnings reserve may not be distributed as dividends. However, all additional paid-in capital and all legal earnings reserve may be transferred to other capital surplus and retained earnings, respectively, which are potentially available for dividends. The maximum amount that the Company can distribute as dividends is calculated based on the non-consolidated financial statements of the Company in accordance with the Law. 12. Commitment The Company entered into overdraft agreements with 18 and 19 banks as of April 30, 2018 and 2017, respectively, to finance working capital requirements. The outstanding balances of such overdrafts as of April 30, 2018 and 2017 are as follows:
Thousands of Millions of yen U.S. dollars 2018 2017 2018 Total overdraft available ¥ 21,450 ¥ 23,950 $ 196,069 Amount utilized 32 32 292 Outstanding balance ¥ 21,418 ¥ 23,918 $ 195,776
13. Contingencies The Company has contingent liabilities for the claims for lease deposits and guarantee deposits paid to owners of shops, due to their transfers to third parties. Such contingent liabilities amounted to nil and ¥742 million as of April 30, 2018 and 2017, respectively. 14. Amounts per share Net assets per share at April 30, 2018 and 2017 and basic and diluted earnings per share for the years then ended are as follows: Yen U.S. dollars 2018 2017 2018 Net assets per share ¥ 2,729.44 ¥ 1,895.63 $ 24.94 Basic earnings per share 310.08 250.71 2.83 Diluted earnings per share - - - Cash dividends per share attributable to the year 50 50 0.45
Cash dividends per share represent the cash dividends declared as applicable to the respective years, including dividends to be paid after the end of the year and not accrued in the accompanying consolidated financial statements.
15. Segment information (1) Overview of reporting segments
Reporting segments of the Company and its consolidated subsidiaries are composed of those individual business units for which separate financial information is available, from which the board of directors makes decisions regarding the allocation of management resources and for which operating performance can be evaluated, allowing the reporting segments to be analyzed periodically. The Company and its consolidated subsidiaries divide their operations into two main businesses, the Dispensing Pharmacy Business and the Cosmetic and Drug Store Business, and the Other Business. The Dispensing Pharmacy Business primarily includes the dispensing pharmacy business, sale of generic drugs, staff dispatching and introduction services and consulting business. The Cosmetic and Drug Store Business primarily consists of the management of cosmetic and drug stores. The Other Business primarily involves real estate rental business. The Company and its consolidated subsidiaries plan and execute strategies for each business. Consequently, the business operations of the Company and its consolidated subsidiaries are classified into the three following reporting segments: Dispensing Pharmacy, Cosmetic and Drug Store and Other.
(2) Methods of calculating sales, income (loss), assets and other items by reporting segment
Methods of accounting for reported business segments are in principle the same as those indicated in Note 1 “Summary of Significant Accounting Policies.” Income or loss of reporting segments are based on ordinary income. Income or loss between segments and transfer amounts are based on market prices.
(3) Information on sales, income (loss), assets and other items by reporting segment as of and for the years ended April 30, 2018 and 2017 are summarized as follows: Millions of yen 2018 Dispensing
pharmacy
Cosmetic and
Drug store Other Total Adjustments Consolidated
Sales Sales to third parties ¥ 238,645 ¥ 24,117 ¥ 5,623 ¥ 268,385 ¥ - ¥ 268,385 Intersegment sales - - 278 278 (278) - Total sales 238,645 24,117 5,901 268,664 (278) 268,385 Segment income (loss)
22,668
657
(1,164)
22,161
(2,031)
20,129
Segment assets ¥ 155,572 ¥ 9,943 ¥ 10,016 ¥ 175,532 ¥ 7,903 ¥ 183,435 Other Depreciation and amortization
¥ 2,229
¥ 334
¥ 387
¥ 2,951
¥ 191
¥ 3,143
Amortization of goodwill
3,910 -
27
3,937
-
3,937
Impairment losses 803 128 243 1,175 - 1,175 Increase of tangible and intangible assets
1,523
931
1,183
3,637
305
3,942
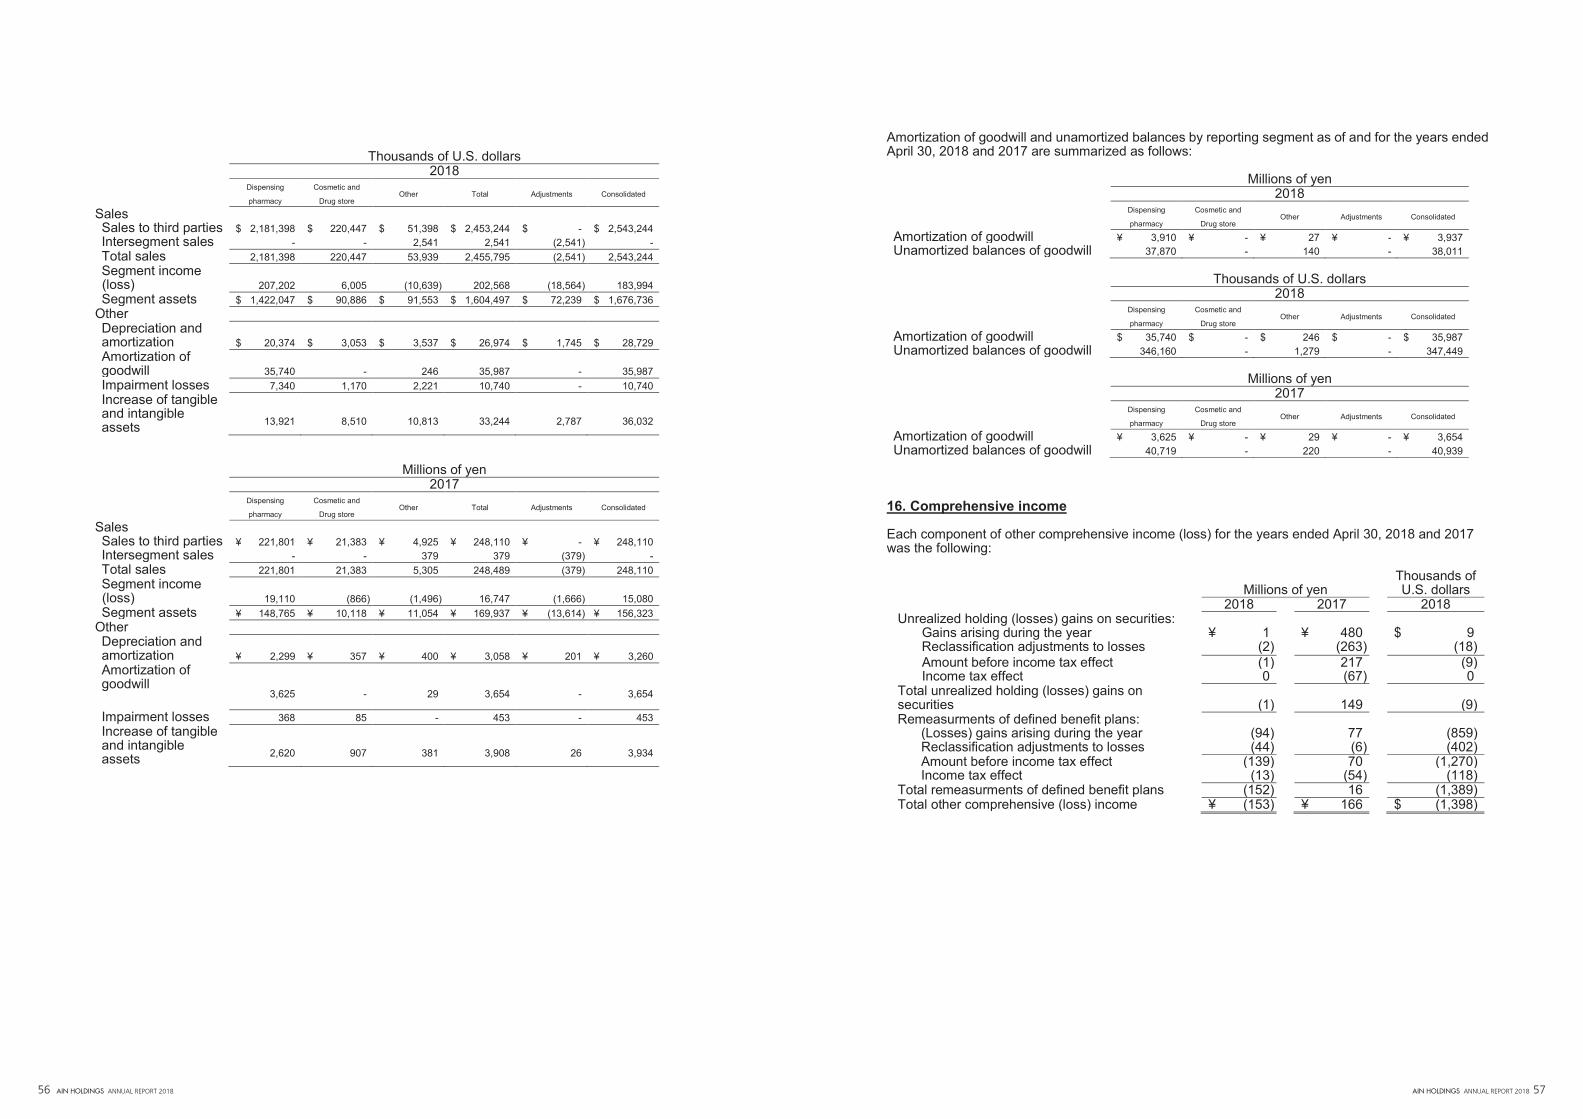
56 AIN HOLDINGS ANNUAL REPORT 2018 AIN HOLDINGS ANNUAL REPORT 2018 57
Thousands of U.S. dollars 2018 Dispensing
pharmacy
Cosmetic and
Drug store Other Total Adjustments Consolidated
Sales Sales to third parties $ 2,181,398 $ 220,447 $ 51,398 $ 2,453,244 $ - $ 2,543,244 Intersegment sales - - 2,541 2,541 (2,541) - Total sales 2,181,398 220,447 53,939 2,455,795 (2,541) 2,543,244 Segment income (loss)
207,202
6,005
(10,639)
202,568
(18,564)
183,994
Segment assets $ 1,422,047 $ 90,886 $ 91,553 $ 1,604,497 $ 72,239 $ 1,676,736 Other Depreciation and amortization
$ 20,374
$ 3,053
$ 3,537
$ 26,974
$ 1,745
$ 28,729
Amortization of goodwill
35,740
-
246
35,987
-
35,987
Impairment losses 7,340 1,170 2,221 10,740 - 10,740 Increase of tangible and intangible assets
13,921
8,510
10,813
33,244
2,787
36,032
Millions of yen 2017 Dispensing
pharmacy
Cosmetic and
Drug store Other Total Adjustments Consolidated
Sales Sales to third parties ¥ 221,801 ¥ 21,383 ¥ 4,925 ¥ 248,110 ¥ - ¥ 248,110 Intersegment sales - - 379 379 (379) - Total sales 221,801 21,383 5,305 248,489 (379) 248,110 Segment income (loss)
19,110
(866)
(1,496)
16,747
(1,666)
15,080
Segment assets ¥ 148,765 ¥ 10,118 ¥ 11,054 ¥ 169,937 ¥ (13,614) ¥ 156,323 Other Depreciation and amortization
¥ 2,299
¥ 357
¥ 400
¥ 3,058
¥ 201
¥ 3,260
Amortization of goodwill
3,625 -
29
3,654
-
3,654
Impairment losses 368 85 - 453 - 453 Increase of tangible and intangible assets
2,620
907
381
3,908
26
3,934
Amortization of goodwill and unamortized balances by reporting segment as of and for the years ended April 30, 2018 and 2017 are summarized as follows: Millions of yen
2018 Dispensing
pharmacy
Cosmetic and
Drug store Other Adjustments Consolidated
Amortization of goodwill ¥ 3,910 ¥ - ¥ 27 ¥ - ¥ 3,937 Unamortized balances of goodwill 37,870 - 140 - 38,011
Thousands of U.S. dollars
2018
Dispensing
pharmacy
Cosmetic and
Drug store Other Adjustments Consolidated
Amortization of goodwill $ 35,740 $ - $ 246 $ - $ 35,987 Unamortized balances of goodwill 346,160 - 1,279 - 347,449
Millions of yen
2017 Dispensing
pharmacy
Cosmetic and
Drug store Other Adjustments Consolidated
Amortization of goodwill ¥ 3,625 ¥ - ¥ 29 ¥ - ¥ 3,654 Unamortized balances of goodwill 40,719 - 220 - 40,939
16. Comprehensive income Each component of other comprehensive income (loss) for the years ended April 30, 2018 and 2017 was the following:
Thousands of Millions of yen U.S. dollars 2018 2017 2018 Unrealized holding (losses) gains on securities:
Gains arising during the year ¥ 1 ¥ 480 $ 9 Reclassification adjustments to losses (2) (263) (18) Amount before income tax effect (1) 217 (9) Income tax effect 0 (67) 0
Total unrealized holding (losses) gains on securities
(1)
149
(9)
Remeasurments of defined benefit plans: (Losses) gains arising during the year (94) 77 (859) Reclassification adjustments to losses (44) (6) (402) Amount before income tax effect (139) 70 (1,270) Income tax effect (13) (54) (118)
Total remeasurments of defined benefit plans (152) 16 (1,389) Total other comprehensive (loss) income ¥ (153) ¥ 166 $ (1,398)

58 AIN HOLDINGS ANNUAL REPORT 2018 AIN HOLDINGS ANNUAL REPORT 2018 59
17. Quarterly Information (1) Quarterly net sales for the year ended April 30, 2018 are as follows: Thousands of Millions of yen U.S. dollars 2018 2018 Three months ended July 31, 2017 ¥ 66,095 $ 604,159 Six months ended October 31, 2017 132,342 1,209,707 Nine months ended January 31, 2018 200,043 1,828,546 Twelve months ended April 30, 2018 268,385 2,453,244
(2) Quarterly income before income taxes and non-controlling interests for the year ended April 30,
2018 is as follows: Thousands of Millions of yen U.S. dollars 2018 2018 Three months ended July 31, 2017 ¥ 3,983 $ 36,407 Six months ended October 31, 2017 8,104 74,076 Nine months ended January 31, 2018 14,003 127,998 Twelve months ended April 30, 2018 17,852 163,180
(3) Quarterly profit attributable to owners of parent for the year ended April 30, 2018 is as follows: Thousands of Millions of yen U.S. dollars 2018 2018 Three months ended July 31, 2017 ¥ 2,120 $ 19,378 Six months ended October 31, 2017 4,418 40,383 Nine months ended January 31, 2018 7,931 72,495 Twelve months ended April 30, 2018 10,567 96,590
(4) Quarterly earnings per share for the year ended April 30, 2018 is as follows: Yen U.S. dollars 2018 2018 Three months ended July 31, 2017 ¥ 66.88 $ 0.61 Six months ended October 31, 2017 134.91 1.23 Nine months ended January 31, 2018 235.74 2.15 Twelve months ended April 30, 2018 310.08 2.83
(5) Quarterly earnings per share for each accounting period of the year ended April 30, 2018 is as
follows: Yen U.S. dollars 2018 2018 Three months ended July 31, 2017 ¥ 66.88 $ 0.61 Three months ended October 31, 2017 70.16 0.64 Three months ended January 31, 2018 104.40 0.95 Three months ended April 30, 2018 77.35 0.70

60 AIN HOLDINGS ANNUAL REPORT 2018
CORPORATE DATA(Fiscal 2018)
Corporate NameAIN HOLDINGS INC.
Head Office5-2-4-30, Higashisapporo, Shiroishi-ku, Sapporo, Hokkaido 003-0005, Japan
EstablishedAugust 1969
Paid-in Capital¥21,894 million
Number of EmployeesConsolidated: 6,498Non-consolidated: 139
Business LinesPlanning, management and operation of the corporate Group, focused on dispensing pharmacy and drugstore operation, generic drug wholesaling, sales of cosmetics, and the Group’s other businesses
STOCK INFORMATION(Fiscal 2018)
Transfer Agent Mizuho Trust & Banking Co., Ltd.
Stock ListingsFirst Section of the Tokyo Stock Exchange and Sapporo Securities Exchange
Securities Code Number9627
Fiscal Year May 1 to April 30 of the following year
Ordinary General Meeting of ShareholdersJuly
Date of RecordApril 30(The Company will announce other dates as and when required.)
Number of Shares Outstanding35,428,212 shares(including treasury stock)* The Company conducted a 2-for-1 stock split
of common shares with an effective date of October 1, 2014.
Number of Shareholders5,360
Major Shareholders (As of April 30, 2018)
Shareholders
Number of shares held (thousand
shares)
Share-holding ratio (%)
Kiichi Otani 3,238 9.14
Seven & i Holdings Co., Ltd. 2,750 7.76
Retirement Benefit Trust managed by Mizuho Trust & Banking Co., Ltd. (Marubeni Corporation account)*3; Trust & Custody Services Bank, Ltd. as a Trustee of Retrust
1,594 4.50
The Hokkaido Bank, Ltd. 1,472 4.15
MSIP CLIENT SECURITIES 1,391 3.93
GOLDMAN SACHS INTERNATIONAL 1,186 3.35
North Pacific Bank, LTD. 1,085 3.06
Japan Trustee Services Bank, Ltd. (Trust account) 965 2.73
The Master Trust Bank of Japan, Ltd. 820 2.32
STATE STREET BANK AND TRUST COMPANY 789 2.23
Notes: 1. Kiichi Otani, who was a major shareholder at the end of the previous fiscal year, is no longer a major shareholder as of the end of the fiscal year under review.
2. The figure excludes 180,688 shares of the treasury stock owned by the Company. 3. Shares held in the Retirement Benefit Trust managed by Mizuho Trust & Banking Co., Ltd. (Marubeni
Corporation account) are part of Marubeni Corporation’s retirement benefit trust. 4. All shares held in Japan Trustee Services Bank, Ltd. (Trust Account) are related to trust services.
Investor Information

ANNUAL REPORT 2018For the year ended April 30, 2018


![REMADE IN JAPAN - ANU Presspress-files.anu.edu.au/downloads/press/p13471/pdf/6_Yipu-HRC11.pdf · REMADE IN JAPAN: THE CASE OF AUDREY HEPBURN ZEN YIPU he face of Audrey Hepburn […]](https://img.pdfslide.us/doc/110x75/5f083eea7e708231d4210e63/remade-in-japan-anu-presspress-filesanueduaudownloadspressp13471pdf6yipu-hrc11pdf.jpg)