Embed Size (px)
Citation preview
Status Report 2019
EMISSIONS TRADING WORLDWIDE
International Carbon Action Partnership
Stat
us R
epor
t 201
9IC
AP
1
EMISSIONS TRADING WORLDWIDEInternational Carbon Action Partnership (ICAP) – Status Report 2019
EDITORIAL TEAMMarissa Santikarn, Stephanie La Hoz Theuer, Alexander Eden, Kai Kellner, Johannes Ackva, Constanze Haug, Lina Li, Martina Kehrer, Daria Ivleva, William Acworth.
CITE AS ICAP. (2019). Emissions Trading Worldwide: Status Report 2019. Berlin: ICAP.
The ICAP Secretariat expresses its gratitude to policymakers from the ICAP mem-bership and further collaborators from the emissions trading field, who provided insightful written contributions and/or carefully reviewed the report:
Botagoz Akhmetova (Kazakhstan), Marco Aurélio dos Santos Araujo (Brazil), Sabyr Assylbekov (Kazakhstan), Paul Baldauf (New Jersey), Bao Ji (China Emissions Exchange Guangzhou), Jean-Yves Benoit (Québec), Pierre Bouchard (Québec), Sebastián Carranza (Colombia), Chen Zhibin (Sinocarbon Innovation & Investment Co., Ltd.), Satoshi Chida (Tokyo Metropolitan Government), Claude Côté (Québec), Hugo Desrosiers (Québec), Damla Doğan (Turkey), Michael Dowd (Virginia), Bill Drumheller (Washington), Thomas Duchaine (Québec), Diane Gagnon (Québec), Gulmira Galiyeva (Kazakhstan), Nicolas Garceau (Québec), Dida Gardera (Indo-nesia), Ge Xing’an (China Shenzhen Emissions Exchange), Víctor Hugo Escalona Gómez (Mexico), Jason Gray (California), Chris Hoagland (Maryland), Jason Hol-lett (Nova Scotia), Huang Jinpeng (China Hubei Carbon Emissions Exchange), Jung-Hwan Kim (Republic of Korea), Seyeon Hwang (Republic of Korea), Christine Kirby (Massachusetts), Lai Han (Sinocarbon Innovation & Investment Co., Ltd.), Marat Latypov (Russia), Stéphane Legros (Québec), Li Qiang (Chongqing Low Car-bon Consulting), Li Jin (Shanghai Environment and Energy Exchange), Pongvipa Lohsomboon (Thailand), Huy Luong Quang (Vietnam), Colin McConnaha (Oregon), Michelle Miller (Nova Scotia), Lois New (New York), Shinichiro Niihara (Japan), Megan O’Toole (Vermont), Takuya Ozawa (Tokyo Metropolitan Government), Monique Page (New Zealand), Qian Guoqiang (Sinocarbon Innovation & Invest-ment Co., Ltd.), Kathleen Rich (Canada), Rajinder Sahota (California), Yumiko Sato (Tokyo Metropolitan Government), Christine Schell (New Jersey), Juan Pedro Searle (Chile), Tuba Seyyah (Turkey), Tomo Shoji (Japan), Mark Sippola (California), Wil-liam Space (Massachusetts), Su Yi-Yuan (National Chung Hsing University), Sumon Sumetchoengprachya (Thailand), Sophie Wenger (Switzerland), Ruben Vermeeren (European Commission), Nicolás Westenenk (Chile), Brittany White (Nova Scotia), Beatriz Yordi (European Commission), Olga Yukhymchuk (Ukraine) and Peter Zapfel (European Commission).
The ICAP Secretariat is grateful to the German Federal Ministry for Environment, Nature Conservation and Nuclear Safety (BMU) and to the Québec Ministry of the Environment and the Fight against Climate Change (MELCC) for funding this report.
A special thanks to Katrin Schambil, Tobias Bernstein, Katharina Vöhler, and Hans Zschüttig for editorial assistance.
←
2
Stat
us R
epor
t 201
9IC
AP
FOREWORD 04→ Beatriz Yordi and Rajinder Sahota, Co-Chairs, International Carbon Action Partnership
01 PRACTITIONER INSIGHTS 06CALIFORNIA AND QUÉBEC – CLIMATE COLLABORATION IN PRACTICE 07→ Rajinder Sahota, California Air Resources Board and Jean-Yves Benoit, Québec Ministry of the Environment andthe Fight against Climate Change
CHINA – LEARNING BY DOING: CHINA’S DYNAMIC APPROACH TO ETS 09→ Qian Guoqiang, Chen Zhibin, Lai Han - SinoCarbon
MEXICO – LESSONS FROM THE ETS DEVELOPMENT PROCESS 12→ Victor Escalona, Mexico's Ministry of Environment and Natural Resources
REPUBLIC OF KOREA – THE EVOLUTION OF KOREA’S CARBON MARKET: PHASE II AND BEYOND 15→ Kim Jung-Hwan, Ministry of Environment of the Republic of Korea
02 INFOGRAPHICS 17EMISSIONS TRADING WORLDWIDE 18
GLOBAL EXPANSION OF EMISSIONS TRADING 19
SECTOR COVERAGE 20
DIFFERENT SHAPES OF CAP-AND-TRADE 21
AUCTIONING REVENUE 22
GROWING STABILITY 23
03 DIVING INTO THE DETAILS 24EUROPE AND CENTRAL ASIAEuropean Union 26
Switzerland 31
Kazakhstan 34
Turkey 37
Russia 38
Ukraine 39
NORTH AMERICAWestern Climate Initiative 40
California 41
Québec 45
Canada 49
Nova Scotia 51
Regional Greenhouse Gas Initiative 55
New Jersey 59
Massachusetts 60
Virginia 63
TABLE OF CONTENTS
Stat
us R
epor
t 201
9IC
AP
3
New Mexico 64
Oregon 65
Transportation and Climate Initiative 66
Washington 67
LATIN AMERICA AND THE CARIBBEANBrazil 68
Chile 69
Mexico 70
Colombia 72
ASIA-PACIFICChina 73
Beijing 77
Chongqing 80
Fujian 83
Guangdong 86
Hubei 89
Shanghai 92
Shenzhen 95
Tianjin 98
Taiwan, China 100
New Zealand 101
Republic of Korea 105
Tokyo 110
Saitama 114
Indonesia 117
Japan 118
Thailand 119
Vietnam 120
04 ABOUT ICAP 121
NOTES ON METHODS AND SOURCES 125
LIST OF ACRONYMS 128
IMPRINT 130
04
Stat
us R
epor
t 201
9IC
AP
FOREWORD
Messages from the ICAP Co-Chairs
Over the past few years, key emissions trading systems (ETSs) worldwide have considered and
undergone sweeping policy reforms to get their sys-tems ready for the post-2020 era. As these market reforms start to kick in, we have started to see signifi-cant price effects, which can now be tracked with the new ICAP Allowance Price Explorer, available on our website. From a climate perspective and as noted in the most recent IPCC Special Report, reinforced car-bon price signals coupled with complementary poli-cies can support increased ambition, cost-effectively.
Although robust carbon prices are important drivers for low-carbon investment, the key determinant of the mitigation impact of an ETS is its cap trajectory, and how it compares to a business-as-usual path-way. Through the recent reforms, the world’s most experienced systems have legislated ambitious caps out to 2030 in line with their broader climate targets, providing a predictable planning horizon to covered businesses.
A key challenge when designing such ambitious cli-mate policy and delivering on the targets, is to ensure that the competitiveness of the covered industries is maintained and that carbon leakage is avoided. Here, recent reforms have also produced real progress, strik-ing a balance between steadily tightening caps and protecting those sectors genuinely at risk. Finally, to better arm markets against any unforeseen develop-ments, systems are also putting market stability mea-sures in place. Regardless of the approach adopted, these tools give businesses and investors more cer-tainty for future planning and investment decisions.
Despite these achievements, the challenges of com-petitiveness and market stability are at the core of all ETSs and they will remain with us for years to come. Over the past decade, ICAP has become one of the key fora for front-runner jurisdictions to compare notes and share lessons learned on these and other chal-lenges. In the coming year, we intend to step up our role as a platform where carbon market policymakers can meet each other and exchange views, making the most of the unique global mix of knowledge and expe-rience our members and observers combine.
We are delighted that Mexico, which may start its own national carbon market as early as 2020, has joined ICAP last year as an observer, and we look forward to continuing stimulating discussions in an ever expand-ing circle of peers pioneering and fine-tuning carbon markets as a key tool on the path towards deep decar-bonization.
←
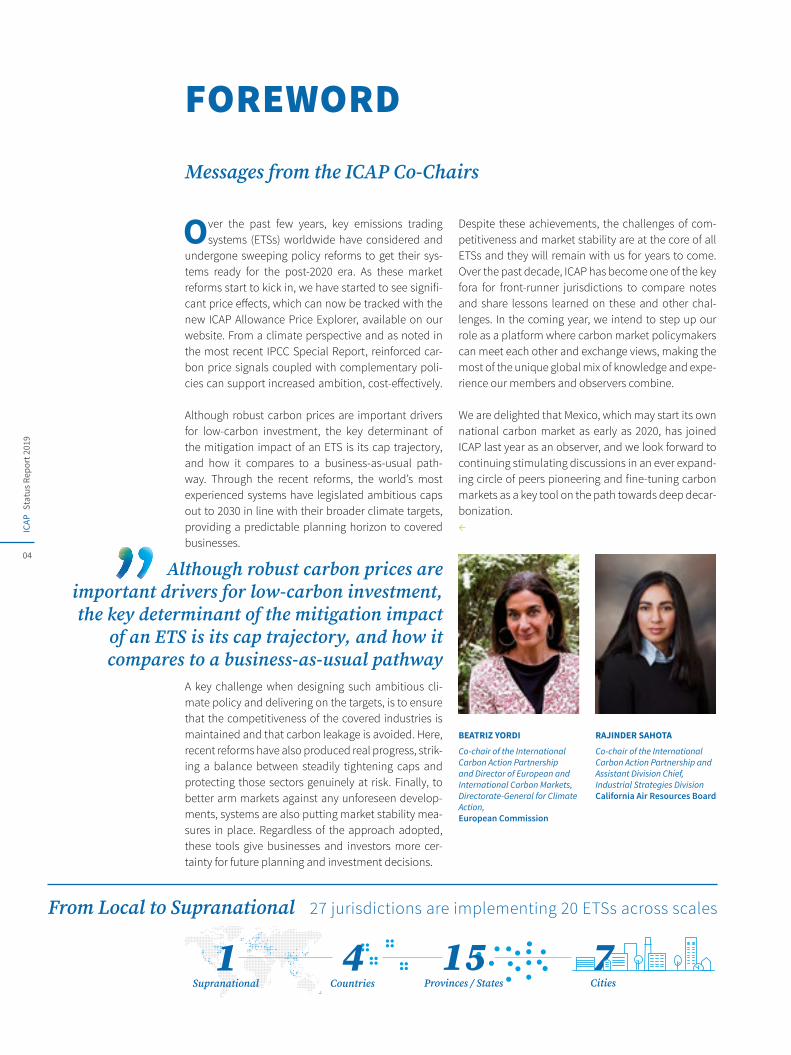
BEATRIZ YORDI
Co-chair of the International Carbon Action Partnership and Director of European and International Carbon Markets, Directorate-General for Climate Action, European Commission
RAJINDER SAHOTA
Co-chair of the International Carbon Action Partnership and Assistant Division Chief, Industrial Strategies DivisionCalifornia Air Resources Board
Although robust carbon prices are important drivers for low-carbon investment, the key determinant of the mitigation impact
of an ETS is its cap trajectory, and how it compares to a business-as-usual pathway
4Countries
1Supranational
From Local to Supranational 27 jurisdictions are implementing 20 ETSs across scales
7Cities
15Provinces / States
Stat
us R
epor
t 201
9IC
AP
05
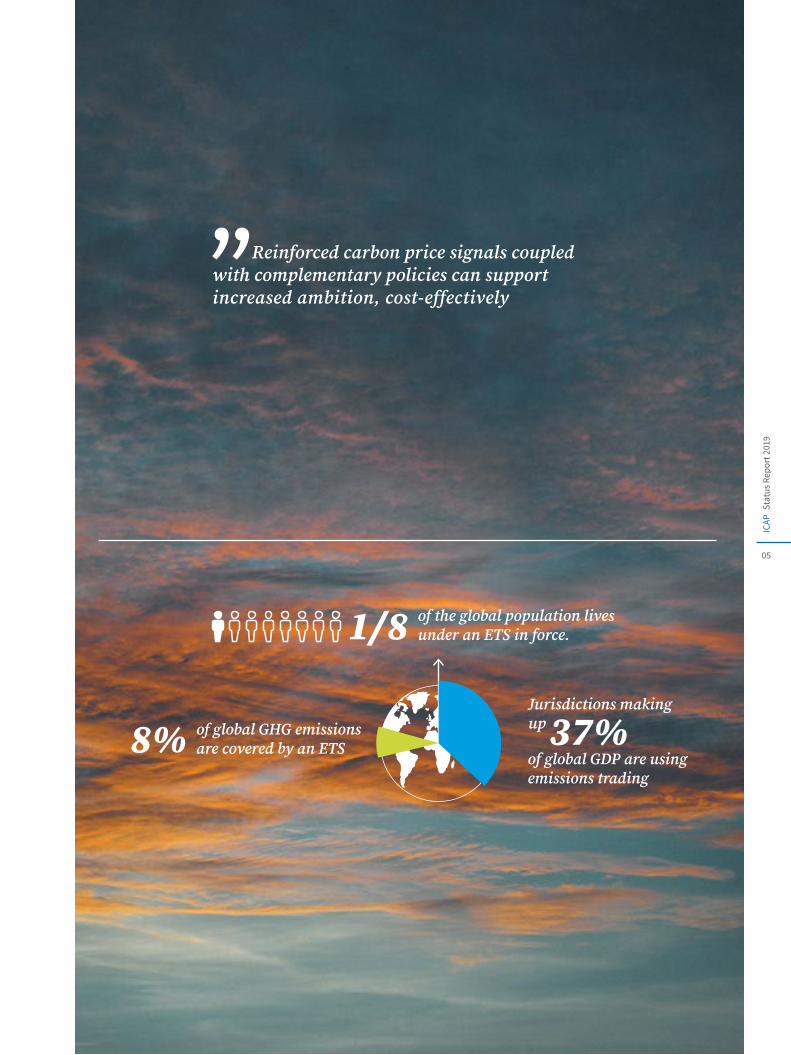
Reinforced carbon price signals coupled with complementary policies can support increased ambition, cost-effectively
Jurisdictions making up 37%of global GHG emissions
are covered by an ETS8% of global GDP are using emissions trading
of the global population lives under an ETS in force.1/8
Stat
us R
epor
t 201
9IC
AP
06
PRACTITIONER INSIGHTS
Designing Cap-and-Trade
01
With the scheduled start of China's national ETS, the share of emissions covered by carbon markets will jump to 14% in 2020
Stat
us R
epor
t 201
9IC
AP
07
PRAC
TITI
ON
ER IN
SIGH
TS01
An interview withCalifornia Air Resources Board
RAJINDER SAHOTA
Québec Ministry of the Environment and the Fight against Climate Change
JEAN-YVES BENOIT
CALIFORNIA AND QUÉBEC
Climate collaboration in practice
INTRODUCTIONWith just about 5,000 kilometers and a national boundary separating them, California and Québec operate the most geographically dispersed linkage between cap-and-trade programs. Under the joint heading of the Western Climate Initiative (WCI), these two climate-ambitious sub-nationals have been col-laborating for more than a decade. Their quest to col-lectively lower the costs of climate change mitigation has resulted in a stable yet flexible carbon market and an example of what the future of climate collaboration can look like.
The ICAP secretariat sat down with ICAP Co-Chair Rajinder Sahota of the California Air Resources Board, and former ICAP Co-Chair, Jean-Yves Benoit of the Ministry of the Environment and the Fight Against Climate Change in Québec, to discuss shared his-tory, challenges, opportunities, and prospects for the future.
HISTORYFounded in 2007 by a group of five western U.S. states, the WCI was formed with the mandate of taking a regional approach through market-based mecha-nisms to address climate change. Four Canadian provinces, Québec being one of them, were quick to join in 2008. Québec and California adopted cap-and-trade regulations in their legislatures and established individual programs by late 2012. As of January 1, 2014, they were officially linked and held their first joint auction later that year in November. At the start of 2018, Québec and California welcomed a third member to their linked market with the addition of Ontario. Despite a successful link, it was soon clear that political changes could undo their work. Several months after the tripartite linked market had begun, newly elected Ontario Premier Doug Ford, almost immediately upon inauguration, made the first defin-itive move of his incumbency the effective withdrawal of Ontario from the WCI linked market. The unilateral withdrawal forced Québec and California to react
swiftly. They undertook coordinated measures to miti-gate any potential market uncertainties, with the chal-lenge resulting in a public display of their unity, and a joint market that remained robust throughout. This ability to transform challenges into opportunities is a recurrent theme in their collective work.
CHALLENGES AND BENEFITS OF COLLABORATIONCalifornia and Québec have diverging economic pro-files with different abatement options across their jurisdictions. Electricity production might be the most notable difference, as Québec has basically no GHG emissions in this sector with its electricity production originating almost entirely from hydropower (approx-imately 99% of renewable electricity generation). Yet, it is a principle of cap-and-trade that a broad market with differing abatement opportunities leads to the greatest cost effectiveness. “We adopted an ambitious mitigation goal of 20% below 1990 levels by 2020. Linking with California allows us to achieve this with a smaller impact on our economy. In fact, between 1990 and 2016, our GHG emissions were reduced by 9% below 1990 levels while our economy grew by 62%”, Jean-Yves Benoit states. In this light, he sees their different economic profiles “more as an opportunity than as a challenge”.
One might also imagine that the different cultures, time zones, currencies and languages have made the collaboration difficult. Rajinder Sahota, however, “can’t think of any” major challenges. Both agree that it takes some time to learn and adjust. “There is an evo-lution, going from a standalone regulatory agency to the mindset of a partnership.” Looking back, Rajinder Sahota notes “with WCI we got a taste of what collabo-ration needs to look like. But it wasn’t until we started writing regulations in advance of the linked market with Québec that we began to realize what collabora-tion really meant”. Jean-Yves Benoit explains “It was a new way of thinking and doing things - something we had to learn.” Rajinder Sahota concludes “I’m happy to say that, over time, it becomes second nature to consider your partner in the other jurisdiction and to have that level of trust, openness and direct dialogue with folks in the other program.”
There is an evolution, going from a standalone regulatory agency to
the mindset of a partnership
Stat
us R
epor
t 201
9IC
APPR
ACTI
TIO
NER
INSI
GHTS
01
08
The experience has even brought benefits beyond managing the linked market. “I realized early on that the skills we learned in collaborating with Québec paid dividends in working with other state agencies within California. It actually helps us in finding solu-tions in other discussions and settings”, notes Rajinder Sahota.
WHAT TO EXPECT IN THE COMING YEARSIn 2017, California enacted legislation providing direc-tion and a clear role for their cap-and-trade program for the period extending through until 2030. Québec did the same by amending its cap-and-trade regula-tion for the post-2020 period and by setting its annu-ally declining cap through 2030. Not only is this a testament to the policy’s success, it reflects the wider success of the partnership between the WCI jurisdic-tions, a success that continues to inspire others to join the partnership.
However, welcoming new jurisdictions doesn’t come without its challenges, as was seen in this past year, where Ontario first joined and several months later dropped out. The experience nevertheless proved valuable. The onboarding process was highly suc-cessful, and has demonstrated that the joint market is ready for new partners to opt-in. The rapid withdrawal of Ontario became a real-world test of market resil-ience, and also provided useful lessons. Two factors were important here: the regulatory design of the mar-ket proved itself able to cope with such unanticipated events, and good communication networks enabled market participants to stay informed and reassured during the process. Jean-Yves Benoit reflects “the end result was that our market stayed extremely stable throughout the delinking process with Ontario.”
The experience has in no way deterred Québec and California from undertaking linking in the future. In fact, they are hoping to soon see another member join: Oregon, California’s neighbor to the north and long-time member of the WCI. The state is currently working out the details in their “Clean Energy Jobs Bill”, which makes clear mentions of the WCI design. While there are several potential linking partners on the horizon, both Jean-Yves Benoit and Rajinder Sahota see Oregon as being “the next jurisdiction ready to link with our program.”
Their cooperation is not limited to the prospects of linking – it extends to broader continental and inter-national forums such as the Carbon Pricing in the Americas (CPA) initiative, a framework committed to regional cooperation on carbon pricing across the
American continents. Jean-Yves Benoit considers “col-laboration amongst governments the key to fighting climate change.”
Does the WCI collaboration provide a model for other jurisdictions to follow? Both Rajinder Sahota and Jean-Yves Benoit “certainly hope so”. The WCI approach leaves jurisdictions ample room for indi-viduality in their respective ETS regulations, despite the harmonization resulting from the linking process. Jean-Yves Benoit recalls that when the WCI framework was originally designed, the eleven partners at the table were hugely different in terms of their economic and emissions profiles. “We were making all our deci-sions by consensus. This really forced us to come up with a design that was flexible and could accommo-date specific needs and circumstances”. This room for diversity in implementation expands the scope for potential partners, can provide better abatement opportunities and also provides a realistic approach to climate change cooperation in the current ‘bottom-up’ paradigm.
The climate challenge is political, in that it cannot be successfully overcome by isolated actions. If we are to have a chance to transition to a low-carbon world, we must learn to collaborate, cooperate and coordinate our efforts. In times when policies on the national level may appear to be lacking, the tried and tested partnership between California and Québec serves not only as a beacon of hope, but also perhaps provides a glimpse into the future of climate policy, where differences are seen as opportunities and the only defining factor is how we can most efficiently and effectively fight climate change.
←
The end result was that our market stayed extremely stable throughout the delinking process with Ontario
The relationship we build over time and that the team builds over time, really makes our joint program a success
Stat
us R
epor
t 201
9IC
AP
09
PRAC
TITI
ON
ER IN
SIGH
TS01
CHINA
Learning by doing: China’s dynamic approach to ETS
In 2018, China undertook a major governmental restructuring program, which has seen climate policy become part of a comprehensive national environ-mental strategy. Adopted in March 2018, the ‘Plan on Deepening the Reform of Party and State Institutions’ established a new Ministry of Ecology and Environ-ment (MEE), which integrates, unifies, and strengthens all environmental protection functions of the Chinese national government. The climate change depart-ment of the National Development and Reform Com-mission (NDRC) and the previous Ministry of Environ-ment Protection have been integrated under the MEE. This restructuring sends a strong message: climate policy is further consolidated with China’s domestic environmental protection strategy, and is a key ele-ment in China’s political vision to build an ecological civilization. According to Li Gao, head of the Climate Change Department, the new MEE combines stronger policy supervision capacity with enforcement author-ity, giving even greater weight to China’s climate change policy goals.
THE DEVELOPMENT OF THE NATIONAL ETS CONTINUES UNDER MEE After the restructuring, responsibility for the develop-ment of the Chinese national ETS now falls to MEE. On a number of occasions, MEE has reconfirmed the validity of the roadmap for establishing a national carbon market1 that was approved in late 2017 by the State Council, the highest executive branch of the Chinese government. Soon after the restructuring, MEE picked up the ongoing work on the national ETS, including historical data reporting and verification for 2016-2017; the design, construction, and roll-out of the trading and registry platforms; and the establish-ment of an expert working group to prepare the allow-ance allocation plan for simulation trading. Improving the regulatory and administrative framework of the national ETS is another priority; in particular, devel-oping the “Interim Regulation on Carbon Emissions Trading,” which will constitute the primary legal basis of the national carbon market. Although the NDRC has previously prepared the draft regulation, it now needs
to be endorsed by the newly restructured Ministry of Justice and finally approved by the State Council.
It is encouraging that the development of the national carbon market is continuing as planned under MEE. However, the restructuring is not without challenges. With eight years of studying, planning, and experi-menting with carbon market design and implemen-tation, the NDRC and its provincial affiliates have established an experienced personnel pool. While all officials have been transferred to MEE from NDRC at the national level, local level restructuring is still underway. As provincial and city level environment agencies will also play a critical role in the operation of the national carbon market, capacity gaps at these lev-els need to be properly addressed in a timely manner.
ETS PILOTS CONTINUE TO GENERATE VALUABLE LESSONSSince June 2013, seven Chinese ETS pilots, as well as the Fujian regional ETS, have entered operation. During this period, the regional ETS pilots already have demonstrated their great value in providing lessons and experiences for the national ETS. In managing the regional pilot markets, the regulating authorities have continuously sought to improve their policies and maintain active markets.
(1) HIGH LEVEL OF COMPLIANCE ACHIEVED IN THE PILOT SYSTEMSBack in 2013, compliance was not ideal. Most pilots experienced delays in compliance and levels were not as high as they could be. This was mainly because covered entities were either unprepared or unaware of their compliance obligations. The relatively weak penalty resulting from the pilots’ low-level regional authority was another factor. However, the situation improved under the active supervision and support of the pilot authorities and exchanges. By 2016, most pilots completed their compliance obligations on time and since have continued to achieve high com-pliance rates.
1 - The “Work Plan for Construction of the National Emissions Trading System (Power Sector)” mandates three phases of implementation: (1) the infrastructure completion phase, (2) the simulation trading phase, and (3) the deepening and expanding phase.
SinoCarbon
QIAN GUOQIANG, CHEN ZHIBIN, LAI HAN
Stat
us R
epor
t 201
9IC
AP
10
PRAC
TITI
ON
ER IN
SIGH
TS01
China
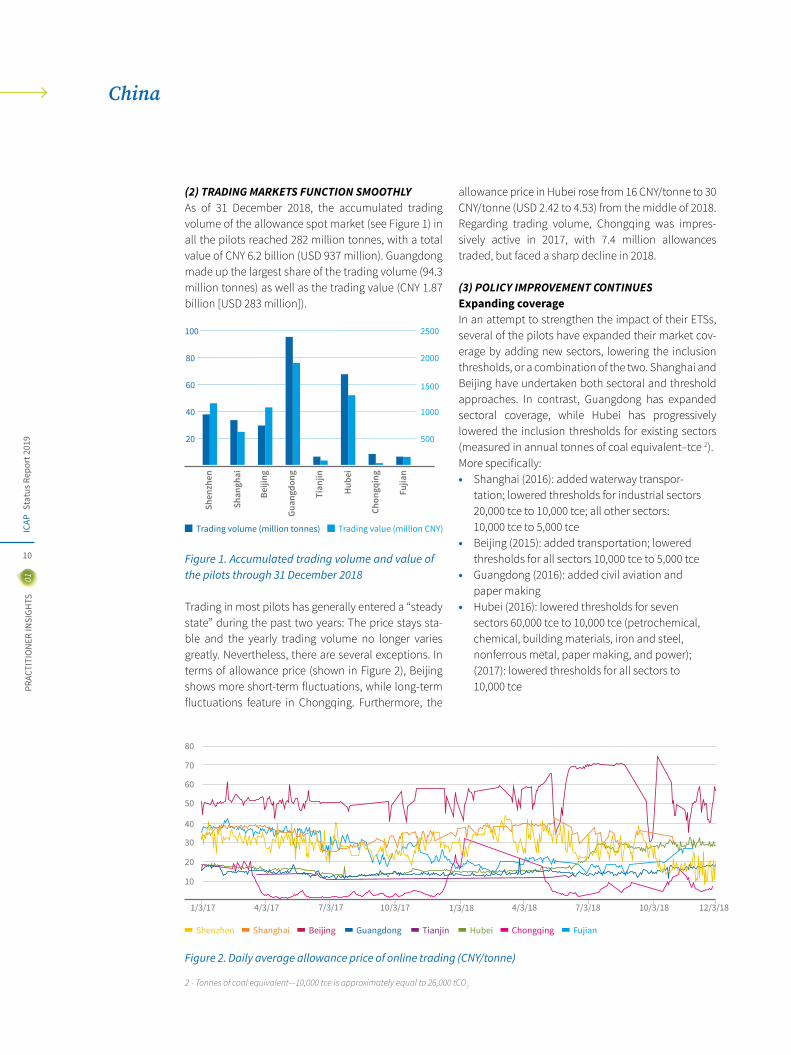
(2) TRADING MARKETS FUNCTION SMOOTHLYAs of 31 December 2018, the accumulated trading volume of the allowance spot market (see Figure 1) in all the pilots reached 282 million tonnes, with a total value of CNY 6.2 billion (USD 937 million). Guangdong made up the largest share of the trading volume (94.3 million tonnes) as well as the trading value (CNY 1.87 billion [USD 283 million]).
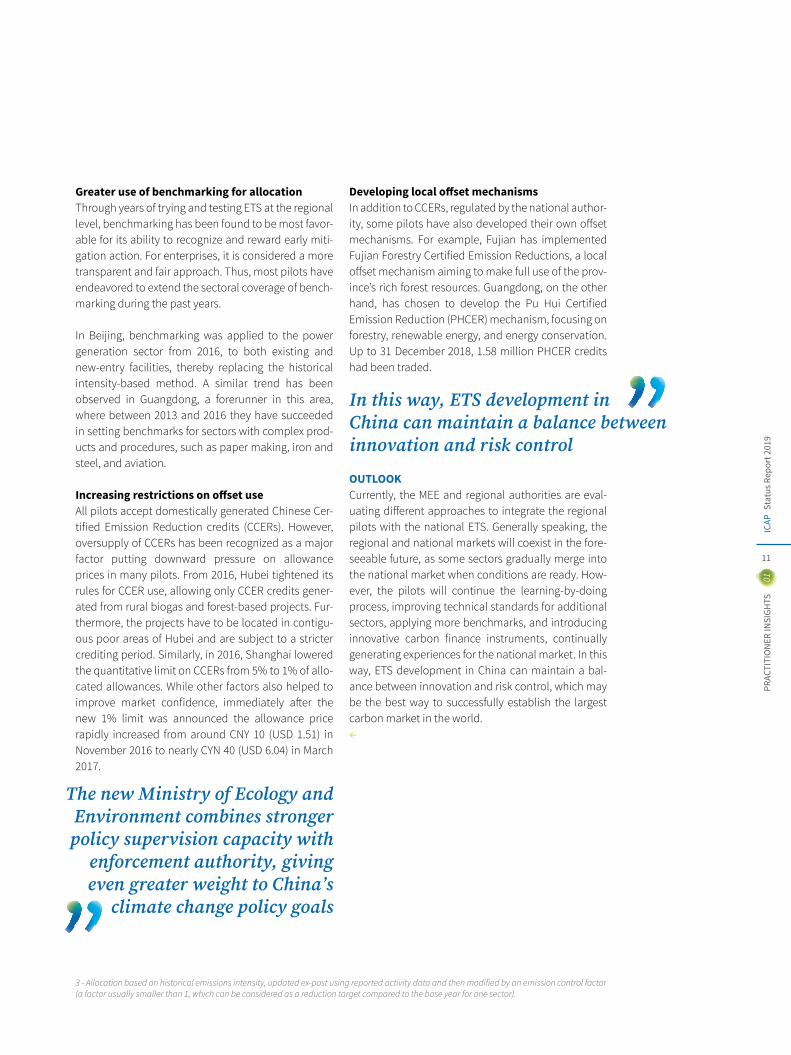
Trading in most pilots has generally entered a “steady state” during the past two years: The price stays sta-ble and the yearly trading volume no longer varies greatly. Nevertheless, there are several exceptions. In terms of allowance price (shown in Figure 2), Beijing shows more short-term fluctuations, while long-term fluctuations feature in Chongqing. Furthermore, the
allowance price in Hubei rose from 16 CNY/tonne to 30 CNY/tonne (USD 2.42 to 4.53) from the middle of 2018. Regarding trading volume, Chongqing was impres-sively active in 2017, with 7.4 million allowances traded, but faced a sharp decline in 2018.
(3) POLICY IMPROVEMENT CONTINUESExpanding coverageIn an attempt to strengthen the impact of their ETSs, several of the pilots have expanded their market cov-erage by adding new sectors, lowering the inclusion thresholds, or a combination of the two. Shanghai and Beijing have undertaken both sectoral and threshold approaches. In contrast, Guangdong has expanded sectoral coverage, while Hubei has progressively lowered the inclusion thresholds for existing sectors (measured in annual tonnes of coal equivalent–tce 2). More specifically:• Shanghai (2016): added waterway transpor- tation; lowered thresholds for industrial sectors 20,000 tce to 10,000 tce; all other sectors: 10,000 tce to 5,000 tce• Beijing (2015): added transportation; lowered thresholds for all sectors 10,000 tce to 5,000 tce• Guangdong (2016): added civil aviation and paper making• Hubei (2016): lowered thresholds for seven sectors 60,000 tce to 10,000 tce (petrochemical, chemical, building materials, iron and steel, nonferrous metal, paper making, and power); (2017): lowered thresholds for all sectors to 10,000 tce
2 - Tonnes of coal equivalent—10,000 tce is approximately equal to 26,000 tCO2
20 500
1000
2000
2500
1500
40
60
80
100
Trading volume (million tonnes) Trading value (million CNY)
Shen
zhen
Beiji
ng
Guan
gdon
g
Tian
jin
Hub
ei
Chon
gqin
g
Fujia
n
Shan
ghai
Figure 1. Accumulated trading volume and value of the pilots through 31 December 2018
Figure 2. Daily average allowance price of online trading (CNY/tonne)
Shenzhen Beijing HubeiShanghai Guangdong ChongqingTianjin Fujian
10
1/3/17 12/3/181/3/187/3/17 7/3/18
20
30
40
80
50
60
70
4/3/17 10/3/17 4/3/18 10/3/18
Stat
us R
epor
t 201
9IC
APPR
ACTI
TIO
NER
INSI
GHTS
01
11
In this way, ETS development in China can maintain a balance between innovation and risk control
3 - Allocation based on historical emissions intensity, updated ex-post using reported activity data and then modified by an emission control factor (a factor usually smaller than 1, which can be considered as a reduction target compared to the base year for one sector).
Greater use of benchmarking for allocationThrough years of trying and testing ETS at the regional level, benchmarking has been found to be most favor-able for its ability to recognize and reward early miti-gation action. For enterprises, it is considered a more transparent and fair approach. Thus, most pilots have endeavored to extend the sectoral coverage of bench-marking during the past years.
In Beijing, benchmarking was applied to the power generation sector from 2016, to both existing and new-entry facilities, thereby replacing the historical intensity-based method. A similar trend has been observed in Guangdong, a forerunner in this area, where between 2013 and 2016 they have succeeded in setting benchmarks for sectors with complex prod-ucts and procedures, such as paper making, iron and steel, and aviation.
Increasing restrictions on offset useAll pilots accept domestically generated Chinese Cer-tified Emission Reduction credits (CCERs). However, oversupply of CCERs has been recognized as a major factor putting downward pressure on allowance prices in many pilots. From 2016, Hubei tightened its rules for CCER use, allowing only CCER credits gener-ated from rural biogas and forest-based projects. Fur-thermore, the projects have to be located in contigu-ous poor areas of Hubei and are subject to a stricter crediting period. Similarly, in 2016, Shanghai lowered the quantitative limit on CCERs from 5% to 1% of allo-cated allowances. While other factors also helped to improve market confidence, immediately after the new 1% limit was announced the allowance price rapidly increased from around CNY 10 (USD 1.51) in November 2016 to nearly CYN 40 (USD 6.04) in March 2017.
Developing local offset mechanismsIn addition to CCERs, regulated by the national author-ity, some pilots have also developed their own offset mechanisms. For example, Fujian has implemented Fujian Forestry Certified Emission Reductions, a local offset mechanism aiming to make full use of the prov-ince’s rich forest resources. Guangdong, on the other hand, has chosen to develop the Pu Hui Certified Emission Reduction (PHCER) mechanism, focusing on forestry, renewable energy, and energy conservation. Up to 31 December 2018, 1.58 million PHCER credits had been traded.
OUTLOOKCurrently, the MEE and regional authorities are eval-uating different approaches to integrate the regional pilots with the national ETS. Generally speaking, the regional and national markets will coexist in the fore-seeable future, as some sectors gradually merge into the national market when conditions are ready. How-ever, the pilots will continue the learning-by-doing process, improving technical standards for additional sectors, applying more benchmarks, and introducing innovative carbon finance instruments, continually generating experiences for the national market. In this way, ETS development in China can maintain a bal-ance between innovation and risk control, which may be the best way to successfully establish the largest carbon market in the world.
←
The new Ministry of Ecology and Environment combines stronger policy supervision capacity with
enforcement authority, giving even greater weight to China’s
climate change policy goals
Stat
us R
epor
t 201
9IC
AP
12
PRAC
TITI
ON
ER IN
SIGH
TS01
MEXICO
Lessons from the ETS development process
For over three years, Mexico has been working on developing a national ETS as a tool to help stakehold-ers reduce emissions, and for the country to reach its mitigation targets. By the end of 2018, the Ministry of Environment and Natural Resources (SEMARNAT) had finalized the draft regulation for the pilot phase of Mexico’s national ETS. This article outlines the tasks accomplished and lessons learned at each step, while reflecting on the political, legal, and technical chal-lenges.
BACKGROUNDThe first and most important step towards develop-ing a carbon pricing policy in Mexico was the publi-cation of the ‘General Law on Climate Change’ (LGCC) in 2012. It established the basis for climate policy in Mexico, including the guidelines for developing plan-ning instruments and provisions for mitigation and adaptation strategies and activities.
Also fundamental to the development of Mexico’s ETS was the creation of the National Emissions Register (RENE), a greenhouse gas reporting system for facil-ities and companies. The regulation for RENE was published in October 2014, with provisions for moni-toring, reporting, and verification (MRV). So far, facil-ities have submitted individual reports for four years (2014-2017).
Despite the milestone achieved by having the LGCC legislation in place, the 2012 legal framework did not go as far as requiring that an ETS be implemented in the country: Article 94 of the 2012 LGCC stated that SEMARNAT could establish a voluntary ETS. Neverthe-less, in 2015 SEMARNAT started an initial assessment of the feasibility of a mandatory system, alongside the identification of legal and technical requirements.
PLANNING: PAVING THE WAY FOR AN ETSIn the lead-up to the design of Mexico’s ETS regulation, several steps were taken to prepare the way. Guide-lines for verifying MRV data were developed, the reg-ulatory landscape was formally assessed, and a pro-cess for engaging key stakeholders was initiated.
For the RENE verification process, SEMARNAT had to develop guidelines for the reporting entities and accredited verifiers. As a result, the Verification Stan-dard for RENE reporting was drafted. It is based on ISO 14064 and ISO 14065 with program-specific require-ments. This standard will be published in 2019, after many months of consultation, but it was in 2016 when the first draft was commissioned and completed.
In 2016, the planning for the ETS was initiated with a formal legal analysis of the regulatory framework. A Clean Energy Certificates program for power con-sumers had been legislated already in 2013. Moreover, a carbon tax on some fossil fuels had been imple-mented in 2014. It was therefore essential to evalu-ate the compatibility of these policies and develop options for an effective carbon pricing policy mix in Mexico that could deliver positive results while avoid-ing overregulation.
Early on in the planning process, a dialogue was started with private sector stakeholders, to listen to their concerns and questions firsthand. This effort represented a major innovation in how public poli-cies are decided in Mexico and it soon proved to be of enormous value, not only for the planning process, but also for the next stage, which included legislative amendments and the formal consultation process.
In parallel, with the support of the Partnership for Market Readiness (PMR), SEMARNAT announced the implementation of an ETS Simulation Exercise, which took place in 2017-2018. The simulation exercise was the first of its kind in Latin America, bringing together more than 100 companies from a wide variety of energy and industry sectors.
Mexico’s Ministry of Environ-ment and Natural Resources (SEMARNAT)VICTOR ESCALONA
The dialogue with private sector stakeholders represented a major innovation in how public policies are decided in Mexico
and it soon proved to be of enormous value
Stat
us R
epor
t 201
9IC
APPR
ACTI
TIO
NER
INSI
GHTS
01
13
Both of these stakeholder engagement activities opened the door for more direct and technically focused exchanges with private sector representa-tives—an opportunity that eventually led to the estab-lishment of a formal Working Group.
LEGAL AMENDMENTS: PROVIDING CERTAINTYIn 2017, proposed amendments to the LGCC were introduced in Congress. The amendments addressed issues regarding harmonization with the Paris Agree-ment and Mexico’s Nationally Determined Contribu-tion, but importantly they also strengthened Article 94, thus providing the regulatory framework for a mandatory ETS. Finally, in April 2018, the amend-ments gained Senate approval. Congress thereby gave SEMARNAT the mandate to launch an ETS, under two conditions: (i) there should be a three-year pilot phase prior to full implementation; and (ii), the pilot phase should not lead to any negative economic impacts for the participating sectors1.
DESIGNING THE NATIONAL ETSWith the legal basis in place, SEMARNAT and private sector stakeholders launched a Working Group with the objective of conducting a formal consultation pro-cess on the design of the national ETS pilot program. To aid the progression of the work plan, the group decided to use the ETS Handbook (published by ICAP and PMR2) as its main guideline.
Through this engagement, the government and pri-vate sector were able to constructively discuss their interests during the drafting process. The Working Group helped considerably in finding common ground on what are usually divergent positions, and the pro-cess placed the ETS as a politically feasible option for GHG mitigation in Mexico. The Working Group proved to be such an important format that it was integrated into the draft regulation through the creation of a Con-sultative Committee. We have learned an important lesson from the process, something we can recom-mend to any authority that is planning an ETS – this kind of stakeholder dialogue is fundamentally helpful in securing the adoption of climate policies.
To support the design of the pilot program and to pro-vide an analytical basis for drafting the regulation, sev-eral studies were commissioned with the help of the German Agency for International Cooperation. The four key studies are:
• Achieving the Mexican Mitigation Targets: Opti- ons for an Effective Carbon Pricing Policy Mix3
• Emissions Trading in Mexico: Analysis of Carbon Leakage Risks4
• Designing an Emissions Trading System in Mexico: Options for Setting an Emissions Cap5 • Clean Energy Certificates and Emissions Trading in Mexico: Reciprocal Effects and Interactions6
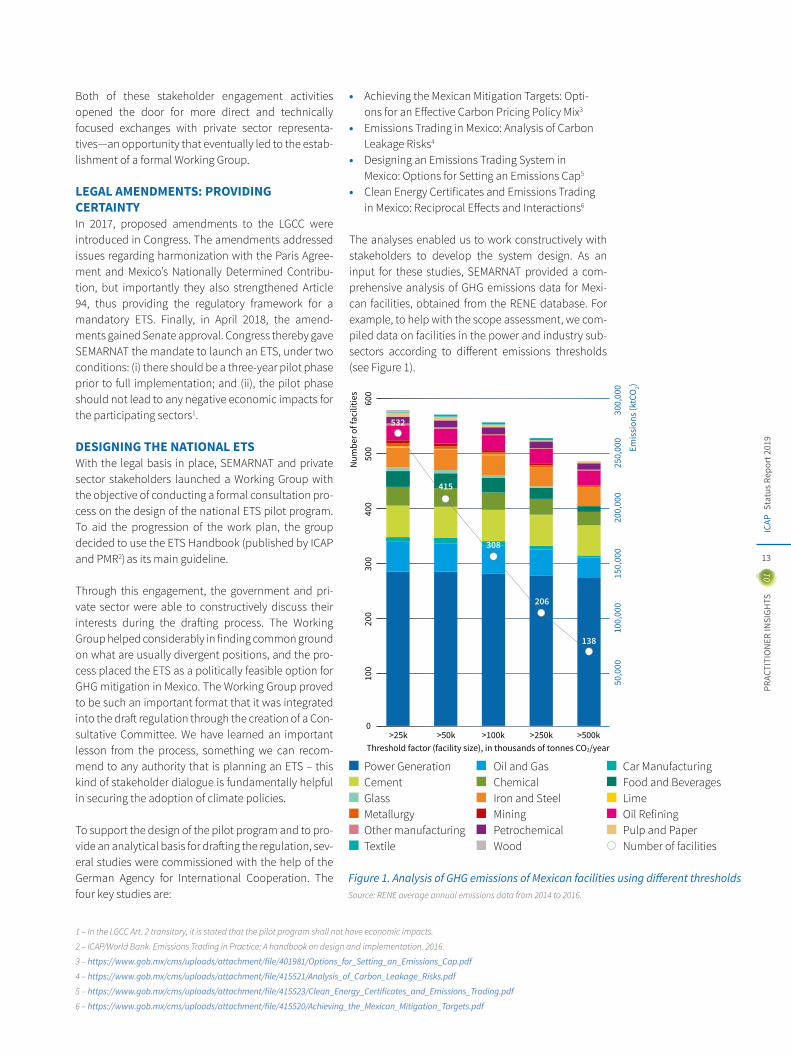
The analyses enabled us to work constructively with stakeholders to develop the system design. As an input for these studies, SEMARNAT provided a com-prehensive analysis of GHG emissions data for Mexi-can facilities, obtained from the RENE database. For example, to help with the scope assessment, we com-piled data on facilities in the power and industry sub-sectors according to different emissions thresholds (see Figure 1).
1 – In the LGCC Art. 2 transitory, it is stated that the pilot program shall not have economic impacts.
2 – ICAP/World Bank. Emissions Trading in Practice: A handbook on design and implementation. 2016.
3 – https://www.gob.mx/cms/uploads/attachment/file/401981/Options_for_Setting_an_Emissions_Cap.pdf
4 – https://www.gob.mx/cms/uploads/attachment/file/415521/Analysis_of_Carbon_Leakage_Risks.pdf
5 – https://www.gob.mx/cms/uploads/attachment/file/415523/Clean_Energy_Certificates_and_Emissions_Trading.pdf
6 – https://www.gob.mx/cms/uploads/attachment/file/415520/Achieving_the_Mexican_Mitigation_Targets.pdf
Power GenerationCementGlassMetallurgyOther manufacturingTextile
Oil and GasChemicalIron and SteelMiningPetrochemicalWood
Car ManufacturingFood and BeveragesLimeOil RefiningPulp and PaperNumber of facilities
Source: RENE average annual emissions data from 2014 to 2016.
0
100
50,0
0010
0,00
015
0,00
020
0,00
025
0,00
030
0,00
0
200
300
400
500
600
Num
ber o
f fac
ilitie
s
Threshold factor (facility size), in thousands of tonnes CO2/year
Emis
sion
s (kt
CO2)
Figure 1. Analysis of GHG emissions of Mexican facilities using different thresholds
>25k >50k >100k >250k >500k
138
206
308
415
532
Stat
us R
epor
t 201
9IC
APPR
ACTI
TIO
NER
INSI
GHTS
01
14
Mexico
Based on this analysis, the participation threshold of >100,000 tCO2/year was chosen for the pilot phase, as it results in an optimal number of participants compared to the overall emissions coverage. At this threshold, the pilot will cover the 308 entities respon-sible for more than 96% of sectoral emissions and approximately 45% of national emissions.
Grandparenting was the logical choice for alloca-tion, first because the historical GHG emissions data from RENE is currently the most reliable, and second, because 100% free allocation allows us to comply with the LGCC provisions mandating that the pilot program should not have economic impacts.
The draft regulation with all the provisions needed for the pilot program awaits public consultation before the government can adopt it and officially initiate the monitoring period. Consultation is scheduled for early this year, and according to the LGCC, the regulation must be published by April 2019 at the latest.
CHALLENGES AHEADThe government will encounter several challenges before and during the pilot program implementation. The first is the renewed public consultation on pilot program regulation, a time-consuming but necessary step to comply with national transparency regula-tions. Key infrastructure also needs to be finished. In particular, a registry should be operational before or soon after the monitoring period starts for the partic-ipants to be able to receive their allowances. Discus-sions on cap-setting and allocation are also under-way, and need to be completed before the pilot phase can begin.
During the pilot phase, SEMARNAT will begin develop-ing the offset program, which will assist participants in lowering compliance costs and could also promote further emissions reductions outside of the scope of the ETS. Auctions are also mentioned in the draft reg-ulation, though demand is not expected during the pilot phase due to the high level of free allocation. As with the offset program, developing an auctioning mechanism will be undertaken during the pilot phase, to be ready at the start of the next phase.
Improving data collection is also a challenge, partic-ularly if allocation benchmarks are to be established in the future. Planned adjustments to the RENE reg-ulation should result in more complete and accurate data, and lessons from the pilot phase will also be incorporated.
The regulation should also be accompanied by strong enforcement mechanisms and sanctions. Mexico’s legal framework mandates that sanctions should be specified in law, rather than secondary regulation. Therefore, the transition to a fully functional ETS in Mexico will require further amendments to the LGCC outlining the enforcement provisions.
Despite these challenges, the hard work and progress made during the past years proves Mexico is taking solid and convincing steps to enhance carbon pric-ing policy implementation, joining China in a new generation of countries implementing a national ETS. This effort is part of Mexico’s commitment to reach the Paris Agreement goals, while also providing an important basis for the adoption of more ambitious national mitigation targets in the future.
←
The hard work and progress made during the past years proves Mexico is taking solid and convincing steps to enhance carbon pricing policy implementation
Stat
us R
epor
t 201
9IC
AP
15
PRAC
TITI
ON
ER IN
SIGH
TS01
REPUBLIC OF KOREA
The evolution of Korea’s carbon market: Phase II and beyond
The IPCC Special Report released in October 2018 outlines the difference in impact that limiting global warming to 1.5°C as opposed to 2°C would have on marine biodiversity, fisheries, and ecosystems. Based on current projections, the report predicts that global warming is likely to reach 1.5°C between 2030 and 2052 and if we are to have any chance of limit-ing warming to 1.5°C we would need emissions to be net zero by 2050. In order to deal with climate change while simultaneously minimizing negative impacts on economic growth, many countries have turned to carbon pricing mechanisms to deliver efficient and effective emissions reductions. Korea launched its Emissions Trading Scheme (the KETS) in 2015, and in 2018 Phase II started alongside a revision of Korea’s 2030 GHG reduction roadmap.
This article outlines the key features of the KETS and provides an overview and operational performance review of Phase I. The major changes in Phase II are then discussed as well as plans for the future of the system.
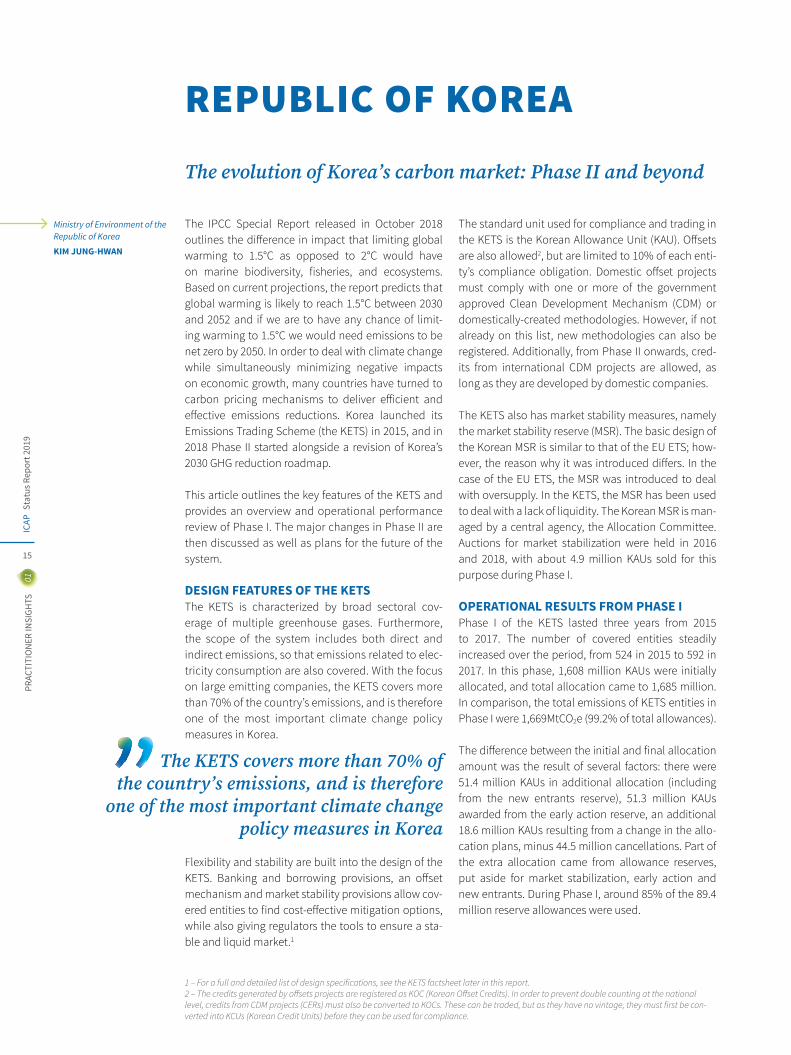
DESIGN FEATURES OF THE KETS The KETS is characterized by broad sectoral cov-erage of multiple greenhouse gases. Furthermore, the scope of the system includes both direct and indirect emissions, so that emissions related to elec-tricity consumption are also covered. With the focus on large emitting companies, the KETS covers more than 70% of the country’s emissions, and is therefore one of the most important climate change policy measures in Korea.
Flexibility and stability are built into the design of the KETS. Banking and borrowing provisions, an offset mechanism and market stability provisions allow cov-ered entities to find cost-effective mitigation options, while also giving regulators the tools to ensure a sta-ble and liquid market.1
The standard unit used for compliance and trading in the KETS is the Korean Allowance Unit (KAU). Offsets are also allowed2, but are limited to 10% of each enti-ty’s compliance obligation. Domestic offset projects must comply with one or more of the government approved Clean Development Mechanism (CDM) or domestically-created methodologies. However, if not already on this list, new methodologies can also be registered. Additionally, from Phase II onwards, cred-its from international CDM projects are allowed, as long as they are developed by domestic companies.
The KETS also has market stability measures, namely the market stability reserve (MSR). The basic design of the Korean MSR is similar to that of the EU ETS; how-ever, the reason why it was introduced differs. In the case of the EU ETS, the MSR was introduced to deal with oversupply. In the KETS, the MSR has been used to deal with a lack of liquidity. The Korean MSR is man-aged by a central agency, the Allocation Committee. Auctions for market stabilization were held in 2016 and 2018, with about 4.9 million KAUs sold for this purpose during Phase I.
OPERATIONAL RESULTS FROM PHASE IPhase I of the KETS lasted three years from 2015 to 2017. The number of covered entities steadily increased over the period, from 524 in 2015 to 592 in 2017. In this phase, 1,608 million KAUs were initially allocated, and total allocation came to 1,685 million. In comparison, the total emissions of KETS entities in Phase I were 1,669MtCO2e (99.2% of total allowances).
The difference between the initial and final allocation amount was the result of several factors: there were 51.4 million KAUs in additional allocation (including from the new entrants reserve), 51.3 million KAUs awarded from the early action reserve, an additional 18.6 million KAUs resulting from a change in the allo-cation plans, minus 44.5 million cancellations. Part of the extra allocation came from allowance reserves, put aside for market stabilization, early action and new entrants. During Phase I, around 85% of the 89.4 million reserve allowances were used.
1 – For a full and detailed list of design specifications, see the KETS factsheet later in this report. 2 – The credits generated by offsets projects are registered as KOC (Korean Offset Credits). In order to prevent double counting at the national level, credits from CDM projects (CERs) must also be converted to KOCs. These can be traded, but as they have no vintage, they must first be con-verted into KCUs (Korean Credit Units) before they can be used for compliance.
Ministry of Environment of the Republic of Korea
KIM JUNG-HWAN
The KETS covers more than 70% of the country’s emissions, and is therefore
one of the most important climate change policy measures in Korea
Stat
us R
epor
t 201
9IC
APPR
ACTI
TIO
NER
INSI
GHTS
01
16
The offset mechanism was successfully established in Phase I. A total of 252 methodologies are registered, including 211 CDM methodologies, and 139 projects were approved. Of these projects, 90 were developed with CDM methodologies and 49 with domestic meth-odologies. The largest numbers of projects were in renewable energy (47) followed by N2O reduction (24), fuel conversion (22), waste heat recovery (17), landfill gas utilization (10), SF6 reduction (10) and other proj-ects (9). A total of 22.4 MtCO2e3 were accredited from 82 projects, with N2O reduction, landfill gas and SF6 reduc-tion projects producing the majority of credits. Of these accredited units, 15.3 MtCO2e (or 68.5%) were converted into KCUs and used for compliance.
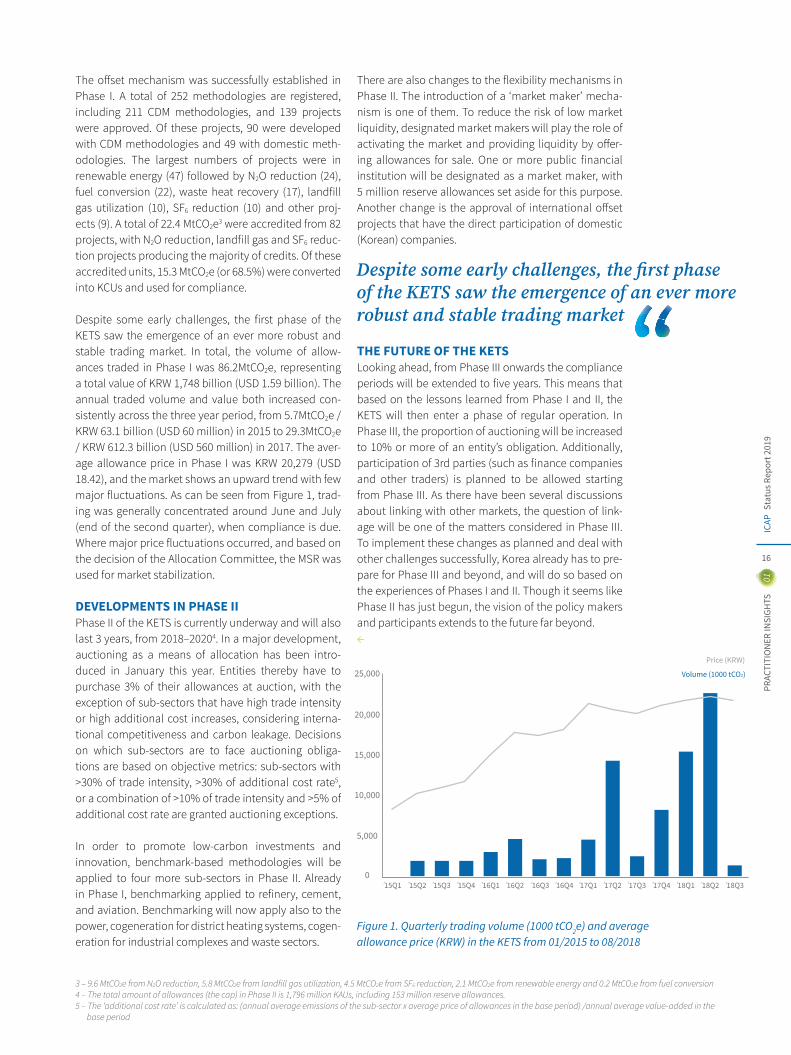
Despite some early challenges, the first phase of the KETS saw the emergence of an ever more robust and stable trading market. In total, the volume of allow-ances traded in Phase I was 86.2MtCO2e, representing a total value of KRW 1,748 billion (USD 1.59 billion). The annual traded volume and value both increased con-sistently across the three year period, from 5.7MtCO2e / KRW 63.1 billion (USD 60 million) in 2015 to 29.3MtCO2e / KRW 612.3 billion (USD 560 million) in 2017. The aver-age allowance price in Phase I was KRW 20,279 (USD 18.42), and the market shows an upward trend with few major fluctuations. As can be seen from Figure 1, trad-ing was generally concentrated around June and July (end of the second quarter), when compliance is due. Where major price fluctuations occurred, and based on the decision of the Allocation Committee, the MSR was used for market stabilization.
DEVELOPMENTS IN PHASE IIPhase II of the KETS is currently underway and will also last 3 years, from 2018–20204. In a major development, auctioning as a means of allocation has been intro-duced in January this year. Entities thereby have to purchase 3% of their allowances at auction, with the exception of sub-sectors that have high trade intensity or high additional cost increases, considering interna-tional competitiveness and carbon leakage. Decisions on which sub-sectors are to face auctioning obliga-tions are based on objective metrics: sub-sectors with >30% of trade intensity, >30% of additional cost rate5, or a combination of >10% of trade intensity and >5% of additional cost rate are granted auctioning exceptions.
In order to promote low-carbon investments and innovation, benchmark-based methodologies will be applied to four more sub-sectors in Phase II. Already in Phase I, benchmarking applied to refinery, cement, and aviation. Benchmarking will now apply also to the power, cogeneration for district heating systems, cogen-eration for industrial complexes and waste sectors.
There are also changes to the flexibility mechanisms in Phase II. The introduction of a ‘market maker’ mecha-nism is one of them. To reduce the risk of low market liquidity, designated market makers will play the role of activating the market and providing liquidity by offer-ing allowances for sale. One or more public financial institution will be designated as a market maker, with 5 million reserve allowances set aside for this purpose. Another change is the approval of international offset projects that have the direct participation of domestic (Korean) companies.
THE FUTURE OF THE KETSLooking ahead, from Phase III onwards the compliance periods will be extended to five years. This means that based on the lessons learned from Phase I and II, the KETS will then enter a phase of regular operation. In Phase III, the proportion of auctioning will be increased to 10% or more of an entity’s obligation. Additionally, participation of 3rd parties (such as finance companies and other traders) is planned to be allowed starting from Phase III. As there have been several discussions about linking with other markets, the question of link-age will be one of the matters considered in Phase III. To implement these changes as planned and deal with other challenges successfully, Korea already has to pre-pare for Phase III and beyond, and will do so based on the experiences of Phases I and II. Though it seems like Phase II has just begun, the vision of the policy makers and participants extends to the future far beyond.
←
Despite some early challenges, the first phase of the KETS saw the emergence of an ever more robust and stable trading market
3 – 9.6 MtCO2e from N2O reduction, 5.8 MtCO2e from landfill gas utilization, 4.5 MtCO2e from SF6 reduction, 2.1 MtCO2e from renewable energy and 0.2 MtCO2e from fuel conversion 4 – The total amount of allowances (the cap) in Phase II is 1,796 million KAUs, including 153 million reserve allowances. 5 – The ‘additional cost rate’ is calculated as: (annual average emissions of the sub-sector x average price of allowances in the base period) /annual average value-added in the base period
Figure 1. Quarterly trading volume (1000 tCO2e) and average allowance price (KRW) in the KETS from 01/2015 to 08/2018
25,000
20,000
15,000
10,000
5,000
01́5Q21́5Q1 1́5Q3 1́5Q4 1́6Q1 1́7Q1 1́8Q1 1́8Q2 1́8Q31́7Q2 1́7Q3 1́7Q4
Price (KRW)
Volume (1000 tCO2)
1́6Q2 1́6Q3 1́6Q4
Stat
us R
epor
t 201
9IC
AP
1702
INFOGRAPHICS
Since their inception,operating systems have raised more than USD 57 billion in auctioning revenue
Indonesia
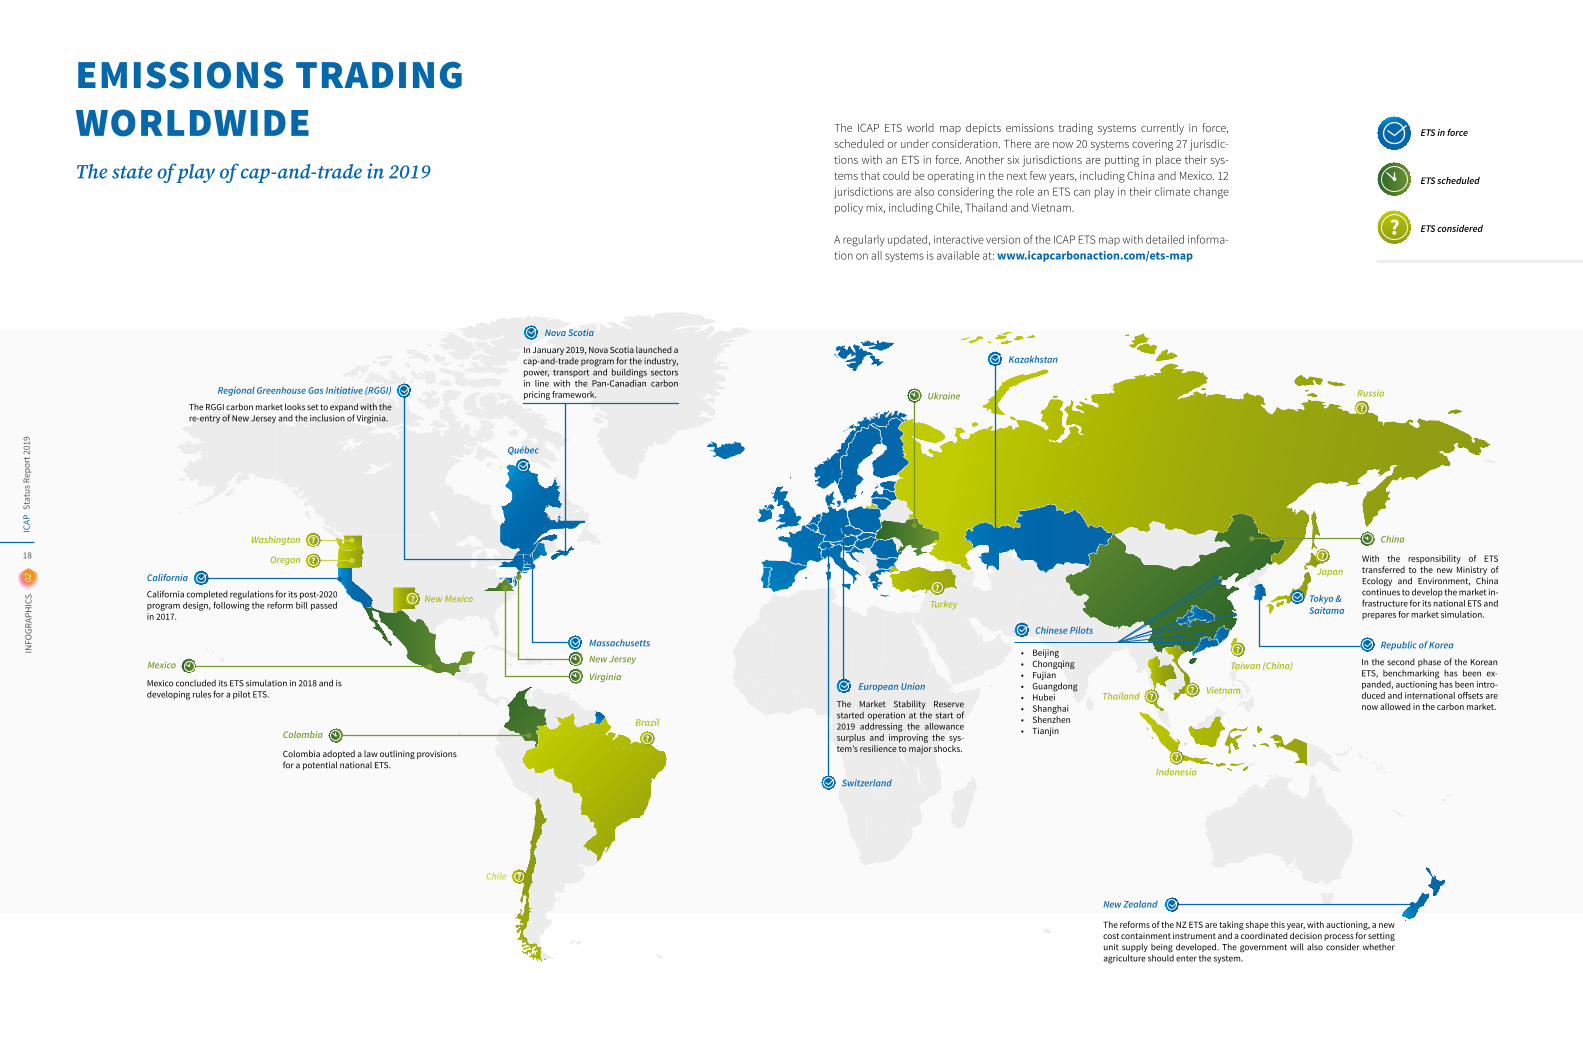
The ICAP ETS world map depicts emissions trading systems currently in force, scheduled or under consideration. There are now 20 systems covering 27 jurisdic-tions with an ETS in force. Another six jurisdictions are putting in place their sys-tems that could be operating in the next few years, including China and Mexico. 12 jurisdictions are also considering the role an ETS can play in their climate change policy mix, including Chile, Thailand and Vietnam.
A regularly updated, interactive version of the ICAP ETS map with detailed informa-tion on all systems is available at: www.icapcarbonaction.com/ets-map
ETS in force
In the second phase of the Korean ETS, benchmarking has been ex-panded, auctioning has been intro-duced and international offsets are now allowed in the carbon market.
With the responsibility of ETS transferred to the new Ministry of Ecology and Environment, China continues to develop the market in-frastructure for its national ETS and prepares for market simulation.
• Beijing• Chongqing• Fujian• Guangdong• Hubei• Shanghai• Shenzhen• Tianjin
The reforms of the NZ ETS are taking shape this year, with auctioning, a new cost containment instrument and a coordinated decision process for setting unit supply being developed. The government will also consider whether agriculture should enter the system.
ETS scheduled
ETS considered
Republic of Korea
Japan
Turkey
Russia
The Market Stability Reserve started operation at the start of 2019 addressing the allowance surplus and improving the sys-tem’s resilience to major shocks.
European Union
Switzerland
Chinese Pilots
Tokyo & Saitama
Thailand Vietnam
New Zealand
EMISSIONS TRADING WORLDWIDEThe state of play of cap-and-trade in 2019
Brazil
Chile
Mexico concluded its ETS simulation in 2018 and is developing rules for a pilot ETS.
Colombia adopted a law outlining provisions for a potential national ETS.
California completed regulations for its post-2020 program design, following the reform bill passed in 2017.
Québec
Nova Scotia
Massachusetts
New Jersey
Virginia
The RGGI carbon market looks set to expand with the re-entry of New Jersey and the inclusion of Virginia.
Regional Greenhouse Gas Initiative (RGGI)
Oregon
Washington
New Mexico
In January 2019, Nova Scotia launched a cap-and-trade program for the industry, power, transport and buildings sectors in line with the Pan-Canadian carbon pricing framework.
Colombia
Mexico
California
Stat
us R
epor
t 201
9IC
AP
18
02IN
FOGR
APH
ICS
Kazakhstan
Taiwan (China)
China
Ukraine
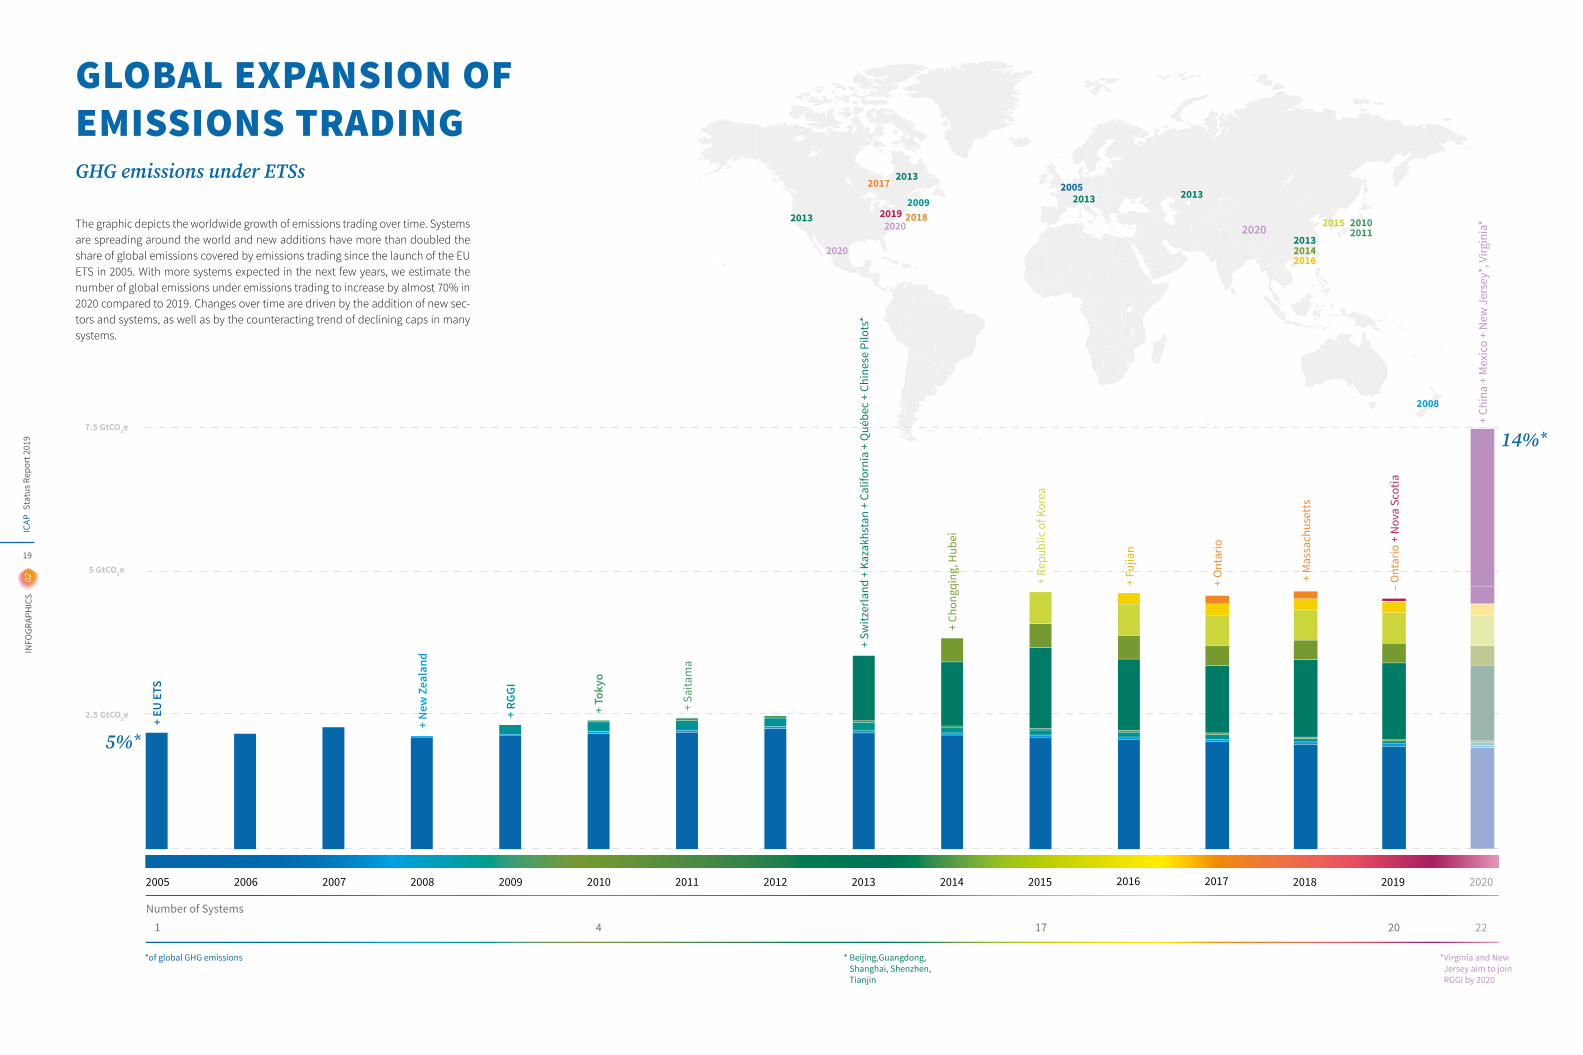
GLOBAL EXPANSION OF EMISSIONS TRADINGGHG emissions under ETSs
The graphic depicts the worldwide growth of emissions trading over time. Systems are spreading around the world and new additions have more than doubled the share of global emissions covered by emissions trading since the launch of the EU ETS in 2005. With more systems expected in the next few years, we estimate the number of global emissions under emissions trading to increase by almost 70% in 2020 compared to 2019. Changes over time are driven by the addition of new sec-tors and systems, as well as by the counteracting trend of declining caps in many systems.
Number of Systems
2.5 GtCO2e
5 GtCO2e
7.5 GtCO2e
2005
1
2006 2007 2008 2009 2010
4
2011
+ EU
ETS
+ Ne
w Z
eala
nd
+ RG
GI
2012 2013 2014 2015
17
2016 2017 2018 2019 2020
20 22
20052013
2008
2010
2013
2013
2013
2013
2014
2015
* Beijing,Guangdong, Shanghai, Shenzhen, Tianjin
*of global GHG emissions *Virginia and New Jersey aim to join RGGI by 2020
2016
2017
+ Sw
itzer
land
+ K
azak
hsta
n +
Calif
orni
a +
Qué
bec
+ Ch
ines
e Pi
lots
*
+ Ch
ongq
ing,
Hub
ei
+ Re
publ
ic o
f Kor
ea
+ Fu
jian
2020
2020
+ O
ntar
io
+ M
assa
chus
etts
– O
ntar
io +
Nov
a Sc
otia
+ C
hina
+ M
exic
o +
New
Jer
sey*
, Virg
inia
*
5%*
14%*
+ To
kyo
+ Sa
itam
a
2011
200920182019
2020
Stat
us R
epor
t 201
9IC
AP
19
02IN
FOGR
APH
ICS
Stat
us R
epor
t 201
9IC
AP
20
02IN
FOGR
APH
ICS
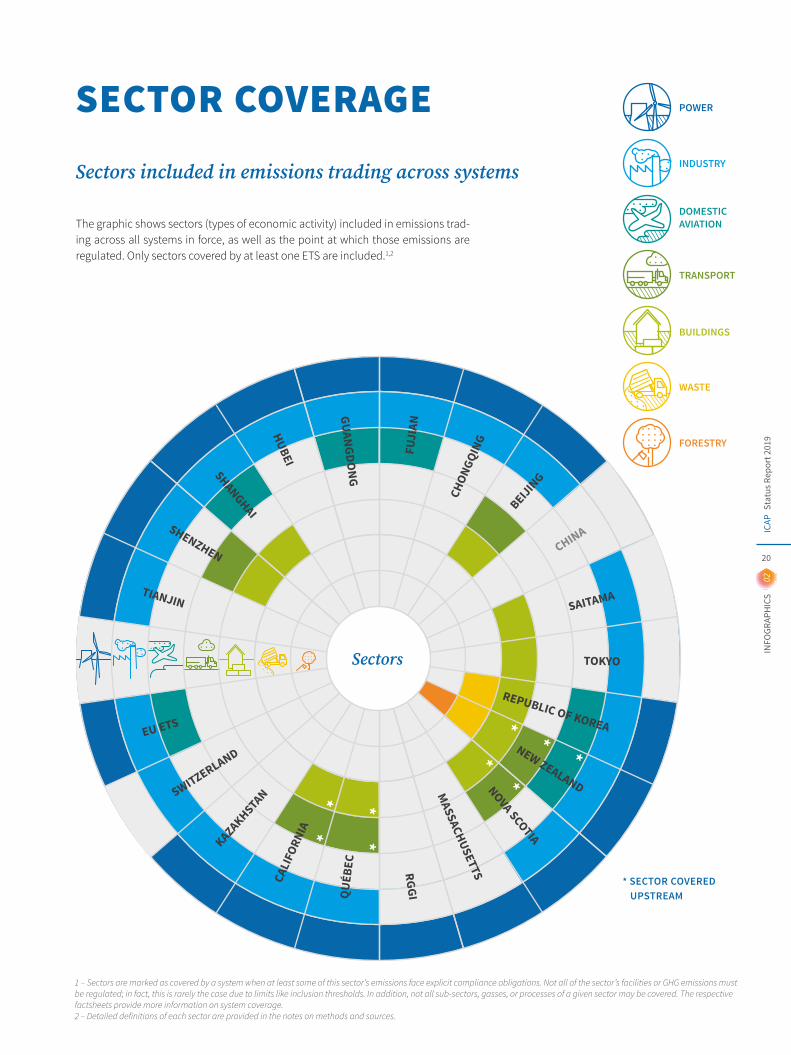
SECTOR COVERAGE
The graphic shows sectors (types of economic activity) included in emissions trad-ing across all systems in force, as well as the point at which those emissions are regulated. Only sectors covered by at least one ETS are included.1,2
1 – Sectors are marked as covered by a system when at least some of this sector’s emissions face explicit compliance obligations. Not all of the sector’s facilities or GHG emissions must be regulated; in fact, this is rarely the case due to limits like inclusion thresholds. In addition, not all sub-sectors, gasses, or processes of a given sector may be covered. The respective factsheets provide more information on system coverage. 2 – Detailed definitions of each sector are provided in the notes on methods and sources.
Sect
ors
EU ETS
**
**
***
*
*
Sectors
SWITZERLAND
KAZAKHSTAN CA
LIFO
RNIA
QUÉ
BEC
RGGI
MASSACHUSETTS
NOVA SCOTIA
NEW ZEALAND
REPUBLIC OF KOREA
TOKYO
SAITAMA
CHINA BEIJIN
G
CHON
GQIN
G
FUJI
AN
GUANGDONG
HUBEI SHANGHAISHENZHEN
TIANJIN
* SECTOR COVERED UPSTREAM
POWER
DOMESTICAVIATION
Sectors included in emissions trading across systems INDUSTRY
WASTE
TRANSPORT
BUILDINGS
FORESTRY
Stat
us R
epor
t 201
9IC
AP
21
02IN
FOGR
APH
ICS
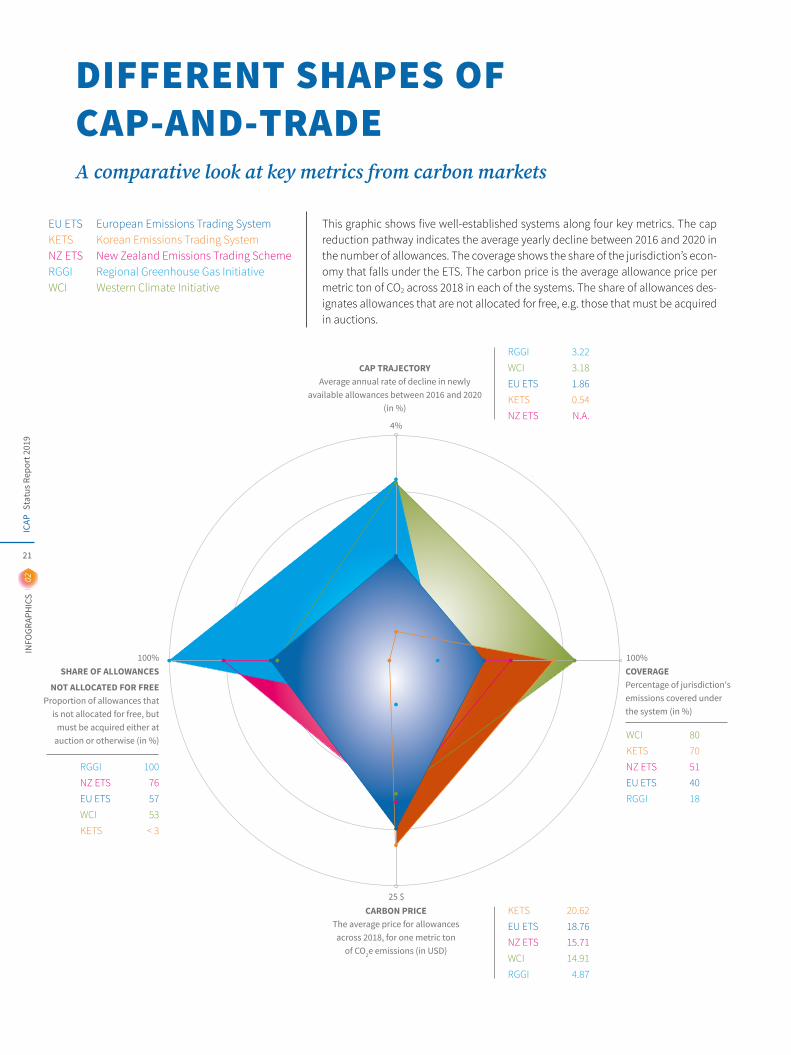
CARBON PRICEThe average price for allowances across 2018, for one metric ton
of CO2e emissions (in USD)
CAP TRAJECTORYAverage annual rate of decline in newly
available allowances between 2016 and 2020 (in %)
COVERAGEPercentage of jurisdiction's emissions covered under the system (in %)
100%100%
25 $
4%
SHARE OF ALLOWANCES
NOT ALLOCATED FOR FREEProportion of allowances that
is not allocated for free, but must be acquired either at
auction or otherwise (in %)
RGGI 3.22WCI 3.18EU ETS 1.86KETS 0.54NZ ETS N.A.
WCI 80KETS 70NZ ETS 51EU ETS 40RGGI 18
RGGI 100NZ ETS 76EU ETS 57WCI 53KETS < 3
KETS 20.62EU ETS 18.76NZ ETS 15.71WCI 14.91RGGI 4.87
DIFFERENT SHAPES OF CAP-AND-TRADE
This graphic shows five well-established systems along four key metrics. The cap reduction pathway indicates the average yearly decline between 2016 and 2020 in the number of allowances. The coverage shows the share of the jurisdiction’s econ-omy that falls under the ETS. The carbon price is the average allowance price per metric ton of CO2 across 2018 in each of the systems. The share of allowances des-ignates allowances that are not allocated for free, e.g. those that must be acquired in auctions.
EU ETS European Emissions Trading SystemKETS Korean Emissions Trading SystemNZ ETS New Zealand Emissions Trading SchemeRGGI Regional Greenhouse Gas InitiativeWCI Western Climate Initiative
A comparative look at key metrics from carbon markets
Stat
us R
epor
t 201
9IC
AP
22
02IN
FOGR
APH
ICS
20172016 2018
All values in million USD
$57.3billionin auction revenue.
By the end of 2018,systems raised
a total of
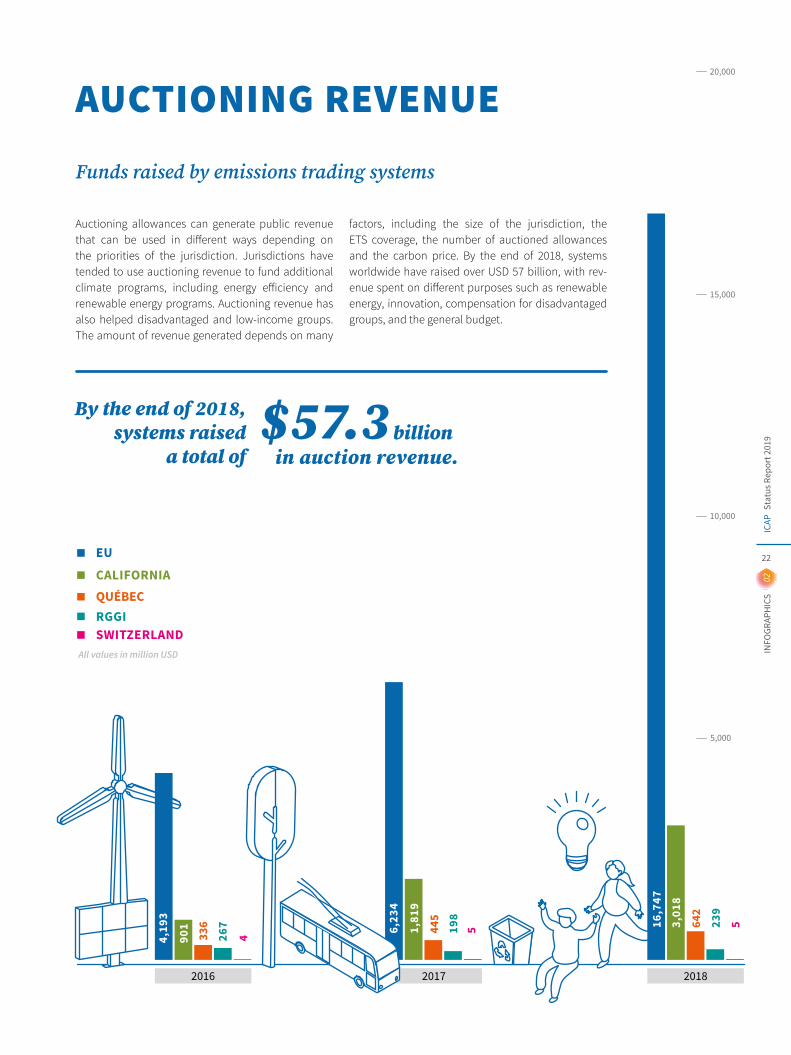
AUCTIONING REVENUE
Funds raised by emissions trading systems
Auctioning allowances can generate public revenue that can be used in different ways depending on the priorities of the jurisdiction. Jurisdictions have tended to use auctioning revenue to fund additional climate programs, including energy efficiency and renewable energy programs. Auctioning revenue has also helped disadvantaged and low-income groups. The amount of revenue generated depends on many
factors, including the size of the jurisdiction, the ETS coverage, the number of auctioned allowances and the carbon price. By the end of 2018, systems worldwide have raised over USD 57 billion, with rev-enue spent on different purposes such as renewable energy, innovation, compensation for disadvantaged groups, and the general budget.
QUÉBEC
EU
SWITZERLAND
CALIFORNIA
RGGI
642
16,7
47
53,01
8
239
5,000
10,000
15,000
20,000
445
6,23
4
51,81
9
198
336
4,19
3
4901
267
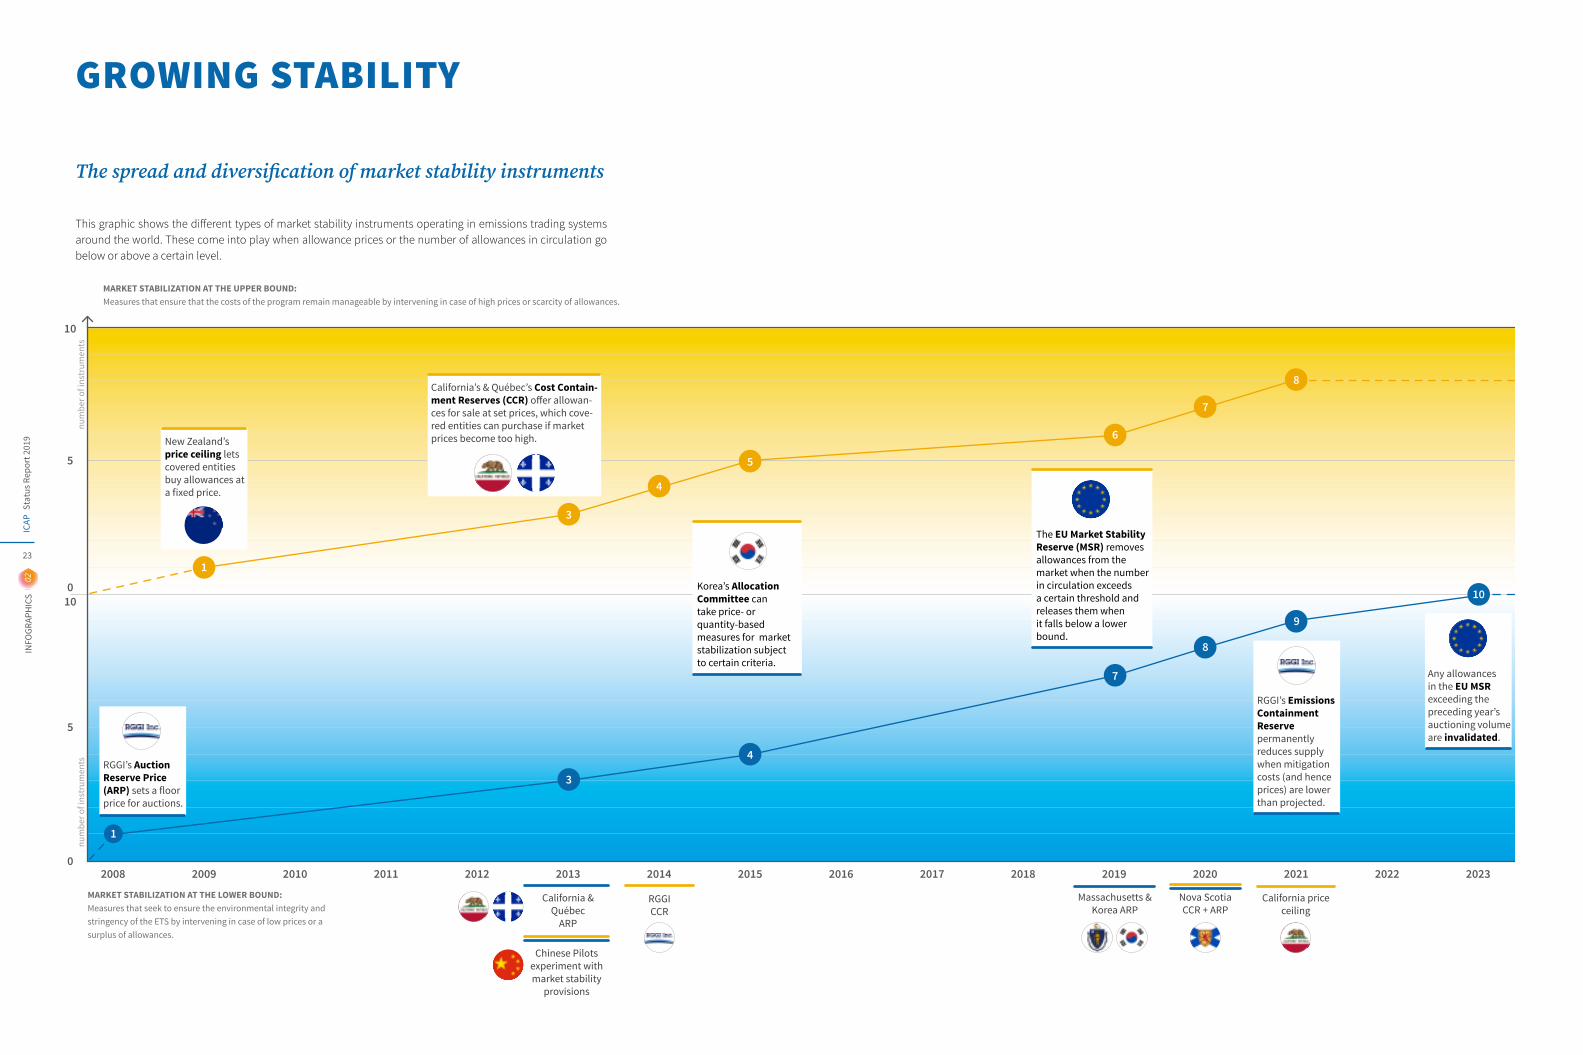
This graphic shows the different types of market stability instruments operating in emissions trading systems around the world. These come into play when allowance prices or the number of allowances in circulation go below or above a certain level.
2008
10
010
5
5
0
num
ber o
f ins
trum
ents
num
ber o
f ins
trum
ents
2009 2010 2011 2012 2013 2014 2015
California &Québec
ARP
RGGI CCR
MARKET STABILIZATION AT THE UPPER BOUND:Measures that ensure that the costs of the program remain manageable by intervening in case of high prices or scarcity of allowances.
MARKET STABILIZATION AT THE LOWER BOUND:Measures that seek to ensure the environmental integrity and stringency of the ETS by intervening in case of low prices or a surplus of allowances.
3
3
4
5
4
Massachusetts & Korea ARP
Nova ScotiaCCR + ARP
California priceceiling
2016 2017 2018 20202019 2021 2022 2023
7
8
8
7
9
10
6
California’s & Québec’s Cost Contain-ment Reserves (CCR) offer allowan-ces for sale at set prices, which cove-red entities can purchase if market prices become too high.New Zealand’s
price ceiling lets covered entities buy allowances at a fixed price.
RGGI’s Emissions Containment Reserve permanently reduces supply when mitigation costs (and hence prices) are lower than projected.
RGGI’s Auction Reserve Price (ARP) sets a floor price for auctions.
Any allowances in the EU MSRexceeding the preceding year’s auctioning volume are invalidated.
Korea’s Allocation Committee can take price- or quantity-based measures for market stabilization subject to certain criteria.
Chinese Pilotsexperiment with market stability
provisions
1
1
The EU Market Stability Reserve (MSR) removes allowances from the market when the number in circulation exceeds a certain threshold and releases them when it falls below a lower bound.
GROWING STABILITY
The spread and diversification of market stability instruments
Stat
us R
epor
t 201
9IC
AP
23
02IN
FOGR
APH
ICS
Stat
us R
epor
t 201
9IC
AP
24
DIVING INTO THE DETAILS
Planned and Operating Emissions Trading Systems Around the World
03
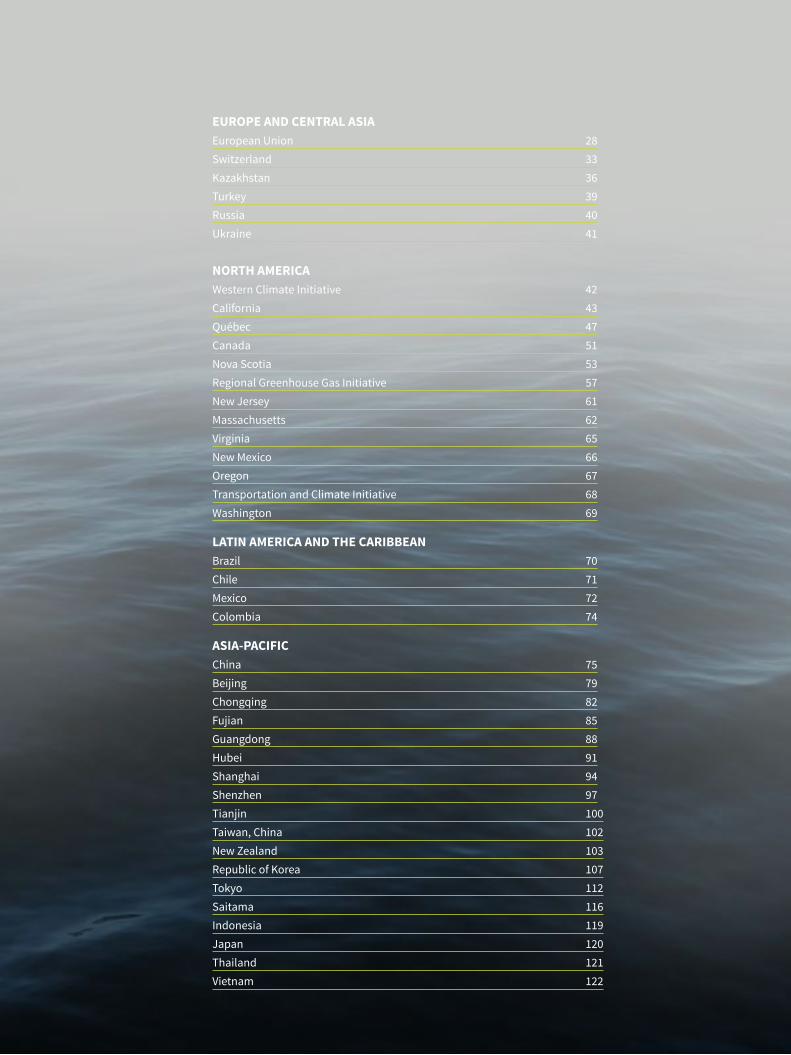
EUROPE AND CENTRAL ASIAEuropean Union 28Switzerland 33Kazakhstan 36Turkey 39Russia 40Ukraine 41
NORTH AMERICAWestern Climate Initiative 42California 43Québec 47Canada 51Nova Scotia 53Regional Greenhouse Gas Initiative 57New Jersey 61Massachusetts 62Virginia 65New Mexico 66Oregon 67Transportation and Climate Initiative 68Washington 69
LATIN AMERICA AND THE CARIBBEANBrazil 70Chile 71Mexico 72Colombia 74
ASIA-PACIFICChina 75Beijing 79Chongqing 82Fujian 85Guangdong 88Hubei 91Shanghai 94Shenzhen 97Tianjin 100Taiwan, China 102New Zealand 103Republic of Korea 107Tokyo 112Saitama 116Indonesia 119Japan 120Thailand 121Vietnam 122
Stat
us R
epor
t 201
9IC
AP
26
03FA
CTSH
EETS
EUROPEAN UNION
GASESSeveral gases
ALLOCATION AuctioningFree Allocation
AVERAGE 2018 PRICEEUR 15.82 (USD 18.76) (average price on secondary market [EEX])
TOTAL REVENUE Since beginning of program: EUR 35.9 billion (USD 42.4 billion) Collected in 2018: EUR 14.2 billion (USD 16.8 billion)
OFFSETS AND CREDITSInternational Offsets
CAP1,855 MtCO2e (2019)
European Union Emissions Trading System
ETS DESCRIPTIONThe European Union Emissions Trading System (EU ETS) represents the central pillar of the EU climate change policy and is the oldest and still largest ETS for GHGs operating worldwide. Introduced in 2005 and now in its third phase, the system has gone through several reforms and will change again with the start of phase 4 in January 2021. The system covers emissions from the power, industrial, and aviation sectors, with the aviation sector being limited to flights within the European Economic Area (EEA). In 2017, the EU and Switzerland signed an agreement linking the Swiss ETS to the EU ETS—the first such agreement for the EU.
YEAR IN REVIEWAfter more than two years of negotiations, in February 2018, the EU Council of Ministers formally approved the reform of the EU ETS for phase 4 (2021-2030). The revised EU ETS Directive entered into force in April 2018.
Phase 4 will see a steeper pace of annual emissions cuts required from the covered sectors, from 1.74% to 2.2%.
In addition, the Market Stability Reserve (MSR) – a mechanism to reduce the surplus of allowances in the carbon market and to improve the EU ETS’s resilience to future shocks – has been strengthened: between 2019 and 2023, 24% of the surplus will be placed in the MSR instead of the regular rate of 12%, while from 2023 onwards the allowances held in the MSR exceed-ing the previous year’s auction volume will be invali-dated. Member States may also invalidate a portion of allowances to reflect additional policies in the energy sector, e.g., a coal phase out. Other changes for phase 4 include provisions to better target free allocation to address carbon leakage, as well as new financial sup-port mechanisms to promote low-carbon innovation and to support modernization efforts in the industry and the power sectors of lower-income Member States.
Steps will be taken in 2019 to ratify the Linking Agree-ment between Switzerland and the EU, which could see the markets linked from 1 January 2020.
Oldest and largest ETS for GHGs
Post-2020 ETS design finalized. Market Stability Reserve started in 2019
Could link with Switzerland by 2020
OVERALL GHG EMISSIONS (EXCL. LULUCF) 4,353.0 MtCO2e (2016)
OVERALL GHG EMISSIONS BY SECTOR
GHG REDUCTION TARGETSBY 2020: 20% below 1990 GHG levelsBY 2030: At least 40% below 1990 GHG levelsBY 2050: EU leaders have committed to reducing emissions by 80-95% below 1990 GHG levels
Energy 3,391.0 (78%)Industrial Processes 386.0 (9%)Agriculture 436.0 (10%)Waste 140.0 (3%)
Background Information
ETS in force
ETS scheduled
ETS considered
SECTORS:
POWER
INDUSTRY
DOMESTICAVIATION
MEMBERS (2018):28 EU Member States, Iceland, Liechtenstein, and Norway
03FA
CTSH
EETS
Stat
us R
epor
t 201
9IC
AP
27
CAPPED EMISSIONS 1,855 MtCO2e
GHGs COVEREDCO2, N2O, PFCs
SECTORS AND THRESHOLDSPHASE 1 (2005-2007): Power stations and other com-bustion installations with >20MW thermal rated input (except hazardous or municipal waste installations), industry (various thresholds) including oil refineries, coke ovens, iron and steel plants, as well as produc-tion of cement, glass, lime, bricks, ceramics, pulp, paper, and board.
PHASE 2 (2008-2012): Aviation was introduced in 2012 (>10,000 tCO2/year for commercial aviation; >1,000 tCO2/year for non-commercial aviation since 2013) (see below). Nitrous oxide emissions from the production of nitric acid were included by a number of countries. The EU ETS also expanded to include Ice-land, Liechtenstein, and Norway.
PHASE 3 (2013-2020): Carbon Capture and Storage installations, production of petrochemicals, ammo-nia, nonferrous and ferrous metals, gypsum, alumi-num, as well as nitric, adipic, and glyoxylic acid (var-ious thresholds) were introduced.
PHASE 4 (2021-2030): No changes to the scope are envisaged for phase 4.
International Aviation: Emissions from interna-tional aviation were included in the EU ETS in 2012. In November 2012, the EU temporarily suspended enforcement of the EU ETS requirements for flights operating from or to non-EEA countries (“stop the clock”) while continuing to apply the legislation to flights within and between countries in the EEA. Exemptions for operators with low emissions have also been introduced.
In light of the progress made under the International Civil Aviation Organization towards a global measure to reduce emissions from the aviation sector (the Carbon Offsetting and Reduction Scheme [CORSIA]), the EU will maintain the intra-EEA scope for the ETS Aviation until 31 December 2023. A further review and assessment will be carried out once there is clarity surrounding the content and nature of CORSIA, as well as the extent of participation by Europe’s inter-national partners.
POINT OF REGULATIONDownstream
NUMBER OF ENTITIESMore than 11,000 power plants and manufacturing installations. Aircraft operators are covered for all flights. However, a temporary exemption applies to flights between the EEA and a third country.
CAPPHASE 1 (2005-2008) and PHASE 2 (2009-2012):Decentralized cap-setting – the EU cap resulted from the aggregation of the National Allocation Plans of each Member State. Phase 1 started with a cap of 2,096 MtCO2e in 2005, phase 2 with a cap of 2,049 MtCO2e in 2009.
PHASE 3 (2013-2020): Single EU-wide cap for sta-tionary sources: 2,084 MtCO2e in 2013, which is annu-ally reduced by a constant linear reduction factor (currently 1.74% or ~38.3 million allowances). This amounts to 1,855 MtCO2e in 2019.
Aviation Sector Cap: The aviation sector cap was originally set at 210 MtCO2e/year. This cap was meant to reflect the initial inclusion of all flights from, to, and within the EEA in the EU ETS. However, following the “stop the clock” temporary suspension until the end of 2016, the number of aviation allowances put into circulation in 2013-2016 was significantly lower than the original cap. In 2017, the intra-EEA scope for avia-tion was prolonged until 2023. The adjusted approach for determining the annual aviation cap still applies.
PHASE 4 (2021-2030): A linear cap reduction factor of 2.2% (48.4 million allowances) annually for both stationary sources and the aviation sector. The linear reduction factor does not have a sunset clause and the cap will continue to decline beyond 2030.
~40% of EU emissions
ETS Size
Stat
us R
epor
t 201
9IC
AP
28
03FA
CTSH
EETS
TRADING PERIODSPHASE 1: 3 years (2005-2007)PHASE 2: 5 years (2008-2012)PHASE 3: 8 years (2013-2020)PHASE 4: 10 years (2021-2030)
ALLOCATIONPHASE 1 (2005-2007): Allocation established through the Member State National Allocation Plans. Nearly 100% free allocation through grandfathering. Some Member States used auctioning and some used benchmarking.
PHASE 2 (2008-2012): Similar to Phase 1 with ~90% of allowances allocated for free. Some benchmarking for free allocation and some auctioning in eight Member States (Germany, United Kingdom, The Netherlands, Austria, Ireland, Hungary, Czech Republic and Lithua-nia), constituting ~3% of total allowances.
PHASE 3 (2013-2020): Over the entire trading period, 57% of allowances will be auctioned, while the remaining allowances are available for free allocation.
Electricity Sector: 100% auctioning with optional derogation for the modernization of the electricity sector in certain Member States. Those Member States whose GDP per capita was below 60% of the EU aver-age in 2013 may continue to make use of this optional free allocation in phase 4.
Manufacturing Sector: Free allocation is based on product-based benchmarks. Benchmarks are based on activity levels in 2007-2008 and are set at the aver-age of the 10% most efficient installations in the (sub)sector.
Subsectors deemed at risk of carbon leakage receive free allocation at 100% of the predetermined bench-marks. Subsectors deemed not at risk of carbon leak-age have free allocation phased out gradually from 80% of the benchmarks in 2013 to 30% by 2020. In the event that free allocation exceeds the amount reserved for free allocation, a cross-sectoral correc-tion factor is applied.
Carbon leakage risk is assessed against criteria of emissions intensity and trade exposure.
Aviation Sector: In 2012, 85% of allowances were allocated for free, based on benchmarks. In phase 3, 15% of allowances are auctioned and 82% allo-cated for free, based on benchmarks. The remaining
3% constitute a special reserve for new entrants and fast-growing airlines. As a consequence of the tem-porary derogation applying to flights with third coun-tries, the allocation is adjusted to the intra-EEA scope.
Backloading: Taken as a short-term measure to address a growing surplus in the EU ETS, it was agreed to postpone the auctioning of 900 million allowances from 2014-2016 to 2019-2020. Auction volumes were reduced by 400 million allowances in 2014, 300 mil-lion in 2015, and by 200 million in 2016. In line with the decision to create an MSR, the back-loaded allow-ances will be placed in the MSR.
New Entrants Reserve: 5% of the total allowances are set aside to assist new installations coming into the EU ETS or covered installations whose capacity has significantly increased since their free allocation was determined.
PHASE 4 (2021-2030): One of the central components of the phase 4 revision package is to ensure that the declining number of free allowances is distributed in the most effective and efficient way. To this end, in phase 4:
• Benchmark values will be updated twice during the phase to reflect technological progress in the differ-ent sectors.
• Free allocation may be updated annually to mirror sustained changes in production (if the change is more than 15% compared to the initial level, on the basis of a two-year rolling average).
• Carbon leakage rules will be more robust, as the number of sectors classified at risk of carbon leak-age will be reduced, and the free allocation for other sectors will be discontinued by 2030 (except district heating).
• Carbon leakage will be assessed against a compos-ite indicator of trade intensity and emissions inten-sity.
• As an additional safeguard for industry, the agree-ment foresees a “free allocation buffer” of over 450 million allowances initially earmarked for auction-ing, to be made available if the initial free allocation is fully absorbed (thereby avoiding or reducing a correction factor).
In addition, two new multi-billion Euro funds will be established to help the industry and the power sec-tors meet the innovation and investment challenges of the transition to a low-carbon economy (for more, see Use of Revenue).
Phases & Allocation
03FA
CTSH
EETS
Stat
us R
epor
t 201
9IC
AP
29
European Union Emissions Trading System
EUROPEAN UNION
BANKING AND BORROWING Unlimited banking has been allowed since 2008. Borrowing is not allowed.
OFFSETS AND CREDITSPHASE 1 (2005-2007):Unlimited use of Clean Development Mechanism (CDM) credits and Joint Implementation credits (JI) was provided for in the Directive. In practice, no cred-its were used in phase 1.
PHASE 2 (2008-2012):Qualitative Limits: Most categories of CDM/JI cred-its were allowed, no credits from LULUCF and nuclear power sectors. Strict requirements for large hydro projects exceeding 20 MW.
Quantitative Limits: In phase 2 (2008-2012), opera-tors were allowed to use JI and CDM credits up to a certain percentage limit determined in the respective country’s National Allocation Plans. Unused entitle-ments were transferred to phase 3 (2013-2020).
PHASE 3 (2013-2020):Qualitative Limits: Newly generated (post-2012) international credits may only come from projects in Least Developed Countries. Credits from CDM and JI projects from other countries are eligible only if reg-istered and implemented before 31 December 2012. Projects from industrial gas credits (projects involv-ing the destruction of HFC-23 and N2O) are excluded regardless of the host country. Credits issued for emis-sion reductions that occurred in the first commitment period of the Kyoto Protocol were no longer accepted after 31 March 2015.
Quantitative Limits: The total use of credits for phase 2 and phase 3 may amount up to 50% of the overall reduction under the EU ETS in that period (~1.6 Gt CO2e).
PHASE 4 (2021-2030): The use of offsets is not envisaged.
MARKET STABILITY PROVISIONS Market Stability Reserve (MSR): The MSR started operating in January 2019. It aims to neutralize the negative impacts of the existing allowance surplus and to improve the system’s resilience to future shocks. Thresholds: Allowances will be added to the reserve if the total number of allowances in circula-tion (TNAC) is higher than 833 million allowances and reinjected to the market if the number of allowances in circulation falls below 400 million. • When the TNAC is above 833 million, 12% (24% up
to 2023) of the surplus is withdrawn from future auc-tions and placed into the reserve over a period of 12 months.
• When the TNAC is less than 400 million allowances, 100 million allowances are taken from the reserve and injected into the market.
From 2023 onwards, the number of allowances held in the reserve will be limited to the auction volume of the previous year. Holdings above that amount will lose their validity.
Cancellations: As of phase 4, a Member State may also cancel allowances from their auction share in the event that they take additional measures that result in closure of electricity generation capacity. The quan-tity of allowances invalidated shall not exceed the average verified emissions of the installation from five years preceding the closure.
COMPLIANCE PERIOD From 1 January until 30 April the following year (16 months)
MRV REPORTING FREQUENCY: Annual self-reporting based on harmonized electronic templates prepared by the European Commission.
VERIFICATION: Verification by independent accred-ited verifiers is required before 31 March each year.
MRV FRAMEWORK: Since phase 3, the MRV frame-work for the EU ETS has been further harmonized. European Commission regulations now apply for emissions monitoring and reporting, as well as ver-ification and accreditation of verifiers. A monitoring plan is required for every installation and aircraft oper-ator (approved by competent authority).
Flexibility
Compliance
Stat
us R
epor
t 201
9IC
AP
30
03FA
CTSH
EETS
LINKS WITH OTHER SYSTEMS The European Commission has concluded negotia-tions with Switzerland on linking the EU ETS with the Swiss ETS. In November 2017, the EU and Switzerland
signed the Agreement to link their ETS.1 The Agree-ment will enter into force on 1 January of the year fol-lowing the exchange of the instruments of ratification by the Parties.
INSTITUTIONS INVOLVED The European Commission and the relevant author-ities of the 28 Member States, Iceland, Liechtenstein, and Norway.
EVALUATION/ETS REVIEWThe European Commission publishes annual reports on the functioning of the European carbon market(the 2018 report is available here2).
Two major EU ETS reviews – before phase 3 and before phase 4 – have been conducted to date, resulting in changes in system design. The directive establishing the EU ETS stipulates that the system be kept under review in light of the implementation of the Paris Agreement and the development of carbon markets in other major economies.
USE OF REVENUESEU ETS revenues from auctioning accrue to EU Mem-ber States. At least 50% of revenues should be used for climate- and energy-related purposes. Member States are obliged to inform the Commission about how they use the revenues. According to information submit-ted, they spend ~80% for domestic and international climate-related purposes.
PHASE 3 (2013-2020):300 million allowances were reserved for auction to fund the demonstration of environmentally safe car-bon capture and storage and innovative renewable energy technologies through the NER300.
PHASE 4 (2021-2030):Two EU-level funds fed from the sale of allowances funds will replace the NER300:
The Innovation Fund: For the demonstration of innovative technologies to breakthrough innovation in industry, as well as carbon capture and storage/use and renewable energy.
The Modernization Fund: Facilitating investments in modernizing the energy systems and supporting energy efficiency in 10 lower-income Member States, including investments to support a socially just tran-sition to a low-carbon economy (such as retraining for affected workers).
IMPLEMENTING LEGISLATIONConsolidated version of Directive 2003/87/EC of the European Parliament and of the Council establishing a scheme for GHG emission allowance trading within the Community and amending Council Directive 96/61/EC (8 April 2018)
Decision concerning the establishment and operation of a market stability reserve for the Union GHG emis-sion trading scheme and amending Directive 2003/87/EU (6 October 2015)
Consolidated Auctioning Regulation (25 February 2014): Commission Regulation EU No 176/2014 amend-ing Regulation (EU) No 1031/2010 in particular to determine the volumes of GHG emission allowances to be auctioned in 2013-2020 (25 February 2014).
All other legislation and documentation can be found here.3
ENFORCEMENTEntities must pay an “excess emissions penalty” of EUR 100/tCO2 (USD 118/tCO2) for each tCO2 emitted for which no allowance has been surrendered. The
name of the noncompliant operator is also pub-lished. Different penalties exist at the national level for other forms of noncompliance.
Linking
Other Information
1 – Agreement between the European Union and the Swiss Confederation on the linking of their greenhouse gas emissions trading systems, OJ L 322, 12 December 2017, p. 3 2 – https://ec.europa.eu/clima/sites/clima/files/ets/docs/com_2018_842_final_en.pdf 3 – https://ec.europa.eu/clima/policies/ets_en#tab-0-1
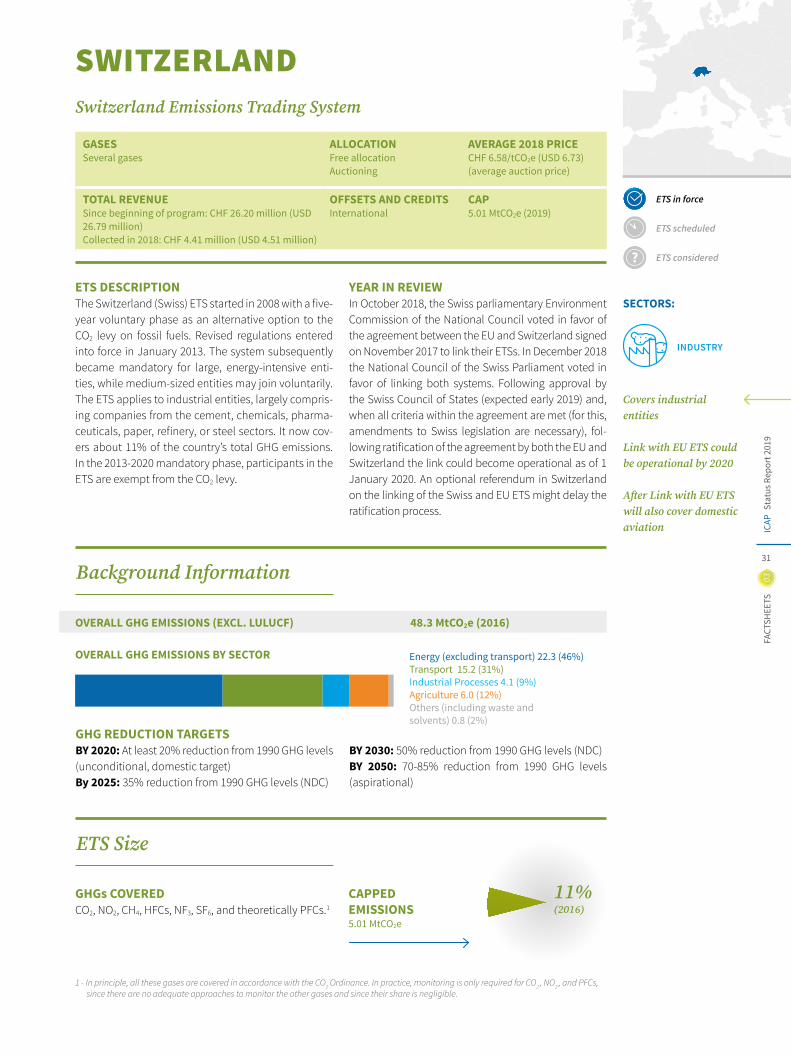
03FA
CTSH
EETS
Stat
us R
epor
t 201
9IC
AP
31
ETS in force
ETS scheduled
ETS considered
SECTORS:
INDUSTRY
Covers industrial entities
Link with EU ETS could be operational by 2020
After Link with EU ETS will also cover domestic aviation
GASESSeveral gases
ALLOCATION Free allocationAuctioning
AVERAGE 2018 PRICECHF 6.58/tCO2e (USD 6.73) (average auction price)
TOTAL REVENUESince beginning of program: CHF 26.20 million (USD 26.79 million)Collected in 2018: CHF 4.41 million (USD 4.51 million)
OFFSETS AND CREDITSInternational
CAP5.01 MtCO2e (2019)
SWITZERLANDSwitzerland Emissions Trading System
ETS DESCRIPTIONThe Switzerland (Swiss) ETS started in 2008 with a five-year voluntary phase as an alternative option to the CO2 levy on fossil fuels. Revised regulations entered into force in January 2013. The system subsequently became mandatory for large, energy-intensive enti-ties, while medium-sized entities may join voluntarily. The ETS applies to industrial entities, largely compris-ing companies from the cement, chemicals, pharma-ceuticals, paper, refinery, or steel sectors. It now cov-ers about 11% of the country’s total GHG emissions. In the 2013-2020 mandatory phase, participants in the ETS are exempt from the CO2 levy.
YEAR IN REVIEWIn October 2018, the Swiss parliamentary Environment Commission of the National Council voted in favor of the agreement between the EU and Switzerland signed on November 2017 to link their ETSs. In December 2018 the National Council of the Swiss Parliament voted in favor of linking both systems. Following approval by the Swiss Council of States (expected early 2019) and, when all criteria within the agreement are met (for this, amendments to Swiss legislation are necessary), fol-lowing ratification of the agreement by both the EU and Switzerland the link could become operational as of 1 January 2020. An optional referendum in Switzerland on the linking of the Swiss and EU ETS might delay the ratification process.
OVERALL GHG EMISSIONS (EXCL. LULUCF) 48.3 MtCO2e (2016)
OVERALL GHG EMISSIONS BY SECTOR
GHG REDUCTION TARGETSBY 2020: At least 20% reduction from 1990 GHG levels (unconditional, domestic target)By 2025: 35% reduction from 1990 GHG levels (NDC)
BY 2030: 50% reduction from 1990 GHG levels (NDC)BY 2050: 70-85% reduction from 1990 GHG levels (aspirational)
Energy (excluding transport) 22.3 (46%)Transport 15.2 (31%)Industrial Processes 4.1 (9%)Agriculture 6.0 (12%)Others (including waste and solvents) 0.8 (2%)
CAPPED EMISSIONS 5.01 MtCO2e
GHGs COVEREDCO2, NO2, CH4, HFCs, NF3, SF6, and theoretically PFCs.1
11%(2016)
Background Information
ETS Size
1 - In principle, all these gases are covered in accordance with the CO2 Ordinance. In practice, monitoring is only required for CO2 , NO2 , and PFCs, since there are no adequate approaches to monitor the other gases and since their share is negligible.
Stat
us R
epor
t 201
9IC
AP
32
03FA
CTSH
EETS
TRADING PERIODSVOLUNTARY PHASE: 2008-2012MANDATORY PHASE: 2013-2020
ALLOCATIONVOLUNTARY PHASE (2008-2012): Free Allocation: Each participant was granted free allocation of allowances covering emissions up to their own entity-specific emissions target.
MANDATORY PHASE (2013-2020): Free allocation: Free allocation is based on industry benchmarks using a similar methodology to the EU ETS. Free allocation for sectors not exposed to the
risk of carbon leakage will be phased out gradually: in 2013, such entities received 80% free allocation whereas in 2020 the share of free allocation will be reduced to 30%.
An overarching correction factor is applied given the ben- chmarked allocation exceeds the overall emissions cap.
Auctioning: Allowances that are not allocated for free are auctioned. Auctions take place two or three times a year, depending on available auction volumes.
5% of the allowances are set aside in a reserve for new entrants and significantly growing operators.
SECTORS AND THRESHOLDSMANDATORY PARTICIPATION: Industries listed under Annex 6 of the revised CO2 Ordinance (25 subsectors) must participate in the Swiss ETS. This includes compa-nies from the cement, chemicals and pharmaceuticals, refineries, paper, district heating, steel, and other sectors.
INCLUSION THRESHOLDS: Facilities pertaining to the sectors included in Annex 6 that have a total rated thermal input of >20MW.
POSSIBLE VOLUNTARY OPT-IN: Industries a) listed under Annex 7 of the revised CO2 Ordinance (21 sub-sectors) and b) with a total rated thermal input of >10MW. A company that newly fulfils the participation conditions must submit the application no later than six months from the date of fulfilment.
POSSIBLE OPT-OUT: Industries with a total rated thermal input of >20MW, but yearly emissions <25,000 tCO2e/year in each of the past three years. Should their future emissions rise above the threshold during at least one year, they must start participating in the ETS the following year and cannot opt out anymore for the remainder of the compliance period.
DOMESTIC AVIATION: Coverage of domestic avia-tion (domestic flights within Switzerland or flights from Switzerland to member states of the European
Economic Area) is a requirement of the linking agree-ment between Switzerland and the EU. In July 2017, to prepare for the inclusion of aviation in the Swiss ETS, Switzerland introduced the legislation for mandatory reporting of tonne-kilometer data for aircraft opera-tors that are likely to fall within the scope of the Swiss ETS, when linked with the EU ETS. Aircraft operators submitted their monitoring plans and mandatory reporting began in January 2018. Verified monitoring reports containing tonne-kilometer data must be sub-mitted by 31 March 2019.
POINT OF REGULATIONDownstream
NUMBER OF ENTITIES54 (2017)
CAPThe absolute cap is set at the installation level.
VOLUNTARY PHASE (2008-2012): Each participant received its own entity-specific reduction target.
MANDATORY PHASE (2013-2020): Overall cap of 5.63 MtCO2e (2013), to be reduced annually by a constant linear reduction factor (currently 1.74% of 2010 emis-sions), to 4.9 MtCO2e in 2020. The 2019 cap amounts to 5.01 MtCO2e.
BANKING AND BORROWING Banking within and across phases is allowed with-out limits. Valid certificates (CERs, ERUs) from the
2008-2012 phase could be banked into the mandatory phase and surrendered until April 2015. Certificates from the 2008-2012 phase that were not requested
Phases & Allocation
Flexibility
03FA
CTSH
EETS
Stat
us R
epor
t 201
9IC
AP
33
Switzerland Emissions Trading System
SWITZERLAND
COMPLIANCE PERIOD One year (1 January to 31 December). Covered entities have until April 30 of the following year to surrender allowances.
MRV Monitoring plans are required for every installation (approved by a competent authority) no later than three months after the registration deadline.
REPORTING FREQUENCY: Annual monitoring report, based on self-reported information (by 31 March).
VERIFICATION: The Federal Office for the Environ-ment may order third-party verification of the moni-toring reports.
ENFORCEMENTThe penalty for failing to surrender sufficient allow-ances is set at CHF 125/tCO2 (USD 127.82/tCO2). In addition to the fine, entities must surrender the miss-ing allowances and/or international credits in the fol-lowing year.
LINKS WITH OTHER SYSTEMS Switzerland has concluded negotiations with the EU on linking the Swiss ETS to the EU ETS and is waiting
for approval of the agreement by the Swiss Parliament in 2019. The link will become operational on 1 January the year following ratification of the linking agreement.
INSTITUTIONS INVOLVED The Federal Office of the Environment
EVALUATION/ETS REVIEWThe Federal Act on the Reduction of CO2 Emissions, which contains the main legislation on the Swiss ETS, is in the process of being reviewed and revised for the period of 2021-2030. Implications for the design of the ETS are possible.
USE OF REVENUESRevenues from auctioning allowances are fed into the federal government budget.
IMPLEMENTING LEGISLATIONFederal Act on the Reduction of CO2 Emissions (CO2 Act)1
Ordinance on the Reduction of CO2 Emissions (CO2 Ordinance)2
to be carried over within the deadline have been can-celed. Borrowing is not allowed.
OFFSETS AND CREDITSQUALITATIVE LIMIT: Only international offsets are allowed. Exclusion criteria are listed in Annex 2 of the revised CO2 Ordinance. Most categories of credits from CDM projects in least developed countries are allowed. Credits from CDM and JI projects from other countries are eligible only if registered and imple-mented before 31 December 2012.
QUANTITATIVE LIMIT: Industries that already par-ticipated in the voluntary phase (2008-2012): for 2013-2020, the maximum amount of offsets allowed into the scheme equals 11% of five times the aver-age emissions allowances allocated in the voluntary phase (2008-2012) minus offset credits used in that same time period.
Industries entering the Swiss ETS in the mandatory phase and newly covered emission sources (2013-2020): 4.5% of their actual emissions in 2013-2020.
Compliance
Linking
Other Information
1 – https://www.admin.ch/opc/en/classified-compilation/20091310/index.html 2 – https://www.admin.ch/opc/en/classified-compilation/20120090/index.html#a5
Stat
us R
epor
t 201
9IC
AP
34
03FA
CTSH
EETS
GASESCO2 only
ALLOCATIONFree allocation
OFFSETS AND CREDITSDomestic
CAP 162 MtCO2e (2019)
KAZAKHSTAN Kazakhstan Emissions Trading Scheme
ETS DESCRIPTIONKazakhstan launched an ETS in January 2013. The groundwork for the ETS development was laid out in 2011 through amendments and additions to Kazakh-stan’s environmental legislation. The system was tem-porarily suspended in 2016-2017 to tackle operational issues and reform allocation rules. MRV obligations applied during the suspension time. Amendments to the Environmental Code were passed in 2016 to improve the MRV system, as well as the overall GHG emissions regulation and KAZ ETS operation. Amend-ments to the Environmental Code in 2017 lay the groundwork for the introduction of benchmarking.
The National Allocation Plan runs through 2018-2020 with a cap of 485.9 MtCO2 (162 MtCO2 on annual aver-age), with 225 participating installations belonging to 129 operators.
YEAR IN REVIEWThe KAZ ETS restarted operation on 1 January 2018 with new trading procedures and allocation methods. Participants were given a choice between allocation based on historical emissions (chosen by 76 installa-tions) or product-based benchmarks with the possi-bility of updating when capacity changes (chosen by 149 installations).
Introduced benchmarking
Restarted operation in 2018
~50%CAPPED EMISSIONS162 MtCO2e
GHGs COVEREDCO2
ETS in force
ETS scheduled
ETS considered
SECTORS:
POWER
INDUSTRY
Energy (excluding Transport) 251.5 (74%)Industrial processes 25.1 (7%)Transport 22.7 (7%)Agriculture 33.2 (10%)Waste 5.5 (2%)
OVERALL GHG EMISSIONS (EXCL. LULUCF) 337.9 MtCO2e (2016)
OVERALL GHG EMISSIONS BY SECTOR
GHG REDUCTION TARGETSBY 2020: 5% reduction from 1990 GHG levelsBY 2030: 15% (unconditional) – 25% (conditional) reduction from 1990 GHG levels (NDC)
BY 2050: 40% CO2 emission reduction in power sec-tor from 2012 levels (Concept of Transition to Green Economy, 2013)
ETS Size
Background Information
03FA
CTSH
EETS
Stat
us R
epor
t 201
9IC
AP
35
SECTORS AND THRESHOLDSPower sector and centralized heating. Extractive industries and manufacturing: oil and gas mining, metallurgy, chemical and processing industry (pro-duction of building materials: cement, lime, gypsum, and brick).
INCLUSION THRESHOLDS: Facilities emitting more than 20,000 tCO2e/year. For Phase III (2018-2020), 2013-2015 emission levels are used.
For Phase I (2013) and Phase II (2014-2015), thresholds were based on 2010 and 2012 emission levels.
POINT OF REGULATIONDownstream
NUMBER OF ENTITIES PHASE III (2018-2020): 129 companies (225 installa-tions)
CAP PHASE I (2013): 147 MtCO2. This equals a stabilization of the capped entities’ emissions at 2010 levels.
PHASE II (2014-2015): 2014: 154.9 MtCO2; 2015: 152.8 MtCO2. This represents reduction targets of 0% and 1.5% respectively, compared to the average CO2 emis-sions of capped entities in 2011-2012.
PHASE III (2018-2020): 485.9 MtCO2. The cap is set at a 5% reduction by 2020 from 1990 levels. The cap is allocated for the overall compliance period of 2018-2020; there is no yearly cap.
TRADING PERIODSPHASE I (PILOT PHASE): 2013
PHASE II: 2014-2015
PHASE III: 2018-2020
In 2016 and 2017, the system was temporarily suspended.
ALLOCATIONFREE ALLOCATION: Phase I (2013): 100% free allocation based on emis-sions data from 2010, with a reserve of 20.6 MtCO2.
Phase II (2014-2015): Free allocation (0% and 1.5% below 2011/2012 average emissions), with a reserve of 18 MtCO2 in 2014 and 20.5 in 2015.
Phase III (2018-2020): Free allocation based on grandfathering or product-based benchmarking (by each company’s own choice). A reserve contains 35.27 million allowances to accommodate for new entrants, new stationary emission sources, and for changes in capacity in case of the choice of benchmarking.
BANKING AND BORROWINGBanking is allowed within one trading period (i.e., within 2018-2020). Banking between trading periods is not possible..
OFFSETS AND CREDITSQUALITATIVE LIMIT: The system allows domestic offsets. International credits may be allowed in the future.
Phases & Allocation
Flexibility
Stat
us R
epor
t 201
9IC
AP
36
03FA
CTSH
EETS
COMPLIANCE PERIOD One year
MRV REPORTING FREQUENCY: Reporting is required annually for businesses or financial facilities above the 20,000 tCO2/year threshold.
Annual reporting is required for operators of installa-tions with emissions between 10,000 tCO2/year and 20,000 tCO2/year (so-called “subjects to administra-tion”), even though these operators are not required to participate in the ETS or to verify annual emission reports.
Aside from CO2, reporting is also required for CH4, N2O, and PFCs emissions.
VERIFICATION: Emissions data reports and their underlying data require accredited third-party verifi-cation.
ENFORCEMENT The non-compliance penalty equals five monthly standard units for each tonne (approximately KZT 10,605/tCO2 [USD 31/tCO2]). In 2013 and in 2014, pen-alties for non-compliance were waived.
INSTITUTIONS INVOLVED Ministry of Energy;JSC Zhasyl Damu, a state-owned joint stock company
IMPLEMENTING LEGISLATION Environmental Code of the Republic of Kazakhstan1
National GHG Emission Quota Allocation Plan for 2018-2020 2
Rules for the allocation of quotas for GHG emissions and formation of reserves of the established number and volume of quotas3
Rules of trading greenhouse gas emission quota and carbon units 4
Compliance
Other Information
1 – http://zan.gov.kz/client/#!/doc/31308/rus 2 – http://zan.gov.kz/client/#!/doc/117046/rus 3 – http://zan.gov.kz/client/#!/doc/112765/rus 4 – http://adilet.zan.kz/rus/docs/V1200007711
03FA
CTSH
EETS
Stat
us R
epor
t 201
9IC
AP
37
TURKEY
ETS DESCRIPTIONIn April 2012, Turkey adopted a new regulatory frame-work for a comprehensive, mandatory MRV system. Monitoring started in 2015 and reporting (of 2015 emissions) began in 2016. Since 2013, Turkey has also been working with the PMR to enhance the MRV regulation through pilot studies in the energy, cement, and refinery sectors. A series of workshops and analytical studies have also been conducted, to explore options for using emis-sions trading and other market-based instruments in the MRV sectors.
A synthesis report outlining carbon market policy options for Turkey was submitted to the Climate Change and Air Management Coordination Board in November 2018. With additional funding from the PMR through 2018, Turkey has been developing draft legislation and improving technical and institutional capacity, to prepare the groundwork for piloting a suitable carbon pricing policy. Turkey is also a candidate to EU accession and thereby aims to complete the environmental obligations of the EU accession (including the EU ETS directive).
ETS in force
ETS scheduled
ETS considered
INSTITUTIONS INVOLVED Ministry of Environment and Urbanization
MRV The Turkish MRV legislation establishes an installa-tion-level system for CO2 emissions for roughly 900 entities. Sector coverage includes the energy sector (combustion fuels >20MW) and industry sectors (coke production, metals, cement, glass, ceramic products, insulation materials, paper and pulp, chemicals over specified threshold sizes/production levels).
MONITORING AND REPORTING: Entities had until October 2014 to submit their first monitoring plans.
VERIFICATION: Entities subsequently submitted veri-fied emissions reports for 2015, 2016, and 2017 to the Ministry of Environment and Urbanization Verifiers were accredited by the Turkish Accreditation Organi-zation in 2018. During 2016-2018, the Ministry of Envi-ronment and Urbanization provided training, exam-ination, and licensing services.
OTHER: Entities that fail to comply with the Turkish MRV regulation are subject to sanctions under the Turkish Environmental Law No. 2872.
Mandatory MRV started in 2015
Developing draft ETS legislation
OVERALL GHG EMISSIONS (EXCL. LULUCF) 496.1 MtCO2e (2016)
OVERALL GHG EMISSIONS BY SECTOR
GHG REDUCTION TARGETSBY 2030: Up to 21% reduction from the BAU scenario (INDC)
Energy (excluding transport) 279.2 (56%)Transport 81.8 (17%)Industry 62.4 (13%)Agriculture 56.5 (11%)Waste 16.2 (3.%)
Compliance
Other Information
Background Information
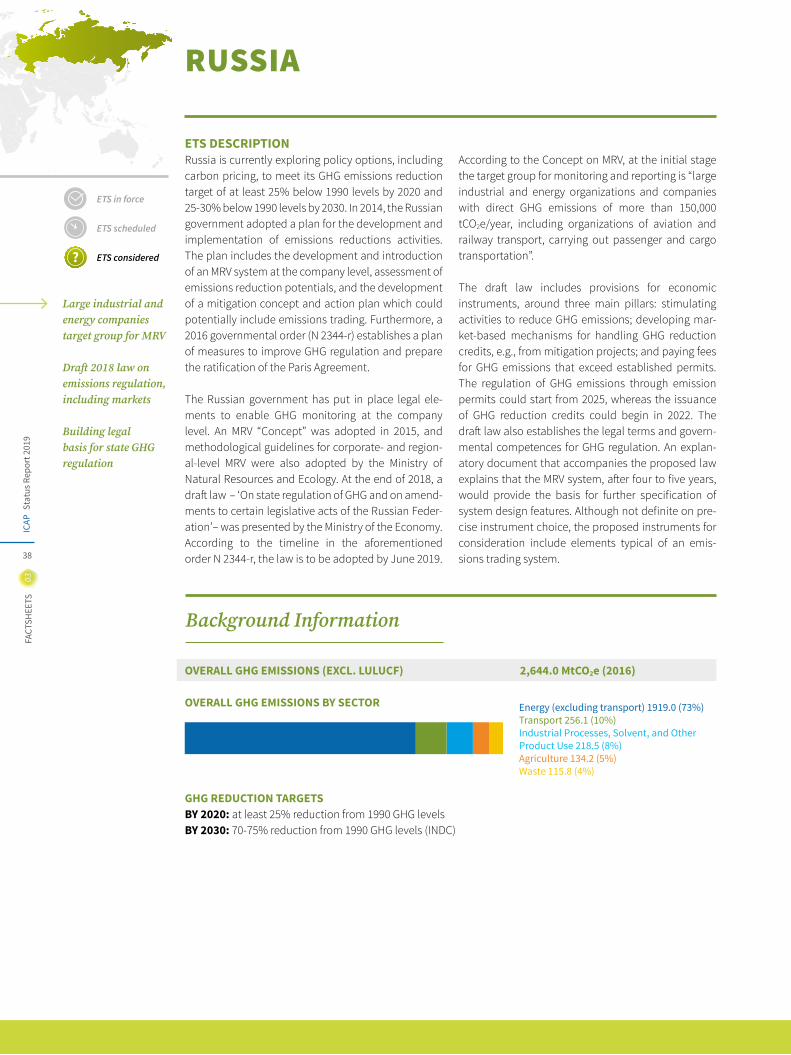
Stat
us R
epor
t 201
9IC
AP
38
03FA
CTSH
EETS
RUSSIA
ETS DESCRIPTIONRussia is currently exploring policy options, including carbon pricing, to meet its GHG emissions reduction target of at least 25% below 1990 levels by 2020 and 25-30% below 1990 levels by 2030. In 2014, the Russian government adopted a plan for the development and implementation of emissions reductions activities. The plan includes the development and introduction of an MRV system at the company level, assessment of emissions reduction potentials, and the development of a mitigation concept and action plan which could potentially include emissions trading. Furthermore, a 2016 governmental order (N 2344-r) establishes a plan of measures to improve GHG regulation and prepare the ratification of the Paris Agreement.
The Russian government has put in place legal ele-ments to enable GHG monitoring at the company level. An MRV “Concept” was adopted in 2015, and methodological guidelines for corporate- and region-al-level MRV were also adopted by the Ministry of Natural Resources and Ecology. At the end of 2018, a draft law – ̒ On state regulation of GHG and on amend-ments to certain legislative acts of the Russian Feder-ation’– was presented by the Ministry of the Economy. According to the timeline in the aforementioned order N 2344-r, the law is to be adopted by June 2019.
According to the Concept on MRV, at the initial stage the target group for monitoring and reporting is “large industrial and energy organizations and companies with direct GHG emissions of more than 150,000 tCO2e/year, including organizations of aviation and railway transport, carrying out passenger and cargo transportation”.
The draft law includes provisions for economic instruments, around three main pillars: stimulating activities to reduce GHG emissions; developing mar-ket-based mechanisms for handling GHG reduction credits, e.g., from mitigation projects; and paying fees for GHG emissions that exceed established permits. The regulation of GHG emissions through emission permits could start from 2025, whereas the issuance of GHG reduction credits could begin in 2022. The draft law also establishes the legal terms and govern-mental competences for GHG regulation. An explan-atory document that accompanies the proposed law explains that the MRV system, after four to five years, would provide the basis for further specification of system design features. Although not definite on pre-cise instrument choice, the proposed instruments for consideration include elements typical of an emis-sions trading system.
ETS in force
ETS scheduled
ETS considered
Energy (excluding transport) 1919.0 (73%)Transport 256.1 (10%)Industrial Processes, Solvent, and Other Product Use 218.5 (8%)Agriculture 134.2 (5%)Waste 115.8 (4%)
OVERALL GHG EMISSIONS (EXCL. LULUCF) 2,644.0 MtCO2e (2016)
OVERALL GHG EMISSIONS BY SECTOR
GHG REDUCTION TARGETSBY 2020: at least 25% reduction from 1990 GHG levelsBY 2030: 70-75% reduction from 1990 GHG levels (INDC)
Large industrial and energy companies target group for MRV
Draft 2018 law on emissions regulation, including markets
Building legal basis for state GHG regulation
Background Information
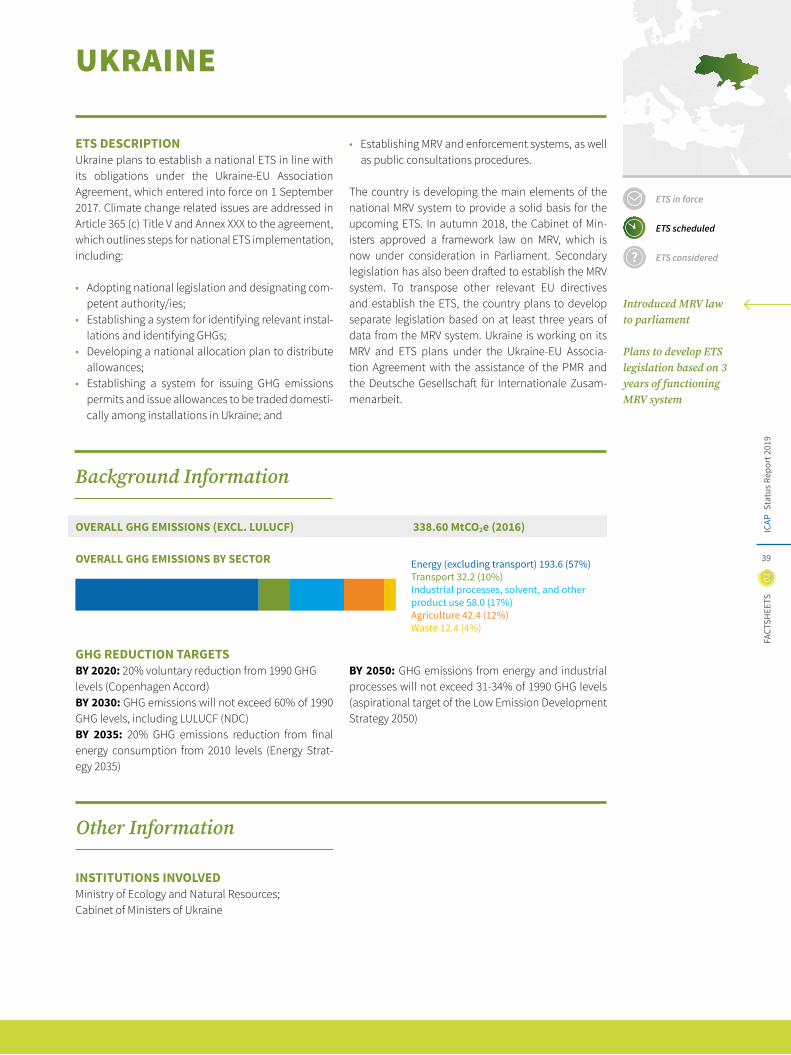
03FA
CTSH
EETS
Stat
us R
epor
t 201
9IC
AP
39
UKRAINE
ETS DESCRIPTIONUkraine plans to establish a national ETS in line with its obligations under the Ukraine-EU Association Agreement, which entered into force on 1 September 2017. Climate change related issues are addressed in Article 365 (c) Title V and Annex XXX to the agreement, which outlines steps for national ETS implementation, including:
• Adopting national legislation and designating com-petent authority/ies;
• Establishing a system for identifying relevant instal-lations and identifying GHGs;
• Developing a national allocation plan to distribute allowances;
• Establishing a system for issuing GHG emissions permits and issue allowances to be traded domesti-cally among installations in Ukraine; and
• Establishing MRV and enforcement systems, as well as public consultations procedures.
The country is developing the main elements of the national MRV system to provide a solid basis for the upcoming ETS. In autumn 2018, the Cabinet of Min-isters approved a framework law on MRV, which is now under consideration in Parliament. Secondary legislation has also been drafted to establish the MRV system. To transpose other relevant EU directives and establish the ETS, the country plans to develop separate legislation based on at least three years of data from the MRV system. Ukraine is working on its MRV and ETS plans under the Ukraine-EU Associa-tion Agreement with the assistance of the PMR and the Deutsche Gesellschaft für Internationale Zusam-menarbeit.
ETS in force
ETS scheduled
ETS considered
INSTITUTIONS INVOLVED Ministry of Ecology and Natural Resources;Cabinet of Ministers of Ukraine
Introduced MRV law to parliament
Plans to develop ETS legislation based on 3 years of functioning MRV system
OVERALL GHG EMISSIONS (EXCL. LULUCF) 338.60 MtCO2e (2016)
OVERALL GHG EMISSIONS BY SECTOR
GHG REDUCTION TARGETSBY 2020: 20% voluntary reduction from 1990 GHG levels (Copenhagen Accord)BY 2030: GHG emissions will not exceed 60% of 1990 GHG levels, including LULUCF (NDC)BY 2035: 20% GHG emissions reduction from final energy consumption from 2010 levels (Energy Strat-egy 2035)
BY 2050: GHG emissions from energy and industrial processes will not exceed 31-34% of 1990 GHG levels (aspirational target of the Low Emission Development Strategy 2050)
Energy (excluding transport) 193.6 (57%)Transport 32.2 (10%)Industrial processes, solvent, and other product use 58.0 (17%)Agriculture 42.4 (12%)Waste 12.4 (4%)
Other Information
Background Information
Stat
us R
epor
t 201
9IC
AP
40
03FA
CTSH
EETS
WESTERN CLIMATE INITIATIVE
The Western Climate Initiative (WCI) is originally an initiative of American state and Canadian provincial govern-ments that aimed at developing a joint regional strategy to reduce GHG emissions via a cap-and-trade program. Eventually, California and Québec independently established cap-and-trade systems using the framework developed through the WCI approach; their first compliance periods started on 1 January 2013. One year later California and Québec linked their systems, creating the first international cap-and-trade system consisting of sub-national jurisdictions. Ontario later developed a program using the WCI framework and launched its cap-and-trade system in 2017, which was linked to the California-Québec regional carbon market on 1 January 2018 until its termination in mid-2018.
WCI, Inc., created in 2011, is a non-profit organization that provides administrative and technical services to member jurisdictions to implement their respective systems. It provides such services to California and Québec, and did so for Ontario until the termination of its ETS. In 2018, WCI, Inc. began supporting Nova Scotia for the establishment of the province’s own cap-and-trade system, which began operating in 2019.
Aim develop joint regional strategy to reduce emissions through cap and trade
WCI, Inc. provides administrative and technical support
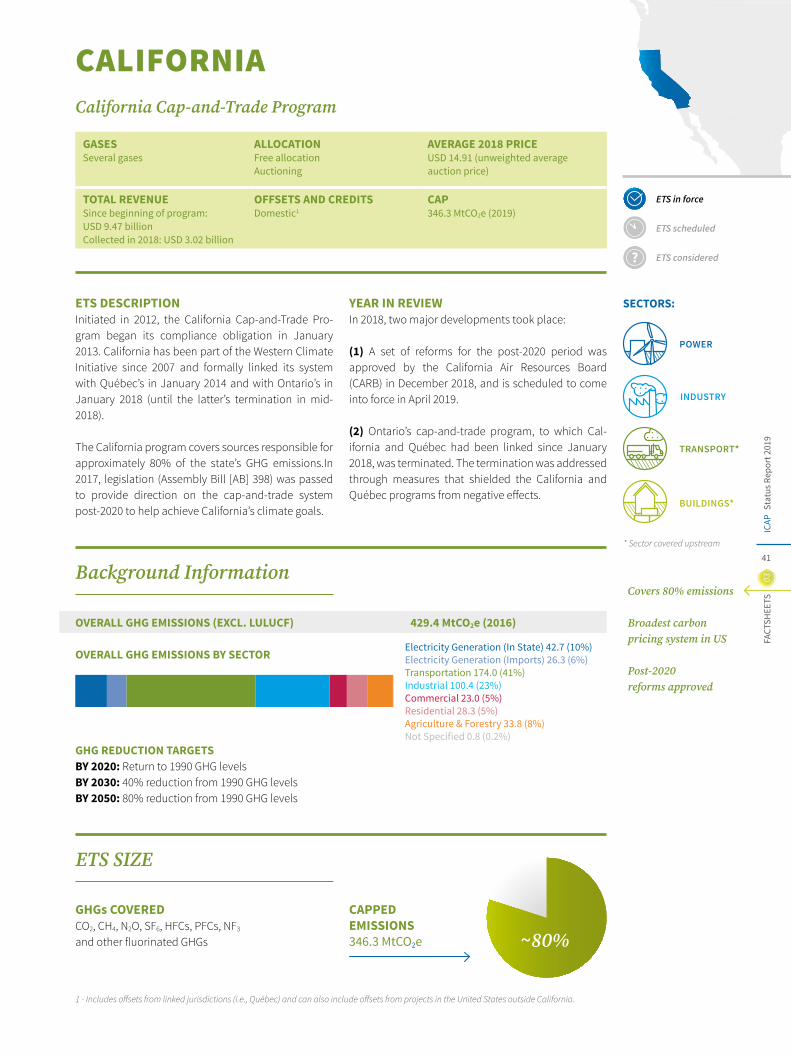
03FA
CTSH
EETS
Stat
us R
epor
t 201
9IC
AP
41
ETS in force
ETS scheduled
ETS considered
SECTORS:
POWER
INDUSTRY
TRANSPORT*
BUILDINGS*
* Sector covered upstream
GASESSeveral gases
ALLOCATION Free allocation Auctioning
AVERAGE 2018 PRICEUSD 14.91 (unweighted average auction price)
TOTAL REVENUESince beginning of program: USD 9.47 billionCollected in 2018: USD 3.02 billion
OFFSETS AND CREDITS Domestic1
CAP 346.3 MtCO2e (2019)
CALIFORNIACalifornia Cap-and-Trade Program
ETS DESCRIPTIONInitiated in 2012, the California Cap-and-Trade Pro-gram began its compliance obligation in January 2013. California has been part of the Western Climate Initiative since 2007 and formally linked its system with Québec’s in January 2014 and with Ontario’s in January 2018 (until the latter’s termination in mid-2018).
The California program covers sources responsible for approximately 80% of the state’s GHG emissions.In 2017, legislation (Assembly Bill [AB] 398) was passed to provide direction on the cap-and-trade system post-2020 to help achieve California’s climate goals.
YEAR IN REVIEWIn 2018, two major developments took place:
(1) A set of reforms for the post-2020 period was approved by the California Air Resources Board (CARB) in December 2018, and is scheduled to come into force in April 2019.
(2) Ontario’s cap-and-trade program, to which Cal-ifornia and Québec had been linked since January 2018, was terminated. The termination was addressed through measures that shielded the California and Québec programs from negative effects.
Covers 80% emissions
Broadest carbon pricing system in US
Post-2020 reforms approved
Background Information
Electricity Generation (In State) 42.7 (10%)Electricity Generation (Imports) 26.3 (6%)Transportation 174.0 (41%)Industrial 100.4 (23%)Commercial 23.0 (5%)Residential 28.3 (5%)Agriculture & Forestry 33.8 (8%)Not Specified 0.8 (0.2%)
OVERALL GHG EMISSIONS (EXCL. LULUCF) 429.4 MtCO2e (2016)
OVERALL GHG EMISSIONS BY SECTOR
GHG REDUCTION TARGETSBY 2020: Return to 1990 GHG levelsBY 2030: 40% reduction from 1990 GHG levelsBY 2050: 80% reduction from 1990 GHG levels
ETS SIZE
CAPPED EMISSIONS346.3 MtCO2e ~80%
GHGs COVEREDCO2, CH4, N2O, SF6, HFCs, PFCs, NF3 and other fluorinated GHGs
1 - Includes offsets from linked jurisdictions (i.e., Québec) and can also include offsets from projects in the United States outside California.
Stat
us R
epor
t 201
9IC
AP
42
03FA
CTSH
EETS
SECTORS & THRESHOLDSFIRST COMPLIANCE PERIOD (2013-2014): Covered sectors include those which have one or more of the following processes or operations: large industrial facilities (including cement, glass, hydrogen, iron and steel, lead, lime manufacturing, nitric acid, petroleum and natural gas systems, petro-leum refining, pulp and paper manufacturing, includ-ing cogeneration facilities co-owned/operated at any of these facilities), electricity generation, electricity imports, other stationary combustion, and CO2 sup-pliers.
SECOND COMPLIANCE PERIOD (2015-2017) AND BEYOND: In addition to the sectors listed above, suppliers of natural gas, suppliers of reformulated blendstock for oxygenate blending and distillate fuel oil, suppliers of liquid petroleum gas in California, and suppliers of liq-uefied natural gas.
INCLUSION THRESHOLDS: Facilities ≥25,000 tCO2e/data year.
POINT OF REGULATIONMixed
NUMBER OF ENTITIES~500 entities (2015-2017)
CAPThe caps listed below are in MtCO2e.The cap decline factor is about 3.3% between 2018 and 2019 and is rising to an average of over 4.1% in the 2021-2030 period.
FIRST COMPLIANCE PERIOD (2013-2014): 2013: 162.8; 2014: 159.7
SECOND COMPLIANCE PERIOD (2015-2017): 2015: 394.5; 2016: 382.4; 2017: 370.4
THIRD COMPLIANCE PERIOD (2018-2020): 2018: 358.3; 2019: 346.3; 2020: 334.2
FROM 2021 TO 2031, every compliance period will be three years. The annual caps are: 2021: 320.8; 2022: 307.5; 2023: 294.1; 2024: 280.7; 2025: 267.4; 2026: 254.0; 2027: 240.6; 2028: 227.3; 2029: 213.9; 2030: 200.5; 2031: 193.8
TRADING PERIODSThe California Cap-and-Trade Program is structured around compliance periods (see “Compliance” below). A cap trajectory until 2030 has been set (see “Cap” above).
Allowances are allocated and auctioned with calendar year vintages. Some allowances from future vintages are offered at each auction and may be traded but not used for compliance until the compliance date for the vintage year.
ALLOCATIONAllowances are distributed via auction and/or free allocation.
FREE ALLOCATION: Industrial facilities: Facilities receive free allow-ances for transition assistance and to prevent leakage. The amount is determined by specific benchmarks, production volumes, general cap adjustment factor, and an assistance factor based on assessment of leak-age risk.
Leakage risk is measured through emissions intensity and trade exposure and used to define assistance fac-tors until 2018. From 2018, assistance factors are set at 100% for all sectors receiving free allocation.
For the post-2020 period, AB 398 specifies an assis-tance factor of 100%, meaning there will be no differ-entiation based on leakage risk for sectors receiving free allocation. Recent regulatory changes also set third compliance period assistance factors to 100% for all sectors. There is no cap on the total amount of industrial allocation.
Free allocation is provided for transition assistance to public wholesale water entities, legacy contract gen-erators, universities, and public service facilities.
Consignment: Electrical distribution utilities and natural gas suppliers: Utilities receive allowances on behalf of their ratepayers. All natural gas and electri-cal utilities must use the allowance value for ratepayer benefit and for emissions reductions.
Phases & Allocation
03FA
CTSH
EETS
Stat
us R
epor
t 201
9IC
AP
43
California Cap-and-Trade Program
CALIFORNIA
BANKING AND BORROWING Banking is allowed, but the emitter is subject to a gen-eral holding limit. Borrowing of future vintage allowances is not allowed.
OFFSETS AND CREDITSQUANTITATIVE LIMIT: Up to 8% of each entity’s compliance obligation.
QUALITATIVE LIMIT: Currently, six domestic offset types are accepted as compliance units originating from projects carried out according to six “protocols”:(1) US forest projects;(2) Urban forest projects;(3) Livestock projects (methane management); (4) Ozone depleting substances projects;(5) Mine methane capture (MMC) projects; and(6) Rice cultivation projects.
FROM 2021: AB 398 lays out two significant changes to the offset program from 2021 onwards:
(1) The share of offsets that can be used to fulfill the compliance obligation will reduce to 4% between 2021-2025 and will remain at 6% thereafter.
(2) At least half of the offset usage limits post-2020 would need to result in direct environmental benefits (DEBS) in the State of California. The DEBS require-ment is operationalized through a performance stan-dard, which defines DEBS eligibility by offset activity type. Offset projects implemented outside of Califor-nia may still result in DEBS based on scientific evi-dence and project data provided. For example, affor-estation projects outside California could also provide benefits within California by improving the quality of waters flowing through the state. Recent regulatory amendments specify the exact criteria that will be used for determining DEBS.
MARKET STABILITY PROVISIONSAuction Reserve Price: USD 15.62 per allowance in 2019. The auction reserve price increases annually by 5% plus inflation, as measured by the Consumer Price Index.
Reserve: An Allowance Price Containment Reserve allocates allowances from various budgets (1% from budget years 2013-2014; 4% from budget years 2015-2017; and 7% from budget years 2018-2020). AB 398 requires two-thirds of the reserve allowances that remain on 31 December 2017 to be used to populate the two price containment points starting in 2021. The reserve sale administrator can sell accumulated allowances on a regular basis in three equal price tiers. For 2019, these prices are USD 58.34, 65.65, and 72.93. Tier prices increase by 5% plus inflation (as measured by the Consumer Price Index).
Through 2020, if all the allowances in the reserve are sold, allowances from future years are transferred to the reserve and made available for sale.
Price Containment Points: AB 398 reforms the price management provisions starting in 2021: two price containment points triggered at increasing price lev-els will be filled with remaining APCR allowances. A third price level will be a price ceiling.
At this level, allowances (or if no allowances remain, price ceiling units) can be bought in unlimited quan-tities, with the revenues having to be invested in real, permanent, quantifiable, verifiable, enforceable, and additional emissions reductions on at least a metric tonne for metric tonne basis.
In 2021, the two cost containment reserve trigger points and the price ceiling will be set at USD 41.40, 53.20, and 65.00, respectively.
AUCTIONING: In 2018, about 50% of allowances were available through auction, including both allow-ances owned by CARB and allowances consigned to auction by utilities. The remainder of allowances was allocated for free.
Flexibility
Stat
us R
epor
t 201
9IC
AP
44
03FA
CTSH
EETS
COMPLIANCE PERIOD Between two and three years. All allowances for emis-sions from the whole compliance period must be surrendered by 1 November (or the first business day thereafter) of the year following the last year of a com-pliance period. A share of allowances (usually about 30% of last year’s emissions) must be surrendered annually.
FIRST COMPLIANCE PERIOD: 2013-2014SECOND COMPLIANCE PERIOD: 2015-2017 THIRD COMPLIANCE PERIOD: 2018-2020FOURTH COMPLIANCE PERIOD starts on 1 January 2021 and ends on 31 December 2023, and each sub-sequent compliance period will be three years long.
MRV REPORTING FREQUENCY: One year
VERIFICATION: Emission data reports and their underlying data require independent third-party ver-ification annually for all entities covered by the pro-gram (generally defined as entities with emissions that equal to or exceed 25,000 tCO2e per year).
OTHER: Reporting is required for most operators at or above 10,000 tCO2e per year. Operators must imple-ment internal audits, quality assurance, and con-trol systems for the reporting program and the data reported.
ENFORCEMENT Penalties may be assessed pursuant to ‘Health and Safety Code Section 38580’ (misdemeanor, fines, and possibly imprisonment).
There are separate and substantial penalties for mis- or non-reporting under the ‘Mandatory Greenhouse Gas Reporting Regulation.’
LINKS WITH OTHER SYSTEMS California linked with Québec’s ETS on 1 January 2014. The two extended their joint market by linking with
Ontario on 1 January 2018 until the termination of Ontario’s system in mid-2018.
INSTITUTIONS INVOLVED California Air Resources Board (CARB)
EVALUATION/ETS REVIEWPursuant to requirements in existing legislation (AB 32, AB 197, and AB 398), CARB must update the Cal-ifornia Climate Change Scoping Plan at least every five years and must provide annual reports to various committees of the legislature and the board. These updates and reports provide opportunities for future review of the cap-and-trade program’s progress in meeting the 2030 target.
USE OF REVENUESRevenue from Auction of California-owned Allow-ances: Most of California’s revenue goes to the Green-house Gas Reduction Fund, of which at least 35%
must benefit disadvantaged and low-income commu-nities. The fund also invests the proceeds in projects that reduce GHG emissions.
Revenue from Auction of Utility-owned Allow-ances: Electric and natural gas utilities are allocated allowances, a portion of which must be consigned to auction. Auction proceeds must be used for ratepayer benefit and for emissions reductions.
IMPLEMENTING LEGISLATIONGlobal Warming Solutions Act of 2006 (AB 32)1
AB 3982
Current regulation can be found on the CARB website.3
Compliance
Linking
Other Information
1 – https://www.arb.ca.gov/cc/docs/ab32text.pdf ; 2 – http://leginfo.legislature.ca.gov/faces/billStatusClient.xhtml?bill_id=201720180AB398 ; 3 – https://www.arb.ca.gov/cc/capandtrade/capandtrade.htm;
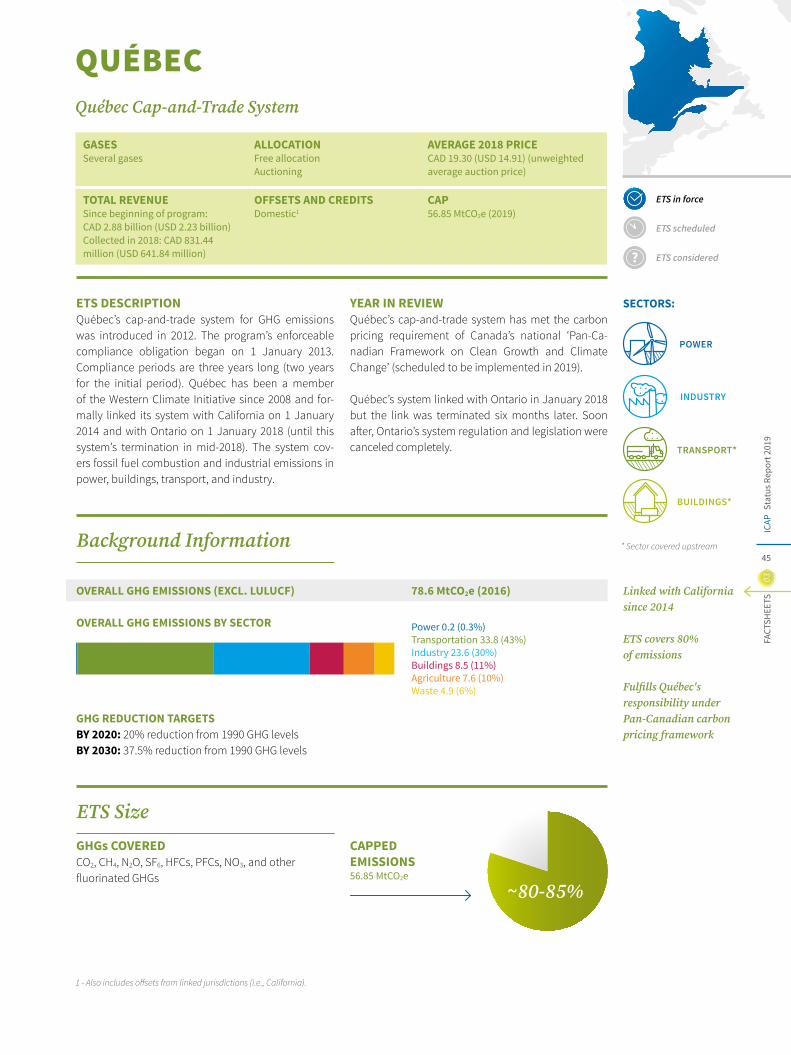
03FA
CTSH
EETS
Stat
us R
epor
t 201
9IC
AP
45
GASESSeveral gases
ALLOCATION Free allocation Auctioning
AVERAGE 2018 PRICECAD 19.30 (USD 14.91) (unweighted average auction price)
TOTAL REVENUE Since beginning of program: CAD 2.88 billion (USD 2.23 billion)Collected in 2018: CAD 831.44 million (USD 641.84 million)
OFFSETS AND CREDITS Domestic1
CAP56.85 MtCO2e (2019)
QUÉBECQuébec Cap-and-Trade System
ETS DESCRIPTIONQuébec’s cap-and-trade system for GHG emissions was introduced in 2012. The program’s enforceable compliance obligation began on 1 January 2013. Compliance periods are three years long (two years for the initial period). Québec has been a member of the Western Climate Initiative since 2008 and for-mally linked its system with California on 1 January 2014 and with Ontario on 1 January 2018 (until this system’s termination in mid-2018). The system cov-ers fossil fuel combustion and industrial emissions in power, buildings, transport, and industry.
YEAR IN REVIEWQuébec’s cap-and-trade system has met the carbon pricing requirement of Canada’s national ‘Pan-Ca-nadian Framework on Clean Growth and Climate Change’ (scheduled to be implemented in 2019).
Québec’s system linked with Ontario in January 2018 but the link was terminated six months later. Soon after, Ontario’s system regulation and legislation were canceled completely.
GHG REDUCTION TARGETS BY 2020: 20% reduction from 1990 GHG levelsBY 2030: 37.5% reduction from 1990 GHG levels
OVERALL GHG EMISSIONS (EXCL. LULUCF) 78.6 MtCO2e (2016)
ETS in force
ETS scheduled
ETS considered
SECTORS:
POWER
INDUSTRY
~80-85%
CAPPED EMISSIONS 56.85 MtCO2e
GHGs COVEREDCO2, CH4, N2O, SF6, HFCs, PFCs, NO3, and other fluorinated GHGs
Linked with California since 2014
ETS covers 80% of emissions
Fulfills Québec's responsibility under Pan-Canadian carbon pricing framework
* Sector covered upstream
TRANSPORT*
BUILDINGS*
Power 0.2 (0.3%)Transportation 33.8 (43%)Industry 23.6 (30%)Buildings 8.5 (11%)Agriculture 7.6 (10%)Waste 4.9 (6%)
OVERALL GHG EMISSIONS BY SECTOR
1 - Also includes offsets from linked jurisdictions (i.e., California).
Background Information
ETS Size
Stat
us R
epor
t 201
9IC
AP
46
03FA
CTSH
EETS
SECTORS & THRESHOLDSFIRST COMPLIANCE PERIOD (2013-2014): Electricity, Industry.
SECOND COMPLIANCE PERIOD (2015-2017) AND THIRD COMPLIANCE PERIOD (2018-2020): Sectors of first compliance period as well as distribution and importation of fuels used for consumption in the transport and building sectors, and in small- and medium-sized businesses.
INCLUSION THRESHOLDS: >25,000 tCO2e/year. As of 2016, fuel distributors that have distributed 200L or more of fuel (in 2015) are also subject to inclusion even if the combustion of their fuel resulted in the emission of less than 25,000 tCO2e.
VOLUNTARY EMITTERS (OPT-IN COVERED ENTI-TIES): Starting in 2019, emitters from capped sectors that reported emissions between 10,000 tCO2e/year and 25,000 tCO2e/year may voluntarily register to the cap-and-trade system as a covered entity. If their production activity is eligible, they could receive free allocation.
POINT OF REGULATIONMixed
NUMBER OF ENTITIES149 (74 industrial entities, 75 fuel distributors) (2017)
CAPThe following caps are given in millions of allowances:
FIRST COMPLIANCE PERIOD (2013-2014): 23.20 each yearSECOND COMPLIANCE PERIOD (2015-2017): 2015: 65.30; 2016: 63.19; 2017: 61.08THIRD COMPLIANCE PERIOD (2018-2020): 2018: 58.96; 2019: 56.85; 2020: 54.74FOURTH COMPLIANCE PERIOD (2021-2023):2021: 55.26; 2022: 54.02; 2023: 52.79 FIFTH COMPLIANCE PERIOD (2024-2026):2024: 51.55; 2025: 50.31; 2026: 49.08; SIXTH COMPLIANCE PERIOD (2027-2029):2027: 47.84; 2028: 46.61; 2029: 45.37
After a slight increase in the cap in 2021 (due to an adjustment of the global warming potential of differ-ent GHGs), the cap will reduce by about 1.24 million allowances per year. This will result in a cap of 44.14 million allowances in 2030.
TRADING PERIODSThe Québec cap-and-trade system is structured around three-year compliance periods, except for the first period (see “Compliance” below). A cap trajectory until 2030 has been set (see “Cap”). Allowances are allocated and auctioned with calendar vintage years.
ALLOCATIONFREE ALLOCATION: Emission-intensive sectors sub-ject to international competition receive a portion of free allowances. Eligible sectors include: aluminum, lime, cement, chemical and petrochemicals, metal-lurgy, mining and pelletizing, pulp and paper, petro-leum refining, and others (manufacturers of glass food containers, electrodes, gypsum products, and some agro-food products). Free allocation is generally based on benchmarks either for inputs of raw materials or for product-based benchmarks (output-based allocation).
First compliance period (2013-2014): Historical emission intensity adjusted for production level and by type of emission, with 100% allocation for process emissions, 80% for combustion emissions and 100% for emissions from other sources.
Second (2015-2017) and subsequent periods: Free allocation is based on increasingly strict inten-sity targets (declining emissions intensity per activity) and production levels. Since production volumes can vary, increasing intensity targets does not guarantee an absolute reduction in free allocation but incentive reductions of emissions intensity.
As of 2019, allocation of free allowances is made avail-able to voluntary emitters (also known as opt-in cov-ered entities) in alignment with what has been estab-lished for regulated entities.
Assistance factors: Assistance factors (AFs) for the 2021-2023 period vary between 1 (100%) and 0.6 (60%), with the lowest AFs for electricity and steam production and most industrial production having AFs of 1 (see Table 7 in the Appendix of the Regulation for details).
AUCTIONING: Generally, electricity and fuel distribu-tors have to buy 100% of their allowances. Allowances are auctioned quarterly.
Phases & Allocation
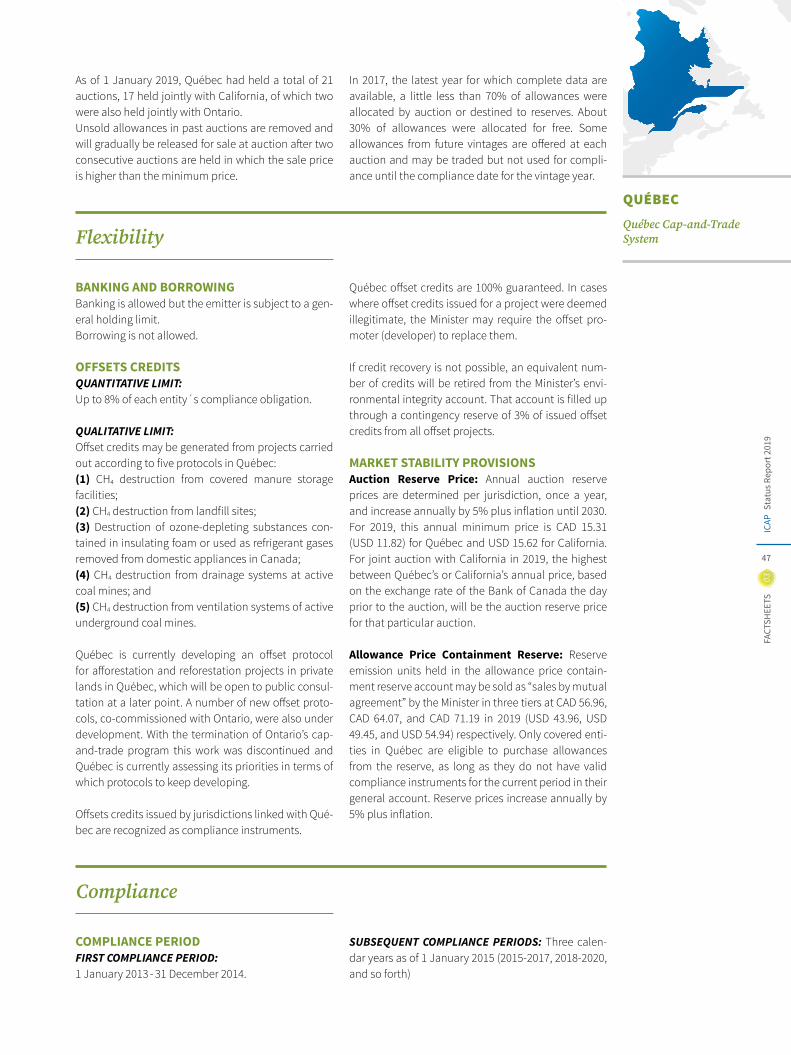
03FA
CTSH
EETS
Stat
us R
epor
t 201
9IC
AP
47
As of 1 January 2019, Québec had held a total of 21 auctions, 17 held jointly with California, of which two were also held jointly with Ontario. Unsold allowances in past auctions are removed and will gradually be released for sale at auction after two consecutive auctions are held in which the sale price is higher than the minimum price.
In 2017, the latest year for which complete data are available, a little less than 70% of allowances were allocated by auction or destined to reserves. About 30% of allowances were allocated for free. Some allowances from future vintages are offered at each auction and may be traded but not used for compli-ance until the compliance date for the vintage year.
BANKING AND BORROWING Banking is allowed but the emitter is subject to a gen-eral holding limit. Borrowing is not allowed.
OFFSETS CREDITSQUANTITATIVE LIMIT: Up to 8% of each entity´s compliance obligation.
QUALITATIVE LIMIT: Offset credits may be generated from projects carried out according to five protocols in Québec: (1) CH4 destruction from covered manure storage facilities;(2) CH4 destruction from landfill sites;(3) Destruction of ozone-depleting substances con-tained in insulating foam or used as refrigerant gases removed from domestic appliances in Canada;(4) CH4 destruction from drainage systems at active coal mines; and(5) CH4 destruction from ventilation systems of active underground coal mines.
Québec is currently developing an offset protocol for afforestation and reforestation projects in private lands in Québec, which will be open to public consul-tation at a later point. A number of new offset proto-cols, co-commissioned with Ontario, were also under development. With the termination of Ontario’s cap-and-trade program this work was discontinued and Québec is currently assessing its priorities in terms of which protocols to keep developing.
Offsets credits issued by jurisdictions linked with Qué-bec are recognized as compliance instruments.
Québec offset credits are 100% guaranteed. In cases where offset credits issued for a project were deemed illegitimate, the Minister may require the offset pro-moter (developer) to replace them.
If credit recovery is not possible, an equivalent num-ber of credits will be retired from the Minister’s envi-ronmental integrity account. That account is filled up through a contingency reserve of 3% of issued offset credits from all offset projects.
MARKET STABILITY PROVISIONS Auction Reserve Price: Annual auction reserve prices are determined per jurisdiction, once a year, and increase annually by 5% plus inflation until 2030. For 2019, this annual minimum price is CAD 15.31 (USD 11.82) for Québec and USD 15.62 for California. For joint auction with California in 2019, the highest between Québec’s or California’s annual price, based on the exchange rate of the Bank of Canada the day prior to the auction, will be the auction reserve price for that particular auction.
Allowance Price Containment Reserve: Reserve emission units held in the allowance price contain-ment reserve account may be sold as “sales by mutual agreement” by the Minister in three tiers at CAD 56.96, CAD 64.07, and CAD 71.19 in 2019 (USD 43.96, USD 49.45, and USD 54.94) respectively. Only covered enti-ties in Québec are eligible to purchase allowances from the reserve, as long as they do not have valid compliance instruments for the current period in their general account. Reserve prices increase annually by 5% plus inflation.
COMPLIANCE PERIOD FIRST COMPLIANCE PERIOD: 1 January 2013 - 31 December 2014.
SUBSEQUENT COMPLIANCE PERIODS: Three calen-dar years as of 1 January 2015 (2015-2017, 2018-2020, and so forth)
Flexibility
Compliance
Québec Cap-and-Trade System
QUÉBEC
Stat
us R
epor
t 201
9IC
AP
48
03FA
CTSH
EETS
Allowances must be surrendered by 1 November fol-lowing the end of the compliance period
MRV REPORTING FREQUENCY: One year. Report to be sub-mitted by 1 June of each year.
VERIFICATION: Emitters (and voluntary emitters) participating in ETS (higher threshold than those with regulatory reporting requirement) must send a verifi-cation report carried out by an organization accred-ited to ISO 14065.
FRAMEWORK: Regulation on the mandatory reporting of certain emissions of contaminants into the atmo-sphere is outlined in the ‘Environment Quality Act.’
ENFORCEMENT For noncompliance, entities can be fined CAD 3,000-500,000 (USD 2,315-385,875) and spend up to 18 months in jail in the case of a natural person, and CAD 10,000-3,000,000 (USD 7,718-2,315,252) in the case of a legal person.
Fines are doubled in the case of a second offence. In addition, the Minister of the Environment and the Fight against Climate Change may suspend the allo-cation to any emitter in case of noncompliance.
A covered entity that fails to cover its real and verified GHG emissions with enough allowances on 1 Novem-ber following the end of a compliance period must remit each missing allowance and will have to remit three additional allowances for each allowance it failed to remit to the minister.
The person with legal responsibility for that entity would also be committing an infraction, subject to financial penalties, for each compliance instrument not surrendered as part of the compliance obligation.
LINKS WITH OTHER SYSTEMS On 1 January 2014, Québec linked with California. On 1 January 2018, Québec and California linked with Ontario. The latter link was effectively abolished in mid-2018 when Ontario revoked and later fully can-celed its system.
INSTITUTIONS INVOLVED Ministère de l’Environnement et de la Lutte contre les changements climatiques (Ministry of the Environ-ment and the Fight Against Climate Change); Direction générale de la Réglementation carbone et des données d’émission (Carbon Market Directorate)
EVALUATION/ETS REVIEWThe regulation has been adjusted almost annually to implement changes and adjustments and, when necessary, maintain harmonization with linked juris-dictions.
USE OF REVENUESAll auction revenues go to the Québec Green Fund,
which is dedicated to the fight against climate change through Québec’s 2013-2020 Climate Action Plan. Examples for spending include energy efficiency mea-sures as well as public transport initiatives.
IMPLEMENTING LEGISLATIONRegulation respecting a cap-and-trade system for greenhouse gas emission allowances1
Amendments are listed and linked on the site of the Québec ministry.2
Environment Quality Act3
Linking
Other Information
1 – http://legisquebec.gouv.qc.ca/en/ShowDoc/cr/Q-2,%20r.%2046.1 2 – http://www.environnement.gouv.qc.ca/changements/carbone/documentation-en.htm#regulations 3 – http://legisquebec.gouv.qc.ca/en/ShowDoc/cs/Q-2/
03FA
CTSH
EETS
Stat
us R
epor
t 201
9IC
AP
49
CANADA
In December 2016, Canada’s First Ministers adopted the Pan-Canadian Framework on Clean Growth and Climate Change (PCF)1. The PCF is Canada’s plan to fight climate change, build resilience to the changing climate, and drive clean economic growth. It puts Can-ada on the path to meet its GHG reduction target of 30% below 2005 levels by 2030.
The PCF includes joint and individual commitments by federal, provincial, and territorial governments, and has been developed with input from the public, busi-nesses, civil society, and Indigenous Peoples. A central part of the Framework is a commitment to price car-bon pollution across Canada by 2019.
The Pan-Canadian Framework sets a federal bench-mark, requiring all provinces and territories to imple-ment carbon pollution pricing systems with a certain minimum level of stringency by 2019. To operational-ize this level of stringency, the PCF defines a federal benchmark as follows: if the federal government deter-mines that the benchmark is not met in a province or territory, a federal backstop measure is implemented.
Multiple options are available to comply with the fed-eral benchmark. The “Pan-Canadian approach to pric-ing carbon pollution” and associated guidance out-lines three main options:
(1) A carbon tax covering a scope comparable to that of British Columbia’s carbon tax, i.e., covering fuels combusted for electricity, heating, transport, and industry. For this option, the carbon price has to increase by CAD 10 (USD 7.72) per year to reach CAD 50 (USD 38.59)/tCO2e by 2022 in order to meet the bench-mark stringency.
(2) A combination (“hybrid”) of a carbon tax for fuels delivered to consumers and an intensity-based base-line-and-credit system for industrial emitters, with the same price trajectory as above. For the baseline-and-credit systems, benchmarks can be set based on pro-vincial/territorial circumstances but should also reflect best-in-class performance.
(3) A broad cap-and-trade system, with coverage com-parable to British Columbia’s carbon tax – including large industry. For these systems, modeling has to demonstrate that expected emissions reductions are at least equal to those that would have resulted in a
carbon tax with the above-described price trajectory. In addition, the provincial/territorial emission reduc-tion target must be set equal to or greater than the fed-eral reduction target (30% below 2005 levels by 2030).
DETERMINATION:Provinces and territories were required to present plans for a carbon pollution pricing instrument by September 2018. Systems were already in place in the Canadian provinces of Alberta, British Columbia, and Québec (operating a cap-and-trade system linked with California). In January 2019, two additional systems were launched: Nova Scotia’s cap-and-trade program, as well as Newfoundland and Labrador’s carbon tax and output-based pricing system for industrial emit-ters. All these provinces were found to meet the fed-erally-set benchmark entirely with their own carbon pricing instruments.
Saskatchewan’s system for large emitters started in January 2019. It is complemented by the federal back-stop, as it does not cover all sectors laid out by the benchmark. The federal output-based pricing system is being applied to electricity generation and to natural gas transmission pipelines. The federal fuel charge will also apply in the province starting in April 2019.
Prince Edward Island plans to establish a carbon levy to some sectors in April 2019, and the federal out-put-based pricing system (see below) will apply in the province.
Ontario, Manitoba, and New Brunswick do not cur-rently have their own carbon pricing systems and the federal backstop will be fully applied.
The Northwest Territories plan a territorial carbon tax in July 2019. In the Yukon and Nunavut, the federal backstop will be applied starting in July 2019, with some exemptions for aviation fuels and electricity for remote communities, reflecting their unique circum-stances.
From 2019 onwards, there will be an annual verifica-tion process to ensure provincial/territorial carbon pollution pricing systems continue to meet the bench-mark. The federal government will also monitor major changes to provincial/territorial systems on an ongo-ing basis.
Committed to pricing carbon across Canada by 2019
Federal backstop measure for provinces and territories available
Three main options are a carbon tax, ETS or hybrid approach
1 - Saskatchewan and Manitoba did not adopt the PCF at that time. Manitoba has since joined.
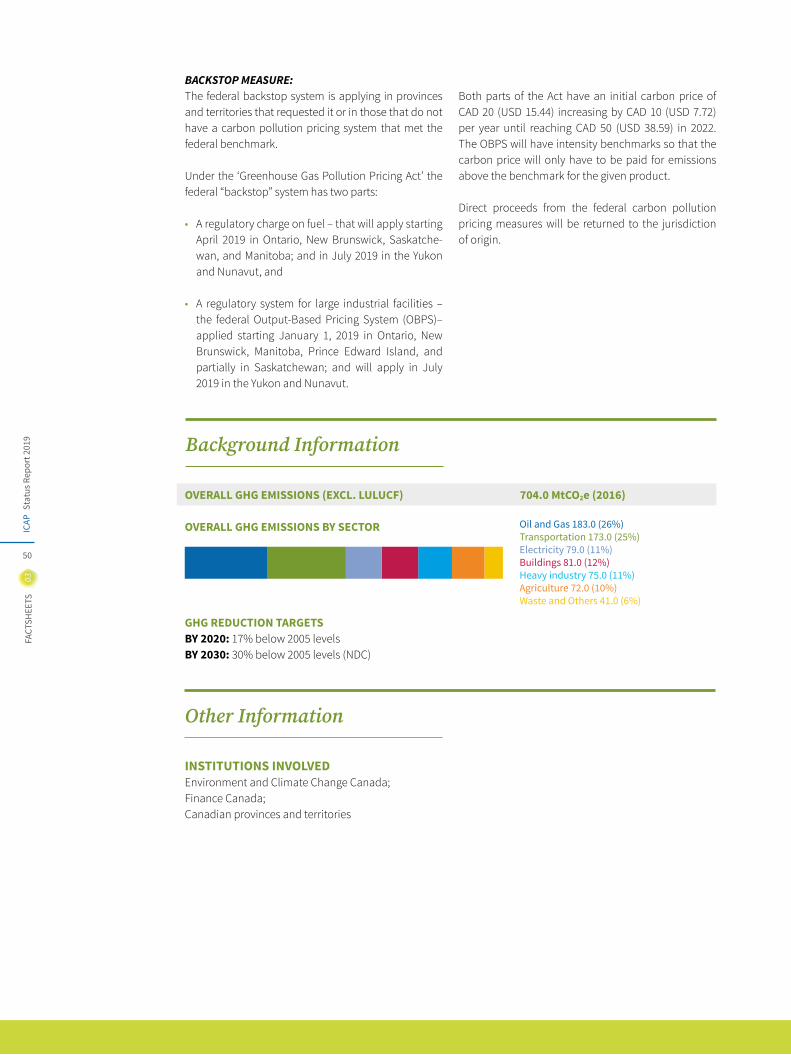
Stat
us R
epor
t 201
9IC
AP
50
03FA
CTSH
EETS
BACKSTOP MEASURE:The federal backstop system is applying in provinces and territories that requested it or in those that do not have a carbon pollution pricing system that met the federal benchmark.
Under the ‘Greenhouse Gas Pollution Pricing Act’ the federal “backstop” system has two parts:
• A regulatory charge on fuel – that will apply starting April 2019 in Ontario, New Brunswick, Saskatche-wan, and Manitoba; and in July 2019 in the Yukon and Nunavut, and
• A regulatory system for large industrial facilities –the federal Output-Based Pricing System (OBPS)–applied starting January 1, 2019 in Ontario, New Brunswick, Manitoba, Prince Edward Island, and partially in Saskatchewan; and will apply in July 2019 in the Yukon and Nunavut.
Both parts of the Act have an initial carbon price of CAD 20 (USD 15.44) increasing by CAD 10 (USD 7.72) per year until reaching CAD 50 (USD 38.59) in 2022. The OBPS will have intensity benchmarks so that the carbon price will only have to be paid for emissions above the benchmark for the given product.
Direct proceeds from the federal carbon pollution pricing measures will be returned to the jurisdiction of origin.
INSTITUTIONS INVOLVED Environment and Climate Change Canada; Finance Canada; Canadian provinces and territories
OVERALL GHG EMISSIONS (EXCL. LULUCF) 704.0 MtCO2e (2016)
OVERALL GHG EMISSIONS BY SECTOR
GHG REDUCTION TARGETSBY 2020: 17% below 2005 levels BY 2030: 30% below 2005 levels (NDC)
Other Information
Background Information
Oil and Gas 183.0 (26%)Transportation 173.0 (25%)Electricity 79.0 (11%)Buildings 81.0 (12%)Heavy industry 75.0 (11%)Agriculture 72.0 (10%)Waste and Others 41.0 (6%)
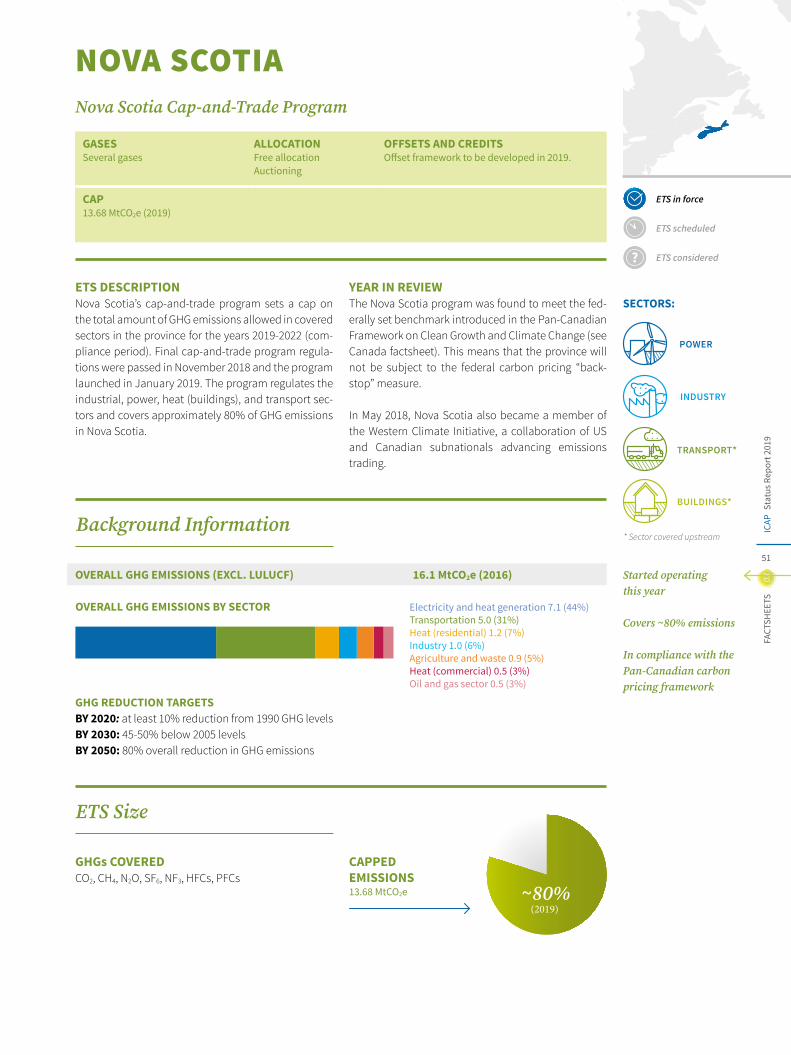
03FA
CTSH
EETS
Stat
us R
epor
t 201
9IC
AP
51
~80% (2019)
GASES Several gases
ALLOCATIONFree allocation Auctioning
OFFSETS AND CREDITS Offset framework to be developed in 2019.
CAP13.68 MtCO2e (2019)
NOVA SCOTIANova Scotia Cap-and-Trade Program
ETS DESCRIPTIONNova Scotia’s cap-and-trade program sets a cap on the total amount of GHG emissions allowed in covered sectors in the province for the years 2019-2022 (com-pliance period). Final cap-and-trade program regula-tions were passed in November 2018 and the program launched in January 2019. The program regulates the industrial, power, heat (buildings), and transport sec-tors and covers approximately 80% of GHG emissions in Nova Scotia.
YEAR IN REVIEWThe Nova Scotia program was found to meet the fed-erally set benchmark introduced in the Pan-Canadian Framework on Clean Growth and Climate Change (see Canada factsheet). This means that the province will not be subject to the federal carbon pricing “back-stop” measure.
In May 2018, Nova Scotia also became a member of the Western Climate Initiative, a collaboration of US and Canadian subnationals advancing emissions trading.
GHG REDUCTION TARGETS BY 2020: at least 10% reduction from 1990 GHG levelsBY 2030: 45-50% below 2005 levelsBY 2050: 80% overall reduction in GHG emissions
OVERALL GHG EMISSIONS (EXCL. LULUCF) 16.1 MtCO2e (2016)
CAPPED EMISSIONS13.68 MtCO2e
GHGs COVEREDCO2, CH4, N2O, SF6, NF3, HFCs, PFCs
ETS in force
ETS scheduled
ETS considered
SECTORS:
POWER
INDUSTRY
Started operating this year
Covers ~80% emissions
In compliance with the Pan-Canadian carbon pricing framework
* Sector covered upstream
TRANSPORT*
BUILDINGS*
Electricity and heat generation 7.1 (44%)Transportation 5.0 (31%)Heat (residential) 1.2 (7%)Industry 1.0 (6%)Agriculture and waste 0.9 (5%)Heat (commercial) 0.5 (3%)Oil and gas sector 0.5 (3%)
OVERALL GHG EMISSIONS BY SECTOR
ETS Size
Background Information
Stat
us R
epor
t 201
9IC
AP
52
03FA
CTSH
EETS
SECTORS AND THRESHOLDSThe program covers the industrial and electricity sec-tors, as well as fuel suppliers (upstream coverage of transport and heating).
INCLUSION THRESHOLDS: For the industrial and electricity sectors, facilities generating ≥ 50,000 tCO2e/year. Electricity importers responsible for >10,000 tCO2e/year are also included. For fuel suppliers, the following thresholds apply: petroleum product suppli-ers selling ≥ 200 liters of fuel into the Nova Scotia mar-ket and natural gas distributors producing ≥ 10,000 tCO2e/year.
No provisions for voluntary (“opt-in”) participation.
POINT OF REGULATIONMixed
NUMBER OF ENTITIES~21 entities
CAPFIRST COMPLIANCE PERIOD (2019-2022): 2019: 13.68 MtCO2e; 2020: 12.72 MtCO2e 2021: 12.26 MtCO2e; 2022: 12.14 MtCO2e
TRADING PERIODSNova Scotia’s cap-and-trade program is structured around compliance periods; trading periods are not defined separately. The first compliance period is 2019-2022.
ALLOCATIONAllowances are distributed via free allocation and auc-tion. Initially, most of the allowances will be distrib-uted for free, as outlined in the regulation (and below).
FREE ALLOCATION:Industrial Facilities: Facilities will receive allowances based on production intensity benchmarks based on data from the period 2014-2016. At the beginning of the year, 75% of the eligible emissions allowances will be distributed to the entities; the remaining 25% will be provided in the following year together with pro-duction-level adjustments after the submission of a verified emissions report.
The benchmark is based on historical facility emis-sions intensity, an assistant factor that varies between 1 (100%) for cement and 0.9 (90%) for pulp and paper and natural gas processing (the only defined indus-tries).
A cap adjustment factor is also applied, declining from 1 in 2019 to about 0.88 in 2022. This means that an entity would receive about 12% less allowances based on the output from year 1.
Fuel Suppliers and Electricity Importers: Receive 80% of free allocation based on verified GHG reports for previous year’s emissions.
Nova Scotia Power Inc.: The utility will be allocated allowances based on a reduction from BAU projec-tions; ~6.3 million allowances will be freely allocated to Nova Scotia Power Inc. in 2019, declining to just over five million in 2022.
AUCTIONING: The province will hold auctions two to four times per calendar year, starting in 2020. Mini-mum price: 5% plus inflation per year.
Auctioning in Nova Scotia has two particularities:
(1) The option for regulated entities to consign allow-ances to auction: minimize transaction costs for par-ticipants, regulated entities can consign their allow-ances to the government auctions. Allowances offered for sale through consignment are included in the gov-ernment auctions and sold first, followed by emission allowances offered for sale by the province. 100% of the revenue from allowances sold on consignment is returned to the participants.
(2) The purchase of limits to secure market function-ing: secure market functioning, bidders will be subject to purchasing limits that restrict how many allow-ances each participant can buy at any one auction. Purchasing limits are intended to mitigate the risk that one participant can manipulate the market by causing shortages and price spikes.
Purchasing Limits (for the 2019-2022 compliance period):• Fuel suppliers: 15% of the previous year’s verified
GHG emissions per auction and 25% for the calen-dar year;
Phases & Allocation
03FA
CTSH
EETS
Stat
us R
epor
t 201
9IC
AP
53
• Industrial facilities: 3% of their previous year’s veri-fied GHG emissions per auction and 5% for the cal-endar year; and
• Nova Scotia Power Inc.: 5% of the allowances avail-able for sale at each auction.
BANKING AND BORROWING Not yet defined.
OFFSETS AND CREDITSNova Scotia’s cap-and-trade legislation includes the possibility for an offset system. Further consultations will be undertaken in 2019 to consider this option.
MARKET STABILITY PROVISIONS RESERVE: In the first year of the compliance period (2019), the government will place 3% of allowances available under the yearly caps into a reserve. These emission allowances may be used for:
(1) Cost containment: Offer for sale at set prices to participants at predetermined times throughout the year to cover their compliance obligations. Up to four reserve sales can occur in a calendar year. The initial price will be CAD 50 (USD 39) in 2020, rising annually by 5% plus inflation.
(2) New entrants: Accommodate new participants in the cap-and-trade program whose GHG emissions are not currently accounted for and that qualify for free allocation.
(3) Reserve for adjustments in output-based free allocation: Adjust to variability in year-to-year com-mitments to free allowances (allowances from reserve can be used as a buffer for allocation-amount uncer-tainty: if projections are not accurate, commitments for free allowances according to allocation rules can be fulfilled by using allowances from the reserve).
Nova Scotia Cap-and-Trade Program
NOVA SCOTIA
COMPLIANCE PERIOD Four years (2019-2022) (see “Phases and Allocation” above)
MRV In Nova Scotia, MRV is referred to as “Quantification, Reporting, and Verification.”
REPORTING FREQUENCY: Annually. Report for 2018 to be submitted by 1 June 2019; verification by 1 Sep-tember 2019. Starting in 2020, report and verification must be submitted by 1 May of each year for the previ-ous calendar year (1 May 2020 for 2019, 1 May 2021 for 2020, 1 May 2022 for 2021, 1 May 2023 for 2022).
VERIFICATION: Reports must be verified by an accredited third-party organization. Lists of eligible verification bodies are available at:Standards Council of Canada and the American National Standards Institute.
FRAMEWORK: The rules for reporting GHG emis-sions are outlined in Nova Scotia’s ‘Quantification, Reporting, and Verification of Greenhouse Gas Emis-sions Regulations’ and ‘Standards for Quantification, Reporting, and Verification of Greenhouse Gas Emis-sions.’
ENFORCEMENT Participants who do not surrender enough allowances at the end of the compliance period will pay three times the latest auction settlement price per allow-ance they are short.
Administrative penalties for violations of other cap-and-trade regulations will be determined in further regulations.
Flexibility
Compliance
Stat
us R
epor
t 201
9IC
AP
54
03FA
CTSH
EETS
INSTITUTIONS INVOLVED Nova Scotia Environment, Climate Change Unit
EVALUATION/ETS REVIEWAnnual reports on the program will be published. Nova Scotia will also have to report annually to Envi-ronment and Climate Change Canada as part of the Pan-Canadian Framework on Clean Growth and Cli-mate Change.
USE OF REVENUESA Green Fund will be set up in 2019 to receive and dis-tribute revenues. The Green Fund will support mea-sures that mitigate GHG emissions, promote adapta-tion, encourage innovative technology, and reduce negative economic and social effects of mitigation action.
IMPLEMENTING LEGISLATION/REGULATIONNova Scotia’s Cap and Trade Program Regulatory Framework1
Cap-and-Trade Program Regulations, Section 112Q of the Environment Act2
Environment Act3
Other Information
1 – https://climatechange.novascotia.ca/sites/default/files/Nova-Scotia-Cap-and-Trade-Regulatory-Framework.pdf 2 – https://www.novascotia.ca/just/regulations/regs/envcapandtrade.htm 3 – https://nslegislature.ca/sites/default/files/legc/PDFs/annual%20statutes/2017%20Fall/c010.pdf
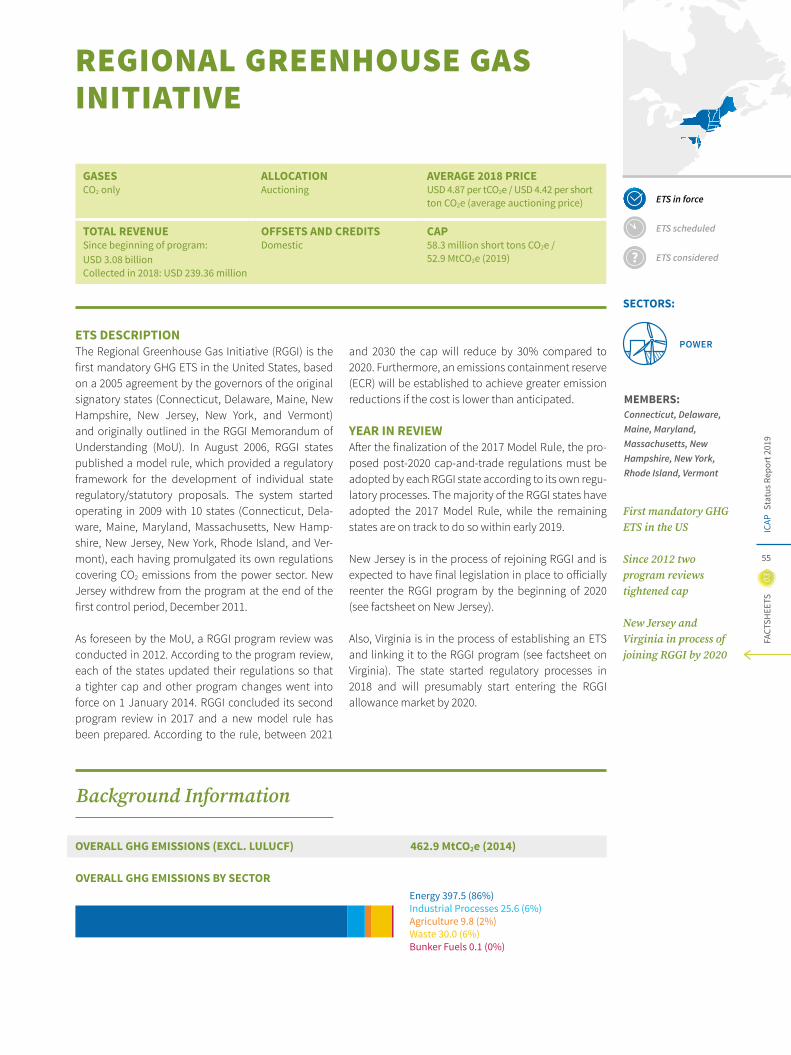
03FA
CTSH
EETS
Stat
us R
epor
t 201
9IC
AP
55
REGIONAL GREENHOUSE GAS INITIATIVE
ETS DESCRIPTIONThe Regional Greenhouse Gas Initiative (RGGI) is the first mandatory GHG ETS in the United States, based on a 2005 agreement by the governors of the original signatory states (Connecticut, Delaware, Maine, New Hampshire, New Jersey, New York, and Vermont) and originally outlined in the RGGI Memorandum of Understanding (MoU). In August 2006, RGGI states published a model rule, which provided a regulatory framework for the development of individual state regulatory/statutory proposals. The system started operating in 2009 with 10 states (Connecticut, Dela-ware, Maine, Maryland, Massachusetts, New Hamp-shire, New Jersey, New York, Rhode Island, and Ver-mont), each having promulgated its own regulations covering CO2 emissions from the power sector. New Jersey withdrew from the program at the end of the first control period, December 2011.
As foreseen by the MoU, a RGGI program review was conducted in 2012. According to the program review, each of the states updated their regulations so that a tighter cap and other program changes went into force on 1 January 2014. RGGI concluded its second program review in 2017 and a new model rule has been prepared. According to the rule, between 2021
and 2030 the cap will reduce by 30% compared to 2020. Furthermore, an emissions containment reserve (ECR) will be established to achieve greater emission reductions if the cost is lower than anticipated.
YEAR IN REVIEWAfter the finalization of the 2017 Model Rule, the pro-posed post-2020 cap-and-trade regulations must be adopted by each RGGI state according to its own regu-latory processes. The majority of the RGGI states have adopted the 2017 Model Rule, while the remaining states are on track to do so within early 2019.
New Jersey is in the process of rejoining RGGI and is expected to have final legislation in place to officially reenter the RGGI program by the beginning of 2020 (see factsheet on New Jersey).
Also, Virginia is in the process of establishing an ETS and linking it to the RGGI program (see factsheet on Virginia). The state started regulatory processes in 2018 and will presumably start entering the RGGI allowance market by 2020.
ETS in force
ETS scheduled
ETS considered
SECTORS:
POWER
MEMBERS:Connecticut, Delaware, Maine, Maryland, Massachusetts, New Hampshire, New York, Rhode Island, Vermont
First mandatory GHG ETS in the US
Since 2012 two program reviews tightened cap
New Jersey and Virginia in process of joining RGGI by 2020
OVERALL GHG EMISSIONS (EXCL. LULUCF) 462.9 MtCO2e (2014)
Energy 397.5 (86%)Industrial Processes 25.6 (6%)Agriculture 9.8 (2%)Waste 30.0 (6%)Bunker Fuels 0.1 (0%)
OVERALL GHG EMISSIONS BY SECTOR
Background Information
GASESCO2 only
ALLOCATION Auctioning
AVERAGE 2018 PRICEUSD 4.87 per tCO2e / USD 4.42 per short ton CO2e (average auctioning price)
TOTAL REVENUESince beginning of program: USD 3.08 billionCollected in 2018: USD 239.36 million
OFFSETS AND CREDITS Domestic
CAP 58.3 million short tons CO2e / 52.9 MtCO2e (2019)
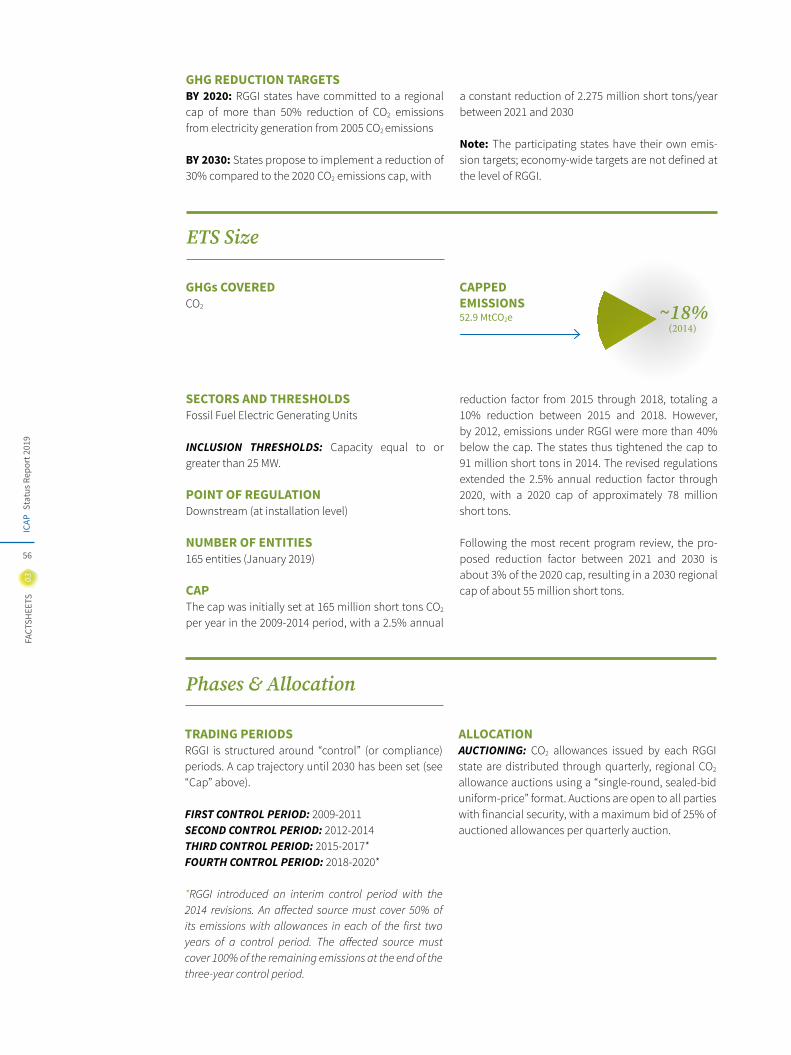
Stat
us R
epor
t 201
9IC
AP
56
03FA
CTSH
EETS
~18% (2014)
CAPPED EMISSIONS 52.9 MtCO2e
GHGs COVEREDCO2
GHG REDUCTION TARGETS BY 2020: RGGI states have committed to a regional cap of more than 50% reduction of CO2 emissions from electricity generation from 2005 CO2 emissions
BY 2030: States propose to implement a reduction of 30% compared to the 2020 CO2 emissions cap, with
a constant reduction of 2.275 million short tons/year between 2021 and 2030
Note: The participating states have their own emis-sion targets; economy-wide targets are not defined at the level of RGGI.
SECTORS AND THRESHOLDS Fossil Fuel Electric Generating Units
INCLUSION THRESHOLDS: Capacity equal to or greater than 25 MW.
POINT OF REGULATION Downstream (at installation level)
NUMBER OF ENTITIES 165 entities (January 2019)
CAP The cap was initially set at 165 million short tons CO2 per year in the 2009-2014 period, with a 2.5% annual
reduction factor from 2015 through 2018, totaling a 10% reduction between 2015 and 2018. However, by 2012, emissions under RGGI were more than 40% below the cap. The states thus tightened the cap to 91 million short tons in 2014. The revised regulations extended the 2.5% annual reduction factor through 2020, with a 2020 cap of approximately 78 million short tons.
Following the most recent program review, the pro-posed reduction factor between 2021 and 2030 is about 3% of the 2020 cap, resulting in a 2030 regional cap of about 55 million short tons.
TRADING PERIODSRGGI is structured around “control” (or compliance) periods. A cap trajectory until 2030 has been set (see “Cap” above).
FIRST CONTROL PERIOD: 2009-2011SECOND CONTROL PERIOD: 2012-2014THIRD CONTROL PERIOD: 2015-2017*FOURTH CONTROL PERIOD: 2018-2020*
*RGGI introduced an interim control period with the 2014 revisions. An affected source must cover 50% of its emissions with allowances in each of the first two years of a control period. The affected source must cover 100% of the remaining emissions at the end of the three-year control period.
ALLOCATIONAUCTIONING: CO2 allowances issued by each RGGI state are distributed through quarterly, regional CO2 allowance auctions using a “single-round, sealed-bid uniform-price” format. Auctions are open to all parties with financial security, with a maximum bid of 25% of auctioned allowances per quarterly auction.
Phases & Allocation
ETS Size
03FA
CTSH
EETS
Stat
us R
epor
t 201
9IC
AP
57
BANKING AND BORROWING Banking of allowances is allowed without restrictions, but regulations include adjustments to the cap to address the aggregate bank by reducing the amount of allowances available for auctions in future years by the amount of allowances not used for compliance in previous control periods. Borrowing is not allowed.
OFFSETS AND CREDITSQUANTITATIVE LIMIT: 3.3% of an entity's liability may be covered with offsets. This percentage share will remain equal between 2021 and 2030 according to the Model Rule.
QUALITATIVE LIMIT: Currently the program allows offset allowances from five offset types located in RGGI states:
(1) Landfill methane capture and destruction;(2) Sequestration of carbon due to reforestation, improved forest management, or avoided conversion;(3) Avoidance of methane emissions from agricultural manure management operations;(4) Reduction or avoidance of CO2 emissions from natural gas, oil, or propane end-use combustion due to end-use energy efficiency; and(5) Reduction in SF6 emissions.
According to the model rule, offset Protocols 4 and 5 will be discontinued from 2021. Some states have discontinued other protocols, but all states accept offset allowances issued by any participating state. To date, only one offset project has been approved under RGGI.
MARKET STABILITY PROVISIONS Auction Price Floor: USD 2.20 per short ton in 2018, increasing by 2.5% per year (to reflect inflation). Reserves: As of 2014, RGGI states created a cost containment reserve (CCR), where allowances are released to the market when certain trigger prices are reached. Trigger prices: USD 10 in 2017. Between 2018 and 2020, the CCR trigger price will increase annually by 2.5%.
In 2021, under the model rule, the trigger price will be set at USD 13 and will increase by 7% compared to the previous year thereafter.
In addition, the model rule envisages the establish-ment of an ECR by 2021: Allowances would be with-held from circulation (from auction) to secure emis-sions reductions if the emission reduction costs are lower than projected. In 2021, this trigger price will be set at USD 6, increasing by 7% compared to the previ-ous year thereafter.
COMPLIANCE PERIOD Three years (see “Phases and Allocation” above)
MRV REPORTING FREQUENCY: Compliance is evaluated at the end of each three-year control period. The RGGI program is currently in its fourth three-year control period (2018-2020).
FRAMEWORK: Emissions data for emitters are recorded in the United States Environmental Protec-tion Agency's (US EPA) Clean Air Markets Division data-base in accordance with state CO2 Budget Trading Pro-gram regulations and US EPA regulations. Provisions are based on the US EPA monitoring provisions. Data are then automatically transferred to the electronic platform of the RGGI CO2 Allowance Tracking System, which is publicly available.
ENFORCEMENT Penalties for non-compliance are set by each state; in case of excess emissions, compliance allowances for three times the amount of excess emissions have to be surrendered in future periods.
REGIONAL GREENHOUSE GAS INITIATIVE
Flexibility
Compliance
Stat
us R
epor
t 201
9IC
AP
58
03FA
CTSH
EETS
INSTITUTIONS INVOLVED Each RGGI state has its own statutory and/or regula-tory authority; RGGI Inc. (non-profit cooperative supporting RGGI’s development and implementation)
EVALUATION/ETS REVIEWThe RGGI participating states periodically review the ETS program in order to consider program successes, impacts, and design elements. The first program review process (known as the 2012 Program Review) was completed in early 2013. A second review process was completed in 2017, resulting in the 2017 Model Rule. Program reviews were accompanied by stake-holder meetings to facilitate stakeholder engage-ment and the submission of comments from inter-ested parties.
USE OF REVENUESRevenues are collected from the quarterly auctions. They are returned to the RGGI states and have been primarily invested in consumer benefit programs: energy efficiency, renewable energy, direct energy bill assistance, and other greenhouse gas reduction pro-grams.
IMPLEMENTING LEGISLATION/REGULATION2017 RGGI Model Rule1
2017 RGGI Model Rule Updates (Summary)2
RGGI States’ Statutes & Regulations3
RGGI Program design4
LINKS WITH OTHER SYSTEMSVirginia and New Jersey plan to join the RGGI allow-ance market by 2020.
Linking
Other Information
1 – https://www.rggi.org/sites/default/files/Uploads/Program-Review/12-19-2017/Model_Rule_2017_12_19.pdf ; 2 – https://www.rggi.org/sites/default/files/Uploads/Program-Review/12-19-2017/Summary_Model_Rule_Updates.pdf ; 3 – https://www.rggi.org/program-overview-and-design/state-regulations ; 4 – https://www.rggi.org/program-overview-and-design/elements
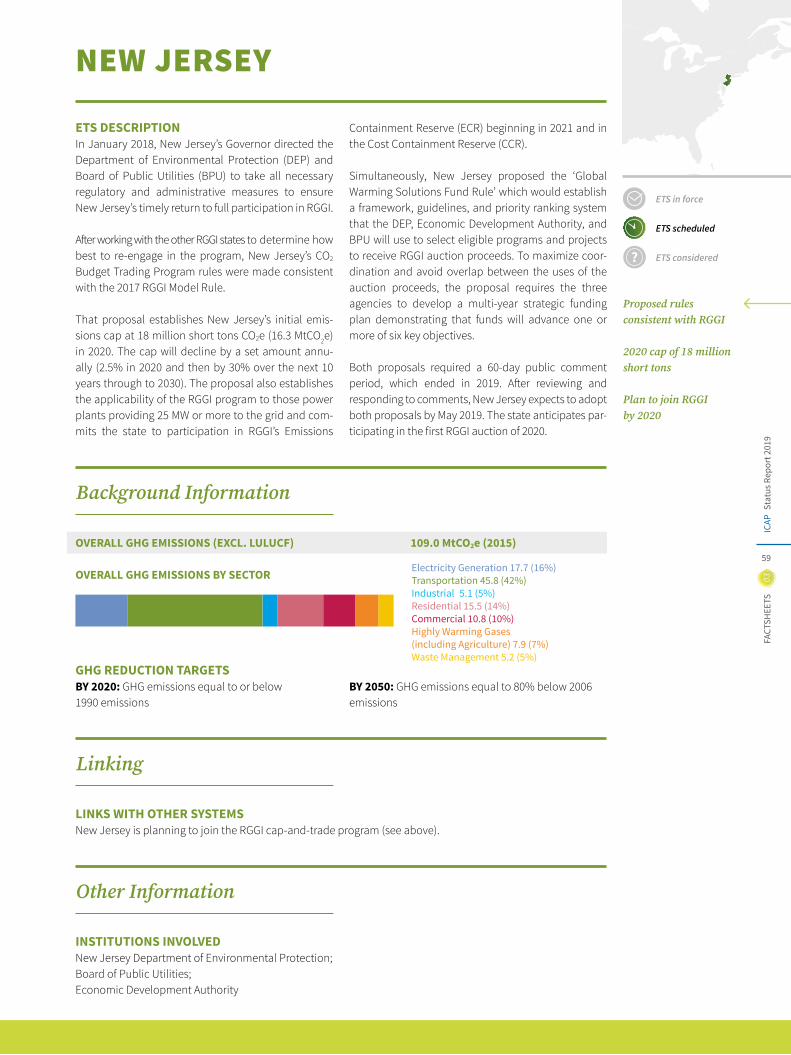
03FA
CTSH
EETS
Stat
us R
epor
t 201
9IC
AP
59
NEW JERSEY
ETS DESCRIPTIONIn January 2018, New Jersey’s Governor directed the Department of Environmental Protection (DEP) and Board of Public Utilities (BPU) to take all necessary regulatory and administrative measures to ensure New Jersey’s timely return to full participation in RGGI.
After working with the other RGGI states to determine how best to re-engage in the program, New Jersey’s CO2 Budget Trading Program rules were made consistent with the 2017 RGGI Model Rule.
That proposal establishes New Jersey’s initial emis-sions cap at 18 million short tons CO2e (16.3 MtCO2e) in 2020. The cap will decline by a set amount annu-ally (2.5% in 2020 and then by 30% over the next 10 years through to 2030). The proposal also establishes the applicability of the RGGI program to those power plants providing 25 MW or more to the grid and com-mits the state to participation in RGGI’s Emissions
Containment Reserve (ECR) beginning in 2021 and in the Cost Containment Reserve (CCR).
Simultaneously, New Jersey proposed the ‘Global Warming Solutions Fund Rule’ which would establish a framework, guidelines, and priority ranking system that the DEP, Economic Development Authority, and BPU will use to select eligible programs and projects to receive RGGI auction proceeds. To maximize coor-dination and avoid overlap between the uses of the auction proceeds, the proposal requires the three agencies to develop a multi-year strategic funding plan demonstrating that funds will advance one or more of six key objectives.
Both proposals required a 60-day public comment period, which ended in 2019. After reviewing and responding to comments, New Jersey expects to adopt both proposals by May 2019. The state anticipates par-ticipating in the first RGGI auction of 2020.
ETS in force
ETS scheduled
ETS considered
LINKS WITH OTHER SYSTEMS New Jersey is planning to join the RGGI cap-and-trade program (see above).
INSTITUTIONS INVOLVED New Jersey Department of Environmental Protection;Board of Public Utilities; Economic Development Authority
Proposed rules consistent with RGGI
2020 cap of 18 million short tons
Plan to join RGGI by 2020
Electricity Generation 17.7 (16%)Transportation 45.8 (42%)Industrial 5.1 (5%)Residential 15.5 (14%)Commercial 10.8 (10%)Highly Warming Gases (including Agriculture) 7.9 (7%)Waste Management 5.2 (5%)
OVERALL GHG EMISSIONS (EXCL. LULUCF) 109.0 MtCO2e (2015)
OVERALL GHG EMISSIONS BY SECTOR
GHG REDUCTION TARGETSBY 2020: GHG emissions equal to or below 1990 emissions
BY 2050: GHG emissions equal to 80% below 2006emissions
Linking
Other Information
Background Information
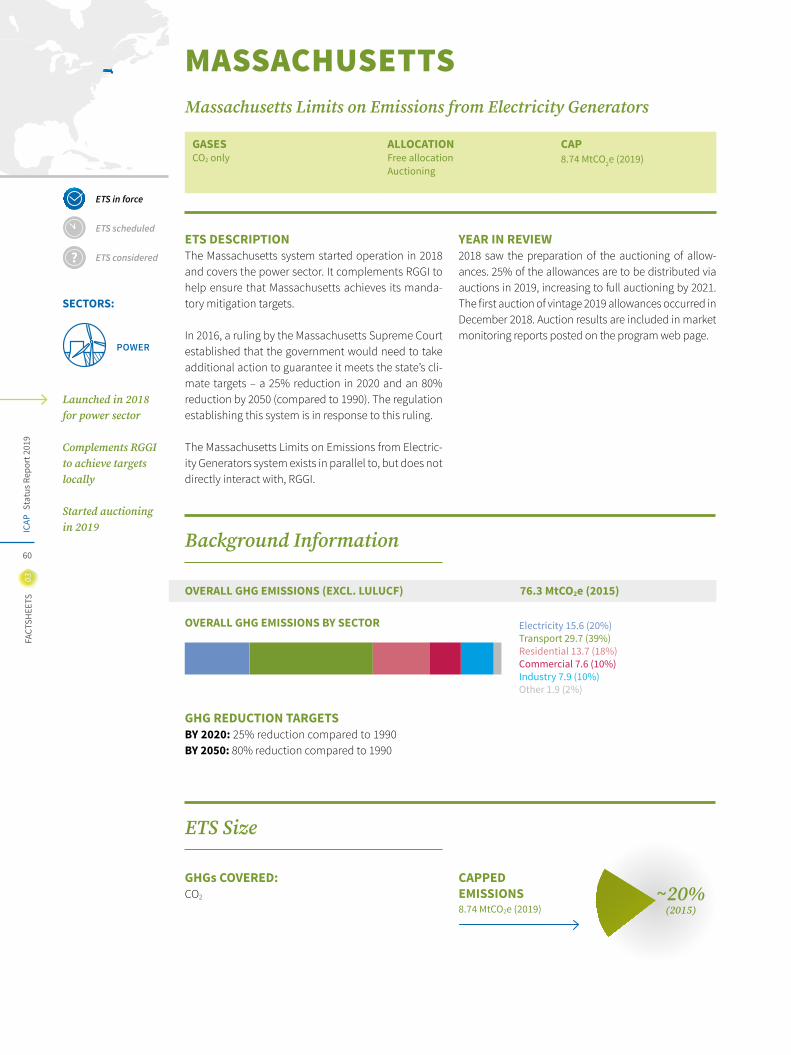
Stat
us R
epor
t 201
9IC
AP
60
03FA
CTSH
EETS
GASESCO2 only
ALLOCATION Free allocation Auctioning
CAP8.74 MtCO2e (2019)
MASSACHUSETTS
ETS in force
ETS scheduled
ETS considered
SECTORS:
Massachusetts Limits on Emissions from Electricity Generators
ETS DESCRIPTIONThe Massachusetts system started operation in 2018 and covers the power sector. It complements RGGI to help ensure that Massachusetts achieves its manda-tory mitigation targets.
In 2016, a ruling by the Massachusetts Supreme Court established that the government would need to take additional action to guarantee it meets the state’s cli-mate targets – a 25% reduction in 2020 and an 80% reduction by 2050 (compared to 1990). The regulation establishing this system is in response to this ruling.
The Massachusetts Limits on Emissions from Electric-ity Generators system exists in parallel to, but does not directly interact with, RGGI.
YEAR IN REVIEW2018 saw the preparation of the auctioning of allow-ances. 25% of the allowances are to be distributed via auctions in 2019, increasing to full auctioning by 2021. The first auction of vintage 2019 allowances occurred in December 2018. Auction results are included in market monitoring reports posted on the program web page.
Launched in 2018 for power sector
Complements RGGI to achieve targets locally
Started auctioning in 2019
CAPPED EMISSIONS 8.74 MtCO2e (2019)
GHGs COVERED:CO2
OVERALL GHG EMISSIONS (EXCL. LULUCF) 76.3 MtCO2e (2015)
OVERALL GHG EMISSIONS BY SECTOR Electricity 15.6 (20%)Transport 29.7 (39%)Residential 13.7 (18%)Commercial 7.6 (10%)Industry 7.9 (10%)Other 1.9 (2%)
POWER
~20% (2015)
GHG REDUCTION TARGETSBY 2020: 25% reduction compared to 1990BY 2050: 80% reduction compared to 1990
Background Information
ETS Size
03FA
CTSH
EETS
Stat
us R
epor
t 201
9IC
AP
61
SECTORS AND THRESHOLDSLarge electricity generators subject to RGGI (>= 25 MWe).
POINT OF REGULATIONDownstream
NUMBER OF ENTITIES21 (2018)
CAP8.74 MtCO2e (2019)The cap declines annually by 223,876 tCO2e per year until it reaches a cap of 1.8 MtCO2e by 2050.
TRADING PERIODSThe system has an annual compliance deadline of 1 March for the prior year’s emissions. A linear cap tra-jectory until 2050 has already been set (see 'Cap').
ALLOCATIONFREE ALLOCATION: Until 2021, remaining allowances will be freely allocated proportionally based on histor-ical (2013-2015) generation.
AUCTIONING: From 2019 onwards, allowances are partially auctioned, with 25% auctioned in 2019, 50% in 2020, and 100% from 2021 onwards. One to four auctions will be held each year.The first auction took place in December 2018.
BANKING AND BORROWING Banking is allowed, but restrictions apply to guar-antee that emissions in any year cannot exceed the emission limit of the prior year. This is done by adjust-ing the number of auctioned allowances downward to compensate for banked allowances. Borrowing is not allowed, but the possibility of emergency deferred compliance exists.
MARKET STABILITY PROVISIONS Auction reserve price: The first auction of 2019 allowances had a reserve price of USD 0.50 per allow-ance. Future reserve prices are not yet known.
COMPLIANCE PERIOD One year
MRV REPORTING FREQUENCY: Regulated entities are required to submit emission reports (by 1 February) and compliance certification reports (by 1 March) indi-cating emissions and the holding of sufficient allow-ances, respectively.
VERIFICATION: Emissions must match reports to RGGI and US EPA. Documents (i.e., emissions reports and compliance certification reports) must be certi-fied by a designated representative identified by the facility, and MassDEP may choose to conduct audits.
ENFORCEMENT If the MassDEP establishes that an entity is in violation of compliance, this will be presumed to constitute “a significant impact to public health, welfare, safety or the environment.” In addition to penalties, the regu-lated entity has to submit three allowances for each tonne of noncompliance.
Phases & Allocation
Flexibility
Compliance
Stat
us R
epor
t 201
9IC
AP
62
03FA
CTSH
EETS
INSTITUTIONS INVOLVED The Executive Office of Energy and Environmental Affairs; Massachusetts Department of Environmental Protec-tion (MassDEP)
EVALUATION/ETS REVIEWThe first program review will be in 2021, with a review every 10 years thereafter.
USE OF REVENUESAuction proceeds will be paid to a segregated account and shall be used to further reduce GHG emissions.
IMPLEMENTING LEGISLATION/REGULATIONElectricity Generator Emissions Limits (310 CMR 7.74)1
Other Information
1 – https://www.mass.gov/guides/electricity-generator-emissions-limits-310-cmr-774
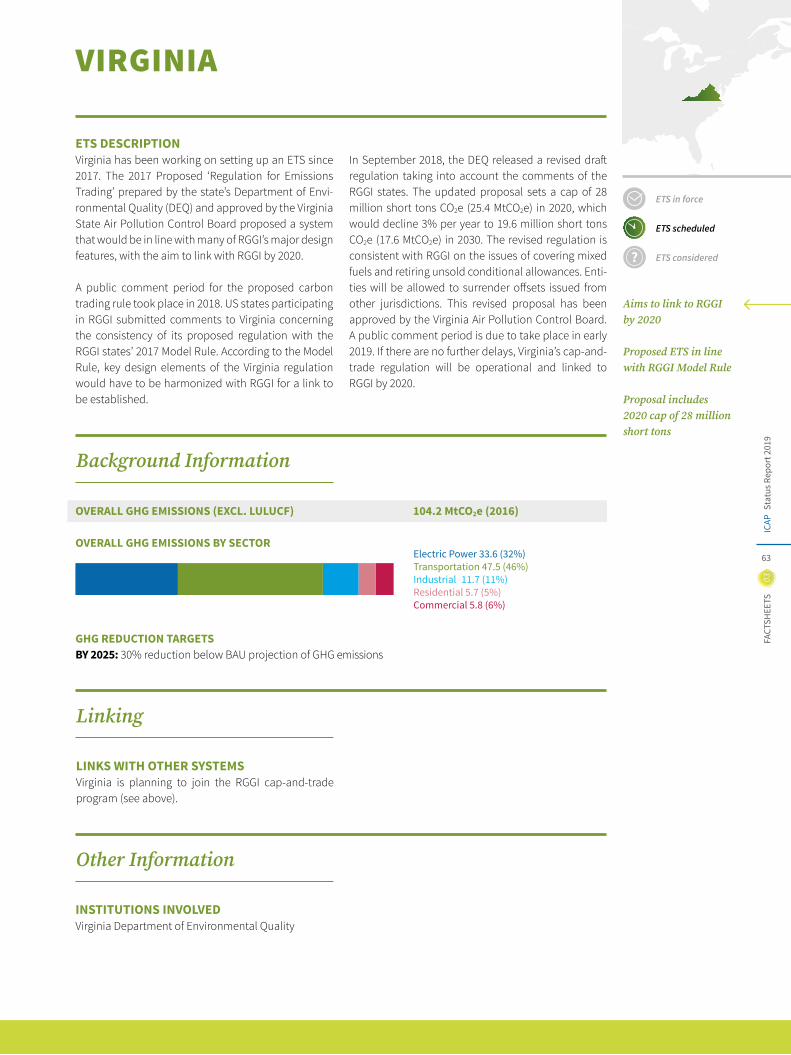
03FA
CTSH
EETS
Stat
us R
epor
t 201
9IC
AP
63
VIRGINIA
ETS DESCRIPTIONVirginia has been working on setting up an ETS since 2017. The 2017 Proposed ‘Regulation for Emissions Trading’ prepared by the state’s Department of Envi-ronmental Quality (DEQ) and approved by the Virginia State Air Pollution Control Board proposed a system that would be in line with many of RGGI’s major design features, with the aim to link with RGGI by 2020.
A public comment period for the proposed carbon trading rule took place in 2018. US states participating in RGGI submitted comments to Virginia concerning the consistency of its proposed regulation with the RGGI states’ 2017 Model Rule. According to the Model Rule, key design elements of the Virginia regulation would have to be harmonized with RGGI for a link to be established.
In September 2018, the DEQ released a revised draft regulation taking into account the comments of the RGGI states. The updated proposal sets a cap of 28 million short tons CO2e (25.4 MtCO2e) in 2020, which would decline 3% per year to 19.6 million short tons CO2e (17.6 MtCO2e) in 2030. The revised regulation is consistent with RGGI on the issues of covering mixed fuels and retiring unsold conditional allowances. Enti-ties will be allowed to surrender offsets issued from other jurisdictions. This revised proposal has been approved by the Virginia Air Pollution Control Board. A public comment period is due to take place in early 2019. If there are no further delays, Virginia’s cap-and-trade regulation will be operational and linked to RGGI by 2020.
ETS in force
ETS scheduled
ETS considered
LINKS WITH OTHER SYSTEMS Virginia is planning to join the RGGI cap-and-trade program (see above).
INSTITUTIONS INVOLVED Virginia Department of Environmental Quality
Aims to link to RGGI by 2020
Proposed ETS in line with RGGI Model Rule
Proposal includes 2020 cap of 28 million short tons
Electric Power 33.6 (32%)Transportation 47.5 (46%)Industrial 11.7 (11%)Residential 5.7 (5%)Commercial 5.8 (6%)
OVERALL GHG EMISSIONS (EXCL. LULUCF) 104.2 MtCO2e (2016)
OVERALL GHG EMISSIONS BY SECTOR
GHG REDUCTION TARGETSBY 2025: 30% reduction below BAU projection of GHG emissions
Linking
Other Information
Background Information
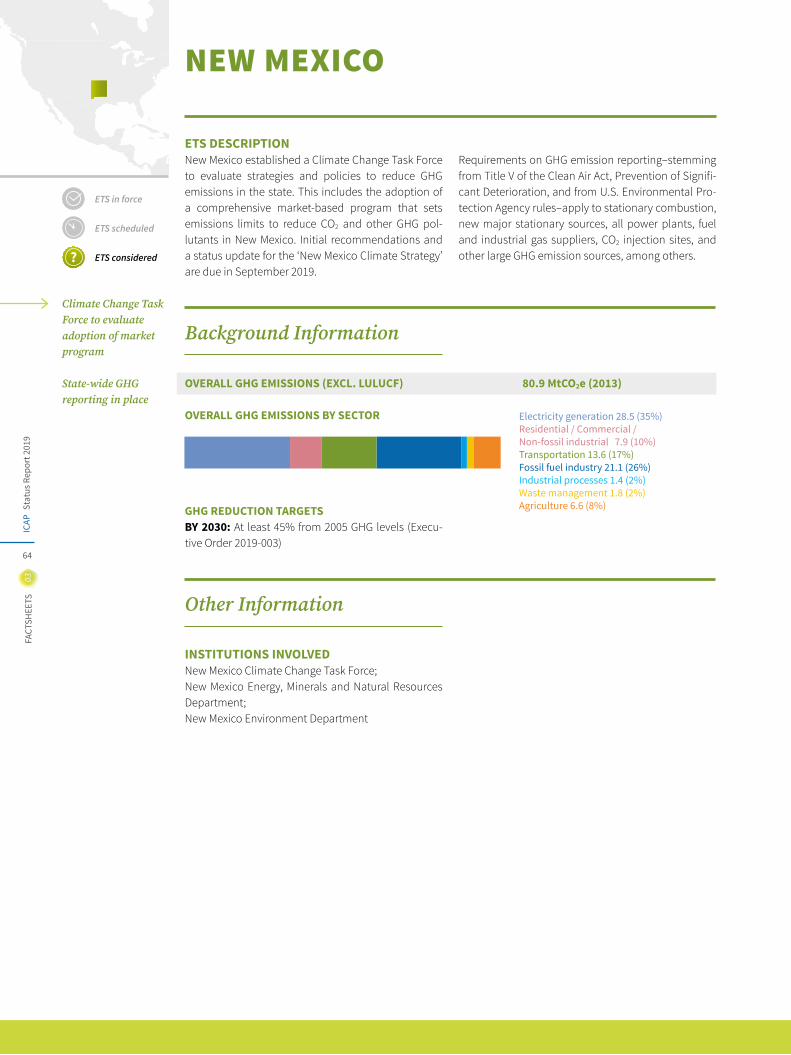
Stat
us R
epor
t 201
9IC
AP
64
03FA
CTSH
EETS
NEW MEXICO
ETS DESCRIPTIONNew Mexico established a Climate Change Task Force to evaluate strategies and policies to reduce GHG emissions in the state. This includes the adoption of a comprehensive market-based program that sets emissions limits to reduce CO2 and other GHG pol-lutants in New Mexico. Initial recommendations and a status update for the ‘New Mexico Climate Strategy’ are due in September 2019.
Requirements on GHG emission reporting–stemming from Title V of the Clean Air Act, Prevention of Signifi-cant Deterioration, and from U.S. Environmental Pro-tection Agency rules–apply to stationary combustion, new major stationary sources, all power plants, fuel and industrial gas suppliers, CO2 injection sites, and other large GHG emission sources, among others.
ETS in force
ETS scheduled
ETS considered
OVERALL GHG EMISSIONS (EXCL. LULUCF) 80.9 MtCO2e (2013)
OVERALL GHG EMISSIONS BY SECTOR
GHG REDUCTION TARGETSBY 2030: At least 45% from 2005 GHG levels (Execu-tive Order 2019-003)
INSTITUTIONS INVOLVED New Mexico Climate Change Task Force;New Mexico Energy, Minerals and Natural Resources Department;New Mexico Environment Department
Climate Change Task Force to evaluate adoption of market program
State-wide GHG reporting in place
Electricity generation 28.5 (35%)Residential / Commercial / Non-fossil industrial 7.9 (10%)Transportation 13.6 (17%)Fossil fuel industry 21.1 (26%)Industrial processes 1.4 (2%)Waste management 1.8 (2%)Agriculture 6.6 (8%)
Other Information
Background Information
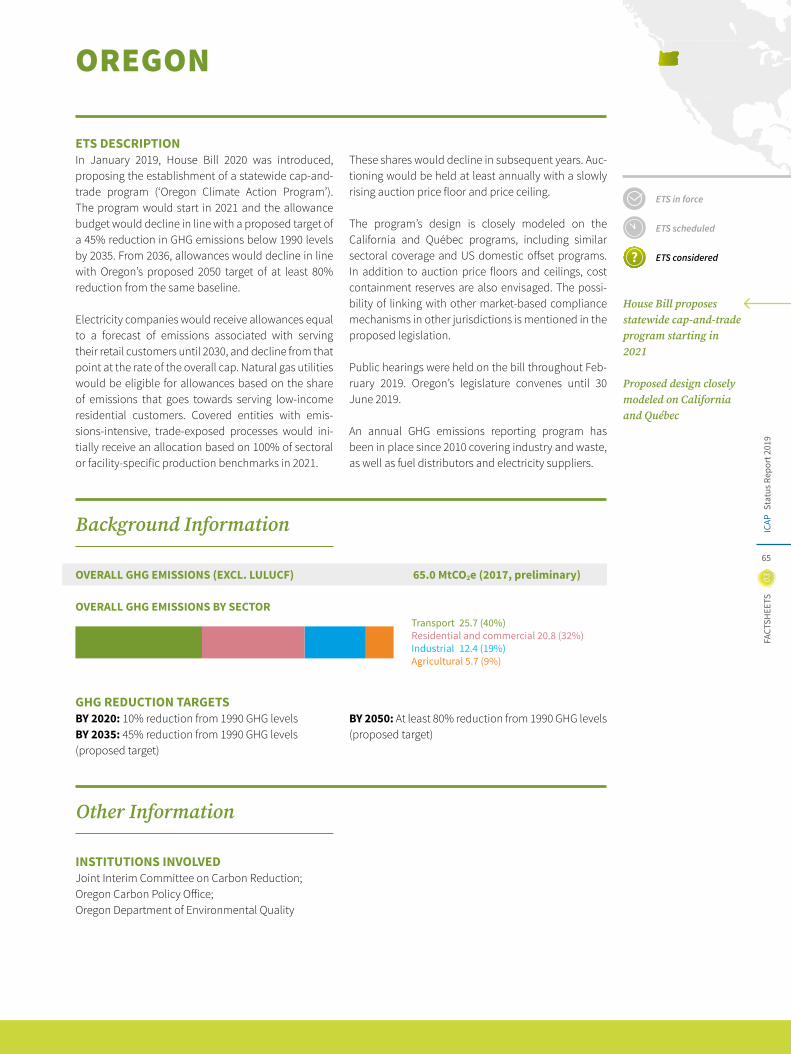
03FA
CTSH
EETS
Stat
us R
epor
t 201
9IC
AP
65
Transport 25.7 (40%)Residential and commercial 20.8 (32%)Industrial 12.4 (19%)Agricultural 5.7 (9%)
OREGON
ETS DESCRIPTIONIn January 2019, House Bill 2020 was introduced, proposing the establishment of a statewide cap-and-trade program (‘Oregon Climate Action Program’). The program would start in 2021 and the allowance budget would decline in line with a proposed target of a 45% reduction in GHG emissions below 1990 levels by 2035. From 2036, allowances would decline in line with Oregon’s proposed 2050 target of at least 80% reduction from the same baseline.
Electricity companies would receive allowances equal to a forecast of emissions associated with serving their retail customers until 2030, and decline from that point at the rate of the overall cap. Natural gas utilities would be eligible for allowances based on the share of emissions that goes towards serving low-income residential customers. Covered entities with emis-sions-intensive, trade-exposed processes would ini-tially receive an allocation based on 100% of sectoral or facility-specific production benchmarks in 2021.
These shares would decline in subsequent years. Auc-tioning would be held at least annually with a slowly rising auction price floor and price ceiling.
The program’s design is closely modeled on the California and Québec programs, including similar sectoral coverage and US domestic offset programs. In addition to auction price floors and ceilings, cost containment reserves are also envisaged. The possi-bility of linking with other market-based compliance mechanisms in other jurisdictions is mentioned in the proposed legislation.
Public hearings were held on the bill throughout Feb-ruary 2019. Oregon’s legislature convenes until 30 June 2019.
An annual GHG emissions reporting program has been in place since 2010 covering industry and waste, as well as fuel distributors and electricity suppliers.
ETS in force
ETS scheduled
ETS considered
INSTITUTIONS INVOLVED Joint Interim Committee on Carbon Reduction;Oregon Carbon Policy Office; Oregon Department of Environmental Quality
House Bill proposes statewide cap-and-trade program starting in 2021
Proposed design closely modeled on California and Québec
OVERALL GHG EMISSIONS (EXCL. LULUCF) 65.0 MtCO2e (2017, preliminary)
OVERALL GHG EMISSIONS BY SECTOR
GHG REDUCTION TARGETSBY 2020: 10% reduction from 1990 GHG levels BY 2035: 45% reduction from 1990 GHG levels (proposed target)
BY 2050: At least 80% reduction from 1990 GHG levels (proposed target)
Other Information
Background Information
Stat
us R
epor
t 201
9IC
AP
66
03FA
CTSH
EETS
TRANSPORTATION AND CLIMATE INITIATIVEThe Transportation and Climate Initiative (TCI) is a regional collaboration of 13 northeastern and mid-Atlantic US jurisdictions that pursues the goal to reduce GHG emissions from the transportation sector and minimize the transportation system’s reliance on high-carbon fuels. In December 2018, a coalition of 10 of the participat-ing TCI jurisdictions (all but Maine, New Hampshire, and New York) announced the future design of a regional low-carbon transportation policy proposal, which aims to establish a carbon pricing mechanism. The goal to introduce such a mechanism is an outcome of several years of consultations and negotiations among the mem-bers of the TCI.
The proposal is supposed to cap carbon emissions from the combustion of transportation fuels by introducing a “cap-and-invest” program or another carbon pricing mechanism, emphasizing the possibility for TCI juris-dictions to raise revenue through the program and invest it into low-carbon and resilient transportation infra-structure projects. A first draft policy proposal is expected to be prepared in 2019. Once the policy proposal is completed, participating states will be able to decide whether to adopt and implement it. Other states would also be able to join the effort at any time.
In 2019, the participating TCI jurisdictions plan to engage in expert consultations; conduct further public stake-holder engagements; and undertake technical, environmental, and economic analyses of the benefits and costs of a regional transportation policy. During the process, TCI jurisdictions also aim to explore the design and potential implementation of complementary policies – including the determination of a cap level, establishing MRV guidelines, the identification of covered entities and fuels, the development of cost containment mecha-nisms, compliance flexibility, and the specific revenue usage.
Regional collaboration to reduce transport GHG emissions
Coalition of majority of TCI members considers cap and invest or other carbon pricing mechanism
Ongoing stakeholder outreach and exploring design options
MEMBERS:Connecticut, Delaware, Maine, Maryland, Massachusetts, New Hampshire, New Jersey, New York, Pennsylvania, Rhode Island, Vermont, Virginia, Washington D.C.
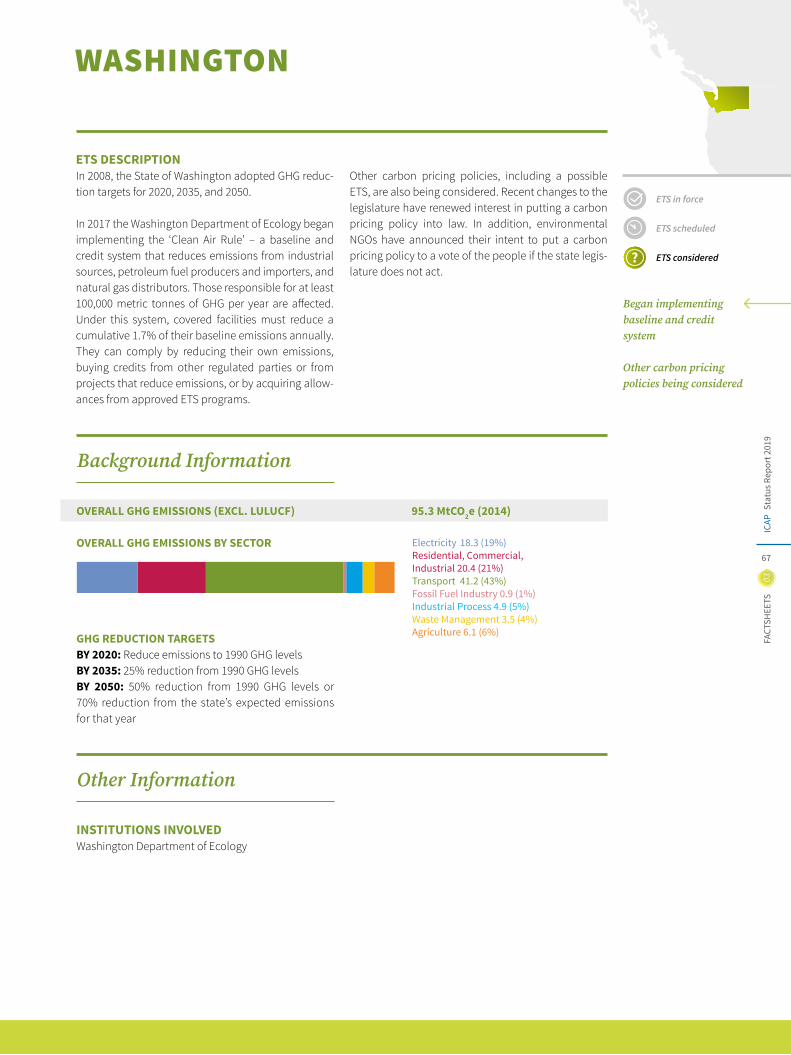
03FA
CTSH
EETS
Stat
us R
epor
t 201
9IC
AP
67
WASHINGTON
ETS DESCRIPTIONIn 2008, the State of Washington adopted GHG reduc-tion targets for 2020, 2035, and 2050.
In 2017 the Washington Department of Ecology began implementing the ‘Clean Air Rule’ – a baseline and credit system that reduces emissions from industrial sources, petroleum fuel producers and importers, and natural gas distributors. Those responsible for at least 100,000 metric tonnes of GHG per year are affected. Under this system, covered facilities must reduce a cumulative 1.7% of their baseline emissions annually. They can comply by reducing their own emissions, buying credits from other regulated parties or from projects that reduce emissions, or by acquiring allow-ances from approved ETS programs.
Other carbon pricing policies, including a possible ETS, are also being considered. Recent changes to the legislature have renewed interest in putting a carbon pricing policy into law. In addition, environmental NGOs have announced their intent to put a carbon pricing policy to a vote of the people if the state legis-lature does not act.
ETS in force
ETS scheduled
ETS considered
Began implementing baseline and credit system
Other carbon pricing policies being considered
Electricity 18.3 (19%)Residential, Commercial, Industrial 20.4 (21%)Transport 41.2 (43%)Fossil Fuel Industry 0.9 (1%)Industrial Process 4.9 (5%)Waste Management 3.5 (4%)Agriculture 6.1 (6%)
OVERALL GHG EMISSIONS (EXCL. LULUCF) 95.3 MtCO2e (2014)
OVERALL GHG EMISSIONS BY SECTOR
GHG REDUCTION TARGETSBY 2020: Reduce emissions to 1990 GHG levelsBY 2035: 25% reduction from 1990 GHG levelsBY 2050: 50% reduction from 1990 GHG levels or 70% reduction from the state’s expected emissions for that year
INSTITUTIONS INVOLVED Washington Department of Ecology
Other Information
Background Information
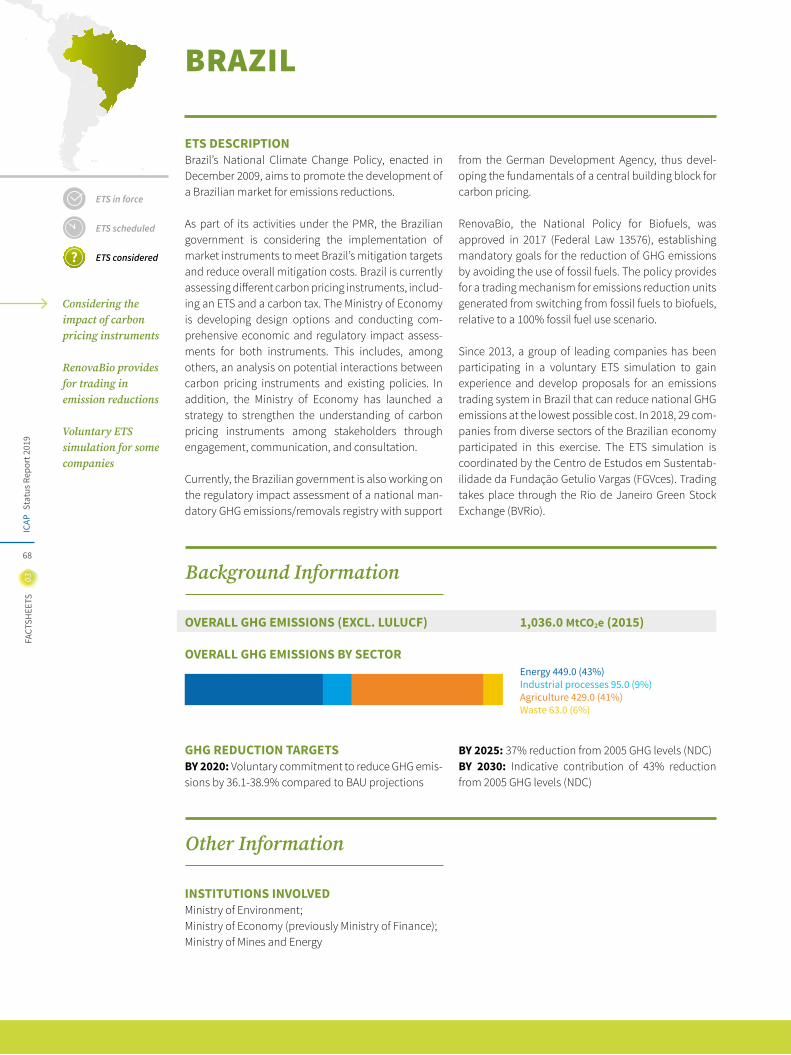
Stat
us R
epor
t 201
9IC
AP
68
03FA
CTSH
EETS
BRAZIL
ETS DESCRIPTIONBrazil’s National Climate Change Policy, enacted in December 2009, aims to promote the development of a Brazilian market for emissions reductions.
As part of its activities under the PMR, the Brazilian government is considering the implementation of market instruments to meet Brazil’s mitigation targets and reduce overall mitigation costs. Brazil is currently assessing different carbon pricing instruments, includ-ing an ETS and a carbon tax. The Ministry of Economy is developing design options and conducting com-prehensive economic and regulatory impact assess-ments for both instruments. This includes, among others, an analysis on potential interactions between carbon pricing instruments and existing policies. In addition, the Ministry of Economy has launched a strategy to strengthen the understanding of carbon pricing instruments among stakeholders through engagement, communication, and consultation.
Currently, the Brazilian government is also working on the regulatory impact assessment of a national man-datory GHG emissions/removals registry with support
from the German Development Agency, thus devel-oping the fundamentals of a central building block for carbon pricing.
RenovaBio, the National Policy for Biofuels, was approved in 2017 (Federal Law 13576), establishing mandatory goals for the reduction of GHG emissions by avoiding the use of fossil fuels. The policy provides for a trading mechanism for emissions reduction units generated from switching from fossil fuels to biofuels, relative to a 100% fossil fuel use scenario.
Since 2013, a group of leading companies has been participating in a voluntary ETS simulation to gain experience and develop proposals for an emissions trading system in Brazil that can reduce national GHG emissions at the lowest possible cost. In 2018, 29 com-panies from diverse sectors of the Brazilian economy participated in this exercise. The ETS simulation is coordinated by the Centro de Estudos em Sustentab-ilidade da Fundação Getulio Vargas (FGVces). Trading takes place through the Rio de Janeiro Green Stock Exchange (BVRio).
ETS in force
ETS scheduled
ETS considered
OVERALL GHG EMISSIONS (EXCL. LULUCF) 1,036.0 MtCO2e (2015)
OVERALL GHG EMISSIONS BY SECTOR
GHG REDUCTION TARGETSBY 2020: Voluntary commitment to reduce GHG emis-sions by 36.1-38.9% compared to BAU projections
BY 2025: 37% reduction from 2005 GHG levels (NDC)BY 2030: Indicative contribution of 43% reduction from 2005 GHG levels (NDC)
INSTITUTIONS INVOLVED Ministry of Environment; Ministry of Economy (previously Ministry of Finance);Ministry of Mines and Energy
Considering the impact of carbon pricing instruments
RenovaBio provides for trading in emission reductions
Voluntary ETS simulation for some companies
Energy 449.0 (43%)Industrial processes 95.0 (9%)Agriculture 429.0 (41%)Waste 63.0 (6%)
Other Information
Background Information
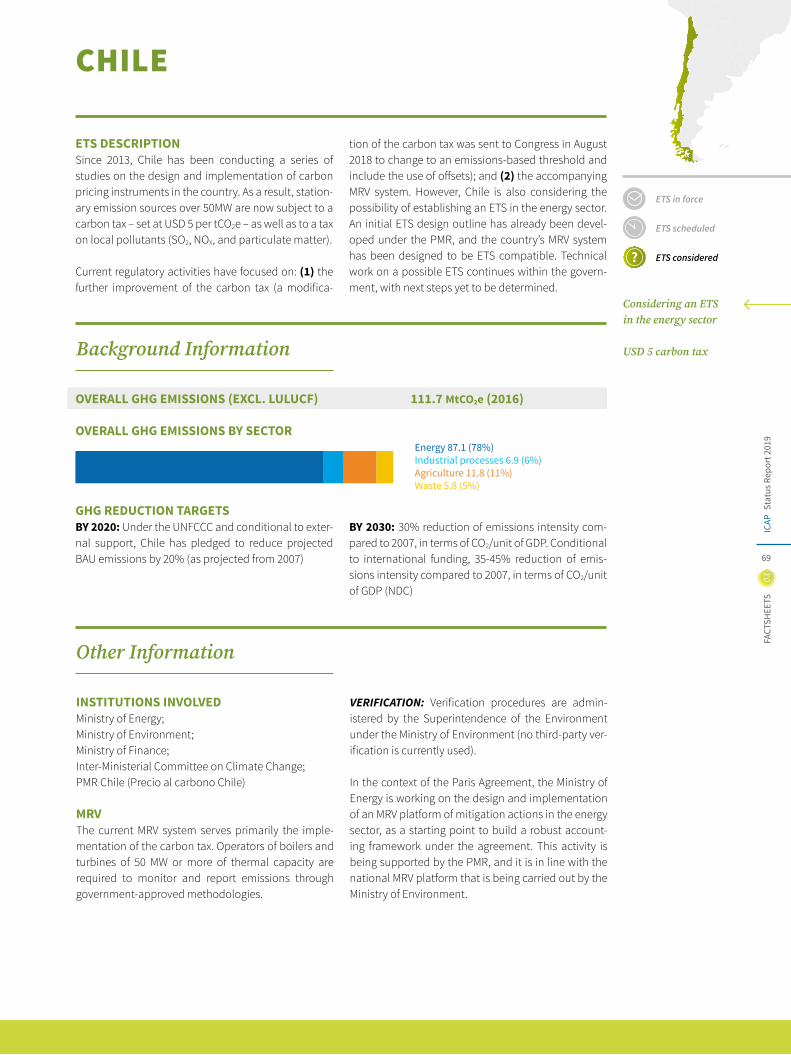
03FA
CTSH
EETS
Stat
us R
epor
t 201
9IC
AP
69
ETS in force
ETS scheduled
ETS considered
Considering an ETS in the energy sector
USD 5 carbon tax
Energy 87.1 (78%)Industrial processes 6.9 (6%)Agriculture 11.8 (11%)Waste 5.8 (5%)
CHILE
ETS DESCRIPTIONSince 2013, Chile has been conducting a series of studies on the design and implementation of carbon pricing instruments in the country. As a result, station-ary emission sources over 50MW are now subject to a carbon tax – set at USD 5 per tCO2e – as well as to a tax on local pollutants (SO2, NOX, and particulate matter).
Current regulatory activities have focused on: (1) the further improvement of the carbon tax (a modifica-
tion of the carbon tax was sent to Congress in August 2018 to change to an emissions-based threshold and include the use of offsets); and (2) the accompanying MRV system. However, Chile is also considering the possibility of establishing an ETS in the energy sector. An initial ETS design outline has already been devel-oped under the PMR, and the country’s MRV system has been designed to be ETS compatible. Technical work on a possible ETS continues within the govern-ment, with next steps yet to be determined.
OVERALL GHG EMISSIONS (EXCL. LULUCF) 111.7 MtCO2e (2016)
OVERALL GHG EMISSIONS BY SECTOR
GHG REDUCTION TARGETSBY 2020: Under the UNFCCC and conditional to exter-nal support, Chile has pledged to reduce projected BAU emissions by 20% (as projected from 2007)
BY 2030: 30% reduction of emissions intensity com-pared to 2007, in terms of CO2/unit of GDP. Conditional to international funding, 35-45% reduction of emis-sions intensity compared to 2007, in terms of CO2/unit of GDP (NDC)
INSTITUTIONS INVOLVED Ministry of Energy;Ministry of Environment;Ministry of Finance;Inter-Ministerial Committee on Climate Change;PMR Chile (Precio al carbono Chile)
MRVThe current MRV system serves primarily the imple-mentation of the carbon tax. Operators of boilers and turbines of 50 MW or more of thermal capacity are required to monitor and report emissions through government-approved methodologies.
VERIFICATION: Verification procedures are admin-istered by the Superintendence of the Environment under the Ministry of Environment (no third-party ver-ification is currently used).
In the context of the Paris Agreement, the Ministry of Energy is working on the design and implementation of an MRV platform of mitigation actions in the energy sector, as a starting point to build a robust account-ing framework under the agreement. This activity is being supported by the PMR, and it is in line with the national MRV platform that is being carried out by the Ministry of Environment.
Other Information
Background Information
Stat
us R
epor
t 201
9IC
AP
70
03FA
CTSH
EETS
ETS in force
ETS scheduled
ETS considered
Developing pilot phase regulations
Should cover energy and industry
Mandatory GHG reporting in place since 2014
MEXICO
ETS DESCRIPTIONMexico’s General Law on Climate Change Law (Ley Gen-eral de Cambio Climatico–LGCC), as amended in July 2018, provides the framework for the establishment of an ETS in Mexico. The mandatory ETS is to be preceded by a pilot phase, which will run for three years.
The Mexican government is currently working on the development of regulations for the pilot phase. A first draft regulation was released in late 2018. A final draft is under consideration within the government and should be published during the first half of 2019. It is expected that the pilot cover direct CO2 emissions from energy and industry. The latter could include, among others, the automotive, cement, chemicals, glass, steel, metallurgical, mining, and petrochemicals subsectors, as well as the pulp and paper subsector. Participation could be limited to entities with annual emissions greater than 100,000 tCO2, amounting to ~300 entities. In this configuration, the pilot would cover approximately 45% of national emissions.
Allowances during the pilot phase are likely to be pri-marily distributed through grandparenting, based on historical emissions, sectorial goals, and the country’s NDC. Auctions – which may be subject to price collars – may also apply to a small percentage of allowances. This could be complemented by reserves, e.g., for new entrants and to respond to price spikes.
Offsets may be eligible for compliance under the pilot ETS, subject to quantitative limits. Offsets would likely be generated under a domestic program that is yet to be established. Participation in the pilot phase is likely mandatory, but without penalties for noncompliance.
In October 2014, a mandatory reporting system (the National Emissions Register – RENE) was established for both direct and indirect GHG emissions for facili-ties with annual emissions above 25,000 tCO₂e. Emit-ters in the energy, industrial, transport, agricultural, waste, commercial, and services sectors are required to report the six GHGs identified by UNFCCC, as well as black carbon. Fossil fuel sales and imports (with the exemption of natural gas) have been subject to a USD 3.50 carbon tax since 2014.
ETS regulations have also built on extensive consulta-tion with and participation by the private sector and civil society. In addition to numerous public consul-tation fora, a national carbon market simulation took place between 2017 and 2018 to strengthen capacity and the readiness of Mexican businesses to partici-pate in a future ETS. The simulation brought together more than 100 Mexican companies from numerous economic sectors, such as electric power, hydrocar-bons, aviation, mining, forestry, consumer goods, and financial institutions, among many others. The com-panies represented two-thirds of Mexico’s GHG emis-sions. The exercise had the objective of strengthening the capacity and readiness of Mexican businesses to participate in a future ETS.
Mexico is also actively seeking to link its future ETS to markets in North America. To this end, in October 2015, Mexico signed a Memorandum of Understand-ing with Québec that includes cooperation on ETS. In August 2016, Mexico, Québec, and Ontario issued a joint declaration on carbon markets collaboration. Additionally, in December 2017, Mexico – together with four countries and seven subnational govern-ments – issued the Paris Declaration on Carbon Pric-ing in the Americas for carbon pricing implementa-tion, which creates a platform for cooperation among countries in the region.
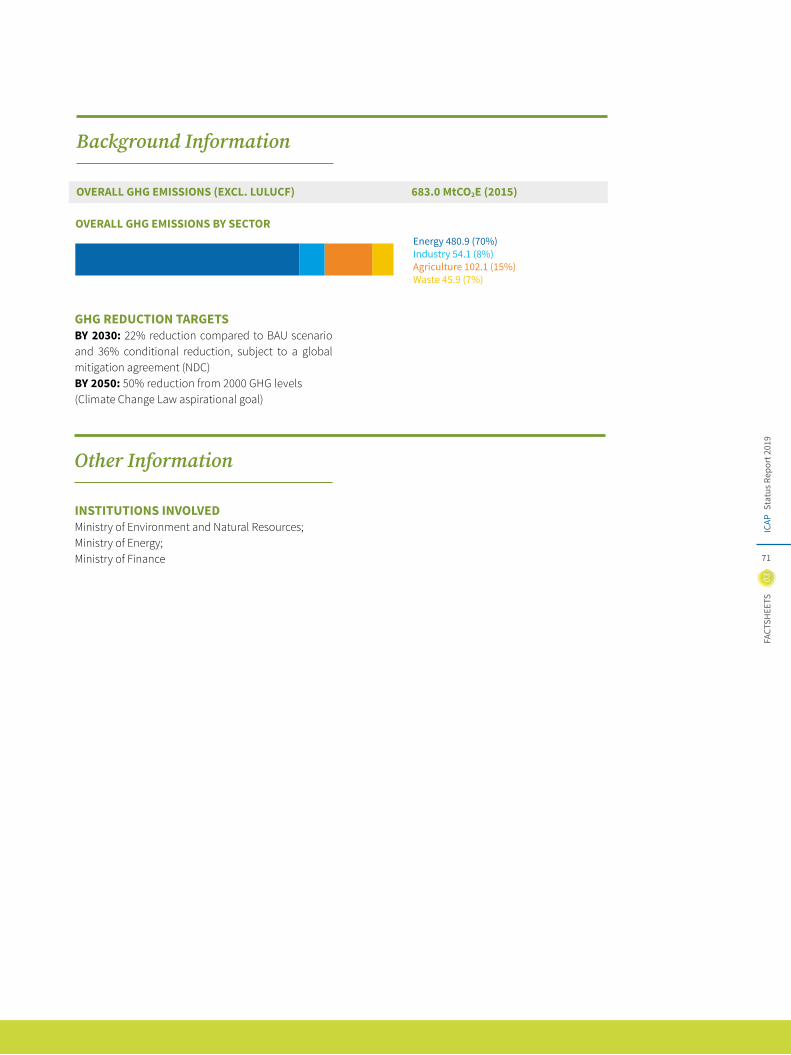
03FA
CTSH
EETS
Stat
us R
epor
t 201
9IC
AP
71
INSTITUTIONS INVOLVED Ministry of Environment and Natural Resources;Ministry of Energy;Ministry of Finance
GHG REDUCTION TARGETSBY 2030: 22% reduction compared to BAU scenario and 36% conditional reduction, subject to a global mitigation agreement (NDC)BY 2050: 50% reduction from 2000 GHG levels (Climate Change Law aspirational goal)
OVERALL GHG EMISSIONS (EXCL. LULUCF) 683.0 MtCO2E (2015)
Energy 480.9 (70%)Industry 54.1 (8%)Agriculture 102.1 (15%)Waste 45.9 (7%)
OVERALL GHG EMISSIONS BY SECTOR
Other Information
Background Information
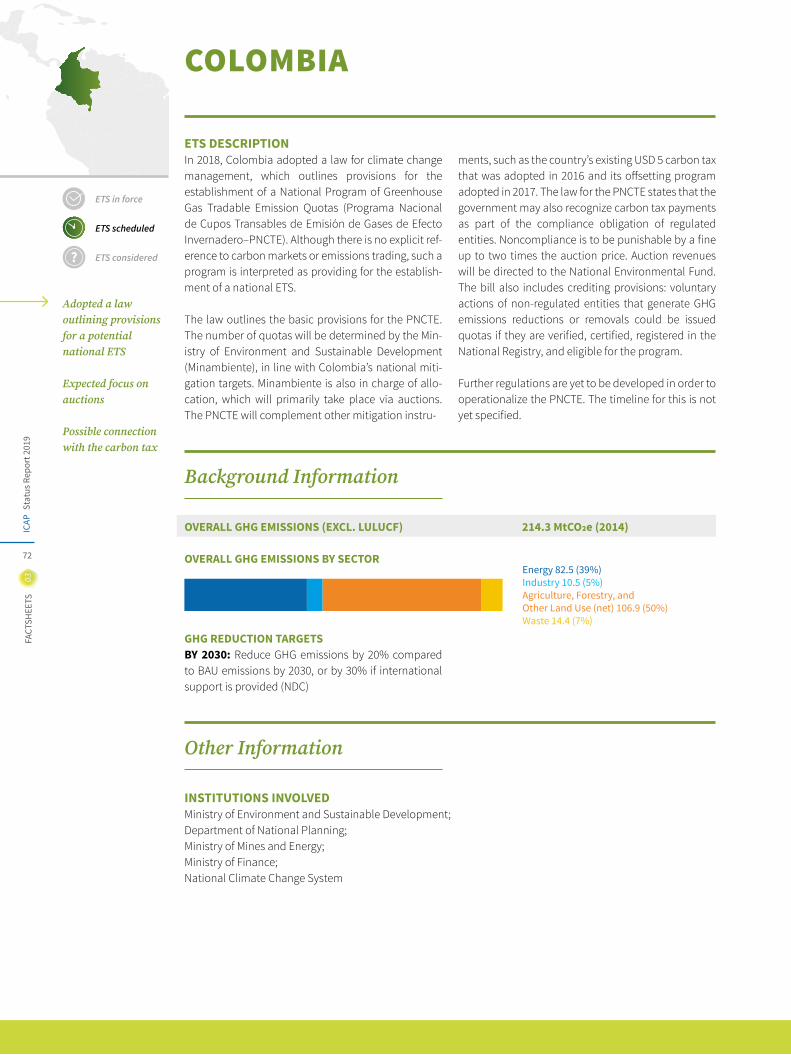
Stat
us R
epor
t 201
9IC
AP
72
03FA
CTSH
EETS
ETS in force
ETS scheduled
ETS considered
Adopted a law outlining provisions for a potential national ETS
Expected focus on auctions
Possible connection with the carbon tax
COLOMBIA
ETS DESCRIPTIONIn 2018, Colombia adopted a law for climate change management, which outlines provisions for the establishment of a National Program of Greenhouse Gas Tradable Emission Quotas (Programa Nacional de Cupos Transables de Emisión de Gases de Efecto Invernadero–PNCTE). Although there is no explicit ref-erence to carbon markets or emissions trading, such a program is interpreted as providing for the establish-ment of a national ETS.
The law outlines the basic provisions for the PNCTE. The number of quotas will be determined by the Min-istry of Environment and Sustainable Development (Minambiente), in line with Colombia’s national miti-gation targets. Minambiente is also in charge of allo-cation, which will primarily take place via auctions. The PNCTE will complement other mitigation instru-
ments, such as the country’s existing USD 5 carbon tax that was adopted in 2016 and its offsetting program adopted in 2017. The law for the PNCTE states that the government may also recognize carbon tax payments as part of the compliance obligation of regulated entities. Noncompliance is to be punishable by a fine up to two times the auction price. Auction revenues will be directed to the National Environmental Fund. The bill also includes crediting provisions: voluntary actions of non-regulated entities that generate GHG emissions reductions or removals could be issued quotas if they are verified, certified, registered in the National Registry, and eligible for the program.
Further regulations are yet to be developed in order to operationalize the PNCTE. The timeline for this is not yet specified.
INSTITUTIONS INVOLVED Ministry of Environment and Sustainable Development;Department of National Planning;Ministry of Mines and Energy;Ministry of Finance;National Climate Change System
Energy 82.5 (39%)Industry 10.5 (5%)Agriculture, Forestry, and Other Land Use (net) 106.9 (50%)Waste 14.4 (7%)
OVERALL GHG EMISSIONS (EXCL. LULUCF) 214.3 MtCO2e (2014)
OVERALL GHG EMISSIONS BY SECTOR
GHG REDUCTION TARGETSBY 2030: Reduce GHG emissions by 20% compared to BAU emissions by 2030, or by 30% if international support is provided (NDC)
Other Information
Background Information
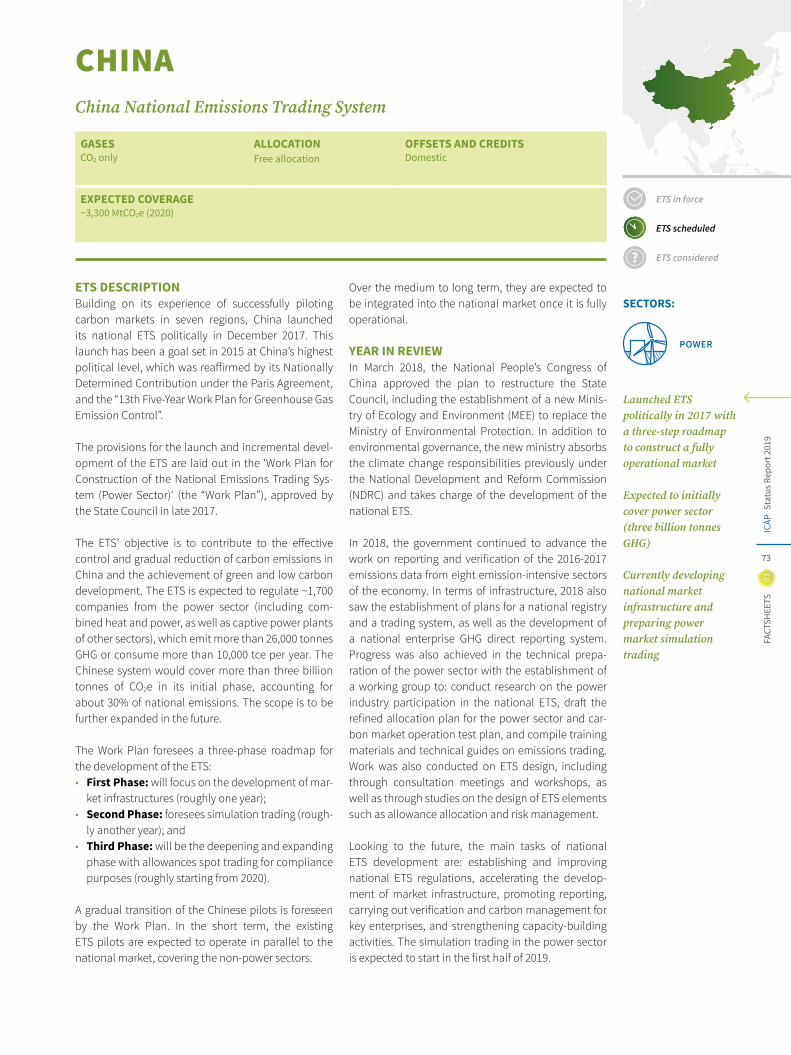
03FA
CTSH
EETS
Stat
us R
epor
t 201
9IC
AP
73
GASESCO2 only
ALLOCATION Free allocation
OFFSETS AND CREDITS Domestic
EXPECTED COVERAGE~3,300 MtCO2e (2020)
CHINAChina National Emissions Trading System
ETS DESCRIPTIONBuilding on its experience of successfully piloting carbon markets in seven regions, China launched its national ETS politically in December 2017. This launch has been a goal set in 2015 at China’s highest political level, which was reaffirmed by its Nationally Determined Contribution under the Paris Agreement, and the “13th Five-Year Work Plan for Greenhouse Gas Emission Control”.
The provisions for the launch and incremental devel-opment of the ETS are laid out in the ‘Work Plan for Construction of the National Emissions Trading Sys-tem (Power Sector)‘ (the “Work Plan”), approved by the State Council in late 2017.
The ETS’ objective is to contribute to the effective control and gradual reduction of carbon emissions in China and the achievement of green and low carbon development. The ETS is expected to regulate ~1,700 companies from the power sector (including com-bined heat and power, as well as captive power plants of other sectors), which emit more than 26,000 tonnes GHG or consume more than 10,000 tce per year. The Chinese system would cover more than three billion tonnes of CO2e in its initial phase, accounting for about 30% of national emissions. The scope is to be further expanded in the future.
The Work Plan foresees a three-phase roadmap for the development of the ETS:• First Phase: will focus on the development of mar-
ket infrastructures (roughly one year); • Second Phase: foresees simulation trading (rough-
ly another year); and • Third Phase: will be the deepening and expanding
phase with allowances spot trading for compliance purposes (roughly starting from 2020).
A gradual transition of the Chinese pilots is foreseen by the Work Plan. In the short term, the existing ETS pilots are expected to operate in parallel to the national market, covering the non-power sectors.
Over the medium to long term, they are expected to be integrated into the national market once it is fully operational.
YEAR IN REVIEWIn March 2018, the National People’s Congress of China approved the plan to restructure the State Council, including the establishment of a new Minis-try of Ecology and Environment (MEE) to replace the Ministry of Environmental Protection. In addition to environmental governance, the new ministry absorbs the climate change responsibilities previously under the National Development and Reform Commission (NDRC) and takes charge of the development of the national ETS.
In 2018, the government continued to advance the work on reporting and verification of the 2016-2017 emissions data from eight emission-intensive sectors of the economy. In terms of infrastructure, 2018 also saw the establishment of plans for a national registry and a trading system, as well as the development of a national enterprise GHG direct reporting system. Progress was also achieved in the technical prepa-ration of the power sector with the establishment of a working group to: conduct research on the power industry participation in the national ETS, draft the refined allocation plan for the power sector and car-bon market operation test plan, and compile training materials and technical guides on emissions trading. Work was also conducted on ETS design, including through consultation meetings and workshops, as well as through studies on the design of ETS elements such as allowance allocation and risk management.
Looking to the future, the main tasks of national ETS development are: establishing and improving national ETS regulations, accelerating the develop-ment of market infrastructure, promoting reporting, carrying out verification and carbon management for key enterprises, and strengthening capacity-building activities. The simulation trading in the power sector is expected to start in the first half of 2019.
ETS in force
ETS scheduled
ETS considered
SECTORS:
POWER
Launched ETS politically in 2017 with a three-step roadmap to construct a fully operational market
Expected to initially cover power sector (three billion tonnes GHG)
Currently developing national market infrastructure and preparing power market simulation trading
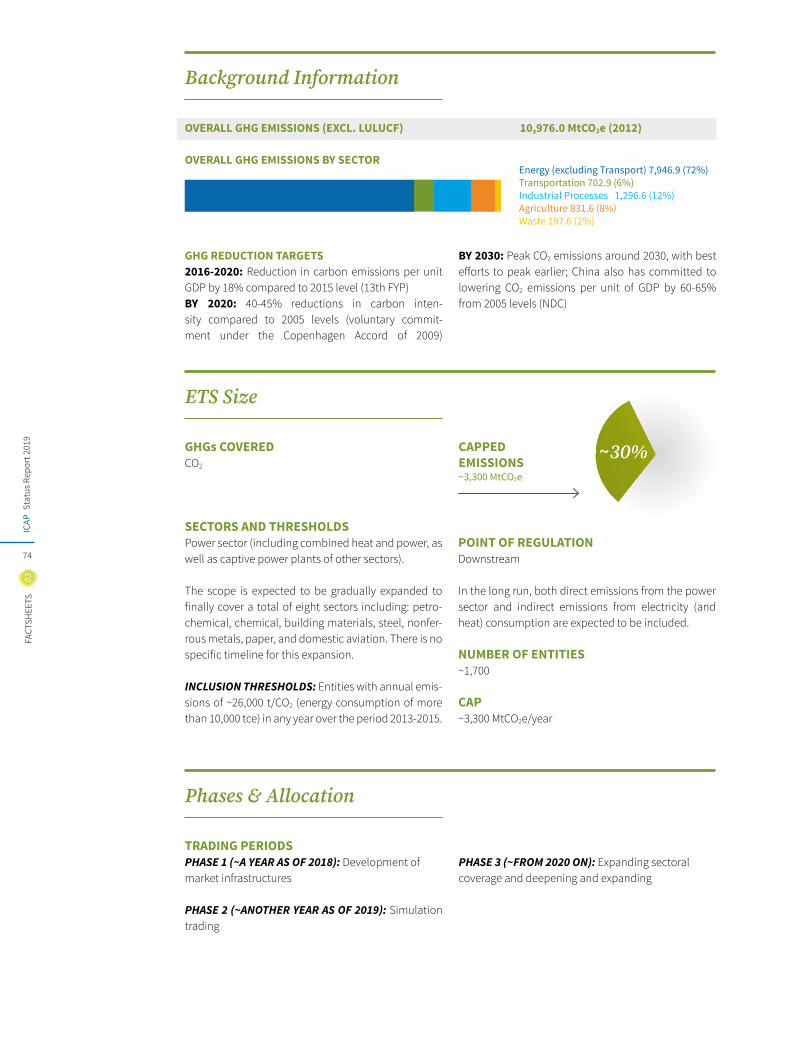
Stat
us R
epor
t 201
9IC
AP
74
03FA
CTSH
EETS
GHG REDUCTION TARGETS2016-2020: Reduction in carbon emissions per unit GDP by 18% compared to 2015 level (13th FYP)BY 2020: 40-45% reductions in carbon inten-sity compared to 2005 levels (voluntary commit-ment under the Copenhagen Accord of 2009)
BY 2030: Peak CO2 emissions around 2030, with best efforts to peak earlier; China also has committed to lowering CO2 emissions per unit of GDP by 60-65% from 2005 levels (NDC)
OVERALL GHG EMISSIONS (EXCL. LULUCF) 10,976.0 MtCO2e (2012)
OVERALL GHG EMISSIONS BY SECTOREnergy (excluding Transport) 7,946.9 (72%)Transportation 702.9 (6%)Industrial Processes 1,296.6 (12%)Agriculture 831.6 (8%)Waste 197.6 (2%)
CAPPED EMISSIONS~3,300 MtCO2e
~30%GHGs COVEREDCO2
SECTORS AND THRESHOLDSPower sector (including combined heat and power, as well as captive power plants of other sectors).
The scope is expected to be gradually expanded to finally cover a total of eight sectors including: petro-chemical, chemical, building materials, steel, nonfer-rous metals, paper, and domestic aviation. There is no specific timeline for this expansion.
INCLUSION THRESHOLDS: Entities with annual emis-sions of ~26,000 t/CO2 (energy consumption of more than 10,000 tce) in any year over the period 2013-2015.
POINT OF REGULATIONDownstream
In the long run, both direct emissions from the power sector and indirect emissions from electricity (and heat) consumption are expected to be included.
NUMBER OF ENTITIES~1,700
CAP ~3,300 MtCO2e/year
TRADING PERIODSPHASE 1 (~A YEAR AS OF 2018): Development of market infrastructures
PHASE 2 (~ANOTHER YEAR AS OF 2019): Simulation trading
PHASE 3 (~FROM 2020 ON): Expanding sectoral coverage and deepening and expanding
Phases & Allocation
Background Information
ETS Size
03FA
CTSH
EETS
Stat
us R
epor
t 201
9IC
AP
75
BANKING AND BORROWING Expected to allow banking across compliance phases, but not to allow borrowing.
OFFSETS AND CREDITSThe use of China Certified Emissions Reduction (CCER) credits is expected to be allowed during the third phase.
In 2012, the NDRC issued the ‘Interim Measures for the Management of Voluntary GHG Emission Reduction Transactions’ (the “Interim Measures”). These mea-sures include guidelines for the issuance of CCERs.
The acceptance of CCERs is expected to be regu-lated through a revision of the Interim Measures and through the development of an ‘Administration Mea-sure of Offset Scheme for National ETS’ (upcoming) focusing on the quality and limits on the use of CCERs in the ETS. Specific timelines and detailed rules are yet to be published.
MARKET STABILITY PROVISIONS Adjustment mechanisms to prevent abnormal price fluctuations, as well as risk prevention and control mechanism to prevent market manipulations are to be developed.
COMPLIANCE PERIOD One year
MRV REPORTING FREQUENCY: Annual reporting of emis-sions to be submitted within a given timeline.
VERIFICATION: Emissions must be verified by a third-party verifier.
FRAMEWORK: MRV guidelines, supplementary data sheets, verification guidelines, and other guidance are available for the eight sectors expected to be covered by the ETS.
From 2013 to 2015, the NDRC released a series of MRV guidelines covering a total of 24 sectors. Supplemen-tary MRV data sheets for the eight sectors expected to be covered under the national ETS, as well as ‘Refer-ence Guidance on Third-party Verification of China ETS’
and ‘Reference Qualification on Third-party Verifica-tion Body and Verifiers of China ETS,’ were all released in 2016. In 2017, new requirements on data collection, categorization, and verification were added.
OTHER: The MEE is taking efforts to develop the man-agement measure for corporate emissions reports as well as improve the existing guidelines and technical specifications for the national ETS.
ENFORCEMENT Noncompliance would result in punishment, which may include recording the noncompliance informa-tion in the national credibility information sharing platform1, although details are yet to be developed.
ALLOCATIONThe ETS competent authority will develop detailed allocation rules in cooperation with energy sector authorities.
FREE ALLOCATION: Free allocation is expected to be based on subsector benchmarks with ex-post adjust-ments for changes in actual production.
In 2017, draft allocation plans for power, cement, and electrolytic aluminum were developed and trial allo-cation work was carried out in two provinces. Further sector-based trial allocation is expected to be carried out in the first half of 2019 in order to refine and final-ize the benchmarks.
CHINAChina National Emissions Trading System
1 – The national credibility information sharing platform, developed in 2015, integrates credibility information provided by various departments and regions across the country. As of 2018, it has achieved interconnection with 44 ministries, 31 provinces and autonomous regions, and 65 market institutions.
Flexibility
Compliance
Stat
us R
epor
t 201
9IC
AP
76
03FA
CTSH
EETS
LINKS WITH OTHER SYSTEMS At the initial phases of the ETS, the focus is on the domestic ETS construction (rather than linking with other systems). Once the national ETS is fully opera-tional, China and other jurisdictions such as EU and Korea may be interested in exploring linking opportu-nities.
INSTITUTIONS INVOLVED The MEE, in cooperation with other relevant minis-tries, is responsible for policy design and rule-making for the national ETS.
Local DRCs implement the policies and rules set up by the central level in their respective regions, but this is expected to be moved to local Ecology and Environ-ment Bureaus, which are the corresponding govern-ment institutions of the MEE at the regional level, in the course of 2019.
IMPLEMENTING LEGISLATIONWork Plan for Construction of the National Emissions Trading System (Power Sector)1
Notice on Key Works in Preparation for the Launch of the National ETS2
24 Guidelines for GHG Monitoring and Reporting for various sectors (20133, 20144 and 20155)
Interim Administrative Measures on Emissions Trading6
Linking
Other Information
1 – http://www.ndrc.gov.cn/zcfb/gfxwj/201712/W020171220566893899825.pdf 2 – http://www.ndrc.gov.cn/gzdt/201601/t20160122_772150.html 3 – http://www.ndrc.gov.cn/zcfb/zcfbtz/201311/t20131101_565313.html 4 – http://www.waizi.org.cn/doc/27835.html 5 – http://www.ndrc.gov.cn/zcfb/zcfbtz/201511/t20151111_758275.html 6 – http://en.pkulaw.cn/display.aspx?cgid=3bd82d2e15823813bdfb&lib=law
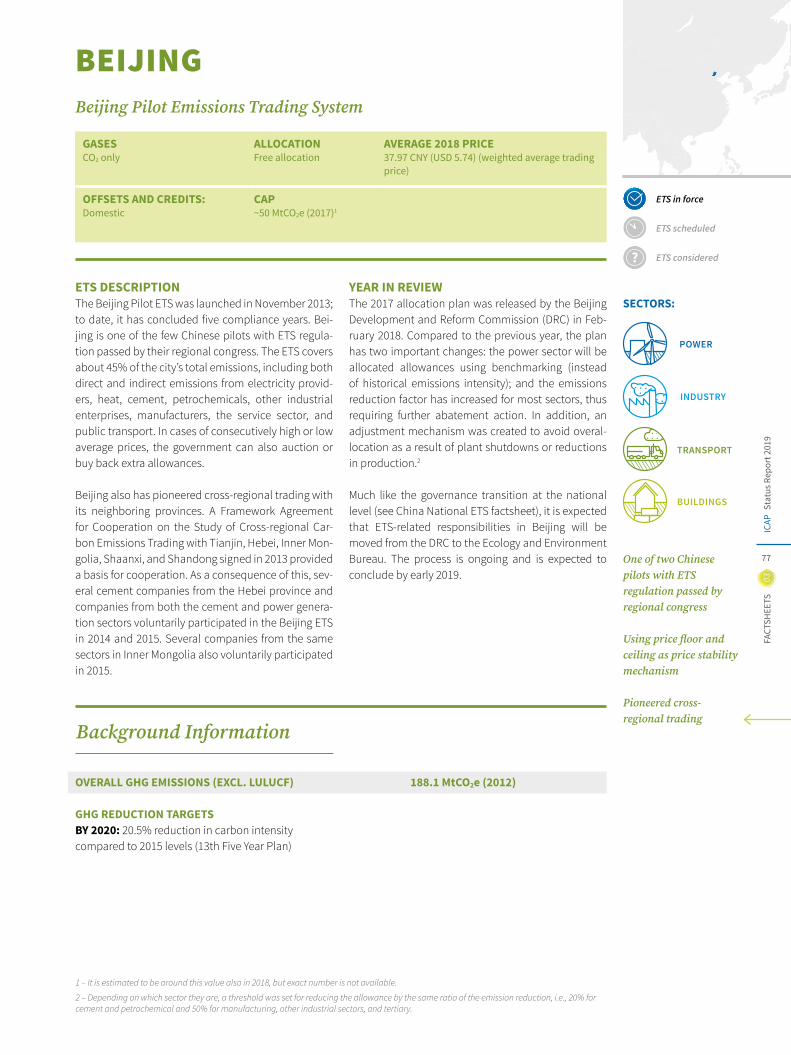
03FA
CTSH
EETS
Stat
us R
epor
t 201
9IC
AP
77
GASES CO2 only
ALLOCATIONFree allocation
AVERAGE 2018 PRICE37.97 CNY (USD 5.74) (weighted average trading price)
OFFSETS AND CREDITS: Domestic
CAP~50 MtCO2e (2017)1
BEIJINGBeijing Pilot Emissions Trading System
ETS DESCRIPTIONThe Beijing Pilot ETS was launched in November 2013; to date, it has concluded five compliance years. Bei-jing is one of the few Chinese pilots with ETS regula-tion passed by their regional congress. The ETS covers about 45% of the city’s total emissions, including both direct and indirect emissions from electricity provid-ers, heat, cement, petrochemicals, other industrial enterprises, manufacturers, the service sector, and public transport. In cases of consecutively high or low average prices, the government can also auction or buy back extra allowances.
Beijing also has pioneered cross-regional trading with its neighboring provinces. A Framework Agreement for Cooperation on the Study of Cross-regional Car-bon Emissions Trading with Tianjin, Hebei, Inner Mon-golia, Shaanxi, and Shandong signed in 2013 provided a basis for cooperation. As a consequence of this, sev-eral cement companies from the Hebei province and companies from both the cement and power genera-tion sectors voluntarily participated in the Beijing ETS in 2014 and 2015. Several companies from the same sectors in Inner Mongolia also voluntarily participated in 2015.
YEAR IN REVIEWThe 2017 allocation plan was released by the Beijing Development and Reform Commission (DRC) in Feb-ruary 2018. Compared to the previous year, the plan has two important changes: the power sector will be allocated allowances using benchmarking (instead of historical emissions intensity); and the emissions reduction factor has increased for most sectors, thus requiring further abatement action. In addition, an adjustment mechanism was created to avoid overal-location as a result of plant shutdowns or reductions in production.2
Much like the governance transition at the national level (see China National ETS factsheet), it is expected that ETS-related responsibilities in Beijing will be moved from the DRC to the Ecology and Environment Bureau. The process is ongoing and is expected to conclude by early 2019.
GHG REDUCTION TARGETS BY 2020: 20.5% reduction in carbon intensity compared to 2015 levels (13th Five Year Plan)
OVERALL GHG EMISSIONS (EXCL. LULUCF) 188.1 MtCO2e (2012)
ETS in force
ETS scheduled
ETS considered
SECTORS:
POWER
INDUSTRY
One of two Chinese pilots with ETS regulation passed by regional congress
Using price floor and ceiling as price stability mechanism
Pioneered cross-regional trading
TRANSPORT
BUILDINGS
1 – It is estimated to be around this value also in 2018, but exact number is not available.
2 – Depending on which sector they are, a threshold was set for reducing the allowance by the same ratio of the emission reduction, i.e., 20% for cement and petrochemical and 50% for manufacturing, other industrial sectors, and tertiary.
Background Information
Stat
us R
epor
t 201
9IC
AP
78
03FA
CTSH
EETS
SECTORS AND THRESHOLDSIndustrial and non-industrial companies and entities, including electricity providers, heating sector, cement, petrochemicals, other industrial enterprises, manu-facturers, service sector, and public transport.
INCLUSION THRESHOLDS: 5,000 tCO2/year, consider-ing both direct and indirect emissions.
MANDATORY REPORTING: 2,000 tonnes of standard coal equivalent (tce) energy consumption/year.
POINT OF REGULATION Downstream.Both direct and indirect emissions are covered.
NUMBER OF ENTITIES943 (2017)
In addition, 621 entities have mandatory reporting obligation but no surrender obligations. CAP~50 MtCO2e (2017)
TRADING PERIODS2013-20183
ALLOCATIONFREE ALLOCATION: Mainly free allocation through grandparenting based on emissions or emissions intensity in the baseline years (for 2017 allowances, the baseline years are 2009-2012 for stationary sources
and 2013-2016 for mobile sources). Benchmarking is used for new entrants and entities with expanded capacity as well for the power sector.
AUCTIONING: Beijing could set aside up to 5% of allowances for regular and irregular auctions (see Mar-ket Stability Mechanisms). To date, the trigger price for auction has never been met.
BANKING AND BORROWINGBanking is allowed. Borrowing is not allowed.
OFFSETS AND CREDITSQUANTITATIVE LIMIT: Domestic project-based carbon offset credits—China Certified Emission Reduction (CCER) credits—are allowed. The use of CCERs is limited to 5% of the annual allocation.
QUALITATIVE LIMIT: CCERs from energy conservation projects and forestry carbon sink projects are allowed, whereas credits
from hydropower, HFC, PFC, N2O, and SF6 projects are not eligible. CCERs must come from projects that began operation after the beginning of 2013 (with exceptions for carbon sink projects, for which the date is February 2005).
Out of the 5% limit, at least 50% must come from projects within the jurisdiction of the city of Beijing. Among the non-Beijing CCERs, priority is given to those with regional climate or pollution control coop-eration agreements (e.g., Hebei and Tianjin).
CAPPED EMISSIONS~50 MtCO2e (2017)
GHGs COVEREDCO2 45%
(2017)
Phases & Allocation
Flexibility
ETS Size
3 – In the short term, the existing Chinese regional carbon markets are expected to operate in parallel to the national Chinese carbon market. Over the medium to long term, they are expected to be integrated into the national market, once it is fully operational.
03FA
CTSH
EETS
Stat
us R
epor
t 201
9IC
AP
79
MARKET STABILITY PROVISIONS The competent authority can auction extra allow-ances if the weighted average price exceeds CNY 150 (USD 22.67) for 10 consecutive days, and buy back allowances from the market using a special funding source from the municipal budget if the price is below CNY 20 (USD 3.02).
COMPLIANCE PERIOD One year
MRV REPORTING FREQUENCY: Annual reporting of CO2 emissions.
VERIFICATION: Third-party verification is required. In addition, further validation is carried out by govern-ment-assigned experts and random checks are con-ducted by fourth-party verifiers. Also, special attention is given to those only with mandatory reporting obli-gation while its reported emissions are close to 5,000 tCO2.
FRAMEWORK: The Beijing DRC has released guide-lines for monitoring and reporting for the following seven sectors: heat production and supply, thermal power generation, cement, petrochemicals, transport, other industrial enterprises, and the service sector.
OTHER: In addition to the ETS participants, all legal entities with energy consumption of more than 2,000 tce have to report their emissions. Verification is not required.
ENFORCEMENT Penalties for failing to submit emissions or verification reports on time can result in fines up to 50,000 CNY (USD 7,558). Furthermore, companies failing to surren-der enough allowances to match their emissions are fined up to five times the average market price over the past six months for each missing allowance. Other nonfinancial penalties include negative impacts on access to bank loans and subsidy programs.
INSTITUTIONS INVOLVED Beijing DRC (Competent authority) – the responsibility is expected to be moved to the Beijing Ecology and Environment Bureau in the course of 2019;China Beijing Environment Exchange (trading plat-form and registry)
IMPLEMENTING LEGISLATION Beijing Pilot ETS Implementation Plan1
Interim Measures for the Management Emissions Trading in Beijing2
Beijing DRC – Allocation Plan for Vintage 20173
BEIJINGBeijing Pilot ETS
Compliance
Other Information
1 – http://www.bjrd.gov.cn/zdgz/zyfb/jyjd/201312/t20131230_124249.html 2 – http://news.bjx.com.cn/html/20140702/523941.shtml 3 – http://www.bjpc.gov.cn/zwxx/tztg/201802/t12508458.htm
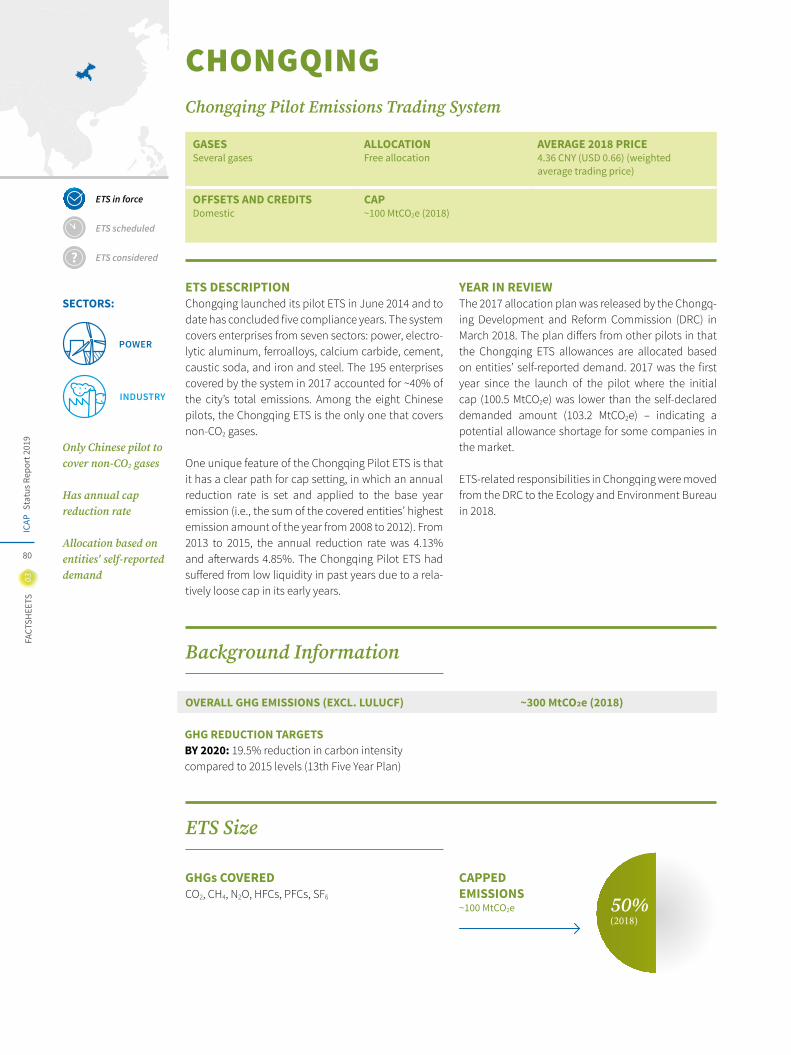
Stat
us R
epor
t 201
9IC
AP
80
03FA
CTSH
EETS
GASESSeveral gases
ALLOCATIONFree allocation
AVERAGE 2018 PRICE4.36 CNY (USD 0.66) (weighted average trading price)
OFFSETS AND CREDITSDomestic
CAP~100 MtCO2e (2018)
CHONGQING
ETS in force
ETS scheduled
ETS considered
SECTORS:
Chongqing Pilot Emissions Trading System
POWER
INDUSTRY
ETS DESCRIPTIONChongqing launched its pilot ETS in June 2014 and to date has concluded five compliance years. The system covers enterprises from seven sectors: power, electro-lytic aluminum, ferroalloys, calcium carbide, cement, caustic soda, and iron and steel. The 195 enterprises covered by the system in 2017 accounted for ~40% of the city’s total emissions. Among the eight Chinese pilots, the Chongqing ETS is the only one that covers non-CO2 gases.
One unique feature of the Chongqing Pilot ETS is that it has a clear path for cap setting, in which an annual reduction rate is set and applied to the base year emission (i.e., the sum of the covered entities’ highest emission amount of the year from 2008 to 2012). From 2013 to 2015, the annual reduction rate was 4.13% and afterwards 4.85%. The Chongqing Pilot ETS had suffered from low liquidity in past years due to a rela-tively loose cap in its early years.
YEAR IN REVIEWThe 2017 allocation plan was released by the Chongq-ing Development and Reform Commission (DRC) in March 2018. The plan differs from other pilots in that the Chongqing ETS allowances are allocated based on entities’ self-reported demand. 2017 was the first year since the launch of the pilot where the initial cap (100.5 MtCO2e) was lower than the self-declared demanded amount (103.2 MtCO2e) – indicating a potential allowance shortage for some companies in the market.
ETS-related responsibilities in Chongqing were moved from the DRC to the Ecology and Environment Bureau in 2018.
Only Chinese pilot to cover non-CO2 gases
Has annual cap reduction rate
Allocation based on entities' self-reported demand
OVERALL GHG EMISSIONS (EXCL. LULUCF) ~300 MtCO2e (2018)
GHG REDUCTION TARGETSBY 2020: 19.5% reduction in carbon intensity compared to 2015 levels (13th Five Year Plan)
CAPPED EMISSIONS~100 MtCO2e 50%
(2018)
GHGs COVEREDCO2, CH4, N2O, HFCs, PFCs, SF6
Background Information
ETS Size
03FA
CTSH
EETS
Stat
us R
epor
t 201
9IC
AP
81
SECTORS AND THRESHOLDSPower, electrolytic aluminum, ferroalloys, calciumcarbide, cement, caustic soda, and iron and steel.
INCLUSION THRESHOLDS: 20,000 tCO2/year or energy consumption 10,000 tonnes coal equivalent (tce)/year.
POINT OF REGULATIONDownstream.Both direct and indirect emissions are covered.
NUMBER OF ENTITIES195 (2018)
CAP~100 MtCO2e (2018)From 2013 to 2015, the annual reduction rate of the cap was 4.13% and afterwards 4.85%.
TRADING PERIODS2013-20181
ALLOCATIONFREE ALLOCATION: Free allocation through grand-parenting based on historic emissions (highest num-ber in period 2008-2012). If the sum of allocation for all enterprises exceeds the cap, a reduction factor is applied. Regulated companies submit their allocation quotas on a yearly basis, forming the basis of their free allocation. Ex-post adjustments based on output data are possible.
BANKING AND BORROWINGBanking is allowed. Borrowing is not allowed.
OFFSETS AND CREDITSQUANTITATIVE LIMIT: Domestic project-based car-bon offset credits – CCERs – are allowed up to 8% of the compliance obligation.
QUALITATIVE LIMIT: Reductions have to be achieved after 2010 with the exception of carbon sink projects. Credits from hydro projects are not allowed.
MARKET STABILITY PROVISIONS Exchange Intervention: In case of market fluctua-tions, the Chongqing Carbon Emissions Exchange can take price stabilization measures.
Sale and Trade Limits: Compliance entities must not sell more than 50% of their annual free allocation. In addition, the price of trading is subject to increase and decrease limits of 10% or 30% depending on types of trading.
1 – In the short term, the existing Chinese regional carbon markets are expected to operate in parallel to the national Chinese carbon market. Over the medium to long term, they are expected to be integrated into the national market, once it is fully operational.
Phases & Allocation
Flexibility
Stat
us R
epor
t 201
9IC
AP
82
03FA
CTSH
EETS
COMPLIANCE PERIOD One year
MRV REPORTING FREQUENCY: Annual reporting of GHG emissions.
VERIFICATION: Third-party verification is required.
FRAMEWORK: The Chongqing DRC released a guiding document for monitoring and reporting that includes methods for different emissions sources, including: combustion, industrial processes, and electricity con-sumption.
ENFORCEMENT There are no financial penalties for non-compliance. Non-financial penalties may include public reporting, disqualification from the energy saving and climate subsidies and associated awards for three years, and a record entered in the State Owned Enterprise perfor-mance assessment system.
INSTITUTIONS INVOLVED Chongqing Ecology and Environment Bureau (Competent authority); Chongqing Carbon Emissions Trading Center (Trading platform and registry)
IMPLEMENTING LEGISLATION Interim Measures for Management of Emissions Trading In Chongqing1
Chongqing DRC – Allowance Allocation Management Rules2
Chongqing DRC – Notice about Allowances Allocation for Vintage 2017
Compliance
Other Information
1 – http://www.tanpaifang.com/tanjiaoyisuo/2014/0504/31858.html 2 – http://www.tanjiaoyi.com/article-2786-1.html
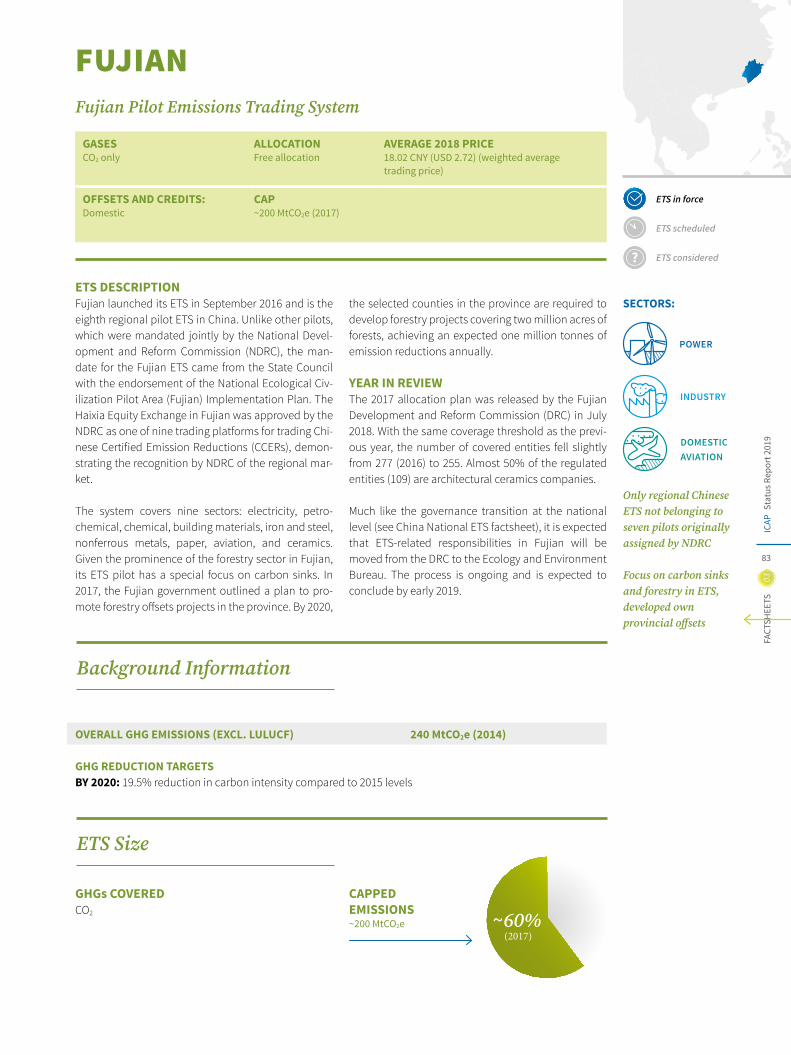
03FA
CTSH
EETS
Stat
us R
epor
t 201
9IC
AP
83
GASES CO2 only
ALLOCATIONFree allocation
AVERAGE 2018 PRICE18.02 CNY (USD 2.72) (weighted average trading price)
OFFSETS AND CREDITS: Domestic
CAP~200 MtCO2e (2017)
FUJIANFujian Pilot Emissions Trading System
ETS DESCRIPTIONFujian launched its ETS in September 2016 and is the eighth regional pilot ETS in China. Unlike other pilots, which were mandated jointly by the National Devel-opment and Reform Commission (NDRC), the man-date for the Fujian ETS came from the State Council with the endorsement of the National Ecological Civ-ilization Pilot Area (Fujian) Implementation Plan. The Haixia Equity Exchange in Fujian was approved by the NDRC as one of nine trading platforms for trading Chi-nese Certified Emission Reductions (CCERs), demon-strating the recognition by NDRC of the regional mar-ket.
The system covers nine sectors: electricity, petro-chemical, chemical, building materials, iron and steel, nonferrous metals, paper, aviation, and ceramics. Given the prominence of the forestry sector in Fujian, its ETS pilot has a special focus on carbon sinks. In 2017, the Fujian government outlined a plan to pro-mote forestry offsets projects in the province. By 2020,
the selected counties in the province are required to develop forestry projects covering two million acres of forests, achieving an expected one million tonnes of emission reductions annually.
YEAR IN REVIEWThe 2017 allocation plan was released by the Fujian Development and Reform Commission (DRC) in July 2018. With the same coverage threshold as the previ-ous year, the number of covered entities fell slightly from 277 (2016) to 255. Almost 50% of the regulated entities (109) are architectural ceramics companies.
Much like the governance transition at the national level (see China National ETS factsheet), it is expected that ETS-related responsibilities in Fujian will be moved from the DRC to the Ecology and Environment Bureau. The process is ongoing and is expected to conclude by early 2019.
GHG REDUCTION TARGETS BY 2020: 19.5% reduction in carbon intensity compared to 2015 levels
OVERALL GHG EMISSIONS (EXCL. LULUCF) 240 MtCO2e (2014)
CAPPED EMISSIONS~200 MtCO2e
GHGs COVEREDCO2 ~60%
(2017)
ETS in force
ETS scheduled
ETS considered
SECTORS:
POWER
INDUSTRY
DOMESTICAVIATION
Only regional Chinese ETS not belonging to seven pilots originally assigned by NDRC
Focus on carbon sinks and forestry in ETS, developed own provincial offsets
Background Information
ETS Size
Stat
us R
epor
t 201
9IC
AP
84
03FA
CTSH
EETS
SECTORS AND THRESHOLDSElectricity, petrochemical, chemical, building materi-als, iron and steel, nonferrous metals, paper, aviation, and ceramics.
INCLUSION THRESHOLDS: Energy consumption 10,000 tonnes of coal equivalent (tce)/year for any year between 2013-2016.
In the future, the Fujian system may extend its cover-age to smaller emitters, i.e., with energy consumption of 5,000 tce or more.
POINT OF REGULATION Downstream.Both direct and indirect emissions are covered.
NUMBER OF ENTITIES255 (2017) CAP~200 MtCO2e (2017)
TRADING PERIODS2016-20181
ALLOCATIONFREE ALLOCATION: Benchmarking is applied to elec-tricity, cement, aluminum, and plate glass sectors.
The other sectors are allocated allowances based on historical intensity. These entities can also apply for more allowances for early mitigation actions.
Free allowances are also to be allocated to new entrants while they are only covered after 12 or 24 months of operation (depending on type of allocation methods).
AUCTIONING: Auctioning may take place where con-sidered appropriate by the ETS authorities (see Market Stability Provisions below) and may be introduced as a method for allowance allocation over time; up to 10% of the total cap is reserved for market interven-tion.
In order to increase market liquidity and price discov-ery, the Fujian DRC organized an auction in 2016 of discriminatory (non-uniform price) allowances. 50,000 allowances from the government reserve were auc-tioned, with the settlement prices ranging from CNY 26.50 (USD 4.01) to around CNY 30 (USD 4.53). To date, this is the only auction held in the province.
BANKING AND BORROWINGBanking is allowed. Borrowing is not allowed.
OFFSETS AND CREDITSQUANTITATIVE LIMIT: Domestic project-based car-bon offset credits (CCERs) and Fujian Forestry Certi-fied Emission Reduction (FFCER) are allowed. The use of CCER credits is limited to 5% of the annual compli-ance obligation, which is increased to 10% for compa-nies that use both FFCER and CCER credits.
QUALITATIVE LIMIT: Eligible offsets will be restricted to those generated in Fujian province, from CO2 or CH4 projects. Hydropower-related credits are not eligible. FFCER projects, with three project types (afforesta-tion, forest management, and bamboo management), need to start implementation after 16 February 2005 and the project developers need to have independent legal personality.
1 – In the short term, the existing Chinese regional carbon markets are expected to operate in parallel to the national Chinese carbon market. Over the medium to long term, they are expected to be integrated into the national market, once it is fully operational.
Phases & Allocation
Flexibility
03FA
CTSH
EETS
Stat
us R
epor
t 201
9IC
AP
85
MARKET STABILITY PROVISIONS DRC Intervention, Reserves: According to the (trial) “Implementation Rules of Emissions Trading Market Management in Fujian Province,” in case of market fluctuations (i.e., if the cumulative increase or decrease of allowance prices for 10 consecutive trading days reach a certain percentage), severe imbalances between supply and demand, or liquidity issues, the Fujian Economic and Information Center
under the guidance of the Fujian DRC – in consul-tation with an advisory committee – can buy or sell allowances in order to stabilize the market. More spe-cifically, high prices may trigger allowance auctions from government reserves through the Haixia Equity Exchange. Low prices may trigger authorities to buy allowances from the market through governmental funds.
COMPLIANCE PERIOD One year
MRV REPORTING FREQUENCY: Annual reporting of CO2 emissions.
VERIFICATION: Third-party verification is required. In addition, further validation is carried out by gov-ernment-assigned experts and random checks are conducted by fourth-party verifiers. Special attention is also given to those only with mandatory reporting obligation while its reported emissions are close to 5,000 tCO2.
FRAMEWORK: The Fujian DRC and the Fujian Statisti-cal Bureau have jointly released a guiding document on monitoring and reporting that includes a moni-toring plan template, using national measuring and reporting guidelines. In addition, the Fujian DRC and the Fujian Quality and Technical Supervision Bureau
also jointly released a measure for the administration of third-party verifiers, which specifies criteria for the verifiers and their staff.
ENFORCEMENT Penalties for failing to submit an emissions or verifica-tion report on time, providing false information, or dis-turbing the verification process range from CNY 10,000 (USD 1,512) to CNY 30,000 (USD 4,535). Companies failing to surrender enough allowances to match their emissions are fined between one to three times the average market price of the past 12 months, with the maximum limit of CNY 30,000 (USD 4,535). Twice the amount of the missing allowances can be withdrawn from the account of the company or deducted from next year’s allocation. Penalties for the misconduct of trading entities and their staff, such as not publishing relevant trading information or leaking commercial secrets, could range from CNY 10,000 (USD 1,512) to CNY 30,000 (USD 4,535).
INSTITUTIONS INVOLVED Fujian DRC (Competent authority) – the responsibility is expected to be moved to the Fujian Ecology and Environment Bureau in the course of 2019;Fujian Huaxia Equity Exchange (Trading platform);Fujian Economic and Information Center (Registry, market management, MRV administration)
IMPLEMENTING LEGISLATION Implementation Plan of Emissions Trading Market Con-struction in Fujian Province1
Interim Measures for the Management of Emissions Trading in Fujian Province2
Fujian DRC – Allocation Plan for Vintage 20173
FUJIANFujian Pilot ETS
Compliance
Other Information
1 – http://fgw.fujian.gov.cn/ztzl/stwmzt/qwsy/201609/t20160930_823497.htm 2 – http://www.fujian.gov.cn/m/#!/detail/1135886 3 – http://fgw.fujian.gov.cn/zfxxgkzl/zfxxgkml/yzdgkdqtxx/201807/t20180730_3595897.htm
Stat
us R
epor
t 201
9IC
AP
86
03FA
CTSH
EETS
60%(2018)
GASES CO2 only
ALLOCATIONFree allocation Auctioning
AVERAGE 2018 PRICECNY 15.10 (USD 2.28) (weighted average trading price)
TOTAL REVENUESince beginning of program: CNY 804 million (USD 122 million)No revenue in 2018 (no auctions took place)
OFFSETS AND CREDITSDomestic
CAP422 MtCO2e (2018)
GUANGDONGGuangdong Pilot Emissions Trading System
ETS DESCRIPTIONThe Guangdong Pilot ETS was launched in December 2013 and is the largest of the Chinese ETS pilots. It cur-rently covers the power, cement, steel, petrochemical, papermaking, and aviation sectors, accounting for more than 60% of the province’s emissions. This is the result of an expansion of its scope back in 2016, which introduced two new sectors (domestic aviation and paper) and adjusted allocation methods. In 2017, the Guangdong Pilot ETS had 50 new entrants.
The Guangdong Pilot ETS has one of the most active markets among Chinese pilots with the largest mar-ket share. Unlike other pilots, Guangdong auctions a small share of allowances1. The auctioning has been moved from mandatory (2013) to voluntary participa-tion (since 2014) and has been held ad hoc (rather than quarterly) since 2017. Guangdong and Shenzhen are the only two Chinese pilots open to foreign investors.
In November 2016, Guangdong increased the maxi-mum position of institutional and individual investors from three to eight million allowances. Guangdong also allows unincorporated organizations, such as funds and trusts, to trade in its carbon market. As of 2018, it had 72 institutional investors.
YEAR IN REVIEWThe 2018 allocation plan was released by the Guang-dong Development and Reform Commission (DRC) in July 2018. No significant changes were implemented compared to the allocation plan of the previous year. Much like the governance transition at the national level (see China National ETS factsheet), the ETS-re-lated responsibilities in Guangdong provincial level moved from the DRC to the Ecology and Environment Bureau in October 2018.
Largest Chinese pilot
One of most active Chinese pilots with largest market share for the spot trading
Only Chinese pilot regularly auctioning
OVERALL GHG EMISSIONS (EXCL. LULUCF) 610.5 MtCO2e (2012)
GHG REDUCTION TARGETSBY 2020: 20.5% reduction in carbon intensity compared to 2015 levels
CAPPED EMISSIONS 422 MtCO2e
GHGs COVEREDCO2
ETS in force
ETS scheduled
ETS considered
SECTORS:
POWER
INDUSTRY
DOMESTICAVIATION
1 - It was mandatory for enterprises to purchase 3% of their allowances from auctions in 2013 before receiving the remainder for free. Since 2014, the non-free allocation rate has been raised to 5% for the power sector and 3% for the remaining sectors.
Background Information
ETS Size
03FA
CTSH
EETS
Stat
us R
epor
t 201
9IC
AP
87
SECTORS AND THRESHOLDSPower, iron and steel, cement, papermaking, aviation, and petrochemicals.
INCLUSION THRESHOLDS: 20,000 tCO2/year orenergy consumption 10,000 tonnes coal equivalent (tce)/year.
POINT OF REGULATIONDownstream.Both direct and indirect emissions are covered2.
NUMBER OF ENTITIES 249 (2018), existing entities39 (2018), new entrant entities CAP 422 MtCO2e (2018), among which 23 MtCO2e are kept as government reserves for new entrants and market stability.
2 - The electricity market in Guangdong has undergone some changes following the national power sector reform process. In 2019, about a third of the total electricity consumption in Guangdong will be included in the electricity trading market. Guangdong also plans to launch an electricity spot market. 3 - In the short term, the existing Chinese regional carbon markets are expected to operate in parallel to the national Chinese carbon market. Over the medium to long term, they are expected to be integrated into the national market once it is fully operational.
TRADING PERIODS2013-20183
ALLOCATIONFREE ALLOCATION: Mainly free allocation based on grandparenting, historical intensity, or benchmarking. Benchmarking is applied to coal and gas-fired elec-tricity generators (including heating, as well as com-bined heat and power), as well as to some industrial processes in the aviation, cement, paper, and steel sectors. Ex-post adjustments based on real produc-tion data of the respective compliance year are also applied.
AUCTIONING: Guangdong auctions a small share of allowances as a way of allowance allocation. During the first compliance year (2013), entities were required to purchase allowances in auctions in order to become eligible to receive their freely allocated allowances. This requirement was terminated in 2014. Since 2014, free allocation percentages remain the same, i.e., 95% for the power sector and 97% for the remaining sec-tors. A total of two million allowances are available for auction annually. Quarterly auctions were held until the 2016 vintage while for 2017 and 2018, auctions were ad hoc. No auction took place in 2018.
BANKING AND BORROWINGBanking is allowed. Borrowing is not allowed.
OFFSETS AND CREDITSQUANTITATIVE LIMIT: Carbon offset credits (CCERs) are allowed. As a mechanism that encourages the public to reduce carbon emissions, Pu Hui Certified Emission Reductions (PHCER) are also allowed during 2017 and 2018. In 2018, entities are allowed to make use of 1.5 million offsets (CCER and PHCER) towards compliance obligations.
QUALITATIVE LIMIT: Of the annual compliance obli-gation met by offsets, at least half must be from CO2 or CH4 reduction projects. At least 70% of offsets need to come from within the Guangdong province. Pre-CDM
credits are not eligible. Credits from hydro and from most fossil fuel projects are also not eligible.
MARKET STABILITY PROVISIONSReserves: The Guangdong province set aside 5% of all allowances for government reserves for new entrants and market stability. The specific rules for market stability are provided by its Trial Measures for ETS. Auction Floor Price: Auctions under the Guangdong Pilot ETS are subject to an auction floor price. Initially in 2013, it was set at CNY 60 (USD 9.07), and then it was lowered to CNY 25 (USD 3.78) and increased to CNY 40 (USD 6.05) in steps of CNY 5 (USD 0.76) with each quarterly auction. In 2015, the floor price was set at 80% of the weighted average price for allowances over the previous three months. In 2016, there was no
Phases & Allocation
Flexibility
Stat
us R
epor
t 201
9IC
AP
88
03FA
CTSH
EETS
restriction on the declared price, but a so-called pol-icy reserve price was set as an effective price floor. In 2017, the policy reserve price was set at 100% of the weighted average price for allowances over the pre-vious three months. The policy reserve prices for the four auctions for the 2016 compliance period are as follows: (21 June 2016–20 June 2017) were CNY 9.37 (USD 1.42), CNY 11.27 (USD 1.70), CNY 16.09 (USD 2.43), and CNY 15.15 (USD 2.29).
OFFSET AUCTIONS: Guangdong also introduced auc-tioning for PHCERs with an auction price floor set by the Emissions Exchange Guangzhou on behalf of the project developers. In the latest auction (19 November 2018), the floor price was set as CNY 12.32/tonne (USD 1.86) (which is set at 80% of the weighted average price for allowances over the previous three months).
COMPLIANCE PERIOD One year
MRV REPORTING FREQUENCY: Annual reporting of CO2 emissions.
VERIFICATION: Third-party verification is required. In addition, further assessment of all validation reports was carried out by the government. On-site cross re-verifications were also conducted by third parties for all compliance entities with questionable verifi-cation reports as well for randomly selected entities. These have been shifted to fourth-party assessment and verification since the 2016 compliance period.
FRAMEWORK: The Guangdong DRC has released guidelines for monitoring and reporting for the com-pliance and reporting sectors.
OTHER: In addition to the ETS participants, all legal entities with energy consumption of more than 2,000 tce have to report their emissions. Verification is not required.
ENFORCEMENT Penalties for failing to submit emissions or verification reports on time range from CNY 10,000 (USD 1,512) to CNY 50,000 (USD 7,558). Furthermore, companies failing to surrender enough allowances to match their emissions will be deducted twice the amount of allowances from the following year’s allocation and are fined CNY 50,000 (USD 7,558). Other non-financial penalties include negative impacts on access to bank loans and subsidy programs.
INSTITUTIONS INVOLVED Guangdong Ecology and Environment Bureau (Competent authority);Emissions Exchange Guangzhou (Trading platform)
USE OF REVENUESGuangdong has been exploring the establishment of a Low Carbon Development Fund that would use auctioning revenues to promote further mitigation actions, carbon finance, and low-carbon industry development. The set-up and function of this fund is
still under discussion between Guangdong DRC and Guangdong Finance Department. Currently, the reve-nue flows into the general provincial budget.
IMPLEMENTING LEGISLATION Guangdong Pilot ETS Implementation Plan1
Trial Measures for Emissions Trading in Guangdong2
Guangdong DRC – Allocation Plan for Vintage 20183
Compliance
Other Information
1 – http://zwgk.gd.gov.cn/006939748/201209/t20120914_343489.html 2 – http://zwgk.gd.gov.cn/006939748/201401/t20140117_462131.html ; 3 – http://www.gddrc.gov.cn/zwgk/ywtz/201807/t20180725_476705.shtml
03FA
CTSH
EETS
Stat
us R
epor
t 201
9IC
AP
89
GASES CO2 only
ALLOCATION Free allocation
AVERAGE 2018 PRICECNY 21.23 (USD 3.21) (weighted average trading price)
TOTAL REVENUE Revenue information for the 2014 auction not available1. No auctions took place in 2018
OFFSETS AND CREDITS Domestic
CAP 257 MtCO2e (2017)
HUBEIHubei Pilot Emissions Trading System
ETS DESCRIPTIONThe Hubei Pilot ETS was launched in April 2014; to date, it has concluded five compliance years. Hubei has been one of the most active regional markets in China in terms of trading and has the second-largest market size when considering spot trading only, after Guangdong. When spot forward trading is also con-sidered, Hubei has the largest market share as of end 2018, with its total secondary market transaction vol-ume and value both accounting for over 60% of the sum of all pilots together. The system initially covered 138 of the most carbon-intensive companies in the province, accounting for approximately 35% of the province’s total carbon emissions.
Hubei has also expanded its scope several times. In 2016, it lowered the thresholds of seven sectors from 60,000 to 10,000 tonnes coal equivalent (tce) and in 2017 further lowered the thresholds of all the other sectors to 10,000 tce. A government reserve with 8% of the total cap is available for market stabilization, and the government can also intervene in cases of market fluctuations, severe supply-demand imbalances or for liquidity reasons.
According to the compliance notice by the Hubei Development and Reform Commission (DRC) in July 2017, the Hubei Pilot ETS will continue to run after the
National ETS commences. However, only allowances that were traded can be banked into later years. The transition of Hubei allowances into the National ETS will be based on rules to be defined by the national competent authority. In December 2017, Hubei was selected to lead the development of the registry for the national ETS.
YEAR IN REVIEWThe 2017 allocation plan was released by the Hubei DRC in January 2018. The key change compared to the previous year’s plan is a tighter allocation rule. By lowering thresholds for some sectors, it also increased the total number of covered entities from 126 (in 2016) to 344 (in 2017).
Much like the governance transition at the national level (see China National ETS factsheet), it is expected that ETS-related responsibilities in Hubei will be moved from the DRC to the Ecology and Environment Bureau. The process is ongoing and is expected to conclude by early 2019.
GHG REDUCTION TARGETS BY 2020: 19.5% reduction in carbon intensity compared to 2015 levels
OVERALL GHG EMISSIONS (EXCL. LULUCF) 463.1 MtCO2e (2012)
ETS in force
ETS scheduled
ETS considered
SECTORS:
POWER
INDUSTRY
Active trading pilot, largest market share (spot and spot forward)
Has market stability reserve, government can intervene in cases of low or high prices
Leading development of national ETS registry
Background Information
1 – To date, only one auction has been held in Hubei, with four million tonnes of allowances auctioned in 2014. The objective of the auction was to discover the market price and enhance market liquidity, rather than as a way of allowance allocation.
Stat
us R
epor
t 201
9IC
AP
90
03FA
CTSH
EETS
INCLUSION THRESHOLDS: Annual energy consump-tion more than 10,000 tce in any year between 2014 and 2016.
UNTIL 2015: Annual energy consumption more than 60,000 tce in any year between 2010 and 2011.
POINT OF REGULATION DownstreamBoth direct and indirect emissions are covered.
NUMBER OF ENTITIES344 (2017) CAP257MtCO2e (2017)
TRADING PERIODS2014-20182
ALLOCATIONFREE ALLOCATION: Free allocation of 2017 vintage allowances through benchmarks for power, heat, co-generation, and cement (except the entities using outsourced clinker).
Historical emissions intensity for glass and other building materials, pulp and paper, and ceramics sec-
tors; grandparenting based on previous three years’ historic emissions for all other sectors.
Ex-post allocation adjustments are possible, espe-cially for those sectors that use benchmarks and emis-sions intensity3.
The total cap also includes a New Entrants Reserve, as well as a government reserve for potential market stability measures.
BANKING AND BORROWINGBanking is allowed, but only for allowances that were traded at least once. Borrowing is not allowed.
OFFSETS AND CREDITSQUANTITATIVE LIMIT: The use of domestic project-based carbon offset cred-its (CCERs) is limited to 10% of the annual initial allo-cation for each entity.
QUALITATIVE LIMIT: CCERs must come from rural biogas or forestry proj-ects in the key counties under the national or pro-vincial poverty alleviation plan in urban agglomera-tion areas of the middle reaches of the Yangtze River (within Hubei). CCERs must have been generated between 1 January 2013 and 31 December 2015.
2 – In the short term, the existing Chinese regional carbon markets are expected to operate in parallel to the national Chinese carbon market. Over the medium to long term, they are expected to be integrated into the national market, once it is fully operational. 3 – In this case, entities first receive half of the total allowance based on the previous year’s actual emission data or historical emission baseline; the actual production data is then used to update allocation ex-post.
CAPPED EMISSIONS257 MtCO2e
GHGs COVEREDCO2
SECTORS AND THRESHOLDSPower and heat supply, iron and steel, nonferrous metals, petrochemicals, chemicals, textile, cement, glass and other building materials, pulp and paper, ceramics, automobile and equipment manufacturing, and food, beverage, and medicine producers.
~45% (2017)
Phases & Allocation
Flexibility
ETS Size
03FA
CTSH
EETS
Stat
us R
epor
t 201
9IC
AP
91
MARKET STABILITY PROVISIONS Reserve: 8% of the total cap is kept as a government reserve for market stabilization.
DRC Intervention: In case of market fluctuations, severe imbalances between supply and demand or liquidity issues, the Hubei DRC – in consultation with an advisory committee consisting of government insti-tutions and other stakeholders – can buy or sell allow-
ances in order to stabilize the market. Specifically, if the allowance price reaches a low or high point six times during a 20-day time span, the Hubei DRC takes action.
Exchange: The exchange limits day-to-day price fluctuations to between -10% and +10% respectively; between 15 July and 25 December 2016, the limit was temporarily adjusted to between -1% and +10% as a response to the decreasing carbon price at that time.
COMPLIANCE PERIOD One year
MRV REPORTING FREQUENCY: Annual reporting of CO2
emissions.
VERIFICATION: Third-party verification is required. In addition, further validation is carried by govern-ment-assigned experts and random checks are con-ducted by fourth-party verifiers. Special attention is also given to those only with mandatory reporting obligation while its reported emissions are close to 26,000 tCO2.
FRAMEWORK: The Hubei DRC has released a guiding document on monitoring and reporting that includes sector-specific guidance for the following sectors: power, glass, aluminum, calcium carbide, pulp and paper, automobile manufacturing, iron and steel, fer-roalloys, ammonia, cement, and petroleum processing.
ENFORCEMENT Penalties for failing to submit an emissions or verifi-cation report on time range from CNY 10,000 (USD 1,512) to CNY 30,000 (USD 4,535). Trade participants that manipulate the market face up to CNY 150,000 (USD 22,673) in fines. Furthermore, companies that fail to surrender enough allowances to match their emissions will be deducted twice the amount of allowances from next year’s allocation and are fined one to three times the average market price for every allowance, with a maximum limit of CNY 150,000 (USD 22,673).
INSTITUTIONS INVOLVED Hubei DRC (Competent authority)—the responsibility is expected to be moved to the Hubei Ecology and Environment Bureau in the course of 2019; China Hubei Emission Exchange (Trading platform and registry)
IMPLEMENTING LEGISLATION Hubei Pilot ETS Implementation Plan1
Interim Measures for Management of Emissions Trading in Hubei Province2
Hubei DRC – Allocation Plan for Vintage 20173
HUBEIHubei Pilot ETS
Compliance
Other Information
1 – http://gkml.hubei.gov.cn/auto5472/auto5473/201302/t20130227_435678.html 2 – http://gkml.hubei.gov.cn/auto5472/auto5473/201404/t20140422_497476.html 3 – http://fgw.hubei.gov.cn/xw/tzgg_3465/gg/wbwj/201801/t20180115_134615.shtml
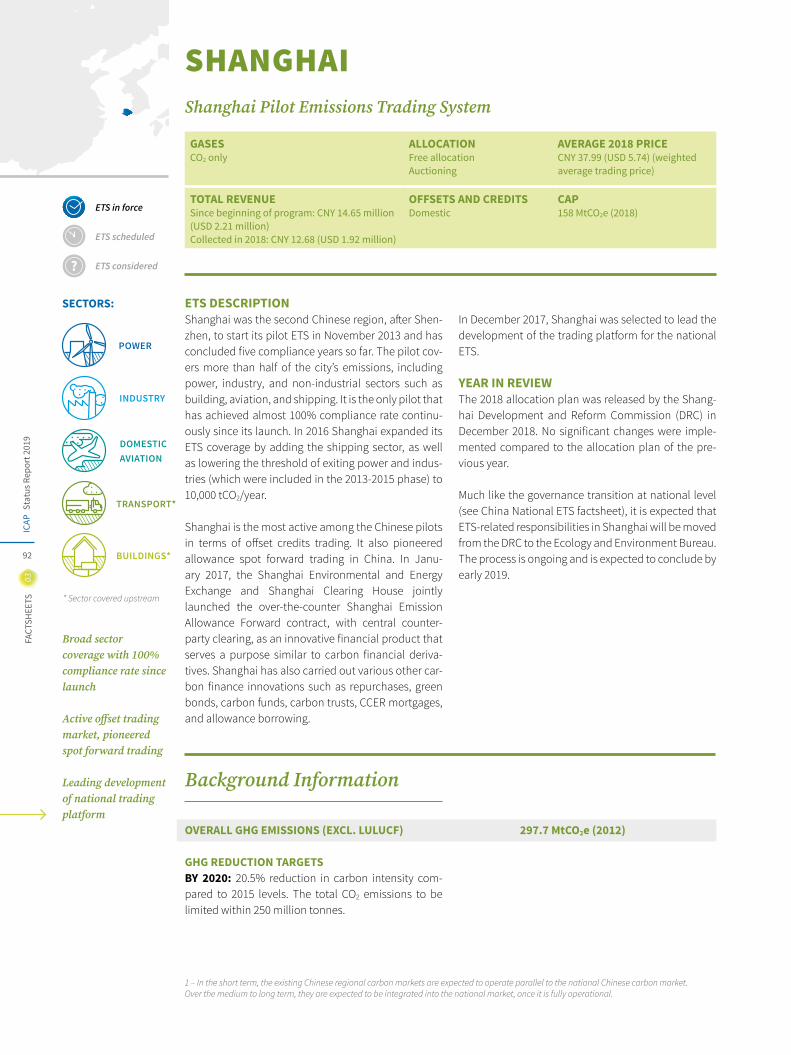
Stat
us R
epor
t 201
9IC
AP
92
03FA
CTSH
EETS
SHANGHAIShanghai Pilot Emissions Trading System
ETS DESCRIPTIONShanghai was the second Chinese region, after Shen-zhen, to start its pilot ETS in November 2013 and has concluded five compliance years so far. The pilot cov-ers more than half of the city’s emissions, including power, industry, and non-industrial sectors such as building, aviation, and shipping. It is the only pilot that has achieved almost 100% compliance rate continu-ously since its launch. In 2016 Shanghai expanded its ETS coverage by adding the shipping sector, as well as lowering the threshold of exiting power and indus-tries (which were included in the 2013-2015 phase) to 10,000 tCO2/year.
Shanghai is the most active among the Chinese pilots in terms of offset credits trading. It also pioneered allowance spot forward trading in China. In Janu-ary 2017, the Shanghai Environmental and Energy Exchange and Shanghai Clearing House jointly launched the over-the-counter Shanghai Emission Allowance Forward contract, with central counter-party clearing, as an innovative financial product that serves a purpose similar to carbon financial deriva-tives. Shanghai has also carried out various other car-bon finance innovations such as repurchases, green bonds, carbon funds, carbon trusts, CCER mortgages, and allowance borrowing.
In December 2017, Shanghai was selected to lead the development of the trading platform for the national ETS.
YEAR IN REVIEWThe 2018 allocation plan was released by the Shang-hai Development and Reform Commission (DRC) in December 2018. No significant changes were imple-mented compared to the allocation plan of the pre-vious year.
Much like the governance transition at national level (see China National ETS factsheet), it is expected that ETS-related responsibilities in Shanghai will be moved from the DRC to the Ecology and Environment Bureau. The process is ongoing and is expected to conclude by early 2019.
Broad sector coverage with 100% compliance rate since launch
Active offset trading market, pioneered spot forward trading
Leading development of national trading platform
OVERALL GHG EMISSIONS (EXCL. LULUCF) 297.7 MtCO2e (2012)
GHG REDUCTION TARGETSBY 2020: 20.5% reduction in carbon intensity com-pared to 2015 levels. The total CO2 emissions to be limited within 250 million tonnes.
1 – In the short term, the existing Chinese regional carbon markets are expected to operate parallel to the national Chinese carbon market. Over the medium to long term, they are expected to be integrated into the national market, once it is fully operational.
ETS in force
ETS scheduled
ETS considered
SECTORS:
POWER
INDUSTRY
DOMESTICAVIATION
* Sector covered upstream
TRANSPORT*
BUILDINGS*
Background Information
GASES CO2 only
ALLOCATION Free allocation Auctioning
AVERAGE 2018 PRICECNY 37.99 (USD 5.74) (weighted average trading price)
TOTAL REVENUE Since beginning of program: CNY 14.65 million (USD 2.21 million)Collected in 2018: CNY 12.68 (USD 1.92 million)
OFFSETS AND CREDITS Domestic
CAP 158 MtCO2e (2018)
03FA
CTSH
EETS
Stat
us R
epor
t 201
9IC
AP
93
57%(2018)
CAPPED EMISSIONS158 MtCO2e
GHGs COVEREDCO2
SECTORS AND THRESHOLDSAirports, aviation, chemical fibers, chemicals, com-mercial, power and heat, water suppliers, hotels, financial, iron and steel, petrochemicals, ports, ship-ping, nonferrous metals, building materials, paper, railways, rubber, and textiles.
INCLUSION THRESHOLDS: For power and industry: 20,000t CO2/year or 10,000 tonnes coal equivalent (tce)/year; and those that already participated in the 2013-2015 phase with 10,000 tCO2/year or 5,000 tce/year.
For Transport: 10,000t CO2/year or 5,000 tce/year (aviation and ports), 100,000t CO2/year or 50,000 tce/year (shipping), considering both direct and indirect emissions.
For Buildings: 10,000t CO2/year or 5,000 tce/year.
POINT OF REGULATIONDownstream. Both direct and indirect emissions are covered.
NUMBER OF ENTITIES298 (2018)
CAP158 MtCO2e (2018, including both free allocation and reserve)
TRADING PERIODSTwo trading periods: first period 2013-2015, second period 2016; no specific ending year. 1
ALLOCATIONFREE ALLOCATION: Free allocation based on sec-tor-specific benchmarks (power, heat, manufactur-ers), historic emissions intensity (industry, aviation, car glass, ports, shipping, and water suppliers, gener-ally based on 2014-2016 data), or historic emissions (buildings, commercial sector, industry with complex products or considerable change in emission bound-ary, and airports, generally based on 2014-2016 data).
Ex-post allocation adjustments, e.g., on the basis of production data, are applied for those with historic intensity or benchmarking allocations.
AUCTIONING: A small share of the annual cap could be auctioned. The purpose of auctions is not to allo-cate allowance but to provide compliance entities with additional supply to meet their compliance demand. Shanghai auctioned two million tonnes from the gov-ernment reserve in July 2018, with a floor price set at two times the weighted on-exchange allowance price from 18 November 2016 to 30 July 2018—CNY 41.54 (USD 6.28). The auction cleared at the floor price and a total of 305,237 tonnes (15% of total auction volume). An auction of two million allowances was held in June 2017. 2% of allowances were sold, at the floor price of CNY 38.77 (USD 5.86).
BANKING AND BORROWINGBanking is allowed both within and across compli-ance periods, with some restrictions for the latter.
For banked allowances from the first trading period (2013-2015), only one-third can be used per year between 2016 and 2018 by compliance entities;
Phases & Allocation
Flexibility
ETS Size
Stat
us R
epor
t 201
9IC
AP
94
03FA
CTSH
EETS
allowances are fully bankable for institutional inves-tors, with some restrictions for OTC deals. Borrowing is not allowed.
OFFSETS AND CREDITSQUANTITATIVE LIMIT: Domestic project-based car-bon offset credits—CCERs—are allowed. Since 2016 the use of CCER credits is limited to 1% of the annual allocation. Between 2013 and 2015 the limit was 5%.
QUALITATIVE LIMIT: Credits for reductions that were realized before January 2013 cannot be used for com-pliance. Credits from hydro projects are not allowed.
MARKET STABILITY PROVISIONS Exchange: Depending on transaction types, if prices vary more than 10% or 30% in one day, the Shanghai Environment and Energy Exchange can take price sta-bilization measures such as temporarily suspending trading or imposing holding limits. Reserve: In addition, a small share of annual cap could be kept in a reserve for auctioning before the end of the annual compliance cycle as a market sta-bility measure (see Auctions section).
COMPLIANCE PERIOD One year
MRV REPORTING FREQUENCY: Annual reporting of CO2
emissions.
VERIFICATION: Third-party verification is required. Besides this, the government also conducts quality checks.
FRAMEWORK: The Shanghai DRC has released mon-itoring and reporting guidelines for the following 10 sectors: iron and steel, electricity and heat, chemicals, nonferrous metals, non-metallic mineral products, textiles and paper, aviation, shipping, large buildings (hotels, commercial, and financial), and transport sta-tions.
ENFORCEMENT Penalties for failing to submit an emissions report or verification report on time or providing fraudulent information range from CNY 10,000 (USD 1,512) to CNY 50,000 (USD 7,558).Between CNY 50,000 (USD 7,558) and CNY 100,000 (USD 15,115) can be imposed for non-compliance, besides surrendering the adequate amount of allow-ances. Further sanctions may also be imposed, such as entry into the credit record of the company, publi-cation on the internet, cancelation of ability to access special funds for energy conservation, and emissions reduction measures.
INSTITUTIONS INVOLVED Shanghai DRC (competent authority; the responsibil-ity is expected to be moved to the Shanghai Ecology and Environment Bureau in the course of 2019);Shanghai Environment and Energy Exchange (trading platform);Shanghai Information Center (registry)
USE OF REVENUESThe revenues are submitted to the general municipal-ity budget.
IMPLEMENTING LEGISLATION Shanghai Pilot ETS Implementation Plan1
Trial Measures for Management of Emissions Trading in Shanghai2
Shanghai DRC - Allocation Plan for Vintage 20183
Shanghai DRC - Allocation Plan for Vintage 20174
Compliance
Other Information
1 – http://www.cneeex.com/c/2014-05-13/487439.shtml 2 – http://www.cneeex.com/c/2014-05-16/487443.shtml 3 – http://www.shdrc.gov.cn/xxgk/cxxxgk/35152.htm 4 – http://www.cneeex.com/c/2017-12-30/487810.shtml
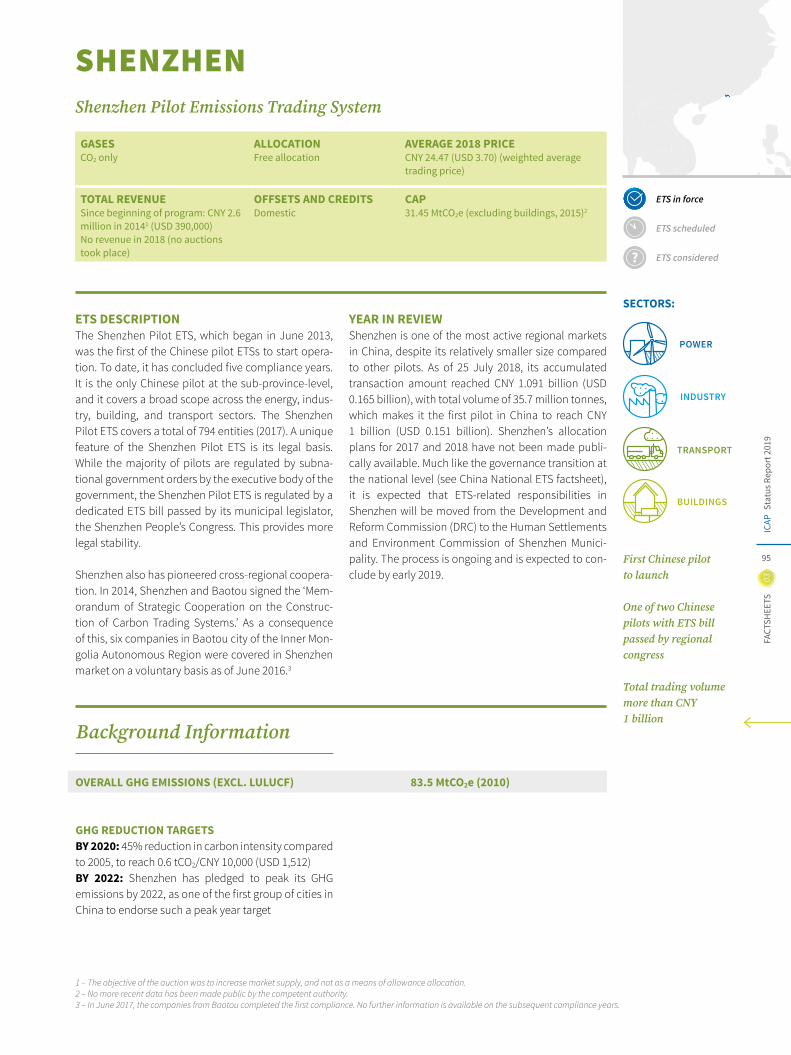
03FA
CTSH
EETS
Stat
us R
epor
t 201
9IC
AP
95
ETS in force
ETS scheduled
ETS considered
SECTORS:
POWER
INDUSTRY
TRANSPORT
BUILDINGS
GASESCO2 only
ALLOCATION Free allocation
AVERAGE 2018 PRICECNY 24.47 (USD 3.70) (weighted average trading price)
TOTAL REVENUE Since beginning of program: CNY 2.6 million in 20141 (USD 390,000)No revenue in 2018 (no auctions took place)
OFFSETS AND CREDITS Domestic
CAP31.45 MtCO2e (excluding buildings, 2015)2
SHENZHENShenzhen Pilot Emissions Trading System
ETS DESCRIPTIONThe Shenzhen Pilot ETS, which began in June 2013, was the first of the Chinese pilot ETSs to start opera-tion. To date, it has concluded five compliance years. It is the only Chinese pilot at the sub-province-level, and it covers a broad scope across the energy, indus-try, building, and transport sectors. The Shenzhen Pilot ETS covers a total of 794 entities (2017). A unique feature of the Shenzhen Pilot ETS is its legal basis. While the majority of pilots are regulated by subna-tional government orders by the executive body of the government, the Shenzhen Pilot ETS is regulated by a dedicated ETS bill passed by its municipal legislator, the Shenzhen People’s Congress. This provides more legal stability.
Shenzhen also has pioneered cross-regional coopera-tion. In 2014, Shenzhen and Baotou signed the ‘Mem-orandum of Strategic Cooperation on the Construc-tion of Carbon Trading Systems.’ As a consequence of this, six companies in Baotou city of the Inner Mon-golia Autonomous Region were covered in Shenzhen market on a voluntary basis as of June 2016.3
YEAR IN REVIEWShenzhen is one of the most active regional markets in China, despite its relatively smaller size compared to other pilots. As of 25 July 2018, its accumulated transaction amount reached CNY 1.091 billion (USD 0.165 billion), with total volume of 35.7 million tonnes, which makes it the first pilot in China to reach CNY 1 billion (USD 0.151 billion). Shenzhen’s allocation plans for 2017 and 2018 have not been made publi-cally available. Much like the governance transition at the national level (see China National ETS factsheet), it is expected that ETS-related responsibilities in Shenzhen will be moved from the Development and Reform Commission (DRC) to the Human Settlements and Environment Commission of Shenzhen Munici-pality. The process is ongoing and is expected to con-clude by early 2019.
1 – The objective of the auction was to increase market supply, and not as a means of allowance allocation. 2 – No more recent data has been made public by the competent authority. 3 – In June 2017, the companies from Baotou completed the first compliance. No further information is available on the subsequent compliance years.
First Chinese pilot to launch
One of two Chinese pilots with ETS bill passed by regional congress
Total trading volume more than CNY 1 billion
OVERALL GHG EMISSIONS (EXCL. LULUCF) 83.5 MtCO2e (2010)
GHG REDUCTION TARGETSBY 2020: 45% reduction in carbon intensity compared to 2005, to reach 0.6 tCO2/CNY 10,000 (USD 1,512) BY 2022: Shenzhen has pledged to peak its GHG emissions by 2022, as one of the first group of cities in China to endorse such a peak year target
Background Information
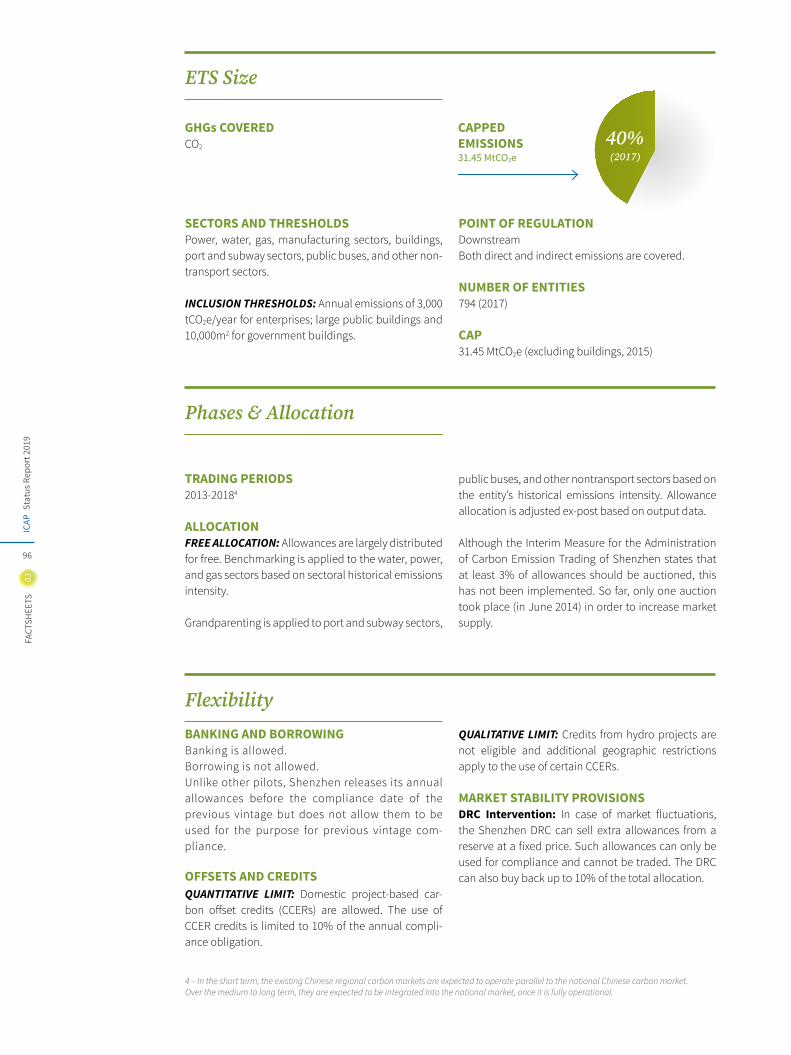
Stat
us R
epor
t 201
9IC
AP
96
03FA
CTSH
EETS
SECTORS AND THRESHOLDSPower, water, gas, manufacturing sectors, buildings, port and subway sectors, public buses, and other non-transport sectors.
INCLUSION THRESHOLDS: Annual emissions of 3,000 tCO2e/year for enterprises; large public buildings and 10,000m2 for government buildings.
POINT OF REGULATION DownstreamBoth direct and indirect emissions are covered.
NUMBER OF ENTITIES794 (2017) CAP31.45 MtCO2e (excluding buildings, 2015)
TRADING PERIODS2013-20184
ALLOCATIONFREE ALLOCATION: Allowances are largely distributed for free. Benchmarking is applied to the water, power, and gas sectors based on sectoral historical emissions intensity.
Grandparenting is applied to port and subway sectors,
public buses, and other nontransport sectors based on the entity’s historical emissions intensity. Allowance allocation is adjusted ex-post based on output data.
Although the Interim Measure for the Administration of Carbon Emission Trading of Shenzhen states that at least 3% of allowances should be auctioned, this has not been implemented. So far, only one auction took place (in June 2014) in order to increase market supply.
BANKING AND BORROWINGBanking is allowed. Borrowing is not allowed. Unlike other pilots, Shenzhen releases its annual allowances before the compliance date of the previous vintage but does not allow them to be used for the purpose for previous vintage com-pliance. OFFSETS AND CREDITSQUANTITATIVE LIMIT: Domestic project-based car-bon offset credits (CCERs) are allowed. The use of CCER credits is limited to 10% of the annual compli-ance obligation.
QUALITATIVE LIMIT: Credits from hydro projects are not eligible and additional geographic restrictions apply to the use of certain CCERs.
MARKET STABILITY PROVISIONS DRC Intervention: In case of market fluctuations, the Shenzhen DRC can sell extra allowances from a reserve at a fixed price. Such allowances can only be used for compliance and cannot be traded. The DRC can also buy back up to 10% of the total allocation.
4 – In the short term, the existing Chinese regional carbon markets are expected to operate parallel to the national Chinese carbon market. Over the medium to long term, they are expected to be integrated into the national market, once it is fully operational.
Phases & Allocation
Flexibility
CAPPED EMISSIONS 31.45 MtCO2e
GHGs COVEREDCO2
40% (2017)
ETS Size
03FA
CTSH
EETS
Stat
us R
epor
t 201
9IC
AP
97
COMPLIANCE PERIOD One year
MRV REPORTING FREQUENCY: Annual reporting of CO2 emissions with a tiered approach taking into account the size of the company. A quarterly emissions report is also submitted. In addition, covered industrial enti-ties must annually submit a statistical indicator data report.
VERIFICATION: Third-party verification of the emis-sions report is required. Covered entities cannot use the same verifiers for three consecutive years. For the statistical indicator data report, the municipal statis-tical department may entrust the statistical indicator data verification agency to verify. In addition, further random checks of emission reports and verification reports are conducted by the government. The pro-portion of these checks shall not be less than 10% of the total number of covered entities. The competent authority may assign this inspection work to a special-ized agency.
FRAMEWORK: The Shenzhen DRC has released a guid-ing document on monitoring and reporting that includes sector-specific guidance for the covered sectors.
ENFORCEMENT Institutes providing false information can be fined for the difference between reported and actual emissions at three times the average allowance price of the past six months. Penalties for disturbing the market order can cost up to CNY 100,000 (USD 15,115). Companies failing to surrender enough allowances to match their emissions are fined three times the average market price of the past six months. The missing allowances can be withdrawn from the account of the company or deducted from next year’s allocation. Other nonfinan-cial penalties include public reporting, reporting to relevant credit information of public banks, disquali-fication from financial subsidies (for five years), and a record entered in the State Owned Enterprise perfor-mance assessment system.
INSTITUTIONS INVOLVED Shenzhen DRC (Competent authority) – the responsi-bility is expected to move to the Human Settlements and Environment Commission of Shenzhen Munici-pality in the course of 2019;China Shenzhen Emissions Exchange (Trading Plat-form and Registry)
EVALUATION/ETS REVIEWNo formal evaluation has been conducted. Research on improving Shenzhen ETS has been undertaken every year, funded by Shenzhen DRC.
IMPLEMENTING LEGISLATION Shenzhen Special Economic Zone ETS Bill5
Interim Measures for Management of Emissions Trading in Shenzhen6
Shenzhen DRC – Notice of Carrying Out Emissions Trad-ing Work for Vintage 20167
SHENZHENShenzhen Pilot ETS
Compliance
Other Information
5 – http://www.sz.gov.cn/zfgb/2013/gb817/201301/t20130110_2099860.htm 6 – http://www.sz.gov.cn/zfgb/2014/gb876/201404/t20140402_2335498.htm 7 – http://www.szpb.gov.cn/xxgk/qt/tzgg/201609/t20160918_4938028.htm
Stat
us R
epor
t 201
9IC
AP
98
03FA
CTSH
EETS
GASESCO2 only
ALLOCATIONFree allocation
AVERAGE 2018 PRICE11.58 CNY (USD 1.75) (weighted average trading price)
OFFSETS AND CREDITSDomestic
CAP160-170 MtCO2e (2017)
TIANJINTianjin Pilot Emissions Trading System
ETS DESCRIPTIONTianjin launched its pilot ETS in December 2013 and has concluded five compliance years so far. The sys-tem covers enterprises including heat and electric-ity production, iron and steel, petrochemicals, and chemicals, as well as oil and gas exploration. Covered entities account for 50-60% of the city’s total emis-sions. Despite not having any financial penalties in place, Tianjin has achieved full or close to full compli-ance since its launch.
YEAR IN REVIEWThe Tianjin Development and Reform Commission (DRC) released its new “Interim Measure for Manage-ment of Emissions Trading in Tianjin” in May 2018,
which was the third one since 2013, as each of them provides the legal basis for the Tianjin Pilot ETS within a specific time period. The Tianjin system has not undergone significant changes since its launch.
Much like the governance transition at the national level (see China National ETS factsheet), it is expected that ETS-related responsibilities in Tianjin will be moved from the DRC to the Ecology and Environment Bureau. The process is ongoing and is expected to conclude by early 2019. Despite small number
of regulated entities, covers more than half city's emissions due to high concentration of GHG in industrial sectors
High rates of compliance despite no financial penalties in place
OVERALL GHG EMISSIONS (EXCL. LULUCF) 215 MtCO2e (2012)
GHG REDUCTION TARGETSBY 2020: 20.5% reduction in carbon intensity compared to 2015 levels (13th five-year plan)
ETS in force
ETS scheduled
ETS considered
SECTORS:
POWER
INDUSTRY
~55% (2017)
CAPPED EMISSIONS160-170 MtCO2e
GHGs COVEREDCO2
SECTORS AND THRESHOLDSHeat and electricity production, iron and steel, petro-chemicals, chemicals, exploration for oil and gas.
INCLUSION THRESHOLDS: 20,000t CO2/year consid-ering both direct and indirect emissions.
POINT OF REGULATIONDownstream.Both direct and indirect emissions are covered.
NUMBER OF ENTITIES109 (2017)
CAP160-170 MtCO2e (2017)
Background Information
ETS Size
03FA
CTSH
EETS
Stat
us R
epor
t 201
9IC
AP
99
TRADING PERIODS2013-20181
ALLOCATIONFREE ALLOCATION: Mainly free allocation through grandparenting based on 2009-2012 emissions or on emissions intensity. Benchmarking for new entrants and expanded capacity.
BANKING AND BORROWINGBanking is allowed. Borrowing is not allowed. OFFSETS AND CREDITSQUANTITATIVE LIMIT: Domestic project-based car-bon offset credits—CCERs—are allowed. The use of CCER credits is limited to 10% of the annual compli-ance obligation.
QUALITATIVE LIMIT: Credits must stem from CO2
reduction projects, excluding hydro. They must be realized after 2013.
MARKET STABILITY PROVISIONS DRC Intervention: In case of market fluctuations, the Tianjin DRC can buy or sell allowances in order to sta-bilize the market.
1 - In the short term, the existing Chinese regional carbon markets are expected to operate parallel to the national Chinese carbon market. Over the medium to long term, they are expected to be integrated into the national market, once it is fully operational. 2 – http://gk.tj.gov.cn/gkml/000125022/201303/t20130305_8506.shtml 3 – http://www.tanpaifang.com/zhengcefagui/2013/123027548.html
COMPLIANCE PERIOD One year
MRV REPORTING FREQUENCY: Annual reporting of CO2 emissions.
VERIFICATION: Third-party verification is required. Covered entities cannot use the same verifiers for three consecutive years.
FRAMEWORK: The Tianjin DRC has released a guiding document on monitoring and reporting that includes sector-specific guidance for the covered sectors.
ENFORCEMENT In case of noncompliance, companies are disqualified for three years for preferential financial support and other national supporting policies, i.e., on recycling economy, energy-saving measures, and emission reductions. There are no financial penalties for non-compliance.
INSTITUTIONS INVOLVED Tianjin DRC (competent authority; the responsibility is expected to be moved to Tianjin Ecology and Environ-ment Bureau in 2019); Tianjin Climate Exchange (trading platform and registry)
IMPLEMENTING LEGISLATION Tianjin Pilot ETS Implementation Plan2
Interim Measure for Management of Emissions Trading in Tianjin3
Phases & Allocation
Flexibility
Compliance
Other Information
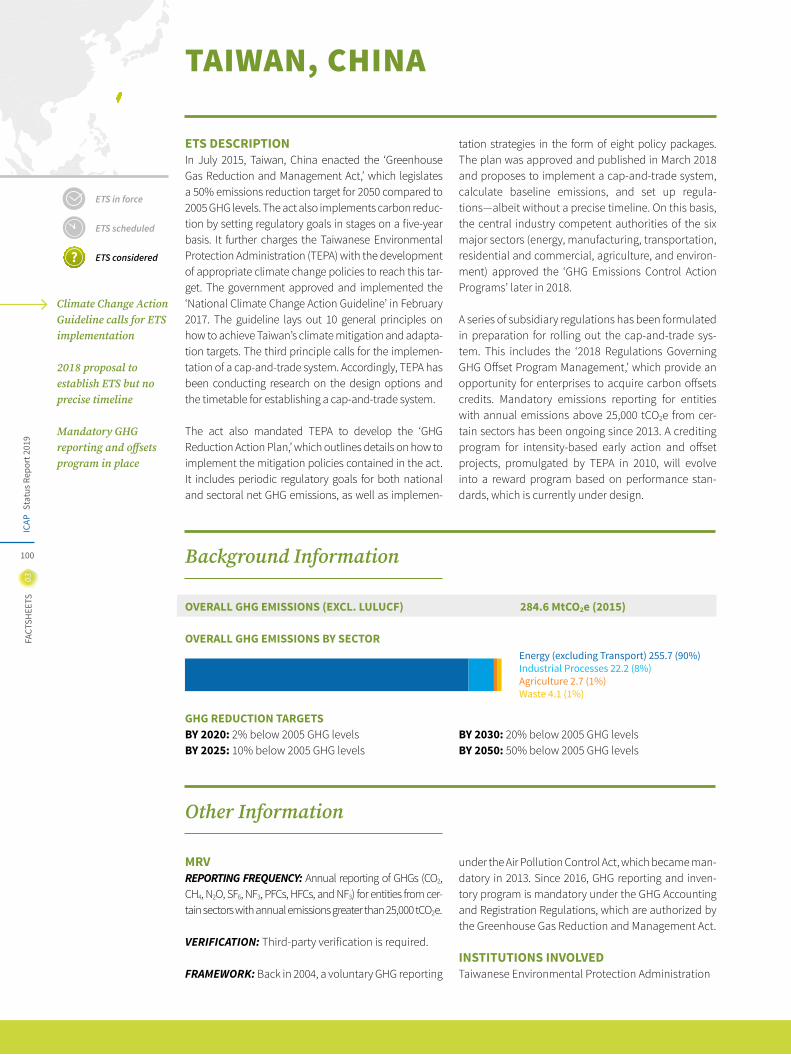
Stat
us R
epor
t 201
9IC
AP
100
03FA
CTSH
EETS
TAIWAN, CHINA
ETS DESCRIPTIONIn July 2015, Taiwan, China enacted the ‘Greenhouse Gas Reduction and Management Act,’ which legislates a 50% emissions reduction target for 2050 compared to 2005 GHG levels. The act also implements carbon reduc-tion by setting regulatory goals in stages on a five-year basis. It further charges the Taiwanese Environmental Protection Administration (TEPA) with the development of appropriate climate change policies to reach this tar-get. The government approved and implemented the ‘National Climate Change Action Guideline’ in February 2017. The guideline lays out 10 general principles on how to achieve Taiwan’s climate mitigation and adapta-tion targets. The third principle calls for the implemen-tation of a cap-and-trade system. Accordingly, TEPA has been conducting research on the design options and the timetable for establishing a cap-and-trade system.
The act also mandated TEPA to develop the ‘GHG Reduction Action Plan,’ which outlines details on how to implement the mitigation policies contained in the act. It includes periodic regulatory goals for both national and sectoral net GHG emissions, as well as implemen-
tation strategies in the form of eight policy packages. The plan was approved and published in March 2018 and proposes to implement a cap-and-trade system, calculate baseline emissions, and set up regula-tions—albeit without a precise timeline. On this basis, the central industry competent authorities of the six major sectors (energy, manufacturing, transportation, residential and commercial, agriculture, and environ-ment) approved the ‘GHG Emissions Control Action Programs’ later in 2018.
A series of subsidiary regulations has been formulated in preparation for rolling out the cap-and-trade sys-tem. This includes the ‘2018 Regulations Governing GHG Offset Program Management,’ which provide an opportunity for enterprises to acquire carbon offsets credits. Mandatory emissions reporting for entities with annual emissions above 25,000 tCO2e from cer-tain sectors has been ongoing since 2013. A crediting program for intensity-based early action and offset projects, promulgated by TEPA in 2010, will evolve into a reward program based on performance stan-dards, which is currently under design.
ETS in force
ETS scheduled
ETS considered
MRVREPORTING FREQUENCY: Annual reporting of GHGs (CO2, CH4, N2O, SF6, NF3, PFCs, HFCs, and NF3) for entities from cer-tain sectors with annual emissions greater than 25,000 tCO2e.
VERIFICATION: Third-party verification is required.
FRAMEWORK: Back in 2004, a voluntary GHG reporting
under the Air Pollution Control Act, which became man-datory in 2013. Since 2016, GHG reporting and inven-tory program is mandatory under the GHG Accounting and Registration Regulations, which are authorized by the Greenhouse Gas Reduction and Management Act.
INSTITUTIONS INVOLVED Taiwanese Environmental Protection Administration
Climate Change Action Guideline calls for ETS implementation
2018 proposal to establish ETS but no precise timeline
Mandatory GHG reporting and offsets program in place
Energy (excluding Transport) 255.7 (90%)Industrial Processes 22.2 (8%)Agriculture 2.7 (1%)Waste 4.1 (1%)
OVERALL GHG EMISSIONS (EXCL. LULUCF) 284.6 MtCO2e (2015)
OVERALL GHG EMISSIONS BY SECTOR
GHG REDUCTION TARGETSBY 2020: 2% below 2005 GHG levels BY 2025: 10% below 2005 GHG levels
BY 2030: 20% below 2005 GHG levelsBY 2050: 50% below 2005 GHG levels
Other Information
Background Information
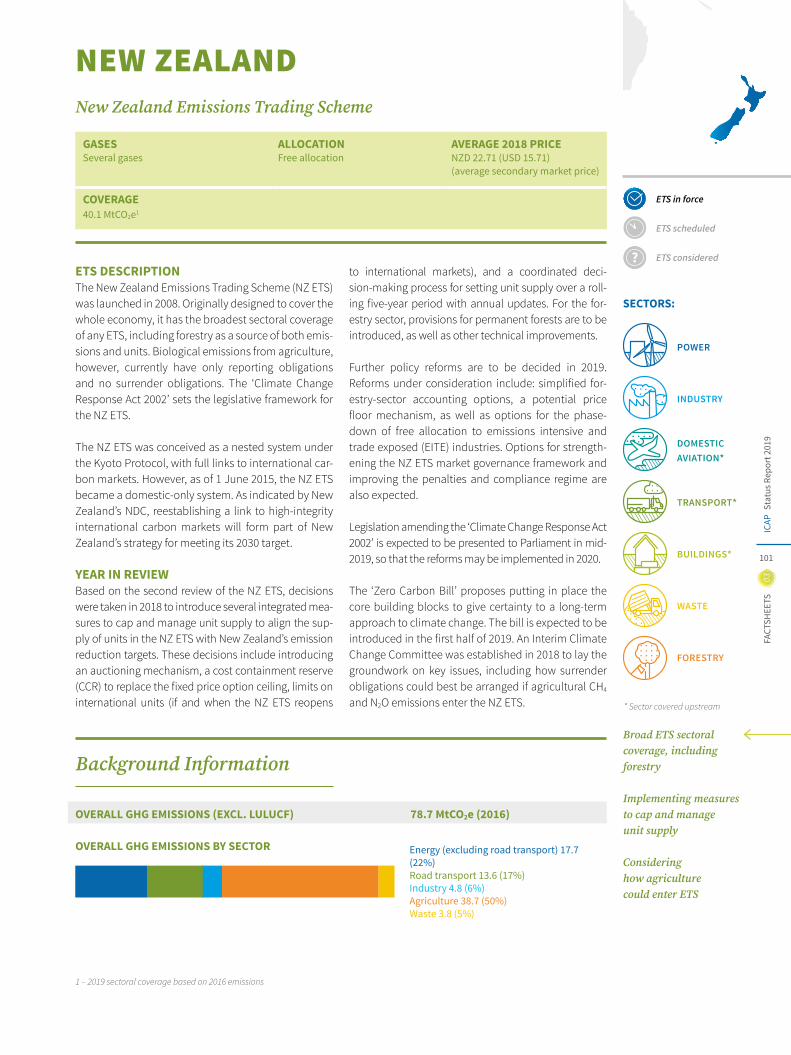
03FA
CTSH
EETS
Stat
us R
epor
t 201
9IC
AP
101
ETS in force
ETS scheduled
ETS considered
SECTORS:
* Sector covered upstream
POWER
INDUSTRY
TRANSPORT*
WASTE
DOMESTICAVIATION*
FORESTRY
BUILDINGS*
Broad ETS sectoral coverage, including forestry
Implementing measures to cap and manage unit supply
Considering how agriculture could enter ETS
GASESSeveral gases
ALLOCATION Free allocation
AVERAGE 2018 PRICENZD 22.71 (USD 15.71) (average secondary market price)
COVERAGE40.1 MtCO2e1
NEW ZEALAND New Zealand Emissions Trading Scheme
ETS DESCRIPTIONThe New Zealand Emissions Trading Scheme (NZ ETS) was launched in 2008. Originally designed to cover the whole economy, it has the broadest sectoral coverage of any ETS, including forestry as a source of both emis-sions and units. Biological emissions from agriculture, however, currently have only reporting obligations and no surrender obligations. The ‘Climate Change Response Act 2002’ sets the legislative framework for the NZ ETS.
The NZ ETS was conceived as a nested system under the Kyoto Protocol, with full links to international car-bon markets. However, as of 1 June 2015, the NZ ETS became a domestic-only system. As indicated by New Zealand’s NDC, reestablishing a link to high-integrity international carbon markets will form part of New Zealand’s strategy for meeting its 2030 target.
YEAR IN REVIEWBased on the second review of the NZ ETS, decisions were taken in 2018 to introduce several integrated mea-sures to cap and manage unit supply to align the sup-ply of units in the NZ ETS with New Zealand’s emission reduction targets. These decisions include introducing an auctioning mechanism, a cost containment reserve (CCR) to replace the fixed price option ceiling, limits on international units (if and when the NZ ETS reopens
to international markets), and a coordinated deci-sion-making process for setting unit supply over a roll-ing five-year period with annual updates. For the for-estry sector, provisions for permanent forests are to be introduced, as well as other technical improvements.
Further policy reforms are to be decided in 2019. Reforms under consideration include: simplified for-estry-sector accounting options, a potential price floor mechanism, as well as options for the phase-down of free allocation to emissions intensive and trade exposed (EITE) industries. Options for strength-ening the NZ ETS market governance framework and improving the penalties and compliance regime are also expected.
Legislation amending the ‘Climate Change Response Act 2002’ is expected to be presented to Parliament in mid-2019, so that the reforms may be implemented in 2020.
The ‘Zero Carbon Bill’ proposes putting in place the core building blocks to give certainty to a long-term approach to climate change. The bill is expected to be introduced in the first half of 2019. An Interim Climate Change Committee was established in 2018 to lay the groundwork on key issues, including how surrender obligations could best be arranged if agricultural CH4
and N2O emissions enter the NZ ETS.
OVERALL GHG EMISSIONS (EXCL. LULUCF) 78.7 MtCO2e (2016)
OVERALL GHG EMISSIONS BY SECTOR Energy (excluding road transport) 17.7 (22%) Road transport 13.6 (17%)Industry 4.8 (6%)Agriculture 38.7 (50%)Waste 3.8 (5%)
1 – 2019 sectoral coverage based on 2016 emissions
Background Information
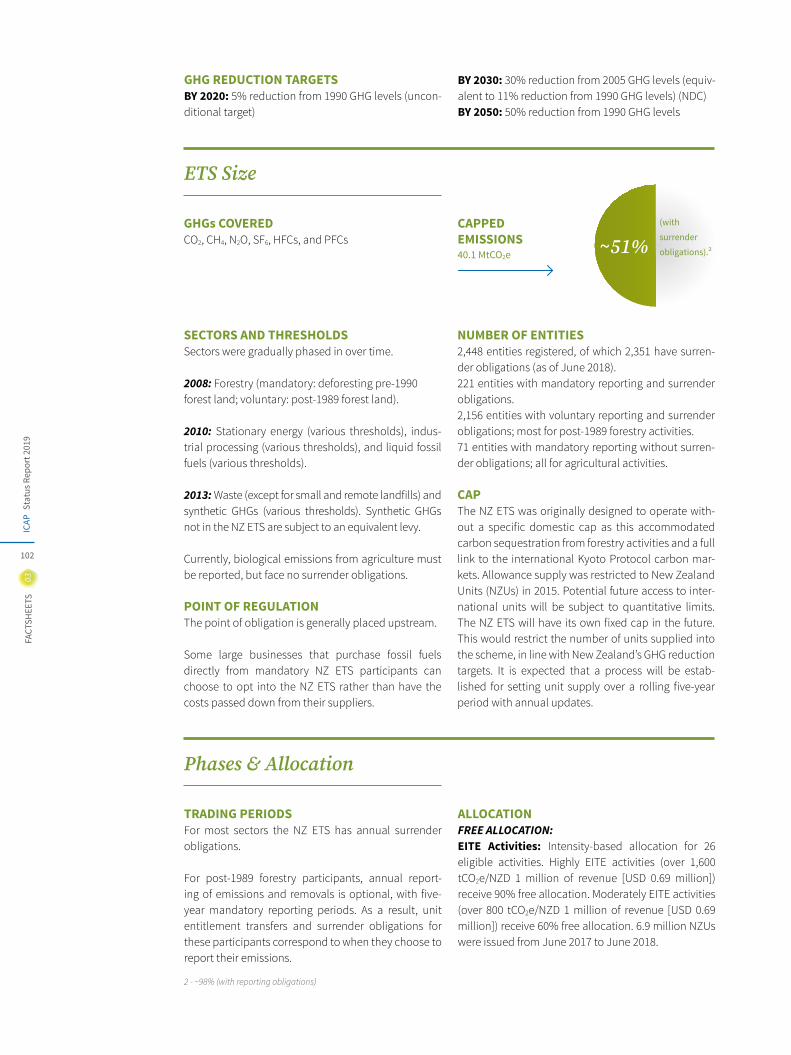
Stat
us R
epor
t 201
9IC
AP
102
03FA
CTSH
EETS
2 - ~98% (with reporting obligations)
CAPPED EMISSIONS40.1 MtCO2e
GHGs COVEREDCO2, CH4, N2O, SF6, HFCs, and PFCs
SECTORS AND THRESHOLDSSectors were gradually phased in over time.
2008: Forestry (mandatory: deforesting pre-1990 forest land; voluntary: post-1989 forest land).
2010: Stationary energy (various thresholds), indus-trial processing (various thresholds), and liquid fossil fuels (various thresholds).
2013: Waste (except for small and remote landfills) and synthetic GHGs (various thresholds). Synthetic GHGs not in the NZ ETS are subject to an equivalent levy.
Currently, biological emissions from agriculture must be reported, but face no surrender obligations.
POINT OF REGULATIONThe point of obligation is generally placed upstream.
Some large businesses that purchase fossil fuels directly from mandatory NZ ETS participants can choose to opt into the NZ ETS rather than have the costs passed down from their suppliers.
NUMBER OF ENTITIES2,448 entities registered, of which 2,351 have surren-der obligations (as of June 2018). 221 entities with mandatory reporting and surrender obligations. 2,156 entities with voluntary reporting and surrender obligations; most for post-1989 forestry activities. 71 entities with mandatory reporting without surren-der obligations; all for agricultural activities.
CAPThe NZ ETS was originally designed to operate with-out a specific domestic cap as this accommodated carbon sequestration from forestry activities and a full link to the international Kyoto Protocol carbon mar-kets. Allowance supply was restricted to New Zealand Units (NZUs) in 2015. Potential future access to inter-national units will be subject to quantitative limits. The NZ ETS will have its own fixed cap in the future. This would restrict the number of units supplied into the scheme, in line with New Zealand’s GHG reduction targets. It is expected that a process will be estab-lished for setting unit supply over a rolling five-year period with annual updates.
TRADING PERIODSFor most sectors the NZ ETS has annual surrender obligations.
For post-1989 forestry participants, annual report-ing of emissions and removals is optional, with five-year mandatory reporting periods. As a result, unit entitlement transfers and surrender obligations for these participants correspond to when they choose to report their emissions.
ALLOCATIONFREE ALLOCATION: EITE Activities: Intensity-based allocation for 26 eligible activities. Highly EITE activities (over 1,600 tCO2e/NZD 1 million of revenue [USD 0.69 million]) receive 90% free allocation. Moderately EITE activities (over 800 tCO2e/NZD 1 million of revenue [USD 0.69 million]) receive 60% free allocation. 6.9 million NZUs were issued from June 2017 to June 2018.
GHG REDUCTION TARGETSBY 2020: 5% reduction from 1990 GHG levels (uncon-ditional target)
BY 2030: 30% reduction from 2005 GHG levels (equiv-alent to 11% reduction from 1990 GHG levels) (NDC)BY 2050: 50% reduction from 1990 GHG levels
~51%
Phases & Allocation
ETS Size
(with
surrender
obligations).²
03FA
CTSH
EETS
Stat
us R
epor
t 201
9IC
AP
103
NEW ZEALANDNew Zealand Emissions Trading Scheme
Post-1989 Forestry Sector and Other Removal Activities: NZUs are granted to participants that vol-untarily register in the scheme for removal activities, as outlined below. There is no limit on the number of units that can be granted for removal activities.
Forestry Removal Activities: Participants are enti-tled to receive one NZU per tonne of CO2 removed for registered post-1989 forest land. If the forest is harvested or deforested, units must be surrendered to account for the emissions, and if the participant chooses to deregister from the scheme, NZUs equiv-alent to the number received must be returned. 18.3 million NZUs were issued for forest removal activities from June 2017 to June 2018.
Other Removal Activities: Participants are entitled to receive one NZU per tonne of removal from recog-nized industrial processes, including export of prod-ucts that embed carbon and export of HFCs and PFCs. 2.2 million NZUs were issued for other removal activi-ties from June 2017 to June 2018.
Forestry and Fisheries Sectors: Owners of pre-1990 forest land, as well as owners of fishing quotas, received a one-off free allocation of NZUs when the NZ ETS was implemented to partially compensate for the impact of the ETS.
AUCTIONING: In 2018 the government decided to develop and introduce an auctioning mechanism, within an overall cap on non-forestry sectors. The first auctions are expected in 2020.
BANKING AND BORROWING Banking is allowed except for those units that were purchased under the fixed price option (see Market Stability Provisions). Borrowing is not allowed.
OFFSETS AND CREDITSQUALITATIVE LIMIT: Units from Kyoto Protocol Flex-ible Mechanisms were eligible for use in the system with no restrictions until 2015. As of 1 June 2015, inter-national units are not eligible for surrender in the NZ ETS.
MARKET STABILITY PROVISIONS Transitional Measures: Two measures were imple-mented in 2009 to help firms adjust to the carbon cost: (1) One-for-two surrender obligation for non-forestry sectors (one allowance could be surrendered for every two tonnes of emissions);
(2) A NZD 25 (USD 17.30) fixed price option, which acts as a price ceiling.
After the second NZ ETS review, the one-for-two mea-sure was phased out and entities have faced full sur-render obligations since 1 January 2019.
Reserve: The fixed price option will remain until it is replaced with a CCR incorporated into the auctioning mechanism. Allowances from the CCR will be auc-tioned if a predetermined trigger price is reached. The price trigger and reserve quantity are still to be deter-mined. Any allowances released from the reserve will be backed by an equivalent tonne of removals.
COMPLIANCE PERIOD One year3
MRV REPORTING FREQUENCY: Most sectors are required to report annually.
VERIFICATION: Self-reporting supplemented by a program of second- and third-party audits run by the regulator. Participants must seek third party verifica-tion if they apply for the use of a unique emissions factor.
Flexibility
Compliance
3 – Participants registered for post-1989 forestry have mandatory five-year compliance periods (with the option to report emissions annually).
Stat
us R
epor
t 201
9IC
AP
104
03FA
CTSH
EETS
LINKS WITH OTHER SYSTEMS Until 1 June 2015, the NZ ETS was indirectly linked to other systems (e.g., the EU ETS) via the international Kyoto Protocol Flexible Mechanisms. Since then, the NZ ETS has been a domestic-only system.
The current reforms will make the NZ ETS more simi-lar to ETSs in other countries, which will make it more compatible for international linking in the future.
INSTITUTIONS INVOLVED Ministry for the Environment; Environmental Protection Authority; Ministry for Primary Industries; New Zealand Customs Service; New Zealand Transport Agency
EVALUATION/ETS REVIEWThe ‘Climate Change Response Act 2002’ includes provisions statutory independent reviews of the oper-ation and effectiveness of the NZ ETS every five years. The first review took place in 2011-2012, and the sec-ond review took place in 2015-2017.
Public consultation on proposed amendments to the ‘Climate Change Response Act’ following the second review was undertaken in 2018 in order to support implementing proposed changes.
IMPLEMENTING LEGISLATIONClimate Change Response Act 2002 –Part 4 ‘New Zealand greenhouse gas emissions trading scheme’4
ENFORCEMENTAn entity that fails to surrender emissions units when required to must surrender the units and pay a pen-alty of NZD 30 for each unit (USD 20.76) that was not surrendered by the due date. In certain circumstances the penalty may be reduced.
Entities can be fined up to NZD 24,000 (USD 16,607) on conviction for failure to collect emissions data or other required information, calculate emissions and/or removals, keep records, register as a participant, submit an emissions return when required, or notify the administering agency or provide information when required to do so.
Entities can also be fined up to NZD 50,000 (USD 34,598) on conviction for knowingly altering, falsifying, or providing incomplete or misleading information about any obligations under the scheme, including emissions return. This penalty and/or imprisonment of up to five years also apply to entities that deliber-ately lie about obligations under the NZ ETS to gain financial benefit or avoid financial loss.
A new “infringement offence regime” is expected to be established from 2020 for minor offences. Infringe-ment offences will result in financial penalties for offenders but not convictions.
Linking
Other Information
4 – http://www.legislation.govt.nz/act/public/2002/0040/latest/DLM1662481.html
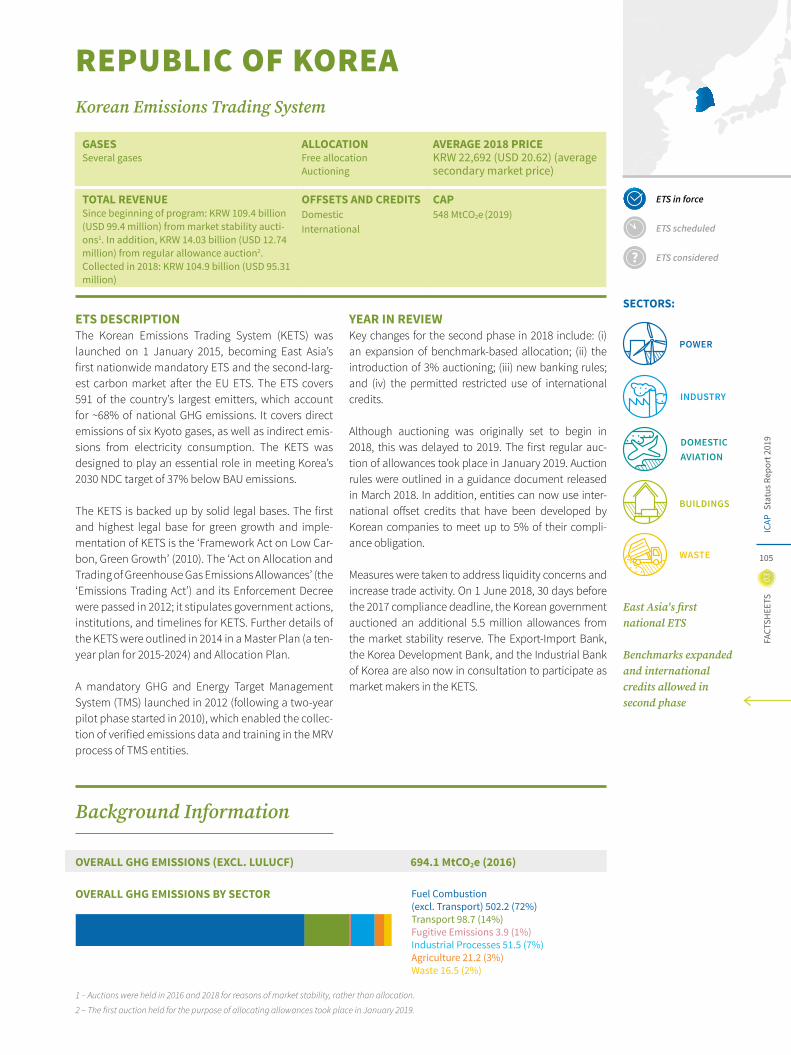
03FA
CTSH
EETS
Stat
us R
epor
t 201
9IC
AP
105
ETS in force
ETS scheduled
ETS considered
SECTORS:
POWER
INDUSTRY
WASTE
DOMESTIC AVIATION
BUILDINGS
GASESSeveral gases
ALLOCATION Free allocation Auctioning
AVERAGE 2018 PRICEKRW 22,692 (USD 20.62) (average secondary market price)
TOTAL REVENUE Since beginning of program: KRW 109.4 billion (USD 99.4 million) from market stability aucti-ons1. In addition, KRW 14.03 billion (USD 12.74 million) from regular allowance auction2.Collected in 2018: KRW 104.9 billion (USD 95.31 million)
OFFSETS AND CREDITSDomestic International
CAP548 MtCO2e (2019)
REPUBLIC OF KOREAKorean Emissions Trading System
ETS DESCRIPTIONThe Korean Emissions Trading System (KETS) was launched on 1 January 2015, becoming East Asia’s first nationwide mandatory ETS and the second-larg-est carbon market after the EU ETS. The ETS covers 591 of the country’s largest emitters, which account for ~68% of national GHG emissions. It covers direct emissions of six Kyoto gases, as well as indirect emis-sions from electricity consumption. The KETS was designed to play an essential role in meeting Korea’s 2030 NDC target of 37% below BAU emissions.
The KETS is backed up by solid legal bases. The first and highest legal base for green growth and imple-mentation of KETS is the ‘Framework Act on Low Car-bon, Green Growth’ (2010). The ‘Act on Allocation and Trading of Greenhouse Gas Emissions Allowances’ (the ‘Emissions Trading Act’) and its Enforcement Decree were passed in 2012; it stipulates government actions, institutions, and timelines for KETS. Further details of the KETS were outlined in 2014 in a Master Plan (a ten-year plan for 2015-2024) and Allocation Plan.
A mandatory GHG and Energy Target Management System (TMS) launched in 2012 (following a two-year pilot phase started in 2010), which enabled the collec-tion of verified emissions data and training in the MRV process of TMS entities.
YEAR IN REVIEWKey changes for the second phase in 2018 include: (i) an expansion of benchmark-based allocation; (ii) the introduction of 3% auctioning; (iii) new banking rules; and (iv) the permitted restricted use of international credits.
Although auctioning was originally set to begin in 2018, this was delayed to 2019. The first regular auc-tion of allowances took place in January 2019. Auction rules were outlined in a guidance document released in March 2018. In addition, entities can now use inter-national offset credits that have been developed by Korean companies to meet up to 5% of their compli-ance obligation.
Measures were taken to address liquidity concerns and increase trade activity. On 1 June 2018, 30 days before the 2017 compliance deadline, the Korean government auctioned an additional 5.5 million allowances from the market stability reserve. The Export-Import Bank, the Korea Development Bank, and the Industrial Bank of Korea are also now in consultation to participate as market makers in the KETS.
Background Information
OVERALL GHG EMISSIONS (EXCL. LULUCF) 694.1 MtCO2e (2016)
OVERALL GHG EMISSIONS BY SECTOR Fuel Combustion (excl. Transport) 502.2 (72%)Transport 98.7 (14%)Fugitive Emissions 3.9 (1%)Industrial Processes 51.5 (7%)Agriculture 21.2 (3%)Waste 16.5 (2%)
1 – Auctions were held in 2016 and 2018 for reasons of market stability, rather than allocation.
2 – The first auction held for the purpose of allocating allowances took place in January 2019.
East Asia's first national ETS
Benchmarks expanded and international credits allowed in second phase
Stat
us R
epor
t 201
9IC
AP
106
03FA
CTSH
EETS
GHGs COVEREDCO2, CH4, N2O, PFCs, HFCs, SF6
SECTORS AND THRESHOLDSPHASE ONE (2015-2017): 23 subsectors from the following six sectors: power, industry (e.g., iron and steel, petrochemical, cement, oil refinery, nonferrous metals, paper, textile, machinery, mining, glass and ceramics, etc.), building, public, waste, and transpor-tation (i.e., aviation).
PHASE TWO (2018-2020): According to the Allocation Plan, the public and waste sectors are disaggregated such that the KETS covers the following six sectors: heat and power, industry, building, transportation, waste sector, and public. These sectors are disaggre-gated into 64 sub-sectors.
INCLUSION THRESHOLDS: Company >125,000 tCO2/year, facility>25,000 tCO2/year
POINT OF REGULATIONDownstream. Both direct and indirect emissions are covered under KETS.
NUMBER OF ENTITIES610 (2019)
CAPPHASE ONE (2015-2017): 1,686 MtCO2e, including a reserve of 89 MtCO2e for market stabilization mea-sures, early action and new entrants. 84.5% of reserve (76MtCO2e) are used.2015: 540 MtCO2e, 2016: 560 MtCO2e, 2017: 567 (including early reduction and additional allowances) MtCO2e.
PHASE TWO (2018-2020): 1,796 MtCO2e, including 14 million allowances for the market stabilization, five million for the market markers, and 134 million for new entrants and other purposes4.2018: 548 MtCO2e; 2019: 548 MtCO2e; 2020: 548 MtCO2e.
TRADING PERIODSPHASE ONE: 3 years (2015-2017)PHASE TWO: 3 years (2018-2020)PHASE THREE: 5 years (2021-2026)
ALLOCATIONPHASE ONE (2015-2017): Free allocation: 100% free allocation. Most sectors received free allowances based on the average GHG emissions of the base year (2011-2013). Three sectors (grey clinker, oil refinery, aviation) were allocated free
allowances following benchmarks based on previous activity data from the base year (2011-2013).
During Phase One, about 5% of total allowances were retained in a reserve for market stabilization measures (14 MtCO2e), early action (41 MtCO2e), and other pur-poses including new entrants (33 MtCO2e). In addition, unallocated allowances and withdrawn allowances were transferred to the reserve.
CAPPED EMISSIONS548 MtCO2e
GHG REDUCTION TARGETS BY 2020: 30% below BAU (Copenhagen Accord target)BY 2030: 37% below BAU (536 MtCO2e), which rep-resents a 22% reduction below 2012 GHG levels (NDC); 38 million international credits3 may be used towards achieving this goal (2030 GHG mitigation roadmap)
ETS Size
Phases & Allocation
3 – This includes international credits through the KETS, as well as alternative options, including LULUCF and other international credits (i.e. Article 6 under the Paris Agreement). 4 – The competent authority expects the actual cap to be 1,777 MtCO2e, considering that not all the reserves would be used.
70% (2016)
03FA
CTSH
EETS
Stat
us R
epor
t 201
9IC
AP
107
Flexibility
PHASE TWO (2018-2020): Free allocation: > 97% free allowances; in some sub-sectors entities have an obligation to get 3% of their compliance obligation from auctions. Auctioning: < 3% auctioned. Auctioning is determined on the sub-sector level, with an obligation to acquire 3% of allowances at auctions, with the exception of sub-sectors that have high trade intensity or high additional cost increases, considering international competitiveness and carbon leakage. Sectors that participate in auctions include, among others, enti-ties from the electricity, domestic aviation, wooden product and metal foundry sectors. While auctioning was scheduled to start in 2018, it has been delayed to the beginning of 2019. Participation in auctions is subject to some limitations. Only companies that do not receive all their allowances for free will be eligible to bid, with a list of eligible bidders published by the Ministry of Environment. No one bidder can purchase more than 30% of the allowances of one auction. The auctions will be subject to a minimum price.
KETS held its first auction in January 2019. Seven companies participated with the bidding price rang-ing from KRW 23,100 (USD 20.99) to KRW 27,500 (USD 24.98). Four companies successfully bid for all available allowances (550,000 KAUs) for a settlement price of KRW 25,500 (USD 23.17). A total of 7.95 million tonnes are set to be auctioned on monthly basis this year, with 550,000 offered in the first, third and fourth quarters; a million tonnes per auction will be offered in the second quarter.
PHASE THREE (2021-2025): Free allocation: less than 90% free allowances.Auctioning: more than 10%.Energy-intensive and trade-exposed (EITE) sectors will receive 100% of their allowances for free in all phases. EITE sectors are defined along the following criteria:(1) Additional production cost of > 5% and trade intensity of > 10%; or(2) Additional production cost of > 30%; or(3) Trade intensity of > 30%.
BANKING AND BORROWING Banking is allowed with some restrictions across phases. From Phase One to Phase Two, banking is lim-ited for each installation to 10% of the annual average allocation and 20,000 Korean Allowance Units (KAUs). The amount that exceeds the threshold is deducted from Phase Two allocation. From Phase Two to Phase Three, banking is limited to the higher of two limits:(1) The net annual amount of allowances sold in Phase Two; and (2) Company- and facility-specific limits, of 250,000 KAUs and 5,000 KAUs respectively.
Borrowing is allowed only within a single trading phase. In 2015, this was limited to 10% of an entity’s obligation. This limit increased to 20% in 2016 and 2017. In the first compliance year of Phase Two (2018), borrowing was limited to 15% of an entity’s obliga-tion. From 2019, the borrowing limit will be affected by how much an entity has borrowed in the past via the following formula: [Borrowing limit of previous year-(“borrowing ratio” in previous year x 50%)]/enti-ty’s emission volume.
OFFSETS AND CREDITSPHASE ONE (2015-2017):Qualitative limit: Only domestic credits from exter-nal reduction activities implemented by non-ETS enti-ties – and that meet international standards – could
be used for compliance in this phase. Domestic CDM credits (CERs), and credits from domestically certified projects (Korean Offset Credits) were allowed. These credits had to be converted to Korean Credit Units (KCUs) of a specified vintage before being used for compliance. Eligible activities included those eligi-ble under the CDM and Carbon Capture and Storage. However, only activities implemented after 14 April 2010 were eligible. As of December 2017, 35 domestic and 211 CDM methodologies had been approved for use under the KETS.
Quantitative limit: Up to 10% of each entity's compliance obligation.
PHASE TWO (2018-2020): Qualitative limit: In Phase Two, trades of CERs gen-erated after 1 June 2016 from international CDM proj-ects developed by domestic companies are allowed. CDM projects operated by Korean companies will be allowed when: (1) At least 20% of the ownership rights, operating rights or the voting stocks are owned by a Korean company; (2) A Korean company sells or distributes more than 20% of the total project cost; or (3) The projects are funded by a Korean company with a national or regional government operating in a
REPUBLIC OF KOREAKorean Emissions Trading System
Stat
us R
epor
t 201
9IC
AP
108
03FA
CTSH
EETS
UN-designated Least Developed Country or a low-in-come economy as classified by the World Bank.
Regulated entities must convert CDM credits (CERs) to KCUs in order to be used for compliance.
Quantitative limit: Up to 10% of each entity’s com-pliance obligation (of which up to 5% for international offset credit).
PHASE THREE (2021-2025): Rules are not yet clear.
MARKET STABILITY PROVISIONSAuction Reserve Price: Auctions for market stability will be subject to an auction reserve price that will be set by the following formula: “the average price over the previous three months + the average price of last month + the average price over the previous three days/3."
Allocation Committee: An Allocation Committee is in place to implement market stabilization measures in particular cases:(1) The market allowance price of six consecutive months is at least three times higher than the average price of the two previous years.(2) The market allowance price of the last month is at least twice the average price of two previous years and the average trading volume of the last month is at
least twice the volume of the same month of the two previous years.(3) The average market allowance price of a given month is smaller than 40% of the average price of the two previous years. In 2015 and 2016, the price thresh-old is KRW 10,000 (USD 9.09).(4) When it is difficult to trade allowances due to the imbalance of supply or demand.The stabilization measures may include:(1) Additional allocation from the reserve (up to 25%); (2) Establishment of an allowance retention limit:minimum (70%) or maximum (150%) of the allowance of the compliance year;(3) An increase or decrease of the borrowing limit;(4) An increase or decrease of the offsets limit; and(5) Temporary set-up of a price ceiling or price floor.
In 2016, the Allocation Committee doubled the bor-rowing limit to 20% and an additional nine million allowances were auctioned at a reserve price of KRW 16,200 (USD 14.72) of which less than a third of allow-ances were sold. In 2018, the Committee made an additional 5.5 million allowances available from the stability reserve in an attempt to ease the market in the lead-up to the 2017 compliance deadline.
The Export-Import Bank, the Korea Development Bank, and the Industrial Bank of Korea are also cur-rently in consultation talks to participate as market makers in the KETS.
Compliance
COMPLIANCE PERIOD One year
MRVREPORTING FREQUENCY: Annual reporting of emis-sions must be submitted within three months from the end of a given compliance year (by the end of March).
VERIFICATION: Emissions must be verified by a third-party verifier.
OTHER: Emissions reports are reviewed and certified by the Certification Committee of the Ministry of Envi-ronment (MOE) within five months from the end of a given compliance year (by the end of May). If the liable entity fails to report emissions correctly, the report will be disqualified.
ENFORCEMENTThe penalty shall not exceed three times the average market price of allowances of the given compliance year or KRW 100,000 (USD 90.85)/tonne.
03FA
CTSH
EETS
Stat
us R
epor
t 201
9IC
AP
109
Linking
Other Information
LINKS WITH OTHER SYSTEMSLinkage is planned to be considered in Phase Three.
INSTITUTIONS INVOLVED In 2016, overall responsibility for the KETS moved from the MOE to the Ministry of Strategy and Finance (MOST). On 1 January 2018, responsibility was trans-ferred back to the MOE, while the MOST still chairs the Allocation Committee;Korea Exchange (Trading Platform);Greenhouse Gas Inventory and Research Center (Registry and technical support)
EVALUATION / ETS REVIEWNo standardized evaluation process has been devel-oped to date, but an analysis of the economic impact of the KETS is ongoing for the current phase5.
USE OF REVENUESThe government has put forward possible options for the use of the revenues – such as supporting mitiga-tion equipment projects, innovation, and technology development of ETS-covered entities. Specific rules on the use of revenues are yet to be decided.
IMPLEMENTING LEGISLATION/REGULATIONFramework Act on Low Carbon, Green Growth6
Enforcement Decree of the Act on the Allocation and Trading of Greenhouse Gas Emissions Allowances7
Act on the Allocation and Trading of Greenhouse Gas Emissions Allowances8
First Master Plan for 2015-20249
Second Allocation Plan10
5 – The method/modelling of the ongoing study is not yet open to the public. 6 – https://www.iea.org/policiesandmeasures/pams/korea/name-38971-en.php 7 – https://elaw.klri.re.kr/eng_mobile/viewer.do?hseq=46598&type=sogan&key=60 8 – http://www.lse.ac.uk/GranthamInstitute/wp-content/uploads/laws/1647.pdf 9 – http://www.moef.go.kr/nw/nes/detailNesDtaView.do?menuNo=4010100&searchNttId1=OLD_4020294&searchBsId1=MOSFBBS_000000000028 10 – http://www.me.go.kr/home/web/board/read.do?pagerOffset=10&maxPageItems=10&maxIndexPages=10&searchKey=&searchValue=& menuId=286&orgCd=&boardId=883200&boardMasterId=1&boardCategoryId=&decorator=
REPUBLIC OF KOREAKorean Emissions Trading System
Stat
us R
epor
t 201
9IC
AP
110
03FA
CTSH
EETS
GASESCO2 only
ALLOCATIONFree allocation
AVERAGE 2018 PRICE~JPY 650 (USD 5.89) (estimated standard transaction price)
OFFSETS AND CREDITSDomestic
COVERAGE13.2 MtCO2e (2019)
TOKYOTokyo Cap-and-Trade Program
ETS DESCRIPTIONLaunched in April 2010, the Tokyo ETS – the cap-and-trade program of the Tokyo Metropolitan Government (TMG) – is Japan’s first mandatory ETS and is linked to the Saitama ETS. Under the ETS, large offices and factories are required to reduce emissions by 15% or 17% in its second period (FY2015 – FY2019). The target in the third period (FY2020 – 2024) is expected to be 25% or 27%.
YEAR IN REVIEWIn FY2016, emissions were reduced by 26% compared to base-year emissions. The introduction of high-effi-ciency heat sources and light fittings have been key activities in reducing emissions in the building sec-tor. Buildings have continued to decrease emissions despite an increase in gross floor space, indicating a decrease in emissions intensity in the sector.
First citywide ETS
Energy efficiency improvements key to emissions reductions OVERALL GHG EMISSIONS (EXCL. LULUCF) 66.0 MtCO2e (2016)1
GHG REDUCTION TARGETSBY 2020: 25% reduction from 2000 GHG levelsBY 2030: 30% reduction from 2000 GHG levels
ETS in force
ETS scheduled
ETS considered
SECTORS:
INDUSTRY
CAPPED EMISSIONS13.2 MtCO2e
GHGs COVEREDCO2
SECTORS AND THRESHOLDSConsumption of fuels, heat, and electricity in com-mercial and industrial buildings.
BUILDINGS
Background Information
1 - The overall emissions figure for Tokyo is higher than the total of the emissions by sector because the former includes all GHGs in Tokyo, whereas the emissions by sector only measures CO2 emissions.
OVERALL GHG EMISSIONS BY SECTORIndustry 4.8 (8%)Residential 16.8 (28%)Transport 11.1 (18%)Commercial 25.7 (43%)Waste 1.7 (3%)
ETS Size
Building owners are subject to surrender obligations, but large tenants (floor space above 5000m2 or over six million kWh electricity usage per year) can assume obligations jointly or in place of building owners.
INCLUSION THRESHOLDS: Facilities that consume energy more than 1,500kL of crude oil equivalent or more per year.
20% (2019)
03FA
CTSH
EETS
Stat
us R
epor
t 201
9IC
AP
111
POINT OF REGULATIONDownstream
NUMBER OF ENTITIES1,200 facilities: office/commercial buildings: 1000; factories: 200
CAPA Tokyo-wide cap is aggregated from emissions base-lines set at the facility level. The baselines at the facil-ity level are calculated according to the following for-mula: Sum of base year emissions of covered facilities x compliance factor x number of years of a compliance period (five years).
COMPLIANCE FACTOR: First Period (FY2010–FY2014): 8% or 6% reduction below base-year emissions
Second Period (FY2015–FY2019): 17% or 15% reduction below base-year emissions
Third Period (FY2020–FY2024): 25% or 27% reduc-tion below base-year emissions (expected compli-ance factors)
The higher compliance factor applies to office build-ings, as well as to district heating and cooling (DHC) plant facilities (excluding facilities that use a large amount of DHC). The lower compliance factor applies, among others, to office buildings, facilities which are heavy users of DHC plants, and factories.
Facilities demonstrating outstanding performance in emissions reductions, as well as in the introduction, use, and management of energy equipment, are cer-tified as top-level facilities that receive lower compli-ance factors according to their rate of progress. The certification standards represent the highest-level energy efficiency measures currently feasible, stipulat-ing more than 200 different energy-saving measures.
TRADING PERIODSFIRST PERIOD: 1 April 2011 to 30 September 2016SECOND PERIOD: 1 April 2015 to 30 September 2021THIRD PERIOD: 1 April 2020 to 30 September 2026
Each of the above trading periods includes an18-month adjustment period.
ALLOCATIONThe baselines for facilities are based on historical emissions, calculated according to the following for-mula: Base-year emissions x (1 - compliance factor) x compliance period (5 years).
Base-year emissions for the first compliance period are based on the average emissions of three consec-utive years between FY2002–2007, as chosen by each entity. Credits are issued to facilities whose emissions fall below the baseline.
Baselines for new entrants are based on past emis-sions or on emissions intensity standards.
Phases & Allocation
Flexibility
BANKING AND BORROWING Banking is only allowed between consecutive compli-ance periods. Borrowing is not allowed.
OFFSETS AND CREDITSCredits from four offset types are allowed in the Tokyo ETS.
SMALL AND MID-SIZE FACILITY CREDITS: Emissions reductions from non-covered small- and medium-sized facilities in Tokyo.
Quantitative Limits: None.
OUTSIDE TOKYO CREDITS: Emission reductions achieved from large facilities out-side of the Tokyo area. Large facilities are those with an energy consumption of 1,500kL of crude oil equiva-lent or more in a base-year, and with base-year emis-sions of 150,000t or less.
Stat
us R
epor
t 201
9IC
AP
112
03FA
CTSH
EETS
Quantitative Limits: Credits are only issued for the reduction amount that exceeds the compliance fac-tor. These credits can be used for compliance for up to one-third of facilities' reduction obligations.
RENEWABLE ENERGY CREDITS: Credits from solar (heat, electricity), wind, geother-mal, or hydro (under 1,000kW) electricity production are counted at 1.5 times the value of regular credits. Credits from biomass (biomass rate of 95% or more, black liquor is excluded) are converted with the factor 1. These credits encompass the following types: Envi-ronmental Value Equivalent, Renewable Energy Cer-tificates, and New Energy Electricity, generated under the Renewable Portfolio Standard Law.Quantitative Limits: None.
SAITAMA CREDITS (VIA LINKING): (1) Excess Credits: Emissions reductions from facil-ities in Saitama with base-year emissions of 150,000 tonnes or less. Issuance of credits from FY2015.(2) Small- and Mid-size Facility Credits issued by Saitama Prefecture. Issuance of credits from FY2012.
Quantitative Limits: None.All offsets have to be verified by verification agencies.
EMISSIONS REDUCTION METHODS:(1) Low Carbon Electricity and Heat: In order to eval-uate energy efficiency efforts of the covered facilities, CO2 emission factors of supply side (electricity and others) are fixed during each compliance period. When covered facilities procure electricity or heating from TMG-certified suppliers with lower emission fac-tors, they can reduce the difference between these emission factors from their emissions to be reported to TMG.(2) Renewable Energy: When covered facilities gener-ate electricity from renewable sources for their own use, they can deduct this amount of electricity from the total energy usage of the facility.
MARKET STABILITY PROVISIONS In general, covered facilities trade over the counter and TMG does not control carbon prices. However, TMG offers offset credits for trading in case of exces-sive price development.
Compliance
COMPLIANCE PERIODFive years
FIRST PERIOD: FY2010-2014SECOND PERIOD: FY2015-2019THIRD PERIOD: FY2020-2024
MRVREPORTING FREQUENCY: Annual emissions report-ing, including emission reduction plans. All seven GHGs have to be monitored and reported: CO2, CH4, N2O, PFCs, HFCs, SF6, and NF3. Large tenants, i.e., those with a floor space above 5000m2 or over six million kWh electricity use per year, are required to submit their own emissions reduction plan to TMG in collaboration with building owners.
VERIFICATION: These annual reports require third-party verification. FRAMEWORK: These are based on ‘TMG Monitoring/Reporting Guidelines’ and ‘TMG Verification Guide-lines.’
ENFORCEMENTIn the case of noncompliance, the following measures may be taken:
FIRST STAGE: The Governor orders the facility to reduce emissions by the amount of the reduction shortfall multiplied by 1.3.
SECOND STAGE: Any facility that fails to carry out the order will be publicly named and subject to penalties (up to JPY 500,000 [USD 4,528]) and surcharges (1.3 times the shortfall).
03FA
CTSH
EETS
Stat
us R
epor
t 201
9IC
AP
113
Linking
Other Information
LINKS WITH OTHER SYSTEMSLinking with the Saitama Prefecture started in April 2011 when the Saitama ETS was launched. Tokyo and Saitama credits are officially eligible for trade between the two jurisdictions. During the first compliance
period, 15 credit transfers took place between the Saitama Prefecture and Tokyo (nine cases from Tokyo to Saitama, six cases from Saitama to Tokyo).
INSTITUTIONS INVOLVED Tokyo Metropolitan Government
EVALUATION / ETS REVIEWTMG has established a committee to analyze the structure of its system post-2020. From FY2020, the program will enter into a new stage to promote con-tinued energy-savings and expanding the utilization of low-carbon (renewable) energy to achieve the 2030 target and transition to a zero-carbon society.
IMPLEMENTING LEGISLATION/REGULATIONThe Tokyo Metropolitan Security Ordinance and Regulation for the Enforcement of the Tokyo Metropoli-tan Environmental Security Ordinance1
Detailed documents on the Tokyo ETS can be found on the TMG website.2
TOKYOTokyo Cap-and-Trade Program
1 – http://www.kankyo.metro.tokyo.jp/basic/guide/security_ordinance/index.html ; 2 – http://www.kankyo.metro.tokyo.jp/en/climate/cap_and_trade/index.files/TokyoCaT_detailed_documents.pdf
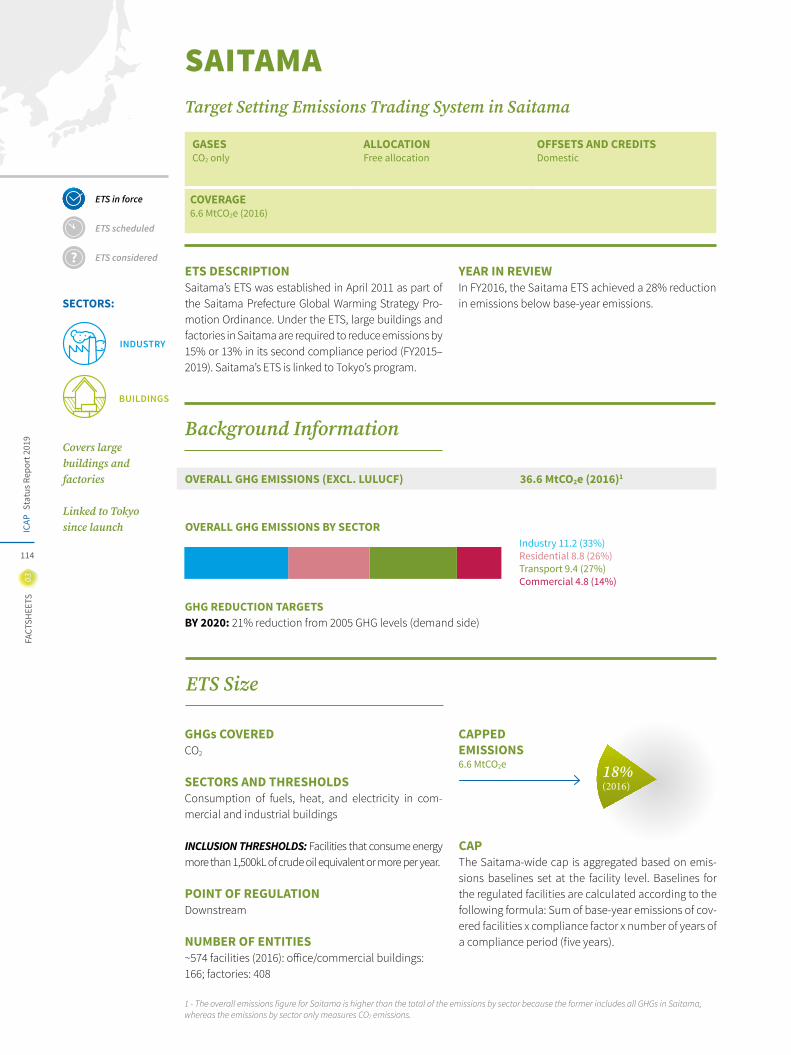
Stat
us R
epor
t 201
9IC
AP
114
03FA
CTSH
EETS
GASESCO2 only
ALLOCATIONFree allocation
OFFSETS AND CREDITSDomestic
COVERAGE6.6 MtCO2e (2016)
SAITAMATarget Setting Emissions Trading System in Saitama
ETS DESCRIPTIONSaitama’s ETS was established in April 2011 as part of the Saitama Prefecture Global Warming Strategy Pro-motion Ordinance. Under the ETS, large buildings and factories in Saitama are required to reduce emissions by 15% or 13% in its second compliance period (FY2015– 2019). Saitama’s ETS is linked to Tokyo’s program.
YEAR IN REVIEWIn FY2016, the Saitama ETS achieved a 28% reduction in emissions below base-year emissions.
Covers large buildings and factories
Linked to Tokyo since launch
OVERALL GHG EMISSIONS (EXCL. LULUCF) 36.6 MtCO2e (2016)1
GHG REDUCTION TARGETSBY 2020: 21% reduction from 2005 GHG levels (demand side)
ETS in force
ETS scheduled
ETS considered
SECTORS:
INDUSTRY
CAPPED EMISSIONS 6.6 MtCO2e
GHGs COVEREDCO2
SECTORS AND THRESHOLDSConsumption of fuels, heat, and electricity in com-mercial and industrial buildings
BUILDINGS
Background Information
1 - The overall emissions figure for Saitama is higher than the total of the emissions by sector because the former includes all GHGs in Saitama, whereas the emissions by sector only measures CO2 emissions.
OVERALL GHG EMISSIONS BY SECTORIndustry 11.2 (33%)Residential 8.8 (26%)Transport 9.4 (27%)Commercial 4.8 (14%)
ETS Size
INCLUSION THRESHOLDS: Facilities that consume energy more than 1,500kL of crude oil equivalent or more per year.
POINT OF REGULATIONDownstream
NUMBER OF ENTITIES~574 facilities (2016): office/commercial buildings: 166; factories: 408
CAPThe Saitama-wide cap is aggregated based on emis-sions baselines set at the facility level. Baselines for the regulated facilities are calculated according to the following formula: Sum of base-year emissions of cov-ered facilities x compliance factor x number of years of a compliance period (five years).
18% (2016)
03FA
CTSH
EETS
Stat
us R
epor
t 201
9IC
AP
115
COMPLIANCE FACTOR: First Period (FY2010–FY2014): 8% or 6% reduction below base-year emissions
Second Period (FY2015–FY2019): 15% or 13% re- duction below base-year emissions
The higher compliance factor applies to commercial buildings, as well as to district heating and cooling (DHC) plant-facilities (excluding facilities that use a large amount of DHC). The lower compliance factor applies, among others, to commercial buildings, facili-ties which are heavy users of DHC plants, and factories.
Facilities demonstrating outstanding performance in emissions reduction, as well as in the introduction, use, and management of energy equipment, are cer-tified as top-level facilities that receive lower compli-ance factors according to their rate of progress. The certification standards represent the highest-level energy-efficiency measures currently feasible, stip-ulating more than 200 different energy-saving mea-sures.
TRADING PERIODSFIRST PERIOD: 1 April 2011 to 30 September 2016SECOND PERIOD: 1 April 2015 to 30 September 2021
Each of the above trading periods includes an 18-month adjustment period.
ALLOCATIONThe baselines for facilities are based on historical emissions, calculated according to the following for-mula: Base-year emissions x (1 – compliance factor) x compliance period (5 years).
Base-year emissions for the first compliance period are based on the average emissions of three consec-utive years between FY 2002–2007, as chosen by each entity. Credits are issued to facilities whose emissions fall below the baseline.
Baselines for new entrants are based on past emis-sions or on emissions intensity standards.
Phases & Allocation
Flexibility
BANKING AND BORROWING Banking is only allowed between two consecutive compliance periods. Borrowing is not allowed.
OFFSETS AND CREDITSCredits from five offset types are allowed in the Saitama ETS.
SMALL- AND MID-SIZE FACILITY CREDITS: Emissions reductions from non-covered small- and medium-sized facilities in Saitama. Quantitative Limits: None.
OUTSIDE SAITAMA CREDITS: Emission reductions achieved from large facilities outside of the Saitama prefecture. Large facilities are those with an energy consumption of 1,500kL of crude oil equivalent or more in a base-year, and with base-year emissions of 150,000t or less.
Quantitative Limits: Credits are only issued for the reduction amount that exceeds the compliance fac-tor. These credits can be used for compliance for up to one-third of offices’ reduction obligations. Factories can use up to 50%. RENEWABLE ENERGY CREDITS: Credits from solar (heat, electricity), wind, geothermal, or hydro (under 1,000kW) electricity production are counted at 1.5 times the value of regular credits. Credits from bio-mass (biomass rate of 95% or more, black liquor is excluded) are converted with the factor 1. These cred-its encompass the following types: Environmental Value Equivalent, Renewable Energy Certificates, and New Energy Electricity, generated under the Renew-able Portfolio Standard Law.Quantitative Limits: None.
Stat
us R
epor
t 201
9IC
AP
116
03FA
CTSH
EETS
TOKYO CREDITS (VIA LINKING): (1) Excess Credits: Emissions reductions from facilities with base-year emissions of 150,000 tonnes or less. Issuance of credits from FY2015.(2) Small- and mid-size Facility Credits: Issued by Saitama Prefecture. Issuance of credits from FY2012. Quantitative Limits: None.
FOREST ABSORPTION CREDITS: Credits from forests inside the Saitama Prefecture are counted at 1.5 times the value of regular credits. Others are converted with the factor 1. Quantitative Limits: None.
EMISSIONS REDUCTION METHODS:Renewable Energy: When covered facilities generate electricity from renewable sources for their own use, they can deduct this amount of electricity from the total energy usage of the facility.
MARKET STABILITY PROVISIONSIn general, Saitama does not control carbon prices.
Compliance
COMPLIANCE PERIODFIRST PERIOD: FY2011-2014SECOND PERIOD: FY2015-2019
MRVREPORTING FREQUENCY: Annual emissions report-ing, including emission reduction plans. All seven GHGs must be monitored and reported: CO2, CH4, N2O, PFCs, HFCs, SF6, and NF3.
VERIFICATION: These reports require third-party veri-fication by the end of adjustment period.
FRAMEWORK: These are based on ‘Saitama Monitor-ing/Reporting Guidelines’ and ‘Saitama Verification Guidelines.’
ENFORCEMENTNone
Linking
Other Information
LINKS WITH OTHER SYSTEMSLinking with Tokyo started in April 2011. Tokyo and Saitama credits are officially eligible for trade between the two jurisdictions. During the first compliance
period, 15 credit transfers took place between the Saitama Prefecture and Tokyo (nine cases from Tokyo to Saitama, six cases from Saitama to Tokyo).
INSTITUTIONS INVOLVED Saitama Prefectural Government
IMPLEMENTING LEGISLATION/REGULATIONSaitama Prefecture Global Warming Strategy Promo-tion Ordinance1
Regulation on Saitama Prefecture Global Warming Strategy Promotion Ordinance2
1 – http://www3.e-reikinet.jp/saitama-pref/d1w_reiki/42190101000900000000/42190101000900000000/42190101000900000000.html ; 2 – http://www3.e-reikinet.jp/saitama-pref/d1w_reiki/42190210001900000000/42190210001900000000/42190210001900000000.html
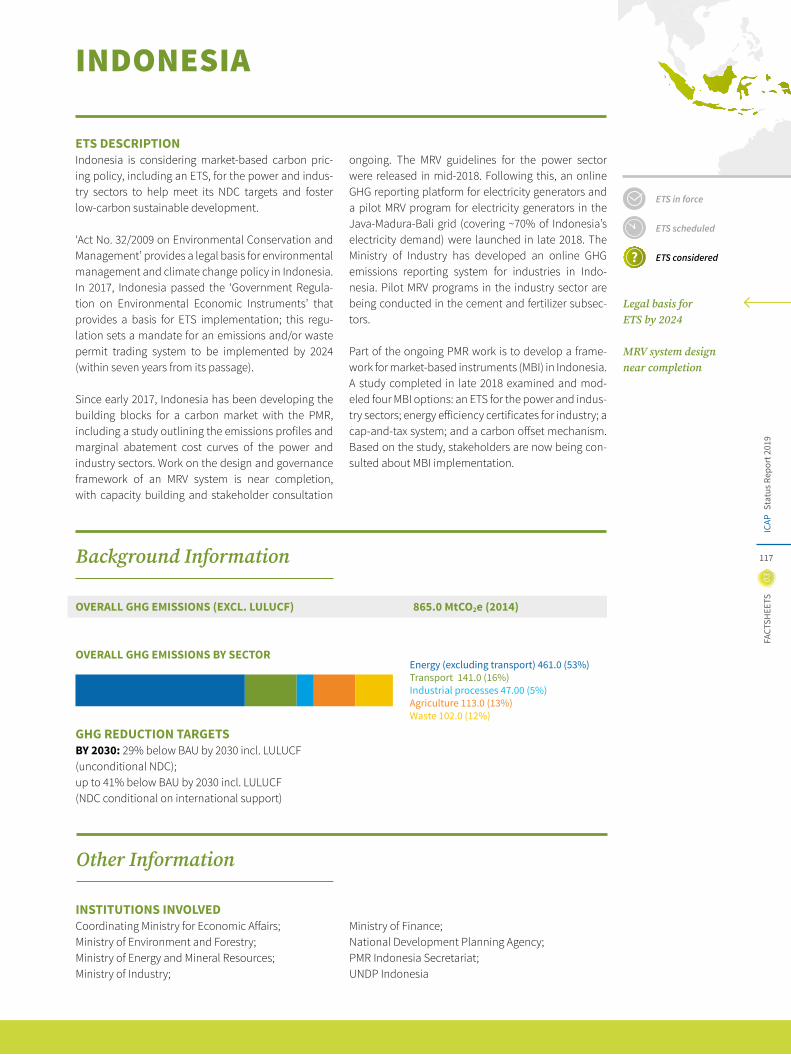
03FA
CTSH
EETS
Stat
us R
epor
t 201
9IC
AP
117
Legal basis for ETS by 2024
MRV system design near completion
ETS in force
ETS scheduled
ETS considered
INDONESIA
ETS DESCRIPTIONIndonesia is considering market-based carbon pric-ing policy, including an ETS, for the power and indus-try sectors to help meet its NDC targets and foster low-carbon sustainable development.
‘Act No. 32/2009 on Environmental Conservation and Management’ provides a legal basis for environmental management and climate change policy in Indonesia. In 2017, Indonesia passed the ‘Government Regula-tion on Environmental Economic Instruments’ that provides a basis for ETS implementation; this regu-lation sets a mandate for an emissions and/or waste permit trading system to be implemented by 2024 (within seven years from its passage).
Since early 2017, Indonesia has been developing the building blocks for a carbon market with the PMR, including a study outlining the emissions profiles and marginal abatement cost curves of the power and industry sectors. Work on the design and governance framework of an MRV system is near completion, with capacity building and stakeholder consultation
ongoing. The MRV guidelines for the power sector were released in mid-2018. Following this, an online GHG reporting platform for electricity generators and a pilot MRV program for electricity generators in the Java-Madura-Bali grid (covering ~70% of Indonesia’s electricity demand) were launched in late 2018. The Ministry of Industry has developed an online GHG emissions reporting system for industries in Indo-nesia. Pilot MRV programs in the industry sector are being conducted in the cement and fertilizer subsec-tors.
Part of the ongoing PMR work is to develop a frame-work for market-based instruments (MBI) in Indonesia. A study completed in late 2018 examined and mod-eled four MBI options: an ETS for the power and indus-try sectors; energy efficiency certificates for industry; a cap-and-tax system; and a carbon offset mechanism. Based on the study, stakeholders are now being con-sulted about MBI implementation.
Other Information
INSTITUTIONS INVOLVED Coordinating Ministry for Economic Affairs; Ministry of Environment and Forestry; Ministry of Energy and Mineral Resources; Ministry of Industry;
Ministry of Finance;National Development Planning Agency;PMR Indonesia Secretariat;UNDP Indonesia
Energy (excluding transport) 461.0 (53%)Transport 141.0 (16%)Industrial processes 47.00 (5%)Agriculture 113.0 (13%)Waste 102.0 (12%)
OVERALL GHG EMISSIONS (EXCL. LULUCF) 865.0 MtCO2e (2014)
OVERALL GHG EMISSIONS BY SECTOR
GHG REDUCTION TARGETSBY 2030: 29% below BAU by 2030 incl. LULUCF(unconditional NDC); up to 41% below BAU by 2030 incl. LULUCF (NDC conditional on international support)
Background Information
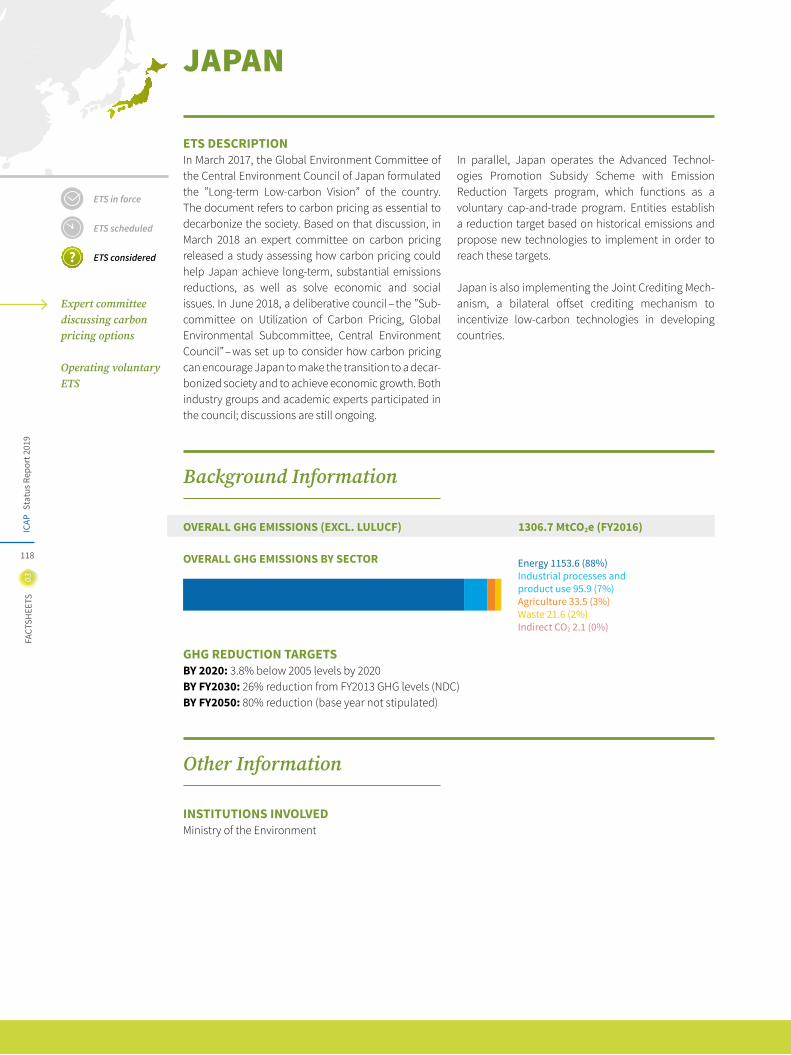
Stat
us R
epor
t 201
9IC
AP
118
03FA
CTSH
EETS
ETS in force
ETS scheduled
ETS considered
Expert committee discussing carbon pricing options
Operating voluntary ETS
JAPAN
ETS DESCRIPTIONIn March 2017, the Global Environment Committee of the Central Environment Council of Japan formulated the ”Long-term Low-carbon Vision” of the country. The document refers to carbon pricing as essential to decarbonize the society. Based on that discussion, in March 2018 an expert committee on carbon pricing released a study assessing how carbon pricing could help Japan achieve long-term, substantial emissions reductions, as well as solve economic and social issues. In June 2018, a deliberative council – the ”Sub-committee on Utilization of Carbon Pricing, Global Environmental Subcommittee, Central Environment Council” – was set up to consider how carbon pricing can encourage Japan to make the transition to a decar-bonized society and to achieve economic growth. Both industry groups and academic experts participated in the council; discussions are still ongoing.
In parallel, Japan operates the Advanced Technol-ogies Promotion Subsidy Scheme with Emission Reduction Targets program, which functions as a voluntary cap-and-trade program. Entities establish a reduction target based on historical emissions and propose new technologies to implement in order to reach these targets.
Japan is also implementing the Joint Crediting Mech-anism, a bilateral offset crediting mechanism to incentivize low-carbon technologies in developing countries.
INSTITUTIONS INVOLVED Ministry of the Environment
OVERALL GHG EMISSIONS (EXCL. LULUCF) 1306.7 MtCO2e (FY2016)
OVERALL GHG EMISSIONS BY SECTOR
GHG REDUCTION TARGETSBY 2020: 3.8% below 2005 levels by 2020BY FY2030: 26% reduction from FY2013 GHG levels (NDC)BY FY2050: 80% reduction (base year not stipulated)
Energy 1153.6 (88%)Industrial processes and product use 95.9 (7%)Agriculture 33.5 (3%)Waste 21.6 (2%)Indirect CO2 2.1 (0%)
Other Information
Background Information
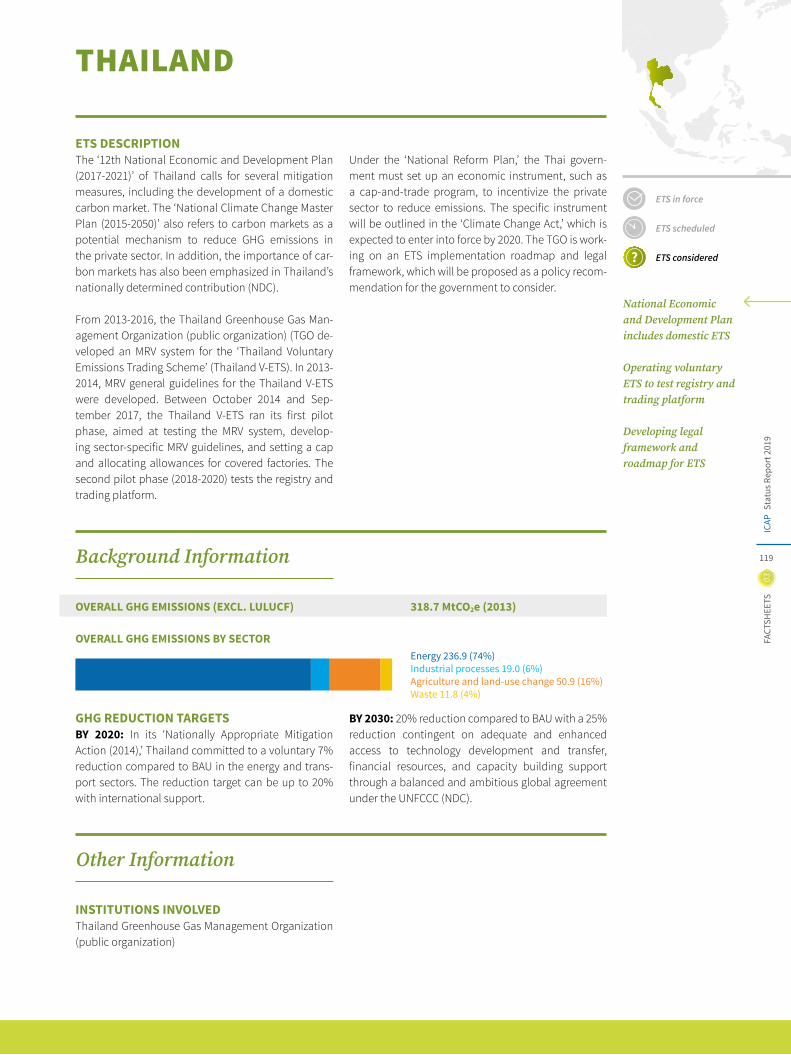
03FA
CTSH
EETS
Stat
us R
epor
t 201
9IC
AP
119
ETS in force
ETS scheduled
ETS considered
National Economic and Development Plan includes domestic ETS
Operating voluntary ETS to test registry and trading platform
Developing legal framework and roadmap for ETS
THAILAND
ETS DESCRIPTIONThe ‘12th National Economic and Development Plan (2017-2021)’ of Thailand calls for several mitigation measures, including the development of a domestic carbon market. The ‘National Climate Change Master Plan (2015-2050)’ also refers to carbon markets as a potential mechanism to reduce GHG emissions in the private sector. In addition, the importance of car-bon markets has also been emphasized in Thailand’s nationally determined contribution (NDC).
From 2013-2016, the Thailand Greenhouse Gas Man-agement Organization (public organization) (TGO de- veloped an MRV system for the ‘Thailand Voluntary Emissions Trading Scheme’ (Thailand V-ETS). In 2013- 2014, MRV general guidelines for the Thailand V-ETS were developed. Between October 2014 and Sep-tember 2017, the Thailand V-ETS ran its first pilot phase, aimed at testing the MRV system, develop-ing sector-specific MRV guidelines, and setting a cap and allocating allowances for covered factories. The second pilot phase (2018-2020) tests the registry and trading platform.
Under the ‘National Reform Plan,’ the Thai govern-ment must set up an economic instrument, such as a cap-and-trade program, to incentivize the private sector to reduce emissions. The specific instrument will be outlined in the ‘Climate Change Act,’ which is expected to enter into force by 2020. The TGO is work-ing on an ETS implementation roadmap and legal framework, which will be proposed as a policy recom-mendation for the government to consider.
Other Information
INSTITUTIONS INVOLVED Thailand Greenhouse Gas Management Organization (public organization)
Energy 236.9 (74%)Industrial processes 19.0 (6%)Agriculture and land-use change 50.9 (16%)Waste 11.8 (4%)
OVERALL GHG EMISSIONS (EXCL. LULUCF) 318.7 MtCO2e (2013)
OVERALL GHG EMISSIONS BY SECTOR
GHG REDUCTION TARGETSBY 2020: In its ‘Nationally Appropriate Mitigation Action (2014),’ Thailand committed to a voluntary 7% reduction compared to BAU in the energy and trans-port sectors. The reduction target can be up to 20% with international support.
BY 2030: 20% reduction compared to BAU with a 25% reduction contingent on adequate and enhanced access to technology development and transfer, financial resources, and capacity building support through a balanced and ambitious global agreement under the UNFCCC (NDC).
Background Information
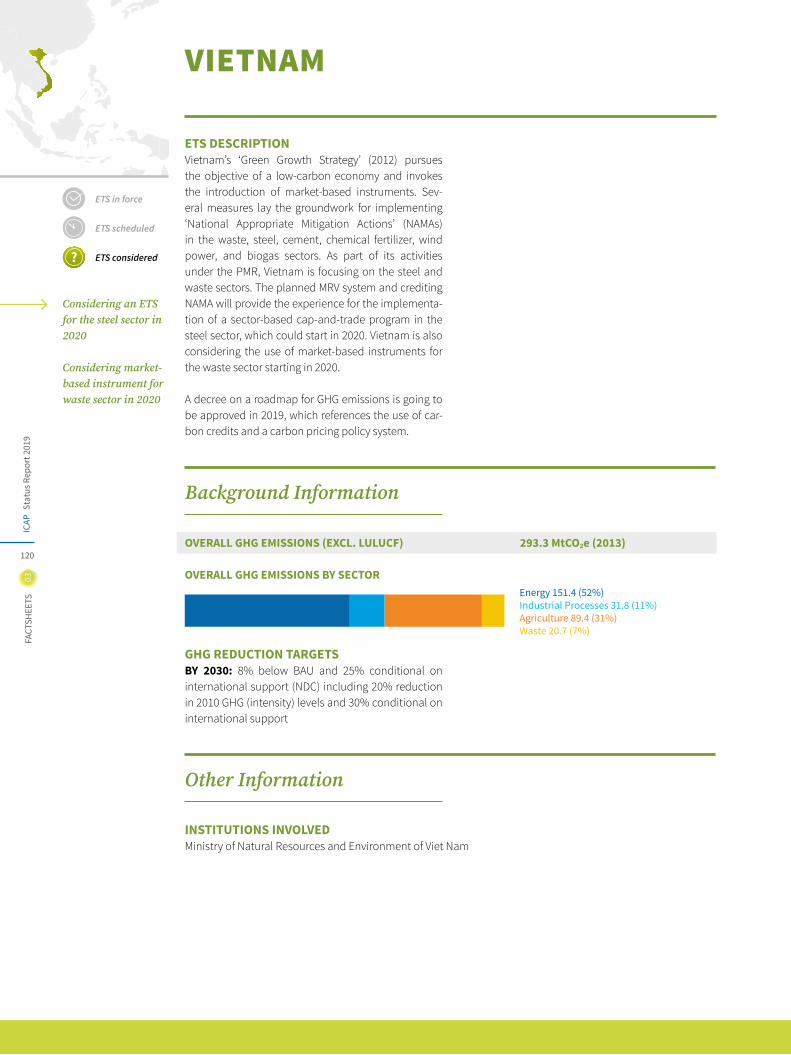
Stat
us R
epor
t 201
9IC
AP
120
03FA
CTSH
EETS
ETS in force
ETS scheduled
ETS considered
Considering an ETS for the steel sector in 2020
Considering market-based instrument for waste sector in 2020
VIETNAM
ETS DESCRIPTIONVietnam’s ‘Green Growth Strategy’ (2012) pursues the objective of a low-carbon economy and invokes the introduction of market-based instruments. Sev-eral measures lay the groundwork for implementing ‘National Appropriate Mitigation Actions’ (NAMAs) in the waste, steel, cement, chemical fertilizer, wind power, and biogas sectors. As part of its activities under the PMR, Vietnam is focusing on the steel and waste sectors. The planned MRV system and crediting NAMA will provide the experience for the implementa-tion of a sector-based cap-and-trade program in the steel sector, which could start in 2020. Vietnam is also considering the use of market-based instruments for the waste sector starting in 2020.
A decree on a roadmap for GHG emissions is going to be approved in 2019, which references the use of car-bon credits and a carbon pricing policy system.
INSTITUTIONS INVOLVED Ministry of Natural Resources and Environment of Viet Nam
OVERALL GHG EMISSIONS (EXCL. LULUCF) 293.3 MtCO2e (2013)
OVERALL GHG EMISSIONS BY SECTOR
GHG REDUCTION TARGETSBY 2030: 8% below BAU and 25% conditional on international support (NDC) including 20% reduction in 2010 GHG (intensity) levels and 30% conditional on international support
Energy 151.4 (52%)Industrial Processes 31.8 (11%)Agriculture 89.4 (31%)Waste 20.7 (7%)
Other Information
Background Information
Stat
us R
epor
t 201
9IC
AP
121
ABOUT ICAP
04
ICAP is a unique platform for governments to discuss the latest research and practical experiences with emissions trading
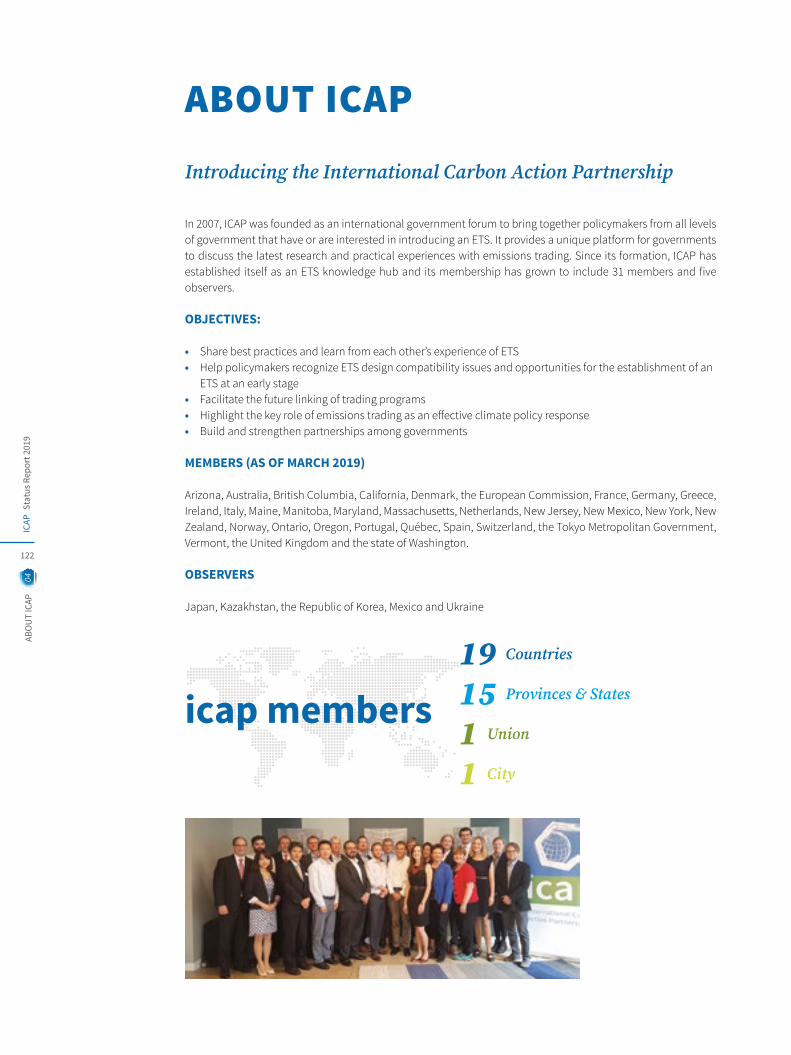
Stat
us R
epor
t 201
9IC
AP
122
04AB
OU
T IC
AP
ABOUT ICAP
Introducing the International Carbon Action Partnership
In 2007, ICAP was founded as an international government forum to bring together policymakers from all levels of government that have or are interested in introducing an ETS. It provides a unique platform for governments to discuss the latest research and practical experiences with emissions trading. Since its formation, ICAP has established itself as an ETS knowledge hub and its membership has grown to include 31 members and five observers.
OBJECTIVES:
• Share best practices and learn from each other’s experience of ETS• Help policymakers recognize ETS design compatibility issues and opportunities for the establishment of an ETS at an early stage• Facilitate the future linking of trading programs• Highlight the key role of emissions trading as an effective climate policy response• Build and strengthen partnerships among governments
MEMBERS (AS OF MARCH 2019)
Arizona, Australia, British Columbia, California, Denmark, the European Commission, France, Germany, Greece, Ireland, Italy, Maine, Manitoba, Maryland, Massachusetts, Netherlands, New Jersey, New Mexico, New York, New Zealand, Norway, Ontario, Oregon, Portugal, Québec, Spain, Switzerland, the Tokyo Metropolitan Government, Vermont, the United Kingdom and the state of Washington.
OBSERVERS
Japan, Kazakhstan, the Republic of Korea, Mexico and Ukraine
19 Countries
15 Provinces & Statesicap members1 Union
1 City
04AB
OU
T IC
APSt
atus
Rep
ort 2
019
ICAP
123
• The ICAP Allowance Price Explorer lets you display and compare allowance prices from across the world in customized charts.
ICAP PROVIDES A WIDE RANGE OF ONLINE TOOLS TO MEET YOUR EMISSIONS TRADING INFORMATION NEEDS
• The ICAP ETS Map lets you explore detailed up-to-date factsheets on all systems, ...
• ... while our news articles cover the latest milestones in emissions trading.
Stat
us R
epor
t 201
9IC
AP
124
04AB
OU
T IC
AP
• The soon-to-be launched ICAP ETS Library lets you dive into a range of government documents and academic papers on carbon markets. Continuously updated, the library is the reference point for all your emissions trading questions.
SHARING KNOWLEDGE AND EXPERIENCE ON EMISSIONS TRADING DESIGN AND IMPLEMENTATION GLOBALLY• In our publications, available on our website, we consolidate lessons learned and highlight best practices from over a decade of experience with GHG emissions trading.
• Through our series ETS briefs we make the complex concepts underlying emissions trading accessible to a broader audience:
04AB
OU
T IC
APSt
atus
Rep
ort 2
019
ICAP
125
NOTES ON METHODS AND SOURCESGENERAL NOTES
NOTES ON INFOGRAPHICS
01. The report draws on a range of sources, including official ETS information and statements from governments and public authorities, data submitted to the UNFCCC, or where available, other official reporting and information provided by ICAP members and observers, contributing authors or in-country/native experts from our network. Information on emitting sectors is based on self-reporting by the respective jurisdictions; therefore categories are not necessarily consistent across jurisdictions.
02. Data in the report represents the current situation as of February 2019.
03. Where 2019 data is not yet available, we use the most recent available data.
04. For the purpose of this report, emissions trading systems (ETS) include mandatory cap-and-trade systems for GHGs. Systems that regulate other gases (e.g., other air pollutants) or trade other units (e.g., energy-efficiency certificates), other market-based instruments (e.g., carbon taxes, baseline-and-crediting systems) and voluntary programs do not fall under the scope of this report.
05. We use metric tonnes throughout the report, unless otherwise indicated.
06. Emissions coverage as reported in factsheets refers to the emissions cap data for systems with a cap. For systems without a cap it refers to estimates of the emissions covered under the particular emissions trading system.
07. Jurisdictions’ shares of global GDP and world population are calculated based on the most recent annual data available at the time of writing. This data is for 2018, 2017 or 2016. The number of people living in jurisdictions that are running an ETS and the cumulative GDP of the respective economies are calculated as a percentage/share of world population and global GDP. The share of global GHG emissions covered by an ETS in force is calculated based on the latest available data of jurisdictions’ official cap data or respective estimates. Figures have been retrieved from various sources (links available upon request, [email protected]).
08. When WCI jurisdictions are represented as a single linked system, values are calculated as averages weighted by shares of the overall 2019 cap when no single uniform data point was available. For variables where the absolute total was of interest (e.g. market size), the cumulative total was used.
09. All prices are listed in USD unless otherwise specified. For the average 2018 price conversion to dollars, the exchange rate used constitutes a yearly average of the monthly averages as provided by the international financial statistics of the IMF. The exchange rates used for Québec carbon prices are the ones provided on day of auction by the WCI.
10. In the factsheets, overall GHG emissions by sector may not add up due to rounding.
11. The following criteria are used to determine the three categories of the status of an ETS:
For the “Emissions Trading Worldwide Map”, the “Sector Coverage” and the “Growing Stability” graphic, we draw on data con-tained in the factsheets, the online version of the ICAP ETS Map (https://icapcarbonaction.com/en/ets-map), as well as news articles from the ICAP secretariat. For infographics involving quantitative data the following sources were used and calculations performed:
GLOBAL EXPANSION OF EMISSIONS TRADING01. Whenever available, we use the official and most recent cap data. When this data is unavailable or when systems operate without a cap, we use estimates of emissions from covered sectors.
02. In the case of the EU ETS, we exclude emissions covered under the aviation sector cap due to a lack of reliable data. In light of international developments of a global market-based regulation for aircraft emissions, the EU adjusted its treatment of the aviation sector, not applying the previously set cap to flights operating from or to non-EEA countries while continuing to apply the legislation to flights within and between countries in the EEA (see the EU ETS Factsheet for details). Excluding the aviation sector of the EU ETS thus leads to a more conservative estimate of the total global emissions covered by an ETS.
a. In force: ETS is in force with implementation established in the relevant regulation or legislation.b. Scheduled: A mandate for ETS is established, ETS rules are currently being drafted, an official launch date has been communicated.c. Under consideration: ETS is being considered as a potential mitigation instrument, the government or other relevant authorities have publicly sent signals regarding the development of an ETS.
Stat
us R
epor
t 201
9IC
AP
126
04AB
OU
T IC
AP
03. In the case of China, the year that its national ETS is expected to start to operate is based on the estimation according to the ‘Work Plan for Construction of the National Emissions Trading System (Power Sector)’ approved by the State Council in late 2017. There are still uncertainties and the start date may be subject to further change or delays.
04. There are two cases where an existing and a scheduled system regulate the same emissions. In those cases, we performed calculations to avoid double-counting:
05. Data on global emissions refers to CO2e excluding LULUCF; 2018 data is calculated based on figures for 2017, assuming 2.7% growth. Data has been retrieved from: Olivier and Peters (2018): Trends in Global CO2 and Total Greenhouse Gas Emissions, 2018 Report. PBL Netherlands Environmental Assessment Agency, The Hague.
06. The assumption of 2.7% growth in global emissions in 2018 is based on the best estimate of CO2 emissions by the Global Carbon Budget Project.
07. Percentages of global emissions covered are rounded to the nearest full percentage. They are slightly above 5% in 2005 and slightly above 8% in 2018.
08. Forecasts for emissions coverages of jurisdictions for 2020 are calculated based on systems’ future caps. This includes the projected caps for the scheduled systems of China, Mexico, Virginia and New Jersey. Mexican cap data were retrieved from Öko-Institut e.V.: Designing an Emissions Trading System in Mexico: Options for Setting an Emissions Cap. In those cases where no future caps are available the most recent cap is used.
a. MA-RGGI: Massachusetts’ system covers emissions from the electricity sector, just as RGGI does, thus it does not increase the total covered emissions.b. China-Chinese Pilots: Both the Chinese pilots and the China national ETS cover the power sector. In order to calculate the total emissions covered by the scheduled ETS in China, we have estimated the degree of power sector overlap between the national system and the pilots, and adjusted accordingly. For provincial power sector data we relied on: Qu, Shen, Sai Liang, and Ming Xu. "CO2 Emissions Embodied in Interprovincial Electricity Transmissions in China" Environmental Science & Technology 51, no. 18 (2017): 10893-10902. The study aggregates official power generation statistics and combines them with emission intensities for 2013 data yielding province-level power sector emission estimates. It indicates that in 2013, ~1/6 of Chinese power sector emissions came from provinces that now have a pilot system covering the power sector. Assuming this share has remained constant since, we adjusted the estimated total coverage of the Chinese national ETS (3.3 Gt CO2e – power sector only), meaning we assume that the Chinese national ETS has brought an additional 5/6 * 3.3Gt = 2.75 Gt CO2e under ETS regulation in China.
DIFFERENT SHAPES OF CAP-AND-TRADE01. Cap trajectory: The rate of decline in the cap is calculated for the period between 2016 and 2020. The cap trajectory for this period of time rather than for the latest available pair of successive years is calculated for reasons of robustness and validity of the results. The difference between the 2020 amount of allowances compared to the 2016 cap is expressed as the average percentage reduction in this time period. The data denotes annual caps and is thus not a direct measure of allowances released in this year, given that this can also be affected by vintage years, reserves and other instruments. The New Zealand ETS does not feature a system-specific cap, but is rather aligned to international targets under the UNFCCC, making it incomparable in this metric.
02. Coverage: The figures for coverage indicate the percentage of the respective economy’s total emissions that is covered by the ETS. The data is retrieved from the factsheets published in this report and refers to the latest emissions coverage figures available for each system.
03. Carbon Price: For the EU ETS, the carbon price is the average of all 2018 spot prices (settlement prices) at the European Energy Exchange converted to USD. Prices for Switzerland represent an average of the “hammer price” from the biannual competitive auctions and are then converted to USD. For RGGI and WCI, the clearing prices of all auctions conducted in 2018 are averaged, with conversion to price per metric tonne in the case of RGGI (where short tons are the standard unit). For the Korean and New Zealand systems, prices are based on average end-of-day trading prices on second- ary-market exchanges in 2018 and converted to USD.
04. Share of allowances not provided freely: This figure indicates the proportion of allowances that must be acquired at auction or elsewhere.
05. California presents a difficult boundary case as it simultaneously features characteristics of free allowances for utilities at the receiving side and characteristics of regularly auctioned allowances seen from the distributing side. Since our prime interest with this metric is illustrating the share of allowances for which a carbon price has to be paid (rather than existing as an opportunity cost), we treat consignment allowances as if they were not provided freely. We thereby take into consideration that most utilities cannot simply use the consignment allowances for their own compliance and revenue usage is mandated to benefit rate-payers.
06. The New Zealand ETS has so far not had an auctioning mechanism. However, this is not equivalent with a free provision of all allowances – most supply comes from sources such as domestic forestry removals or privately held banked units. For New Zealand this metric is calculated as the proportion of freely allocated allowances for Emissions Intensive and Trade Exposed (EITE) activities in 2017 compared to the total system-wide compliance obligation for that year.
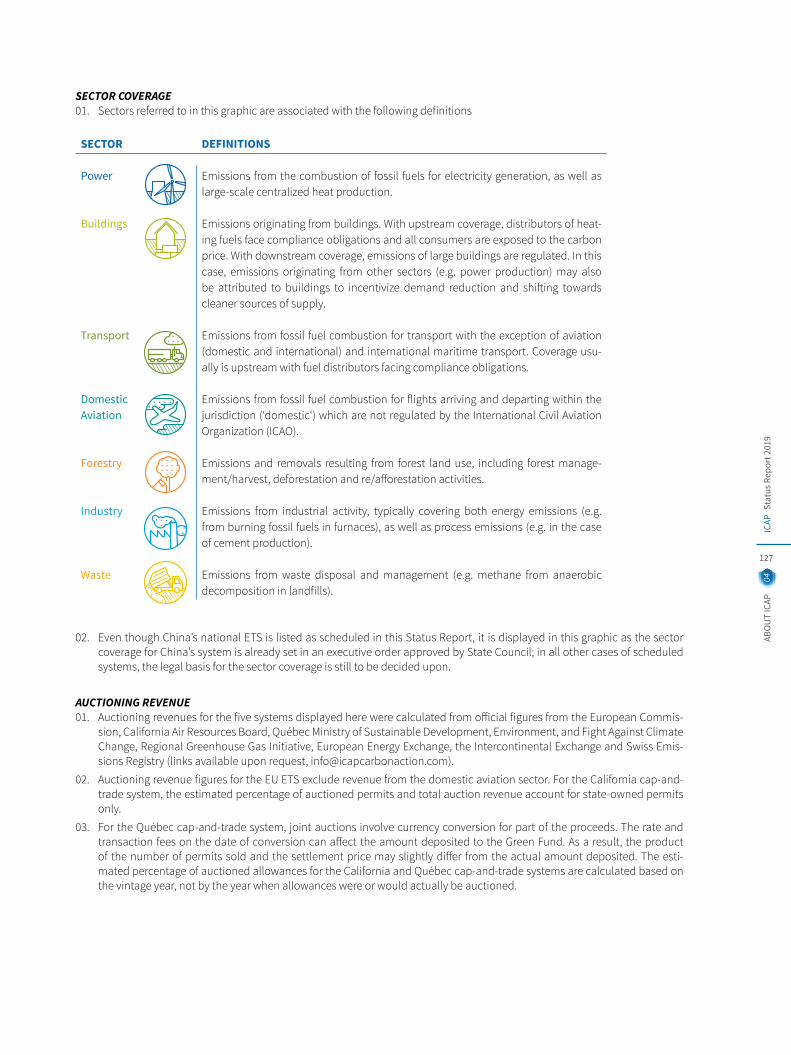
04AB
OU
T IC
APSt
atus
Rep
ort 2
019
ICAP
127
SECTOR COVERAGE01. Sectors referred to in this graphic are associated with the following definitions
02. Even though China’s national ETS is listed as scheduled in this Status Report, it is displayed in this graphic as the sector coverage for China’s system is already set in an executive order approved by State Council; in all other cases of scheduled systems, the legal basis for the sector coverage is still to be decided upon.
AUCTIONING REVENUE01. Auctioning revenues for the five systems displayed here were calculated from official figures from the European Commis- sion, California Air Resources Board, Québec Ministry of Sustainable Development, Environment, and Fight Against Climate Change, Regional Greenhouse Gas Initiative, European Energy Exchange, the Intercontinental Exchange and Swiss Emis- sions Registry (links available upon request, [email protected]).
02. Auctioning revenue figures for the EU ETS exclude revenue from the domestic aviation sector. For the California cap-and- trade system, the estimated percentage of auctioned permits and total auction revenue account for state-owned permits only.
03. For the Québec cap-and-trade system, joint auctions involve currency conversion for part of the proceeds. The rate and transaction fees on the date of conversion can affect the amount deposited to the Green Fund. As a result, the product of the number of permits sold and the settlement price may slightly differ from the actual amount deposited. The esti- mated percentage of auctioned allowances for the California and Québec cap-and-trade systems are calculated based on the vintage year, not by the year when allowances were or would actually be auctioned.
SECTOR DEFINITIONS
Power Emissions from the combustion of fossil fuels for electricity generation, as well as large-scale centralized heat production.
Buildings Emissions originating from buildings. With upstream coverage, distributors of heat-ing fuels face compliance obligations and all consumers are exposed to the carbon price. With downstream coverage, emissions of large buildings are regulated. In this case, emissions originating from other sectors (e.g. power production) may also be attributed to buildings to incentivize demand reduction and shifting towards cleaner sources of supply.
Transport Emissions from fossil fuel combustion for transport with the exception of aviation (domestic and international) and international maritime transport. Coverage usu-ally is upstream with fuel distributors facing compliance obligations.
Domestic Aviation
Emissions from fossil fuel combustion for flights arriving and departing within the jurisdiction (‘domestic‘) which are not regulated by the International Civil Aviation Organization (ICAO).
Forestry Emissions and removals resulting from forest land use, including forest manage-ment/harvest, deforestation and re/afforestation activities.
Industry Emissions from industrial activity, typically covering both energy emissions (e.g. from burning fossil fuels in furnaces), as well as process emissions (e.g. in the case of cement production).
Waste Emissions from waste disposal and management (e.g. methane from anaerobic decomposition in landfills).
128
Stat
us R
epor
t 201
9IC
AP
Assembly Bill Agriculture, Forestry and other Land UseAllowances in CirculationAmerican National Standards InstituteAllowance Price Containment Reserve Business as UsualBoard of Public UtilitiesRio de Janeiro Green Stock ExchangeCanadian DollarCalifornia Air Resources BoardChinese Certified Emission ReductionCost Containment ReserveCarbon Capture and StorageClean Development Mechanism Certified Emission ReductionsMethaneSwiss FrancCoordinating Ministry for Economic AffairsChinese Yuan RenminbiCarbon DioxideCarbon Offsetting and Reduction Schemefor International AviationCarbon Pricing in the AmericasDirect Environmental BenefitsDepartment of Environmental ProtectionOregon Department of Environmental QualityDistrict Heat and CoolingDevelopment and Reform CommissionEnvironment and Climate Change CanadaEmissions Containment Reserve European Economic AreaEnergy-Intensive and Trade-ExposedEmissions Reduction UnitsEmissions Trading System or Emissions Trading SchemeEuropean UnionEuroFujian Forestry Certified Emission ReductionFundação Getúlio VargasFiscal YearFive Year PlanGross Domestic ProductGreenhouse GasDeutsche Gesellschaft für Internationale Zusam-menarbeit (German Society for International Cooperation)
ABAFOLUAICANSIAPCRBAUBPUBVRioCADCARBCCERCCRCCSCDMCERCH4
CHFCMEACNYCO2
CORSIA
CPADEBDEPDEQDHCDRCECCCECREEAEITEERUETS
EUEURFFCERFGVFYFYPGDPGHGGIZ
List of acronyms
GVCes
HFCsHFC-23ICAOICAPINDCKCUsKETSKRWLDCsLGCCLNGLULUCFJIMassDEP
MBIMEEMEPMMCMOEMOUMOSTMRVMSRMtCO2e
MWMWeN2ONOxNAMANDCNDRCNF3
NO2
NZNZDNZUsOTCPFCsPHCERPMR
Centro de Estudos em Sustentabilidade da Fundação Getúlio Vargas (Center for Sustainability Studies)
HydrofluorocarbonFluoroformInternational Civil Aviation Organization International Carbon Action PartnershipIntended Nationally Determined ContributionKorean Credit UnitsKorean Emissions Trading SchemeSouth Korean WonLeast Developed CountriesLey General de Cambio Climatico (Mexico’s General Law on Climate Change)Liquefied Natural GasLand Use, Land-Use Change and ForestryJoint ImplementationMassachusetts’ Department of Environmental ProtectionMarket-based InstrumentMinistry of Ecology and EnvironmentMinistry of Environmental ProtectionMine Methane CaptureMinistry of EnvironmentMemorandum of UnderstandingMinistry of Strategy and FinanceMonitoring, Reporting and VerificationMarket Stability ReserveMillion Metric Tonnes of Carbon Dioxide Equivalent MegawattMegawatt EquivalentNitrous OxideNitrogen OxideNationally Appropriate Mitigation ActionsNationally Determined ContributionNational Development Reform CommissionNitrogen TrifluorideNitrogen DioxideNew ZealandNew Zealand DollarNew Zealand UnitsOver the CounterPerfluorocarbonPu Hui Certified Emission ReductionsPartnership for Market Readiness
Stat
us R
epor
t 201
9IC
AP
129
Programa Nacional de Cupos Transables de Emisión de Gases de Efecto Invernadero
(National Program of Greenhouse Gas Tradable Emission Quotas)
Reformulated Blendstock for Oxygenate BlendingRegistro Nacional de Emisiones (Mexico National Emissions Register)Regional Greenhouse Gas InitiativeStandards Council of CanadaSecretaría de Medio Ambiente y Recursos Naturales (Ministry of Environment and Natural Resources)Sulfur FluorideShanghai Emission Allowance ForwardSulfur DioxideState Owned EnterpriseTonne of Coal EquivalentTransportation and Climate InitiativeTonne of Carbon DioxideTonne of Carbon Dioxide EquivalentTaiwanese Environmental Protection Adminis-tration
Thailand Greenhouse Gas Management Orga-nization
Tokyo Metropolitan GovernmentTarget Management SchemeUnited Nations Framework Convention on Climate Change
US DollarUS Environment Protection AgencyThailand Voluntary Emissions Trading SchemeWestern Climate Initiative
PNCTE
RBOB
RENE
RGGISCCSEMARNAT
SF6
SHEAFSO2
SOEtceTCItCO2
tCO2eTEPA
TGO
TMGTMSUNFCCC
USDUS EPAV-ETSWCI
130
Stat
us R
epor
t 201
9IC
AP
IMPRINT
Publication DateMarch 2019
DesignSimpelpluswww.simpelplus.de
PrintingRuksaldruck
PhotosCover: Tobias Tullius on Unsplash, content in chronological order: Nahil Naseer on Unsplash, Derek Story on Unsplash, Pascal Brandle on Unsplash, Sonaal Bangera on Unsplash, Alexandre Chambon on Unsplash, Asoggetti on Unsplash, Conor Sex-ton on Unsplash, Elizabeth Lies on Unsplash, Luca Dugaro on Unsplash,
DisclaimerThis report was prepared by the ICAP Secretariat.
The findings and opinions expressed in this report are the sole responsibility of the authors. They do not necessarily reflect the views of ICAP or its members. Dupli-cation, processing, distribution or any form of commercialization of such material beyond the scope of the respective copyright law requires the prior written consent of its author or creator.
The data used in this report reflects the global state of play at the time of writing in March 2019. Although the information contained in the report was assembled with the utmost care, updated and/or additional information may have been released by the time of printing, the ICAP Secretariat cannot be held liable for the timeliness, correctness, or completeness of the information provided.
For any corrections, additions or other comments on the content of this report, including relevant citations, please contact the ICAP Secretariat at [email protected].

International Carbon Action Partnership
www.icapcarbonaction.com