Embed Size (px)
Citation preview
Status of the Southeastern Bering Sea– Upper Trophic Level and Aggregate Indicators
Linking Ecosystem-Based Management Goals with
Ecosystem Research
Fisheries And The
Environment
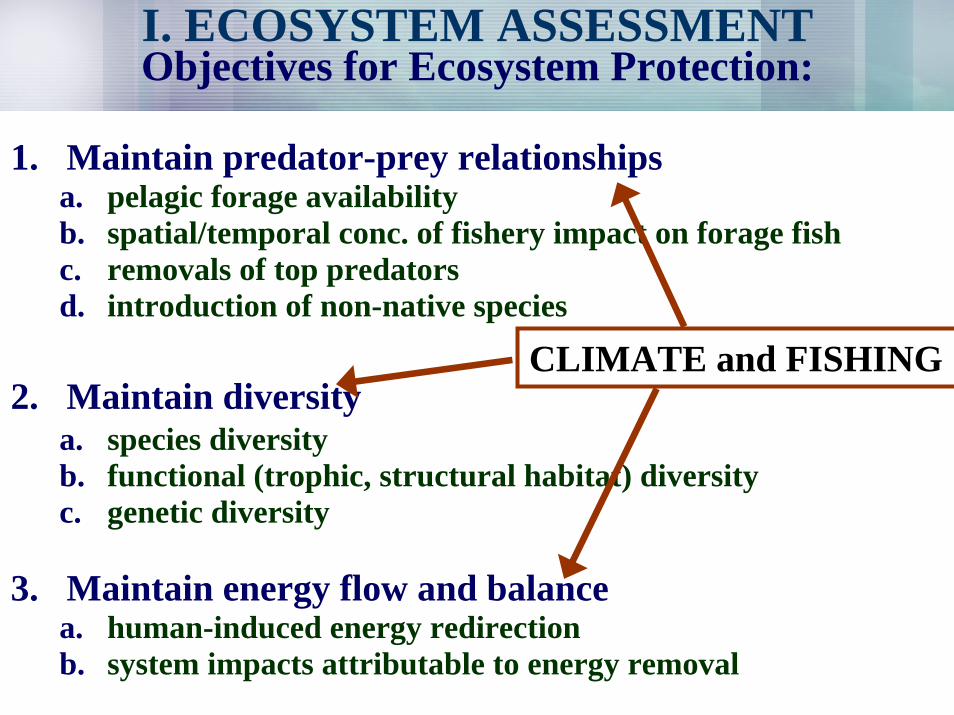
I. ECOSYSTEM ASSESSMENTObjectives for Ecosystem Protection:
1. Maintain predator-prey relationships a. pelagic forage availabilityb. spatial/temporal conc. of fishery impact on forage fishc. removals of top predatorsd. introduction of non-native species
2. Maintain diversitya. species diversityb. functional (trophic, structural habitat) diversityc. genetic diversity
3. Maintain energy flow and balancea. human-induced energy redirectionb. system impacts attributable to energy removal
CLIMATE and FISHING
20042003200220012000199919981997199619951994199319921991199019891988198719861985198419831982198119801979197819771976197519741973197219711970Year
199BSPelagic Trawl Duration
199BS Bottom Trawl Duration
199AI Bottom Trawl Duration
199Hook and Line Effort
198Summer Bottom Temp.
197FHS (R/S)
197Rock sole (R/S)
197ATF (R/S)
197GT (R/S)
197Northerns (R/S)
196POP (R/S)
196YFS (R/S)
197RLKI Productivity
197TBMU Productivity
197BLKI Productivity
198Total crab biomass
198BS Richness
196Pollock (R/S)
197Cod (R/S)
197AK Plaice (R/S)
198Jellyfish biomass
198BS Diversity
198Total CPUE
197Atka (R/S)
195AOI
197COMU Productivity
197May SST
197Herring recruits
190PDO
190Total salmon catch
191Surface Winter Air Temp.
196AI Trophic level of catch
195Ice Cover Index
195BS Trophic level of catch
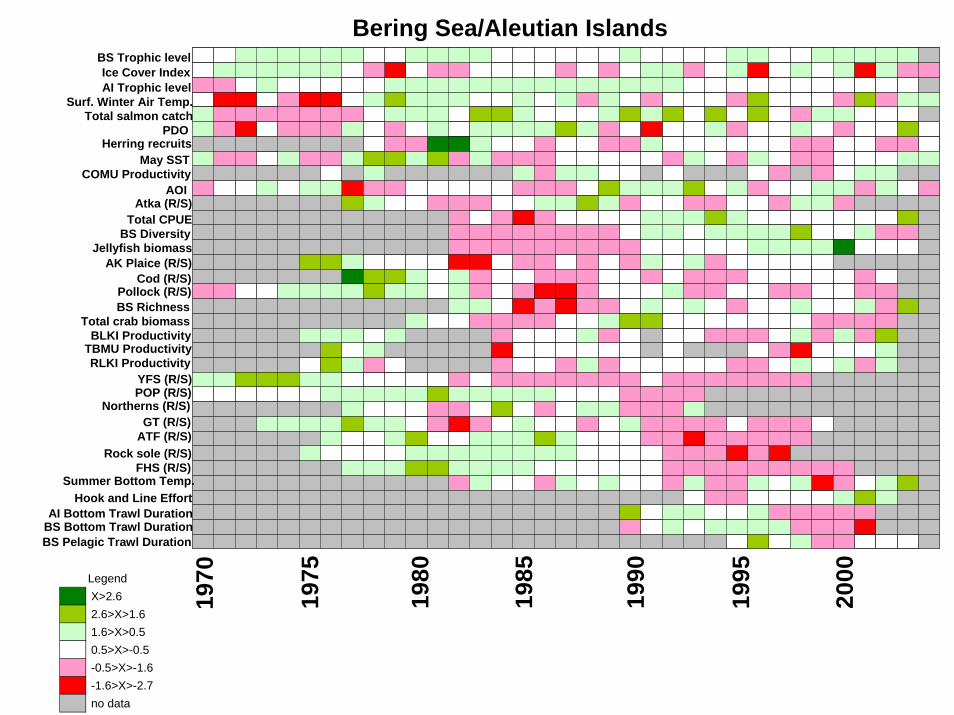
Bering Sea/Aleutian Islands
1995
2000
1990
1985
1980
1975
1970 Legend
X>2.6 2.6>X>1.6 1.6>X>0.5 0.5>X>-0.5 -0.5>X>-1.6 -1.6>X>-2.7 no data
BS Pelagic Trawl DurationBS Bottom Trawl DurationAI Bottom Trawl Duration
Hook and Line EffortSummer Bottom Temp.
FHS (R/S)Rock sole (R/S)
ATF (R/S)GT (R/S)
Northerns (R/S)POP (R/S)YFS (R/S)
RLKI ProductivityTBMU ProductivityBLKI Productivity
Total crab biomassBS RichnessPollock (R/S)
Cod (R/S)AK Plaice (R/S)
Jellyfish biomassBS Diversity
Total CPUEAtka (R/S)
AOI COMU Productivity
May SSTHerring recruits
PDOTotal salmon catch
Surf. Winter Air Temp.AI Trophic levelIce Cover Index
BS Trophic level
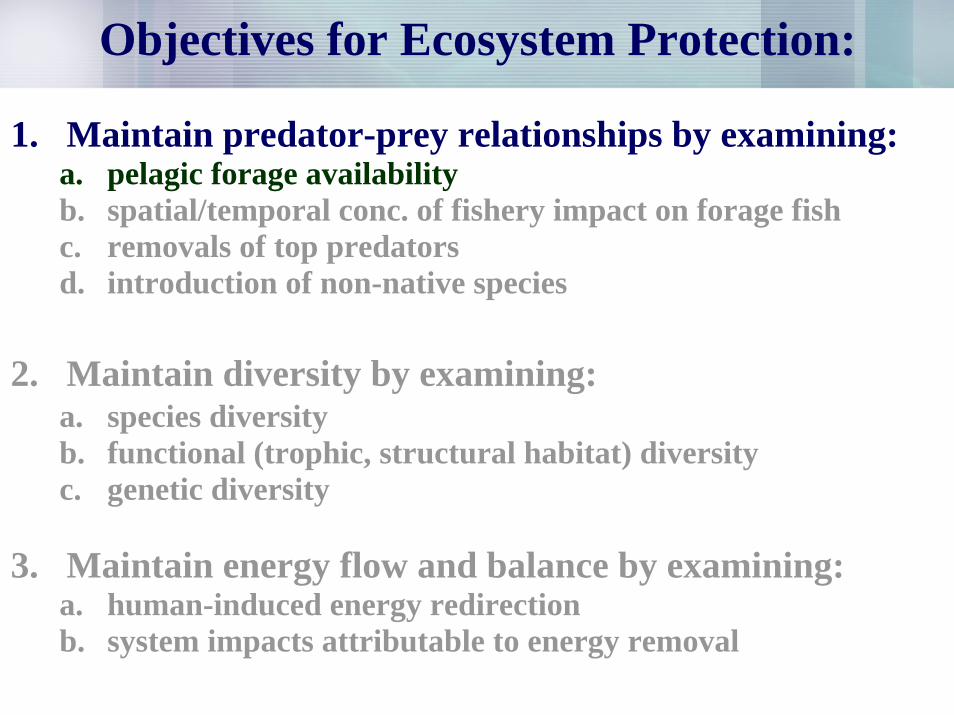
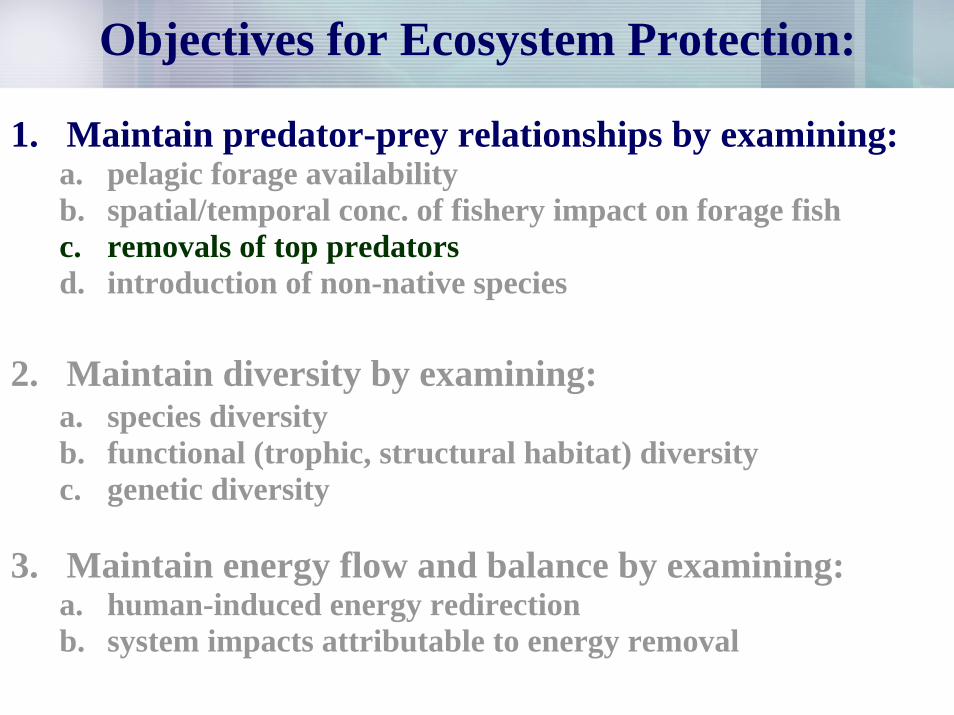
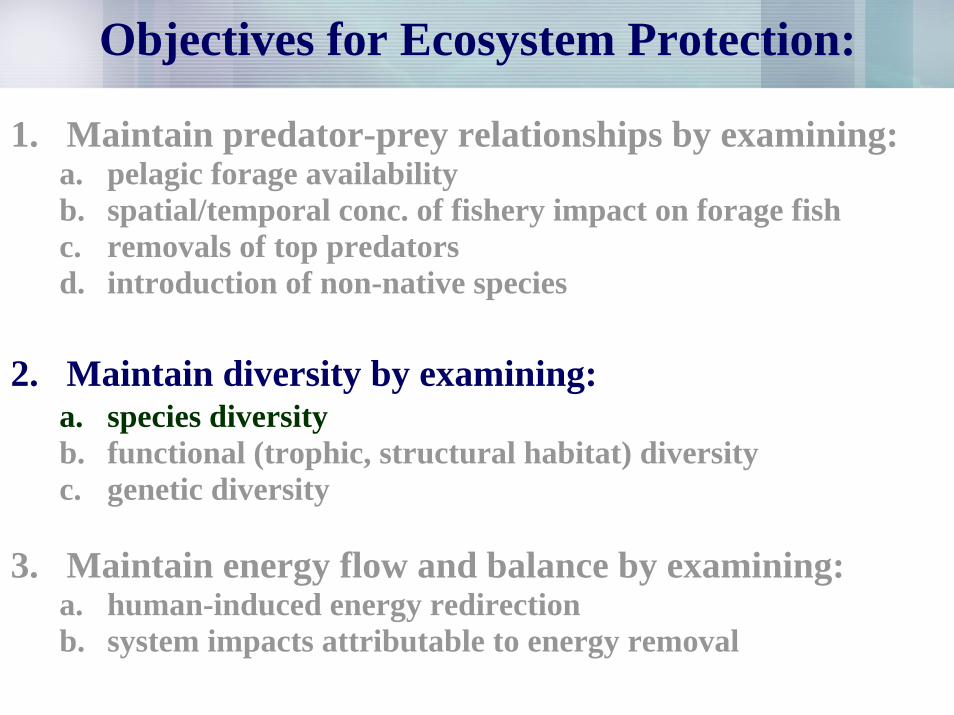
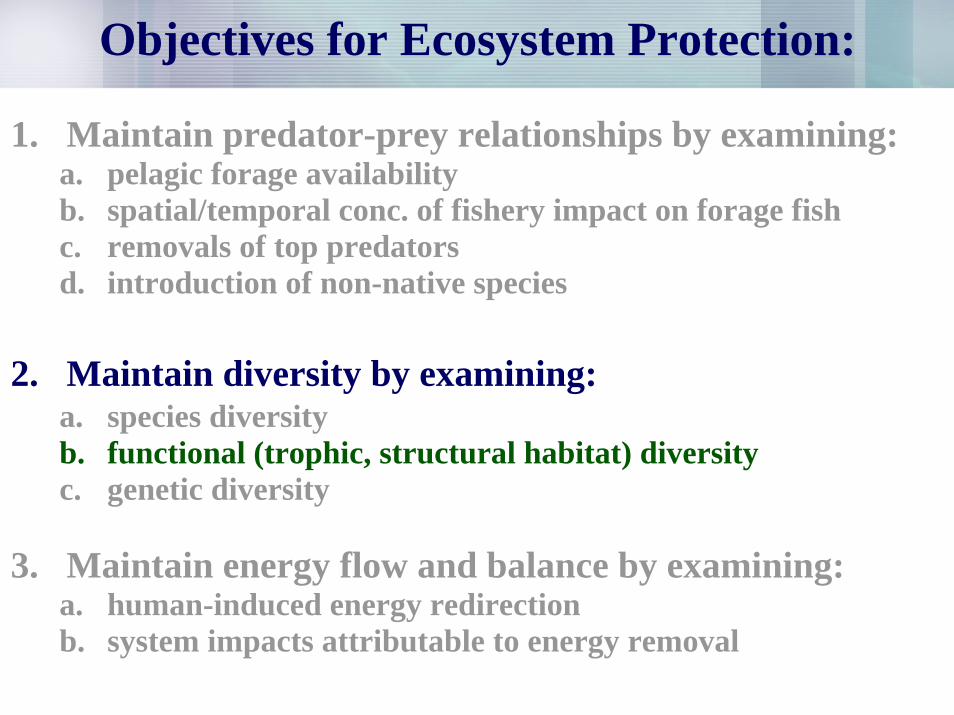
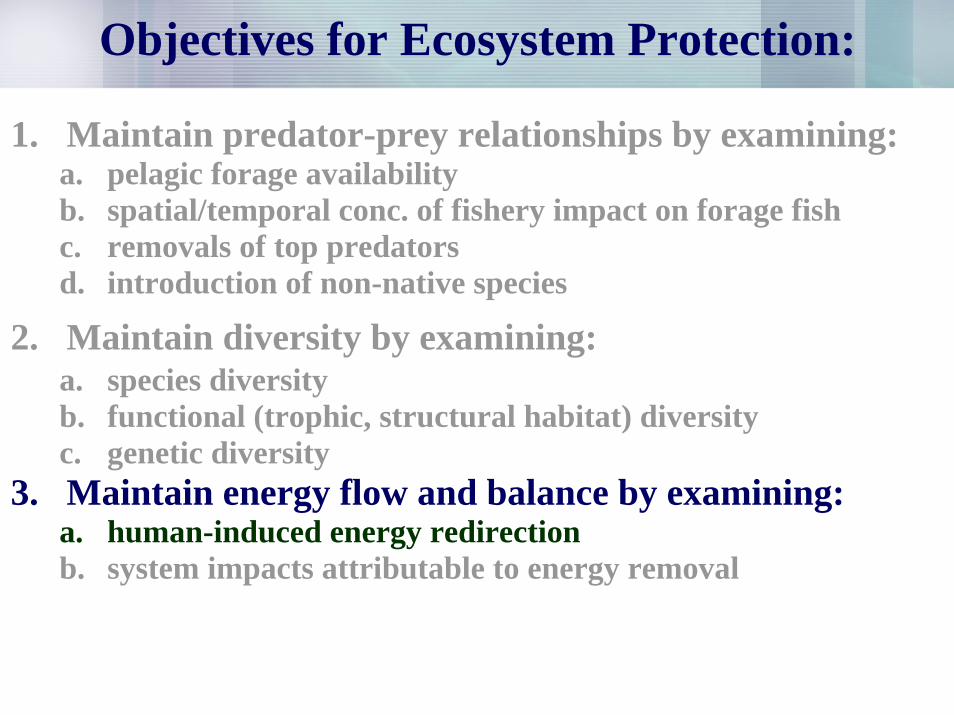
Objectives for Ecosystem Protection:
1. Maintain predator-prey relationships by examining:a. pelagic forage availabilityb. spatial/temporal conc. of fishery impact on forage fishc. removals of top predatorsd. introduction of non-native species
2. Maintain diversity by examining:a. species diversityb. functional (trophic, structural habitat) diversityc. genetic diversity
3. Maintain energy flow and balance by examining:a. human-induced energy redirectionb. system impacts attributable to energy removal
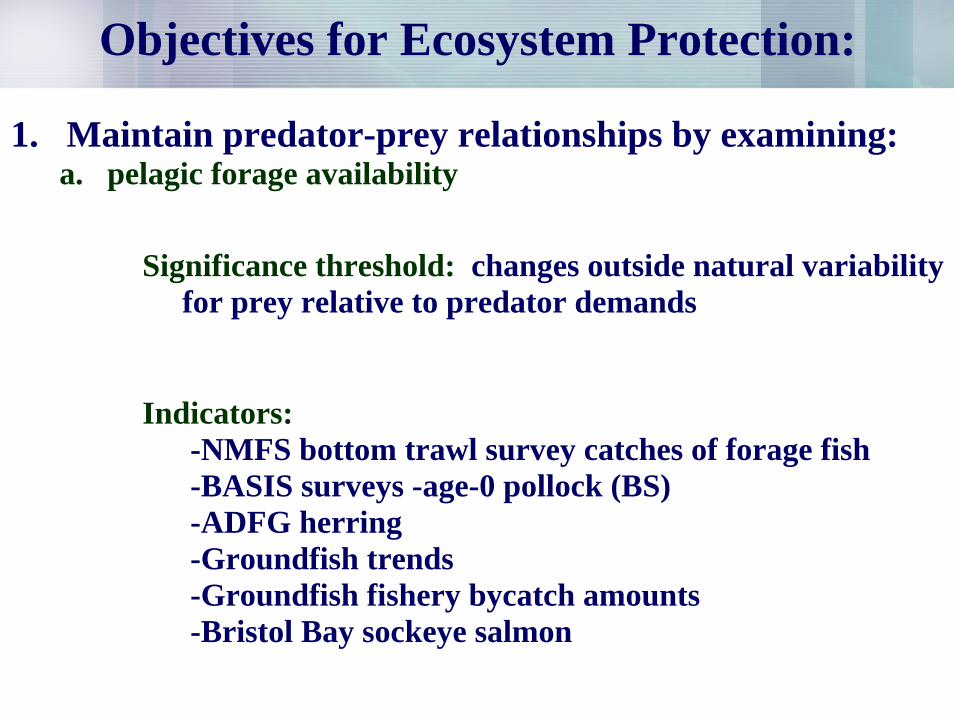
Objectives for Ecosystem Protection:
1. Maintain predator-prey relationships by examining:a. pelagic forage availability
Significance threshold: changes outside natural variability for prey relative to predator demands
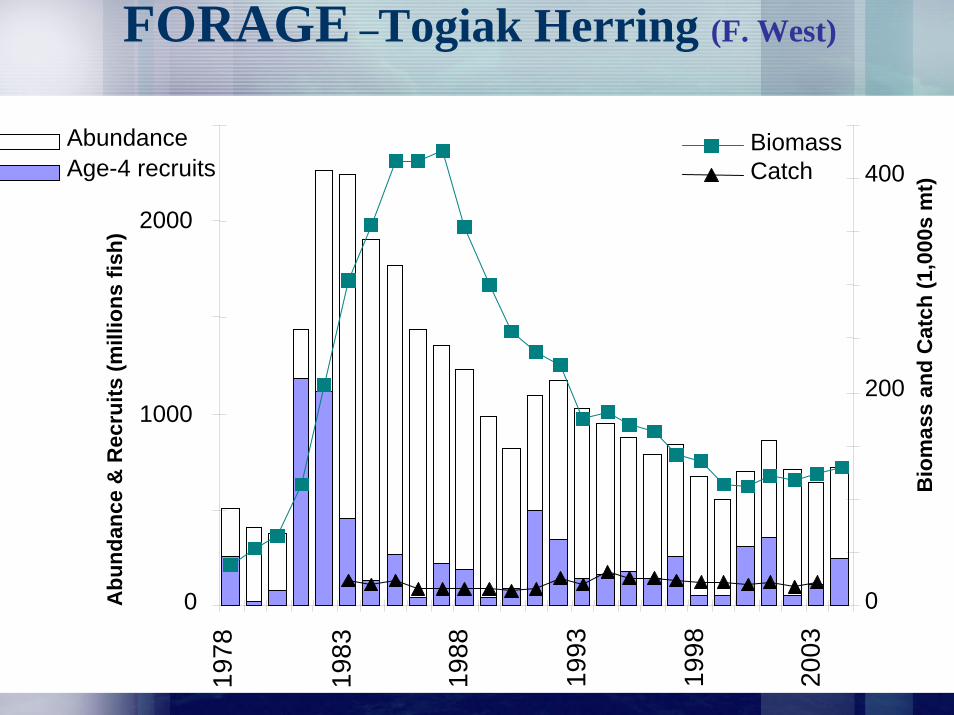
Indicators:-NMFS bottom trawl survey catches of forage fish-BASIS surveys -age-0 pollock (BS) -ADFG herring-Groundfish trends-Groundfish fishery bycatch amounts-Bristol Bay sockeye salmon
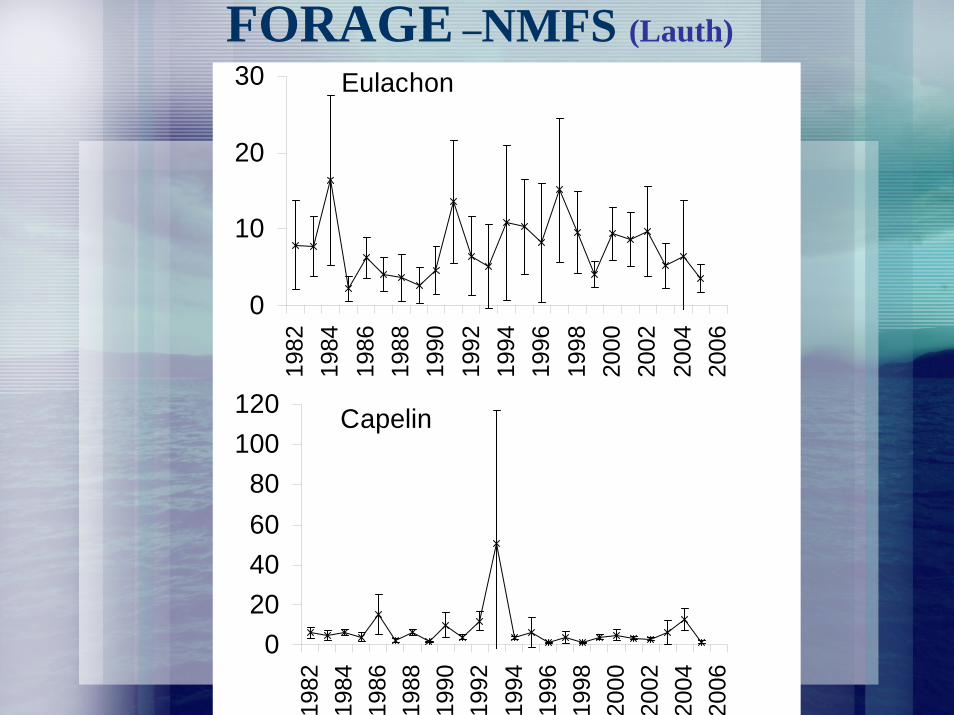
Eulachon
0
10
20
30
1982
1984
1986
1988
1990
1992
1994
1996
1998
2000
2002
2004
2006
Capelin
020406080
100120
1982
1984
1986
1988
1990
1992
1994
1996
1998
2000
2002
2004
2006
FORAGE –NMFS (Lauth)
0
1000
200019
78
1983
1988
1993
1998
2003
0
200
400AbundanceAge-4 recruits
BiomassCatch
Abu
ndan
ce &
Rec
ruits
(mill
ions
fish
)
Bio
mas
s an
d C
atch
(1,0
00s
mt)
FORAGE –Togiak Herring (F. West)
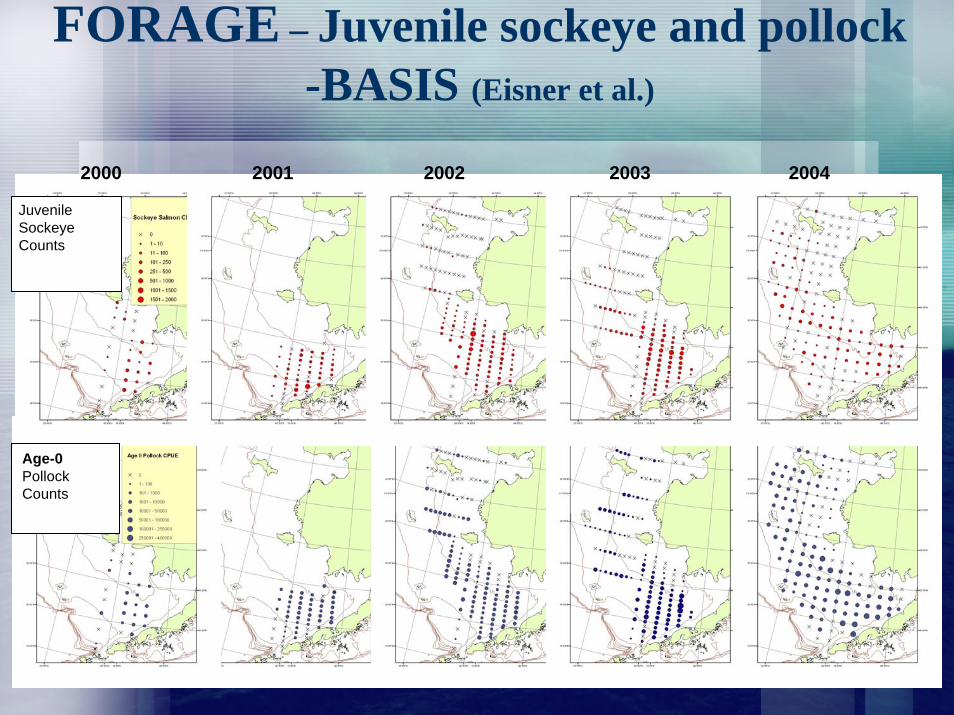
JuvenileSockeyeCounts
2000 2001 2002 2003 2004
Age-0PollockCounts
FORAGE – Juvenile sockeye and pollock-BASIS (Eisner et al.)
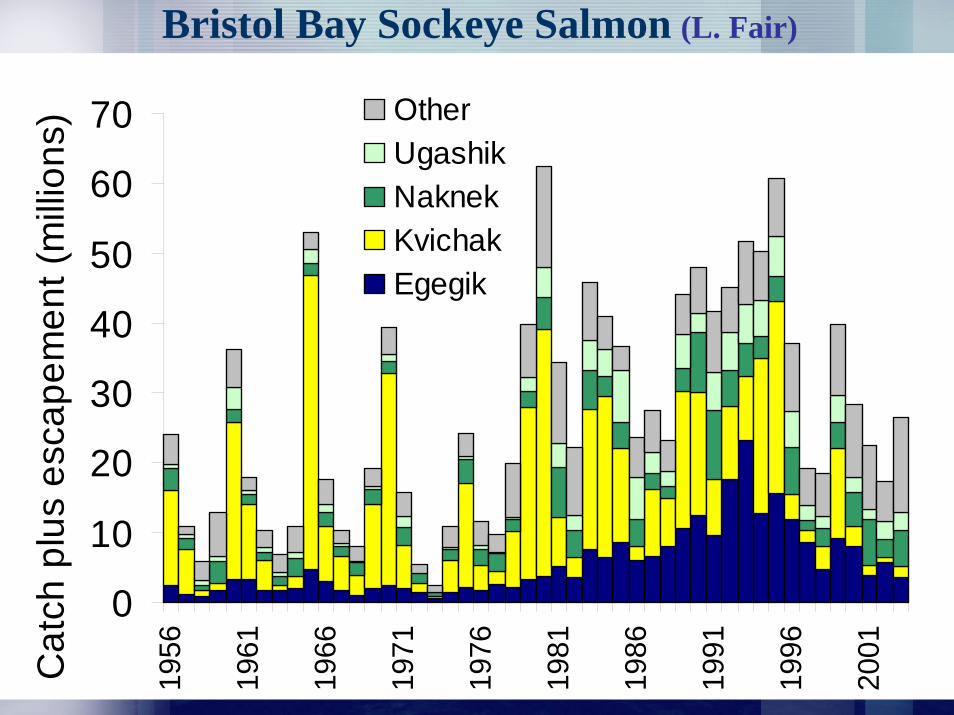
Bristol Bay Sockeye Salmon (L. Fair)
0
10
20
30
40
50
60
7019
56
1961
1966
1971
1976
1981
1986
1991
1996
2001Cat
ch p
lus
esca
pem
ent (
milli
ons) Other
UgashikNaknekKvichakEgegik
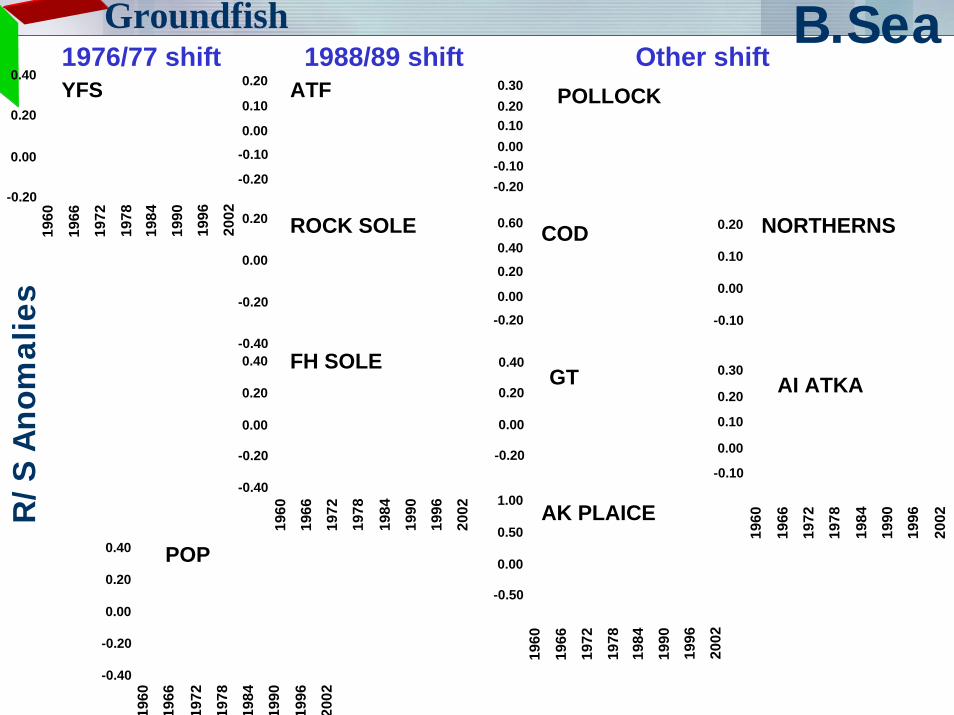
POLLOCK
-0.20-0.100.000.100.200.30
COD
-0.20
0.00
0.20
0.40
0.60
GT
-0.20
0.00
0.20
0.40
ATF
-0.20
-0.10
0.00
0.10
0.20
ROCK SOLE
-0.40
-0.20
0.00
0.20 NORTHERNS
-0.10
0.00
0.10
0.20
YFS
-0.20
0.00
0.20
0.40
1960
1966
1972
1978
1984
1990
1996
2002
FH SOLE
-0.40
-0.20
0.00
0.20
0.40
1960
1966
1972
1978
1984
1990
1996
2002
POP
-0.40
-0.20
0.00
0.20
0.40
1960
1966
1972
1978
1984
1990
1996
2002
AI ATKA
-0.10
0.00
0.10
0.20
0.30
1960
1966
1972
1978
1984
1990
1996
2002
1976/77 shift 1988/89 shift Other shift
AK PLAICE
-0.50
0.00
0.50
1.00
1960
1966
1972
1978
1984
1990
1996
2002
R/S
An
omal
ies
Groundfish B.Sea
-0.5
0.0
0.5
1.0
1970
1972
1974
1976
1978
1980
1982
1984
1986
1988
1990
1992
1994
1996
1998
2000
2002
-1.0
-0.5
0.0
0.5
1.0
1970
1972
1974
1976
1978
1980
1982
1984
1986
1988
1990
1992
1994
1996
1998
2000
2002
-0.5
0.0
0.5
1970
1972
1974
1976
1978
1980
1982
1984
1986
1988
1990
1992
1994
1996
1998
2000
2002
-1.0
-0.5
0.0
0.5
1.0
1970
1972
1974
1976
1978
1980
1982
1984
1986
1988
1990
1992
1994
1996
1998
2000
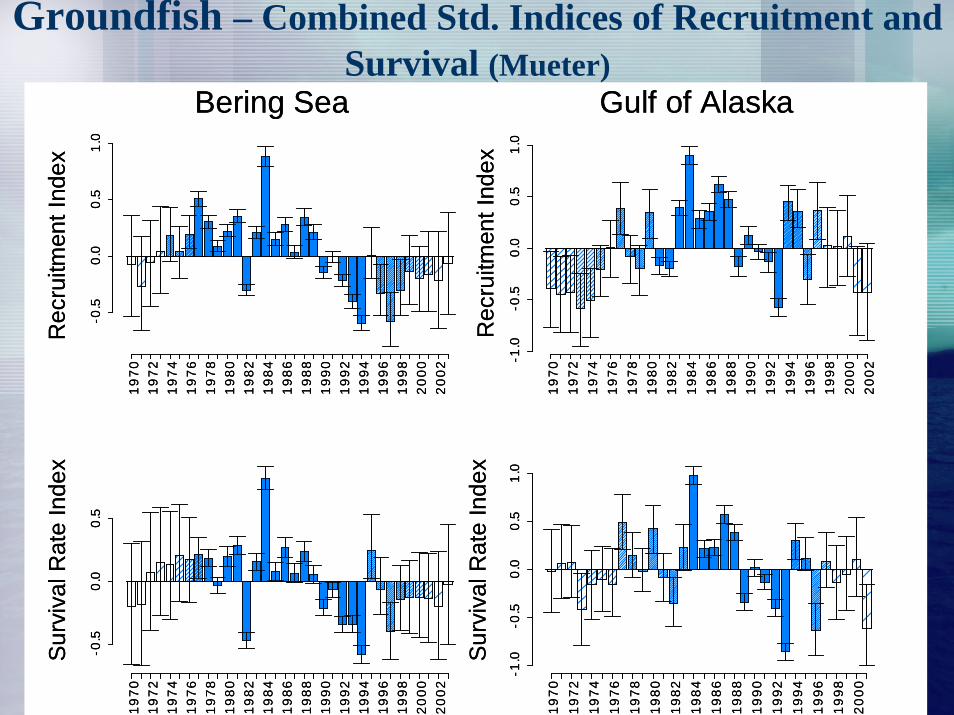
Bering Sea Gulf of AlaskaS
urvi
val R
ate
Inde
x
Rec
ruitm
ent I
ndex
Sur
viva
l Rat
e In
dex
Rec
ruitm
ent I
ndex
-0.5
0.0
0.5
1.0
1970
1972
1974
1976
1978
1980
1982
1984
1986
1988
1990
1992
1994
1996
1998
2000
2002
-1.0
-0.5
0.0
0.5
1.0
1970
1972
1974
1976
1978
1980
1982
1984
1986
1988
1990
1992
1994
1996
1998
2000
2002
-0.5
0.0
0.5
1970
1972
1974
1976
1978
1980
1982
1984
1986
1988
1990
1992
1994
1996
1998
2000
2002
-1.0
-0.5
0.0
0.5
1.0
1970
1972
1974
1976
1978
1980
1982
1984
1986
1988
1990
1992
1994
1996
1998
2000
Bering Sea Gulf of AlaskaS
urvi
val R
ate
Inde
x
Rec
ruitm
ent I
ndex
Sur
viva
l Rat
e In
dex
Rec
ruitm
ent I
ndex
Groundfish – Combined Std. Indices of Recruitment and Survival (Mueter)
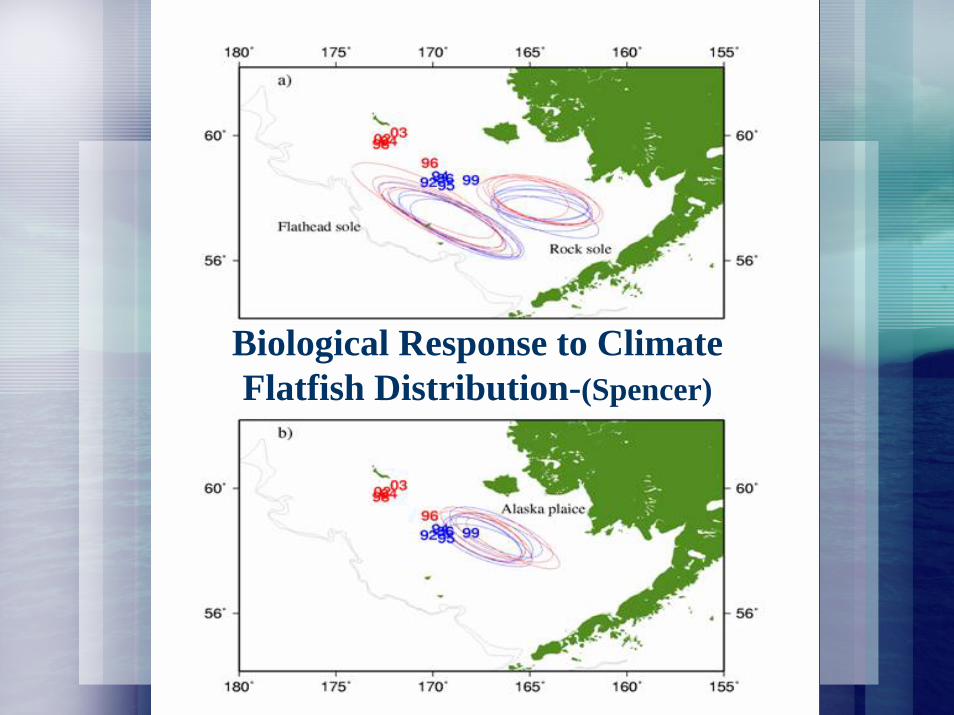
Biological Response to Climate Flatfish Distribution-(Spencer)
Objectives for Ecosystem Protection:
1. Maintain predator-prey relationships by examining:a. pelagic forage availabilityb. spatial/temporal conc. of fishery impact on forage fishc. removals of top predatorsd. introduction of non-native species
2. Maintain diversity by examining:a. species diversityb. functional (trophic, structural habitat) diversityc. genetic diversity
3. Maintain energy flow and balance by examining:a. human-induced energy redirectionb. system impacts attributable to energy removal
Significance threshold: catches high enough to cause biomass of top predator(s) to fall below min. biol. acceptable limits
Indicators:-Trophic level of the catch-Population status of top predators-Fishing takes of top predators-Seabird incidental take
Tota
l cat
ch (1
000
t) 4
0
1,000
2,000
1
2
3
Trop
hic
leve
l cat
ch
0.0
1.0
2.0
3.0
FIB
Inde
x
1960
1970
1980
1990
2000 1960
1970
1980
1990
2000
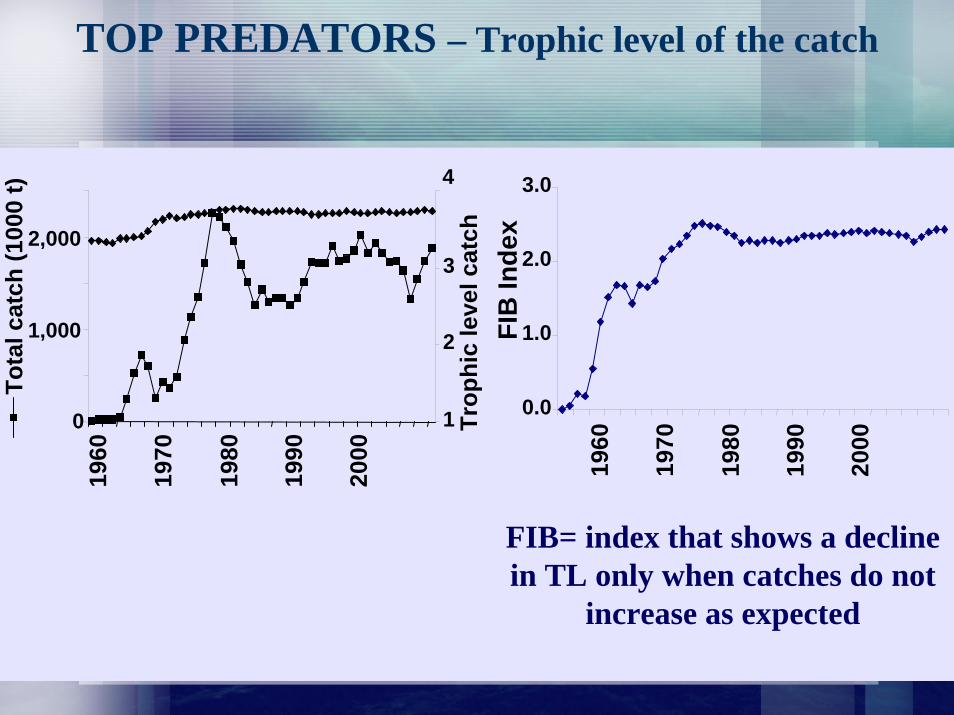
TOP PREDATORS – Trophic level of the catch
FIB= index that shows a decline in TL only when catches do not
increase as expected
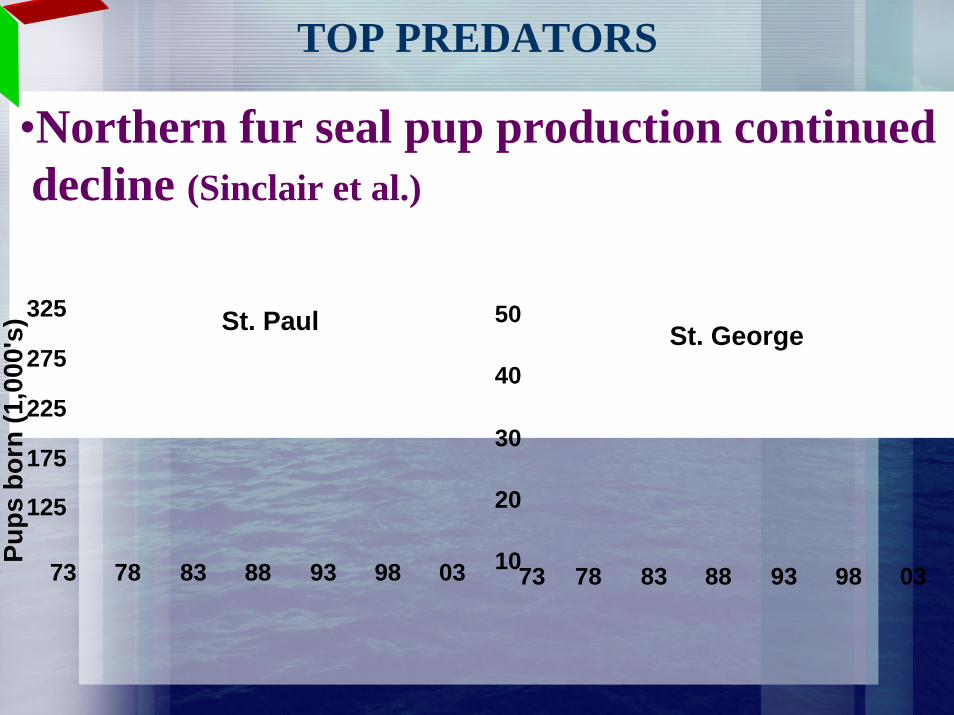
•Northern fur seal pup production continued decline (Sinclair et al.)
Pups
bor
n (1
,000
's) St. George
10
20
30
40
50
73 78 83 88 93 98 03
St. Paul
125
175
225
275
325
73 78 83 88 93 98 03
TOP PREDATORS
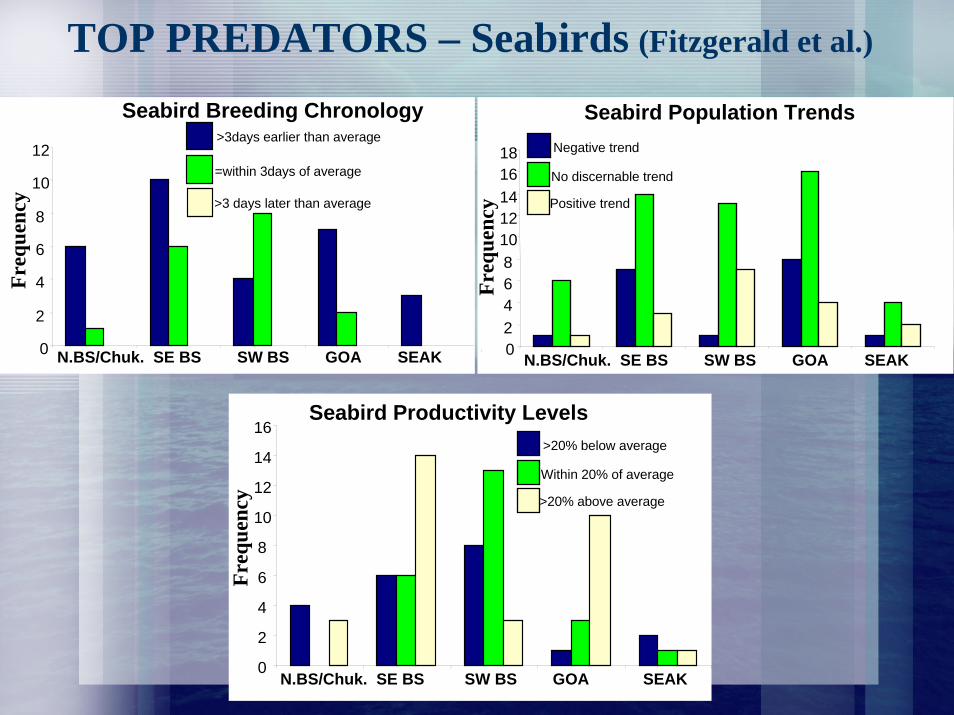
TOP PREDATORS – Seabirds (Fitzgerald et al.)
Seabird Breeding Chronology
0
2
4
6
8
10
12>3days earlier than average
=within 3days of average
>3 days later than average
Freq
uenc
y
N.BS/Chuk. SE BS SW BS GOA SEAK
Seabird Population Trends
024681012141618 Negative trend
No discernable trend
Positive trend
Freq
uenc
y
N.BS/Chuk. SE BS SW BS GOA SEAK
Seabird Productivity Levels
0
2
4
6
8
10
12
14
16>20% below average
Within 20% of average
>20% above average
Freq
uenc
y
N.BS/Chuk. SE BS SW BS GOA SEAK
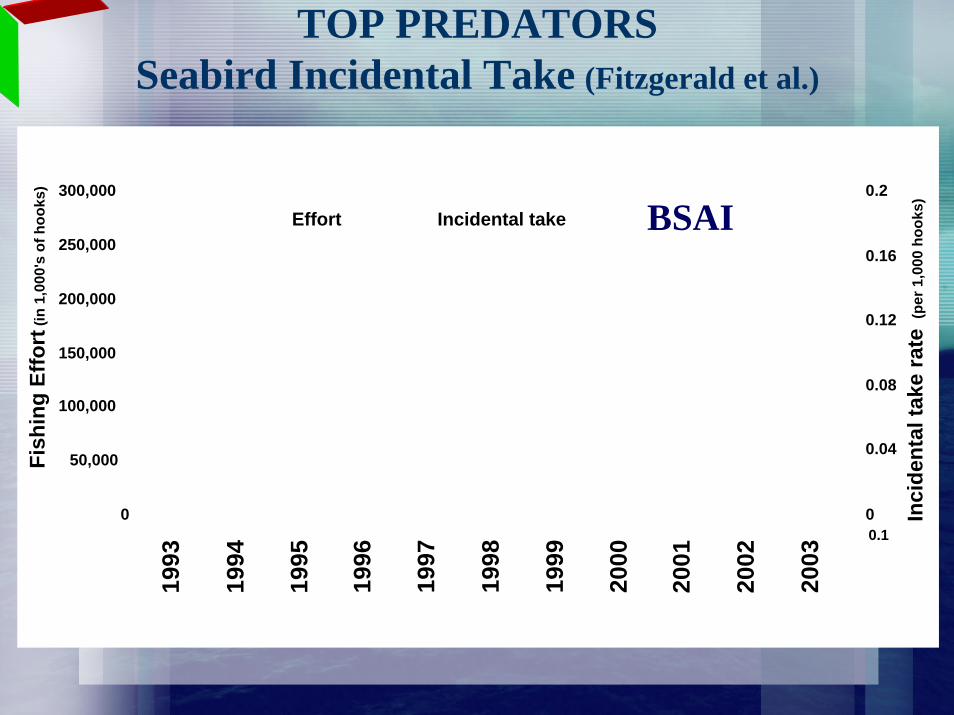
Fish
ing
Effo
rt(in
1,0
00's
of h
ooks
)
Inci
dent
al ta
ke ra
te (
per 1
,000
hoo
ks)
1993
1994
1995
1996
1997
1998
1999
2000
2001
2002
2003
BSAI
0.10
50,000
100,000
150,000
200,000
250,000
300,000
0
0.04
0.08
0.12
0.16
0.2
Effort Incidental take
TOP PREDATORSSeabird Incidental Take (Fitzgerald et al.)
0
50,000
100,000
150,000
200,000
250,000
300,000
350,000
400,000
1980
1982
1984
1986
1988
1990
1992
1994
1996
1998
2000
2002
2004
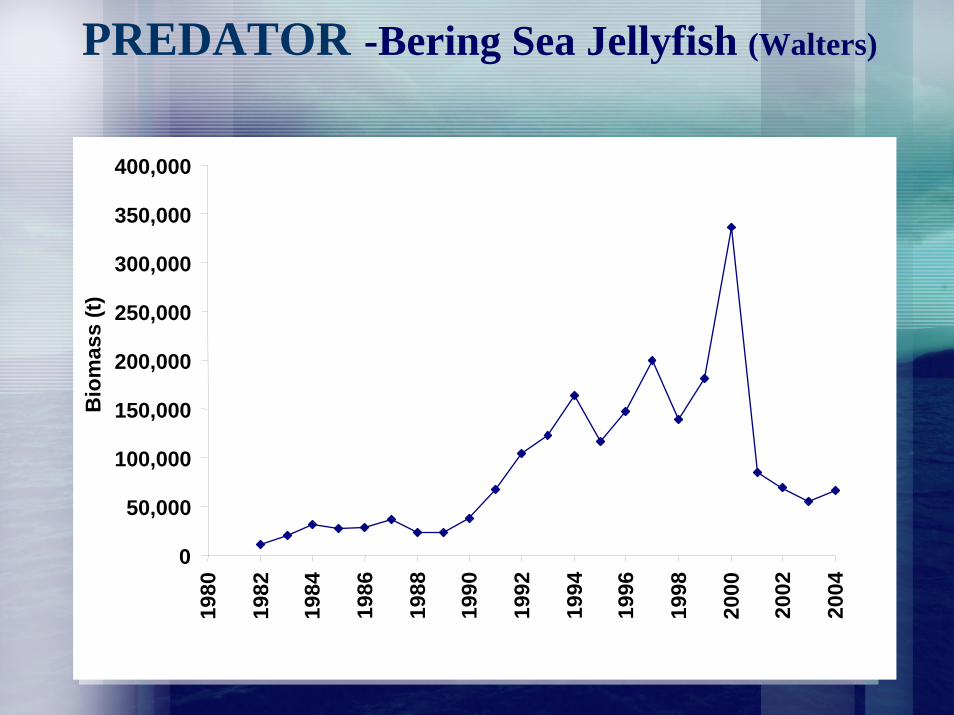
Bio
mas
s (t)
PREDATOR -Bering Sea Jellyfish (Walters)
Objectives for Ecosystem Protection:
1. Maintain predator-prey relationships by examining:a. pelagic forage availabilityb. spatial/temporal conc. of fishery impact on forage fishc. removals of top predatorsd. introduction of non-native species
2. Maintain diversity by examining:a. species diversityb. functional (trophic, structural habitat) diversityc. genetic diversity
3. Maintain energy flow and balance by examining:a. human-induced energy redirectionb. system impacts attributable to energy removal
Objectives for Ecosystem Protection:Maintain predator-prey relationships by examining:
pelagic forage availabilityspatial/temporal conc. of fishery impact on forage fishremovals of top predatorsintroduction of non-native species
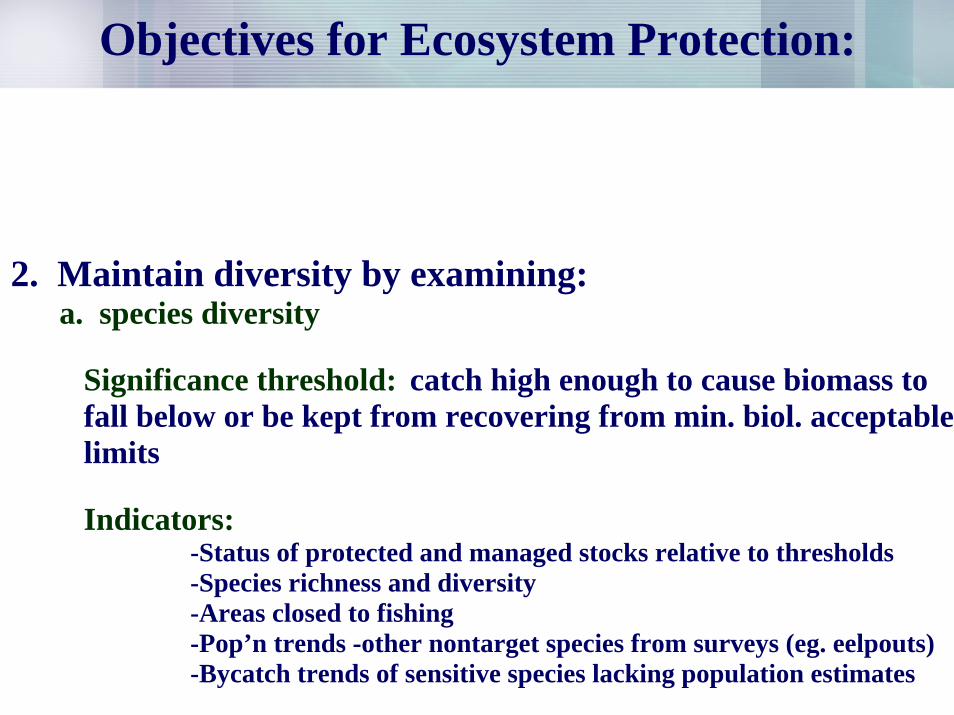
2. Maintain diversity by examining:a. species diversity
Significance threshold: catch high enough to cause biomass to fall below or be kept from recovering from min. biol. acceptablelimits
Indicators:-Status of protected and managed stocks relative to thresholds-Species richness and diversity-Areas closed to fishing-Pop’n trends -other nontarget species from surveys (eg. eelpouts)-Bycatch trends of sensitive species lacking population estimates
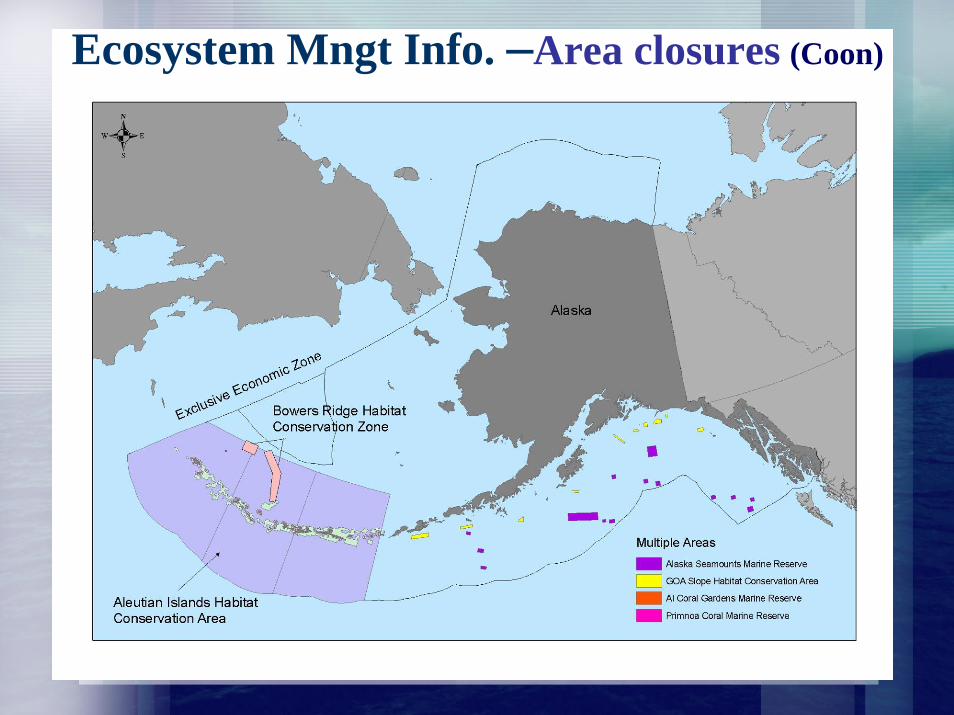
Ecosystem Mngt Info. –Area closures (Coon)
Spe
cies
per
hau
l
1985 1990 1995 2000
1213
1415
Spe
cies
per
hau
l
1985 1990 1995 2000
1.6
1.8
2.0
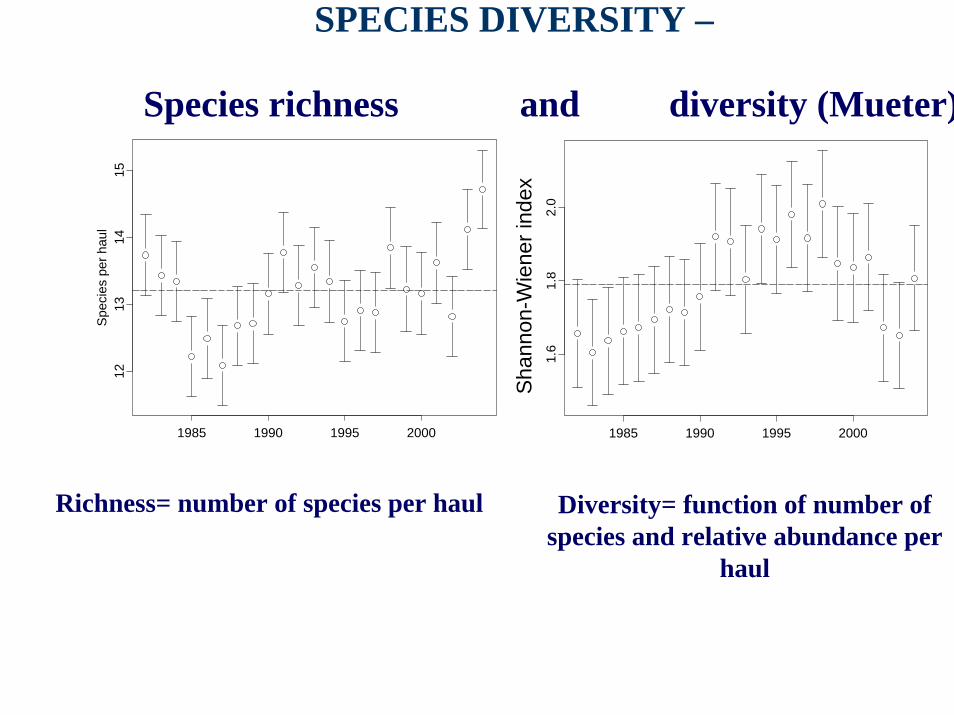
SPECIES DIVERSITY –
Species richness and diversity (Mueter)
Shan
non-
Wie
ner i
ndex
Richness= number of species per haul Diversity= function of number of species and relative abundance per
haul
Objectives for Ecosystem Protection:
1. Maintain predator-prey relationships by examining:a. pelagic forage availabilityb. spatial/temporal conc. of fishery impact on forage fishc. removals of top predatorsd. introduction of non-native species
2. Maintain diversity by examining:a. species diversityb. functional (trophic, structural habitat) diversityc. genetic diversity
3. Maintain energy flow and balance by examining:a. human-induced energy redirectionb. system impacts attributable to energy removal
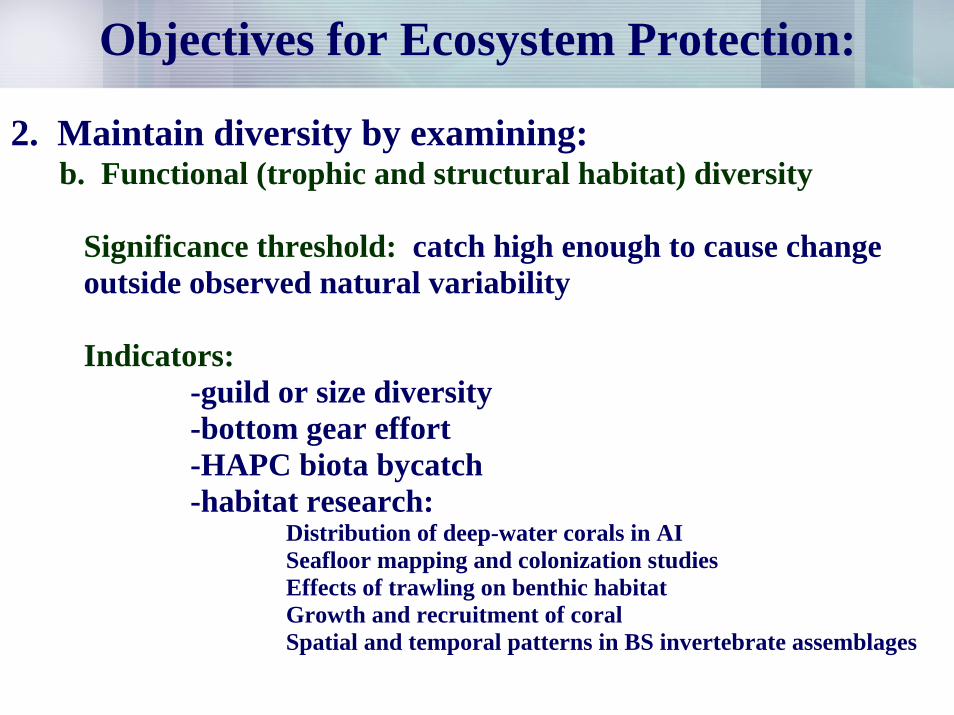
Objectives for Ecosystem Protection:
2. Maintain diversity by examining:b. Functional (trophic and structural habitat) diversity
Significance threshold: catch high enough to cause change outside observed natural variability
Indicators:-guild or size diversity-bottom gear effort-HAPC biota bycatch-habitat research:
Distribution of deep-water corals in AISeafloor mapping and colonization studiesEffects of trawling on benthic habitatGrowth and recruitment of coralSpatial and temporal patterns in BS invertebrate assemblages
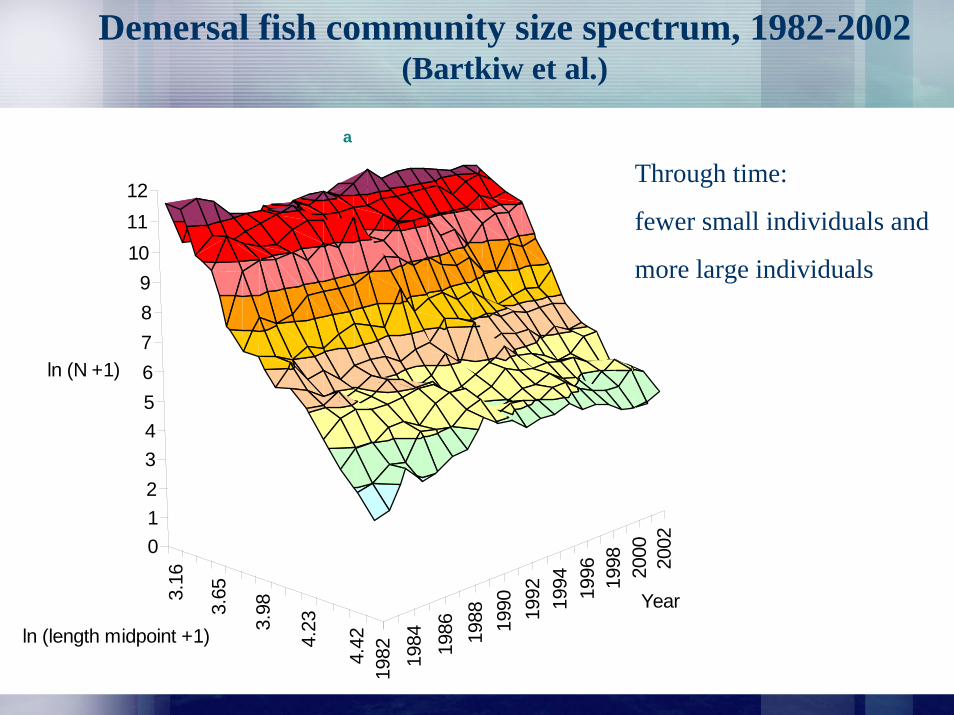
3.16
3.65
3.98
4.23
4.42
1982 19
84 1986 19
88 1990 19
92 1994 1996 1998 2000 20020
123456789
101112
ln (N +1)
ln (length midpoint +1)
Year
aa
Through time:
fewer small individuals and
more large individuals
Demersal fish community size spectrum, 1982-2002 (Bartkiw et al.)
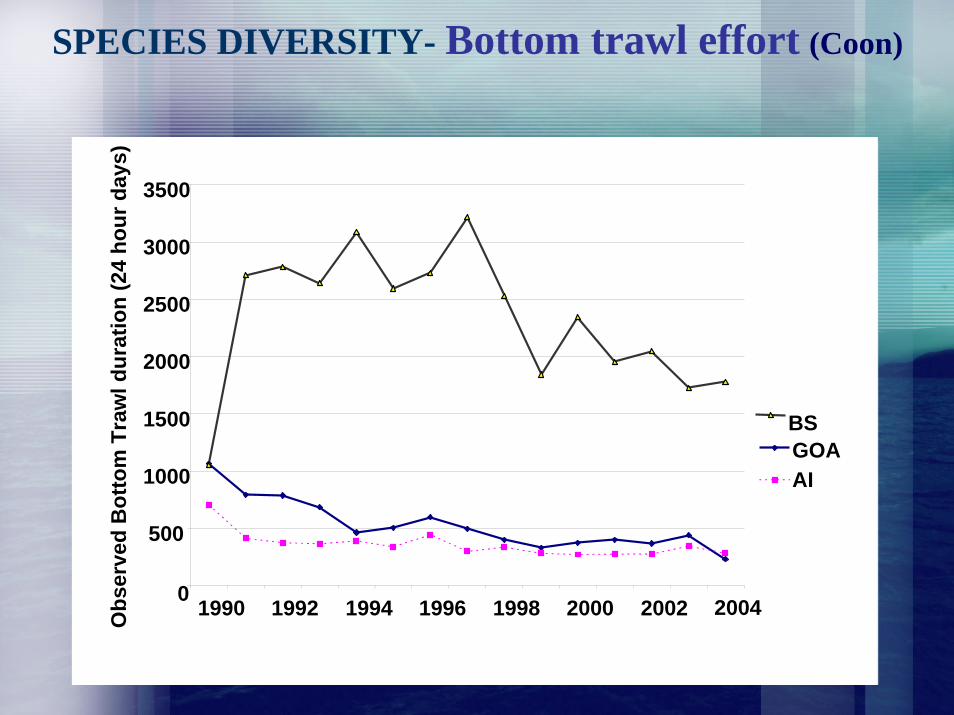
0
500
1000
1500
2000
2500
3000
3500
1990 1992 1994 1996 1998 2000 2002 2004Obs
erve
d B
otto
m T
raw
l dur
atio
n (2
4 ho
ur d
ays)
GOAAI
BS
SPECIES DIVERSITY- Bottom trawl effort (Coon)
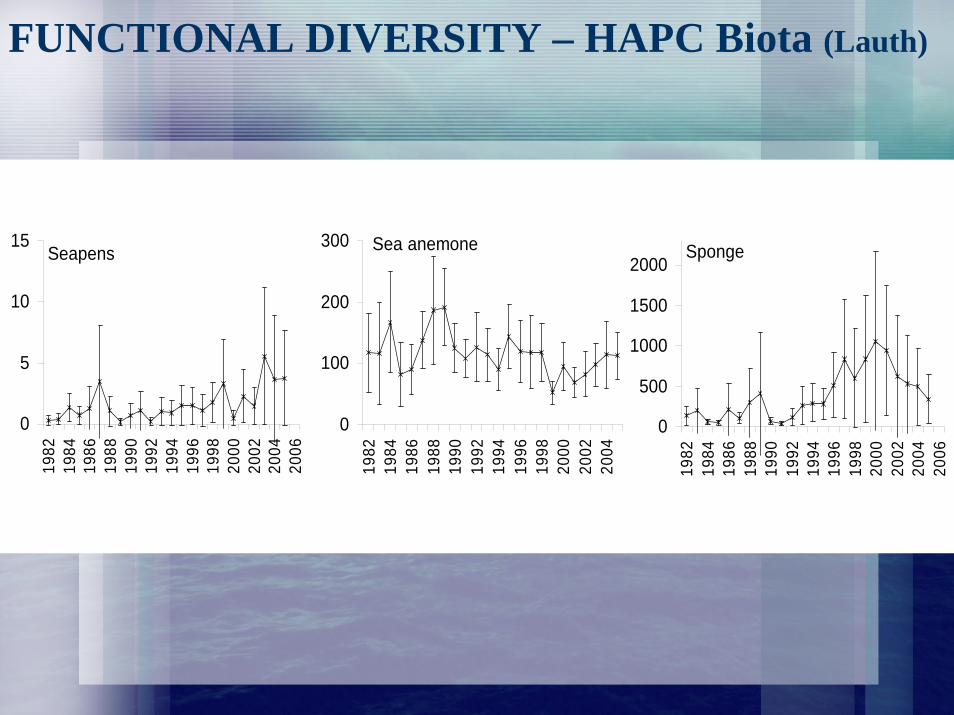
Seapens
0
5
10
15
1982
1984
1986
1988
1990
1992
1994
1996
1998
2000
2002
2004
2006
Sea anemone
0
100
200
300
1982
1984
1986
1988
1990
1992
1994
1996
1998
2000
2002
2004
Sponge
0
500
1000
1500
2000
1982
1984
1986
1988
1990
1992
1994
1996
1998
2000
2002
2004
2006
FUNCTIONAL DIVERSITY – HAPC Biota (Lauth)
Objectives for Ecosystem Protection:
1. Maintain predator-prey relationships by examining:a. pelagic forage availabilityb. spatial/temporal conc. of fishery impact on forage fishc. removals of top predatorsd. introduction of non-native species
2. Maintain diversity by examining:a. species diversityb. functional (trophic, structural habitat) diversityc. genetic diversity
3. Maintain energy flow and balance by examining:a. human-induced energy redirectionb. system impacts attributable to energy removal
Objectives for Ecosystem Protection:3. Maintain energy flow and balance by examining:
a. human-induced energy redirection
Significance threshold: long-term changes in system biomass, respiration, production, energy-cycling due to discards and offal
Indicators:-Prohibited species bycatch amounts-Nontarget catch and discards-Groundfish discards-Trends in scavenger species
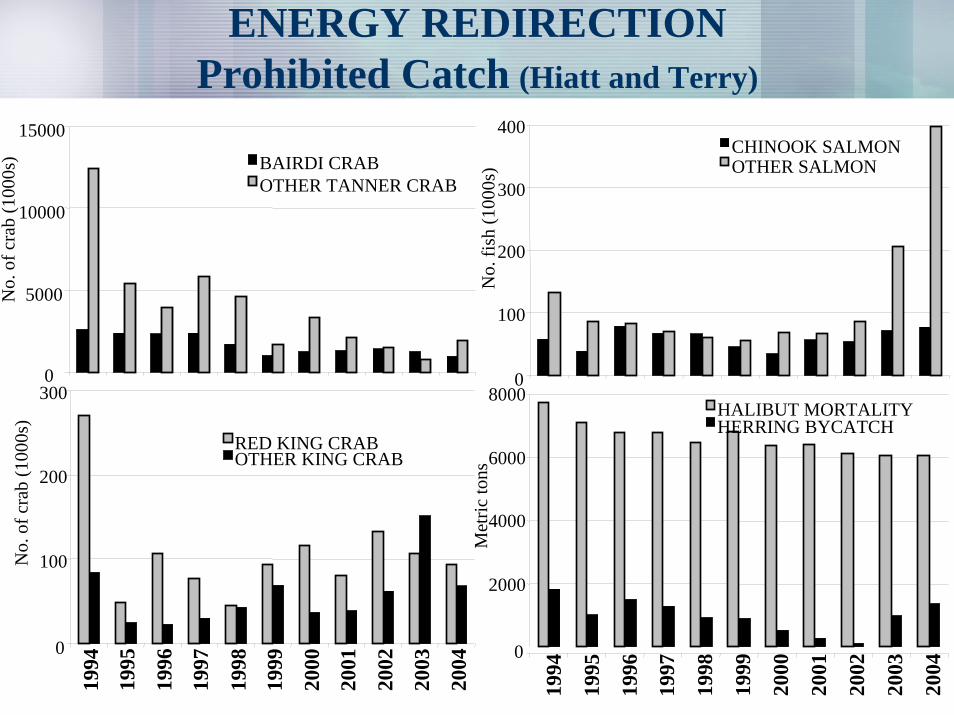
ENERGY REDIRECTIONProhibited Catch (Hiatt and Terry)
0
5000
10000
15000
No.
of c
rab
(100
0s) BAIRDI CRAB
OTHER TANNER CRAB
0
100
200
300
400
No.
fish
(100
0s)
CHINOOK SALMONOTHER SALMON
0
100
200
300
1994
1995
1996
1997
1998
1999
2000
2001
2002
2003
2004
No.
of c
rab
(100
0s)
RED KING CRABOTHER KING CRAB
0
2000
4000
6000
8000
1994
1995
1996
1997
1998
1999
2000
2001
2002
2003
2004
Met
ric to
ns
HALIBUT MORTALITYHERRING BYCATCH
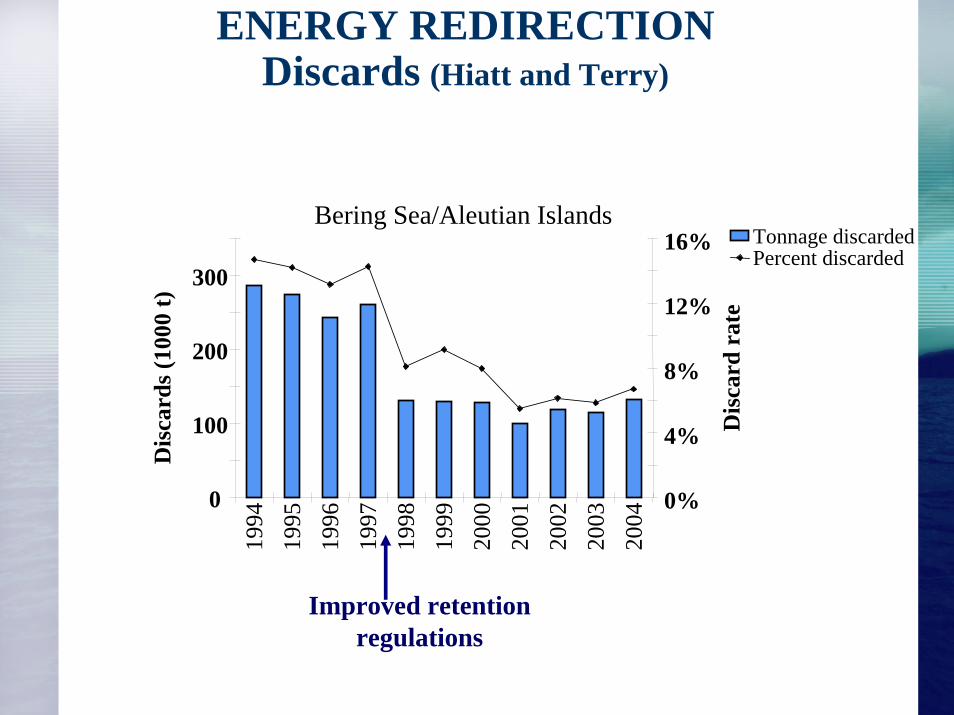
ENERGY REDIRECTIONDiscards (Hiatt and Terry)
Bering Sea/Aleutian Islands
0
100
200
30019
9419
9519
9619
9719
9819
9920
0020
0120
0220
0320
04
0%
4%
8%
12%
16%
Dis
card
s (10
00 t)
Dis
card
rat
e
Tonnage discardedPercent discarded
Improved retention regulations
Objectives for Ecosystem Protection:
1. Maintain predator-prey relationships by examining:a. pelagic forage availabilityb. spatial/temporal conc. of fishery impact on forage fishc. removals of top predatorsd. introduction of non-native species
2. Maintain diversity by examining:a. species diversityb. functional (trophic, structural habitat) diversityc. genetic diversity
3. Maintain energy flow and balance by examining:a. human-induced energy redirectionb. system impacts attributable to energy removal
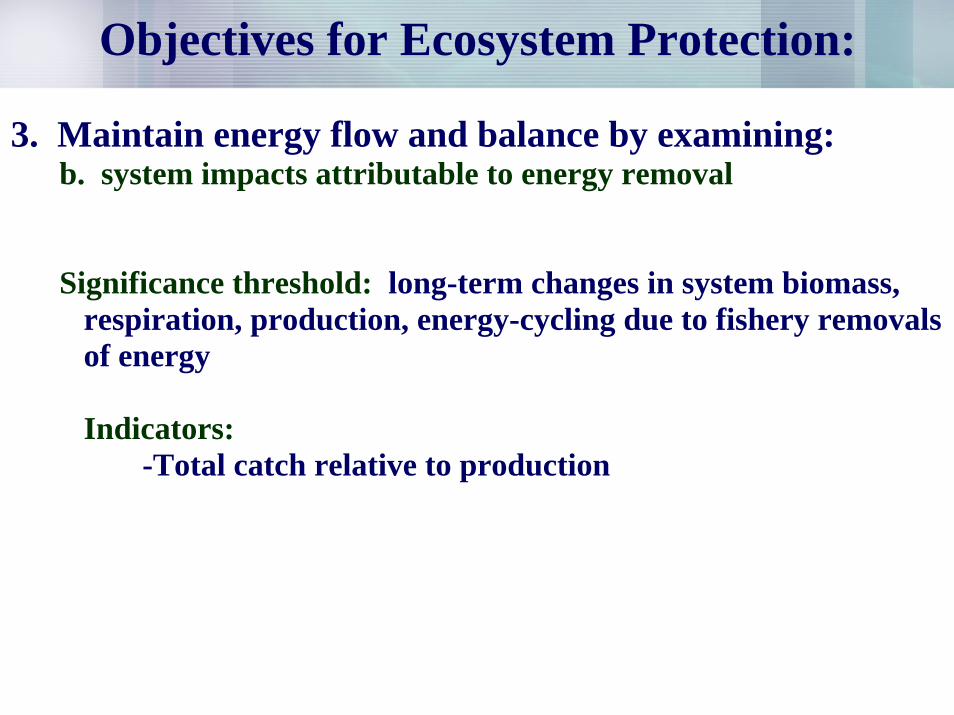
Objectives for Ecosystem Protection:
3. Maintain energy flow and balance by examining:b. system impacts attributable to energy removal
Significance threshold: long-term changes in system biomass, respiration, production, energy-cycling due to fishery removals of energy
Indicators:-Total catch relative to production
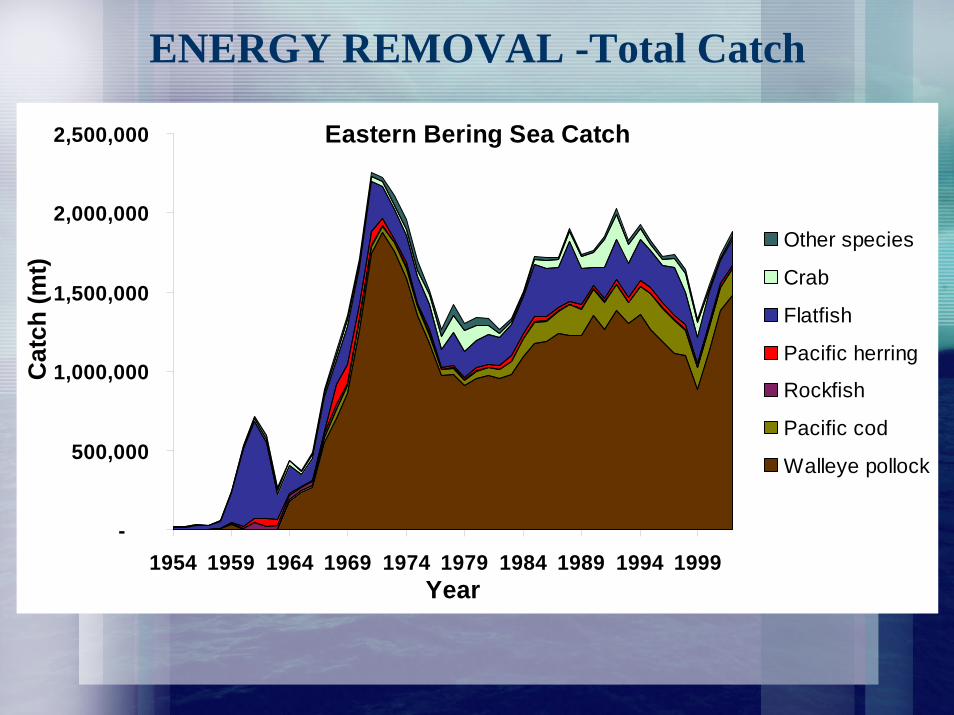
Eastern Bering Sea Catch
-
500,000
1,000,000
1,500,000
2,000,000
2,500,000
1954 1959 1964 1969 1974 1979 1984 1989 1994 1999Year
Cat
ch (m
t)
Other species
Crab
Flatfish
Pacific herring
Rockfish
Pacific cod
Walleye pollock
ENERGY REMOVAL -Total Catch
0
200400600800100012001400
1978
1980
1982
1984
1986
1988
1990
1992
1994
1996
1998
2000
2002
2004
BS
ASP
(100
0 m
t)
0
50
100
150
200
250
300
GO
A A
SP (1
000
mt)
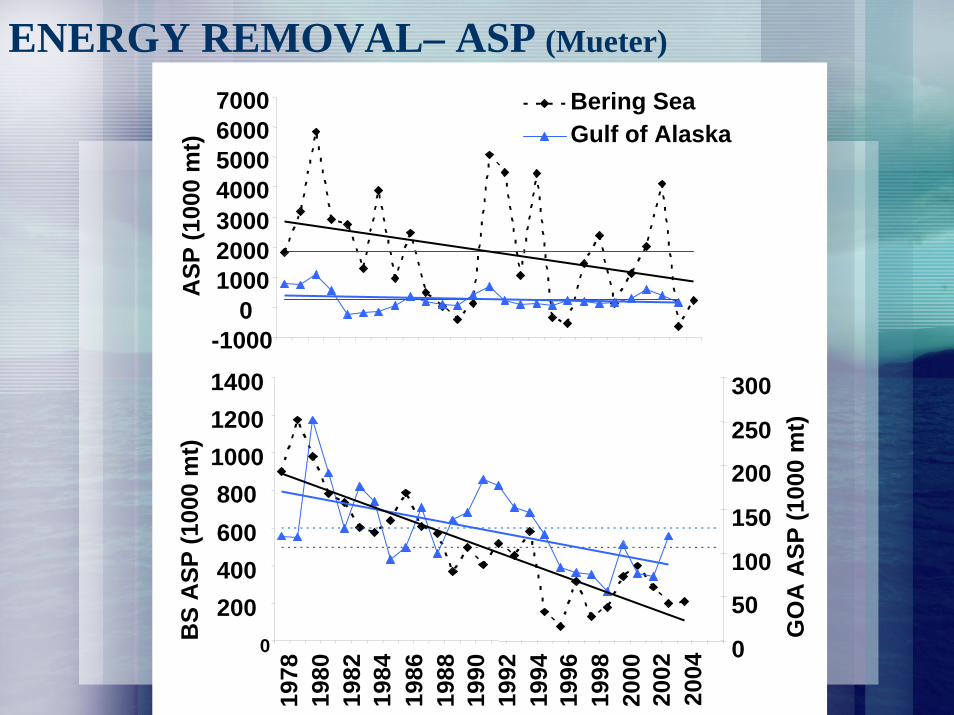
Bering SeaGulf of Alaska
-10000
1000200030004000500060007000
ASP
(100
0 m
t)
ENERGY REMOVAL– ASP (Mueter)
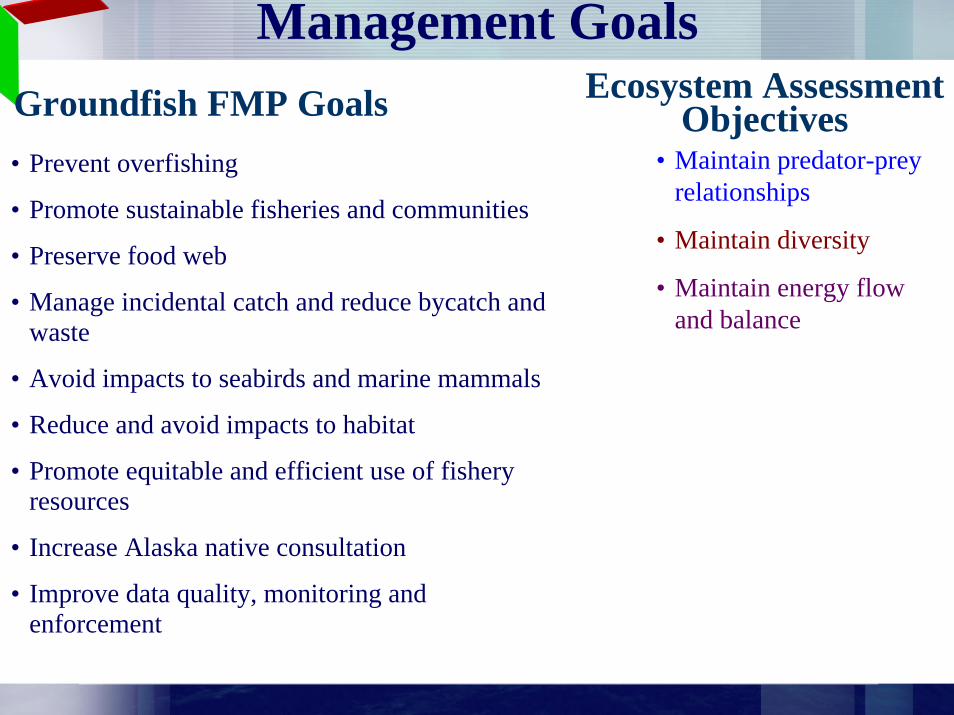
Groundfish FMP Goals• Prevent overfishing
• Promote sustainable fisheries and communities
• Preserve food web
• Manage incidental catch and reduce bycatch and waste
• Avoid impacts to seabirds and marine mammals
• Reduce and avoid impacts to habitat
• Promote equitable and efficient use of fishery resources
• Increase Alaska native consultation
• Improve data quality, monitoring and enforcement
Management GoalsEcosystem Assessment
Objectives• Maintain predator-prey
relationships
• Maintain diversity
• Maintain energy flow and balance
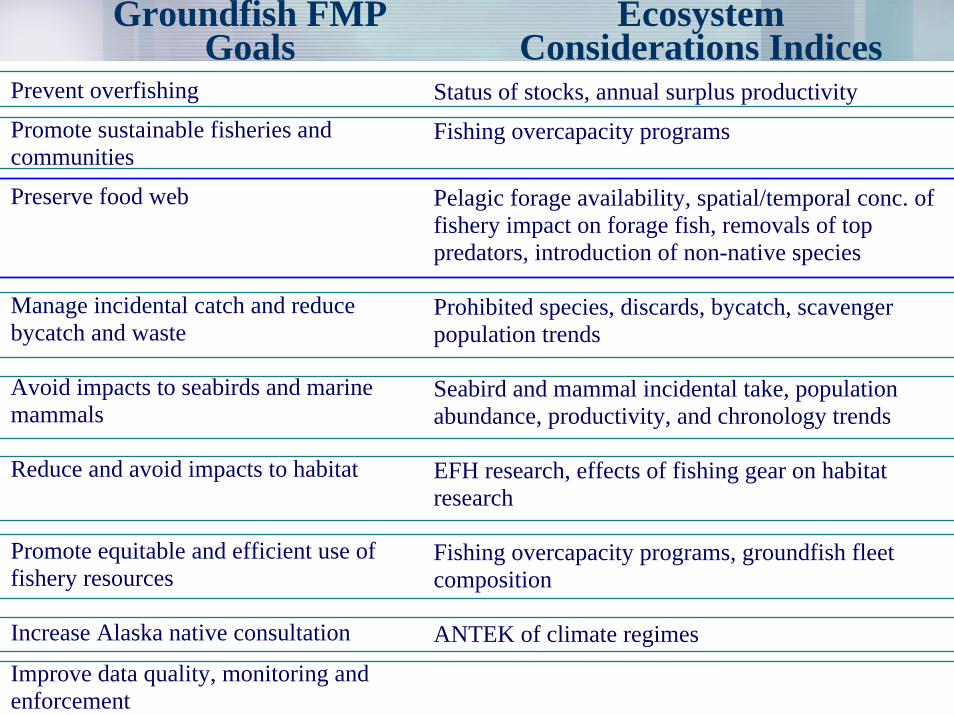
Groundfish FMP Goals
Prevent overfishing
Promote sustainable fisheries and communities
Preserve food web
Manage incidental catch and reduce bycatch and waste
Avoid impacts to seabirds and marine mammals
Reduce and avoid impacts to habitat
Promote equitable and efficient use of fishery resources
Increase Alaska native consultation
Improve data quality, monitoring and enforcement
Ecosystem Considerations Indices
Status of stocks, annual surplus productivity
Fishing overcapacity programs
Pelagic forage availability, spatial/temporal conc. of fishery impact on forage fish, removals of top predators, introduction of non-native species
Prohibited species, discards, bycatch, scavenger population trends
Seabird and mammal incidental take, population abundance, productivity, and chronology trends
EFH research, effects of fishing gear on habitat research
Fishing overcapacity programs, groundfish fleet composition
ANTEK of climate regimes
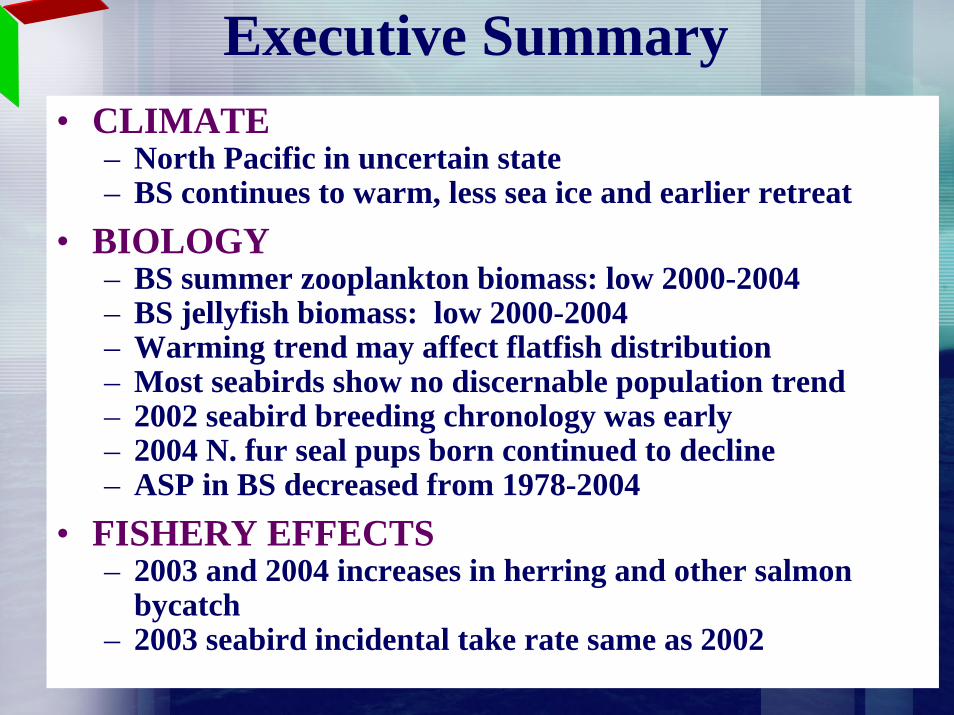
Executive Summary• CLIMATE
– North Pacific in uncertain state – BS continues to warm, less sea ice and earlier retreat
• BIOLOGY– BS summer zooplankton biomass: low 2000-2004– BS jellyfish biomass: low 2000-2004– Warming trend may affect flatfish distribution– Most seabirds show no discernable population trend– 2002 seabird breeding chronology was early– 2004 N. fur seal pups born continued to decline– ASP in BS decreased from 1978-2004
• FISHERY EFFECTS– 2003 and 2004 increases in herring and other salmon
bycatch– 2003 seabird incidental take rate same as 2002
Website: Geoff Langhttp://access.afsc.noaa.gov/reem/ecoweb/index.cfm
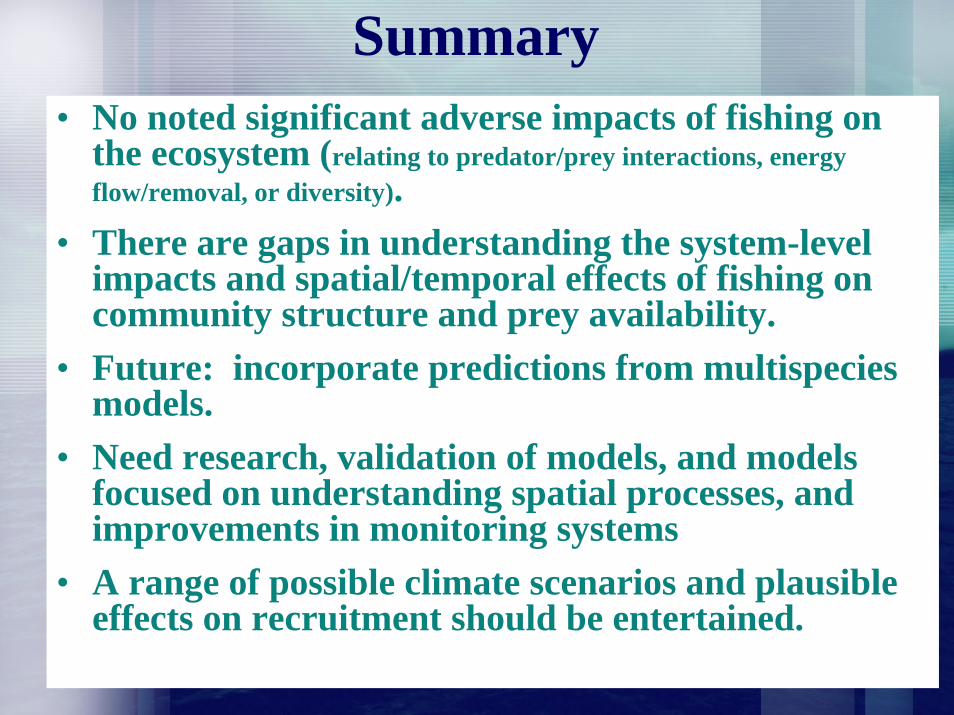
Summary• No noted significant adverse impacts of fishing on
the ecosystem (relating to predator/prey interactions, energy flow/removal, or diversity).
• There are gaps in understanding the system-level impacts and spatial/temporal effects of fishing on community structure and prey availability.
• Future: incorporate predictions from multispeciesmodels.
• Need research, validation of models, and models focused on understanding spatial processes, and improvements in monitoring systems
• A range of possible climate scenarios and plausible effects on recruitment should be entertained.