Embed Size (px)
Citation preview

Status of the SEMCOG E6 Travel Model
SEMCOG TMIP Peer Review Panel Meeting
December 12, 2011
presented byLiyang Feng, SEMCOGThomas Rossi, Cambridge Systematics
presented to
Objectives
Improve key modeling components as needed to analyze key projects and policies
Reflect the most recent available data
Implement 2004 TMIP peer review recommendations
2
E6 Model Components

Data Sources
2004-2005 household survey (SEMCOG, MI Travel Counts)
2010-2011 transit on-board survey
SEMCOG traffic count database
Information from transit providers (ridership counts, schedules)
4
Work to Be Done for All Model Components
Model estimation
Application programming (TransCAD)
Validation at component level
5
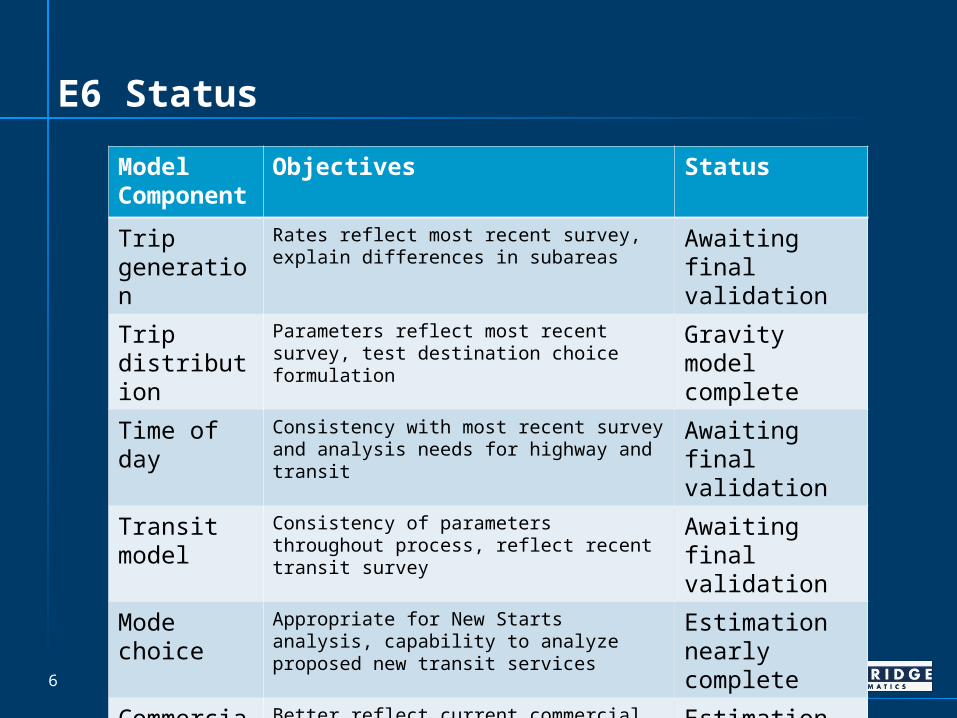
E6 Status
6
Model Component
Objectives Status
Trip generation
Rates reflect most recent survey, explain differences in subareas
Awaiting final validation
Trip distribution
Parameters reflect most recent survey, test destination choice formulation
Gravity model complete
Time of day Consistency with most recent survey and analysis needs for highway and transit
Awaiting final validation
Transit model
Consistency of parameters throughout process, reflect recent transit survey
Awaiting final validation
Mode choice Appropriate for New Starts analysis, capability to analyze proposed new transit services
Estimation nearly complete
Commercial vehicle
Better reflect current commercial vehicle/truck movements in region
Estimation nearly complete

Trip Generation
Identified ways to improve the trip generation rates
Home based university trip purpose added
Parameters updated using household survey data
Factors used to separate non-motorized travel
Air passenger model updated
7
Trip Generation
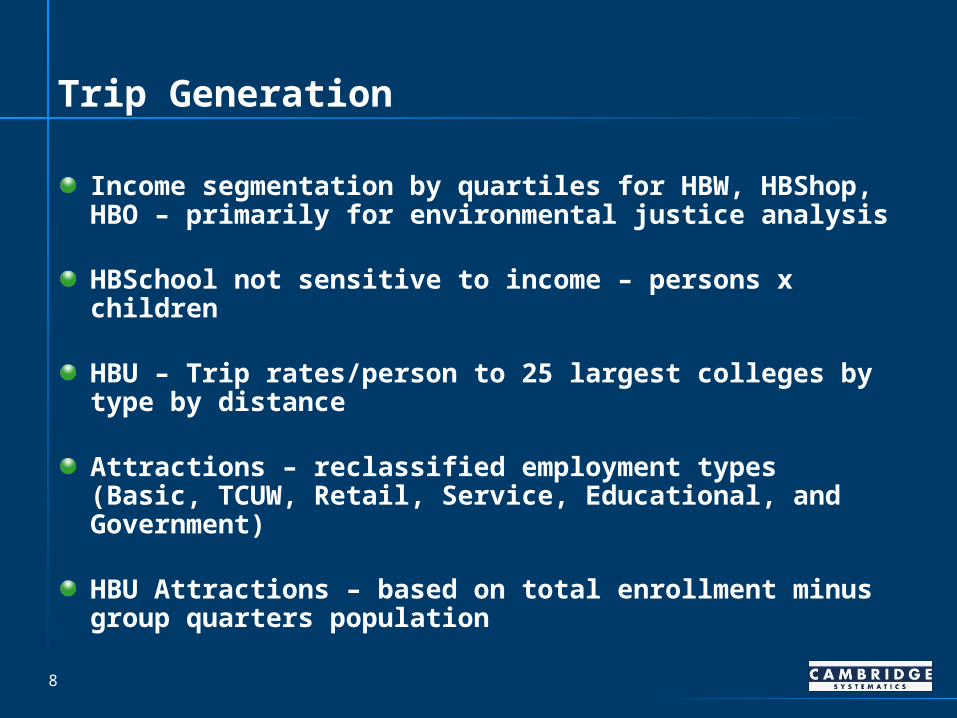
Income segmentation by quartiles for HBW, HBShop, HBO – primarily for environmental justice analysis
HBSchool not sensitive to income – persons x children
HBU – Trip rates/person to 25 largest colleges by type by distance
Attractions – reclassified employment types (Basic, TCUW, Retail, Service, Educational, and Government)
HBU Attractions – based on total enrollment minus group quarters population
8
Trip Generation Validation
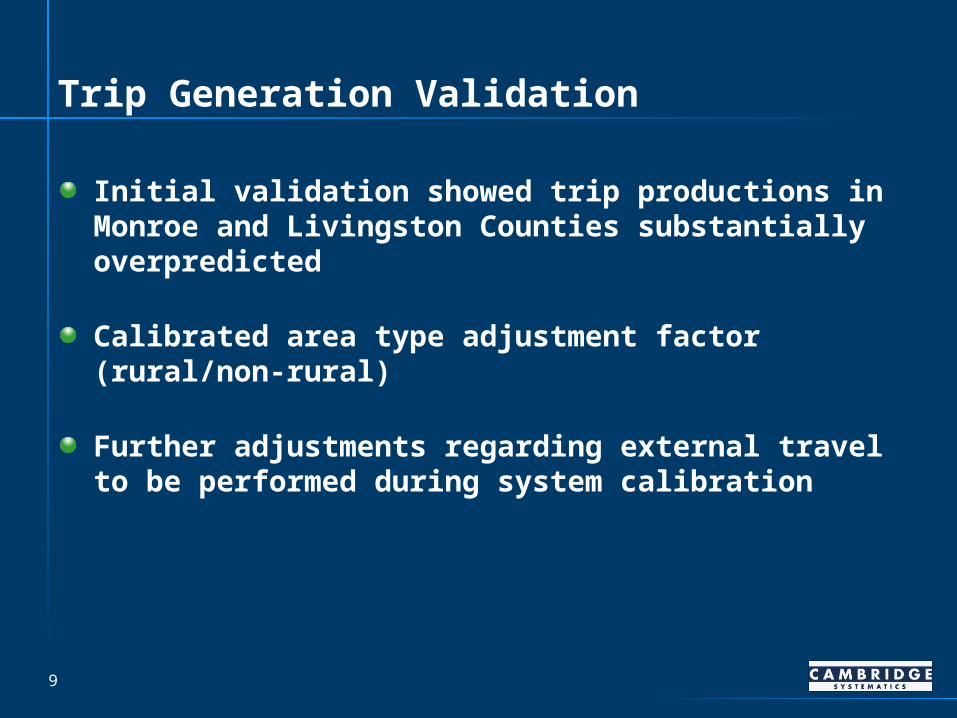
Initial validation showed trip productions in Monroe and Livingston Counties substantially overpredicted
Calibrated area type adjustment factor (rural/non-rural)
Further adjustments regarding external travel to be performed during system calibration
9

Trip Distribution
Gravity model parameters recalibrated by trip purpose (income segmentation for HBW, HBShop, HBO)
Logit destination choice model to be estimated» Using the most recent data, test whether destination choice
model produces better results» If so, implement and validate logit destination choice model» If not, revalidate existing gravity model using recent data
10

Time of Day
New time periods defined…» Definitions useful for both highway and transit analysis
Factors reestimated using household survey data
11
Period Definition
AM 6:30-9:00 a.m.
MD 9:00 a.m.-3:00 p.m.
PM 3:00-6:30 p.m.
Evening 6:30-10:00 p.m.
Overnight 10:00 p.m.-6:30 a.m.

Time of Day Factors
12
AM MD PM Evening Overnight1HBW From home 29.9% 11.0% 3.4% 1.4% 8.9%1HBW To home 1.2% 7.4% 25.5% 6.8% 4.5%2HBO From home 13.7% 18.5% 13.7% 7.2% 1.4%2HBO To home 3.9% 12.0% 14.2% 12.8% 2.8%
3HBSH From home 3.2% 19.7% 10.7% 6.6% 1.0%3HBSH To home 0.7% 22.6% 20.7% 13.5% 1.3%
4HBSCH From home 54.2% 3.1% 0.7% 0.3% 0.5%4HBSCH To home 0.1% 16.3% 23.9% 0.8% 0.1%
5HBU From home 18.2% 21.3% 9.7% 1.9% 0.8%5HBU To home 0.0% 16.4% 13.1% 16.9% 1.8%
6NHBW From work 2.1% 30.3% 26.6% 4.2% 1.3%6NHBW To work 12.2% 18.2% 3.2% 0.8% 1.1%7NHBO All 7.8% 40.9% 33.1% 16.3% 1.9%
Transit Model
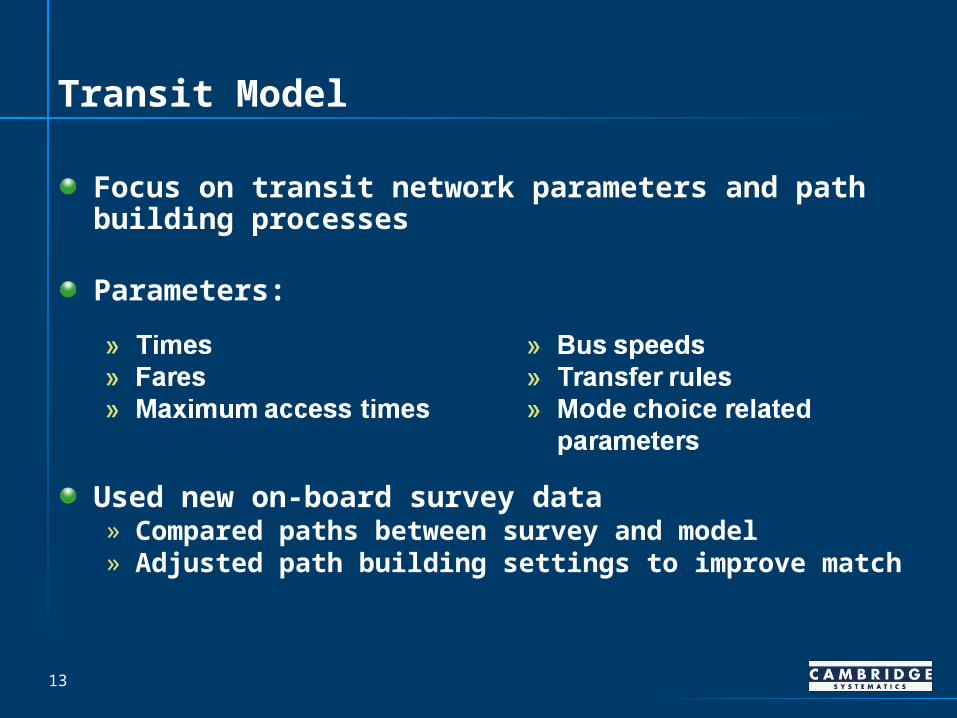
Focus on transit network parameters and path building processes
Parameters:
13
Used new on-board survey data» Compared paths between survey and model» Adjusted path building settings to improve match

Transit Model Speed Definition
Using 2010 data, SEMCOG did a comparison between model auto time and scheduled bus time for 145 routes for AATA, DDOT, and SMART
Initial analysis adjusted to account for systemic differences
Stop (dwell) time adjustments by operator
14
Scheduled_bus_time = 0.917 * (Model_autotime) + .318 * (Model_stops)

Transit Walk Access Time
E5 model – Walk access capped at 18 minutes
Examined on-board survey data
Recommended increase to 36 minutes (about 90% of observations after eliminating outliers)
15
Transit Network and Path-Building Procedure Checks
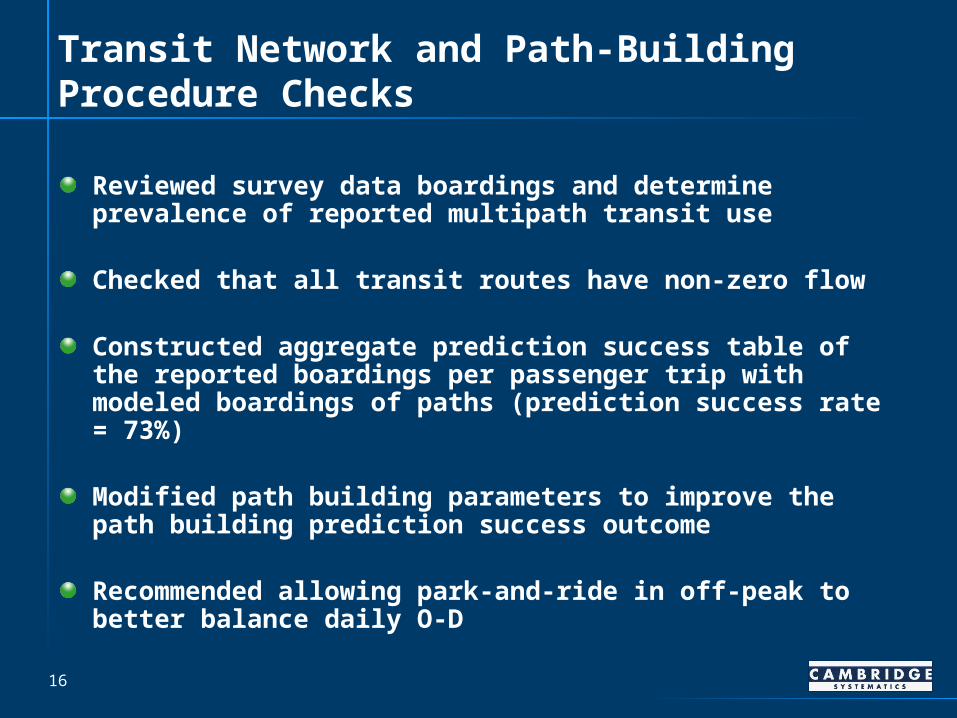
Reviewed survey data boardings and determine prevalence of reported multipath transit use
Checked that all transit routes have non-zero flow
Constructed aggregate prediction success table of the reported boardings per passenger trip with modeled boardings of paths (prediction success rate = 73%)
Modified path building parameters to improve the path building prediction success outcome
Recommended allowing park-and-ride in off-peak to better balance daily O-D
16
Mode Choice
Existing mode choice model needs to be evaluated:» Range of current and potential transit services » FTA New Starts analysis» Project impacts on population segments» Incorporation of transit model improvements» Use of recent data (counts, surveys)» Efficiency of model structure and procedures» Validity of results
Recommendations for structure, parameters of mode choice model to be implemented
Reestimate/revalidate
17

Mode ChoiceNesting Structure Tests
18

Mode ChoiceNesting Structure Tests (continued)
19

Handling New Modes in Mode Choice Application
Arterial Rapid Transit (ART)
Bus Rapid Transit (BRT)
Light Rail (LRT), including on Woodward
Commuter rail (CRT) from Detroit to Ann Arbor
20
Commercial Vehicle Model
Three-step model – generation, distribution, assignment
Prepared vehicle classification count data – adjusted for growth/decline in region
Adjusting parameters to reflect current data
Adjustments to reflect changes in external station volumes
Revalidating
21

System Calibration
Validate individual components as they are developed
Use recent data to see “what has changed”» Enhance short-term forecast capability
Get the “big picture” correct
Examine “trouble spots” from previous model versions
Make sure forecasts make sense
Expected completion – March 2012
22