Embed Size (px)
Citation preview

CITY & COUNTY OF SAN FRANCISCO
Office of the ControllerOffice of Economic Analysis
Status of the Re-Opening of the San Francisco Economy:
August 2021
August 25, 2021
As the COVID-19 restrictions have been lifted, the Controller’s Office is tracking the pace of re-opening of the city’s economy. This is the third monthly report examining a variety of local economic indicators.
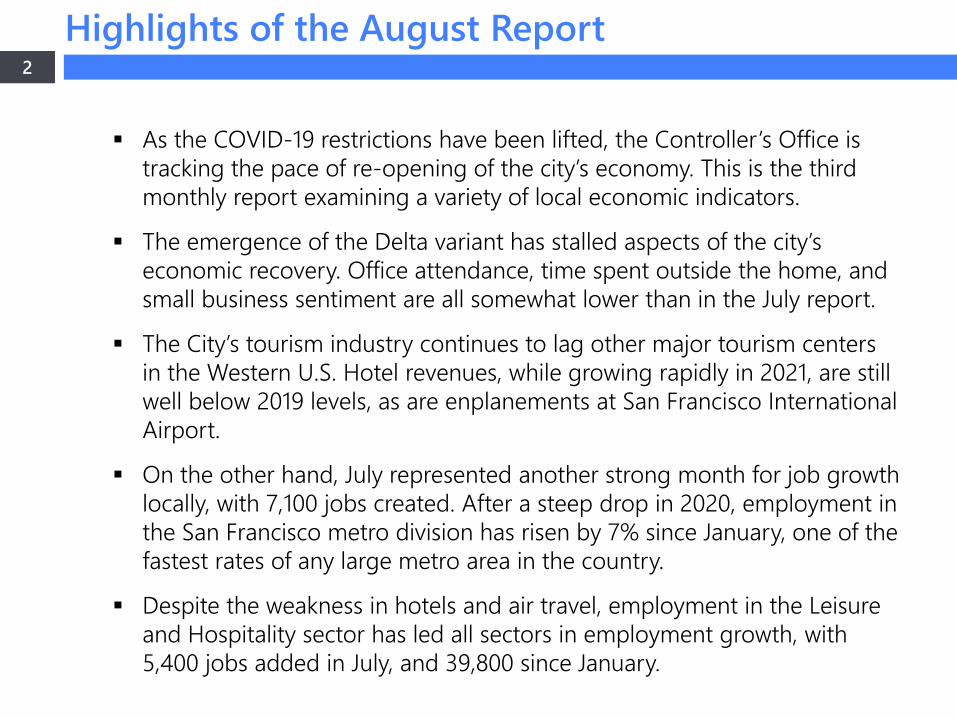
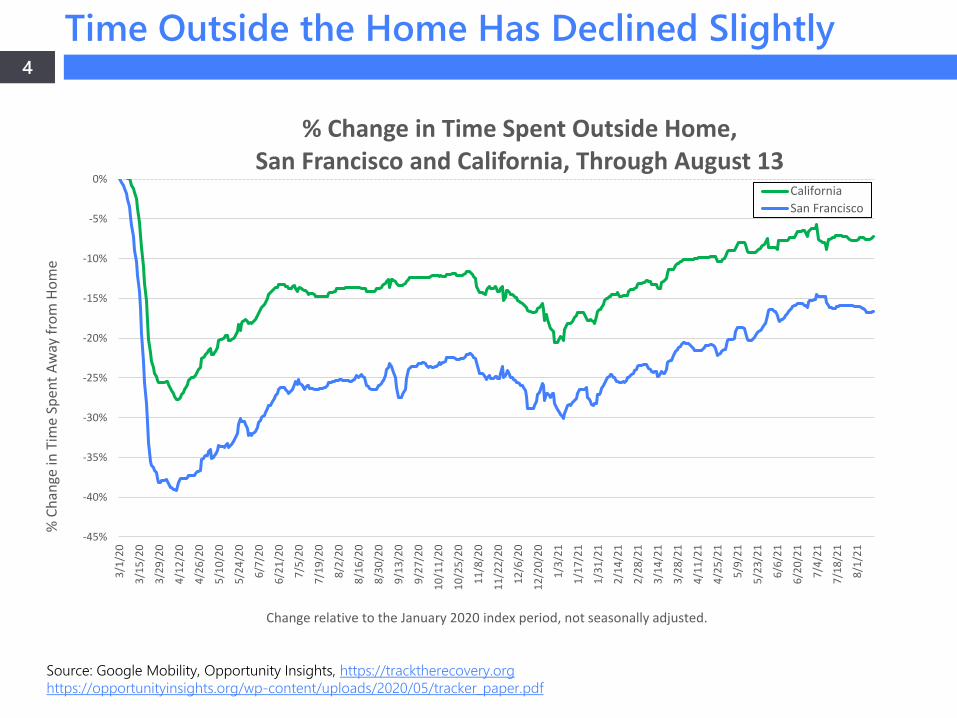
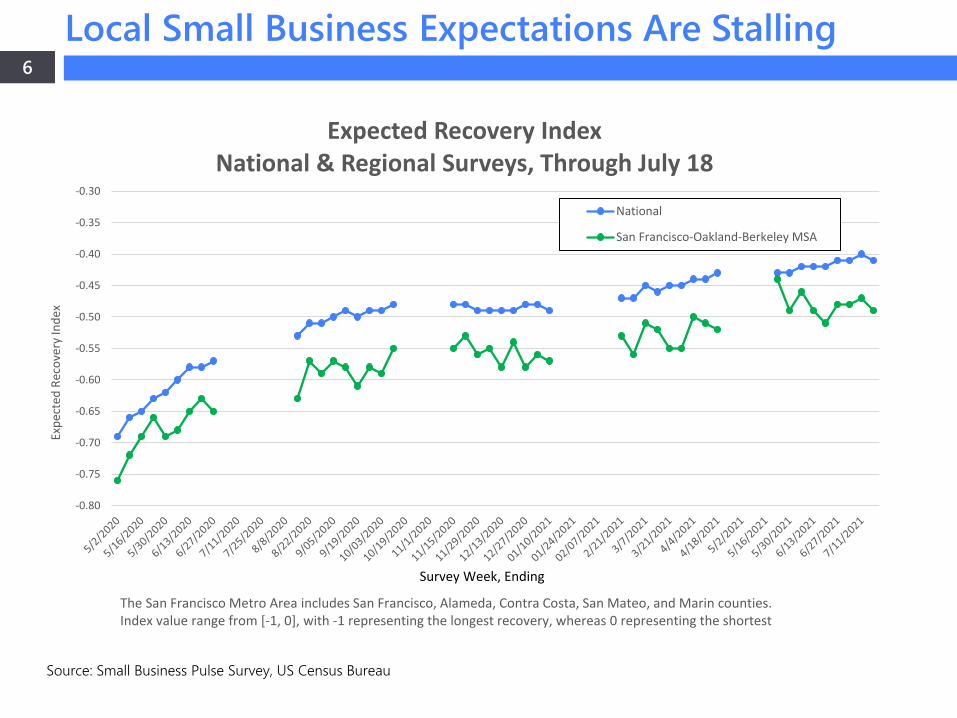
The emergence of the Delta variant has stalled aspects of the city’s economic recovery. Office attendance, time spent outside the home, and small business sentiment are all somewhat lower than in the July report.
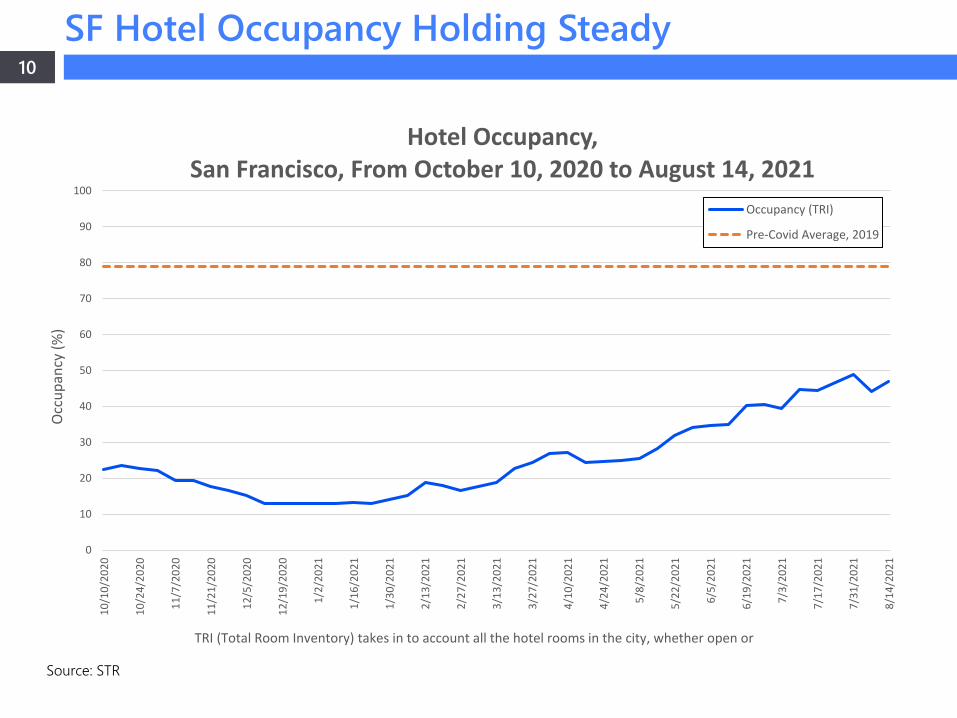
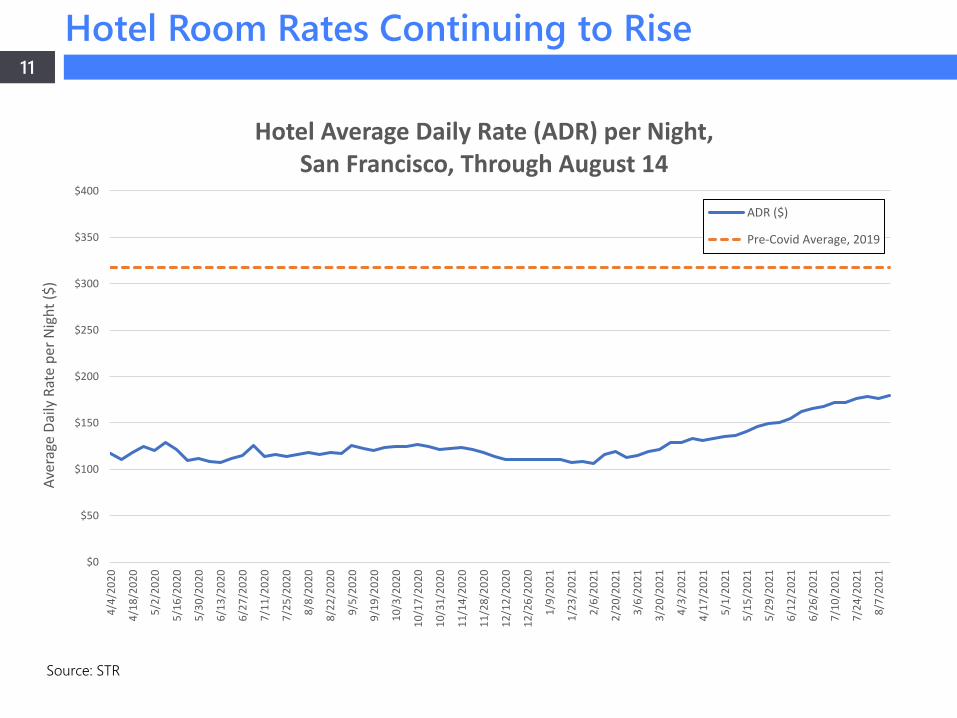
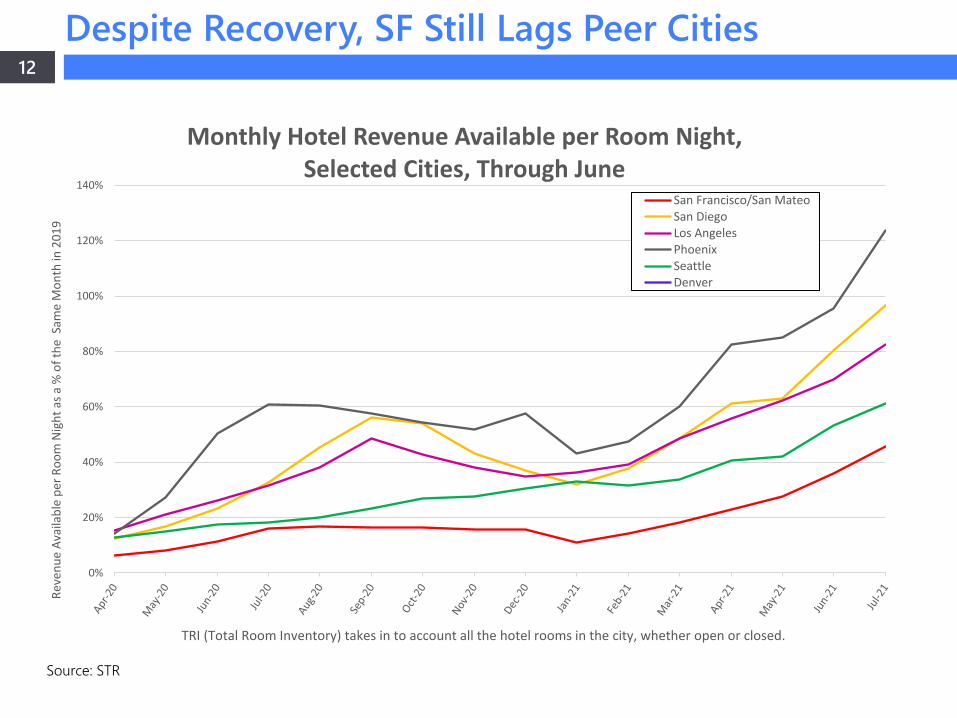
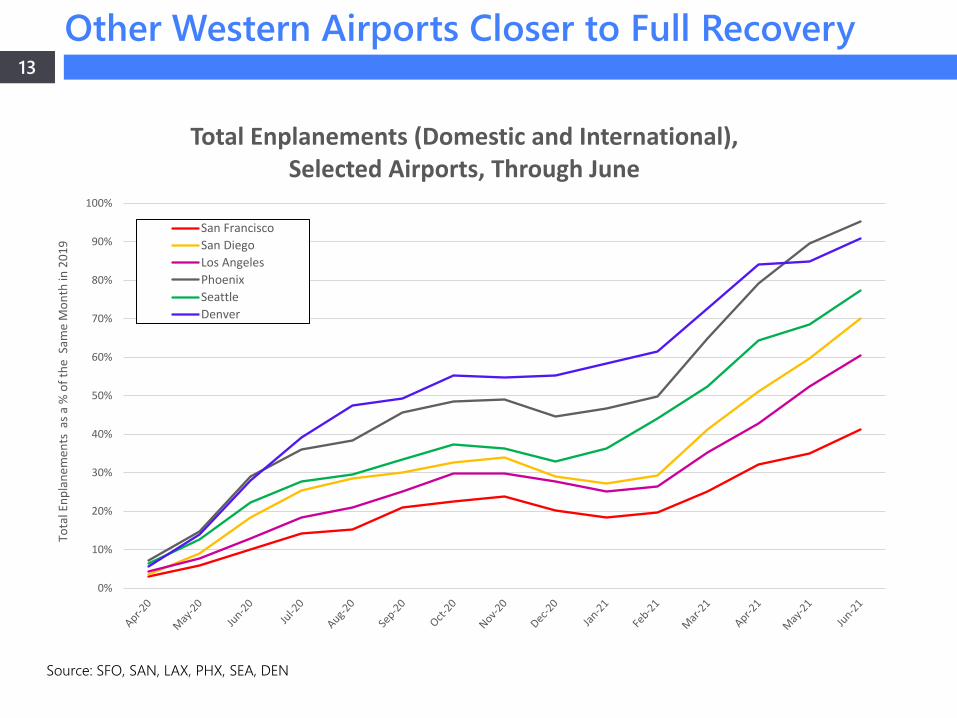
The City’s tourism industry continues to lag other major tourism centers in the Western U.S. Hotel revenues, while growing rapidly in 2021, are still well below 2019 levels, as are enplanements at San Francisco International Airport.
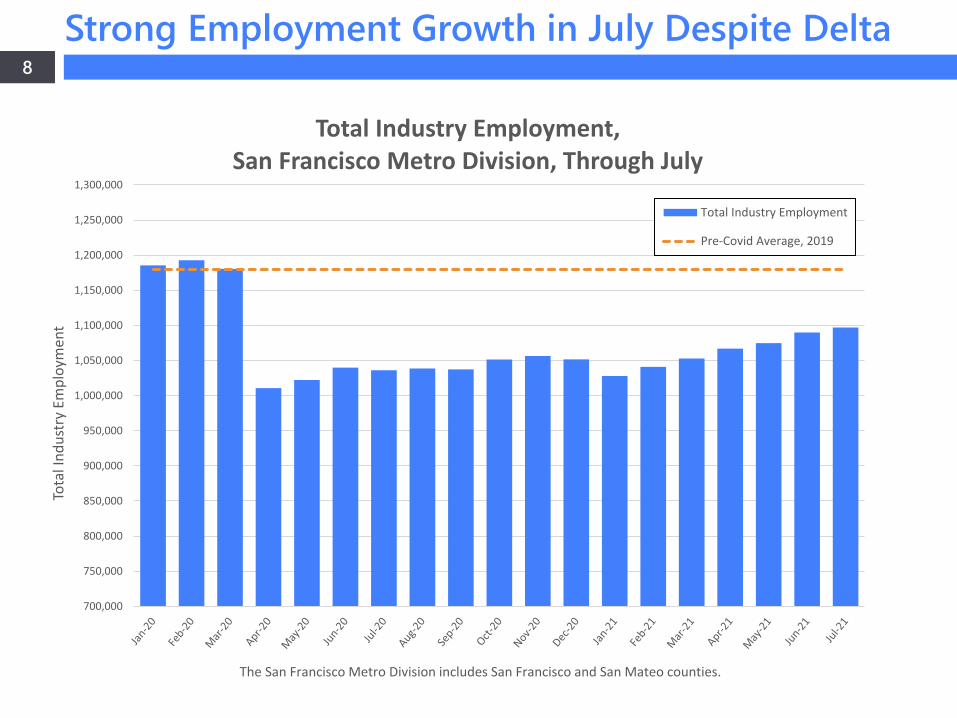
On the other hand, July represented another strong month for job growth locally, with 7,100 jobs created. After a steep drop in 2020, employment in the San Francisco metro division has risen by 7% since January, one of the fastest rates of any large metro area in the country.
Despite the weakness in hotels and air travel, employment in the Leisure and Hospitality sector has led all sectors in employment growth, with 5,400 jobs added in July, and 39,800 since January.
2
Highlights of the August Report

3
List of Economic Indicators
1. Time Spent Outside of the Home 2. Office Attendance3. Small Business Sentiment: Expected Recovery Index4. New Business Registrations5. Total Employment in San Francisco & San Mateo Counties6. Hotel Occupancy Rate7. Hotel Average Daily Rate (ADR) per Night8. Hotel Revenue Available per Room Night (RevPar): Selected Cities Comparison9. Small Business Sentiment: Expected Future Business Travel10. Airport Enplanements: Selected Cities Comparison 11. Convention Bookings At Moscone Center12. PM Freeway Speed13. Bay Bridge and Golden Bridge Traffic14. BART Exits at Downtown SF Stations15. Average Asking Rents for Apartments16. Building Permits
4
Source: Google Mobility, Opportunity Insights, https://tracktherecovery.orghttps://opportunityinsights.org/wp-content/uploads/2020/05/tracker_paper.pdf
-45%
-40%
-35%
-30%
-25%
-20%
-15%
-10%
-5%
0%
3/1/
20
3/15
/20
3/29
/20
4/12
/20
4/26
/20
5/10
/20
5/24
/20
6/7/
20
6/21
/20
7/5/
20
7/19
/20
8/2/
20
8/16
/20
8/30
/20
9/13
/20
9/27
/20
10/1
1/20
10/2
5/20
11/8
/20
11/2
2/20
12/6
/20
12/2
0/20
1/3/
21
1/17
/21
1/31
/21
2/14
/21
2/28
/21
3/14
/21
3/28
/21
4/11
/21
4/25
/21
5/9/
21
5/23
/21
6/6/
21
6/20
/21
7/4/
21
7/18
/21
8/1/
21
% C
hang
e in
Tim
e Sp
ent A
way
from
Hom
e
% Change in Time Spent Outside Home, San Francisco and California, Through August 13
CaliforniaSan Francisco
Change relative to the January 2020 index period, not seasonally adjusted.
Time Outside the Home Has Declined Slightly
5
Source: Kastle Systems
0%
10%
20%
30%
40%
50%
60%
4/1/
2020
4/15
/202
0
4/29
/202
0
5/13
/202
0
5/27
/202
0
6/10
/202
0
6/24
/202
0
7/8/
2020
7/22
/202
0
8/5/
2020
8/19
/202
0
9/2/
2020
9/16
/202
0
9/30
/202
0
10/1
4/20
20
10/2
8/20
20
11/1
1/20
20
11/2
5/20
20
12/9
/202
0
12/2
3/20
20
1/6/
2021
1/20
/202
1
2/3/
2021
2/17
/202
1
3/3/
2021
3/17
/202
1
3/31
/202
1
4/14
/202
1
4/28
/202
1
5/12
/202
1
5/26
/202
1
6/9/
2021
6/23
/202
1
7/7/
2021
7/21
/202
1
8/4/
2021
Wee
kly
Offi
ce A
tten
danc
e R
ate,
%
Weekly Office Attendance Across Selected Metros, Through August 11
Austin MetroLos Angeles MetroSan Jose MetroNew York MetroSan Francisco Metro
Kastle Back to Work Barometer reflects unique authorized user entries in a market relative to its pre-COVID baseline, averaged weekly. The San Francisco Metro Area includes San Francisco, Alameda, Contra Costa, San Mateo, and Marin counties.
Office Attendance Has Declined Across the U.S.
6
Source: Small Business Pulse Survey, US Census Bureau
-0.80
-0.75
-0.70
-0.65
-0.60
-0.55
-0.50
-0.45
-0.40
-0.35
-0.30
Expe
cted
Rec
over
y In
dex
Expected Recovery IndexNational & Regional Surveys, Through July 18
National
San Francisco-Oakland-Berkeley MSA
Survey Week, Ending
The San Francisco Metro Area includes San Francisco, Alameda, Contra Costa, San Mateo, and Marin counties.Index value range from [-1, 0], with -1 representing the longest recovery, whereas 0 representing the shortest
Local Small Business Expectations Are Stalling
7
Source: Treasurer & Tax Collector, City and County of San Francisco
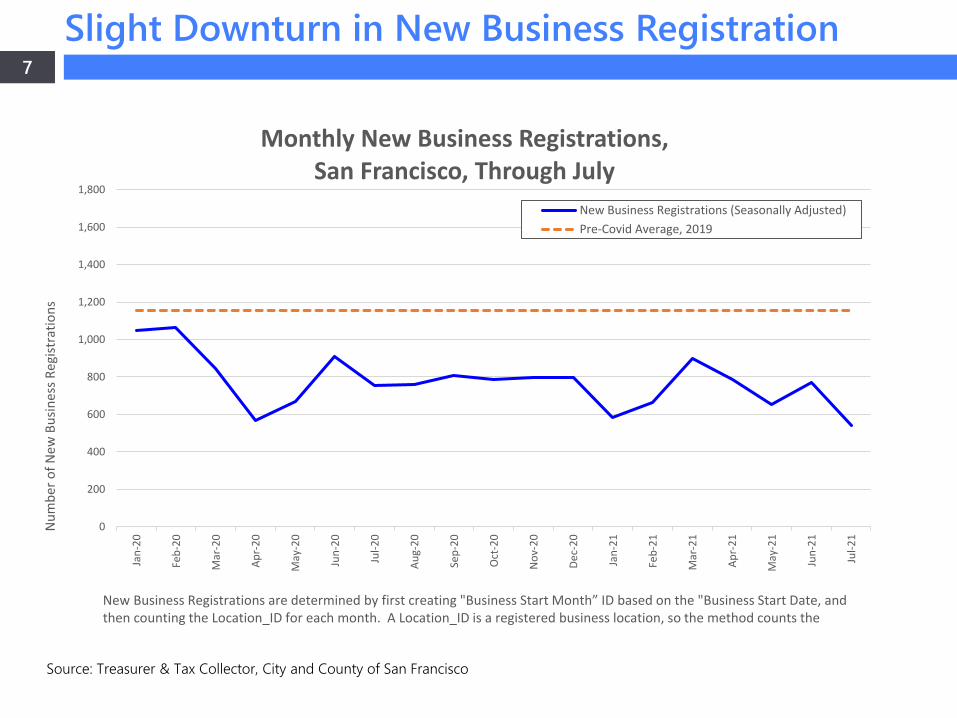
Slight Downturn in New Business Registration
0
200
400
600
800
1,000
1,200
1,400
1,600
1,800
Jan-
20
Feb-
20
Mar
-20
Apr-
20
May
-20
Jun-
20
Jul-2
0
Aug-
20
Sep-
20
Oct
-20
Nov
-20
Dec-
20
Jan-
21
Feb-
21
Mar
-21
Apr-
21
May
-21
Jun-
21
Jul-2
1
Num
ber o
f New
Bus
ines
s Reg
istra
tions
Monthly New Business Registrations,San Francisco, Through July
New Business Registrations (Seasonally Adjusted)Pre-Covid Average, 2019
New Business Registrations are determined by first creating "Business Start Month” ID based on the "Business Start Date, and then counting the Location_ID for each month. A Location_ID is a registered business location, so the method counts the
8
Source: California Employment Development Department (EDD)
Strong Employment Growth in July Despite Delta
700,000
750,000
800,000
850,000
900,000
950,000
1,000,000
1,050,000
1,100,000
1,150,000
1,200,000
1,250,000
1,300,000
Tota
l Ind
ustr
y Em
ploy
men
t
Total Industry Employment, San Francisco Metro Division, Through July
Total Industry Employment
Pre-Covid Average, 2019
The San Francisco Metro Division includes San Francisco and San Mateo counties.

9
Source: California Employment Development Department (EDD)
Hospitality and Professional Services Lead Growth
-8,000
-6,000
-4,000
-2,000
0
2,000
4,000
6,000
Employment Change by Industry Sector, June-July 2021:San Francisco Metropolitan Division
10
Source: STR
0
10
20
30
40
50
60
70
80
90
100
10/1
0/20
20
10/2
4/20
20
11/7
/202
0
11/2
1/20
20
12/5
/202
0
12/1
9/20
20
1/2/
2021
1/16
/202
1
1/30
/202
1
2/13
/202
1
2/27
/202
1
3/13
/202
1
3/27
/202
1
4/10
/202
1
4/24
/202
1
5/8/
2021
5/22
/202
1
6/5/
2021
6/19
/202
1
7/3/
2021
7/17
/202
1
7/31
/202
1
8/14
/202
1
Occ
upan
cy (%
)
Hotel Occupancy,San Francisco, From October 10, 2020 to August 14, 2021
Occupancy (TRI)
Pre-Covid Average, 2019
TRI (Total Room Inventory) takes in to account all the hotel rooms in the city, whether open or
SF Hotel Occupancy Holding Steady
11
Source: STR
$0
$50
$100
$150
$200
$250
$300
$350
$400
4/4/
2020
4/18
/202
0
5/2/
2020
5/16
/202
0
5/30
/202
0
6/13
/202
0
6/27
/202
0
7/11
/202
0
7/25
/202
0
8/8/
2020
8/22
/202
0
9/5/
2020
9/19
/202
0
10/3
/202
0
10/1
7/20
20
10/3
1/20
20
11/1
4/20
20
11/2
8/20
20
12/1
2/20
20
12/2
6/20
20
1/9/
2021
1/23
/202
1
2/6/
2021
2/20
/202
1
3/6/
2021
3/20
/202
1
4/3/
2021
4/17
/202
1
5/1/
2021
5/15
/202
1
5/29
/202
1
6/12
/202
1
6/26
/202
1
7/10
/202
1
7/24
/202
1
8/7/
2021
Aver
age
Daily
Rat
e pe
r Nig
ht ($
)
Hotel Average Daily Rate (ADR) per Night,San Francisco, Through August 14
ADR ($)
Pre-Covid Average, 2019
Hotel Room Rates Continuing to Rise
12
Source: STR
Despite Recovery, SF Still Lags Peer Cities
0%
20%
40%
60%
80%
100%
120%
140%
Reve
nue
Avai
labl
e pe
r Roo
m N
ight
as a
% o
f the
Sam
e M
onth
in 2
019
Monthly Hotel Revenue Available per Room Night,Selected Cities, Through June
San Francisco/San MateoSan DiegoLos AngelesPhoenixSeattleDenver
TRI (Total Room Inventory) takes in to account all the hotel rooms in the city, whether open or closed.
13
Source: SFO, SAN, LAX, PHX, SEA, DEN
Other Western Airports Closer to Full Recovery
0%
10%
20%
30%
40%
50%
60%
70%
80%
90%
100%
Tota
l Enp
lane
men
ts a
s a %
of t
he S
ame
Mon
th in
201
9
Total Enplanements (Domestic and International), Selected Airports, Through June
San FranciscoSan DiegoLos AngelesPhoenixSeattleDenver
14
Source: SF Travel
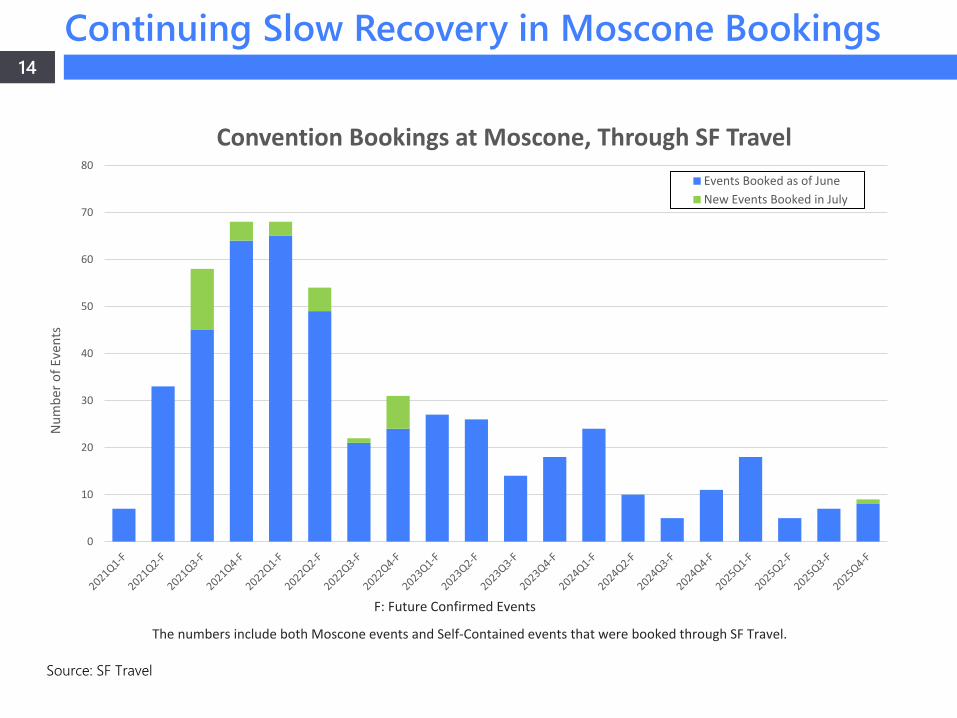
Continuing Slow Recovery in Moscone Bookings
0
10
20
30
40
50
60
70
80
Num
ber o
f Eve
nts
Convention Bookings at Moscone, Through SF TravelEvents Booked as of JuneNew Events Booked in July
F: Future Confirmed Events
The numbers include both Moscone events and Self-Contained events that were booked through SF Travel.
15
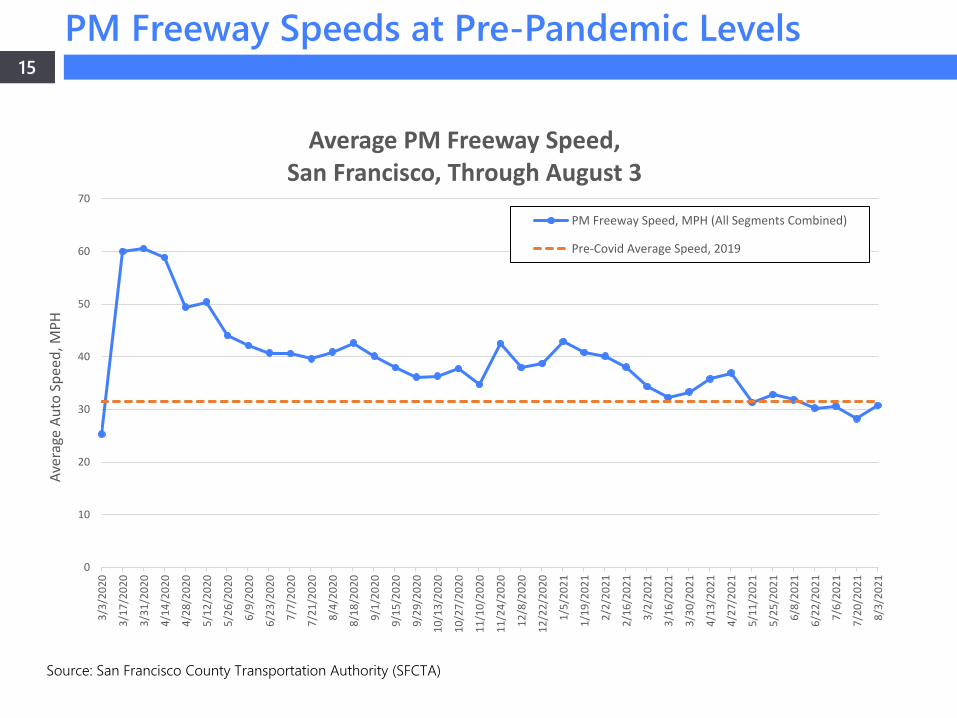
Source: San Francisco County Transportation Authority (SFCTA)
PM Freeway Speeds at Pre-Pandemic Levels
0
10
20
30
40
50
60
70
3/3/
2020
3/17
/202
0
3/31
/202
0
4/14
/202
0
4/28
/202
0
5/12
/202
0
5/26
/202
0
6/9/
2020
6/23
/202
0
7/7/
2020
7/21
/202
0
8/4/
2020
8/18
/202
0
9/1/
2020
9/15
/202
0
9/29
/202
0
10/1
3/20
20
10/2
7/20
20
11/1
0/20
20
11/2
4/20
20
12/8
/202
0
12/2
2/20
20
1/5/
2021
1/19
/202
1
2/2/
2021
2/16
/202
1
3/2/
2021
3/16
/202
1
3/30
/202
1
4/13
/202
1
4/27
/202
1
5/11
/202
1
5/25
/202
1
6/8/
2021
6/22
/202
1
7/6/
2021
7/20
/202
1
8/3/
2021
Aver
age
Auto
Spe
ed, M
PH
Average PM Freeway Speed,San Francisco, Through August 3
PM Freeway Speed, MPH (All Segments Combined)
Pre-Covid Average Speed, 2019

16
Source: Bay Area Toll Authority (BATA), Golden Gate Bridge Highway & Transportation District
Bridge Traffic Steady at 90% of Normal
0
1,000,000
2,000,000
3,000,000
4,000,000
5,000,000
6,000,000
7,000,000
Tota
l Mon
thly
Tra
ffic
Volu
me
Bay Bridge and Golden Gate Bridge Monthly Traffic Volume,San Francisco, Through July
Bay BridgeGolden Gate BridgePre-Covid Average, 2019
Includes Bay Bridge (Westbound Trips) and Golden Gate Bridge (Southbound Trips)
17
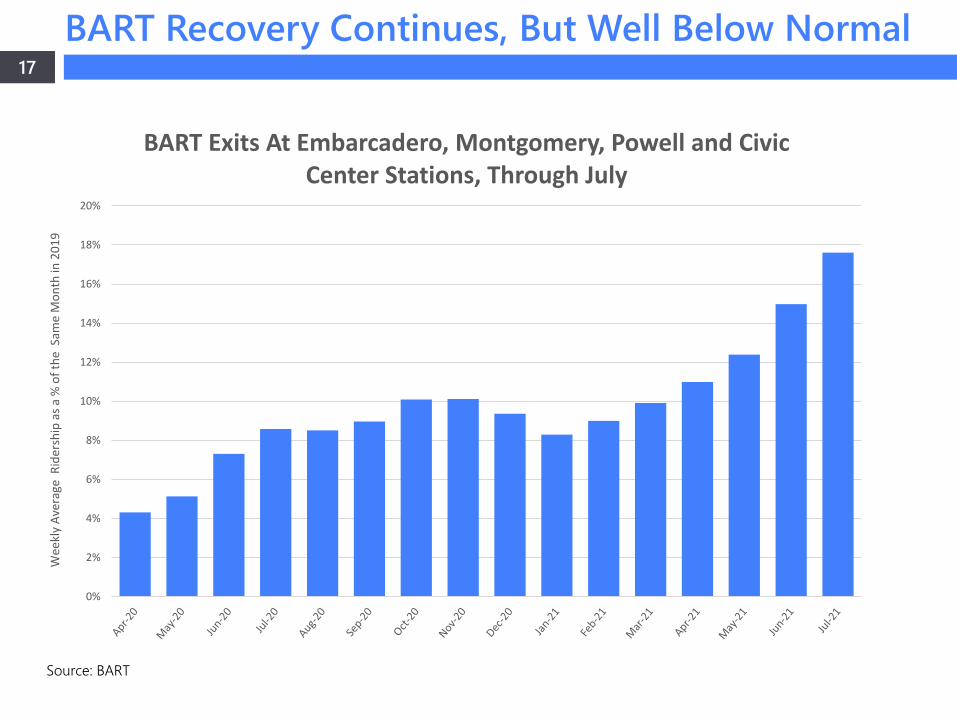
Source: BART
BART Recovery Continues, But Well Below Normal
0%
2%
4%
6%
8%
10%
12%
14%
16%
18%
20%
Wee
kly
Aver
age
Rid
ersh
ip a
s a %
of t
he S
ame
Mon
th in
201
9
BART Exits At Embarcadero, Montgomery, Powell and Civic Center Stations, Through July

18
Source: Apartment List
Apartment Rents Continue Rising; Still Down 17%
$0
$500
$1,000
$1,500
$2,000
$2,500
$3,000
$3,500
Aver
age
Aski
ng A
part
men
t Re
nt
Average Asking Apartment Rent,San Francisco, Through July
Average Asking Apartment RentPre-Pandemic Average, 2019
Overall Average, Blended Across All Unit Sizes
19
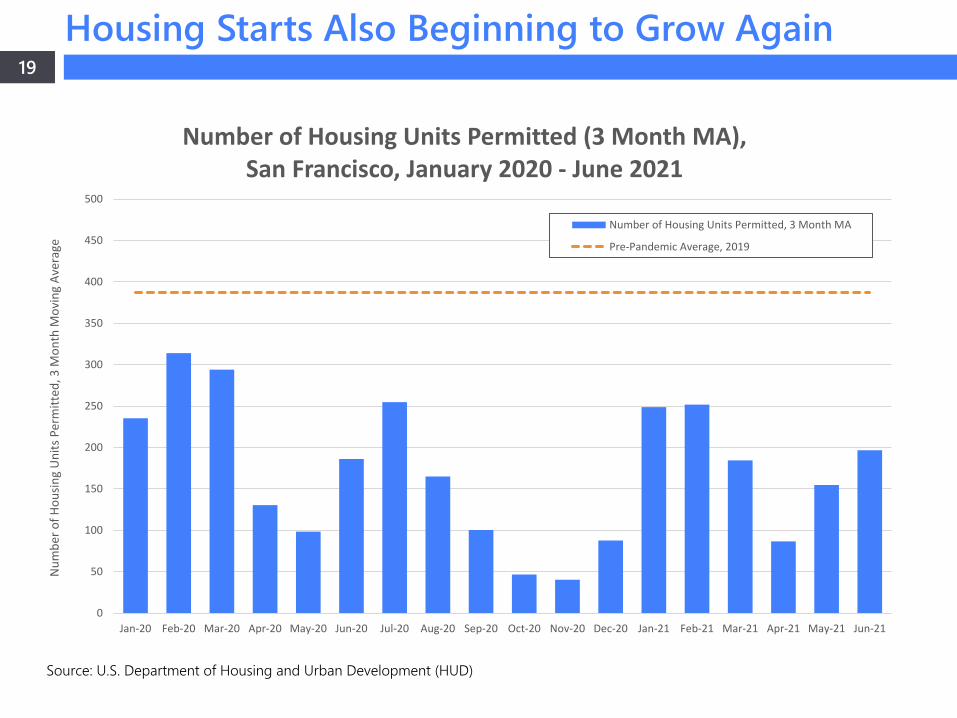
Source: U.S. Department of Housing and Urban Development (HUD)
Housing Starts Also Beginning to Grow Again
0
50
100
150
200
250
300
350
400
450
500
Jan-20 Feb-20 Mar-20 Apr-20 May-20 Jun-20 Jul-20 Aug-20 Sep-20 Oct-20 Nov-20 Dec-20 Jan-21 Feb-21 Mar-21 Apr-21 May-21 Jun-21
Num
ber o
f Hou
sing
Uni
ts P
erm
itted
, 3 M
onth
Mov
ing
Aver
age
Number of Housing Units Permitted (3 Month MA), San Francisco, January 2020 - June 2021
Number of Housing Units Permitted, 3 Month MA
Pre-Pandemic Average, 2019
Ted Egan, Ph.D., Chief Economist
Asim Khan, Ph.D., Senior Economist
20
Staff Contact