Embed Size (px)
Citation preview
Status of Renewable Energy (RE)
in Malaysia
Ir. Ahmad Hadri [email protected] Energy Centre (PTM)
EGNRET Meeting2nd – 3rd April 2009, Honolulu Hawaii
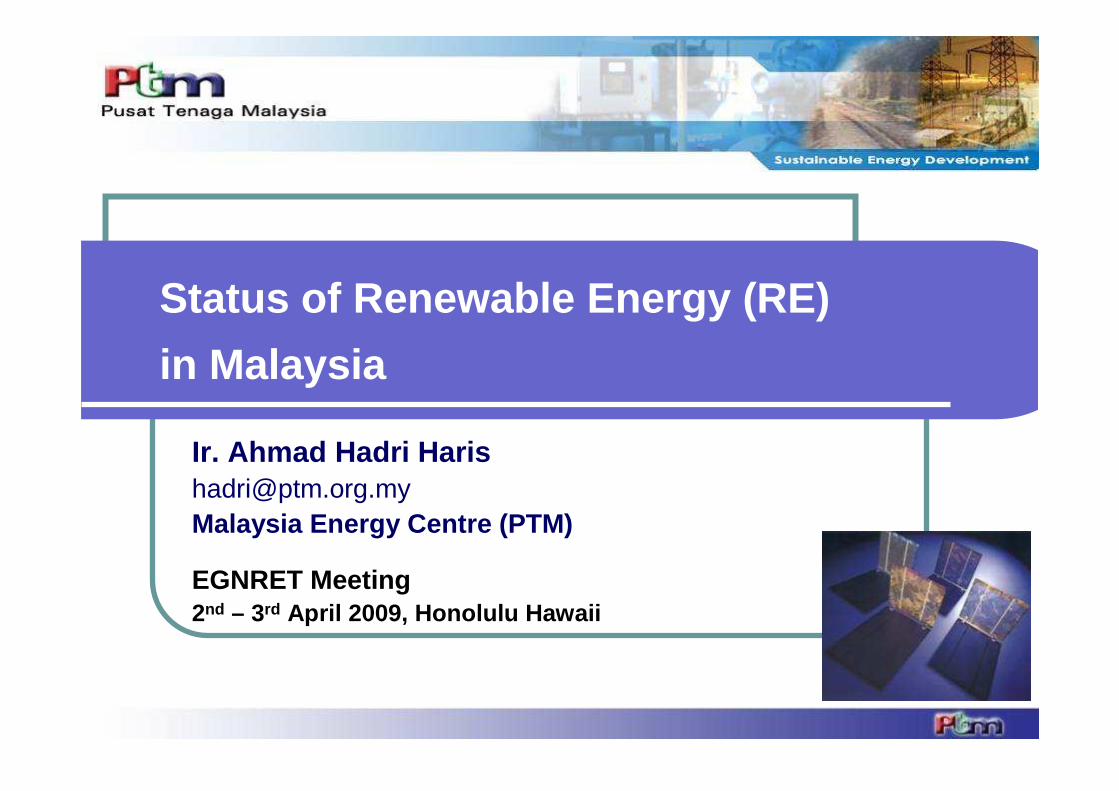
Renewable Energy Policy
2
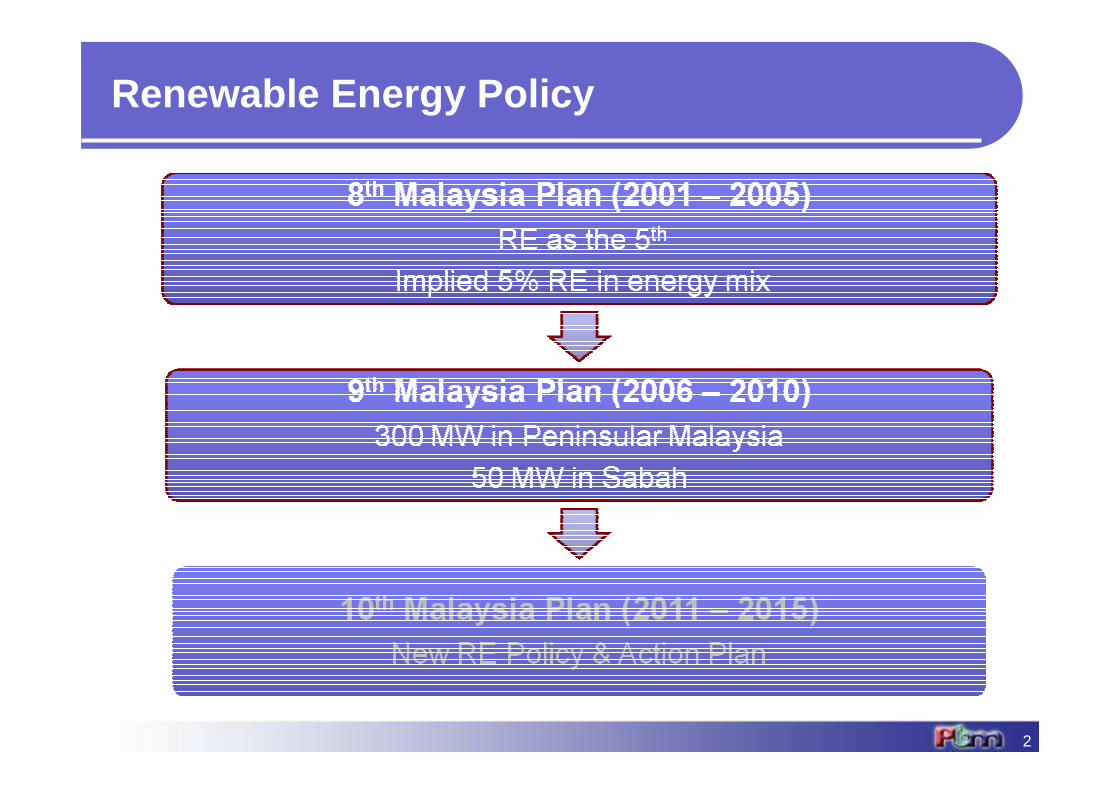
RE Potential
3
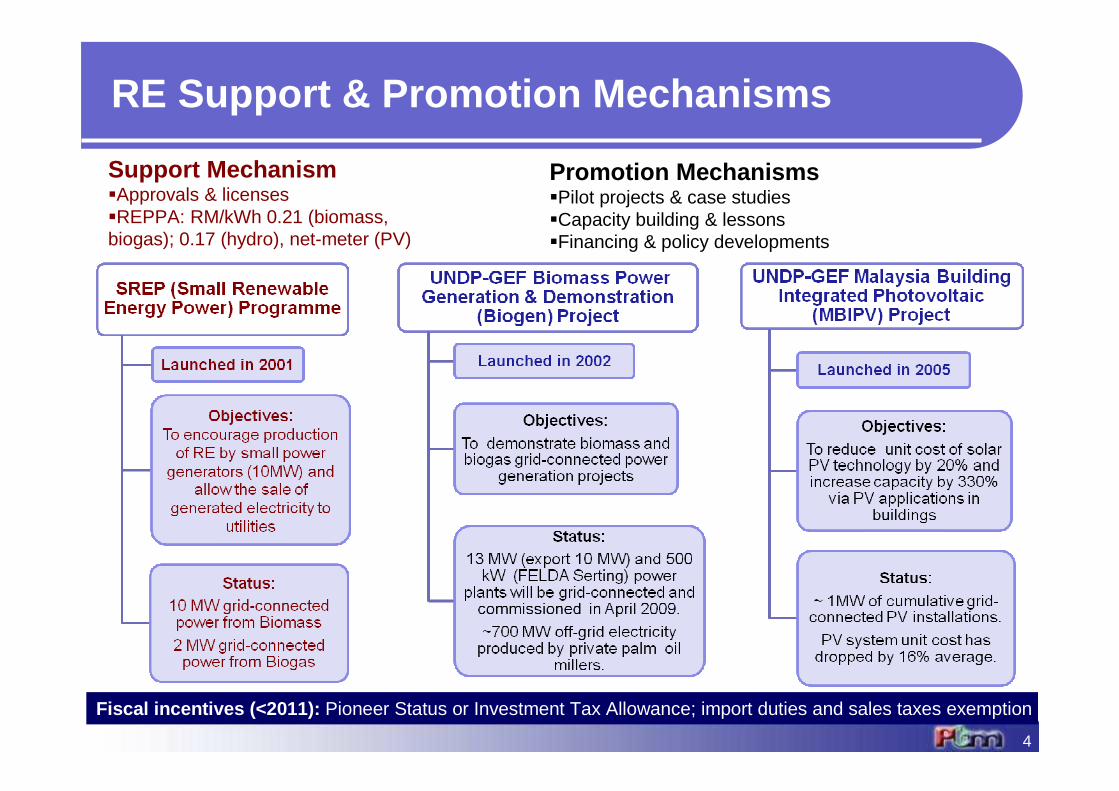
RE Support & Promotion Mechanisms
4
Support Mechanism�Approvals & licenses�REPPA: RM/kWh 0.21 (biomass, biogas); 0.17 (hydro), net-meter (PV)
Promotion Mechanisms�Pilot projects & case studies�Capacity building & lessons�Financing & policy developments
Fiscal incentives (<2011): Pioneer Status or Investment Tax Allowance; import duties and sales taxes exemption
5
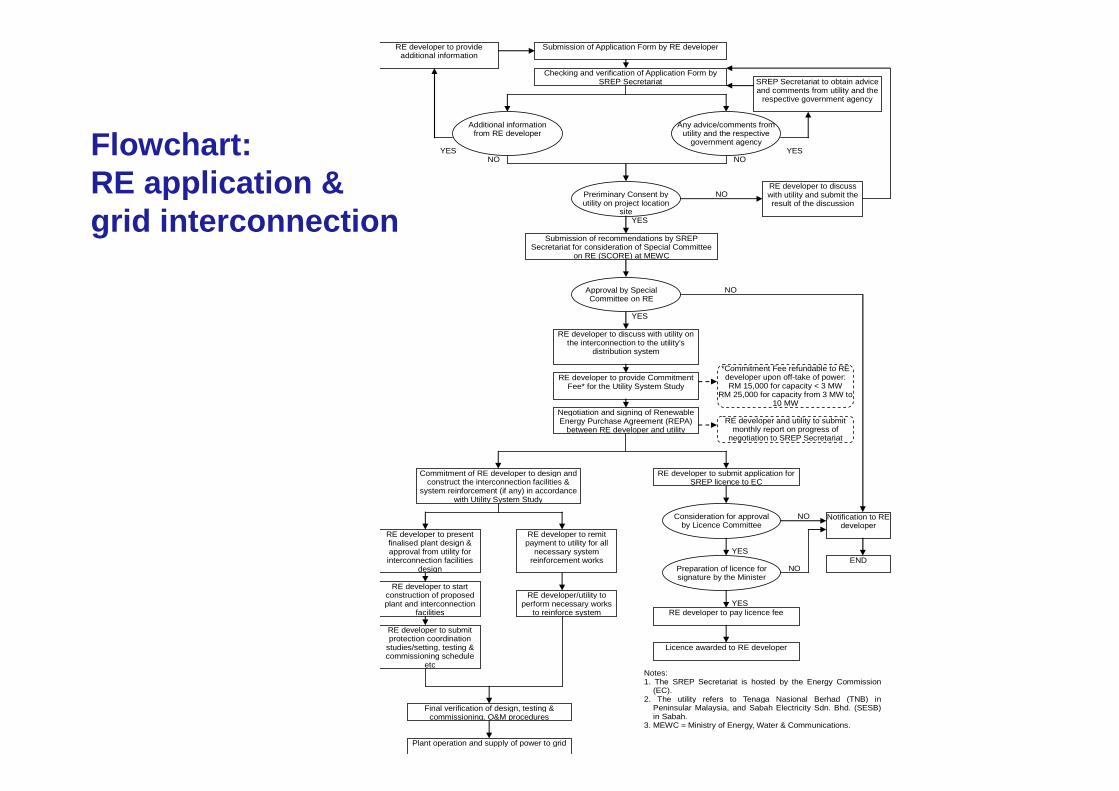
Submission of Application Form by RE developer
Checking and verification of Application Form by SREP Secretariat
RE developer to provide additional information
Additional information from RE developer
NO YES
SREP Secretariat to obtain advice and comments from utility and the
respective government agency
YES NO
Preriminary Consent by utility on project location
site
RE developer to discuss with utility and submit the result of the discussion
NO
Submission of recommendations by SREP Secretariat for consideration of Special Committee
on RE (SCORE) at MEWC
Approval by Special Committee on RE
RE developer to discuss with utility on the interconnection to the utility’s
distribution system
RE developer to provide Commitment Fee* for the Utility System Study
*Commitment Fee refundable to RE developer upon off-take of power: RM 15,000 for capacity < 3 MW
RM 25,000 for capacity from 3 MW to 10 MW
YES
YES
NO
Negotiation and signing of Renewable Energy Purchase Agreement (REPA)
between RE developer and utility RE developer and utility to submit
monthly report on progress of negotiation to SREP Secretariat
RE developer to submit application for SREP licence to EC
Consideration for approval by Licence Committee
Notification to RE developer
END
NO
YES
Preparation of licence for signature by the Minister
NO
YES RE developer to pay licence fee
Licence awarded to RE developer
Commitment of RE developer to design and construct the interconnection facilities &
system reinforcement (if any) in accordance with Utility System Study
RE developer to remit payment to utility for all
necessary system reinforcement works
RE developer to present finalised plant design & approval from utility for interconnection facilities
design
RE developer/utility to perform necessary works
to reinforce system
RE developer to start construction of proposed plant and interconnection
facilities
RE developer to submit protection coordination
studies/setting, testing & commissioning schedule
etc
Final verification of design, testing & commissioning, O&M procedures
Plant operation and supply of power to grid
Notes: 1. The SREP Secretariat is hosted by the Energy Commission
(EC). 2. The utility refers to Tenaga Nasional Berhad (TNB) in
Peninsular Malaysia, and Sabah Electricity Sdn. Bhd. (SESB) in Sabah.
3. MEWC = Ministry of Energy, Water & Communications.
Any advice/comments from utility and the respective
government agency Flowchart: RE application & grid interconnection
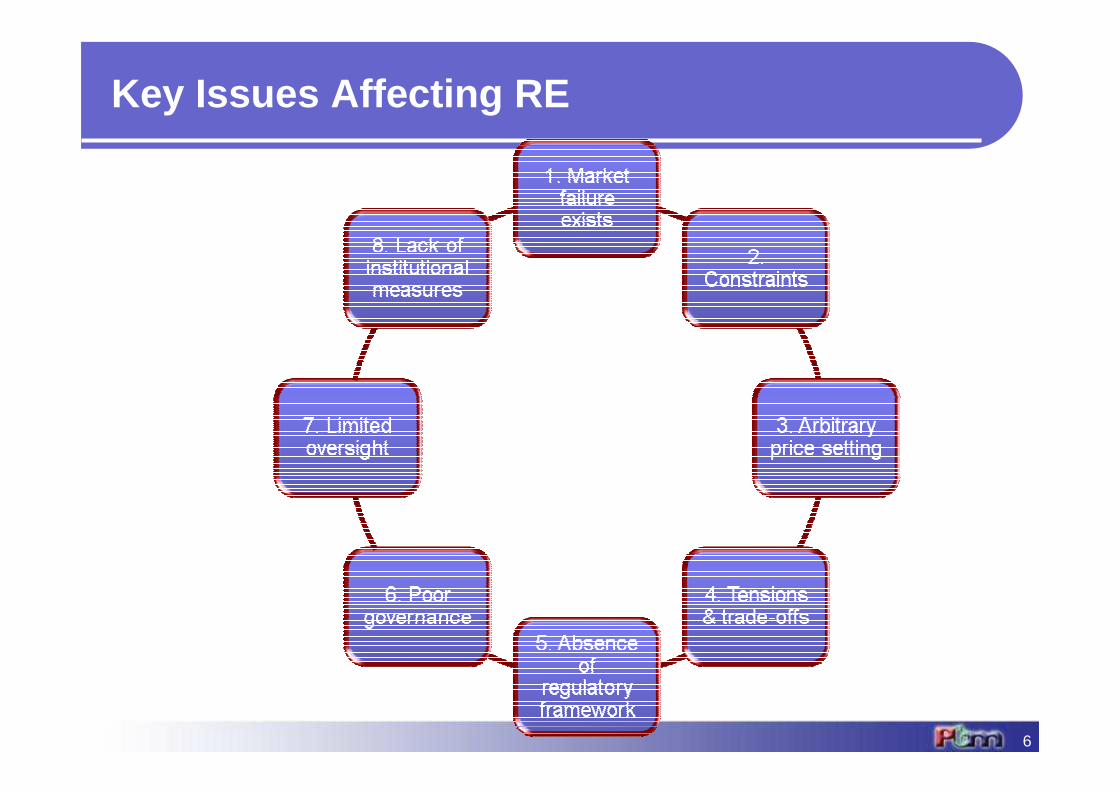
Key Issues Affecting RE
6
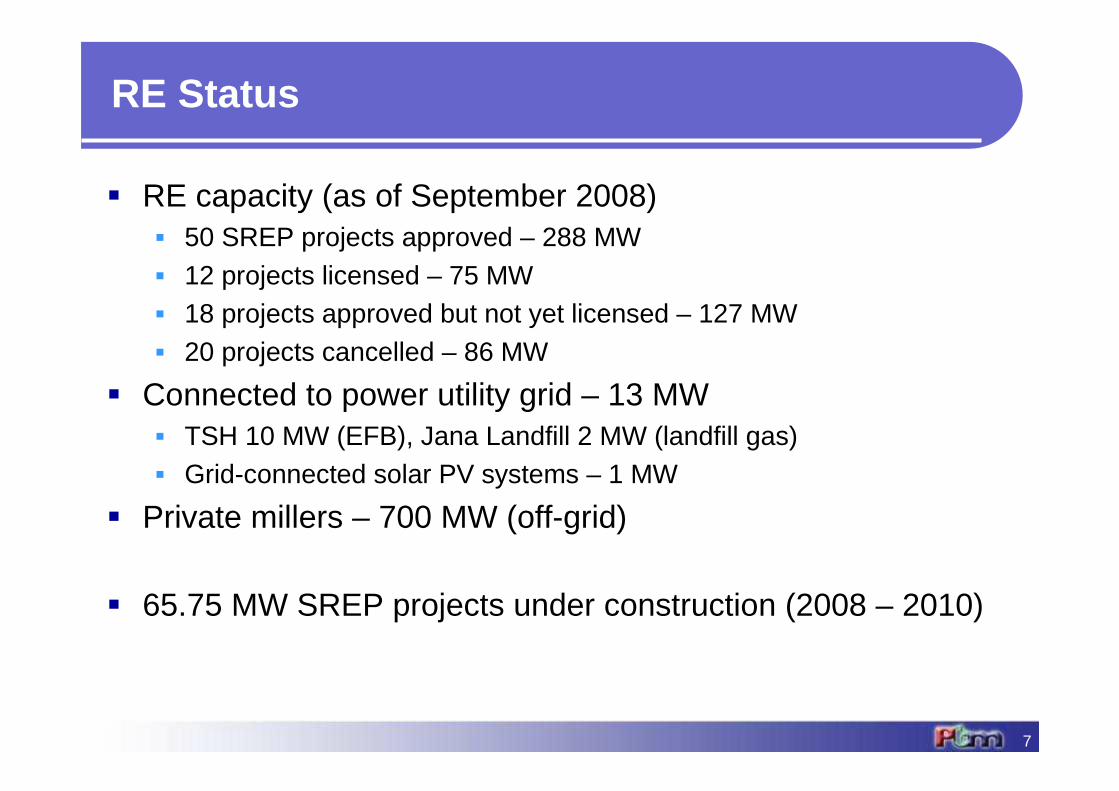
RE Status
� RE capacity (as of September 2008)� 50 SREP projects approved – 288 MW� 12 projects licensed – 75 MW� 18 projects approved but not yet licensed – 127 MW� 20 projects cancelled – 86 MW
� Connected to power utility grid – 13 MW � TSH 10 MW (EFB), Jana Landfill 2 MW (landfill gas)� Grid-connected solar PV systems – 1 MW
� Private millers – 700 MW (off-grid)
� 65.75 MW SREP projects under construction (2008 – 2010)
7
8
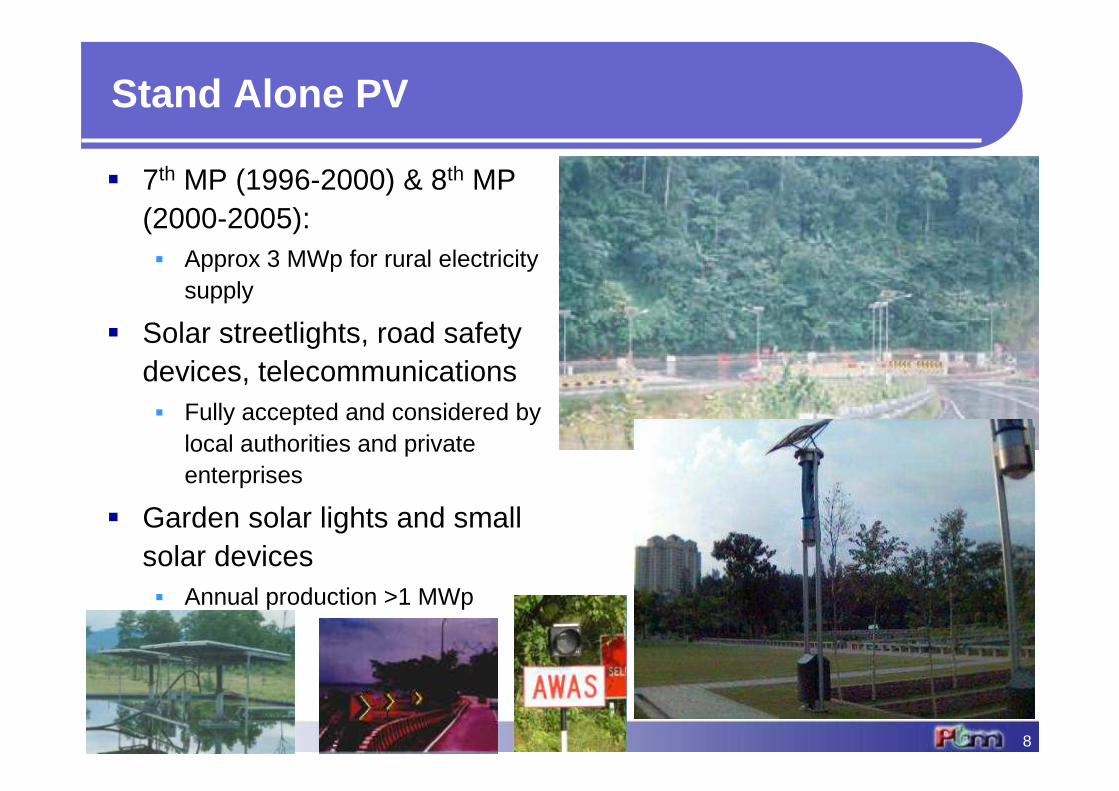
Stand Alone PV
� 7th MP (1996-2000) & 8th MP (2000-2005): � Approx 3 MWp for rural electricity
supply
� Solar streetlights, road safety devices, telecommunications� Fully accepted and considered by
local authorities and private enterprises
� Garden solar lights and small solar devices� Annual production >1 MWp
9
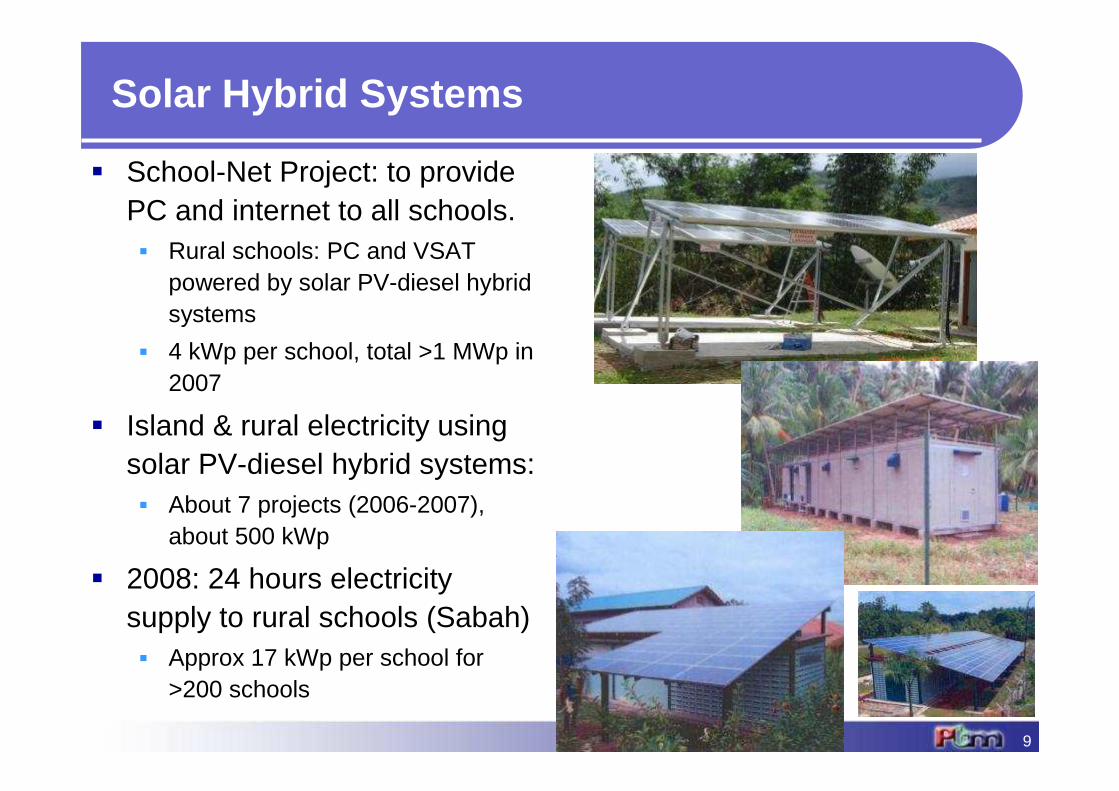
Solar Hybrid Systems
� School-Net Project: to provide PC and internet to all schools.� Rural schools: PC and VSAT
powered by solar PV-diesel hybrid systems
� 4 kWp per school, total >1 MWp in 2007
� Island & rural electricity using solar PV-diesel hybrid systems: � About 7 projects (2006-2007),
about 500 kWp
� 2008: 24 hours electricity supply to rural schools (Sabah)� Approx 17 kWp per school for
>200 schools
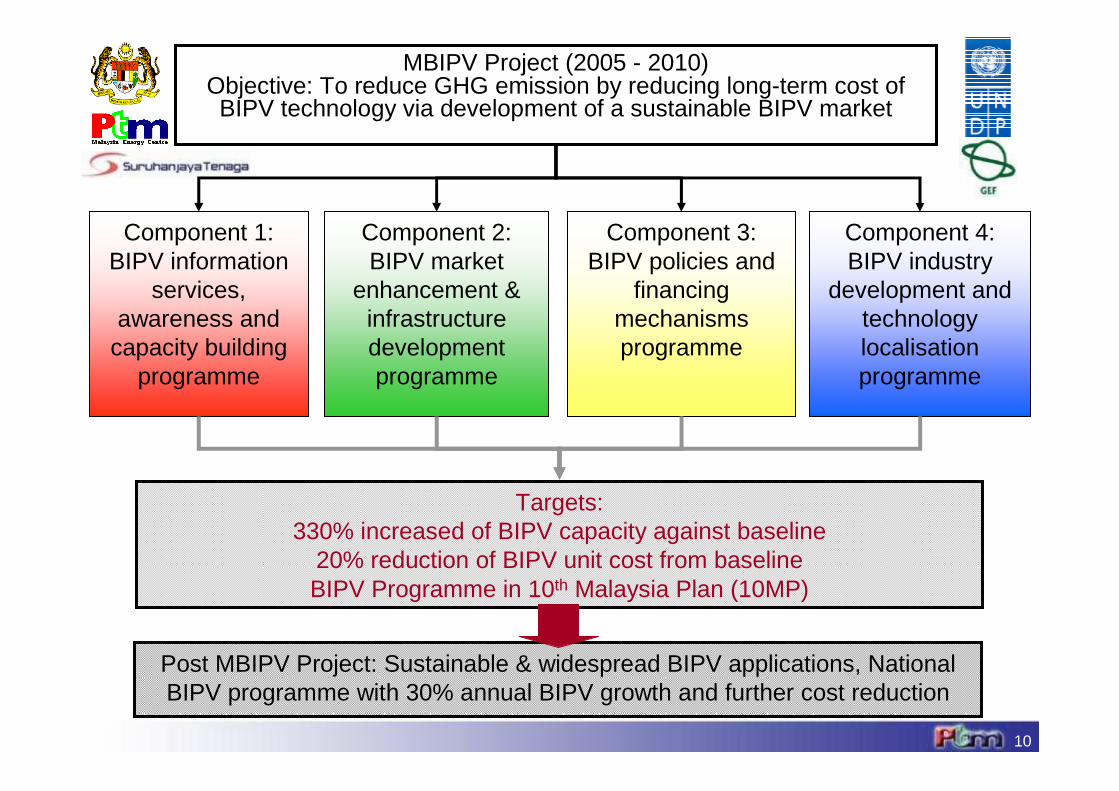
MBIPV Project (2005 - 2010)Objective: To reduce GHG emission by reducing long-term cost of BIPV technology via development of a sustainable BIPV market
Component 1: BIPV information
services, awareness and
capacity building programme
Component 4: BIPV industry
development and technology localisation programme
Component 2:BIPV market
enhancement & infrastructure development programme
Component 3: BIPV policies and
financing mechanisms programme
Targets:330% increased of BIPV capacity against baseline
20% reduction of BIPV unit cost from baseline BIPV Programme in 10th Malaysia Plan (10MP)
Post MBIPV Project: Sustainable & widespread BIPV applications, National BIPV programme with 30% annual BIPV growth and further cost reduction
10
11
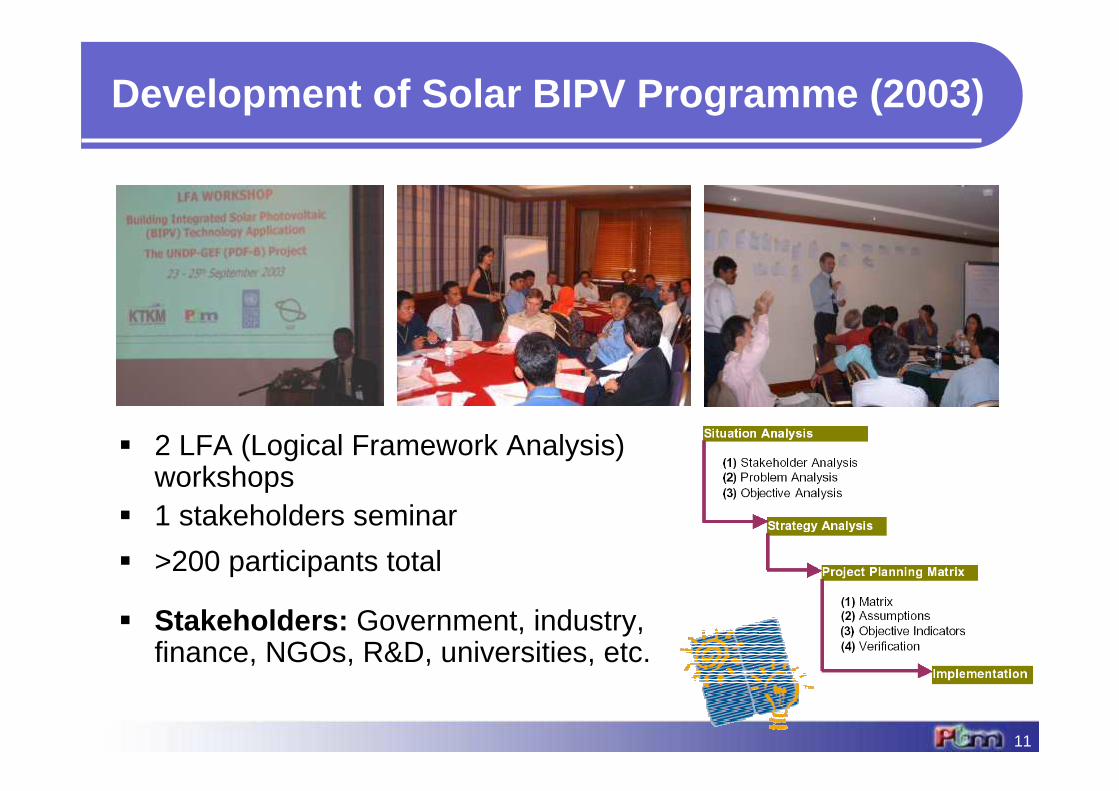
� 2 LFA (Logical Framework Analysis) workshops
� 1 stakeholders seminar
� >200 participants total
� Stakeholders: Government, industry, finance, NGOs, R&D, universities, etc.
Development of Solar BIPV Programme (2003)
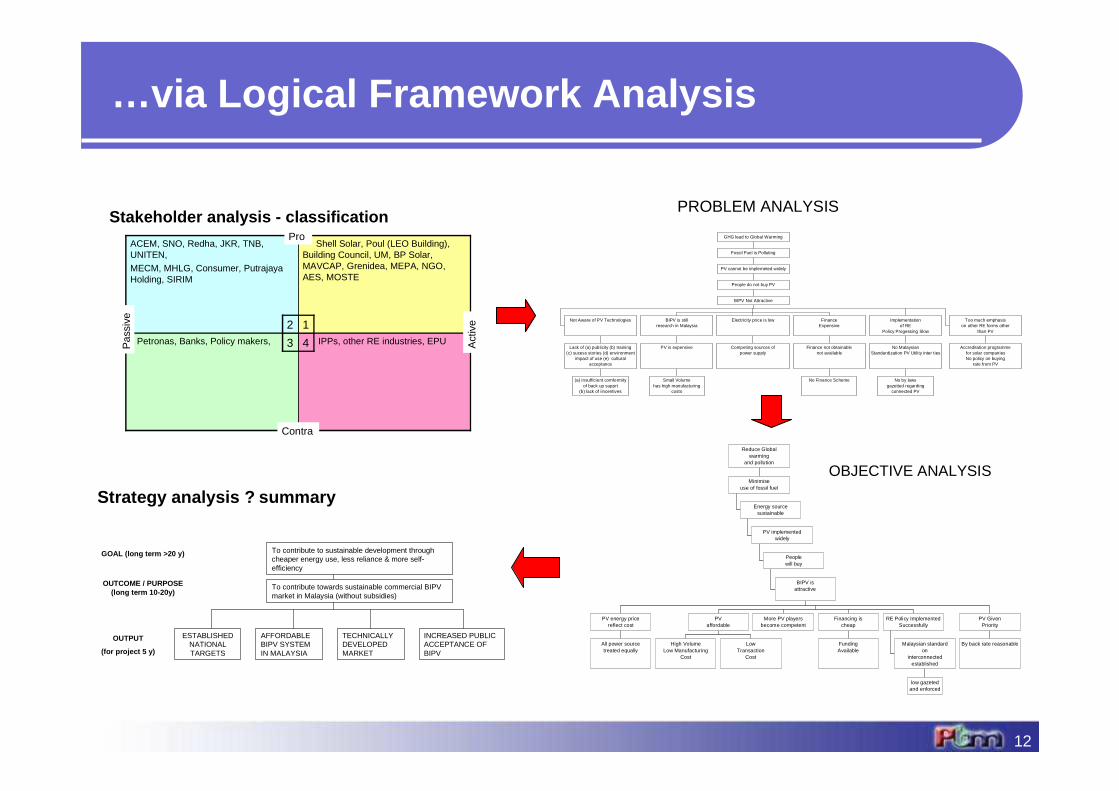
12
Stakeholder analysis - classification
IPPs, other RE industries, EPU Petronas, Banks, Policy makers,
Shell Solar, Poul (LEO Building),Building Council, UM, BP Solar,MAVCAP, Grenidea, MEPA, NGO,AES, MOSTE
ACEM, SNO, Redha, JKR, TNB,UNITEN,MECM, MHLG, Consumer, PutrajayaHolding, SIRIM
Pro
Contra
Pas
sive
Act
ive
43
12
All power sourcetreated equally
PV energy pricereflect cost
High VolumeLow Manufacturing
Cost
LowTransaction
Cost
PVaffordable
More PV playersbecome competent
FundingAvailable
Financing ischeap
low gazetedand enforced
Malaysian standardon
interconnectedestablished
RE Policy ImplementedSuccessfully
By back rate reasonable
PV GivenPriority
BIPV isattractive
Peoplewill buy
PV implementedwidely
Energy sourcesustainable
Minimiseuse of fossil fuel
Reduce Globalwarming
and pollution
OBJECTIVE ANALYSIS
(a) insufficient comformityof back up supprt
(b) lack of iincentives
Lack of (a) publicity (b) training(c) sucess stories (d) environment
impact of use (e) culturalacceptance
Not Aware of PV Technologies
Small Volumehas high manufacturing
costs
PV is expensive
BIPV is stillresearch in Malaysia
Competing sources ofpower supply
Electricity price is low
No Finance Scheme
Finance not obtainablenot available
FinanceExpensive
No by lawsgazetted regarding
connected PV
No MalaysianStandardization PV Utility inter ties
Implementationof RE
Policy Progessing Slow
Accreditation programmefor solar companiesNo policy on buying
rate from PV
Too much emphasison other RE forms other
than PV
BIPV Not Attractive
People do not buy PV
PV cannot be implemeted widely
Fossil Fuel is Polluting
GHG lead to Global Warming
PROBLEM ANALYSIS
Strategy analysis ? summary
ESTABLISHEDNATIONALTARGETS
AFFORDABLEBIPV SYSTEMIN MALAYSIA
TECHNICALLYDEVELOPEDMARKET
INCREASED PUBLICACCEPTANCE OFBIPV
To contribute towards sustainable commercial BIPVmarket in Malaysia (without subsidies)
To contribute to sustainable development throughcheaper energy use, less reliance & more self-efficiency
OUTPUT
(for project 5 y)
OUTCOME / PURPOSE(long term 10-20y)
GOAL (long term >20 y)
…via Logical Framework Analysis
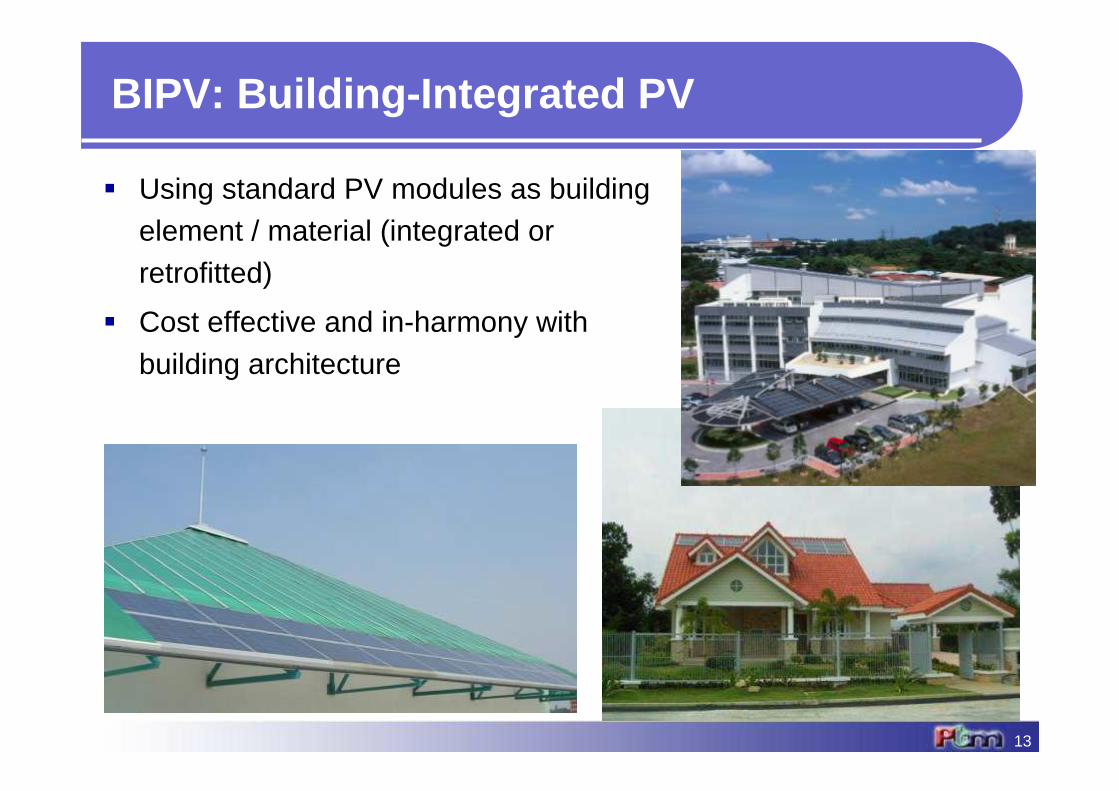
� Using standard PV modules as building element / material (integrated or retrofitted)
� Cost effective and in-harmony with building architecture
BIPV: Building-Integrated PV
13
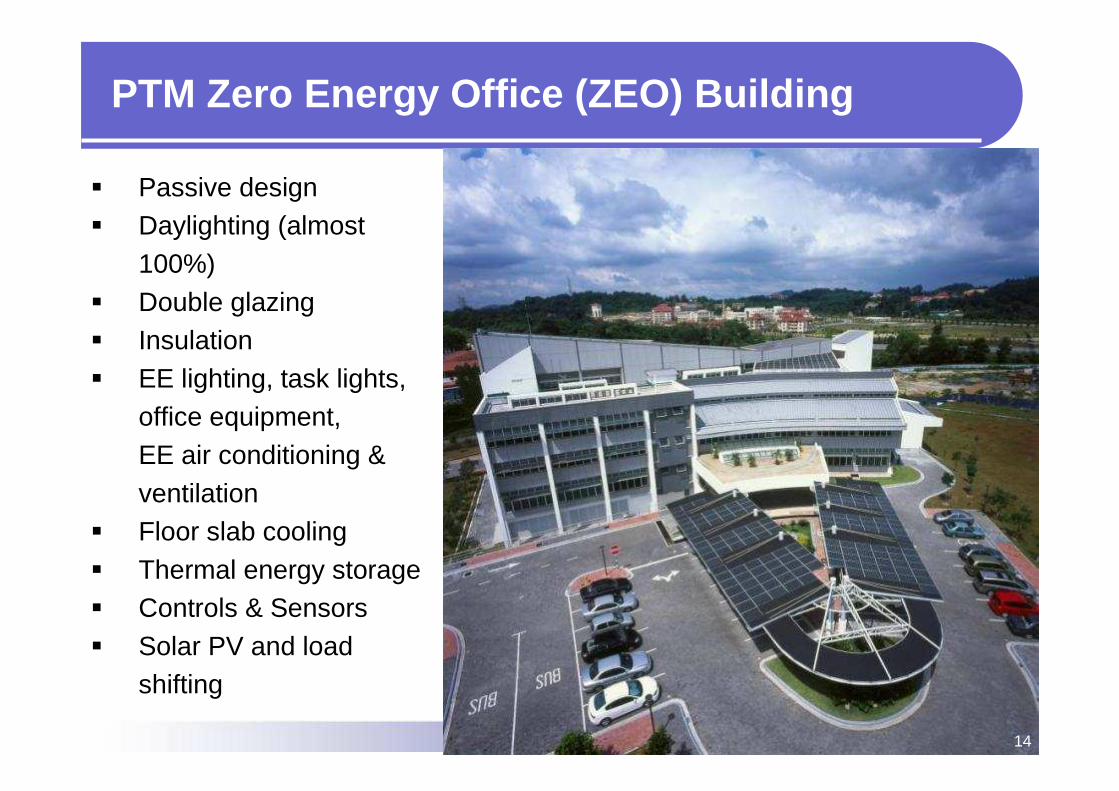
� Passive design� Daylighting (almost
100%)� Double glazing� Insulation� EE lighting, task lights,
office equipment, EE air conditioning & ventilation
� Floor slab cooling� Thermal energy storage� Controls & Sensors� Solar PV and load
shifting
PTM Zero Energy Office (ZEO) Building
14
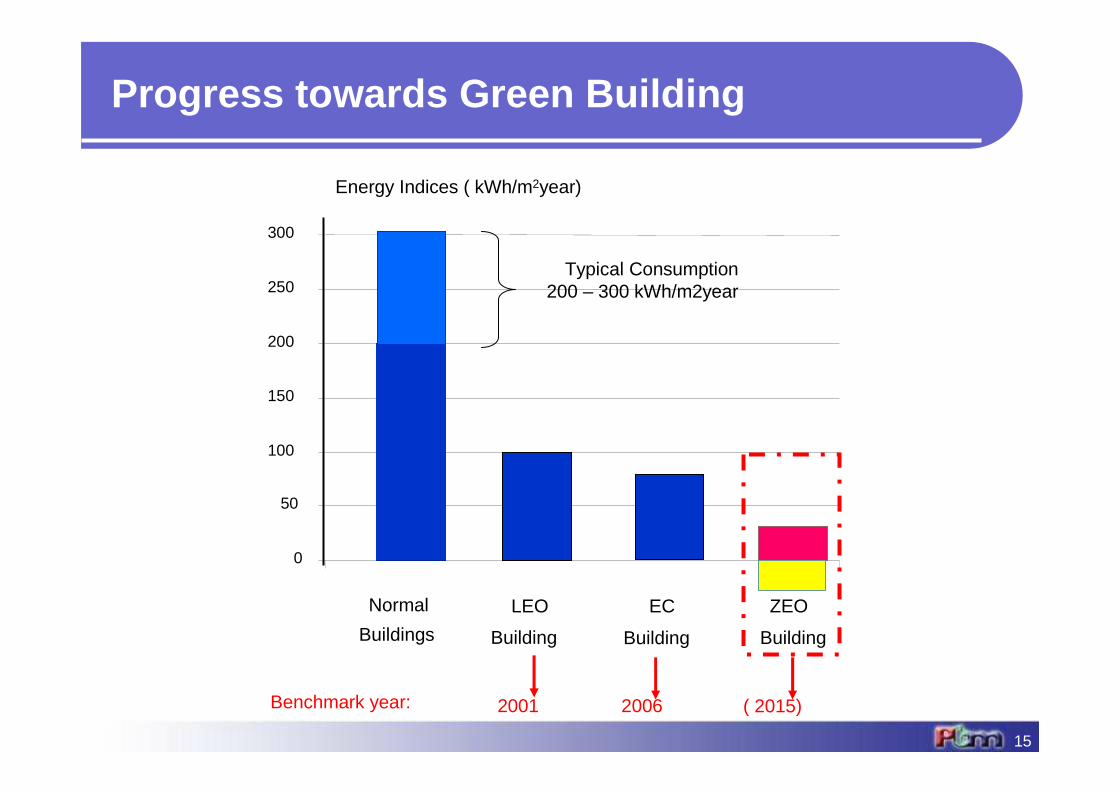
Energy Indices ( kWh/m2year)
0
50
100
150
200
250
300
Normal
Buildings
LEO
Building
ZEO
Building
EC
Building
Typical Consumption200 – 300 kWh/m2year
2001 2006 ( 2015) Benchmark year:
Progress towards Green Building
15
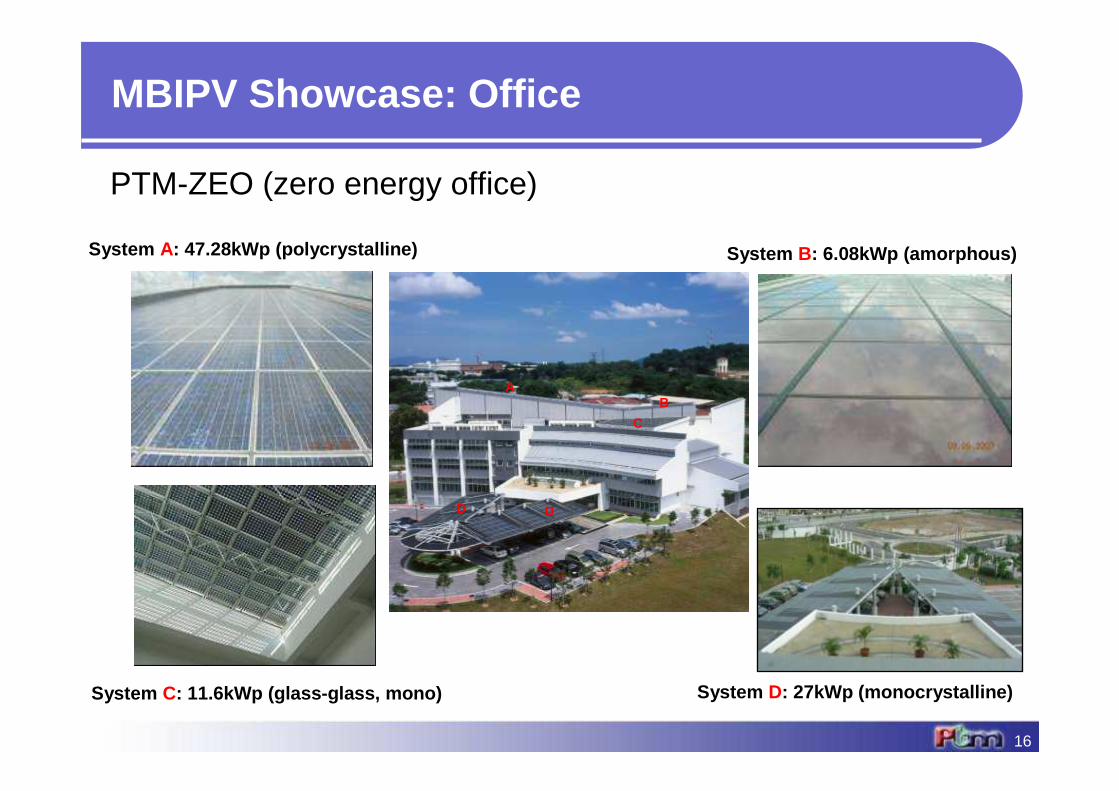
16
AB
C
D D
System A: 47.28kWp (polycrystalline) System B: 6.08kWp (amorphous)
System C: 11.6kWp (glass-glass, mono) System D: 27kWp (monocrystalline)
MBIPV Showcase: Office
PTM-ZEO (zero energy office)
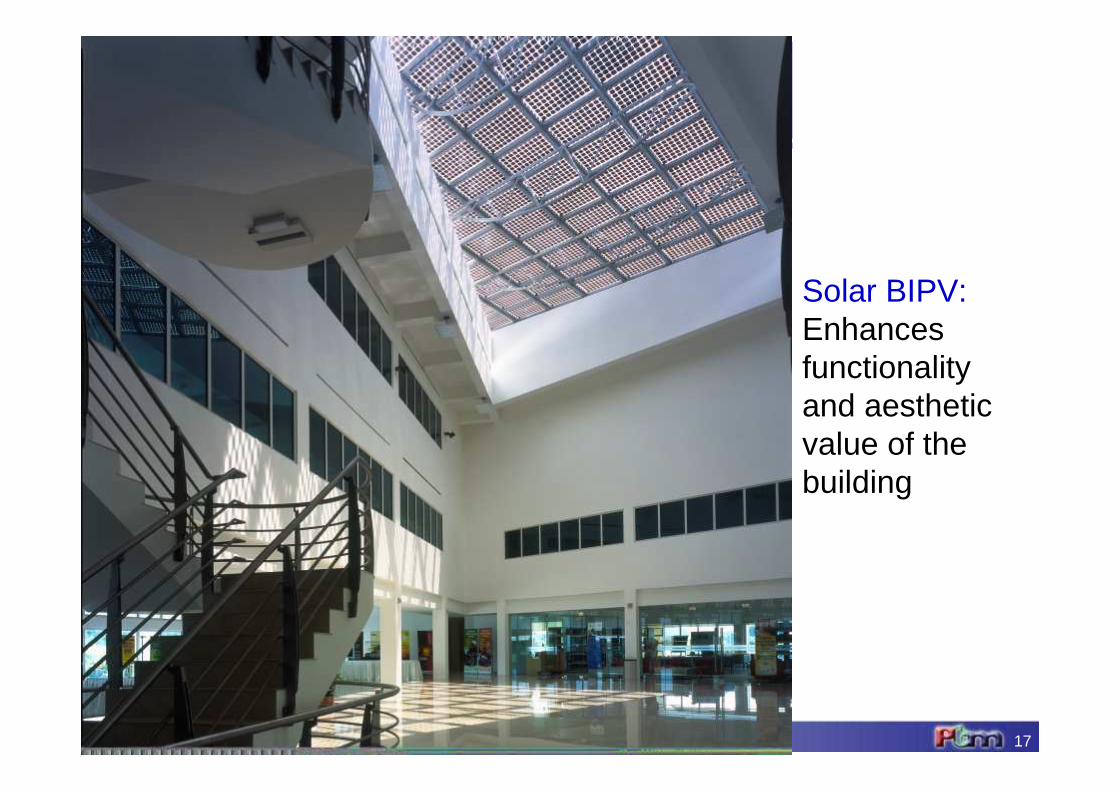
17
Solar BIPV: Enhances functionality and aesthetic value of the building
18
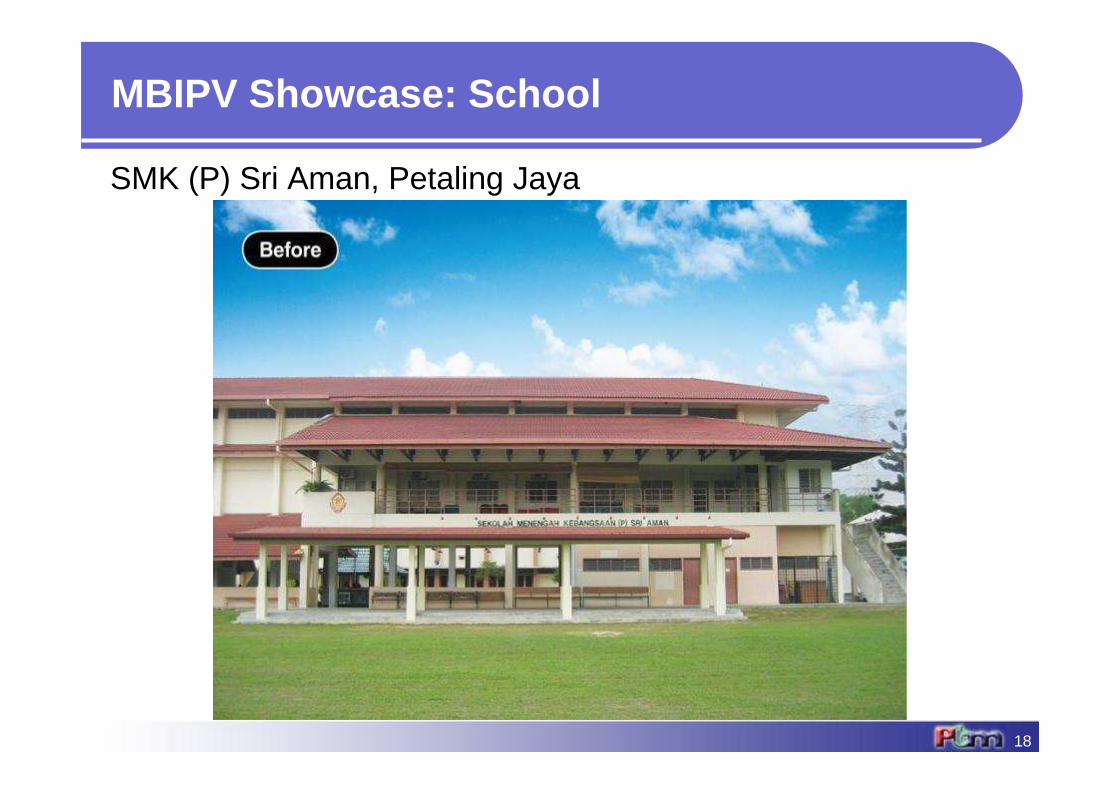
MBIPV Showcase: School
SMK (P) Sri Aman, Petaling Jaya
19
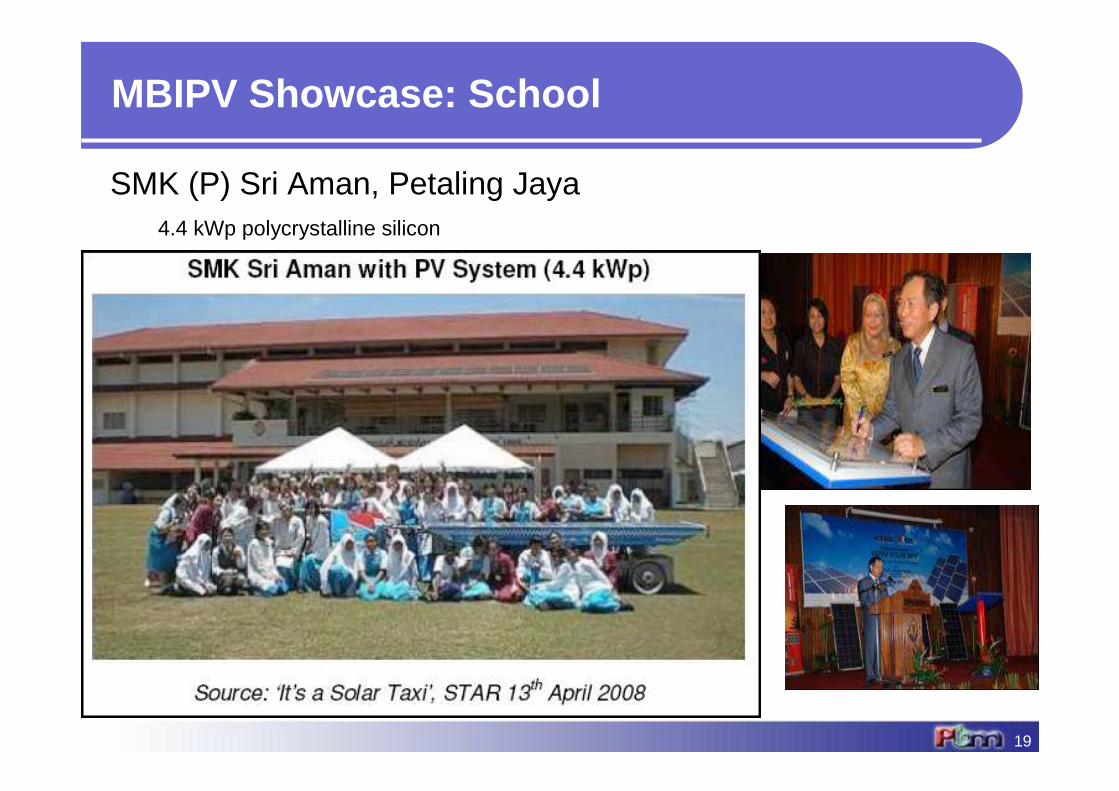
MBIPV Showcase: School
SMK (P) Sri Aman, Petaling Jaya4.4 kWp polycrystalline silicon
20
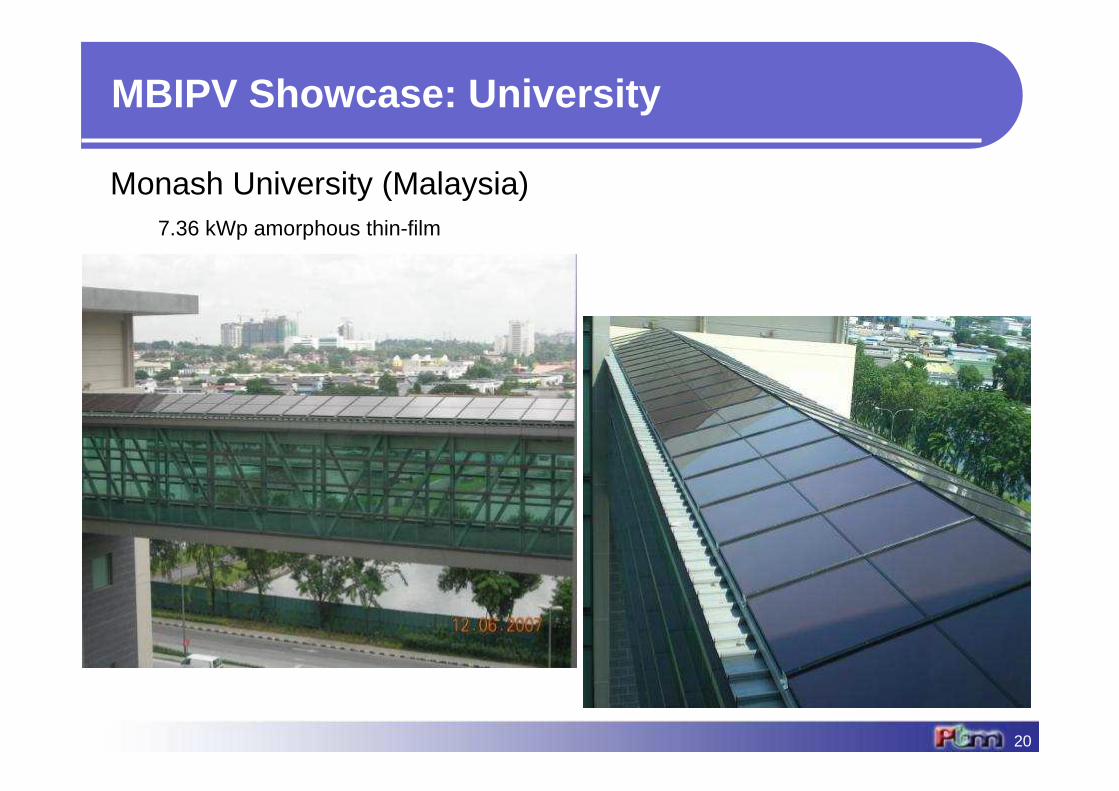
MBIPV Showcase: University
Monash University (Malaysia)7.36 kWp amorphous thin-film
21
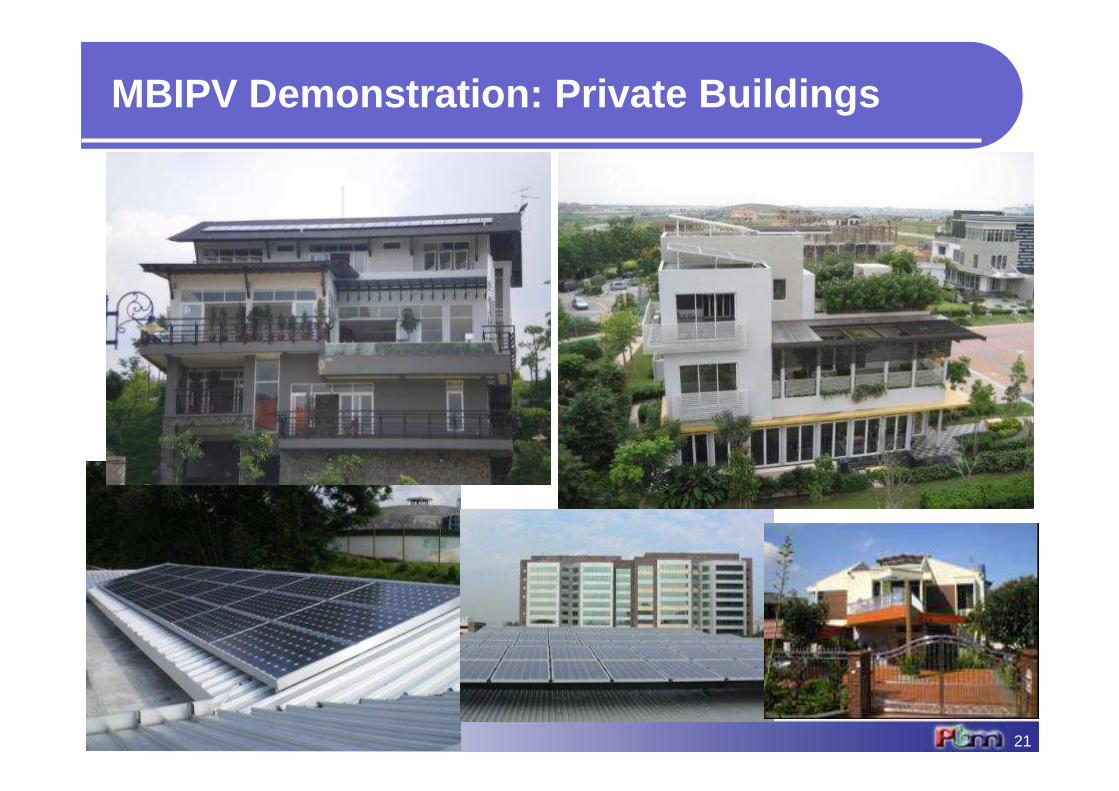
MBIPV Demonstration: Private Buildings
22
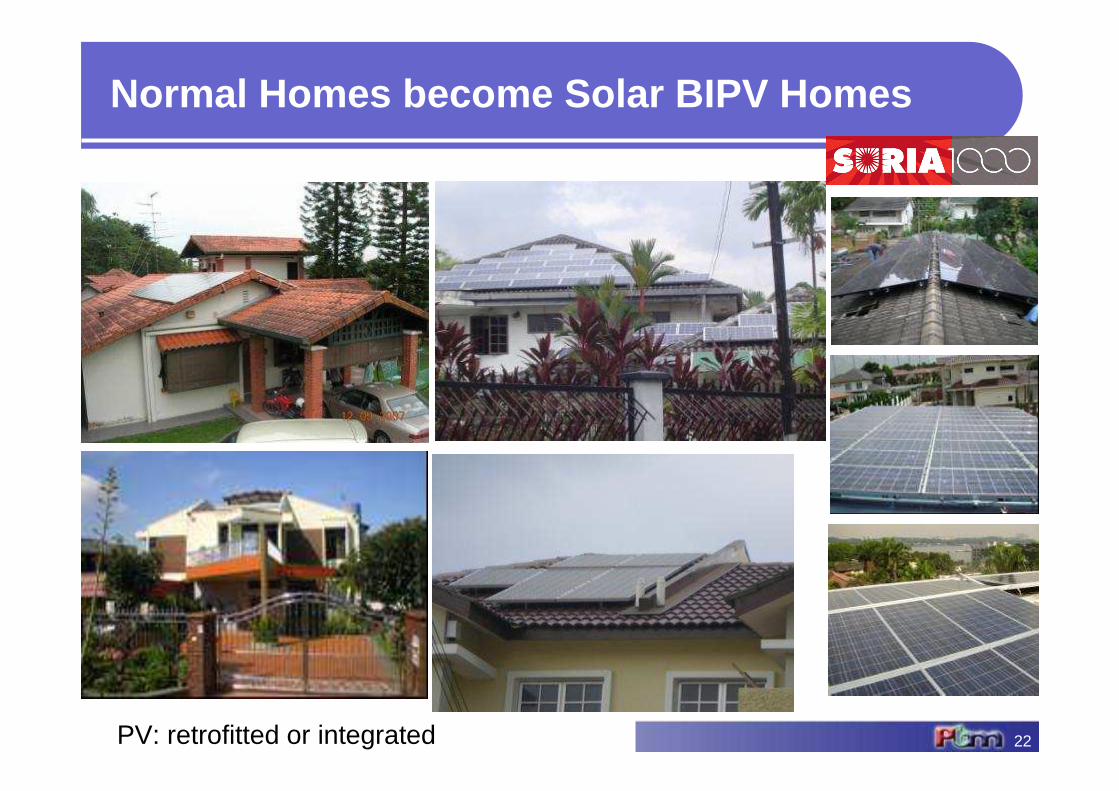
Normal Homes become Solar BIPV Homes
PV: retrofitted or integrated

23
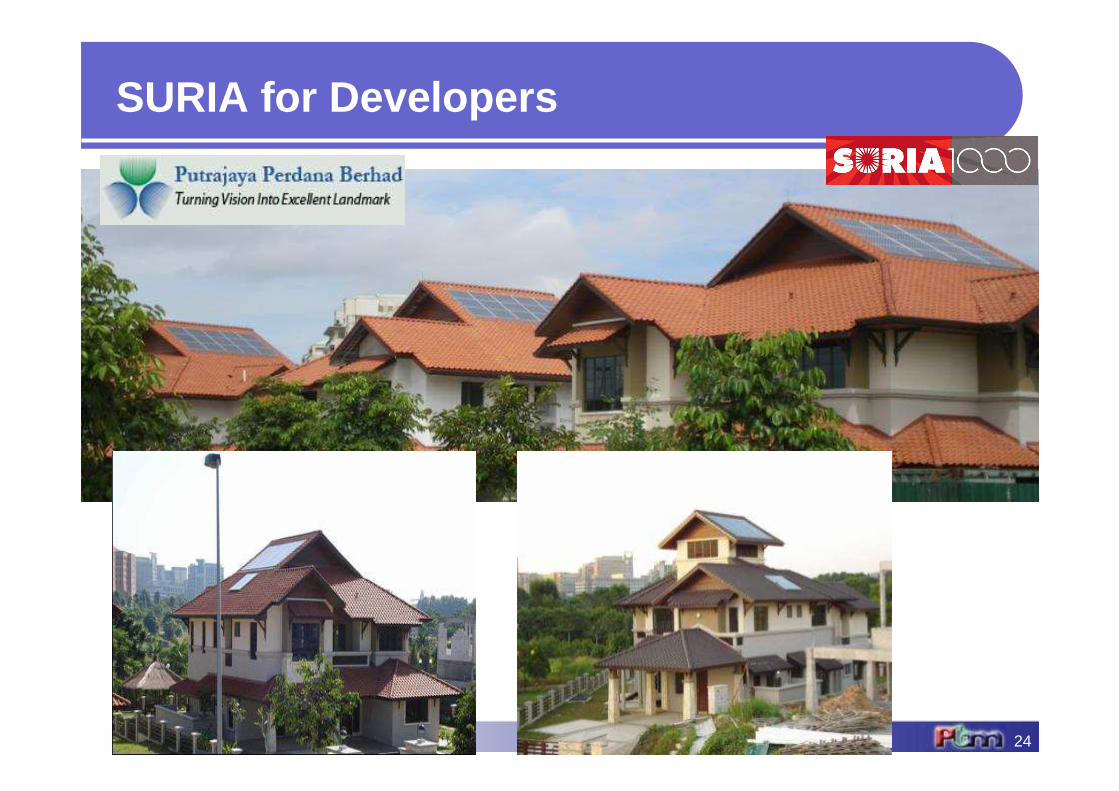
National PV Conference 2008
SURIA for Developers
24
SURIA for Developers
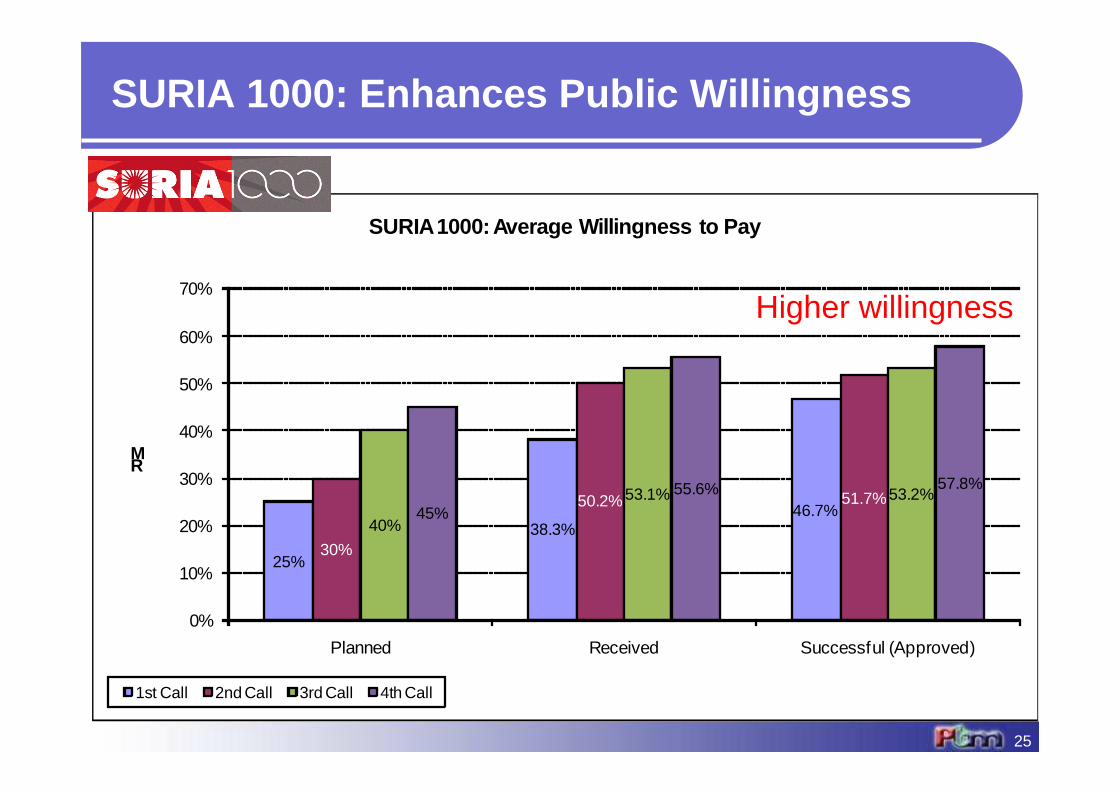
25%
38.3%46.7%
30%
50.2% 51.7%
40%
53.1% 53.2%45%
55.6% 57.8%
0%
10%
20%
30%
40%
50%
60%
70%
Planned Received Successful (Approved)
RM
SURIA 1000: Average Willingness to Pay
1st Call 2nd Call 3rd Call 4th Call
Key Impact
Higher willingness
SURIA 1000: Enhances Public Willingness
25
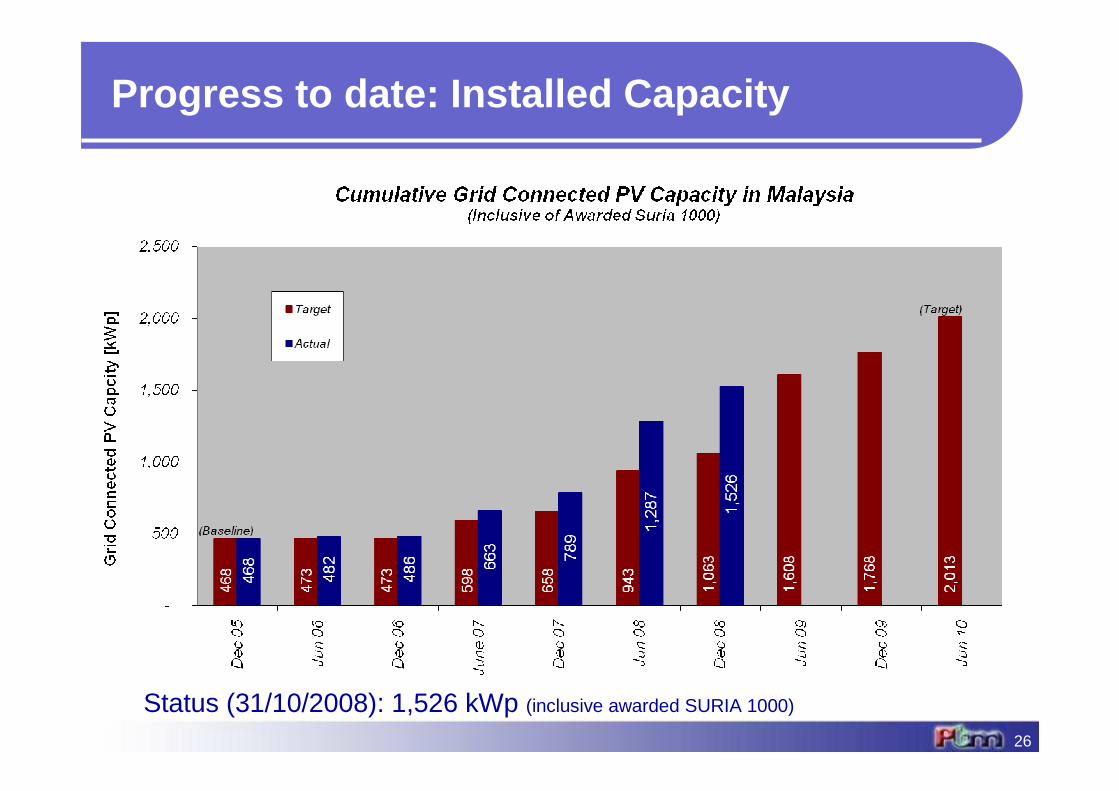
Status (31/10/2008): 1,526 kWp (inclusive awarded SURIA 1000)
Progress to date: Installed Capacity
26
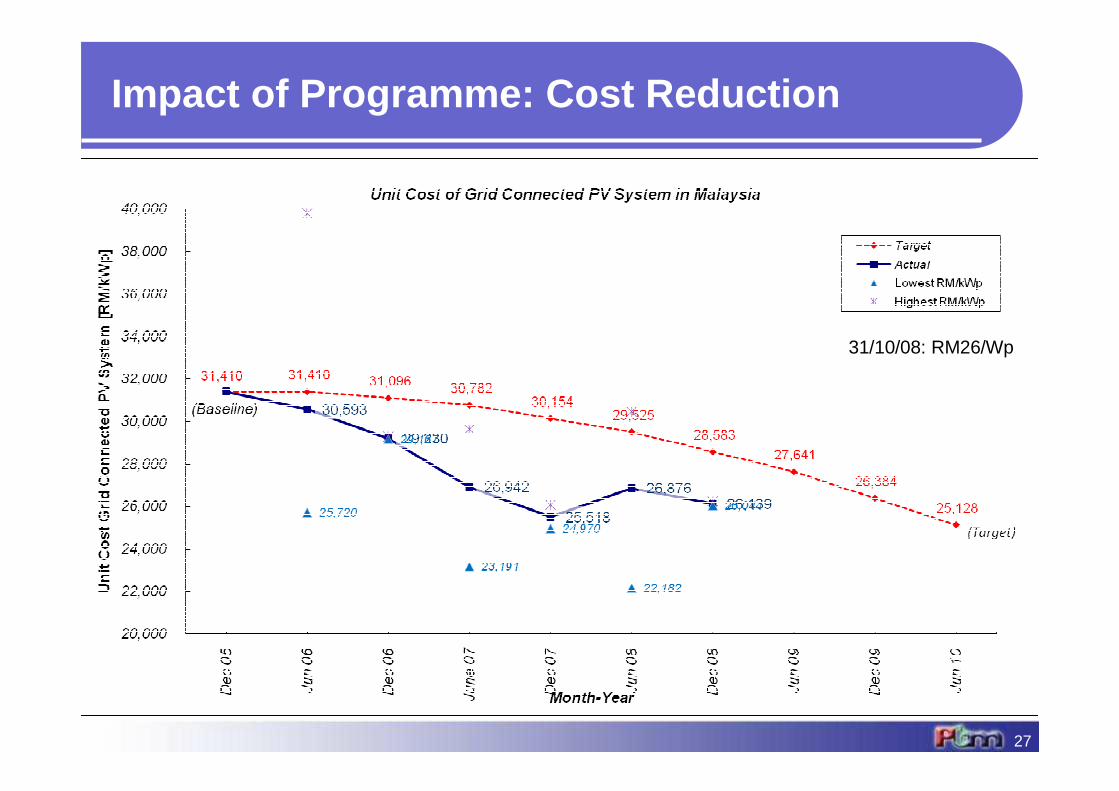
31/10/08: RM26/Wp
Impact of Programme: Cost Reduction
27
28
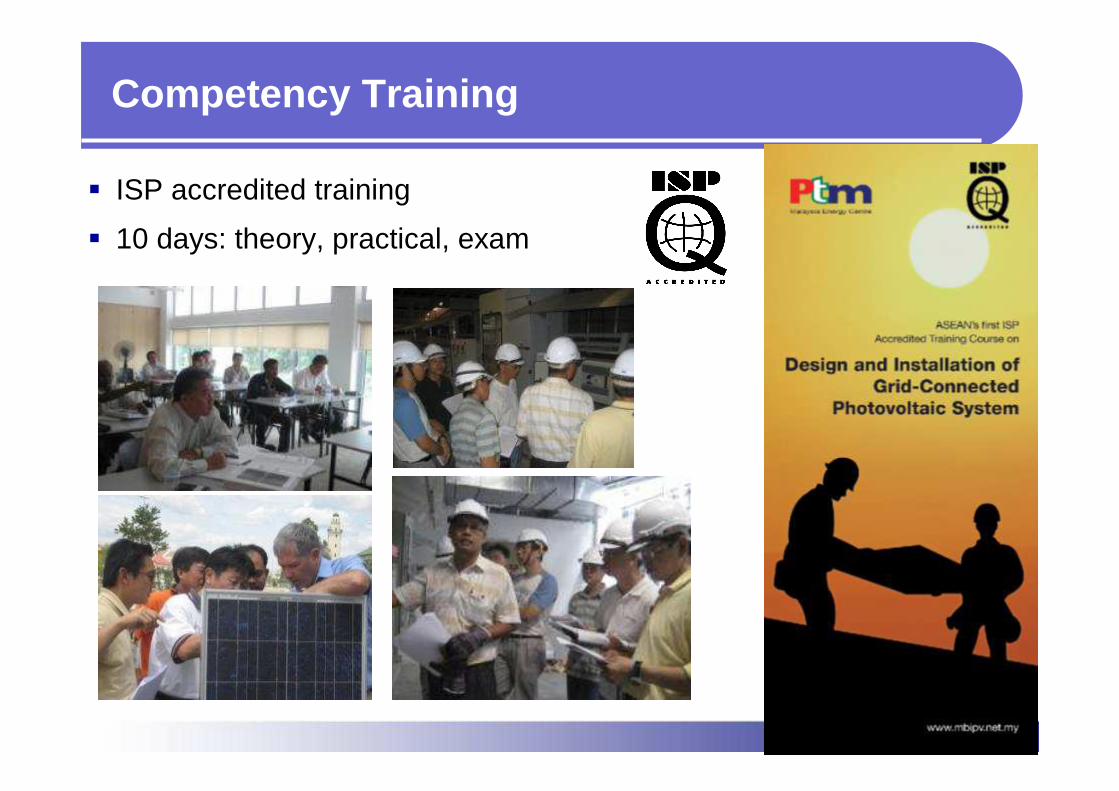
� ISP accredited training
� 10 days: theory, practical, exam
Competency Training
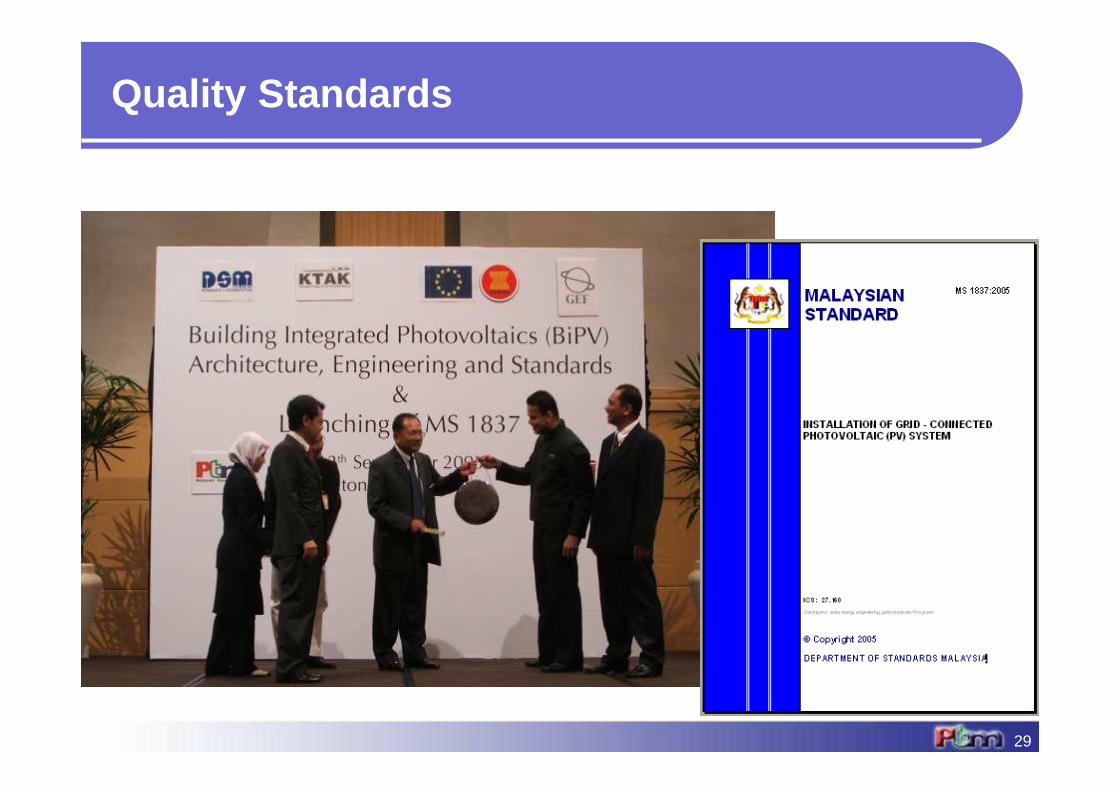
Quality Standards
29
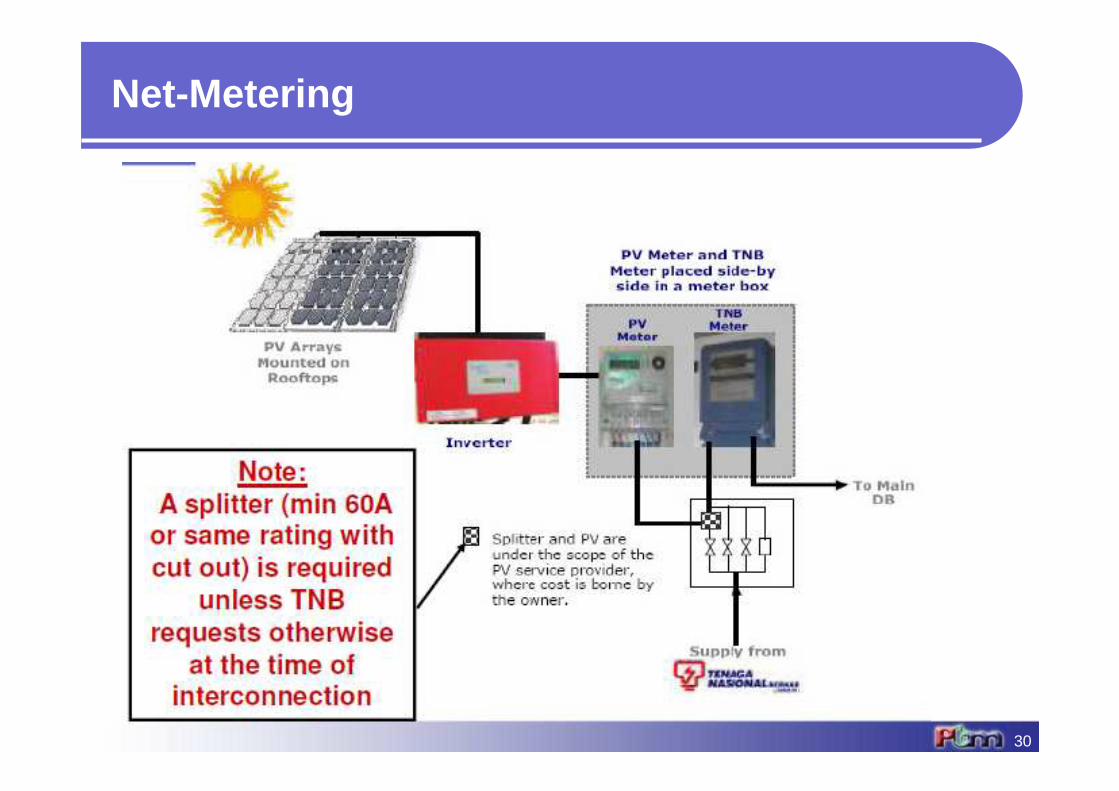
Net-Metering
30
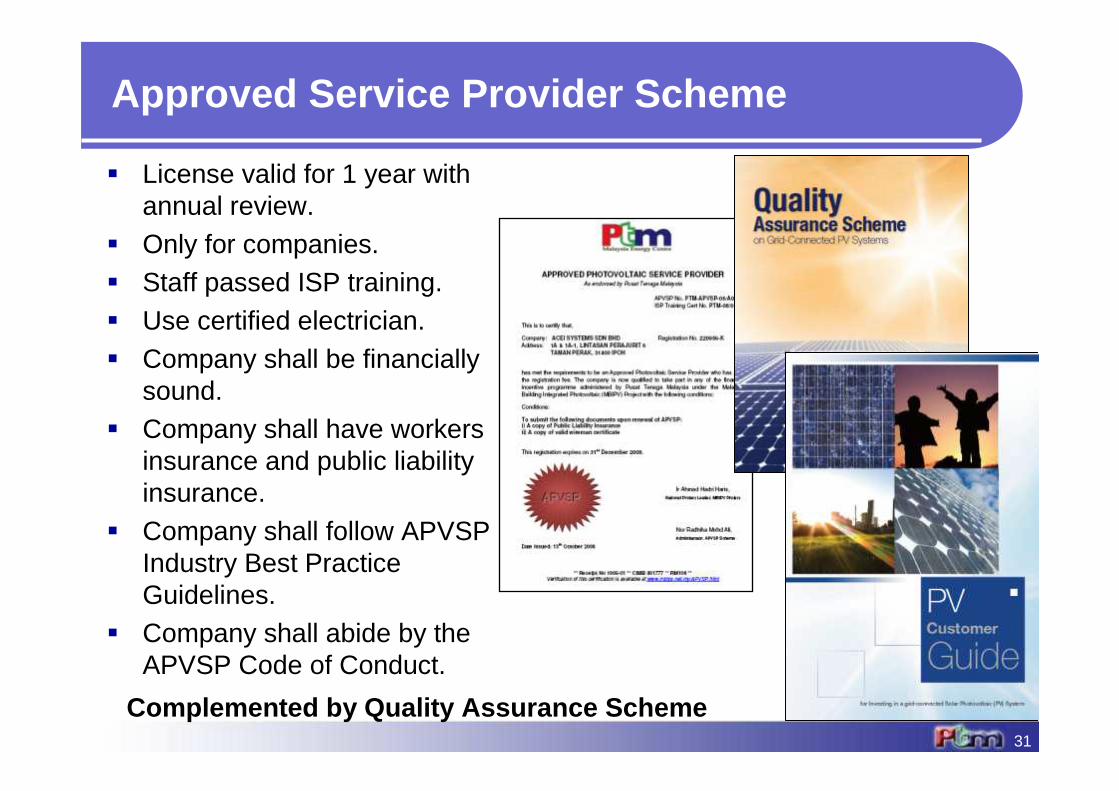
Approved Service Provider Scheme
� License valid for 1 year with annual review.
� Only for companies.� Staff passed ISP training.� Use certified electrician.� Company shall be financially
sound.� Company shall have workers
insurance and public liability insurance.
� Company shall follow APVSP Industry Best Practice Guidelines.
� Company shall abide by the APVSP Code of Conduct.
31
Complemented by Quality Assurance Scheme
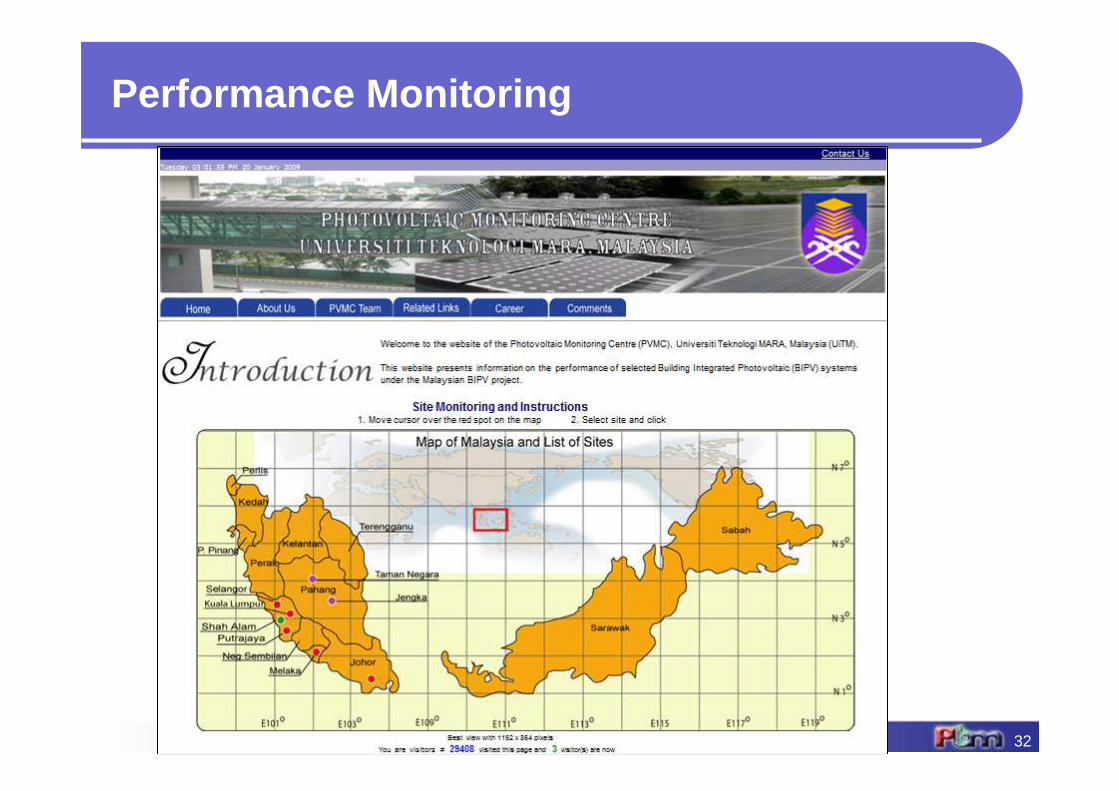
Performance Monitoring
32
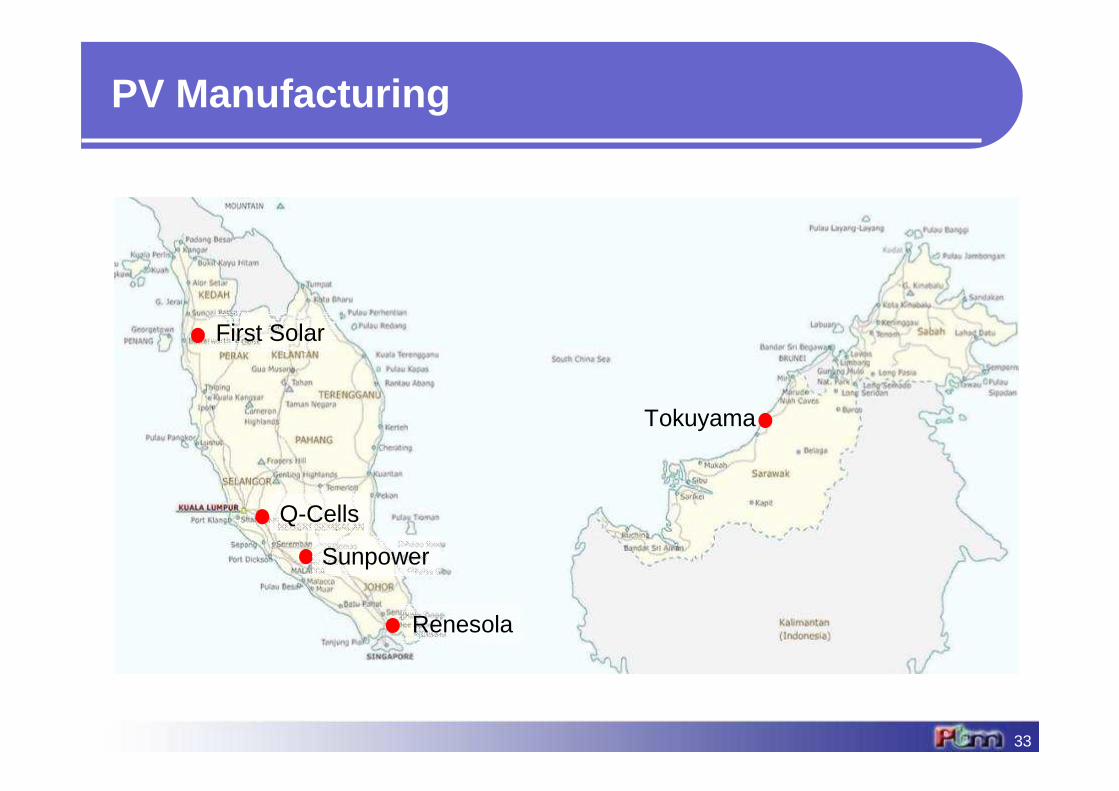
First Solar
Q-Cells
Tokuyama
Renesola
Sunpower
PV Manufacturing
33
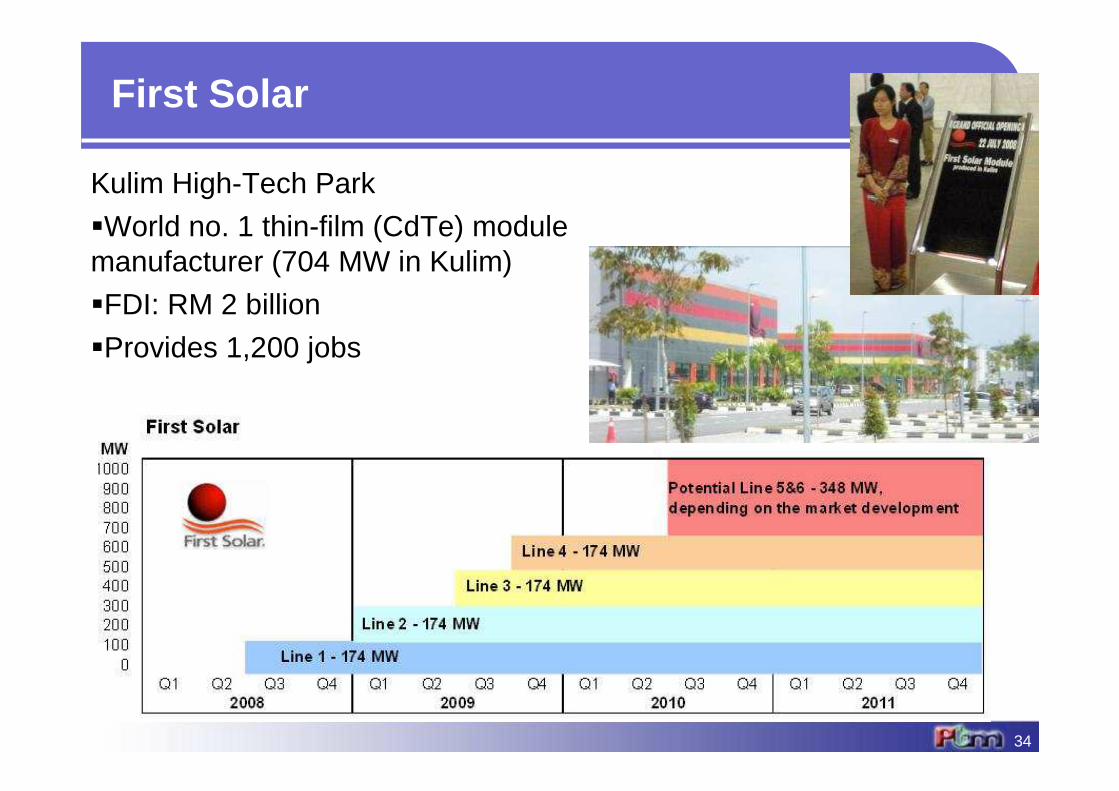
First Solar
34
Kulim High-Tech Park
�World no. 1 thin-film (CdTe) module manufacturer (704 MW in Kulim)
�FDI: RM 2 billion
�Provides 1,200 jobs
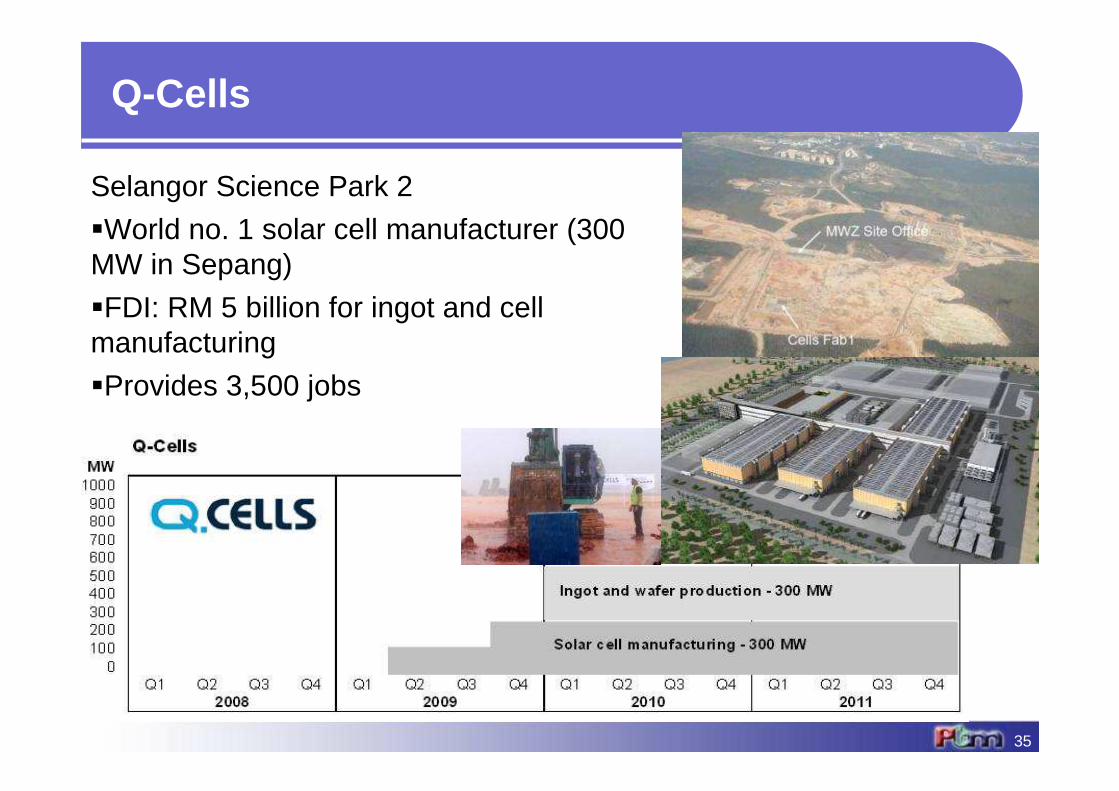
Selangor Science Park 2
�World no. 1 solar cell manufacturer (300 MW in Sepang)
�FDI: RM 5 billion for ingot and cell manufacturing
�Provides 3,500 jobs
Q-Cells
35
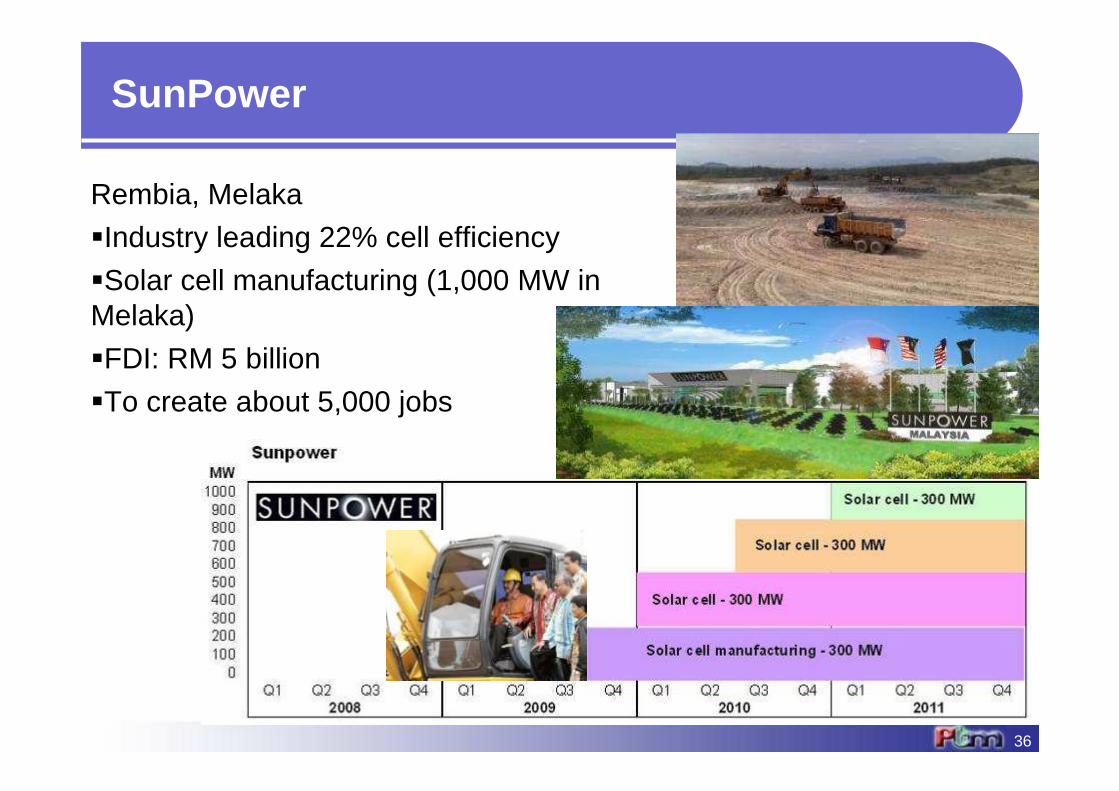
Rembia, Melaka
�Industry leading 22% cell efficiency
�Solar cell manufacturing (1,000 MW in Melaka)
�FDI: RM 5 billion
�To create about 5,000 jobs
SunPower
36
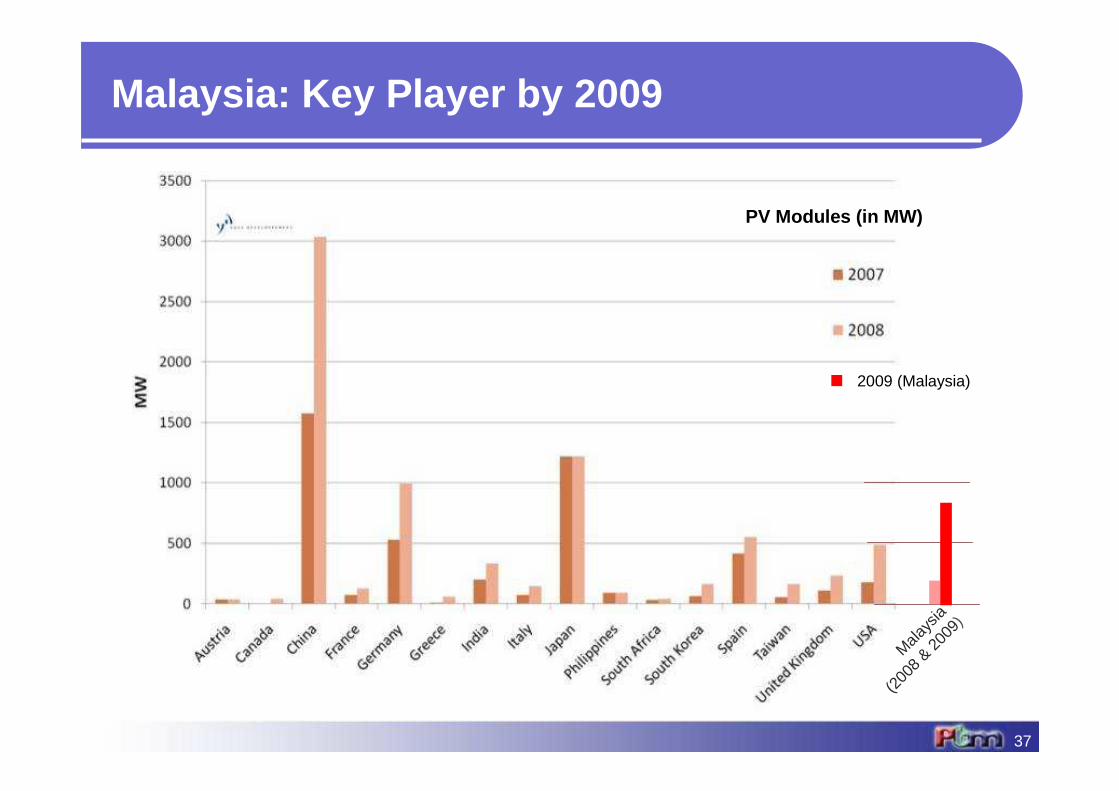
Malaysia: Key Player by 2009
37
Mala
ysia
(200
8 & 20
09)
PV Modules (in MW)
2009 (Malaysia)
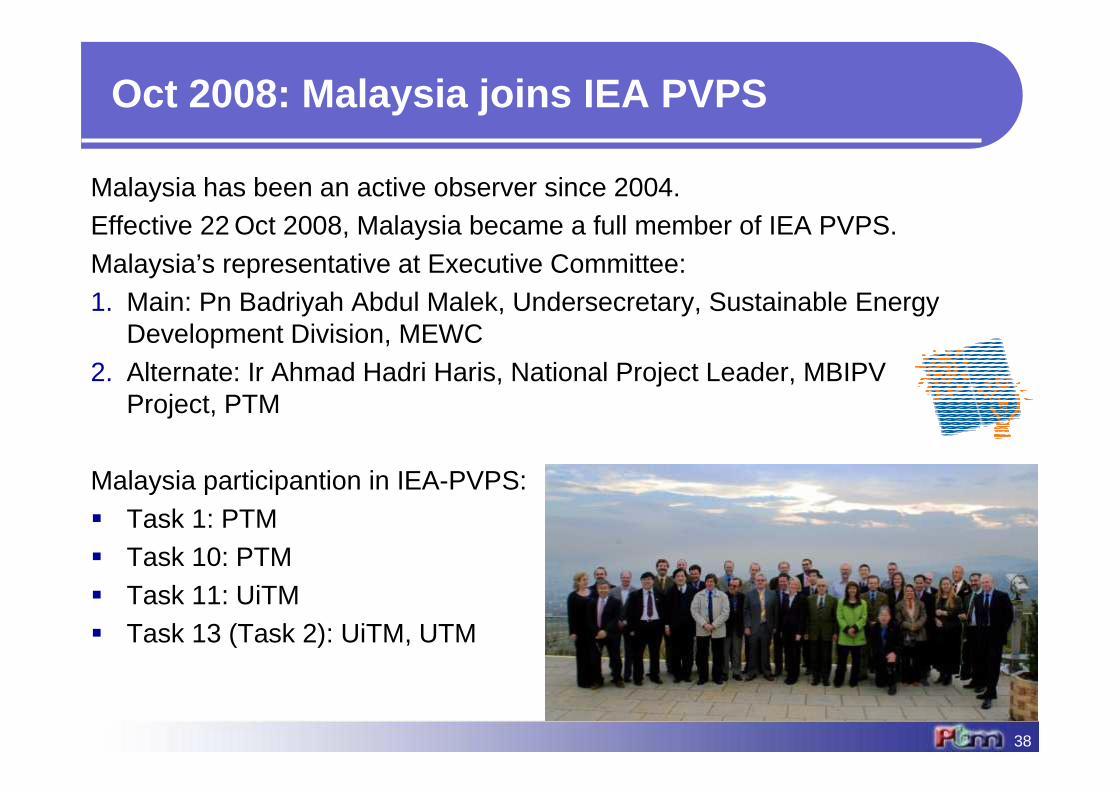
Oct 2008: Malaysia joins IEA PVPS
38
Malaysia has been an active observer since 2004. Effective 22 Oct 2008, Malaysia became a full member of IEA PVPS.Malaysia’s representative at Executive Committee:1. Main: Pn Badriyah Abdul Malek, Undersecretary, Sustainable Energy
Development Division, MEWC2. Alternate: Ir Ahmad Hadri Haris, National Project Leader, MBIPV
Project, PTM
Malaysia participantion in IEA-PVPS:� Task 1: PTM� Task 10: PTM� Task 11: UiTM� Task 13 (Task 2): UiTM, UTM
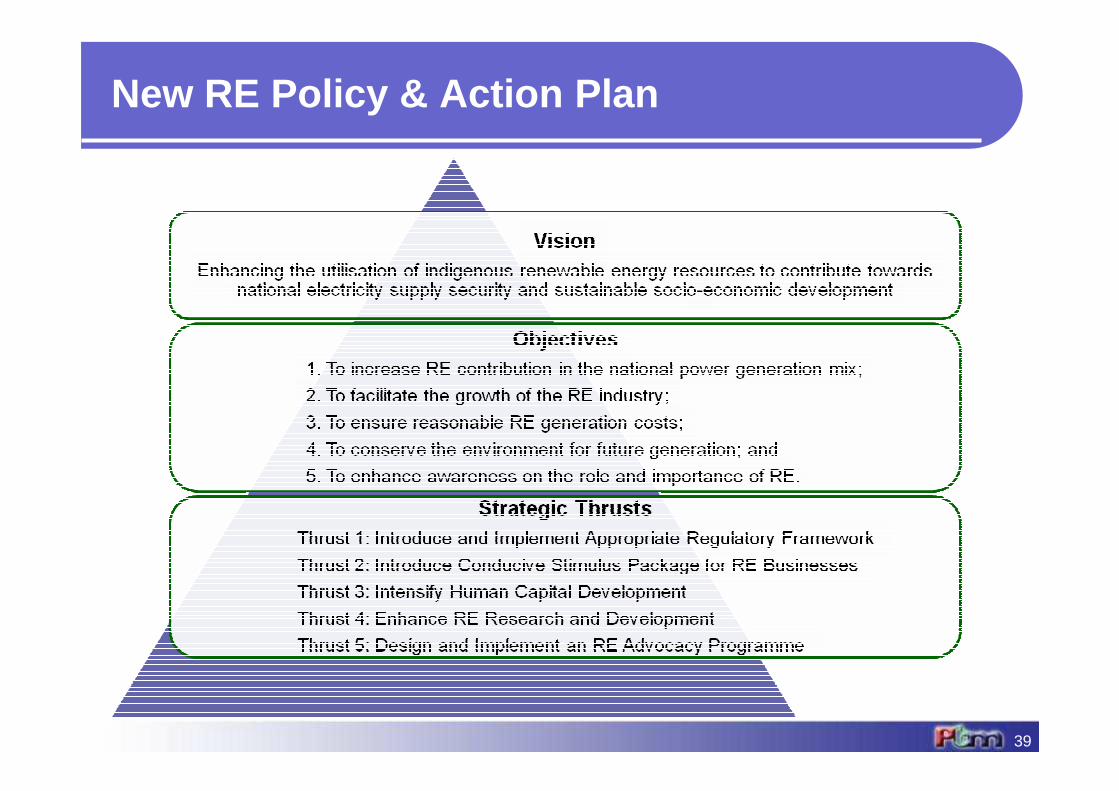
New RE Policy & Action Plan
39
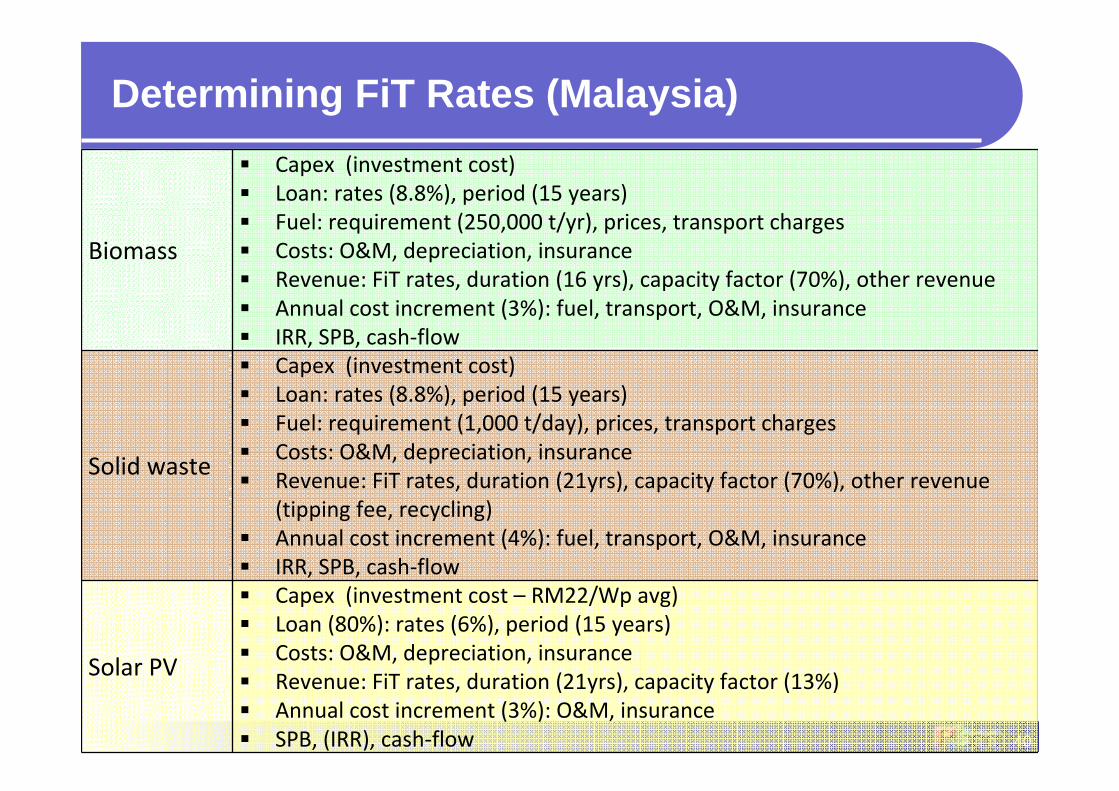
Determining FiT Rates (Malaysia)
40
Biomass
� Capex (investment cost)
� Loan: rates (8.8%), period (15 years)
� Fuel: requirement (250,000 t/yr), prices, transport charges
� Costs: O&M, depreciation, insurance
� Revenue: FiT rates, duration (16 yrs), capacity factor (70%), other revenue
� Annual cost increment (3%): fuel, transport, O&M, insurance
� IRR, SPB, cash-flow
Solid waste
� Capex (investment cost)
� Loan: rates (8.8%), period (15 years)
� Fuel: requirement (1,000 t/day), prices, transport charges
� Costs: O&M, depreciation, insurance
� Revenue: FiT rates, duration (21yrs), capacity factor (70%), other revenue
(tipping fee, recycling)
� Annual cost increment (4%): fuel, transport, O&M, insurance
� IRR, SPB, cash-flow
Solar PV
� Capex (investment cost – RM22/Wp avg)
� Loan (80%): rates (6%), period (15 years)
� Costs: O&M, depreciation, insurance
� Revenue: FiT rates, duration (21yrs), capacity factor (13%)
� Annual cost increment (3%): O&M, insurance
� SPB, (IRR), cash-flow
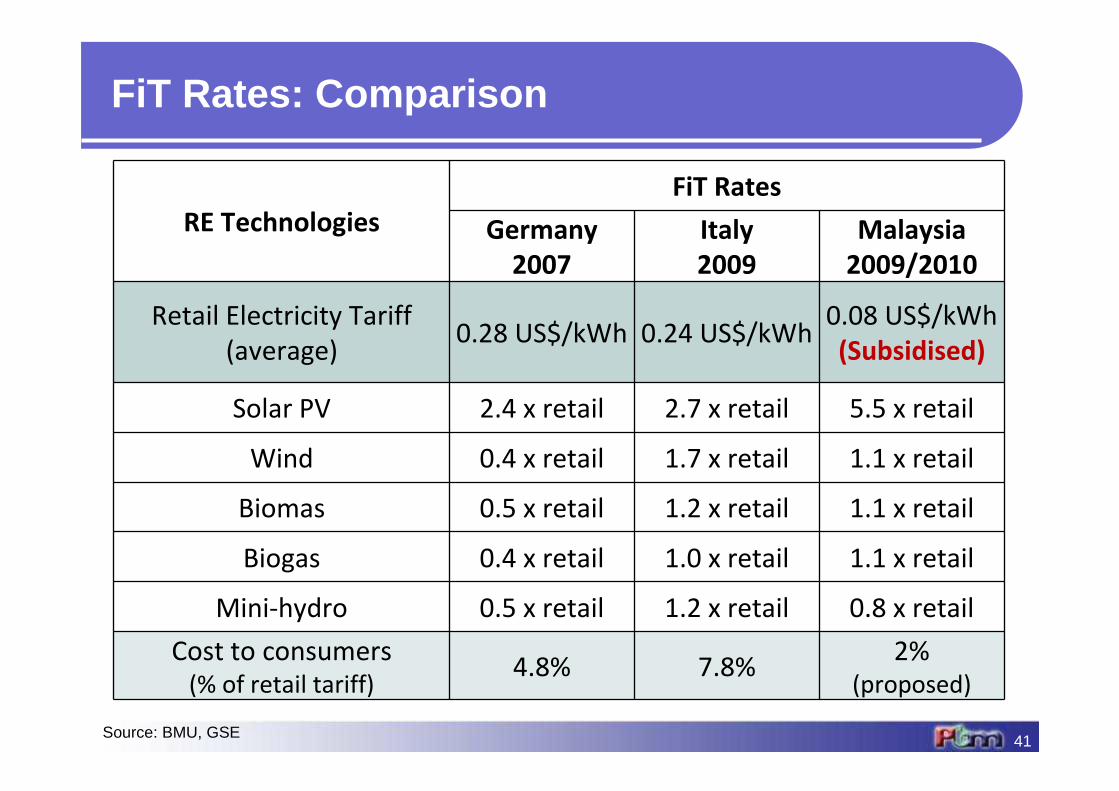
FiT Rates: Comparison
41
RE Technologies
FiT Rates
Germany
2007
Italy
2009
Malaysia
2009/2010
Retail Electricity Tariff
(average)0.28 US$/kWh 0.24 US$/kWh
0.08 US$/kWh
(Subsidised)
Solar PV 2.4 x retail 2.7 x retail 5.5 x retail
Wind 0.4 x retail 1.7 x retail 1.1 x retail
Biomas 0.5 x retail 1.2 x retail 1.1 x retail
Biogas 0.4 x retail 1.0 x retail 1.1 x retail
Mini-hydro 0.5 x retail 1.2 x retail 0.8 x retail
Cost to consumers(% of retail tariff)
4.8% 7.8%2%
(proposed)
Source: BMU, GSE
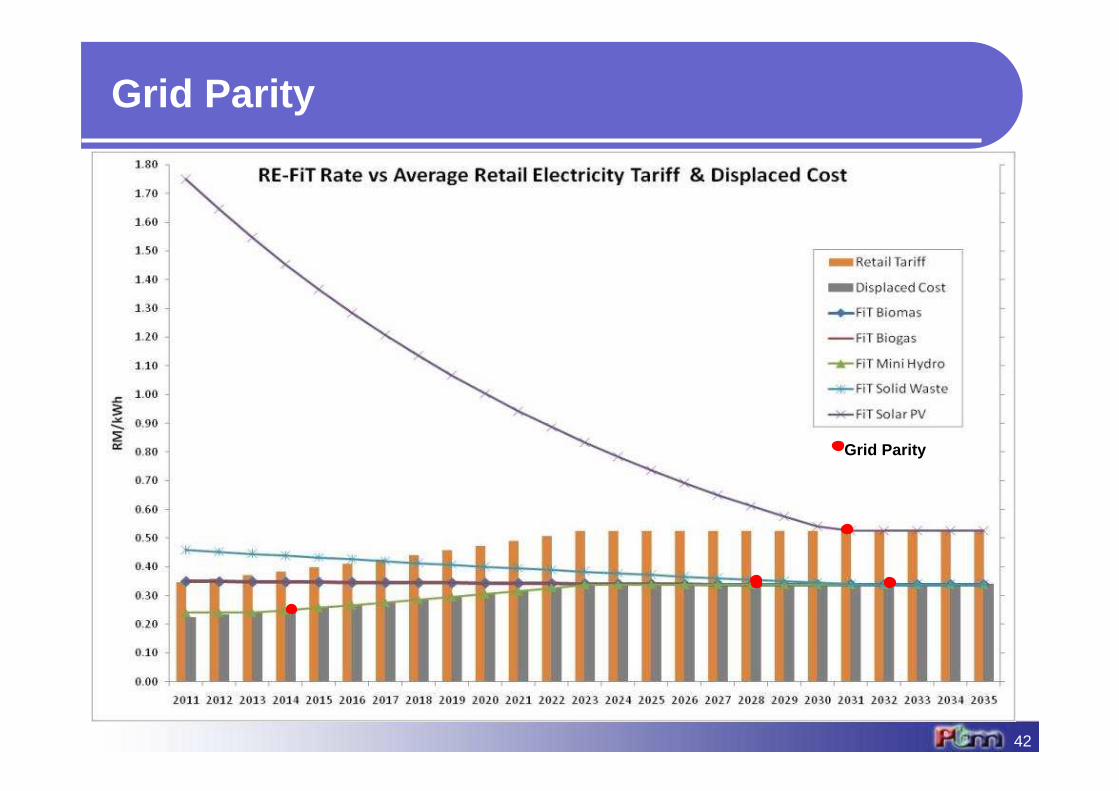
Grid Parity
42
Grid Parity
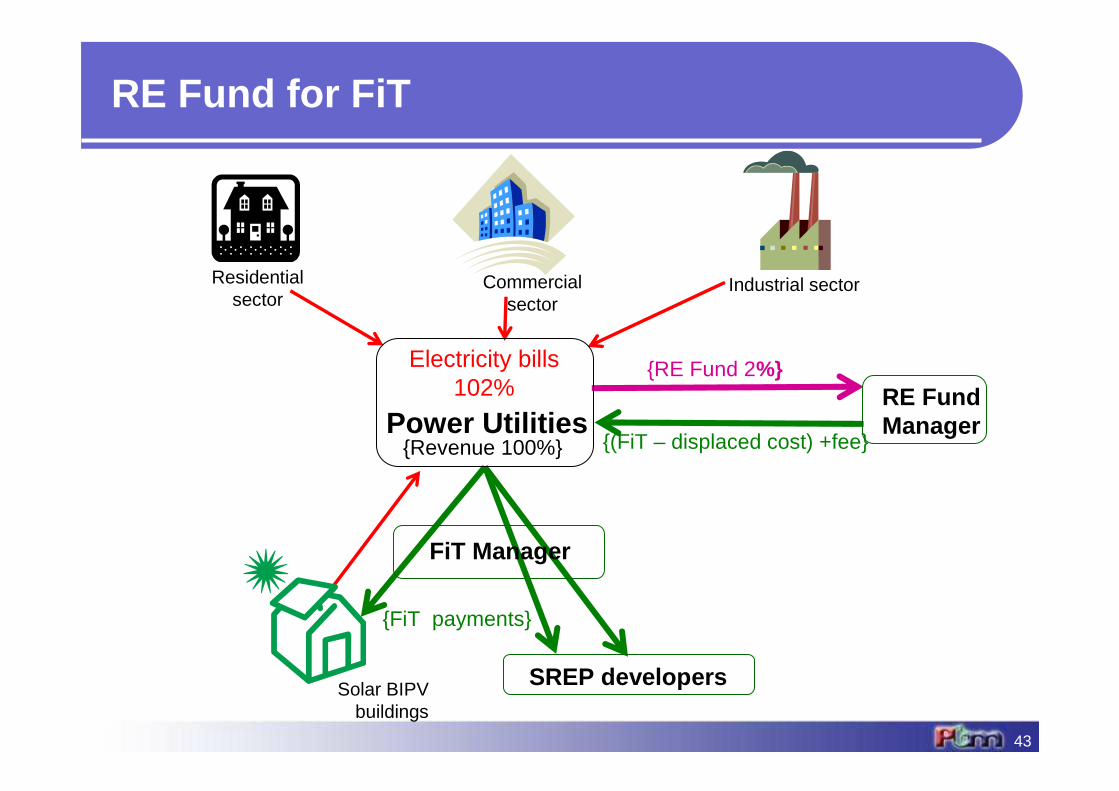
{RE Fund 2%}
Residential sector
Electricity bills 102%
Solar BIPV buildings
Commercial sector
{FiT payments}
{(FiT – displaced cost) +fee}
Industrial sector
Power UtilitiesRE Fund Manager
FiT Manager
SREP developers
{Revenue 100%}
RE Fund for FiT
43
-
200
400
600
800
1,000
1,200
1,400
2011
2012
2013
2014
2015
2016
2017
2018
2019
2020
2021
2022
2023
2024
2025
2026
2027
2028
2029
2030
2031
2032
2033
2034
2035
2036
2037
2038
2039
2040
2041
2042
2043
2044
2045
2046
2047
2048
2049
2050
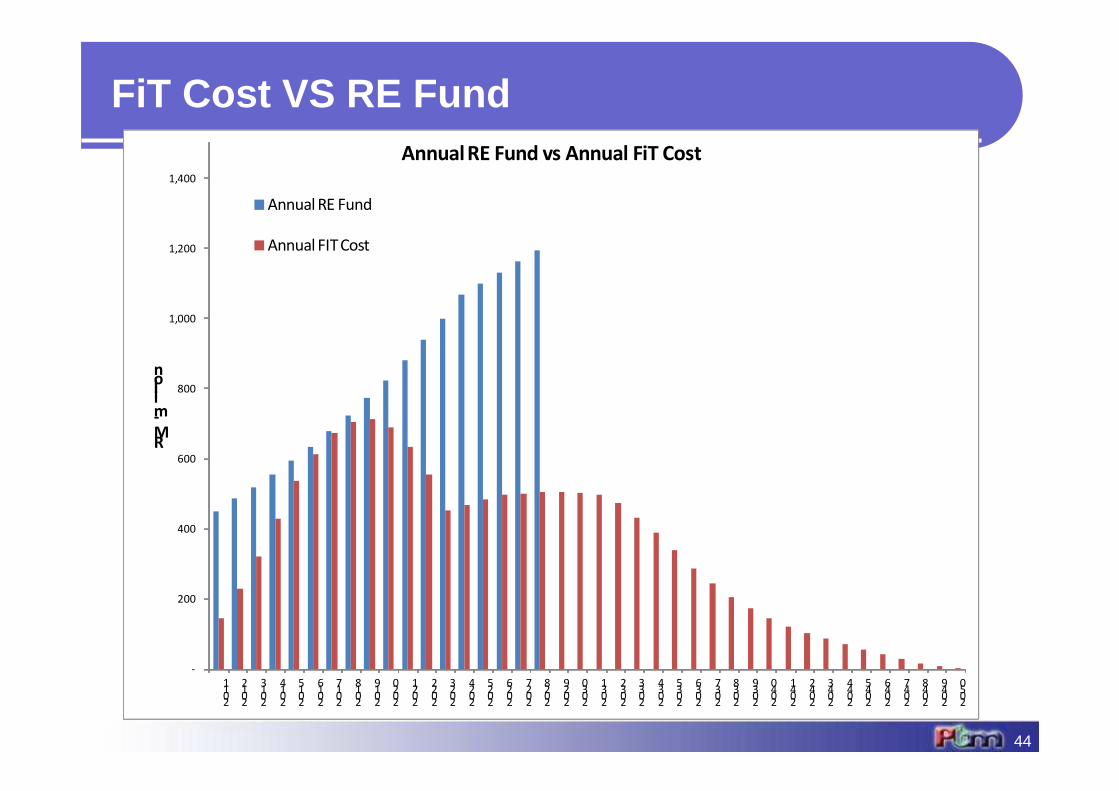
RM-million
Annual RE Fund vs Annual FiT Cost
Annual RE Fund
Annual FIT Cost
FiT Cost VS RE Fund
44
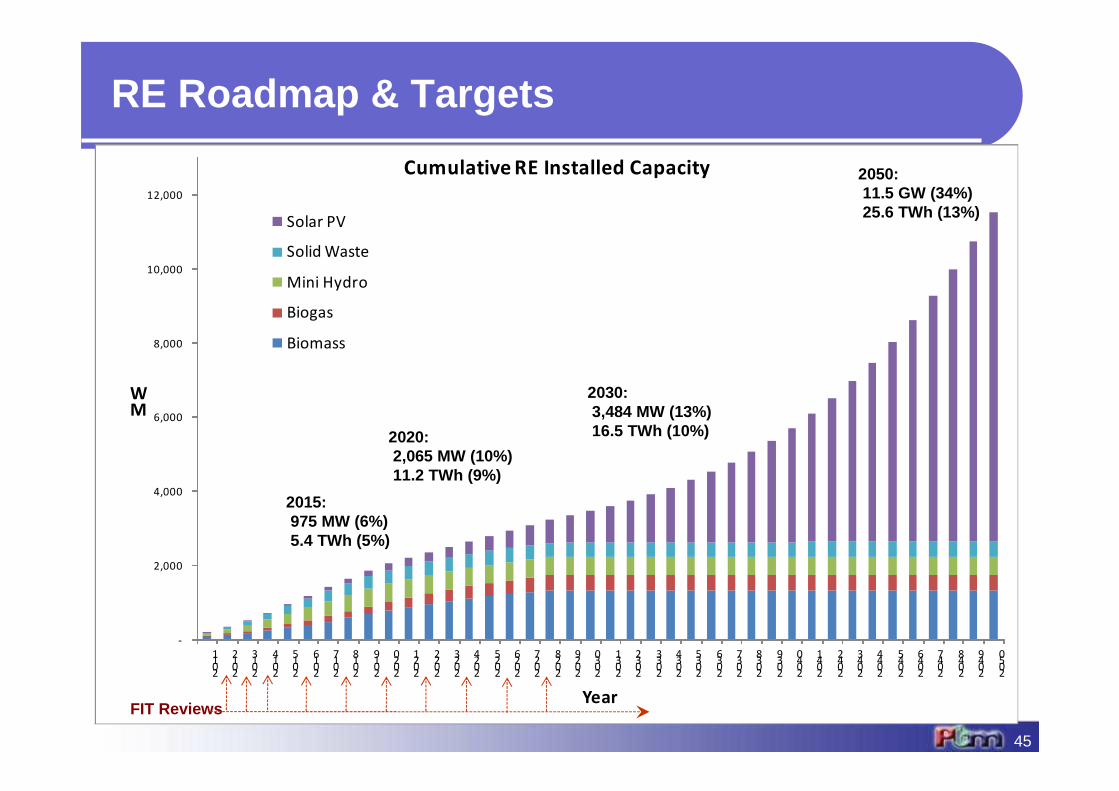
RE Roadmap & Targets
45
-
2,000
4,000
6,000
8,000
10,000
12,000
2011
2012
2013
2014
2015
2016
2017
2018
2019
2020
2021
2022
2023
2024
2025
2026
2027
2028
2029
2030
2031
2032
2033
2034
2035
2036
2037
2038
2039
2040
2041
2042
2043
2044
2045
2046
2047
2048
2049
2050
MW
Year
Cumulative RE Installed Capacity
Solar PV
Solid Waste
Mini Hydro
Biogas
Biomass
2020:2,065 MW (10%)11.2 TWh (9%)
2030:3,484 MW (13%)16.5 TWh (10%)
2050:11.5 GW (34%)25.6 TWh (13%)
2015:975 MW (6%)5.4 TWh (5%)
FIT Reviews
-
5,000,000
10,000,000
15,000,000
20,000,000
25,000,000
30,000,000
35,000,000
40,000,000
45,000,000
50,000,000
2011
2012
2013
2014
2015
2016
2017
2018
2019
2020
2021
2022
2023
2024
2025
2026
2027
2028
2029
2030
2031
2032
2033
2034
2035
2036
2037
2038
2039
2040
2041
2042
2043
2044
2045
2046
2047
2048
2049
2050
MWh
Year
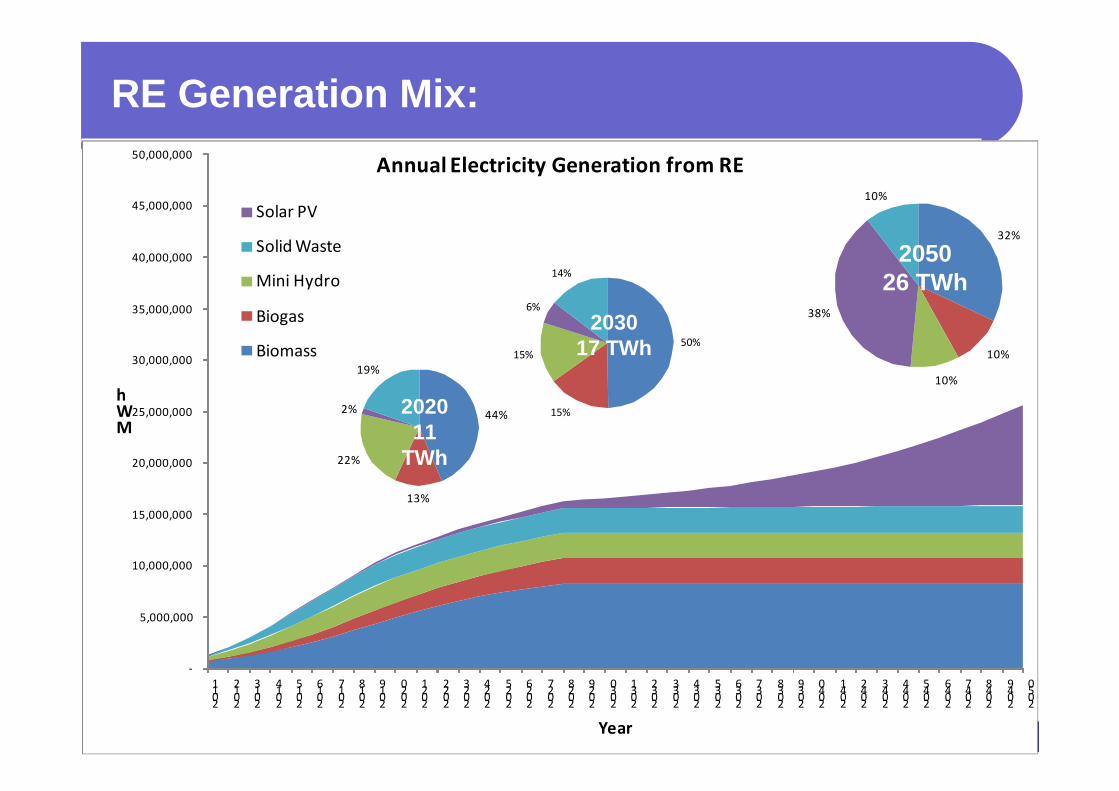
Annual Electricity Generation from RE
Solar PV
Solid Waste
Mini Hydro
Biogas
Biomass50%
15%
15%
6%
14%
32%
10%
10%
38%
10%
44%
13%
22%
2%
19%
203017 TWh
2050 26 TWh
202011
TWh
RE Generation Mix:
46
MBIPV ProjectPusat Tenaga Malaysia
No.2 Jalan 9/10, Persiaran Usahawan, Seksyen 943650 Bandar Baru Bangi, Malaysia
P: +603 8921 0865 F: +603 8921 0911 E: [email protected]
www.mbipv.net.my
Thank you
47


![S REPORT MALAYSIA [] 2019.pdf · ers with the new skills re-quired by a another gen-eration of businesses. Starting off as a semi-conductor manufacturer in the mid-1990s, when Malaysia:](https://img.pdfslide.us/doc/110x75/5fd754ae6ce50878b92bde29/s-report-malaysia-2019pdf-ers-with-the-new-skills-re-quired-by-a-another.jpg)

![PP v. AZILAH HADRI & ORS - Malaysian Law · PDF filePP v. AZILAH HADRI & ORS High Court Malaya, Shah Alam Mohd Zaki Yasin J ... 3 MLJ 516 (refd) Chan Chwen Kong v. PP [1962] MLJ 307](https://img.pdfslide.us/doc/110x75/5a78ee767f8b9a43758b54be/pp-v-azilah-hadri-ors-malaysian-law-v-azilah-hadri-ors-high-court-malaya-shah.jpg)