Embed Size (px)
Citation preview

STATUS OF LOCAL AGRICULTURAL LABOUR IN PUNJAB
Ranjit Singh Ghuman Inderjeet Singh
Lakhwinder Singh
Department of Economics Punjabi University, Patiala
Study Sponsored by
The Punjab State Farmers Commission Government of Punjab S.A.S. Nagar, Mohali
November 2007
2
CONTENTS
Page No.
Preface i-ii
Chapter 1 Introduction 1-6
Chapter 2 Structure of Rural Economy of Punjab 7-19
Chapter 3 Migrant Labour in Rural Punjab 20-28
Chapter 4 Local Agricultural Labour in Rural Punjab 29-35
Chapter 5 Occupational Structure of Local Casual Labour in Rural Punjab
36-52
Chapter 6 Wages, Earnings and Extent of Local Casual Labour in Rural Punjab
53-72
Chapter 7 Occupational Structure, Wages and Assets of Local Attached Labour in Rural Punjab
73-83
Chapter 8 Summary and Policy Implications 84-96
Bibliography 97-99
Appendix I to V 100-112
i
PREFACE
The rising demand for labour in Punjab, during the initial phase of green
revolution, attracted agricultural labour from other states of India. However, towards
the end of eighties, the labour absorption capacity of agriculture in Punjab started
declining. The employment in crop-sector experienced a significant decline during
the 1990s as compared to the 1980s. The employment opportunities in agriculture
might have further declined since then.
The substantial presence of migrant labour in Punjab and huge amount of
surplus labour in agriculture has resulted in a paradoxical situation. The policy
makers and social scientists are grappling with the predicament.
The Punjab State Farmers Commission was also seized of the phenomenon.
The commission wanted to investigate the status of local agricultural labour in Punjab
as it was a general notion that the cheap and docile migrant labour has pushed a
significant proportion of local labour out of agriculture.
This study has tried to examine the changing status of local agricultural labour
in Punjab, in the above mentioned context. It has also tried to estimate the extent of
migrant labour and casualisation of labour in Punjab agriculture. Besides, the study
has tried to analyse and discuss the occupational structure, wages and earnings of the
local agricultural labour in Punjab. As such, the findings of the study, inter alia,
bring out many new revelations about all the above mentioned aspects. The study
supports some earlier findings as well negates certain general notions.
The study based on primary data and field observations pertaining to 36
villages, spread over 12 districts of Punjab. Out of these 12 districts, 3 are from
Majha, 2 are from Doaba and 7 are from Malwa. In all, there were 7669 households
in the 36 sampled villages. Nearly 67 per cent households are landless and 33 per
cent are land owners.
The Punjab State Farmers Commission approached the Punjabi University,
Patiala for undertaking this study. The Vice-Chancellor, Mr. Swarn Singh Boparai, in
turn, entrusted this task to the below mentioned research team. The research team
would like to express a deep sense of gratitude to the Vice-Chancellor, Mr. Swarn
Singh Boparai, for providing an important opportunity to contribute to the cause of
local labour in particular and to Punjab’s rural economy in general. The research

ii
team is also grateful to Dr. Sucha Singh Gill, Dean, Academic Affairs, Punjabi
University, Patiala, as the discussions with him proved very useful in articulating and
fine tuning the various issues related to the study. We are also thankful to the former
and present Registrars, Professor Parm Bakhshish Singh Sidhu and Professor Baldev
Singh Sandhu, of this University for extending appropriate administrative help.
Dr. G.S. Kalkat, Chairman of the Punjab State Farmers Commission, deserves
our special gratitude and appreciation for approaching the Punjabi University for
undertaking such an important study. We would also like to express our thanks to Dr.
P.S. Rangi, Marketing Economist for his ready availability to the research team for
discussion. Our thanks are also due to Mr. Dipinder Singh, Member Secretary of the
Commission and Dr. Karam Singh, Agricultural Economist with the Commission.
The contribution of Mr. Gurpreet Singh and Rakesh Sharma, both Research
Fellows in the project, in the collection and tabulation of enormous amount of data, is
duly appreciated and acknowledged.
Ranjit Singh Ghuman Inderjeet Singh Lakhwinder Singh Professor and Professor and Reader and Principal Investigator Co-investigator Co-investigator
1
CHAPTER 1
INTRODUCTION
The Green Revolution, ushered in during the later half of 1960s, transformed
the food deficient Indian economy into a food self sufficient economy. Several
states/regions demonstrated a spectacular success in the Green Revolution. Punjab
has been at the top of such a success story. However, since the mid-1980s, the colour
of Green Revolution in Punjab started fading as the yield and production experienced
a tendency towards stagnation. The Punjab farmers faced a two-pronged squeeze on
their income. First, the cost of inputs increased, both, on account of higher quantity
and enhanced price. Secondly, the return did not keep pace with the rising cost. The
annual trend growth rate as per hectare return on wheat, paddy and cotton over the
variable costs was -0.35 per cent, -2.83 per cent and -14.24 per cent, respectively,
during the decade of 1990s (Ghuman, 2001).
Besides, the cropping pattern and agricultural technology led to a decline in
employment opportunities in Punjab agriculture. The employment in crop-sector in
Punjab declined from 48.04 crore man days during the triennium ending 1983-84 to
43.17 crore man days during the triennium ending 1996-97 (Gill, 2002). The share of
agricultural labourers in total rural main workers in Punjab, on the other hand,
increased from 24.80 per cent in 1971 to 28.52 per cent and 30.75 per cent in 1981
and 1991, respectively.
Along with this, the Punjab agriculture witnessed an important change in the
nature and character of hired labour input, during the same period. The share of hired
labour in Punjab (unlike most of the other states, barring Maharashtra) increased both
in wheat and paddy during the decade of 1970s. The decade of 1980s witnessed a
further rise in share of hired labour in wheat and cotton. The startling feature of this
was that casual hired labour constituted 68 to 84 per cent of hired labour across the
three major crops: paddy, cotton and wheat (Gill and Ghuman, 2001).
The scenario presented in the foregoing discussion, along with an increased
influx of migrant workers, led to the emergence of the peculiar scenario in Punjab.
On the one hand, there is large scale unemployment prevailing amongst the local
labour and on the other hand, there has been substantial in-migration of labour of
Punjab. In 1991, ten lakh cultivators and 2.78 lakh migrant labourers were surplus
(Gill, 2002). At the same time there were 3.63 lakh migrant labourers in Punjab
2
agriculture, even during the lean period (Sidhu, Rangi and Singh, 1997). It is also
estimated that about eight lakh migrant workers are there in Punjab in agriculture. At
the same time, 10.40 lakh rural youth (both educated and uneducated), in the age
group of 18-31 were unemployed in Punjab in 1998 (GOP, 1998).
Economic history of world, however, shows that the human labour migration
is the natural manifestation of socio-economic and technological
growth/development. The normal course of migration is that it takes place from
relatively low developed to high developed regions/countries. The in-migration to
Punjab, from other states of India, especially from UP and Bihar may be viewed in
this context.
The Census of India, 2001 (GOI) recorded a substantial shift of rural
workforce from agriculture to non-agriculture sectors during the decade of 1990s.
The census show that the share of agricultural workers in total rural main workers
declined from 73.5 per cent in 1991 to 53.5 per cent in 2001, a fall of 20 percentage
points. The corresponding decline during the period of two decades (1971-1991) was
just 6 percentage points. The proportion of agricultural workforce in Punjab’s total
workforce declined from 55.26 per cent in 1991 to 39.40 per cent in 2001, a fall of
approximately 2.77 and 4.24 percentage points during 1981-91 and 1971-81,
respectively.
As per the Census (2001), 66 per cent population and 70 per cent of workforce
in Punjab are living in rural areas. In this context, Punjab continues to be
predominantly a rural economy in terms of share of population and workforce. In
fact, agricultural development in Punjab experienced a partial dynamism of growth in
Kaldor-Kuznets long-term dynamics of agrarian economy (Kaldor, 1967; Kuznets,
1965). Punjab agriculture’s share witnessed a substantial fall in NSDP whereas the
workforce declined marginally during 1961-1991. The share of agriculture and
livestock in NSDP, at current prices, declined from 52.00 per cent in 1960-61 to 44.10
per cent in 1990-91. As compared to it, the share of agricultural workforce in the total
workforce in Punjab declined from 55.89 per cent in 1961 to 55.26 per cent in 1991.
According to a recent study (Ghuman, 2005), about 16 per cent workers were
employed in non-farm activities, in three villages of the three districts of Punjab. The
study further highlights that the shift of workers from the farm to non-farm
employment was largely due to “push effect” in agriculture and not due to “pull
3
effect” in the non-agricultural sectors. A quantum shift of rural workforce from farm
to non-farm sectors is, however, in sharp contrast to employment growth scenario in
Punjab during 1991-2001. The shrinking employment opportunities in agriculture
sector, the drastic fall in the share of agricultural workforce in total workforce of
Punjab and substantial presence of migrant labour in the rural Punjab raises many
serious questions. The most important question, inter alia, is about the status of local
agricultural labourers which have been shown shifted to non-farm sector.
Various studies have pointed out both positive and negative impacts of
migratory labour on the socio-economic aspects of local labour and also on the
economy of Punjab. The present work is an attempt to capture the socio-economic
adjustment process of the local agricultural labour in response to large scale influx of
migrant labour in Punjab.
Objectives
The production structure of the agriculture sector in the state has substituted:
(a) local labour with migrant labour and (b) high wage labour with low wage labour.
Complete occupational structure, income structure and asset structure of the economy
has undergone a substantial change over the period of time. Accordingly, the specific
objectives of the study as follows:
1. To determine the extent of local and migratory labour in agriculture;
2. To analyze the changes in the occupational structure of local
agricultural labour;
3. To study the income and asset structure of the local agricultural labour;
4. To make policy recommendations regarding the emerging scenario
pertaining to the local agricultural labour.
Methodology
The study, mainly a primary data based, also uses the secondary data sources
like Census of India, Statistical Abstracts of Punjab and other sources such as ESO
and CSO. The primary data was collected during the year 2006-07. For primary data
collection, a well structured questionnaire (Appendix IV and V) has been used.
Multistage sampling technique has been used to draw a representative sample of the
entire state of Punjab. At the first stage, we randomly selected 12 development blocks
in such a manner so that each block is located in a separate district. The selection of
blocks has been done at random, three each from the first 25 ranks, 26-50 ranks, 51-
4
80 ranks and 81-122 ranks, respectively. The selection of blocks has broadly been
made as per the ranking of blocks in the descending order according to level of
development. The ranking was done by the Economic and Statistical Organization
(ESO), Punjab (Appendix III). In the process, we have taken three districts from
Majha, two from Doaba and seven from Malwa regions of Punjab. Malwa has been
given higher weightage, keeping in view its share in total population of Punjab.
Further out of each of the selected blocks, three villages have been randomly selected.
Each village was randomly selected out of a cluster of villages. One village each is
randomly selected from the developed, moderately developed and low developed
cluster of villages in each block. Thus, in all, 36 villages constitute the universe of
the study (Appendix I, II).
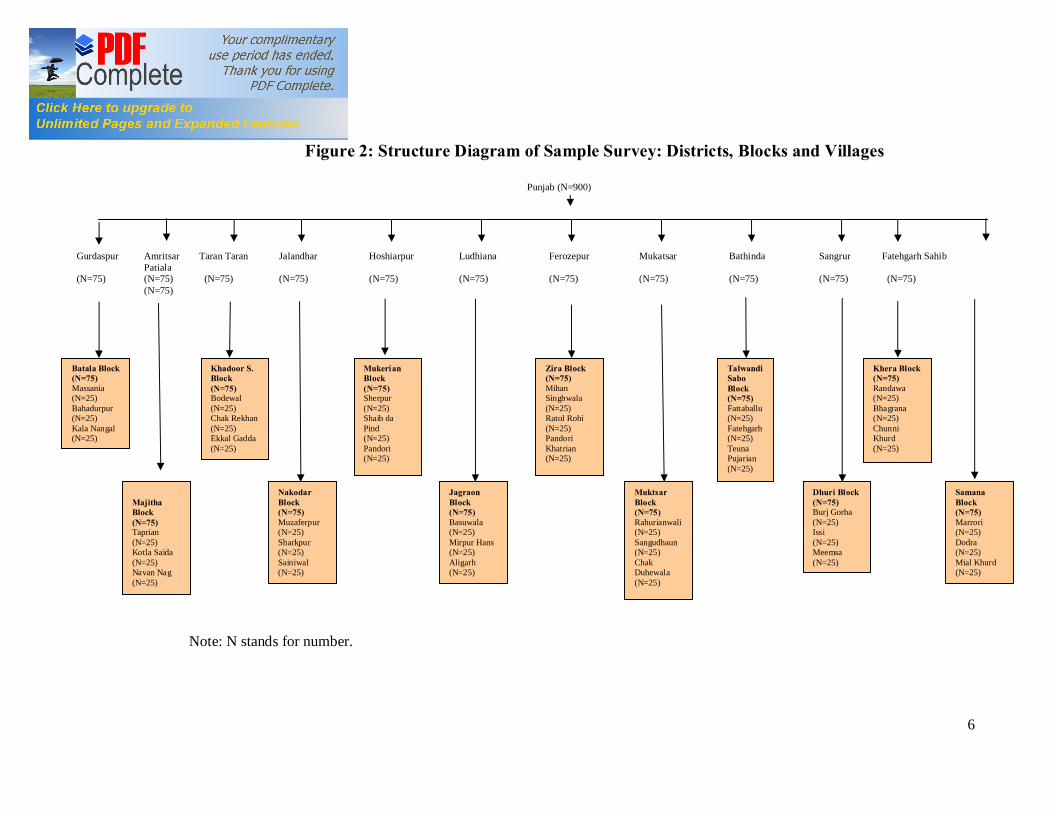
To analyse the nature and extent of rural labour, a complete household census
survey of the selected 36 villages has been done. The total number of households, in
all the 36 villages, comes out to be 7669. The complete structure of this census
survey is presented in figure 1. To analyse the occupational, income and asset
structure of local agricultural labourers, a detailed sample survey has also been
undertaken. Taking 25 respondents, randomly, from each of the 36 sampled villages,
the total sample size of the study comes out to be 900 respondents. Structure of the
sample survey of local agricultural labourers is presented in figure 2. For analysis, the
tabular analysis has been supported with appropriate statistical techniques.
Structure of the Study
The study has been organized into eight chapters. The opening chapter
introduces the study. It is followed by a chapter on structure of rural economy of
Punjab state. Chapter third elaborates the macro dynamics of migrant labour in
Punjab. The fourth chapter dwells upon overall scenario of agricultural labour in
Punjab. Occupational structure of local casual labour in Punjab has been discussed in
the next chapter. Wages, earnings and extent of loan in case of casual labour forms
the subject matter of chapter sixth. Seventh chapter analyses the occupational
structure, wages and assets of attached labourers. Main conclusions and policy
implications have been summarized in the last chapter.

5
Figure 1: Structure Diagram of Census Survey: Districts, Blocks and Villages
Punjab (N=7669)
Gurdaspur Amritsar Taran Taran Jalandhar Hoshiarpur Ludhiana Ferozepur Mukatsar Bathinda Sangrur Fatehgarh Sahib Patiala
(N=772) (N=402) (N=675) (N=390) (N=337) (N=349) (N=679) (N=998) (N=703) (N=992) (N=841) (N=531)
Note: N stands for number.
Khadoor S. Block (N=675) Bodewal (N=103) Chak Rekhan (N=194) Ekkal Gadda (N=378)
Talwandi Sabo Block (N=703) Fattaballu (N=106) Fatehgarh (N=217) Teuna Pujarian (N=380)
Khera Block (N=841) Randawa (N=150) Bhagrana (N=420) Chunni Khurd (N=271)
Zira Block (N=679) Mihan Singhwala (N=192) Ratol Rohi (N=241) Pandori Khatrian (N=246)
Batala Block (N=772) Massania (N=418) Bahadurpur (N=86) Kala Nangal (N=268)
Dhuri Block (N=992) Burj Gorha (N=57) Issi (N=256) Meemsa (N=679)
Samana Block (N=531) Marrori (N=388) Dodra (N=97) Mial Khurd (N=46)
Muktsar Block (N=998) Rahurianwali (N=457) Sangudhaun (N=226) Chak Duhewala (N=315)
Majitha Block (N=402) Taprian (N=80) Kotla Saida (N=87) Navan Nag (N=235)
Nakodar Block (N=390) Muzaferpur (N=64) Sharkpur (N=186) Sainiwal (N=140)
Mukerian Block (N=337) Sherpur (N=82) Shaib da Pind (N=103) Pandori (N= 152)
Jagraon Block (N=349) Basuwala (N=70) Mirpur Hans (N=157) Aligarh (N=122)
6
Figure 2: Structure Diagram of Sample Survey: Districts, Blocks and Villages
Punjab (N=900)
Gurdaspur Amritsar Taran Taran Jalandhar Hoshiarpur Ludhiana Ferozepur Mukatsar Bathinda Sangrur Fatehgarh Sahib
Patiala (N=75) (N=75) (N=75) (N=75) (N=75) (N=75) (N=75) (N=75) (N=75) (N=75) (N=75)
(N=75)
Note: N stands for number.
Khadoor S. Block (N=75) Bodewal (N=25) Chak Rekhan (N=25) Ekkal Gadda (N=25)
Talwandi Sabo Block (N=75) Fattaballu (N=25) Fatehgarh (N=25) Teuna Pujarian (N=25)
Khera Block (N=75) Randawa (N=25) Bhagrana (N=25) Chunni Khurd (N=25)
Zira Block (N=75) Mihan Singhwala (N=25) Ratol Rohi (N=25) Pandori Khatrian (N=25)
Batala Block (N=75) Massania (N=25) Bahadurpur (N=25) Kala Nangal (N=25)
Dhuri Block (N=75) Burj Gorha (N=25) Issi (N=25) Meemsa (N=25)
Samana Block (N=75) Marrori (N=25) Dodra (N=25) Mial Khurd (N=25)
Muktsar Block (N=75) Rahurianwali (N=25) Sangudhaun (N=25) Chak Duhewala (N=25)
Majitha Block (N=75) Taprian (N=25) Kotla Saida (N=25) Navan Nag (N=25)
Nakodar Block (N=75) Muzaferpur (N=25) Sharkpur (N=25) Sainiwal (N=25)
Mukerian Block (N=75) Sherpur (N=25) Shaib da Pind (N=25) Pandori (N=25)
Jagraon Block (N=75) Basuwala (N=25) Mirpur Hans (N=25) Aligarh (N=25)

7
CHAPTER 2
STRUCTURE OF RURAL ECONOMY OF PUNJAB
Rural economic development assumes an added significance both as a need in
the context of economic transformation and fast globalization of development. The
rural population of Punjab, according to census 2001 was 1,60,96,488 persons which
comes out to be 66.08 per cent of the total population. These persons are inhabited in
12,278 villages spread over 20 districts. Punjab’s rural economy has undergone
significant economic growth and structural transformation during the early period of
green revolution. However, the agriculture sector still remains the mainstay of
majority of rural population. The structural transformation process has reduced the
income generation in the rural economy but population more or less still dependent on
agriculture. At the most, the shift of rural population from agriculture related
activities to modern sector of the economy is pretty slow. When the productivity
growth in the agriculture sector showed signs of fatigue, a process of turning green
revolution pale, the crisis of rural economy surfaced on the scene. The resolution of
the crisis ridden rural economy is urgently required. For enacting suitable policy
measures, the examination of the structure of rural economy of Punjab is needed to
identify the weak links. The weak links assume utmost significance from the point of
view of rejuvenating the rural economy of Punjab. This is attempted in this chapter.
Development level and region wise distribution of rural households
Census of 36 villages across development levels and geographical regions was
conducted to ascertain the composition of economic activates in which the rural
workforce is engaged in. Total number of households of these villages comes out to
7669 (table 2.1). Accordingly average number of household inhabited by a village in
Punjab is 213. Out of the 7669 households, 2167 households are inhabited in the
relatively less economically developed villages of Punjab which comes out to be
28.26 per cent of the total households in all 36 sampled villages for which census was
conducted. The average number of households in relatively less developed villages is
181, which is lower than the overall average. This implies that the less developed
villages of Punjab are small in size and are away from major towns and cities.
Among the examined villages, 42.14 per cent of the households, that is 3232, are
hosted by the developed villages of rural Punjab. The average of the developed
villages in turns of number of households is 269. This implies that the developed
8
villages are bigger in size compared with medium, and less developed villages.
Furthermore, the process of development leads to concentration of population and
there is a positive relationship between size of the village and level of development.
Some of these villages are having characteristics similar to the level of semi urban
areas.
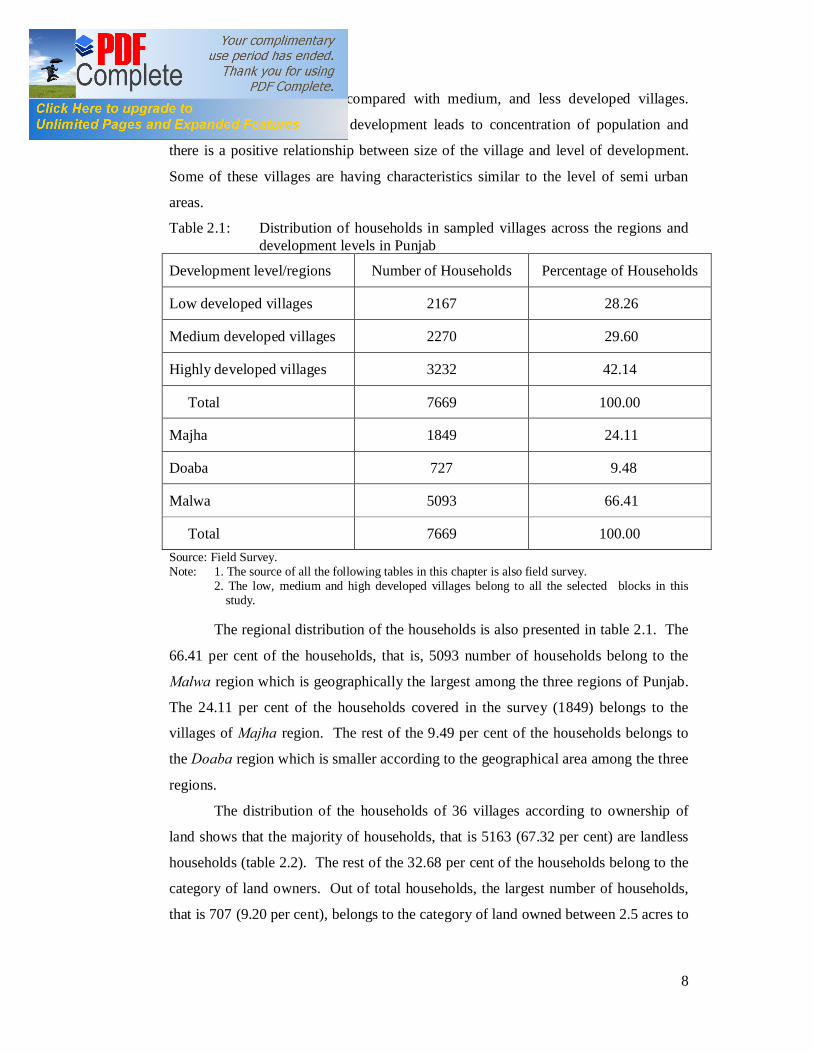
Table 2.1: Distribution of households in sampled villages across the regions and development levels in Punjab
Development level/regions Number of Households Percentage of Households
Low developed villages 2167 28.26
Medium developed villages 2270 29.60
Highly developed villages 3232 42.14
Total 7669 100.00
Majha 1849 24.11
Doaba 727 9.48
Malwa 5093 66.41
Total 7669 100.00 Source: Field Survey. Note: 1. The source of all the following tables in this chapter is also field survey.
2. The low, medium and high developed villages belong to all the selected blocks in this study.
The regional distribution of the households is also presented in table 2.1. The
66.41 per cent of the households, that is, 5093 number of households belong to the
Malwa region which is geographically the largest among the three regions of Punjab.
The 24.11 per cent of the households covered in the survey (1849) belongs to the
villages of Majha region. The rest of the 9.49 per cent of the households belongs to
the Doaba region which is smaller according to the geographical area among the three
regions.
The distribution of the households of 36 villages according to ownership of
land shows that the majority of households, that is 5163 (67.32 per cent) are landless
households (table 2.2). The rest of the 32.68 per cent of the households belong to the
category of land owners. Out of total households, the largest number of households,
that is 707 (9.20 per cent), belongs to the category of land owned between 2.5 acres to
9
5.5 acres. The second important category according to land ownership is 5.0 to 10
acres which covers 653 households that come out to be 8.51 per cent. These two
categories together showed that the large number of households in Punjab belongs to
the small and medium category of farming. The number of households engaged in
marginal farming in 36 villages of Punjab is 576 which are 7.51 per cent of the total
number of households (table 2.2). These households are nearly one-forth of the total
land owned households. Similarly, the upper two categories of households, that own
land between 10.00 to 15.00 acres and above 15 acres, are 570 households. These
households together constitute 7.44 per cent of the total number of households
inhabited by the 36 villages of Punjab. Furthermore, these two categories of
households together constitute 22.75 per cent of the land owner households. This
means the remaining 77.26 per cent households own land up to 10 acres only. Nearly
51 per cent households own land only up to five acres.
Table 2.2: Distribution of households in sampled villages according to ownership of land in Punjab
Categories\Households Number of Households Percentage share of Households
Landless* 5163 67.32 Land Owners* 2506 32.68 Upto 2.5 acres 576 (22.98) 7.51 (22.98) 2.5 to 5 acres 707 (28.21) 9.22 (28.22) 5.0 to 10.00 acres 653 (26.06) 8.51 (26.06) 10.00 to 15.00 acres 239 (9.54) 3.12 ( 9.53) Above 15.00 acres 331 (13.21) 4.32 (13.21) Note: 1. The figures in parentheses represent the percentage share of households in each
category of size-holding in the total land owning households. 2. The respective holding sizes are marginal, small, semi-medium, medium and large.
* These proportions are almost similar to the NSSO estimates (Govt. of India, 2005).
The dispersal of households across three regions of Punjab according to the
area operated is presented in table 2.3. The perusal of the table reveals that there
exists a wide differential among the regions so far so the areas operated by the
households across size classes are concerned. The highest number of households
according to area operated in Malwa region of Punjab falls in terms of size of holding
between 5 to 10 acres of area operated. This category of farm size is generally being
described as semi-medium. However, the largest proportion of households in the
regions of Doaba and Majha, that is 35.85 per cent and 31.86 per cent, respectively,
operated area between 2.5 to 5.0 acres. This implies that the majority proportion of
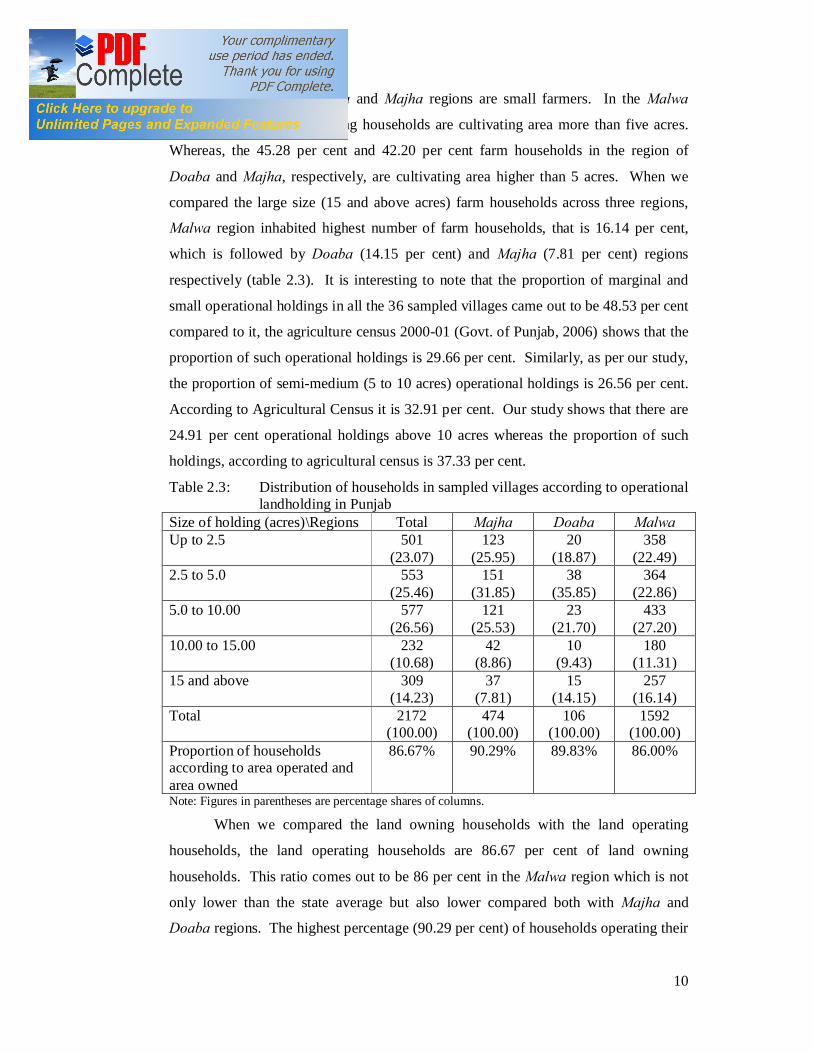
10
the households in the Doaba and Majha regions are small farmers. In the Malwa
region, 54.65 per cent farming households are cultivating area more than five acres.
Whereas, the 45.28 per cent and 42.20 per cent farm households in the region of
Doaba and Majha, respectively, are cultivating area higher than 5 acres. When we
compared the large size (15 and above acres) farm households across three regions,
Malwa region inhabited highest number of farm households, that is 16.14 per cent,
which is followed by Doaba (14.15 per cent) and Majha (7.81 per cent) regions
respectively (table 2.3). It is interesting to note that the proportion of marginal and
small operational holdings in all the 36 sampled villages came out to be 48.53 per cent
compared to it, the agriculture census 2000-01 (Govt. of Punjab, 2006) shows that the
proportion of such operational holdings is 29.66 per cent. Similarly, as per our study,
the proportion of semi-medium (5 to 10 acres) operational holdings is 26.56 per cent.
According to Agricultural Census it is 32.91 per cent. Our study shows that there are
24.91 per cent operational holdings above 10 acres whereas the proportion of such
holdings, according to agricultural census is 37.33 per cent.
Table 2.3: Distribution of households in sampled villages according to operational landholding in Punjab
Size of holding (acres)\Regions Total Majha Doaba Malwa Up to 2.5 501
(23.07) 123
(25.95) 20
(18.87) 358
(22.49) 2.5 to 5.0 553
(25.46) 151
(31.85) 38
(35.85) 364
(22.86) 5.0 to 10.00 577
(26.56) 121
(25.53) 23
(21.70) 433
(27.20) 10.00 to 15.00 232
(10.68) 42
(8.86) 10
(9.43) 180
(11.31) 15 and above 309
(14.23) 37
(7.81) 15
(14.15) 257
(16.14) Total 2172
(100.00) 474
(100.00) 106
(100.00) 1592
(100.00) Proportion of households according to area operated and area owned
86.67% 90.29% 89.83% 86.00%
Note: Figures in parentheses are percentage shares of columns.
When we compared the land owning households with the land operating
households, the land operating households are 86.67 per cent of land owning
households. This ratio comes out to be 86 per cent in the Malwa region which is not
only lower than the state average but also lower compared both with Majha and
Doaba regions. The highest percentage (90.29 per cent) of households operating their
11
own land is recorded in the region of Majha. Two farm size classes, that is, up to 2.5
and 2.5 to 5.0 acres recorded lower proportion of households in terms of area operated
to area owned. As the land operating households are the highest ones in the two
categories, that is 10-15 acres (98.7 per cent) and 15 and above (94.2 per cent, this
implies that these two categories may have been operating farms while reaping
economies of scale. Furthermore, these two categories of households lease in land to
exploit the operational economies of scale. Thus, Punjab farm economy is observing
the reverse tenancy.
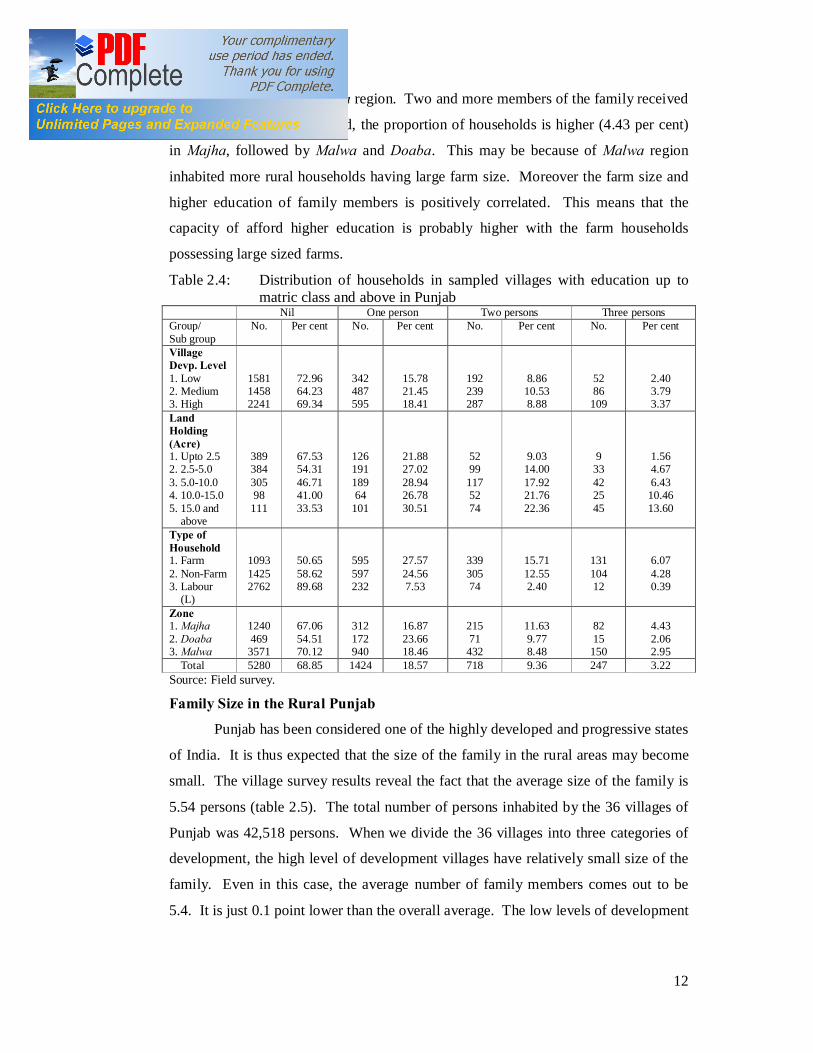
Education levels Across Rural Households
It is widely accepted fact that education and training convert the labour force
in human capital. Accumulation of human capital and economic development are
positively correlated. It is distressing to note here that the rural households of Punjab
observed generally very low level of education of the family members. The perusal
of table 2.4 clearly brings out the fact that the 72.96 per cent of the households of the
less developed villages of Punjab devoid of any family member received education up
to 10th level. However, this percentage is 64.23 for medium development villages and
69.34 per cent in the case of highly developed villages of Punjab. The proportion of
households in which one family member received education up to 10th and beyond
was higher in the medium development level of villages (21.45 per cent). It is
important to note here that there exist marginal variations across developed and highly
developed villages so far as number of family members received education beyond
tenth class. According to one, two or three number of the family members received
education up to tenth class, the proportion of households residing in the medium
developed villages is higher compared to high and less developed villages of rural
Punjab (table 2.4).
The relationship between farm size classes and members of farm households
received education up to 10th or beyond is positive. As the size of farm increases, the
number of household members received education upto 10th or beyond also increases.
Region wise distribution of households shows that the Malwa region having
households more than 70.12 per cent which do not have even one family member who
has received education up to tenth or beyond. However, the Doaba region has lower
proportion of family member who has not received education up to 10th level or
beyond. This proportion of households is slightly higher in Majha compared with
12
Doaba, but lower than Malwa region. Two and more members of the family received
education upto 10th or beyond, the proportion of households is higher (4.43 per cent)
in Majha, followed by Malwa and Doaba. This may be because of Malwa region
inhabited more rural households having large farm size. Moreover the farm size and
higher education of family members is positively correlated. This means that the
capacity of afford higher education is probably higher with the farm households
possessing large sized farms.
Table 2.4: Distribution of households in sampled villages with education up to matric class and above in Punjab
Nil One person Two persons Three persons Group/ Sub group
No. Per cent No. Per cent No. Per cent No. Per cent
Village Devp. Level 1. Low 2. Medium 3. High
1581 1458 2241
72.96 64.23 69.34
342 487 595
15.78 21.45 18.41
192 239 287
8.86 10.53 8.88
52 86
109
2.40 3.79 3.37
Land Holding (Acre) 1. Upto 2.5 2. 2.5-5.0 3. 5.0-10.0 4. 10.0-15.0 5. 15.0 and above
389 384 305 98
111
67.53 54.31 46.71 41.00 33.53
126 191 189 64
101
21.88 27.02 28.94 26.78 30.51
52 99
117 52 74
9.03 14.00 17.92 21.76 22.36
9
33 42 25 45
1.56 4.67 6.43
10.46 13.60
Type of Household 1. Farm 2. Non-Farm 3. Labour (L)
1093 1425 2762
50.65 58.62 89.68
595 597 232
27.57 24.56 7.53
339 305 74
15.71 12.55 2.40
131 104 12
6.07 4.28 0.39
Zone 1. Majha 2. Doaba 3. Malwa
1240 469
3571
67.06 54.51 70.12
312 172 940
16.87 23.66 18.46
215 71
432
11.63 9.77 8.48
82 15
150
4.43 2.06 2.95
Total 5280 68.85 1424 18.57 718 9.36 247 3.22 Source: Field survey.
Family Size in the Rural Punjab
Punjab has been considered one of the highly developed and progressive states
of India. It is thus expected that the size of the family in the rural areas may become
small. The village survey results reveal the fact that the average size of the family is
5.54 persons (table 2.5). The total number of persons inhabited by the 36 villages of
Punjab was 42,518 persons. When we divide the 36 villages into three categories of
development, the high level of development villages have relatively small size of the
family. Even in this case, the average number of family members comes out to be
5.4. It is just 0.1 point lower than the overall average. The low levels of development

13
villages (12 villages) are having exactly equivalent mean size of the family compared
to the overall average. The standard deviation for the low level of development
villages is 2,614 which are higher than the high level of development villages (2.31).
This reveals that the variations in the family size across households of the low level of
development villages are perceptibly higher than that of the high level of development
villages. The medium development villages have family size nearly six persons
which is higher than, the overall average as well as higher than the low and high level
of development villages. The estimated standard deviation for these households is 2.6
which are on the higher side compared with the high level of development villages.
An important feature needs to be noted here is that the family size of the farm
households is higher than the family size of the non-farm and also of the labour
households. The average size of the family of the farm households is 6.4 persons.
However, the family size of the non-farm families was 5.2 persons. The variations, as
revealed by the estimated value of the standard deviation, across households were
higher compared to the non-farm households. The family size (5.2 persons) of rural
labour households was 5.2 persons and the variations across households were the
lowest (2.1 standard deviation). This clearly brings out the fact that across the rural
labour households the family size is almost same.
The perusal of the table 2.5 reveals that there exists a positive relationship
between size of the farm and the average size of the family. The households owning
land up to 2.5 acres, the average size of the family is 5.3 persons per household. The
estimated value of the standard deviation comes out to be 2.2. These variations
revealed from the estimated value of standard deviation are the lowest one. This
implies that small farm size households more tended towards nuclear family. The
average size of the family for the farm households owning land between 2.5 and 5.0
acres is 5.7 persons. The estimated standard deviation is 2.4. The average size of
family and the variations across households are higher compared to marginal farming
family households. The average size of family for the farm categories of 10.0 to 15.0
acres and 15 and above acres is 7.3 and 7.6 persons, respectively. The variations, as
observed from the estimated value of standard deviation, across these farm
households increased as the average size of the family increases.
14
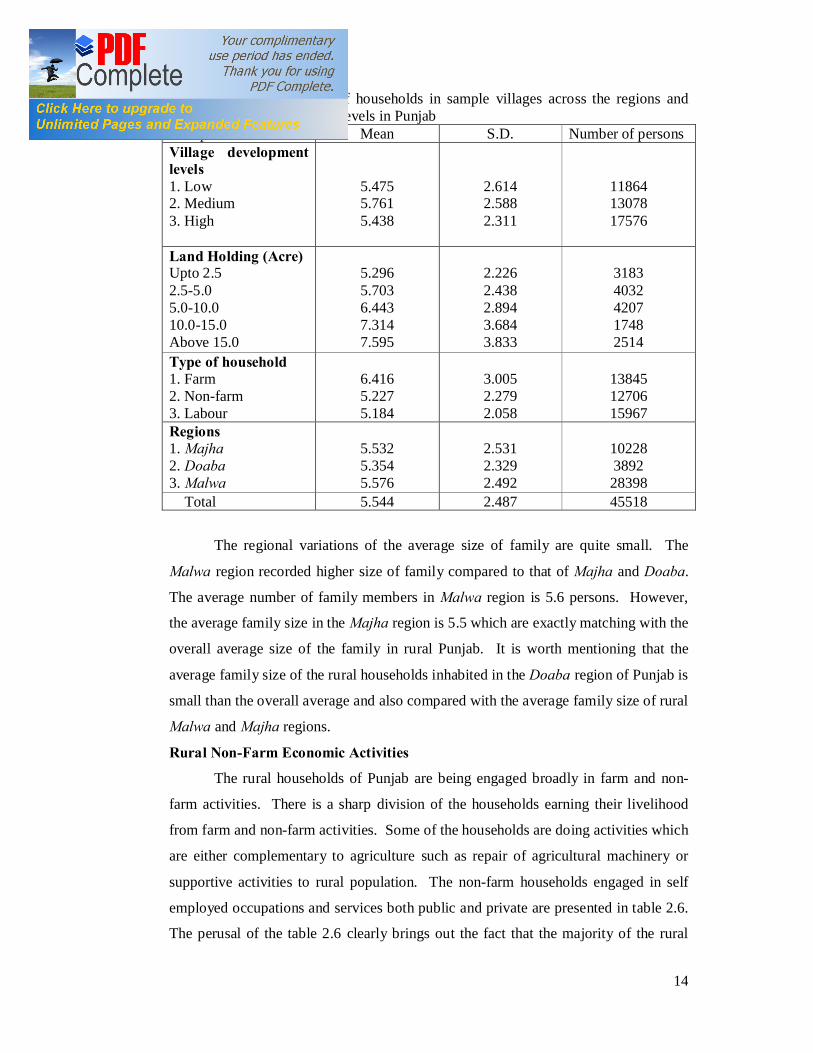
Table 2.5: Family size of households in sample villages across the regions and development levels in Punjab
Group Mean S.D. Number of persons Village development levels 1. Low 2. Medium 3. High
5.475 5.761 5.438
2.614 2.588 2.311
11864 13078 17576
Land Holding (Acre) Upto 2.5 2.5-5.0 5.0-10.0 10.0-15.0 Above 15.0
5.296 5.703 6.443 7.314 7.595
2.226 2.438 2.894 3.684 3.833
3183 4032 4207 1748 2514
Type of household 1. Farm 2. Non-farm 3. Labour
6.416 5.227 5.184
3.005 2.279 2.058
13845 12706 15967
Regions 1. Majha 2. Doaba 3. Malwa
5.532 5.354 5.576
2.531 2.329 2.492
10228 3892 28398
Total 5.544 2.487 45518
The regional variations of the average size of family are quite small. The
Malwa region recorded higher size of family compared to that of Majha and Doaba.
The average number of family members in Malwa region is 5.6 persons. However,
the average family size in the Majha region is 5.5 which are exactly matching with the
overall average size of the family in rural Punjab. It is worth mentioning that the
average family size of the rural households inhabited in the Doaba region of Punjab is
small than the overall average and also compared with the average family size of rural
Malwa and Majha regions.
Rural Non-Farm Economic Activities
The rural households of Punjab are being engaged broadly in farm and non-
farm activities. There is a sharp division of the households earning their livelihood
from farm and non-farm activities. Some of the households are doing activities which
are either complementary to agriculture such as repair of agricultural machinery or
supportive activities to rural population. The non-farm households engaged in self
employed occupations and services both public and private are presented in table 2.6.
The perusal of the table 2.6 clearly brings out the fact that the majority of the rural
15
non-farm households are engaged in self generated petty economic activities. Some
of the earlier studies, too, have shown similar results (Ghuman, et. al., 2002; Sidhu
and Toor, 2002 and Ghuman, 2005).
These activities are grocery shops, mechanics, wheat floor and rice shelling
mills, repair workshops, painter and plumbers and dairying. It is important to note that
the proportion of households engaged in non-farm activities in the total households of
36 villages comes out to be 24.36 per cent. An earlier study (Ghuman, 2005) of three
villages in three districts shows rural non-farm employment only up to 16 per cent.
However, the (Govt. of India, Census, 2001) shows that the extent of non-farm
employment in total rural workers was 46.5 per cent. The corresponding proportion
in 1991 was 26.50 per cent. Our census study of 36 sampled villages, spread over 12
districts of Punjab, does not support the census data. Out of the 1868 non-farm
households, 1009 households which come out to be 54.01 per cent of the total non-
farm households engaged in such activities mentioned above. Those who are engaged
in services account for 45.99 per cent of the households.
The non farm households are dependent on employment in both public and
private sector jobs such as teaching, bank clerks, army-personnel, drivers (bus driver,
truck driver, car driver, tractor driver and auto driver). These are relatively low paid
jobs but better than work available in agriculture. The distribution of rural non-farm
households between self employed and engaged in services reveals the fact that the
households of less developed villages of Punjab are more occupied in self created
economic activities. This is because of the fact that educational achievements are also
quite low and thus, these households can not seek jobs both in the public and private
sector economic activities. Some what similar trends are found in the case of
developed villages. However, it needs to be noted that the proportion of households
engaged in services is marginally higher. The middle level development of villages
recorded equal proportion of households in both the economic activities. Why the
proportion of services is higher in medium development villages compared with the
other two categories of villages because of the fact that educated persons up to matric
level and beyond were also reported higher in these villages. Formal education, thus,
allows people to seek jobs in the service sector both public and private.
16
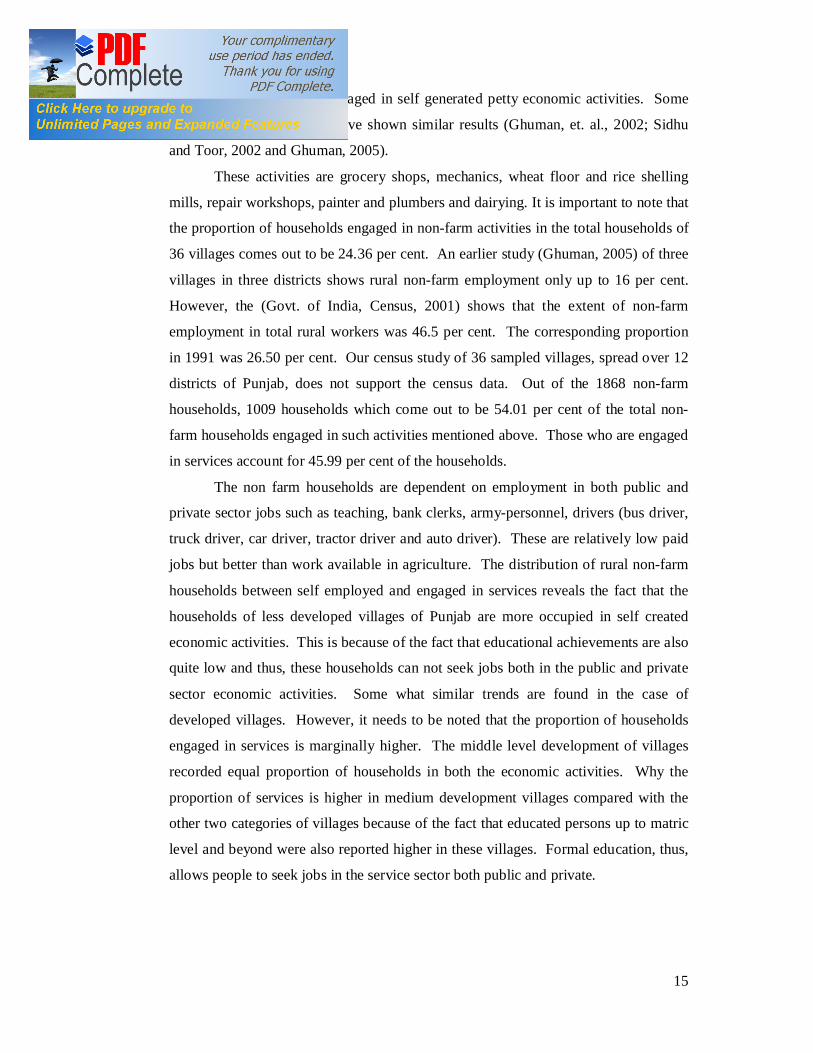
Table 2.6: Distribution of rural non-farm households in sampled villages according to economic activities across development levels and regions in Punjab
Activity Development Level and Regions
Self-employed Employed in services Percentage Share in
Total Households
No. Percentage No. Percentage
Low developed villages
251 (24.88)
57.44 186 (21.65)
42.56 20.17
Medium developed villages
300 (29.73)
50.00 300 (34.92)
50.00 26.43
Developed villages 458 (45.39)
55.11 373 (43.43)
44.89 25.71
Total 1009 (100.00)
54.01 859 (100.00)
45.99 24.36
Majha 185 43.94 236 56.06 22.77 Doaba 212 66.46 107 33.54 43.88 Malwa 612 54.25 516 45.75 22.15 Note: Figures in parentheses are percentages of the respective column.
The region wise distribution of non-farm households reveals an interesting fact
that the majority of the Malwa and Doaba households are engaged in self generated
occupations. However, this proportion is higher for Doaba (two-third of households
in self employed activities) region compared with Malwa region. The Majha region,
surprisingly, recorded majority of the households engaged themselves into services
that is 56.06 per cent. This is quite contrary to the trend observed in the case of
Malwa and Doaba regions.
Extent of Attached Local Labour in Rural Punjab
Agriculture sector of an economy generates work of two kinds. Some of the
operations of agriculture sector do require to be attended on regular basis such as
animal care, irrigation, fertilizer, and spraying the crops. Sowing and harvesting
generates second category of work which increases the demand for casual labour.
The regular kind of work needs to be attended either by the farm household with its
own labour or hired labour. Small sized farm usually fulfils the demand for labour
from the household itself. But the medium and large size farms depend more or less
on the hired labour. Such households do hire labour on contract basis for one year or
more which is called as attached labour or ‘Seeri’ in local language. The other source
of contract labour is migrants. Therefore, the local labour hired on a regular contract
basis has been on the decline. The factor behind the contract based labour is the
17
linkage between credit and labour markets. The inter-linked agrarian markets in rural
Punjab are still operating despite the development of agrarian economy on modern
capitalist lines of production (Gill, 2004). This labour force is an exploited lot mainly
due to longer hours put in work and the nature of work also remained undefined.
These workers are usually hired as a farm labour. However, the majority of the farm
households themselves are engaged in such activities which are indicative of the fact
that 79 per cent of the farm households do not hire at all the contract labour on regular
basis. The rest of the twenty one per cent of the households hire contract labour on
regular basis. The analysis of the table 2.7 reveals that nearly 17 per cent of the farm
households hire one worker on regular contract basis.
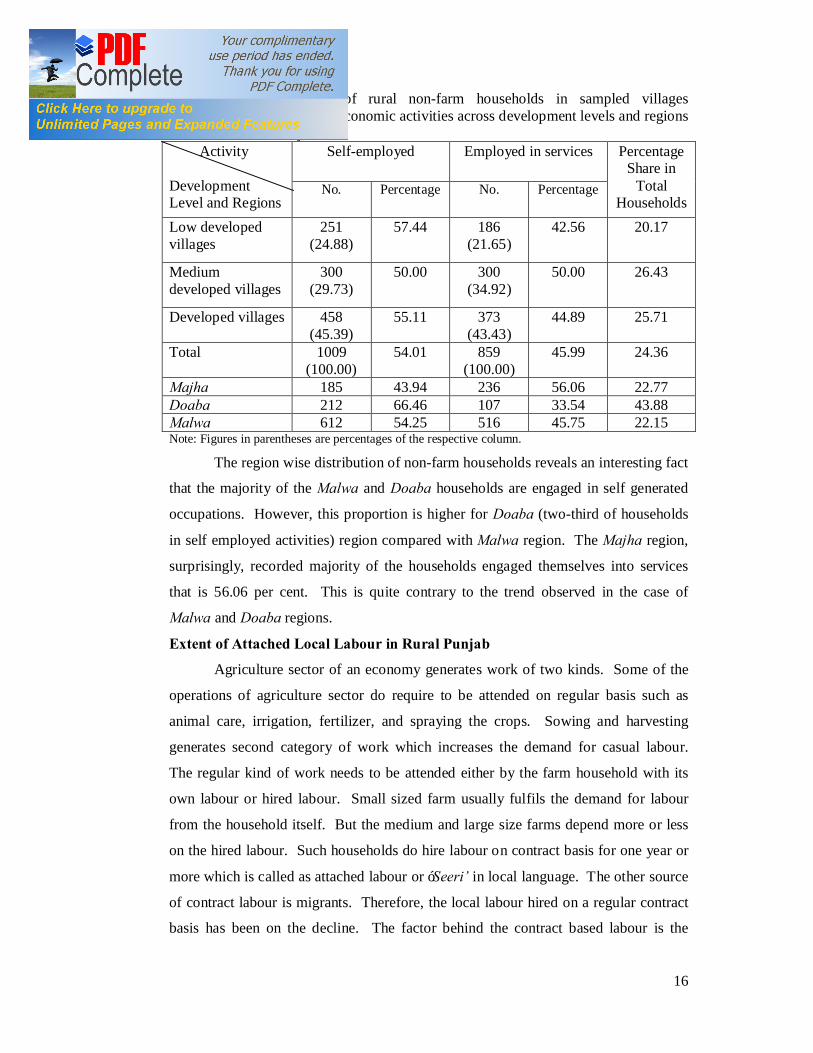
Table 2.7: The extent of attached local labour in sampled villages in Punjab No. of
workers
Farm Size
Households with no hired workers
Households with one hired worker
Households with two hired workers
Households with three or more hired workers
Number %age Number %age Number %age Number %age
Up to 2.5 498 99.40 2 0.40 1 0.20 - - 2.5-5.0 514 92.95 36 6.51 2 0.36 1 0.18 5.0-10.0 454 78.68 119 20.62 2 0.35 2 0.35 10.0-15.0 140 60.34 81 34.91 9 3.88 2 0.86 Above 15.0 113 36.57 122 39.48 43 13.92 31 10.03 Total 1719 79.15 360 16.57 57 02.62 36 01.66 Source: Field survey.
Two labourers on contract basis were hired by the 2.62 per cent of the farm
households. A few households that is, 1.66 per cent, hired three or more workers on
regular contract basis in rural Punjab. The perusal of the table 2.7 reveals that 99.40
per cent small and marginal farmer’s households owning land up to 2.5 acres do not
hire any worker on regular or contract basis. Furthermore, the analysis of the table
2.7 shows that as the farm size increases, the hired contract based labour also
increases. Thus, there is a positive relationship between the practice of hiring contract
based farm labour and farm size. The medium, semi-medium and large farm
households are hiring large number of farm labourers as attached labourers. The farm
households owning large size farms are hiring two, three and more workers as
attached labourers. So tying of labour is still more common with the farm households
those are having large size of the land holdings.

18
Table 2.8: The extent of employment of local casual labour in sampled villages in Punjab, by size of operational holding
No. of man days Farm size group
Number of man days in a year
Nil % 0-25
% 25-50
% 50-75
% 75 or
more
%
Upto 2.5 337 64.68 94 18.04 83 15.93 3 0.58 4 0.77 2.5-5.0 197 35.62 121 21.88 155 28.03 55 9.95 25 4.52 5.0-10.0 255 44.19 54 9.36 57 9.88 64 11.09 147 25.48 10.0-15.0 99 42.67 29 12.50 15 6.47 9 3.88 80 34.48 Above 15.0 115 37.22 31 10.03 9 2.91 6 1.94 148 47.90
The sowing and harvesting season generates huge amount of work and
demand for casual labour. All farm households across the farm size classes hire
labour for this kind of work. The analysis of the table 2.8 reveals the fact that 54 per
cent of the farm households generate demand for casual labour. The pattern of hiring
casual labour follow an inverted ‘U’ shape curve because of the face that the farm
households, which belong to the category of small and marginal, depend more on
family labour for sowing and harvesting of crops. However, there is a positive
relationship between number of workers hired as casual labourers and farm size upto
10 acres and reverses thereafter. The reasons for such kind of relationship are well
known because of the fact that the farm households possessing the large size farms
depend more on farm machinery (Singh and Singh’s study (2006), too, came up with
such findings). The mechanization of Punjab agriculture has increased dramatically
over the last two decades due to uncertainties. One, the weather conditions have
changed dramatically due to global warming and untimely rainfall especially during
the harvesting period increases the intensity of mechanization. Two, the maturity
period of the high yielding variety crops has shortened and harvesting takes place
simultaneously. This generally creates shortage of labour during the time of
harvesting. In fact, the duration of peak period, both at the time of sowing and
harvesting, has shrunk over the period of time. Thus, shortening of peak period, along
with declining employment elasticity in agriculture has resulted in reduction of labour
absorption in agriculture in rural economy of Punjab (Bhalla, 1987; Gill, 2002).
Hence to sum up, the agriculture sector still remains the mainstay of majority
of rural population. There are wide differentials among the regions so far as the area
19
operated by the households is concerned. Punjab farm economy is observing the
process of reverse tenancy. The employment of attached labour is positively
associated with the farm size, and the pattern of hiring casual labour follows an
inverted ‘U’ shape curve. The family size of the farm households is larger than the
family size of the labour households and there exists a positive relationship between
size of the farm and the average size of the family. The process of self employment
and tertiarization of the system is picking up in the state but the poor school education
is a bottleneck in the process.
20
CHAPTER 3
MIGRANT LABOUR IN RURAL PUNJAB
Migration and economic development are intimately linked. Dualistic
development literature viewed internal migration as natural process in which surplus
labour can gradually be withdrawn from the agriculture sector to fulfil the increasing
demand in the urban industrial sector. This process of economic transformation has
been considered socially beneficial because of human resources can be shifted from
low paid economic activities (marginal product nearly zero) to rapidly growing
economic activities where marginal product is positive (Todaro and Smith, 2004).
Thus, economic theory of migration suggests that migration takes place in response to
urban-rural differences in expected income. Contrary to this, Jolly (1970) argued that
most of these concern looks irrelevant today. The rates of rural-urban migration in
less developed countries continue to exceed rates of urban job creation. Dualistic
theory of economic development and migration has been criticized that it completely
ignored the empirical realities of most of the developing economies where the rural-
rural migration is the dominant form than rural to urban. It is being generally
observed from empirical literature on migration that the skill levels required for urban
migration have increased over time. The skill requirements in urban areas and skill
possessed by the agricultural workers have widened substantially. Therefore, the
people of poorest areas do not have access to the most rewarding activities in the
urban areas.
They migrate to activities which are seasonal agriculture and also less
rewarding. Another important factor that contributes to the flow of rural to rural
migration is the improvement of agricultural productivity due to technological
progress which resulted into the improvements in mean income in such regions. The
people of the less developed areas are likely candidates for such migration (Haan,
2007). The rural economy of Punjab do attract huge amount of flow of people from
other poorer states of India. These workers do engage themselves into low paid
agriculture sector related activities both regular and seasonal. Rural to rural migration
which is largely seasonal and the stay of workers in most of the cases is less than six
months, therefore, excluded from the official records. The place of residence of
migrant workers is usually at the place of work, that is, farm and thus is not being
recorded during the period of conduct of census. Therefore, the official statistics on
21
migration grossly under record the rural to rural migration. In this chapter, an attempt
has been made to fill this gap.
Migration Inflows in Punjab
There was a dramatic improvement in agricultural productivity with the advent
of green revolution which resulted into rise in per capita income. Intensive
agriculture has also increased the demand for labour. The high yielding variety of
seeds, irrigation network of canals and tubewells have given big push to multiple
cropping pattern. This process of agricultural development created shortage of labour
force required for intensive agriculture. The successful and sustained agricultural
transformation widened the gap of per capita income of Punjab compared to other
states of India (Gill, 1990). The poor people of poorer states have started gradually
flowing in the state of Punjab.
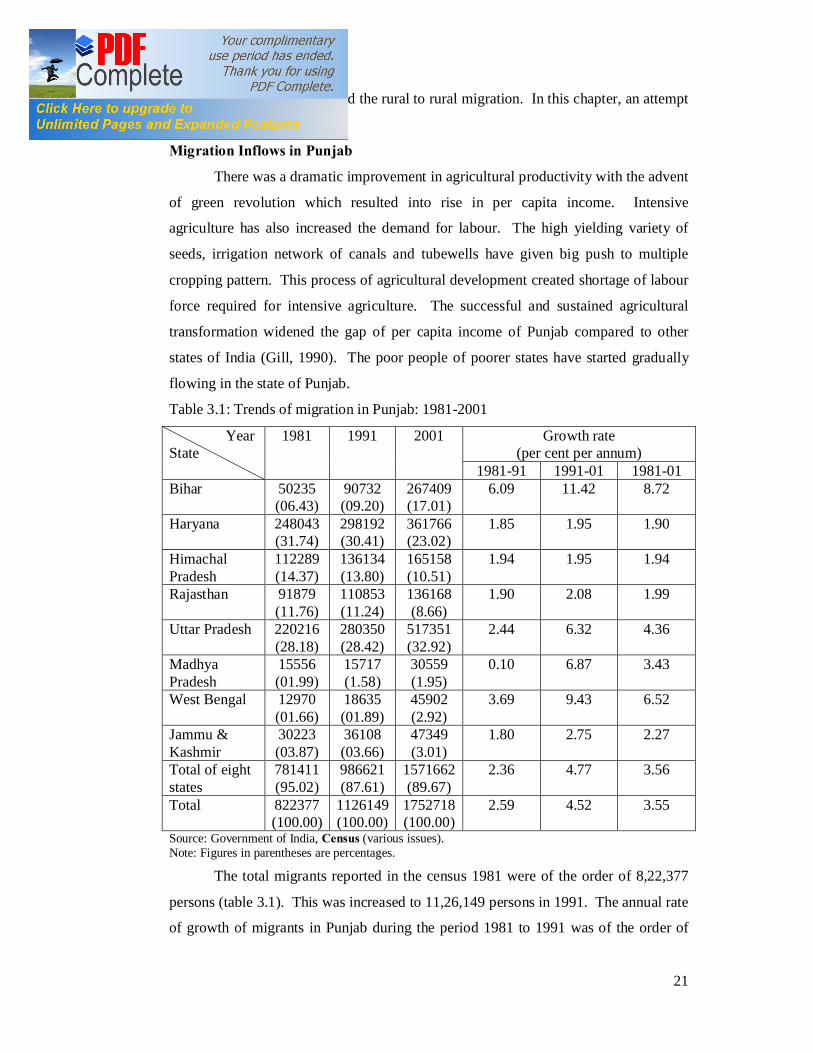
Table 3.1: Trends of migration in Punjab: 1981-2001
Year State
1981 1991 2001 Growth rate (per cent per annum)
1981-91 1991-01 1981-01 Bihar 50235
(06.43) 90732 (09.20)
267409 (17.01)
6.09 11.42 8.72
Haryana 248043 (31.74)
298192 (30.41)
361766 (23.02)
1.85 1.95 1.90
Himachal Pradesh
112289 (14.37)
136134 (13.80)
165158 (10.51)
1.94 1.95 1.94
Rajasthan 91879 (11.76)
110853 (11.24)
136168 (8.66)
1.90 2.08 1.99
Uttar Pradesh 220216 (28.18)
280350 (28.42)
517351 (32.92)
2.44 6.32 4.36
Madhya Pradesh
15556 (01.99)
15717 (1.58)
30559 (1.95)
0.10 6.87 3.43
West Bengal 12970 (01.66)
18635 (01.89)
45902 (2.92)
3.69 9.43 6.52
Jammu & Kashmir
30223 (03.87)
36108 (03.66)
47349 (3.01)
1.80 2.75 2.27
Total of eight states
781411 (95.02)
986621 (87.61)
1571662 (89.67)
2.36 4.77 3.56
Total 822377 (100.00)
1126149 (100.00)
1752718 (100.00)
2.59 4.52 3.55
Source: Government of India, Census (various issues). Note: Figures in parentheses are percentages.
The total migrants reported in the census 1981 were of the order of 8,22,377
persons (table 3.1). This was increased to 11,26,149 persons in 1991. The annual rate
of growth of migrants in Punjab during the period 1981 to 1991 was of the order of

22
2.59. The inflow of migrants increased sharply during the decade of 1991 to 2001.
The total number of migrants increased from 11,26,149 in 1991 to 17,52,718 persons
in 2001. The rise in flows of migrants in Punjab during the period 1991-2001 was
quite sharp. The annual rate of growth comes out to be 4.52 per cent which is higher
than the previous decade.
The compound growth rate of migrant inflows to Punjab was 3.55 per cent per
annum during the period 1981 to 2001. The overall growth rate is higher than the first
decade that is 1981 to 1991 compared with the 1991 to 2001. This implies that the
migrant flow to Punjab was higher in the decade of 1991 to 2001 than that of the 1981
to 1991. However, the similar trends can also be seen from table 3.1 so far as the
growth rates of migrants coming from other important states are concerned.
The perusal of table 3.1 reveals an important fact that the compound rate of
growth of migrant inflows from Bihar was the highest compared to other states.
There was a sharp rise in the migrant inflows from Bihar state to Punjab. When we
compare the structure of migrant inflows, Haryana tops in the year 1981 with 31.74
per cent migrants recorded in Punjab were from Haryana. Uttar Pradesh with 28.18
per cent of the migrant inflows to Punjab was ranked number two. Himachal Pradesh
and Rajasthan ranked number 3 and 4 recorded migrant inflows shares 14.37 and
11.76 per cent respectively. Bihar state comes at number 5 so far as migrant inflow
proportion in 1981 is concerned. The eight important states in terms of migrant
inflows together covered nearly 90 per cent of migrant inflows to Punjab. The
analysis of the changing structure of migrant inflows presented in table 3.1 clearly
shows that Uttar Pradesh has emerged as the most important state that sends migrants
to Punjab. This is contrary to the widely held belief that the majority migrants
inflows are from Bihar (Singh, 2006). However, the proportion of Bihar migrants in
total migrants from other states to Punjab has sharply increased and Bihar is now
ranked at number 3rd in 2001 and improved its rank from 5th in 1981. On the whole,
the higher growth rate than the average of all states of India was recorded by four
states, that is, Bihar, West Bengal, Madhya Pradesh and Uttar Pradesh during the
period 1991 to 2001. The relative shares of migrant inflows in Punjab from these four
states improved, but the share of migrants declined for rest of the states included in
the analysis.
23
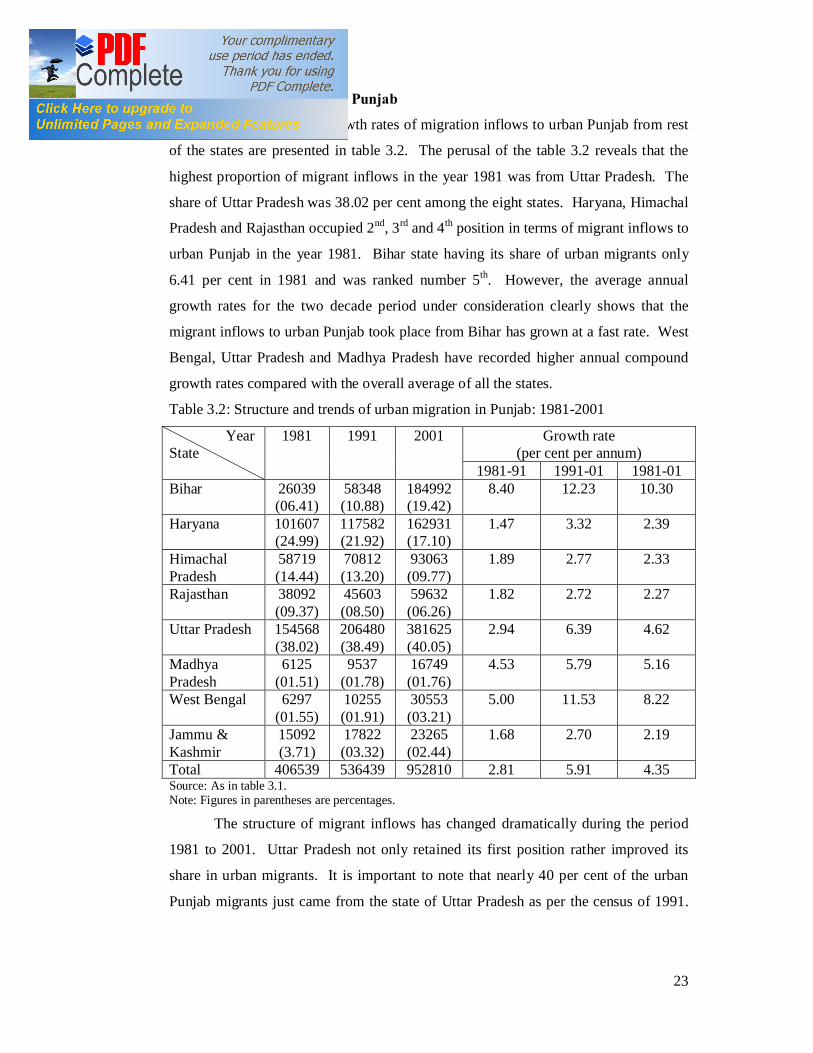
Migration Inflows in Urban Punjab
The structure and growth rates of migration inflows to urban Punjab from rest
of the states are presented in table 3.2. The perusal of the table 3.2 reveals that the
highest proportion of migrant inflows in the year 1981 was from Uttar Pradesh. The
share of Uttar Pradesh was 38.02 per cent among the eight states. Haryana, Himachal
Pradesh and Rajasthan occupied 2nd, 3rd and 4th position in terms of migrant inflows to
urban Punjab in the year 1981. Bihar state having its share of urban migrants only
6.41 per cent in 1981 and was ranked number 5th. However, the average annual
growth rates for the two decade period under consideration clearly shows that the
migrant inflows to urban Punjab took place from Bihar has grown at a fast rate. West
Bengal, Uttar Pradesh and Madhya Pradesh have recorded higher annual compound
growth rates compared with the overall average of all the states.
Table 3.2: Structure and trends of urban migration in Punjab: 1981-2001
Year State
1981 1991 2001 Growth rate (per cent per annum)
1981-91 1991-01 1981-01 Bihar 26039
(06.41) 58348 (10.88)
184992 (19.42)
8.40 12.23 10.30
Haryana 101607 (24.99)
117582 (21.92)
162931 (17.10)
1.47 3.32 2.39
Himachal Pradesh
58719 (14.44)
70812 (13.20)
93063 (09.77)
1.89 2.77 2.33
Rajasthan 38092 (09.37)
45603 (08.50)
59632 (06.26)
1.82 2.72 2.27
Uttar Pradesh 154568 (38.02)
206480 (38.49)
381625 (40.05)
2.94 6.39 4.62
Madhya Pradesh
6125 (01.51)
9537 (01.78)
16749 (01.76)
4.53 5.79 5.16
West Bengal 6297 (01.55)
10255 (01.91)
30553 (03.21)
5.00 11.53 8.22
Jammu & Kashmir
15092 (3.71)
17822 (03.32)
23265 (02.44)
1.68 2.70 2.19
Total 406539 536439 952810 2.81 5.91 4.35 Source: As in table 3.1. Note: Figures in parentheses are percentages.
The structure of migrant inflows has changed dramatically during the period
1981 to 2001. Uttar Pradesh not only retained its first position rather improved its
share in urban migrants. It is important to note that nearly 40 per cent of the urban
Punjab migrants just came from the state of Uttar Pradesh as per the census of 1991.

24
Bihar emerged as the second largest so far as migrant inflows to urban areas of Punjab
are concerned. Haryana and Himachal Pradesh relegated to third and fourth position.
The West Bengal state has improved its relative position from 1.55 per cent in
1981 to 3.21 per cent in 2001 and recorded 8.22 per cent per annum growth rate between
the period 1981 and 2001. The growth rate of migrant inflows from West Bengal to
urban areas of Punjab is comparable to Bihar during the period 1991 to 2001.
Rural Migration in Punjab
Rural economy of Punjab received 4,04,657 persons from other states of India
in the year 1981. Rural migrants registered increasing trend between the period 1981
and 1991. However, the rate of growth was 2.08 per cent during the same period.
Rural migrants registered fast growth between the period 1991 and 2001 and the
growth rate was nearly 3 per cent per annum. Among the eight states, which cover
nearly 93 per cent of the total rural inflow of migration from other states, have been
selected for analysis. Haryana occupies first position from where largest migrants
came from. The proportion of migrants from Haryana was 39.06 per cent in 1981
which increased 40.10 per cent in 1991 and dwindled to 32.13 per cent in 2001. It is
important to note here that Haryana state occupied rank one during the period of
analysis. The rate of growth of migrant inflows from Haryana to rural Punjab was
more than 2 per cent during the period 1981-1991 which was higher than overall as
well as of the eight states average growth rate. However, the growth rate of migrant
inflows declined to nearly one per cent during the period 1991 to 2001. This increase
was lower than overall growth rate as well as of the eight states average growth rate.
The total number of migrants which came to rural areas of Punjab from rural
areas of Uttar Pradesh was of the order of 65,648 in the year 1981. The proportion
comes out to be 17.51 per cent. According to the proportion of migrants, Uttar
Pradesh was ranked number two among the eight important states under
consideration. The rate of growth of migrants from Uttar Pradesh to rural areas of
Punjab was nearly one per cent during the period 1981 to 1991 which was below the
overall as well as combined eight states growth rate. Therefore, the proportion of
migrants declined to 16.41 per cent in 1991 (table 3.3).
There was sharp rise in the growth rate of migrants from Uttar Pradesh to rural
areas of Punjab during the period 1991 to 2001 which was 6.62 per cent per annum.
Therefore, the relative share of Uttar Pradesh dramatically improved to 21.93 per cent

25
which is more than 5 percentage point shift. Rajasthan and Himachal Pradesh
occupied ranks 3rd and 4th in the year 1981 lost to the state of Bihar where the rate of
growth was very high during both the decades. Bihar rose to the 3rd position in the
year 2001 so far as relative shares of migrant inflows to rural areas of Punjab are
concerned. Another important source which has been sending substantial number of
migrants to rural Punjab was the state of Jammu and Kashmir. However, the rate of
growth of migrants from J&K remained slightly below average of other states. Thus,
the relative share of migrants from Jammu and Kashmir declined marginally in 2001
compared with 1981 and 1991. The growth rate of migrant inflows from West Bengal
to rural areas of Punjab was 2.30 per cent per annum between 1981 and 1991. This
growth rate dramatically increased during the period 1991 to 2001 and was of the
order of 6.24 per cent per annum. The structure of rural migrants from other states
remained quite stable except that the relative share of Bihar improved dramatically.
Rural to rural migration from other states to Punjab has increased during the period of
analysis but the growth was slow compared with the migrant inflows to urban areas of
Punjab.
Table 3.3: Structure and tends in rural migration in Punjab: 1981-2001 Year State
1981 1991 2001 Growth rate (per cent per annum)
1981-91 1991-01 1981-01 Bihar 24196
(06.45) 32375 (07.19)
82417 (13.32)
2.95 9.79 6.32
Haryana 146436 (39.06)
180519 (40.10)
198935 (32.15)
2.11 0.97 1.54
Himachal Pradesh
53570 (14.29)
65322 (14.51)
72095 (11.65)
2.00 0.99 1.50
Rajasthan 53787 (14.35)
65250 (14.49)
76536 (12.37)
1.95 1.61 1.78
Uttar Pradesh 65648 (17.51)
738701 (16.41)
135726 (21.93)
1.19 6.62 3.70
Madhya Pradesh
9431 (02.52)
6181 (01.37)
13810 (02.23)
-4.14 8.37 1.92
West Bengal 6673 (01.78)
8380 (01.86)
15349 (02.48)
2.30 6.24 4.25
Jammu & Kashmir
15131 (04.04)
18286 (04.07)
24084 (03.87)
1.91 2.79 2.35
Total of eight states
374872 (92.64)
450182 (90.52)
618852 (93.13)
1.85 3.23 2.54
Total Punjab 404657 (100.00)
497312 (100.00)
664468 (100.00)
2.08 2.94 2.51
Source: As in table 3.1.
26
Estimates of Migrant Labour in Rural Punjab
The pattern of migrant inflows in rural economy of Punjab as ascertained from
36 sampled villages is presented in table 3.4. The analysis of the table 3.4 reveals that
there are two types of migrant workers working in the agrarian economy of Punjab.
One, the workers engaged in regular kind of activities being done by agriculture
households and enter into a contract for one year or beyond are called attached or
regular workers. Two, the workers hired by the farm households during the peak
season, that is, harvesting and sowing are called casual workers. The highly
developed villages of Punjab hire major proportion of both types of migrant workers,
that is, regular and casual. The hiring pattern of casual workers across village
development levels clearly shows that level of development of village and hiring
practices are positively correlated. This pattern also holds true across farm size
classes. Region wise distribution of regular/attached migrant workers and casual
migrant workers brings out the fact that more than 75 per cent of migrant workers
work in Malwa region. Majha region attracted more than 16 per cent of the migrant
workers both regular and casual. The migration inflows in rural areas of Doaba
region are quite low.
On the basis of inflows of migrant workers in the 36 villages of Punjab, we
have estimated total number of migrants from other states to rural Punjab and the
same are presented in table 3.5. Total estimated number of migrant workers working
in rural areas of Punjab comes out to be 8,19,254 persons. This is 23.04 per cent of
the agricultural workforce engaged in the agriculture sector activities. It comes out to
be 58.35 per cent of the rural agricultural labour in Punjab. The casual migrant
workers working in agriculture sector of Punjab were 6,95,615 persons. The casual or
seasonal migrant workers alone come out to be 19.57 per cent of the total agricultural
workers of Punjab. Their proportion in rural agriculture labour comes out to be 49.54
per cent. The higher migrant inflows were recorded in Malwa region of Punjab.
27
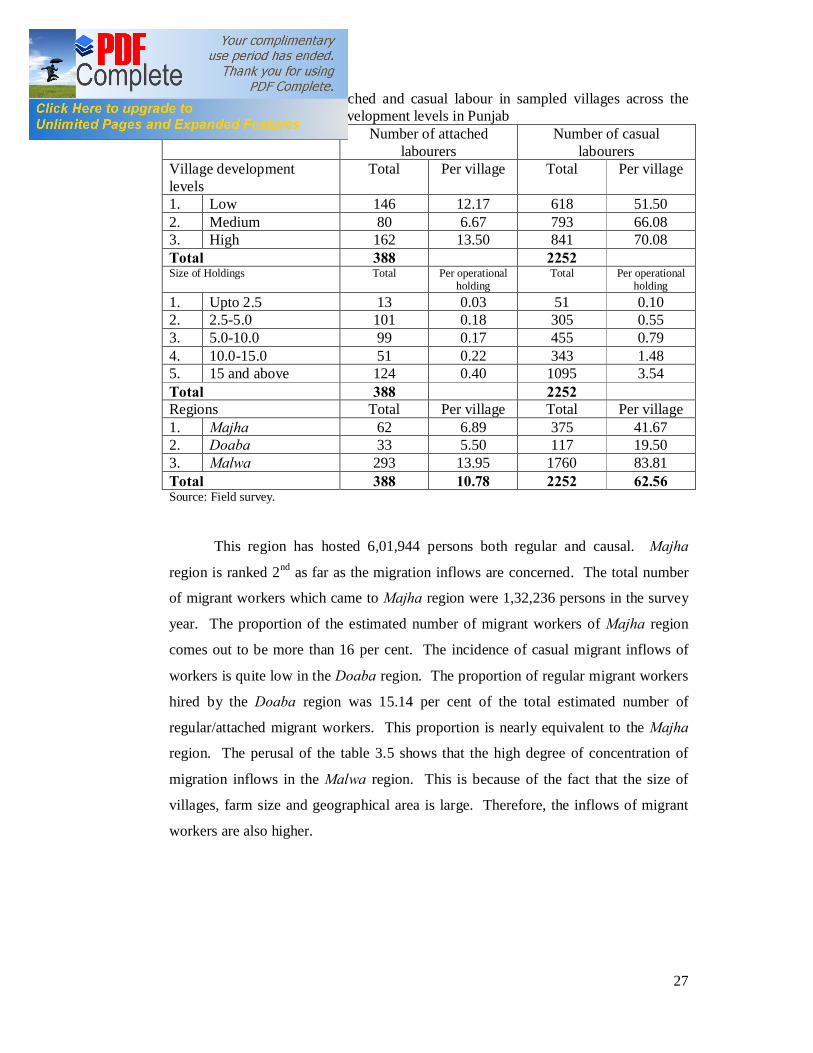
Table 3.4: Migratory attached and casual labour in sampled villages across the regions and development levels in Punjab
Labour Characteristics Number of attached labourers
Number of casual labourers
Village development levels
Total Per village Total Per village
1. Low 146 12.17 618 51.50 2. Medium 80 6.67 793 66.08 3. High 162 13.50 841 70.08 Total 388 2252 Size of Holdings Total Per operational
holding Total Per operational
holding 1. Upto 2.5 13 0.03 51 0.10 2. 2.5-5.0 101 0.18 305 0.55 3. 5.0-10.0 99 0.17 455 0.79 4. 10.0-15.0 51 0.22 343 1.48 5. 15 and above 124 0.40 1095 3.54 Total 388 2252 Regions Total Per village Total Per village 1. Majha 62 6.89 375 41.67 2. Doaba 33 5.50 117 19.50 3. Malwa 293 13.95 1760 83.81 Total 388 10.78 2252 62.56 Source: Field survey.
This region has hosted 6,01,944 persons both regular and causal. Majha
region is ranked 2nd as far as the migration inflows are concerned. The total number
of migrant workers which came to Majha region were 1,32,236 persons in the survey
year. The proportion of the estimated number of migrant workers of Majha region
comes out to be more than 16 per cent. The incidence of casual migrant inflows of
workers is quite low in the Doaba region. The proportion of regular migrant workers
hired by the Doaba region was 15.14 per cent of the total estimated number of
regular/attached migrant workers. This proportion is nearly equivalent to the Majha
region. The perusal of the table 3.5 shows that the high degree of concentration of
migration inflows in the Malwa region. This is because of the fact that the size of
villages, farm size and geographical area is large. Therefore, the inflows of migrant
workers are also higher.
28
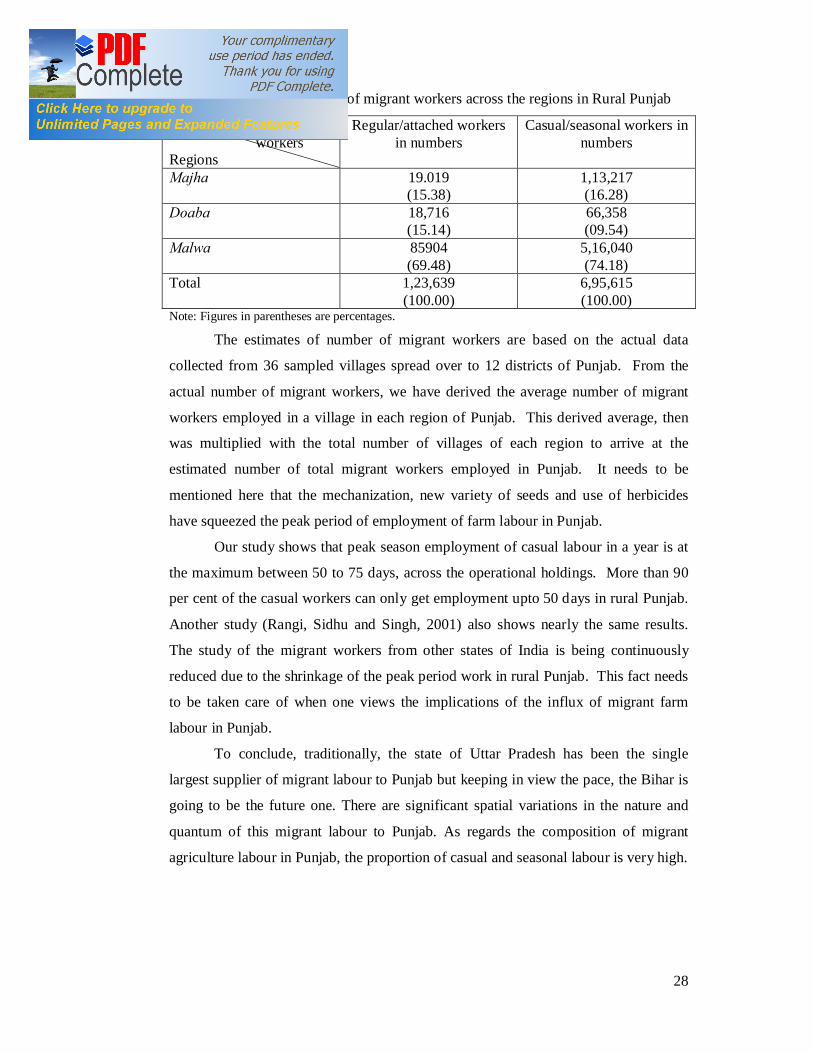
Table 3.5: Estimated number of migrant workers across the regions in Rural Punjab
Types of workers Regions
Regular/attached workers in numbers
Casual/seasonal workers in numbers
Majha 19.019 (15.38)
1,13,217 (16.28)
Doaba 18,716 (15.14)
66,358 (09.54)
Malwa 85904 (69.48)
5,16,040 (74.18)
Total 1,23,639 (100.00)
6,95,615 (100.00)
Note: Figures in parentheses are percentages. The estimates of number of migrant workers are based on the actual data
collected from 36 sampled villages spread over to 12 districts of Punjab. From the
actual number of migrant workers, we have derived the average number of migrant
workers employed in a village in each region of Punjab. This derived average, then
was multiplied with the total number of villages of each region to arrive at the
estimated number of total migrant workers employed in Punjab. It needs to be
mentioned here that the mechanization, new variety of seeds and use of herbicides
have squeezed the peak period of employment of farm labour in Punjab.
Our study shows that peak season employment of casual labour in a year is at
the maximum between 50 to 75 days, across the operational holdings. More than 90
per cent of the casual workers can only get employment upto 50 days in rural Punjab.
Another study (Rangi, Sidhu and Singh, 2001) also shows nearly the same results.
The study of the migrant workers from other states of India is being continuously
reduced due to the shrinkage of the peak period work in rural Punjab. This fact needs
to be taken care of when one views the implications of the influx of migrant farm
labour in Punjab.
To conclude, traditionally, the state of Uttar Pradesh has been the single
largest supplier of migrant labour to Punjab but keeping in view the pace, the Bihar is
going to be the future one. There are significant spatial variations in the nature and
quantum of this migrant labour to Punjab. As regards the composition of migrant
agriculture labour in Punjab, the proportion of casual and seasonal labour is very high.

29
CHAPTER 4
LOCAL AGRICULTURAL LABOUR IN RURAL PUNJAB
As mentioned earlier, the migration of human resources is a natural
manifestation of economic development. The process of economic transformation is
considered socially beneficial because human resources can be shifted from low paid
economic activities to rapidly growing economic activities where marginal product is
higher. In the context of heavy influx of migrant labour to Punjab, there is a need of
the time to analyze the living condition of local labour also.
This chapter dwells on the general profile of 900 local agricultural labourers,
selected at random from 36 villages, spread over 12 blocks in 12 districts of Punjab.
Out of 900 sampled labourers 225, 150 and 525 are from ‘Majha’, ‘Doaba’ and
‘Malwa’ regions of Punjab, respectively. The percentage share of sampled labourers
from ‘Majha’, ‘Doaba’ and ‘Malwa’ regions is, 25, 16.67 and 58.33 per cent,
respectively. The rationale for varying proportion of labourers from the three regions
is given in Chapter 1.
As regards the villages they have been classified as low, medium and high
developed selected from each of the blocks. Since there are equal number of villages
(12 in each category) the distribution of labourers is equal (300 in each category) in
every category of village.
Table 4.1: Region-wise and development level-wise classification of sampled local labourers in sampled villages in Punjab
Group/Sub Group
Total Region Development Level of Village
Majha Doaba Malwa Low Medium High Casual 726
(80.67) 201
(89.33) 129
(86.00) 396
(75.43) 254
(84.67) 246
(82.00) 226
(75.34) Attached 174
(19.33) 24
(10.77) 21
(14.00) 129
(24.57) 46
(15.33) 54
(18.00) 74
(24.66) Number 900
(100.00) 225
(100.00) 150
(100.00) 525
(100.00) 300
(100.00) 300
(100.00) 300
(100.00) Source: Field survey. Note: The source of all the following tables is in this chapter is also field survey.
Further, there are 726 casual labourers and 174 attached labourers in the
sample. Accordingly, the share of casual and attached labourers in the total sample is
80.67 and 19.33 per cent, respectively. The share of casual and attached labourers in
Majha is 89.33 and 10.77 per cent, respectively. The corresponding share in Doaba
30
region is 86 and 14 per cent. The proportion of casual and attached labour in Malwa
region is 75.43 and 24.57 per cent, respectively. Thus, there are wide variations in the
nature of hired labour amongst all the three regions of Punjab. The casualization of
labour is highest in Majha and lowest in Malwa. Though the proportion of casual
labour is quite high in Malwa, as compared to the attached labour, yet the proportion
of attached labour is quite high as compared to the other two regions. One may
attribute the tradition of attached labour in Malwa to the relatively large holdings
and/or to the low level of socio-economic development.
As compared to the regions, the share of casual labour is highest (84.61 per
cent) in low developed and lowest (75.33 per cent) in high developed villages. And
the share of attached labour is lowest (15.33 per cent) in low developed villages and
highest (24.67 per cent) in high developed villages. It may seem to be contradicting
the conclusion drawn in the case of regions. This may not be so taking into account
the fact that the low, medium and high developed villages belong to the low, medium
and high developed blocks.
While collecting information about local agricultural labourers in Punjab, we
also inquired about their housing status. Table 4.2 shows that 98.33 per cent
labourers have their own house across the regions. Inter-regional variation is
negligible. Only 1.67 per cent labourers are living in hired houses. It is significant to
note that no rural labourer is living without roof on his head. As regards house
ownership status, more than 98 per cent labourers own the houses across the low,
medium and high developed villages. There is almost negligible variation with regard
to ownership of house across the various levels of development.
As regards the type of house, 87.56 per cent labourers, out of all the 900
sampled labourers, have semi-pacca (Brick and Mud) houses, 5.55 per cent have
pacca (Bricked) houses and 6.89 per cent have kacha (Mud) houses. It is interesting
to note that in Malwa the percentage share of labourers having pacca houses is highest
(8.00 per cent) among all the three regions. At the same time, the proportion of
labourers, having kacha houses, is also highest (7.81 per cent) in Malwa. Clearly the
proportion of labourers, having semi-pacca houses, is lowest (84.19 per cent) in
Malwa.
As regards the type of house in low, medium and high developed villages the
variation is nearly on expected lines. The only exception is in the case of semi-pacca
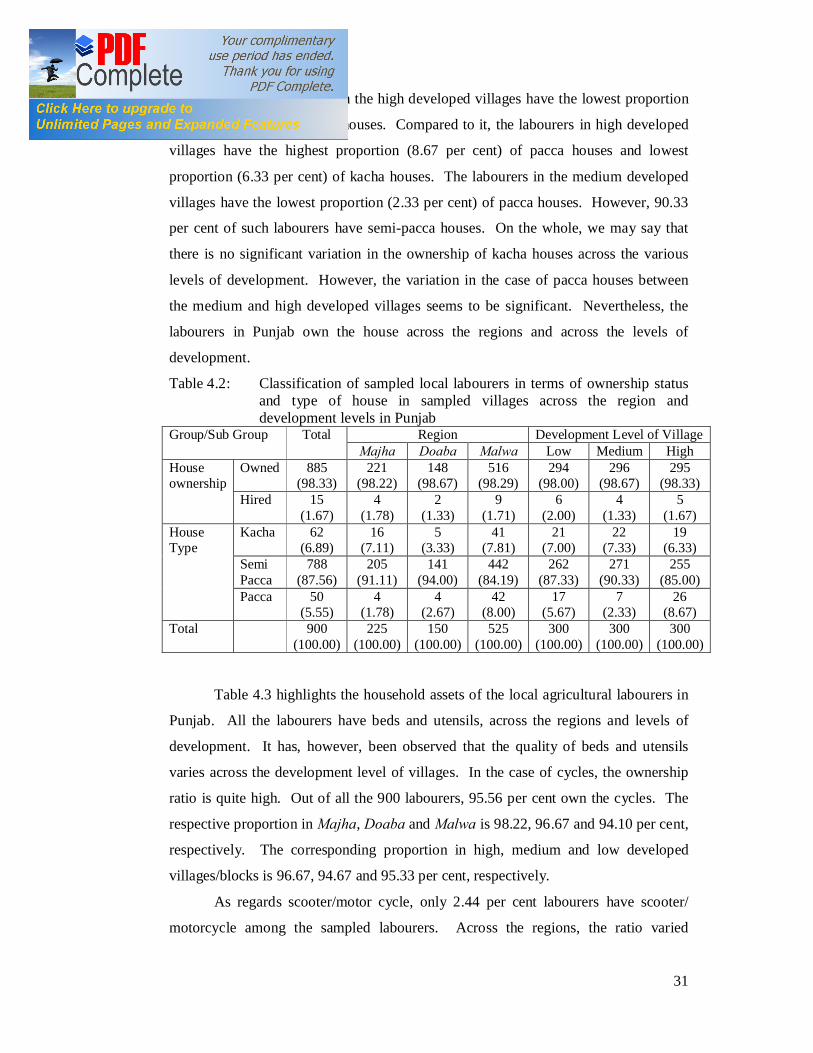
31
houses where the labourers in the high developed villages have the lowest proportion
(85 per cent) of semi-pacca houses. Compared to it, the labourers in high developed
villages have the highest proportion (8.67 per cent) of pacca houses and lowest
proportion (6.33 per cent) of kacha houses. The labourers in the medium developed
villages have the lowest proportion (2.33 per cent) of pacca houses. However, 90.33
per cent of such labourers have semi-pacca houses. On the whole, we may say that
there is no significant variation in the ownership of kacha houses across the various
levels of development. However, the variation in the case of pacca houses between
the medium and high developed villages seems to be significant. Nevertheless, the
labourers in Punjab own the house across the regions and across the levels of
development.
Table 4.2: Classification of sampled local labourers in terms of ownership status and type of house in sampled villages across the region and development levels in Punjab
Group/Sub Group Total Region Development Level of Village Majha Doaba Malwa Low Medium High
House ownership
Owned 885 (98.33)
221 (98.22)
148 (98.67)
516 (98.29)
294 (98.00)
296 (98.67)
295 (98.33)
Hired 15 (1.67)
4 (1.78)
2 (1.33)
9 (1.71)
6 (2.00)
4 (1.33)
5 (1.67)
House Type
Kacha 62 (6.89)
16 (7.11)
5 (3.33)
41 (7.81)
21 (7.00)
22 (7.33)
19 (6.33)
Semi Pacca
788 (87.56)
205 (91.11)
141 (94.00)
442 (84.19)
262 (87.33)
271 (90.33)
255 (85.00)
Pacca 50 (5.55)
4 (1.78)
4 (2.67)
42 (8.00)
17 (5.67)
7 (2.33)
26 (8.67)
Total 900 (100.00)
225 (100.00)
150 (100.00)
525 (100.00)
300 (100.00)
300 (100.00)
300 (100.00)
Table 4.3 highlights the household assets of the local agricultural labourers in
Punjab. All the labourers have beds and utensils, across the regions and levels of
development. It has, however, been observed that the quality of beds and utensils
varies across the development level of villages. In the case of cycles, the ownership
ratio is quite high. Out of all the 900 labourers, 95.56 per cent own the cycles. The
respective proportion in Majha, Doaba and Malwa is 98.22, 96.67 and 94.10 per cent,
respectively. The corresponding proportion in high, medium and low developed
villages/blocks is 96.67, 94.67 and 95.33 per cent, respectively.
As regards scooter/motor cycle, only 2.44 per cent labourers have scooter/
motorcycle among the sampled labourers. Across the regions, the ratio varied
32
between 1.78 per cent in Majha to 3.33 per cent in Doaba. From amongst the low,
medium and high developed villages only 0.33 per cent labourers have the
scooter/motorcycle in medium developed villages. It has been observed, that only
those labourers have the scooter/motorcycle that use it as a necessity. The extremely
low proportion of labourers having scooters is largely due to non-affordability.
Nearly 95 per cent sampled labourers own one fan. A very thin proportion of
them own the second fan. Malwa has the lowest proportion (93.52 per cent) of
labourers with fans whereas Majha and Doaba have almost the same proportion in
this regard. As regards the ownership of fan across the various levels of development,
the lowest proportion (93.52 per cent) is in high developed villages. It is something
strange. This is a crude indicator that level of development has not helped 7 per cent
of labourers in the developed villages to own a fan. Nevertheless, fan has become a
necessity of labourers in Punjab, largely because of extreme hot weather for well over
five months. Not even a single sampled labourer in Punjab owns cooler. This again
is due to the non-affordability of the labourers.
The television penetration is higher than the radio, as is evident from table 4.3.
About 50 per cent of labourers own television. Compared to it, only 32.44 per cent
labourers own radio. Across the regions, 68 per cent of labourers in Doaba, followed
by Majha (48.00 per cent) and Malwa (45.52 per cent), have television. The
corresponding proportion of labourers having radio is 46.67, 30.67 and 29.14 per cent,
respectively. The variation across the development level of villages is, however, not
that wide. It is interesting to note that proportion of labourers having television in low
and high developed villages is almost the same. Compared to it, the proportion of
radio owners in low developed villages is higher than the high developed villages.
Interestingly the proportion of labourers having television and radio is lowest in
medium developed villages. Across the regions, Malwa has the lowest penetration of
television and radio among the labourers.
About 97 per cent of the labourers do not have refrigerators. Across the
regions 10.67 per cent labourers have refrigerators in Doaba where as the proportion
is less than 2 per cent in other regions. Interestingly the proportion of labourers
having refrigerators is slightly higher in Malwa than that in Majha. Amongst low,
medium and high developed villages, the proportion of labourers varies between 3 to
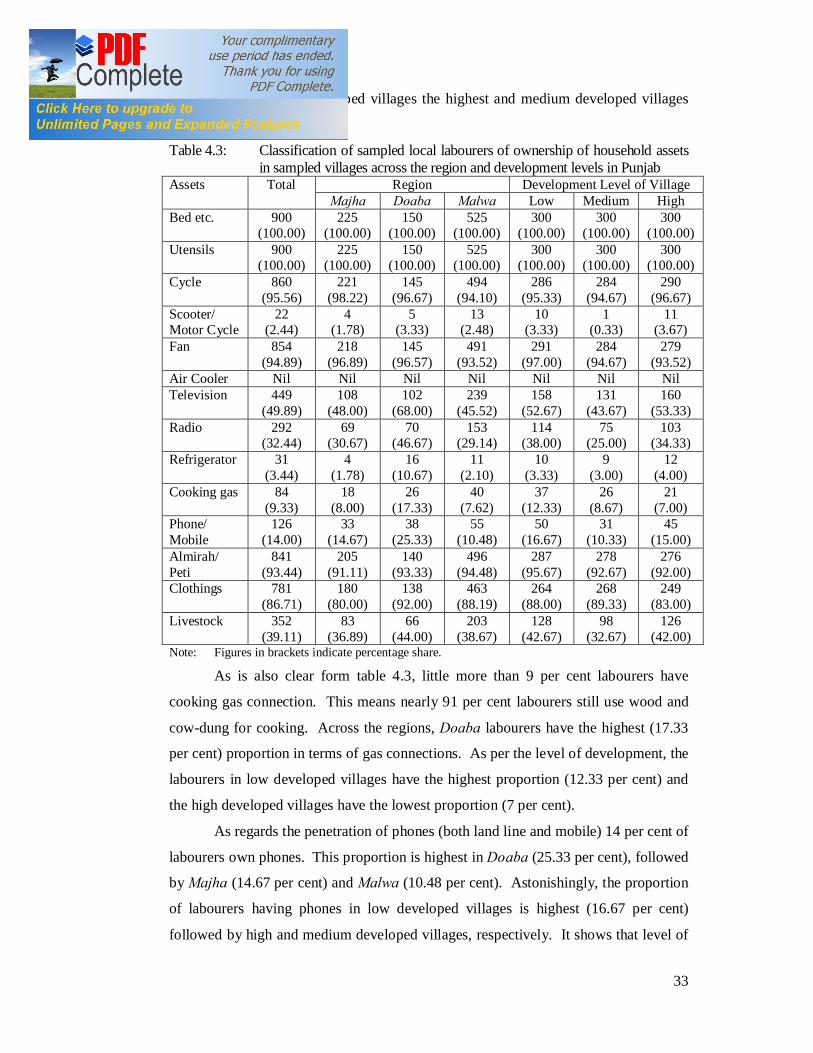
33
4 per cent, with high developed villages the highest and medium developed villages
the lowest.
Table 4.3: Classification of sampled local labourers of ownership of household assets in sampled villages across the region and development levels in Punjab
Assets Total Region Development Level of Village Majha Doaba Malwa Low Medium High
Bed etc. 900 (100.00)
225 (100.00)
150 (100.00)
525 (100.00)
300 (100.00)
300 (100.00)
300 (100.00)
Utensils 900 (100.00)
225 (100.00)
150 (100.00)
525 (100.00)
300 (100.00)
300 (100.00)
300 (100.00)
Cycle 860 (95.56)
221 (98.22)
145 (96.67)
494 (94.10)
286 (95.33)
284 (94.67)
290 (96.67)
Scooter/ Motor Cycle
22 (2.44)
4 (1.78)
5 (3.33)
13 (2.48)
10 (3.33)
1 (0.33)
11 (3.67)
Fan 854 (94.89)
218 (96.89)
145 (96.57)
491 (93.52)
291 (97.00)
284 (94.67)
279 (93.52)
Air Cooler Nil Nil Nil Nil Nil Nil Nil Television 449
(49.89) 108
(48.00) 102
(68.00) 239
(45.52) 158
(52.67) 131
(43.67) 160
(53.33) Radio 292
(32.44) 69
(30.67) 70
(46.67) 153
(29.14) 114
(38.00) 75
(25.00) 103
(34.33) Refrigerator 31
(3.44) 4
(1.78) 16
(10.67) 11
(2.10) 10
(3.33) 9
(3.00) 12
(4.00) Cooking gas 84
(9.33) 18
(8.00) 26
(17.33) 40
(7.62) 37
(12.33) 26
(8.67) 21
(7.00) Phone/ Mobile
126 (14.00)
33 (14.67)
38 (25.33)
55 (10.48)
50 (16.67)
31 (10.33)
45 (15.00)
Almirah/ Peti
841 (93.44)
205 (91.11)
140 (93.33)
496 (94.48)
287 (95.67)
278 (92.67)
276 (92.00)
Clothings 781 (86.71)
180 (80.00)
138 (92.00)
463 (88.19)
264 (88.00)
268 (89.33)
249 (83.00)
Livestock 352 (39.11)
83 (36.89)
66 (44.00)
203 (38.67)
128 (42.67)
98 (32.67)
126 (42.00)
Note: Figures in brackets indicate percentage share.
As is also clear form table 4.3, little more than 9 per cent labourers have
cooking gas connection. This means nearly 91 per cent labourers still use wood and
cow-dung for cooking. Across the regions, Doaba labourers have the highest (17.33
per cent) proportion in terms of gas connections. As per the level of development, the
labourers in low developed villages have the highest proportion (12.33 per cent) and
the high developed villages have the lowest proportion (7 per cent).
As regards the penetration of phones (both land line and mobile) 14 per cent of
labourers own phones. This proportion is highest in Doaba (25.33 per cent), followed
by Majha (14.67 per cent) and Malwa (10.48 per cent). Astonishingly, the proportion
of labourers having phones in low developed villages is highest (16.67 per cent)
followed by high and medium developed villages, respectively. It shows that level of

34
development is not a determinant of ownership of phones in the case of labourers. It
is important to note that the labourers in Doaba have the highest proportion of
televisions, radio, refrigerators, gas connections and phones. Such a phenomenon
may be attributed to relatively higher out-migration to foreign countries from the
region.
As regards owning of almirah/’Peti’, a little more than 93 per cent labourers
own almirah. The difference is not very high across the regions and across the
development level of villages. It is however, important to note that nearly 13 per cent
of the labourers do not have adequate clothing, particularly winter clothing.
Astonishingly, Majha is the worst in this regard where 20 per cent labourers lack
sufficient quantity of clothing. Amongst the low, medium and high developed
villages, nearly 11 per cent in medium, 12 per cent in low and 17 per cent labourers in
high developed villages do not have adequate quantity of clothing. It is very
important revelation of the study, as it is often understood that poor people in Punjab
have a sufficient quantity of clothing.
Approximately 39 per cent of the labourers rear live stock (mainly milch
animals) to meet their demand for milk and to supplement the family income. The
proportion is highest (44 per cent) in Doaba followed by Malwa and Majha. Across
the levels of development, it is 42 to 43 per cent in high and low developed villages
and 33 per cent in medium developed villages.
Table 4.4: Classification of sampled local labourers in terms of drinking water in sampled villages across the region and development levels in Punjab
Source Total Region Development Level of Village Majha Doaba Malwa Low Medium High
Tap Water 605 (67.22)
124 (55.11)
116 (77.33)
365 (69.53)
199 (66.34)
201 (67.00)
205 (68.34)
Owned Pump 257 (28.56)
97 (43.11)
34 (22.67)
126 (24.00)
85 (28.33)
88 (29.33)
84 (28.00)
Neighbourer 29 (3.32)
4 (1.78)
- 25 (4.76)
15 (5.00)
4 (1.33)
10 (3.33)
Well 3 (0.33)
- - 3 (0.57)
- 2 (0.67)
1 (0.33)
Miscellaneous 6 (0.67)
- - 6 (1.14)
1 (0.33)
5 (1.67)
-
Note: Figures in brackets indicate percentage share.
Table 4.4 presents labourers’ access to drinking water in rural Punjab. Out of
the 900 sampled labourers, two-third has the access to tap-water. Another 28.56 per
cent own hand-pumps and 3 per cent use well-water. It means nearly one-third do not

35
have access to tap-water. Region wise 77.33 per cent, 69.53 per cent and 55.11 per
cent labourers in Doaba, Malwa and Majha, respectively have access to tap water.
Accordingly the proportion of labourers using owned pump water is highest (43.11
per cent) in Majha. One of the reasons for this may be that the quality of ground
water in Majha is relatively better than the other two regions. In terms of
development level, the access to tap water does not indicate any significant difference.
Accordingly, the access to water from owned pumps is almost the same across the
various levels of development. It is clear from the foregoing discussion that access to
tap water is quite high in Punjab.
Hence, regional specificity and economic determinants are associated with
recruitment of local attached labour in Punjab. Across the state, about four-fifth of the
local agricultural labourers are casual. Local labour prefers its own house; no matter it
is kacha or semi-pacca. Almost all have the basic necessities like beds, utensils,
cloths, fan and cycle but majority are deprived of necessities like radio, television,
scooter, motorcycle, air cooler, refrigerator, cooking gas, etc. The problem of
drinking water is not visible.
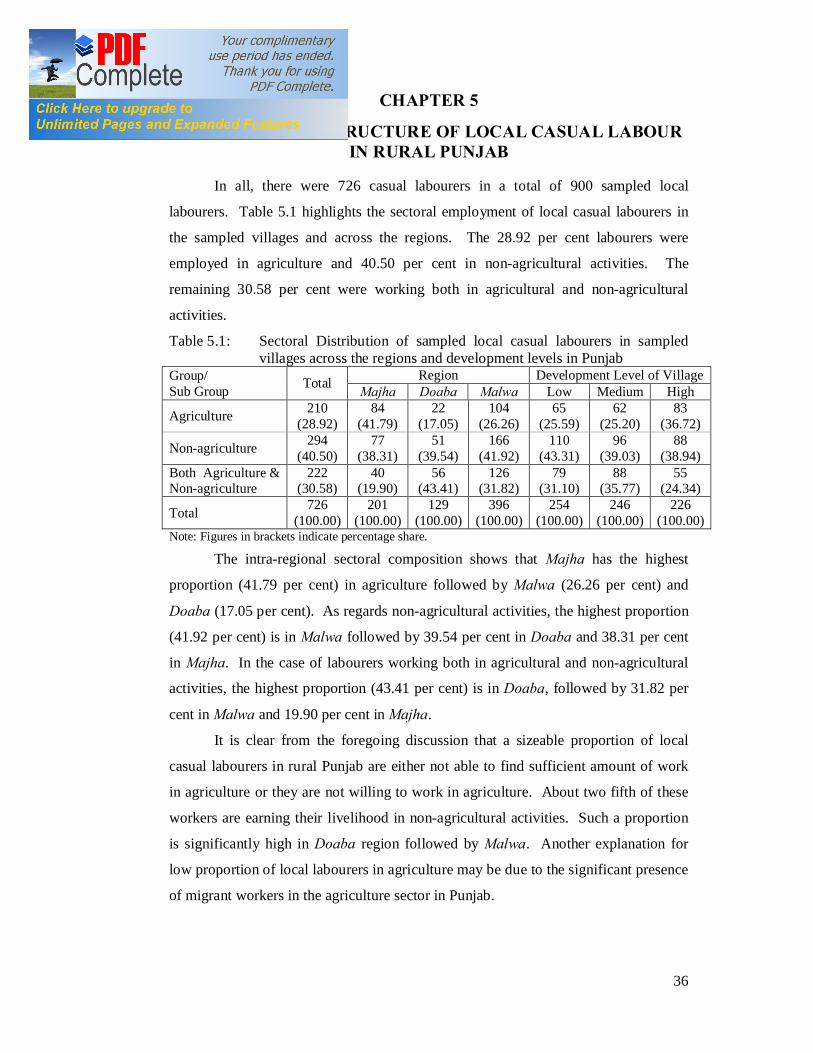
36
CHAPTER 5
OCCUPATIONAL STRUCTURE OF LOCAL CASUAL LABOUR IN RURAL PUNJAB
In all, there were 726 casual labourers in a total of 900 sampled local
labourers. Table 5.1 highlights the sectoral employment of local casual labourers in
the sampled villages and across the regions. The 28.92 per cent labourers were
employed in agriculture and 40.50 per cent in non-agricultural activities. The
remaining 30.58 per cent were working both in agricultural and non-agricultural
activities.
Table 5.1: Sectoral Distribution of sampled local casual labourers in sampled villages across the regions and development levels in Punjab
Group/ Sub Group Total Region Development Level of Village
Majha Doaba Malwa Low Medium High
Agriculture 210 (28.92)
84 (41.79)
22 (17.05)
104 (26.26)
65 (25.59)
62 (25.20)
83 (36.72)
Non-agriculture 294 (40.50)
77 (38.31)
51 (39.54)
166 (41.92)
110 (43.31)
96 (39.03)
88 (38.94)
Both Agriculture & Non-agriculture
222 (30.58)
40 (19.90)
56 (43.41)
126 (31.82)
79 (31.10)
88 (35.77)
55 (24.34)
Total 726 (100.00)
201 (100.00)
129 (100.00)
396 (100.00)
254 (100.00)
246 (100.00)
226 (100.00)
Note: Figures in brackets indicate percentage share.
The intra-regional sectoral composition shows that Majha has the highest
proportion (41.79 per cent) in agriculture followed by Malwa (26.26 per cent) and
Doaba (17.05 per cent). As regards non-agricultural activities, the highest proportion
(41.92 per cent) is in Malwa followed by 39.54 per cent in Doaba and 38.31 per cent
in Majha. In the case of labourers working both in agricultural and non-agricultural
activities, the highest proportion (43.41 per cent) is in Doaba, followed by 31.82 per
cent in Malwa and 19.90 per cent in Majha.
It is clear from the foregoing discussion that a sizeable proportion of local
casual labourers in rural Punjab are either not able to find sufficient amount of work
in agriculture or they are not willing to work in agriculture. About two fifth of these
workers are earning their livelihood in non-agricultural activities. Such a proportion
is significantly high in Doaba region followed by Malwa. Another explanation for
low proportion of local labourers in agriculture may be due to the significant presence
of migrant workers in the agriculture sector in Punjab.
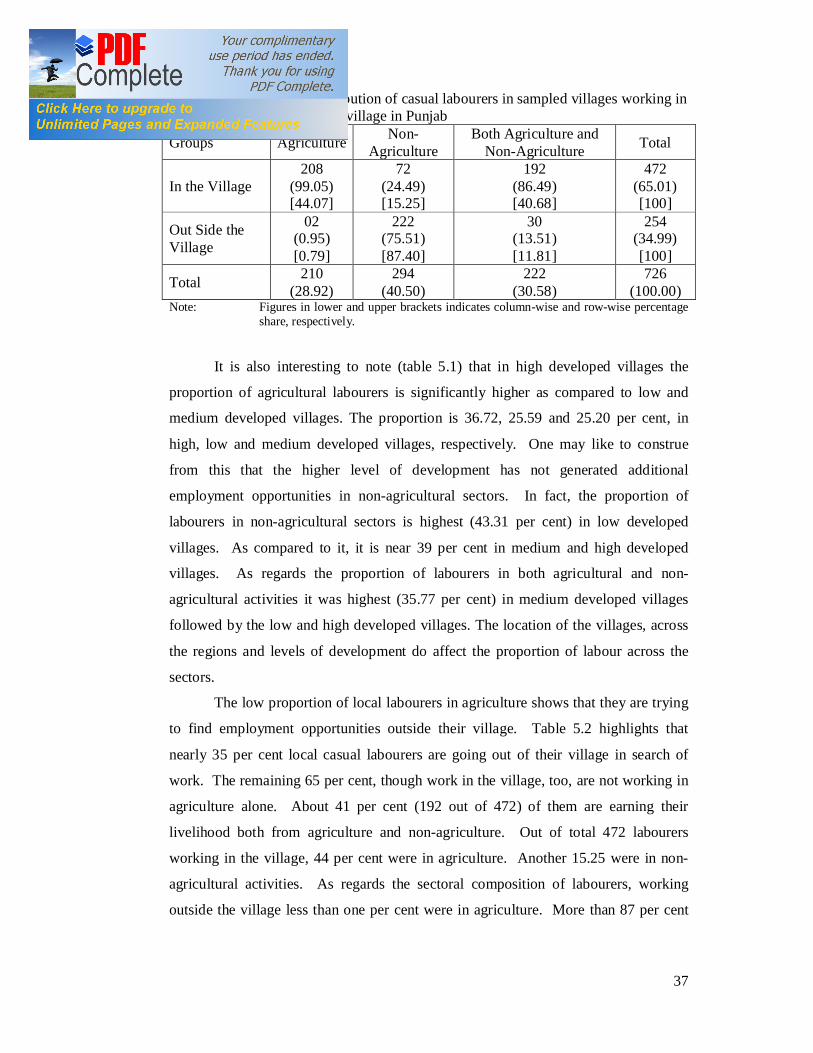
37
Table 5.2: Sectoral distribution of casual labourers in sampled villages working in and out of the village in Punjab
Groups Agriculture Non-Agriculture
Both Agriculture and Non-Agriculture Total
In the Village 208
(99.05) [44.07]
72 (24.49) [15.25]
192 (86.49) [40.68]
472 (65.01) [100]
Out Side the Village
02 (0.95) [0.79]
222 (75.51) [87.40]
30 (13.51) [11.81]
254 (34.99) [100]
Total 210 (28.92)
294 (40.50)
222 (30.58)
726 (100.00)
Note: Figures in lower and upper brackets indicates column-wise and row-wise percentage share, respectively.
It is also interesting to note (table 5.1) that in high developed villages the
proportion of agricultural labourers is significantly higher as compared to low and
medium developed villages. The proportion is 36.72, 25.59 and 25.20 per cent, in
high, low and medium developed villages, respectively. One may like to construe
from this that the higher level of development has not generated additional
employment opportunities in non-agricultural sectors. In fact, the proportion of
labourers in non-agricultural sectors is highest (43.31 per cent) in low developed
villages. As compared to it, it is near 39 per cent in medium and high developed
villages. As regards the proportion of labourers in both agricultural and non-
agricultural activities it was highest (35.77 per cent) in medium developed villages
followed by the low and high developed villages. The location of the villages, across
the regions and levels of development do affect the proportion of labour across the
sectors.
The low proportion of local labourers in agriculture shows that they are trying
to find employment opportunities outside their village. Table 5.2 highlights that
nearly 35 per cent local casual labourers are going out of their village in search of
work. The remaining 65 per cent, though work in the village, too, are not working in
agriculture alone. About 41 per cent (192 out of 472) of them are earning their
livelihood both from agriculture and non-agriculture. Out of total 472 labourers
working in the village, 44 per cent were in agriculture. Another 15.25 were in non-
agricultural activities. As regards the sectoral composition of labourers, working
outside the village less than one per cent were in agriculture. More than 87 per cent
38
were in non-agricultural activities and about 12 per cent were both in agricultural and
non-agricultural activities.
Within agriculture, less than one per cent labourers were working outside the
village. Compared to it, 99 per cent were working in the village only. Thus, those
who work in agriculture only, they are more interested to work in the village itself. In
the case of non-agricultural activities, only 24.49 per cent were working in the village
and 75.51 per cent were working outside the village. Thus, three-fourth workers,
engaged in non-agricultural activities alone, were working outside their village. As
regards the labourers engaged both in agricultural and non-agricultural activities,
86.49 per cent were working in the village and the remaining 13.51 per cent were
working outside the village.
It is clear from the foregoing discussion that a sizeable proportion of labourers
(nearly two-third; on the assumption that of those working both in agriculture and
non-agriculture, are employed 50 per cent of their time in agriculture alone), working
in the village, are absorbed in agriculture. On the same assumption, the proportion of
labourers, working outside the village, in non-agricultural activities comes out to be
about 93 per cent. Thus, the rural labourers who are going outside the village (due to
push factor of agriculture or due to pull factor of non-agricultural sector) prefer to
work only in non-agricultural activities.
Table 5.3, depicts the classification of labourers, as per number of days, in
agricultural and non-agricultural activities. A very high proportion (63.48 per cent) of
labourers working in agriculture finds work only between 8 to 10 days in a month.
Another 36.57 per cent find work between 10 to 20 days per month. This means the
availability of work in agriculture is quite low.
Across the regions, 82.05 per cent labourers are working only between 8 to 10
days per month in agriculture in Doaba. The corresponding proportion is 69.56 per
cent in Malwa and 40.32 per cent in Majha. However, 59.68 per cent agricultural
labourers in Majha are working for 10-20 days per month. Such a proportion in the
other two regions is quite low.
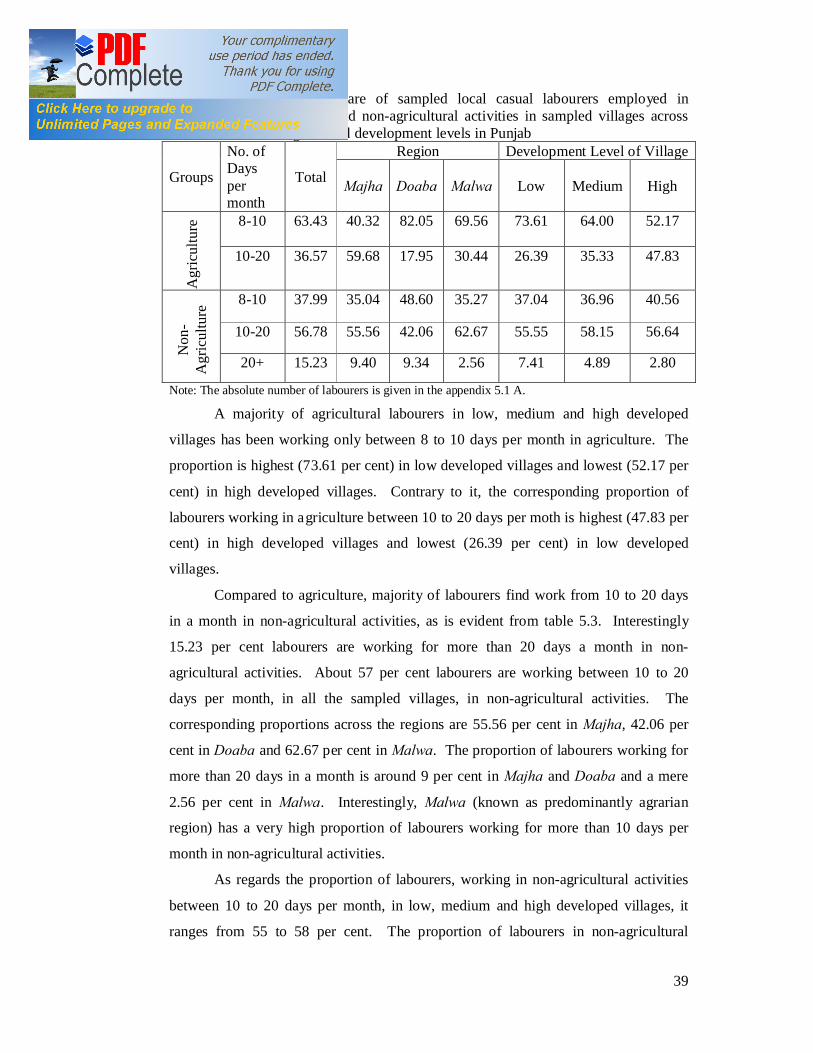
39
Table 5.3: Percentage share of sampled local casual labourers employed in agricultural and non-agricultural activities in sampled villages across the regions and development levels in Punjab
Groups
No. of Days per month
Total
Region Development Level of Village
Majha Doaba Malwa Low Medium High A
gric
ultu
re 8-10 63.43 40.32 82.05 69.56 73.61 64.00 52.17
10-20 36.57 59.68 17.95 30.44 26.39 35.33 47.83
Non
-A
gric
ultu
re 8-10 37.99 35.04 48.60 35.27 37.04 36.96 40.56
10-20 56.78 55.56 42.06 62.67 55.55 58.15 56.64
20+ 15.23 9.40 9.34 2.56 7.41 4.89 2.80
Note: The absolute number of labourers is given in the appendix 5.1 A.
A majority of agricultural labourers in low, medium and high developed
villages has been working only between 8 to 10 days per month in agriculture. The
proportion is highest (73.61 per cent) in low developed villages and lowest (52.17 per
cent) in high developed villages. Contrary to it, the corresponding proportion of
labourers working in agriculture between 10 to 20 days per moth is highest (47.83 per
cent) in high developed villages and lowest (26.39 per cent) in low developed
villages.
Compared to agriculture, majority of labourers find work from 10 to 20 days
in a month in non-agricultural activities, as is evident from table 5.3. Interestingly
15.23 per cent labourers are working for more than 20 days a month in non-
agricultural activities. About 57 per cent labourers are working between 10 to 20
days per month, in all the sampled villages, in non-agricultural activities. The
corresponding proportions across the regions are 55.56 per cent in Majha, 42.06 per
cent in Doaba and 62.67 per cent in Malwa. The proportion of labourers working for
more than 20 days in a month is around 9 per cent in Majha and Doaba and a mere
2.56 per cent in Malwa. Interestingly, Malwa (known as predominantly agrarian
region) has a very high proportion of labourers working for more than 10 days per
month in non-agricultural activities.
As regards the proportion of labourers, working in non-agricultural activities
between 10 to 20 days per month, in low, medium and high developed villages, it
ranges from 55 to 58 per cent. The proportion of labourers in non-agricultural
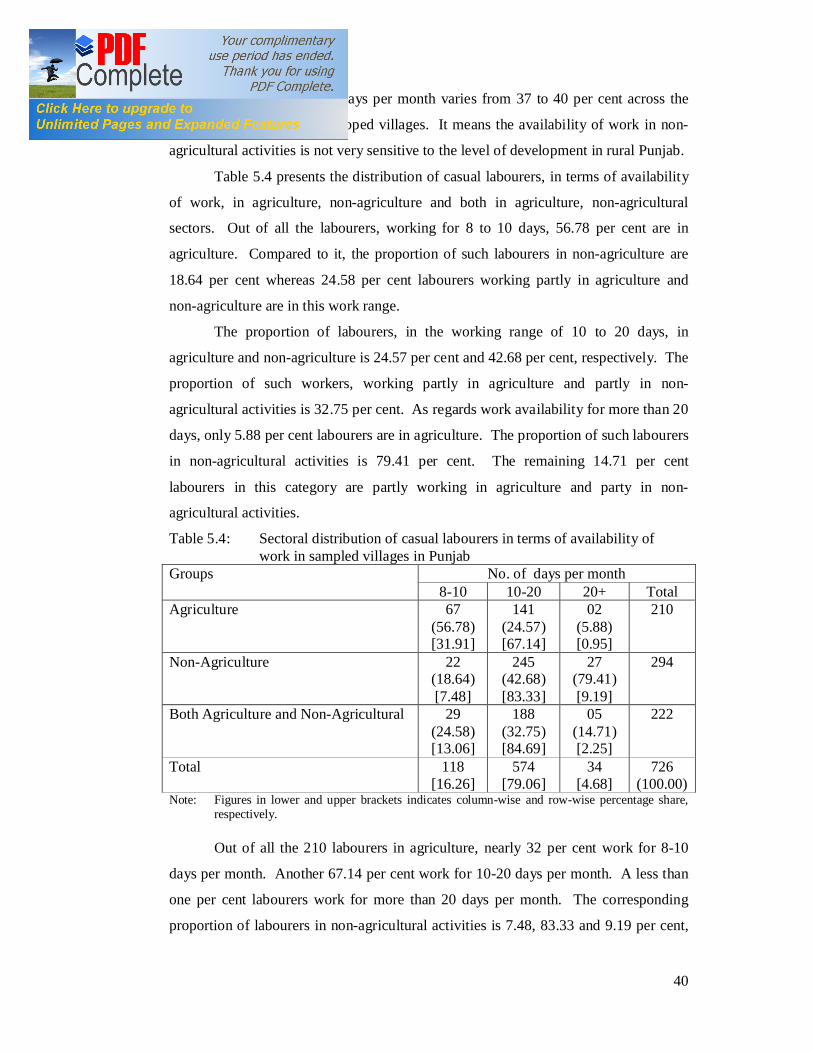
40
activities working up to 10 days per month varies from 37 to 40 per cent across the
low, medium and high developed villages. It means the availability of work in non-
agricultural activities is not very sensitive to the level of development in rural Punjab.
Table 5.4 presents the distribution of casual labourers, in terms of availability
of work, in agriculture, non-agriculture and both in agriculture, non-agricultural
sectors. Out of all the labourers, working for 8 to 10 days, 56.78 per cent are in
agriculture. Compared to it, the proportion of such labourers in non-agriculture are
18.64 per cent whereas 24.58 per cent labourers working partly in agriculture and
non-agriculture are in this work range.
The proportion of labourers, in the working range of 10 to 20 days, in
agriculture and non-agriculture is 24.57 per cent and 42.68 per cent, respectively. The
proportion of such workers, working partly in agriculture and partly in non-
agricultural activities is 32.75 per cent. As regards work availability for more than 20
days, only 5.88 per cent labourers are in agriculture. The proportion of such labourers
in non-agricultural activities is 79.41 per cent. The remaining 14.71 per cent
labourers in this category are partly working in agriculture and party in non-
agricultural activities.
Table 5.4: Sectoral distribution of casual labourers in terms of availability of work in sampled villages in Punjab
Groups No. of days per month 8-10 10-20 20+ Total
Agriculture 67 (56.78) [31.91]
141 (24.57) [67.14]
02 (5.88) [0.95]
210
Non-Agriculture 22 (18.64) [7.48]
245 (42.68) [83.33]
27 (79.41) [9.19]
294
Both Agriculture and Non-Agricultural 29 (24.58) [13.06]
188 (32.75) [84.69]
05 (14.71) [2.25]
222
Total 118 [16.26]
574 [79.06]
34 [4.68]
726 (100.00)
Note: Figures in lower and upper brackets indicates column-wise and row-wise percentage share, respectively.
Out of all the 210 labourers in agriculture, nearly 32 per cent work for 8-10
days per month. Another 67.14 per cent work for 10-20 days per month. A less than
one per cent labourers work for more than 20 days per month. The corresponding
proportion of labourers in non-agricultural activities is 7.48, 83.33 and 9.19 per cent,
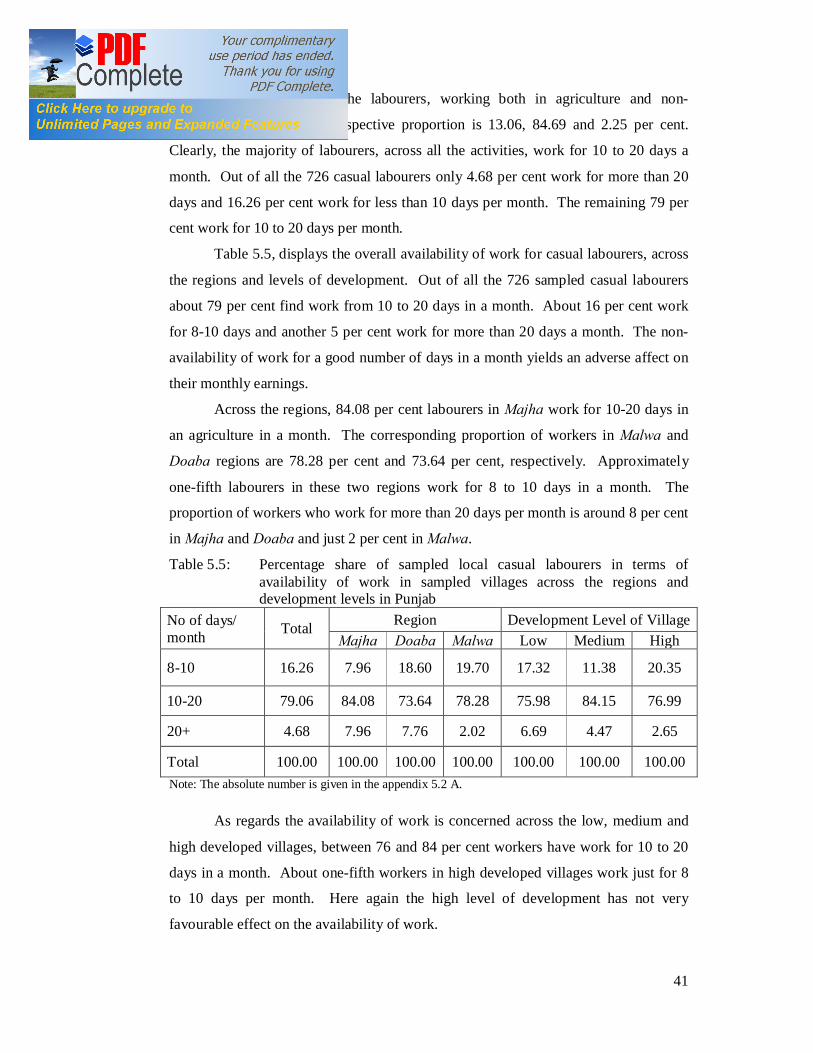
41
respectively. As regards the labourers, working both in agriculture and non-
agricultural activities, the respective proportion is 13.06, 84.69 and 2.25 per cent.
Clearly, the majority of labourers, across all the activities, work for 10 to 20 days a
month. Out of all the 726 casual labourers only 4.68 per cent work for more than 20
days and 16.26 per cent work for less than 10 days per month. The remaining 79 per
cent work for 10 to 20 days per month.
Table 5.5, displays the overall availability of work for casual labourers, across
the regions and levels of development. Out of all the 726 sampled casual labourers
about 79 per cent find work from 10 to 20 days in a month. About 16 per cent work
for 8-10 days and another 5 per cent work for more than 20 days a month. The non-
availability of work for a good number of days in a month yields an adverse affect on
their monthly earnings.
Across the regions, 84.08 per cent labourers in Majha work for 10-20 days in
an agriculture in a month. The corresponding proportion of workers in Malwa and
Doaba regions are 78.28 per cent and 73.64 per cent, respectively. Approximately
one-fifth labourers in these two regions work for 8 to 10 days in a month. The
proportion of workers who work for more than 20 days per month is around 8 per cent
in Majha and Doaba and just 2 per cent in Malwa.
Table 5.5: Percentage share of sampled local casual labourers in terms of availability of work in sampled villages across the regions and development levels in Punjab
No of days/ month Total Region Development Level of Village
Majha Doaba Malwa Low Medium High
8-10 16.26 7.96 18.60 19.70 17.32 11.38 20.35
10-20 79.06 84.08 73.64 78.28 75.98 84.15 76.99
20+ 4.68 7.96 7.76 2.02 6.69 4.47 2.65
Total 100.00 100.00 100.00 100.00 100.00 100.00 100.00 Note: The absolute number is given in the appendix 5.2 A.
As regards the availability of work is concerned across the low, medium and
high developed villages, between 76 and 84 per cent workers have work for 10 to 20
days in a month. About one-fifth workers in high developed villages work just for 8
to 10 days per month. Here again the high level of development has not very
favourable effect on the availability of work.

42
Table 5.6 shows the range of working hours in day, across the agricultural and
non-agricultural sectors. Within agriculture, 59.05 per cent labourers work for 7 to 8
hours per day, 28.10 per cent work for 5 to 7 hours a day and about 12.85 per cent
work for 8 to 10 hours a day. In non-agricultural sectors 70.07 per cent labourers
work for 7 to 8 hours per day, where as 17.35 and 12.58 per cent workers work for 5
to 7 and 8 to 10 hours, respectively, in a day. Out of those who work both in
agricultural and non-agricultural activities, 56.31 per cent work for 7 to 8 hours a day,
32.88 pr cent for 5 to 7 hours and 10.81 per cent work for 8 to 10 hours a day. Thus,
the highest proportion of labourers who work for 7 to 8 hours a day is in non-
agricultural sectors. However, across the sectors, 62.27 per cent labourers work for 7
to 8 hours per day and 25.21 pr cent work for 5 to 7 hours per day. Only 12.12 per
cent workers work for more than 8 hours a day.
Out of all the 726 casual labourers about 31 per cent in agriculture, 42 per cent
in non-agriculture and 27 per cent in both the sectors, work for 8-10 hours a day. The
corresponding proportion of workers who work for 7 to 8 hours a day is 27.25, 45.27
and 27.47 per cent, respectively. As compared to it, 32.24, 27.87 and 39.90 per cent
workers, respectively, work for 5 to 7 hours in a day across the various sectors. Thus,
the proportion of labourers who work for more than 8 hours a day, within the same
sector is between 11 to 13 per cent.
Table 5.6: Percentage share of sampled local casual labourers in agricultural and non-agricultural activities, as per working hours, in sampled villages in Punjab
Note: 1. Figures in brackets indicate column-wise percentage share. 2. The absolute number is given in the appendix 5.3 A.
The working hours of casual labourers across the three regions and three levels
of development are given in table 5.7. Approximately 63 per cent labourers work for
7 to 8 hours per day whereas 25 per cent and 12 per cent labourers work for 5 to 7 per
Sector Working Hours(per day) Total 5-7 7-8 8-10
Agricultural 100.00 (28.93)
28.10 (32.24)
59.05 (27.25)
12.85 (30.68)
Non-agricultural 100.00 (40.50)
17.35 (27.87)
70.07 (45.27)
12.58 (42.05)
Both Agri. & Non-Agri. 100.00 (30.57)
32.88 (39.90)
56.31 (27.47)
10.81 (27.27)
Total 100.00 (100.00)
25.21 (100.00)
62.27 (100.00)
12.12 (100.00)
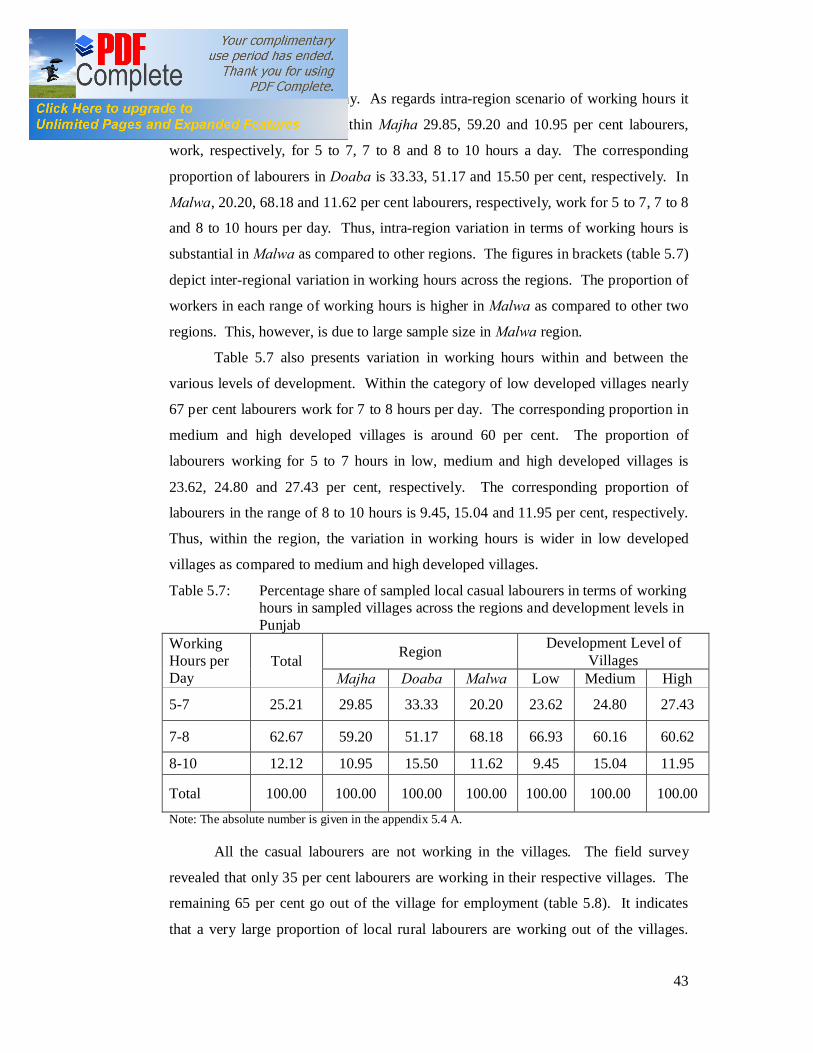
43
cent and 8 to 10 hours per day. As regards intra-region scenario of working hours it
has very wide variation. Within Majha 29.85, 59.20 and 10.95 per cent labourers,
work, respectively, for 5 to 7, 7 to 8 and 8 to 10 hours a day. The corresponding
proportion of labourers in Doaba is 33.33, 51.17 and 15.50 per cent, respectively. In
Malwa, 20.20, 68.18 and 11.62 per cent labourers, respectively, work for 5 to 7, 7 to 8
and 8 to 10 hours per day. Thus, intra-region variation in terms of working hours is
substantial in Malwa as compared to other regions. The figures in brackets (table 5.7)
depict inter-regional variation in working hours across the regions. The proportion of
workers in each range of working hours is higher in Malwa as compared to other two
regions. This, however, is due to large sample size in Malwa region.
Table 5.7 also presents variation in working hours within and between the
various levels of development. Within the category of low developed villages nearly
67 per cent labourers work for 7 to 8 hours per day. The corresponding proportion in
medium and high developed villages is around 60 per cent. The proportion of
labourers working for 5 to 7 hours in low, medium and high developed villages is
23.62, 24.80 and 27.43 per cent, respectively. The corresponding proportion of
labourers in the range of 8 to 10 hours is 9.45, 15.04 and 11.95 per cent, respectively.
Thus, within the region, the variation in working hours is wider in low developed
villages as compared to medium and high developed villages.
Table 5.7: Percentage share of sampled local casual labourers in terms of working hours in sampled villages across the regions and development levels in Punjab
Working Hours per Day
Total Region Development Level of Villages
Majha Doaba Malwa Low Medium High
5-7 25.21 29.85 33.33 20.20 23.62 24.80 27.43
7-8 62.67 59.20 51.17 68.18 66.93 60.16 60.62
8-10 12.12 10.95 15.50 11.62 9.45 15.04 11.95
Total 100.00 100.00 100.00 100.00 100.00 100.00 100.00
Note: The absolute number is given in the appendix 5.4 A.
All the casual labourers are not working in the villages. The field survey
revealed that only 35 per cent labourers are working in their respective villages. The
remaining 65 per cent go out of the village for employment (table 5.8). It indicates
that a very large proportion of local rural labourers are working out of the villages.

44
Amongst the three regions, Majha has the highest proportion (73.63 per cent) of
labourers working out of the villages. The respective share in the case of Doaba and
Malwa is 63.57 and 61.11 per cent, respectively. Clearly, the labourers in Majha are
more mobile; whatever may be the reasons, than their counterparts in Doaba and
Malwa.
Amongst low, medium and high developed villages, the proportion of
labourers, working out of the village, is highest (68.50 per cent) in low developed
villages. It is followed by high developed villages (65.49 per cent) and medium
developed villages (60.98 per cent). One may like to conclude that low level of
development pushes the labourers for working out of the village. However, inter-
development level, variation does not seem to be very significant.
Table 5.8: Percentage share of sampled local casual labourers working out of the village in sampled villages across the regions and development levels in Punjab
Work Out Total Region Development Level of Village
Majha Doaba Malwa Low Medium High
No 34.99 26.37 36.43 38.89 34.50 39.02 34.51
Yes 65.01 73.63 63.57 61.11 68.50 60.98 65.49
Total 100.00 100.00 100.00 100.00 100.00 100.00 100.00 Note: The absolute number is given in the appendix 5.5 A.
The reasons for working out of the village, as given by the labourers, are
presented in table 5.9. Out of all the 472 labourers 63.78 per cent labourers go out for
work because of higher wage rate. Nearly 23 per cent stated that they go out due to
non-availability of work in the village. “Better working conditions” is the reason
stated by the remaining 13.39 per cent labourers. Thus, the most important reason for
working out of the village is the higher wage rate.
“The higher wage rate” to be the reason for working outside the village, is
more prominent in Majha followed by Doaba and Malwa as is evident from table 5.9.
A little more than 77 per cent labourers in Majha go out of the village mainly because
of higher wage rate. The corresponding proportion in Doaba and Malwa is 63.83 and
59.09 per cent, respectively. With regard to non-availability of work Malwa is at the
top with 29.22 per cent labourers stating this as the reason for going out of the village.
The proportion of such labourers in Doaba and Majha is, respectively, 10.64 and
15.09 per cent. The labourers in Doaba region are more responsive to the better

45
working conditions. The proportion of labourers in this respect in Majha, Doaba and
Malwa regions is 7.55, 25.53 and 11.69 per cent, respectively.
Table 5.9: Percentage share of sampled local casual labourers in terms of causes for working out of the village, in sampled villages across the regions and development levels in Punjab
Cause Total Region Development Level of Village Majha Doaba Malwa Low Medium High
Higher wage rate 63.78 77.36 63.83 59.09 58.75 61.46 71.79
Non-availability of work 22.83 15.09 10.64 29.22 27.50 23.96 16.67
Better working conditions 13.39 7.55 25.53 11.69 13.75 14.58 11.54
Total 100.00 100.00 100.00 100.00 100.00 100.00 100.00
Note: The absolute number is given in the appendix 5.6 A. It is astonishing to note that the proportion of labourers, going out of the
village for high wage rate is highest (71.79 per cent) in high developed villages. It is
followed by medium and low developed villages with 61.46 and 58.75 per cent,
respectively.
It is, thus, clear that level of development in the rural area has a high positive
correlation with wage-differential in and outside the village. As regards non-
availability of work, the proportion is highest (27.50 per cent) in low developed
villages followed by medium developed villages (23.96 per cent) and high developed
villages (16.67 per cent). Clearly, level of development has a positive bearing on the
availability of work in the rural area. As regards better working conditions, this
reason does not weigh very high across the low, medium and high developed villages.
In other words, there is no clear cut indication with regard to correlation between the
level of development and the better working conditions as a reason for going out for
work.
The labourers use various modes of travelling to reach their work place, as is
displayed in table 5.10. The labourers going out for working in agriculture use only
bus as the mode of travelling. However, the labourers in the non-agricultural
activities use cycle, bus and rickshaw for travelling. Those who partly work in
agriculture as well as in non-agricultural activities travel by cycle and bus.
Out of the 224 labourers, travelling by cycle, nearly 88 per cent go in for non-
agricultural activities. The remaining 12 per cent work in agriculture as well as non-
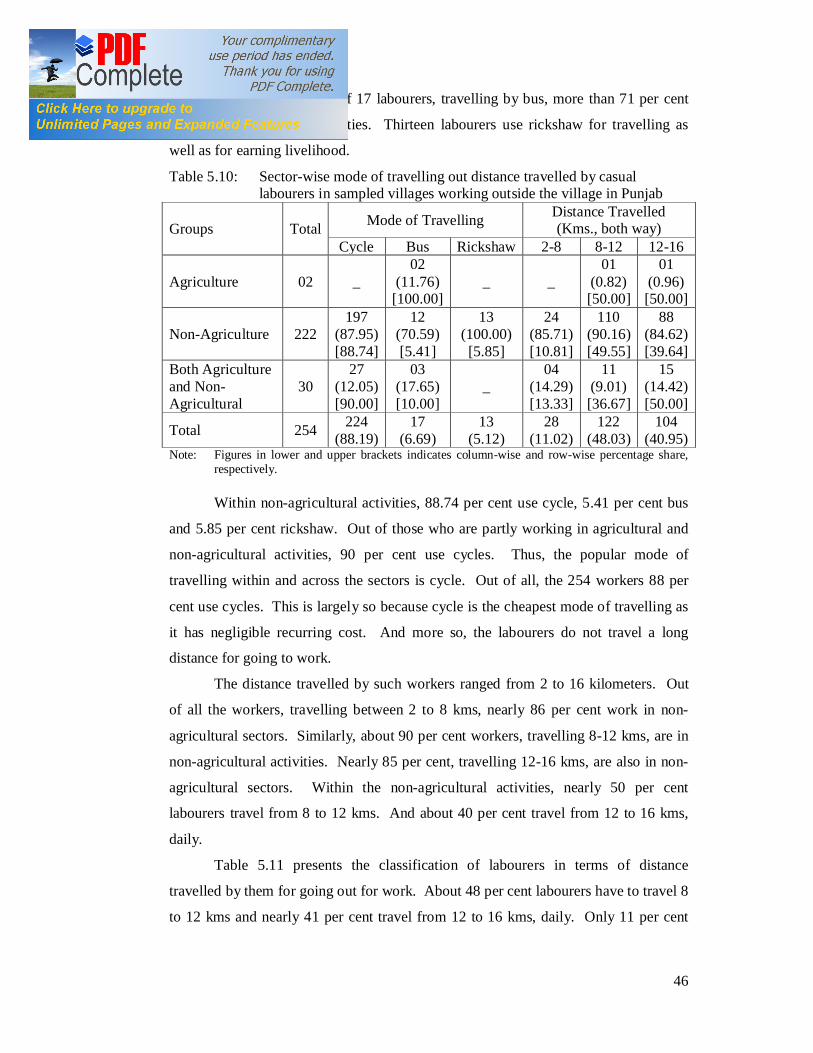
46
agricultural activities. Out of 17 labourers, travelling by bus, more than 71 per cent
are in non-agricultural activities. Thirteen labourers use rickshaw for travelling as
well as for earning livelihood.
Table 5.10: Sector-wise mode of travelling out distance travelled by casual labourers in sampled villages working outside the village in Punjab
Groups Total Mode of Travelling Distance Travelled (Kms., both way)
Cycle Bus Rickshaw 2-8 8-12 12-16
Agriculture 02 _ 02
(11.76) [100.00]
_ _ 01
(0.82) [50.00]
01 (0.96) [50.00]
Non-Agriculture 222 197
(87.95) [88.74]
12 (70.59) [5.41]
13 (100.00) [5.85]
24 (85.71) [10.81]
110 (90.16) [49.55]
88 (84.62) [39.64]
Both Agriculture and Non-Agricultural
30 27
(12.05) [90.00]
03 (17.65) [10.00]
_ 04
(14.29) [13.33]
11 (9.01) [36.67]
15 (14.42) [50.00]
Total 254 224 (88.19)
17 (6.69)
13 (5.12)
28 (11.02)
122 (48.03)
104 (40.95)
Note: Figures in lower and upper brackets indicates column-wise and row-wise percentage share, respectively.
Within non-agricultural activities, 88.74 per cent use cycle, 5.41 per cent bus
and 5.85 per cent rickshaw. Out of those who are partly working in agricultural and
non-agricultural activities, 90 per cent use cycles. Thus, the popular mode of
travelling within and across the sectors is cycle. Out of all, the 254 workers 88 per
cent use cycles. This is largely so because cycle is the cheapest mode of travelling as
it has negligible recurring cost. And more so, the labourers do not travel a long
distance for going to work.
The distance travelled by such workers ranged from 2 to 16 kilometers. Out
of all the workers, travelling between 2 to 8 kms, nearly 86 per cent work in non-
agricultural sectors. Similarly, about 90 per cent workers, travelling 8-12 kms, are in
non-agricultural activities. Nearly 85 per cent, travelling 12-16 kms, are also in non-
agricultural sectors. Within the non-agricultural activities, nearly 50 per cent
labourers travel from 8 to 12 kms. And about 40 per cent travel from 12 to 16 kms,
daily.
Table 5.11 presents the classification of labourers in terms of distance
travelled by them for going out for work. About 48 per cent labourers have to travel 8
to 12 kms and nearly 41 per cent travel from 12 to 16 kms, daily. Only 11 per cent
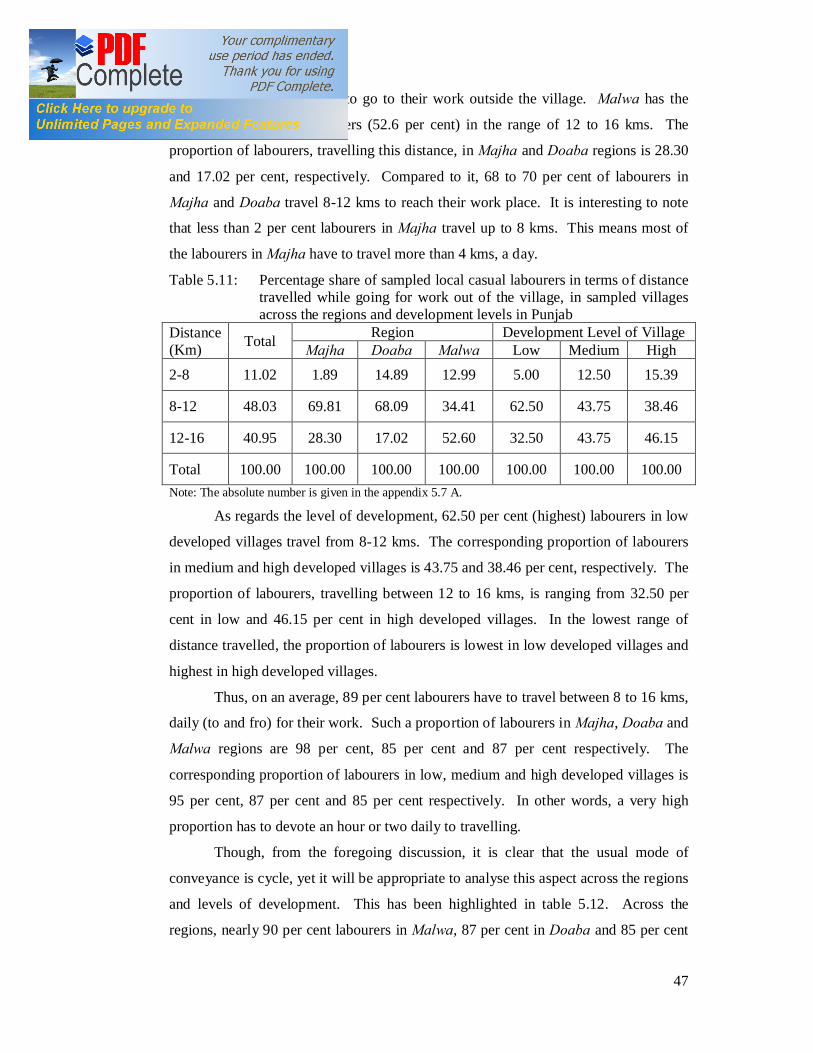
47
labourers travel upto 4 kms to go to their work outside the village. Malwa has the
highest proportion of labourers (52.6 per cent) in the range of 12 to 16 kms. The
proportion of labourers, travelling this distance, in Majha and Doaba regions is 28.30
and 17.02 per cent, respectively. Compared to it, 68 to 70 per cent of labourers in
Majha and Doaba travel 8-12 kms to reach their work place. It is interesting to note
that less than 2 per cent labourers in Majha travel up to 8 kms. This means most of
the labourers in Majha have to travel more than 4 kms, a day.
Table 5.11: Percentage share of sampled local casual labourers in terms of distance travelled while going for work out of the village, in sampled villages across the regions and development levels in Punjab
Distance (Km) Total Region Development Level of Village
Majha Doaba Malwa Low Medium High 2-8 11.02 1.89 14.89 12.99 5.00 12.50 15.39
8-12 48.03 69.81 68.09 34.41 62.50 43.75 38.46
12-16 40.95 28.30 17.02 52.60 32.50 43.75 46.15
Total 100.00 100.00 100.00 100.00 100.00 100.00 100.00 Note: The absolute number is given in the appendix 5.7 A.
As regards the level of development, 62.50 per cent (highest) labourers in low
developed villages travel from 8-12 kms. The corresponding proportion of labourers
in medium and high developed villages is 43.75 and 38.46 per cent, respectively. The
proportion of labourers, travelling between 12 to 16 kms, is ranging from 32.50 per
cent in low and 46.15 per cent in high developed villages. In the lowest range of
distance travelled, the proportion of labourers is lowest in low developed villages and
highest in high developed villages.
Thus, on an average, 89 per cent labourers have to travel between 8 to 16 kms,
daily (to and fro) for their work. Such a proportion of labourers in Majha, Doaba and
Malwa regions are 98 per cent, 85 per cent and 87 per cent respectively. The
corresponding proportion of labourers in low, medium and high developed villages is
95 per cent, 87 per cent and 85 per cent respectively. In other words, a very high
proportion has to devote an hour or two daily to travelling.
Though, from the foregoing discussion, it is clear that the usual mode of
conveyance is cycle, yet it will be appropriate to analyse this aspect across the regions
and levels of development. This has been highlighted in table 5.12. Across the
regions, nearly 90 per cent labourers in Malwa, 87 per cent in Doaba and 85 per cent
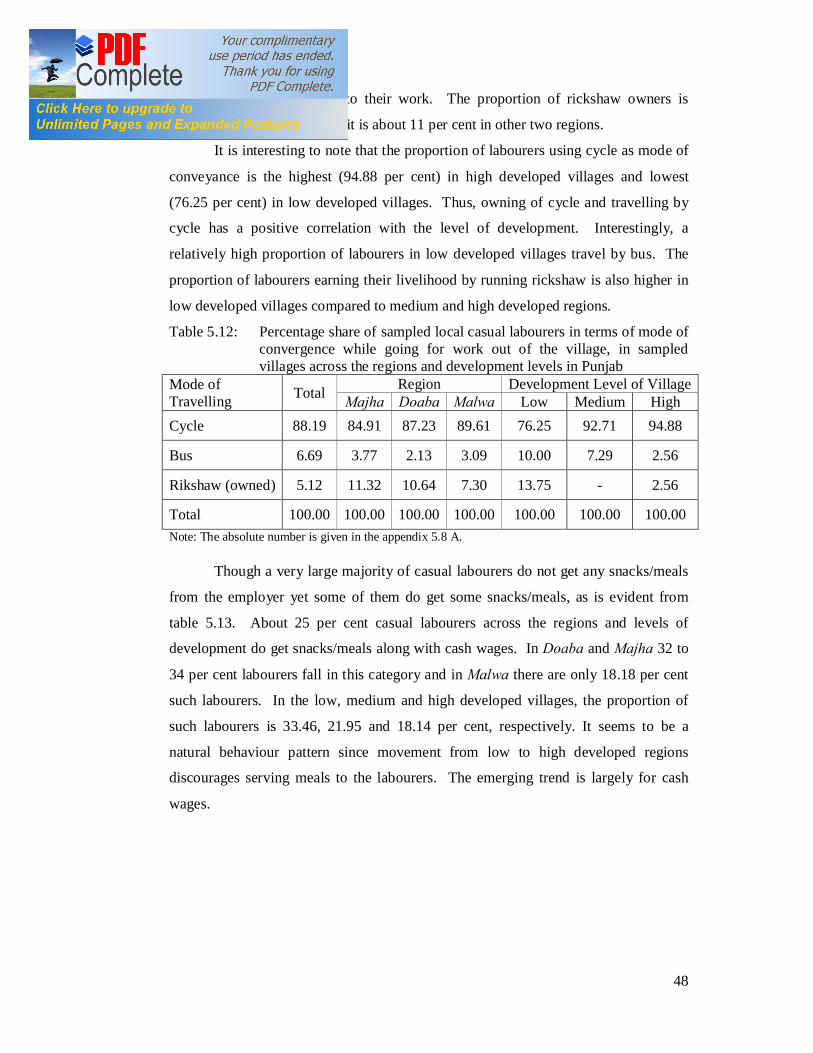
48
in Majha use cycles to go to their work. The proportion of rickshaw owners is
negligible in Malwa whereas it is about 11 per cent in other two regions.
It is interesting to note that the proportion of labourers using cycle as mode of
conveyance is the highest (94.88 per cent) in high developed villages and lowest
(76.25 per cent) in low developed villages. Thus, owning of cycle and travelling by
cycle has a positive correlation with the level of development. Interestingly, a
relatively high proportion of labourers in low developed villages travel by bus. The
proportion of labourers earning their livelihood by running rickshaw is also higher in
low developed villages compared to medium and high developed regions.
Table 5.12: Percentage share of sampled local casual labourers in terms of mode of convergence while going for work out of the village, in sampled villages across the regions and development levels in Punjab
Mode of Travelling Total Region Development Level of Village
Majha Doaba Malwa Low Medium High Cycle 88.19 84.91 87.23 89.61 76.25 92.71 94.88
Bus 6.69 3.77 2.13 3.09 10.00 7.29 2.56
Rikshaw (owned) 5.12 11.32 10.64 7.30 13.75 - 2.56
Total 100.00 100.00 100.00 100.00 100.00 100.00 100.00 Note: The absolute number is given in the appendix 5.8 A.
Though a very large majority of casual labourers do not get any snacks/meals
from the employer yet some of them do get some snacks/meals, as is evident from
table 5.13. About 25 per cent casual labourers across the regions and levels of
development do get snacks/meals along with cash wages. In Doaba and Majha 32 to
34 per cent labourers fall in this category and in Malwa there are only 18.18 per cent
such labourers. In the low, medium and high developed villages, the proportion of
such labourers is 33.46, 21.95 and 18.14 per cent, respectively. It seems to be a
natural behaviour pattern since movement from low to high developed regions
discourages serving meals to the labourers. The emerging trend is largely for cash
wages.
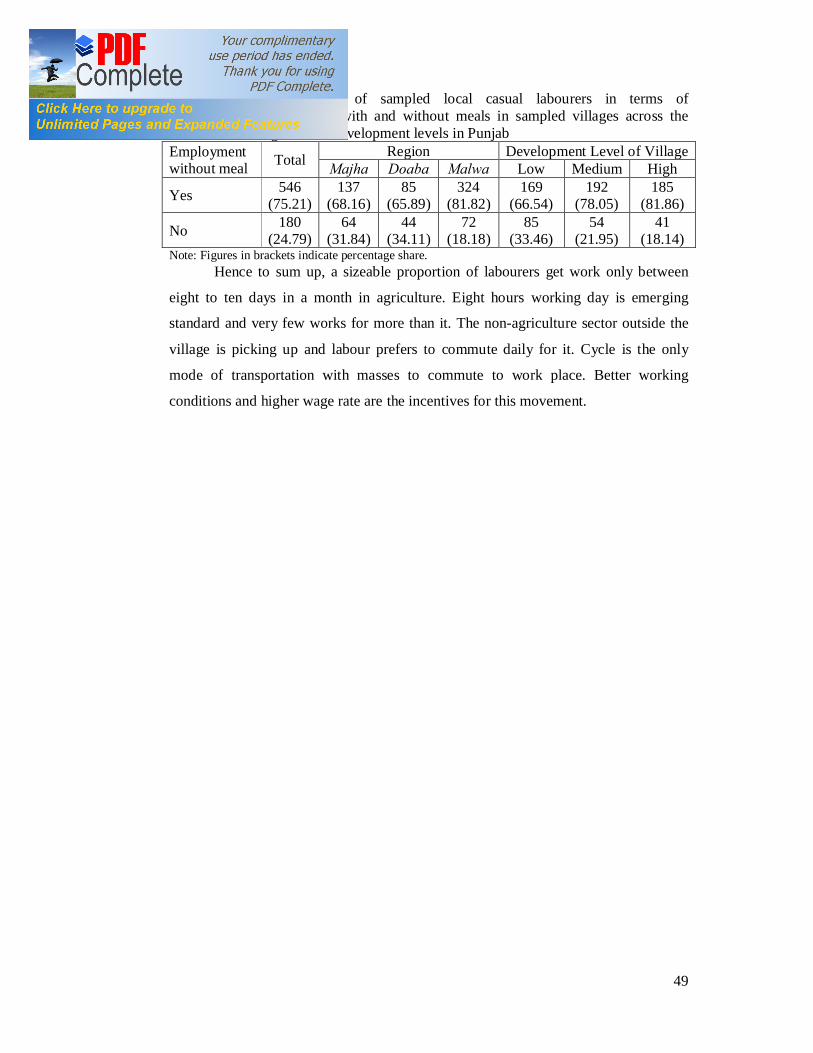
49
Table 5.13 Classification of sampled local casual labourers in terms of employment with and without meals in sampled villages across the regions and development levels in Punjab
Employment without meal Total Region Development Level of Village
Majha Doaba Malwa Low Medium High
Yes 546 (75.21)
137 (68.16)
85 (65.89)
324 (81.82)
169 (66.54)
192 (78.05)
185 (81.86)
No 180 (24.79)
64 (31.84)
44 (34.11)
72 (18.18)
85 (33.46)
54 (21.95)
41 (18.14)
Note: Figures in brackets indicate percentage share. Hence to sum up, a sizeable proportion of labourers get work only between
eight to ten days in a month in agriculture. Eight hours working day is emerging
standard and very few works for more than it. The non-agriculture sector outside the
village is picking up and labour prefers to commute daily for it. Cycle is the only
mode of transportation with masses to commute to work place. Better working
conditions and higher wage rate are the incentives for this movement.
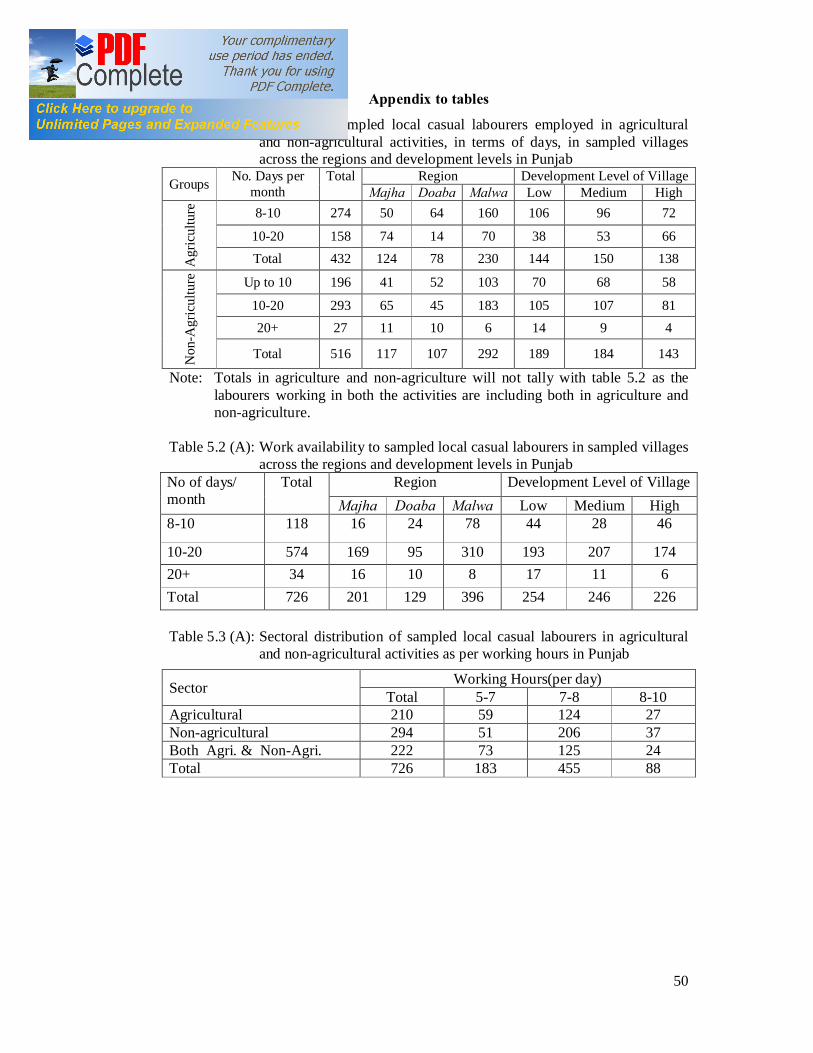
50
Appendix to tables
Table 5.1(A): Number of sampled local casual labourers employed in agricultural and non-agricultural activities, in terms of days, in sampled villages across the regions and development levels in Punjab
Groups No. Days per month
Total Region Development Level of Village Majha Doaba Malwa Low Medium High
Agr
icul
ture
8-10 274 50 64 160 106 96 72
10-20 158 74 14 70 38 53 66 Total 432 124 78 230 144 150 138
Non
-Agr
icul
ture
Up to 10 196 41 52 103 70 68 58
10-20 293 65 45 183 105 107 81 20+ 27 11 10 6 14 9 4
Total 516 117 107 292 189 184 143
Note: Totals in agriculture and non-agriculture will not tally with table 5.2 as the labourers working in both the activities are including both in agriculture and non-agriculture.
Table 5.2 (A): Work availability to sampled local casual labourers in sampled villages
across the regions and development levels in Punjab No of days/ month
Total Region Development Level of Village Majha Doaba Malwa Low Medium High
8-10 118 16 24 78 44 28 46
10-20 574 169 95 310 193 207 174 20+ 34 16 10 8 17 11 6 Total 726 201 129 396 254 246 226 Table 5.3 (A): Sectoral distribution of sampled local casual labourers in agricultural
and non-agricultural activities as per working hours in Punjab
Sector Working Hours(per day) Total 5-7 7-8 8-10
Agricultural 210 59 124 27 Non-agricultural 294 51 206 37 Both Agri. & Non-Agri. 222 73 125 24 Total 726 183 455 88
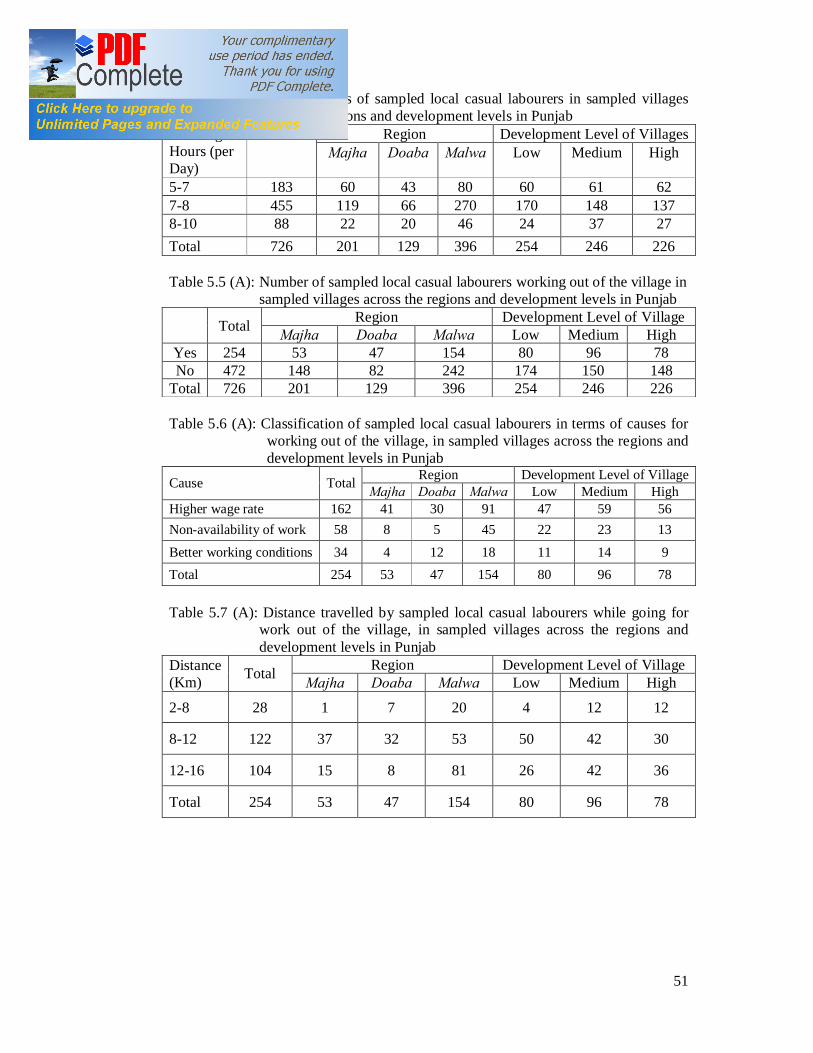
51
Table 5.4 (A): Working hours of sampled local casual labourers in sampled villages across the regions and development levels in Punjab
Working Hours (per Day)
Total Region Development Level of Villages Majha Doaba Malwa Low Medium High
5-7 183 60 43 80 60 61 62 7-8 455 119 66 270 170 148 137 8-10 88 22 20 46 24 37 27 Total 726 201 129 396 254 246 226 Table 5.5 (A): Number of sampled local casual labourers working out of the village in
sampled villages across the regions and development levels in Punjab
Total Region Development Level of Village Majha Doaba Malwa Low Medium High
Yes 254 53 47 154 80 96 78 No 472 148 82 242 174 150 148
Total 726 201 129 396 254 246 226 Table 5.6 (A): Classification of sampled local casual labourers in terms of causes for
working out of the village, in sampled villages across the regions and development levels in Punjab
Cause Total Region Development Level of Village Majha Doaba Malwa Low Medium High
Higher wage rate 162 41 30 91 47 59 56 Non-availability of work 58 8 5 45 22 23 13
Better working conditions 34 4 12 18 11 14 9 Total 254 53 47 154 80 96 78 Table 5.7 (A): Distance travelled by sampled local casual labourers while going for
work out of the village, in sampled villages across the regions and development levels in Punjab
Distance (Km) Total Region Development Level of Village
Majha Doaba Malwa Low Medium High
2-8 28 1 7 20 4 12 12
8-12 122 37 32 53 50 42 30
12-16 104 15 8 81 26 42 36
Total 254 53 47 154 80 96 78
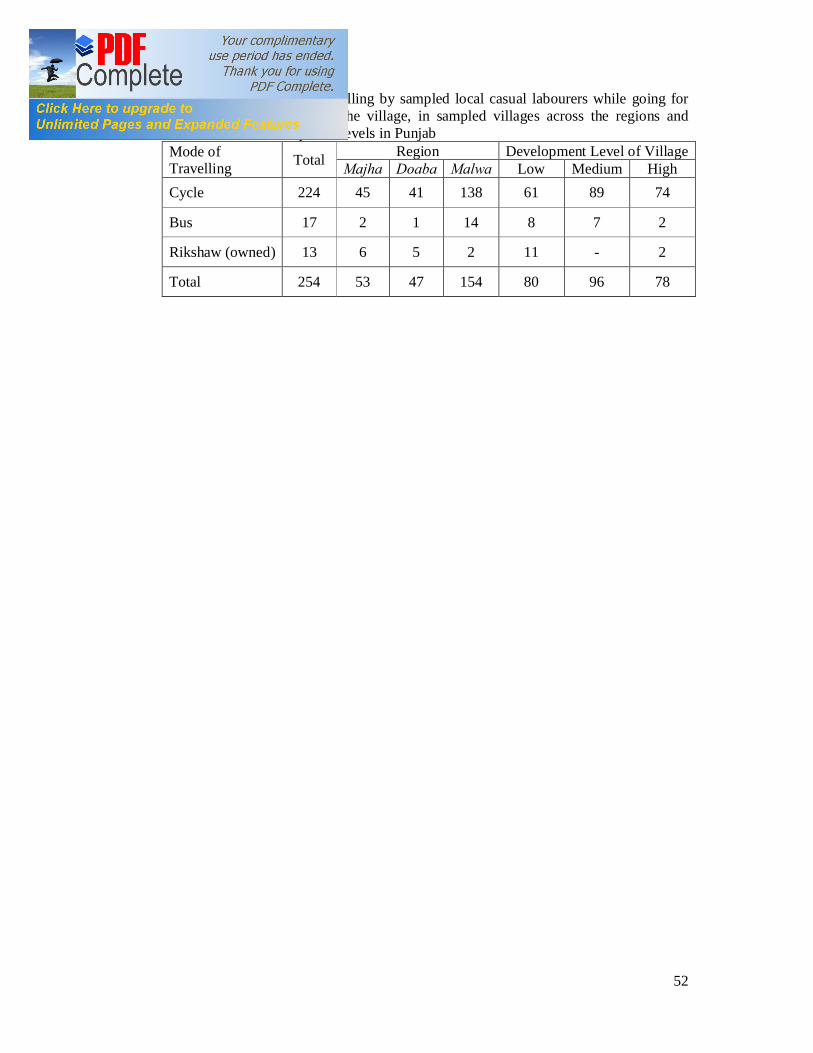
52
Table 5.8 (A: Mode of travelling by sampled local casual labourers while going for work out of the village, in sampled villages across the regions and development levels in Punjab
Mode of Travelling Total Region Development Level of Village
Majha Doaba Malwa Low Medium High Cycle 224 45 41 138 61 89 74
Bus 17 2 1 14 8 7 2
Rikshaw (owned) 13 6 5 2 11 - 2
Total 254 53 47 154 80 96 78
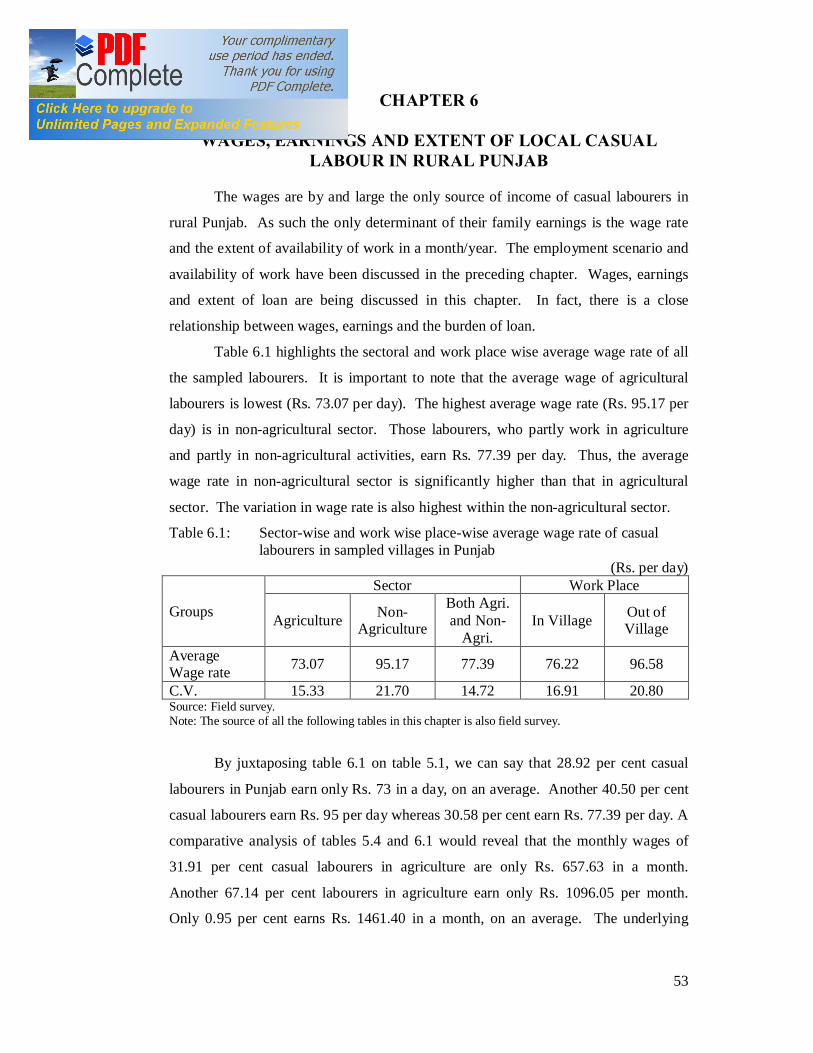
53
CHAPTER 6
WAGES, EARNINGS AND EXTENT OF LOCAL CASUAL LABOUR IN RURAL PUNJAB
The wages are by and large the only source of income of casual labourers in
rural Punjab. As such the only determinant of their family earnings is the wage rate
and the extent of availability of work in a month/year. The employment scenario and
availability of work have been discussed in the preceding chapter. Wages, earnings
and extent of loan are being discussed in this chapter. In fact, there is a close
relationship between wages, earnings and the burden of loan.
Table 6.1 highlights the sectoral and work place wise average wage rate of all
the sampled labourers. It is important to note that the average wage of agricultural
labourers is lowest (Rs. 73.07 per day). The highest average wage rate (Rs. 95.17 per
day) is in non-agricultural sector. Those labourers, who partly work in agriculture
and partly in non-agricultural activities, earn Rs. 77.39 per day. Thus, the average
wage rate in non-agricultural sector is significantly higher than that in agricultural
sector. The variation in wage rate is also highest within the non-agricultural sector.
Table 6.1: Sector-wise and work wise place-wise average wage rate of casual labourers in sampled villages in Punjab
(Rs. per day)
Groups
Sector Work Place
Agriculture Non-Agriculture
Both Agri. and Non-
Agri. In Village Out of
Village
Average Wage rate 73.07 95.17 77.39 76.22 96.58
C.V. 15.33 21.70 14.72 16.91 20.80 Source: Field survey. Note: The source of all the following tables in this chapter is also field survey.
By juxtaposing table 6.1 on table 5.1, we can say that 28.92 per cent casual
labourers in Punjab earn only Rs. 73 in a day, on an average. Another 40.50 per cent
casual labourers earn Rs. 95 per day whereas 30.58 per cent earn Rs. 77.39 per day. A
comparative analysis of tables 5.4 and 6.1 would reveal that the monthly wages of
31.91 per cent casual labourers in agriculture are only Rs. 657.63 in a month.
Another 67.14 per cent labourers in agriculture earn only Rs. 1096.05 per month.
Only 0.95 per cent earns Rs. 1461.40 in a month, on an average. The underlying
54
assumption in all these calculations is that the labourers in each range of working days
get work at the mid-value of the class interval.
Analogously, the monthly wages of 7.48, 83.33 and 9.19 per cent labourers in
the non-agricultural sector came out to be Rs. 856.53, Rs. 1427.55 and Rs. 1903.40
respectively. Compared to it, the monthly wages of 13.06, 84.69 and 2.25 per cent
labourers (working partly in agriculture and partly in non-agricultural sectors) were
Rs. 696.51, Rs. 1160.85 and Rs. 1547.80, respectively. It is clear from the foregoing
discussion that the monthly wages of agricultural labourers are far less than their
counterparts in non-agricultural sectors. As such the majority of local casual labourers
prefer to work in non-agricultural activities.
Table 6.1 also highlights the average daily wage rate for labourers working in
and outside the village. It is rather revealing that the average wage rate (Rs. 76.22 per
day) within the village is significantly less than the average wage rate of Rs. 96.58
outside the village. Clearly, all those workers who are going in for work out of the
village are earning much higher monthly wages than those left behind in the village.
The variation of wage rate among the workers is, however, much higher outside the
village as compared to within the village. In fact, differential wage rate is the single
most important reason for in-migration of labour in Punjab.
Table 6.2 presents the range of wage rate in agricultural and non-agricultural
sectors. The wage rate varies from as low of Rs. 40 to as high as Rs. 100 across the
sectors. Within agriculture, a little more than two-third of labourers are getting a
wage rate between Rs. 60 and Rs. 80 per day. It is really very revealing that in a
developed state like Punjab about 27 per cent casual labourers are getting wages
between Rs. 40 and Rs. 60 per day. Perhaps these labourers are working for lesser
number of hours and also getting meals etc. It is clear from table 5.6 and 5.13, in the
previous chapter. The proportion of labourers getting wage between Rs. 80 to Rs. 100
is just 4.76 per cent. Only 0.48 per cent labourers in agriculture earn more than Rs.
100 a day.
As compared to agriculture, a high proportion of labourers is getting
higher wage rate in non-agricultural sector, as is clear from table 6.2. Approximately
two-third labourers in non-agricultural sectors are getting wages between Rs. 80 to
Rs. 100 per day. Another 24.15 per cent labourers are getting wages between Rs. 60
to 80 per day. Another 4.76 per cent labourers are getting a wage rate above Rs. 100
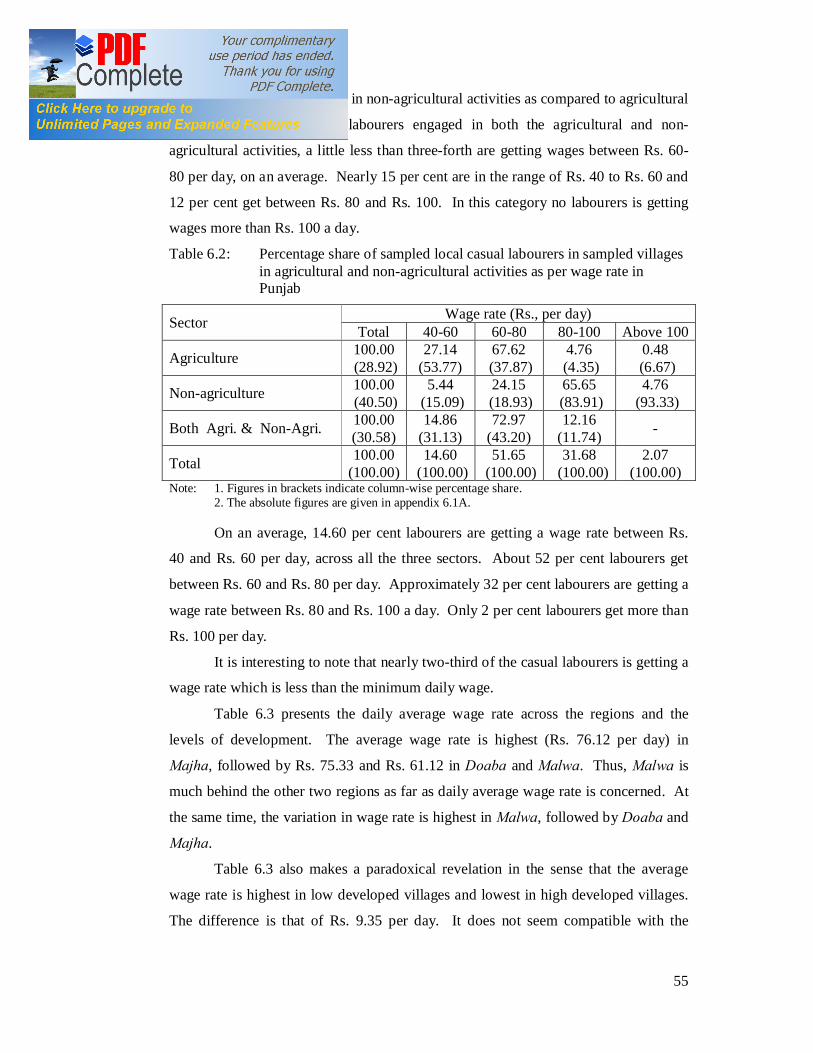
55
and below Rs. 60 is quite low in non-agricultural activities as compared to agricultural
activities. As regards the labourers engaged in both the agricultural and non-
agricultural activities, a little less than three-forth are getting wages between Rs. 60-
80 per day, on an average. Nearly 15 per cent are in the range of Rs. 40 to Rs. 60 and
12 per cent get between Rs. 80 and Rs. 100. In this category no labourers is getting
wages more than Rs. 100 a day.
Table 6.2: Percentage share of sampled local casual labourers in sampled villages in agricultural and non-agricultural activities as per wage rate in Punjab
Note: 1. Figures in brackets indicate column-wise percentage share. 2. The absolute figures are given in appendix 6.1A.
On an average, 14.60 per cent labourers are getting a wage rate between Rs.
40 and Rs. 60 per day, across all the three sectors. About 52 per cent labourers get
between Rs. 60 and Rs. 80 per day. Approximately 32 per cent labourers are getting a
wage rate between Rs. 80 and Rs. 100 a day. Only 2 per cent labourers get more than
Rs. 100 per day.
It is interesting to note that nearly two-third of the casual labourers is getting a
wage rate which is less than the minimum daily wage.
Table 6.3 presents the daily average wage rate across the regions and the
levels of development. The average wage rate is highest (Rs. 76.12 per day) in
Majha, followed by Rs. 75.33 and Rs. 61.12 in Doaba and Malwa. Thus, Malwa is
much behind the other two regions as far as daily average wage rate is concerned. At
the same time, the variation in wage rate is highest in Malwa, followed by Doaba and
Majha.
Table 6.3 also makes a paradoxical revelation in the sense that the average
wage rate is highest in low developed villages and lowest in high developed villages.
The difference is that of Rs. 9.35 per day. It does not seem compatible with the
Sector Wage rate (Rs., per day) Total 40-60 60-80 80-100 Above 100
Agriculture 100.00 (28.92)
27.14 (53.77)
67.62 (37.87)
4.76 (4.35)
0.48 (6.67)
Non-agriculture 100.00 (40.50)
5.44 (15.09)
24.15 (18.93)
65.65 (83.91)
4.76 (93.33)
Both Agri. & Non-Agri. 100.00 (30.58)
14.86 (31.13)
72.97 (43.20)
12.16 (11.74) -
Total 100.00 (100.00)
14.60 (100.00)
51.65 (100.00)
31.68 (100.00)
2.07 (100.00)

56
theory of growth. The variation in wage rate is, however, highest in high developed
villages and lowest in low developed villages.
Table 6.3: Region-wise and Development level-wise average wage rate of casual labourers in sampled villages in Punjab
(Rs. per day)
Groups Region Development level Majha Doaba Malwa Low Medium High
Average Wage rate 76.12 75.33 61.12 70.77 69.50 61.42 C.V. 40.67 47.19 62.25 51.36 52.18 60.76
A comparative analysis of tables 6.3 and 5.5 may reveal the proportion of
labourers earning various levels of monthly wages among various regions and levels
of development. About 8 per cent labourers in Majha earn monthly wages of Rs.
685.08. Nearly 84 per cent and 8 per cent labourers, in this region earn monthly
wages of Rs. 1141.80 and Rs. 1522.40, respectively. The proportion of labourers, in
Doaba, having monthly wages of Rs. 677.97, Rs. 1129.96 and Rs. 1506.60 is 18.60,
73.64 and 7.76, respectively. Compared to it, 19.70, 78.28 and 2.02 per cent
labourers in Malwa have monthly wages of Rs. 550.08, Rs. 916.80 and Rs. 1222.40,
respectively.
The comparison of tables 6.3 and 5.5 also brings out that the average monthly
wages for labourers in the low, medium and high developed villages. The proportion
of labourers in low, medium and high developed regions, having monthly wage rate
of Rs. 1061.55, Rs. 1042.50 and Rs. 921.30 is 76, 84 and 77 per cent, respectively. It
implies that a significant majority of labourers in low developed villages are getting a
higher monthly wage rate compared to high developed villages.
The wage rate across the regions and levels of development has been
highlighted in table 6.4. In Majha region around 8 per cent labourers are receiving a
wage rate between Rs. 40 to 60. The proportion of labourers earning between Rs. 60-
80 and Rs. 80-100 is 55 per cent and 36 per cent, respectively. Only one per cent
labourers are getting a wage rate above Rs. 100.
Compared to it, nearly 10 per cent labourers are getting a wage rate between
Rs. 40-60 per day in Doaba. The proportion of labourers in the wage rate range of
Rs. 60-80 and Rs. 80-100 is 50.39 and 37.21 per cent, respectively. The proportion of
labourers receiving a wage rate above Rs. 100 is 2.33 per cent.
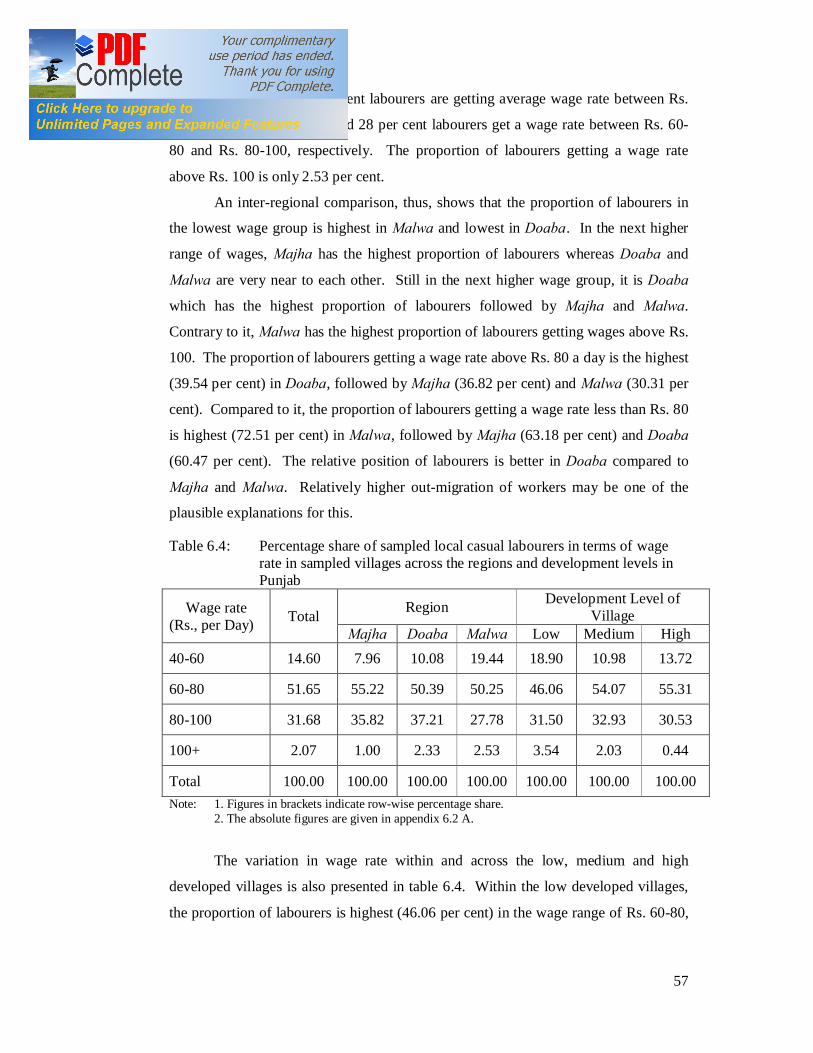
57
In Malwa 19.44 per cent labourers are getting average wage rate between Rs.
40-60. About 50 per cent and 28 per cent labourers get a wage rate between Rs. 60-
80 and Rs. 80-100, respectively. The proportion of labourers getting a wage rate
above Rs. 100 is only 2.53 per cent.
An inter-regional comparison, thus, shows that the proportion of labourers in
the lowest wage group is highest in Malwa and lowest in Doaba. In the next higher
range of wages, Majha has the highest proportion of labourers whereas Doaba and
Malwa are very near to each other. Still in the next higher wage group, it is Doaba
which has the highest proportion of labourers followed by Majha and Malwa.
Contrary to it, Malwa has the highest proportion of labourers getting wages above Rs.
100. The proportion of labourers getting a wage rate above Rs. 80 a day is the highest
(39.54 per cent) in Doaba, followed by Majha (36.82 per cent) and Malwa (30.31 per
cent). Compared to it, the proportion of labourers getting a wage rate less than Rs. 80
is highest (72.51 per cent) in Malwa, followed by Majha (63.18 per cent) and Doaba
(60.47 per cent). The relative position of labourers is better in Doaba compared to
Majha and Malwa. Relatively higher out-migration of workers may be one of the
plausible explanations for this.
Table 6.4: Percentage share of sampled local casual labourers in terms of wage rate in sampled villages across the regions and development levels in Punjab
Wage rate (Rs., per Day) Total Region Development Level of
Village Majha Doaba Malwa Low Medium High
40-60 14.60 7.96 10.08 19.44 18.90 10.98 13.72
60-80 51.65 55.22 50.39 50.25 46.06 54.07 55.31
80-100 31.68 35.82 37.21 27.78 31.50 32.93 30.53
100+ 2.07 1.00 2.33 2.53 3.54 2.03 0.44
Total 100.00 100.00 100.00 100.00 100.00 100.00 100.00 Note: 1. Figures in brackets indicate row-wise percentage share. 2. The absolute figures are given in appendix 6.2 A.
The variation in wage rate within and across the low, medium and high
developed villages is also presented in table 6.4. Within the low developed villages,
the proportion of labourers is highest (46.06 per cent) in the wage range of Rs. 60-80,

58
followed by 31.50 per cent labourers in the wage range of Rs. 80-100. The proportion
of labourers in the lowest and highest range of wages is 18.90 and 3.54 per cent,
respectively. Thus, in low developed villages 65.56 per cent labourers get less than
Rs. 80 per day.
The proportion of labourers getting wages between Rs. 60-80 in medium and
high developed villages is 54.07 and 55.31 per cent, respectively. The corresponding
proportion in the range of Rs. 80-100 is 32.93 and 30.53 per cent, respectively. Only
2.03 and 0.44 per cent labourers, respectively, are getting wages above Rs. 100 a day.
About 11 per cent labourers in medium and nearly 14 per cent labourers in high
developed villages get a wage rate between Rs. 40-60.
It is interesting to note that the proportion of labourers getting wage above Rs.
80 is equal (about 35 per cent) in low and medium developed villages. Compared to
it, this proportion is 31 per cent in high developed villages. It means in the range of
higher wages the variation rate in wage is neutral to level of development. Almost
similar are the results in the wages below Rs. 80. The proportion of labourers getting
wage below Rs. 80 are 64.96, 65.05 and 69.03 per cent, respectively, in low, medium
and high developed villages. It is astonishing to note that the proportion of labourers
getting wages below Rs. 80 is highest in the high developed villages. It does not go
well along the development theory. One of the plausible explanations for such a
scenario may be the lesser working hours and the participation of child labour.
It is clear from the foregoing analysis of intra- and inter-levels of development
that wages are not strictly determined by the development level of villages. The wage
rate may be lower in high developed villages and higher in low developed villages.
Table 6.5 presents sectoral distribution of labourers in terms of total family
earnings. The family earnings range from as low as Rs. 500 per month to Rs. 1500
per month. Amongst all the 726 casual labourers, 27.13 per cent labourers have
family income between Rs. 500 and Rs. 100 pr month. The proportion of labourers in
the range of Rs. 100 to 1500 is 40.50 per cent. Only 32.37 per cent labourers have
family income above Rs. 1500 per month.
The sectoral distribution of labourers, having family income between Rs. 500-
1000 is, respectively, 55.33 per cent in agriculture, 14.21 per cent in non-agricultural
sectors. Another 30.46 per cent labourers are earning their livelihood both from
agricultural and non-agricultural activities also fall in this range of family earnings.
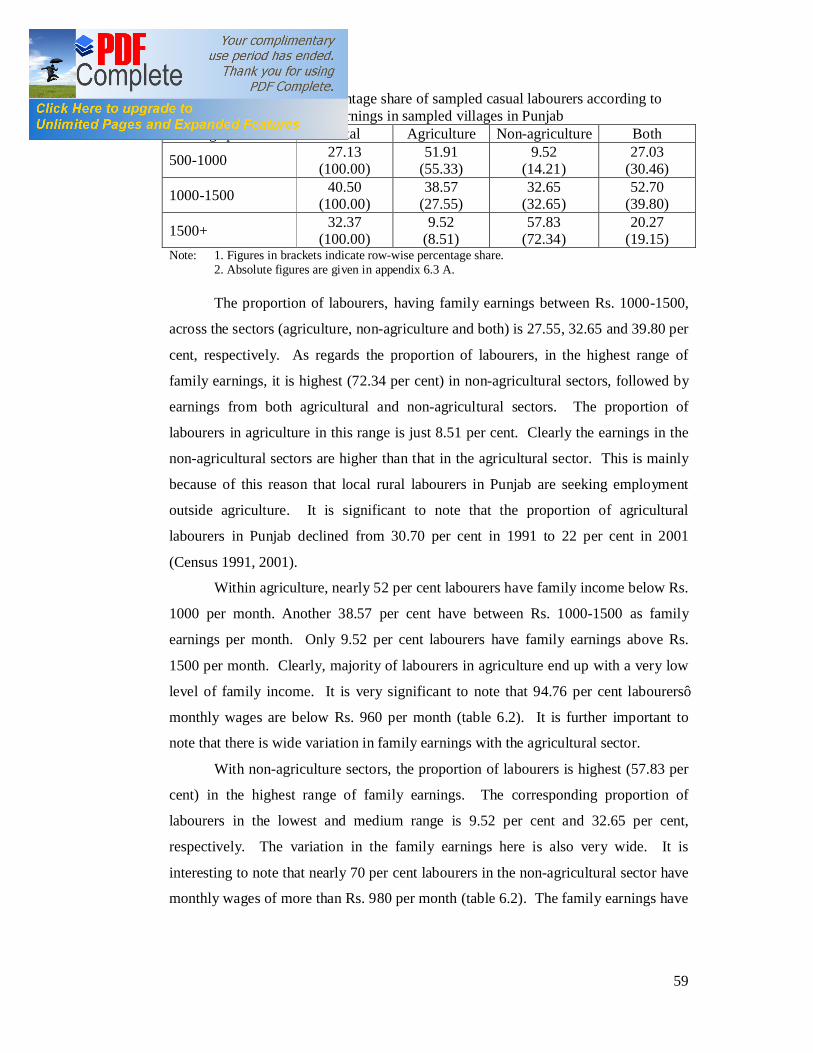
59
Table 6.5: Sectoral percentage share of sampled casual labourers according to total family earnings in sampled villages in Punjab
Earnings per month Total Agriculture Non-agriculture Both
500-1000 27.13 (100.00)
51.91 (55.33)
9.52 (14.21)
27.03 (30.46)
1000-1500 40.50 (100.00)
38.57 (27.55)
32.65 (32.65)
52.70 (39.80)
1500+ 32.37 (100.00)
9.52 (8.51)
57.83 (72.34)
20.27 (19.15)
Note: 1. Figures in brackets indicate row-wise percentage share. 2. Absolute figures are given in appendix 6.3 A.
The proportion of labourers, having family earnings between Rs. 1000-1500,
across the sectors (agriculture, non-agriculture and both) is 27.55, 32.65 and 39.80 per
cent, respectively. As regards the proportion of labourers, in the highest range of
family earnings, it is highest (72.34 per cent) in non-agricultural sectors, followed by
earnings from both agricultural and non-agricultural sectors. The proportion of
labourers in agriculture in this range is just 8.51 per cent. Clearly the earnings in the
non-agricultural sectors are higher than that in the agricultural sector. This is mainly
because of this reason that local rural labourers in Punjab are seeking employment
outside agriculture. It is significant to note that the proportion of agricultural
labourers in Punjab declined from 30.70 per cent in 1991 to 22 per cent in 2001
(Census 1991, 2001).
Within agriculture, nearly 52 per cent labourers have family income below Rs.
1000 per month. Another 38.57 per cent have between Rs. 1000-1500 as family
earnings per month. Only 9.52 per cent labourers have family earnings above Rs.
1500 per month. Clearly, majority of labourers in agriculture end up with a very low
level of family income. It is very significant to note that 94.76 per cent labourers’
monthly wages are below Rs. 960 per month (table 6.2). It is further important to
note that there is wide variation in family earnings with the agricultural sector.
With non-agriculture sectors, the proportion of labourers is highest (57.83 per
cent) in the highest range of family earnings. The corresponding proportion of
labourers in the lowest and medium range is 9.52 per cent and 32.65 per cent,
respectively. The variation in the family earnings here is also very wide. It is
interesting to note that nearly 70 per cent labourers in the non-agricultural sector have
monthly wages of more than Rs. 980 per month (table 6.2). The family earnings have
60
a close relationship with the wage rate and availability of employment since the
family earnings of landless agricultural labourers largely consist of wage-income.
As regards, labourers engaged both in agriculture and non-agricultural
activities, nearly 53 per cent labourers have family earnings in the range of Rs. 1000-
1500 per month. The variation in wages in these activities is also significantly visible.
It is interesting to note (table 6.2) that the monthly wages of nearly 88 per cent
labourers, working both in agriculture and non-agriculture, are less than Rs. 980 per
month. In other words, only 12 per cent labourers’ monthly wages are above Rs. 980
per month. Compared to it, the proportion of labourers having family earnings more
than Rs. 1000 is 72.97 per cent. This means the other family members of such
labourers do supplement the family income in significant manner.
Table 6.5 also makes another significant revelation that 27.13 per cent
labourers’ families have an annual income below Rs. 12000, which is very low by any
standards. Per day family income of such labourers comes out to be Rs. 32.88. For a
family of five persons it comes out to be Rs. 6.59 per day. This is far below Rs. 12 a
day. As per a recent National Report (Govt. of India, 2007), 77 per cent of Indian
population is below Rs. 12 a day. This proportion becomes all the more significant if
we add labourers’ families whose annual earnings range between Rs. 12000 to Rs.
18000. Together, nearly 68 per cent labourer families end up with family earnings up
to Rs. 18000 per annum. This means 68 per cent labourer families have less than Rs.
10 per capita per day. This is very disappointing situation in a prosperous state like
Punjab.
After discussing the sectoral shares in family income, it would be appropriate
to analyse the size of family income across the regions and levels of development.
Table 6.6 presents this scenario. The inter-regional analysis shows that about 17 per
cent families in Majha have monthly earnings below Rs. 1000. The corresponding
proportions in Doaba and Malwa are 27.13 and 32.32 per cent, respectively. This
means the labourer families in Majha are relatively better-off than the other two
regions. As regards the monthly income between Rs. 1000-1500, the proportion of
families is almost the same, as is evident from table 6.6. However, Majha is better
placed than the other two regions as far as the highest income bracket is concerned.
Approximately 42 per cent families in Majha have monthly income above Rs. 1500
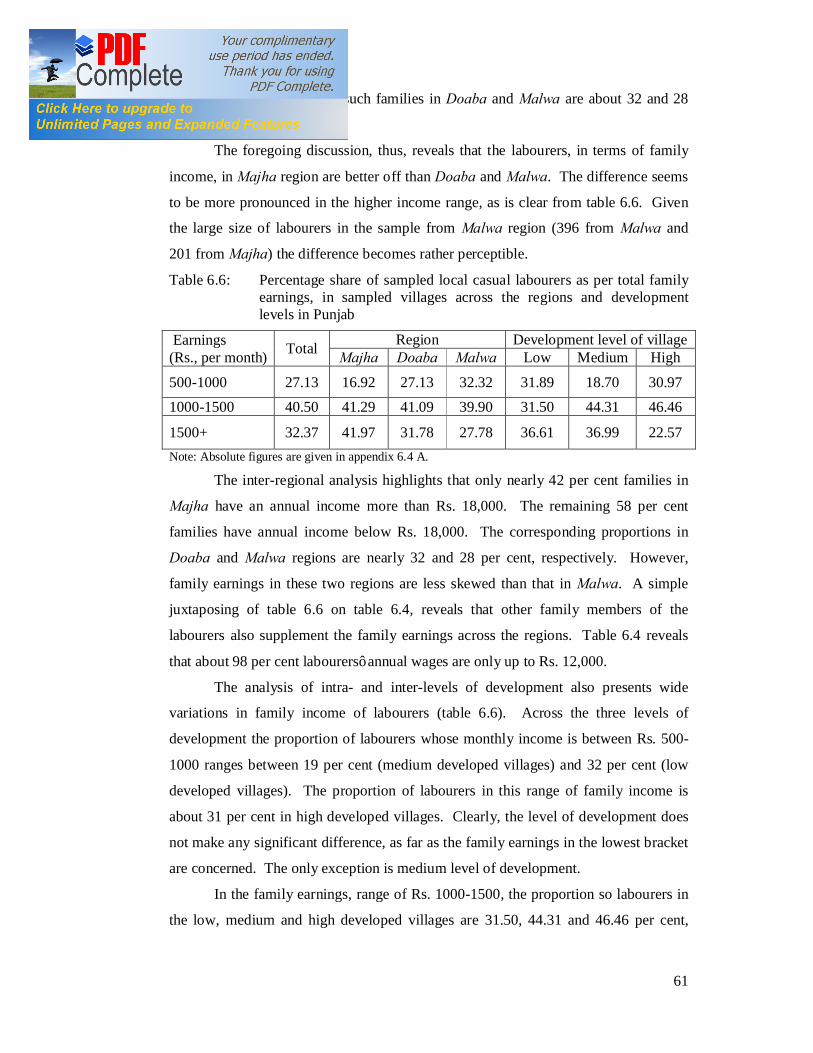
61
where as the proportions of such families in Doaba and Malwa are about 32 and 28
per cent, respectively
The foregoing discussion, thus, reveals that the labourers, in terms of family
income, in Majha region are better off than Doaba and Malwa. The difference seems
to be more pronounced in the higher income range, as is clear from table 6.6. Given
the large size of labourers in the sample from Malwa region (396 from Malwa and
201 from Majha) the difference becomes rather perceptible.
Table 6.6: Percentage share of sampled local casual labourers as per total family earnings, in sampled villages across the regions and development levels in Punjab
Note: Absolute figures are given in appendix 6.4 A.
The inter-regional analysis highlights that only nearly 42 per cent families in
Majha have an annual income more than Rs. 18,000. The remaining 58 per cent
families have annual income below Rs. 18,000. The corresponding proportions in
Doaba and Malwa regions are nearly 32 and 28 per cent, respectively. However,
family earnings in these two regions are less skewed than that in Malwa. A simple
juxtaposing of table 6.6 on table 6.4, reveals that other family members of the
labourers also supplement the family earnings across the regions. Table 6.4 reveals
that about 98 per cent labourers’ annual wages are only up to Rs. 12,000.
The analysis of intra- and inter-levels of development also presents wide
variations in family income of labourers (table 6.6). Across the three levels of
development the proportion of labourers whose monthly income is between Rs. 500-
1000 ranges between 19 per cent (medium developed villages) and 32 per cent (low
developed villages). The proportion of labourers in this range of family income is
about 31 per cent in high developed villages. Clearly, the level of development does
not make any significant difference, as far as the family earnings in the lowest bracket
are concerned. The only exception is medium level of development.
In the family earnings, range of Rs. 1000-1500, the proportion so labourers in
the low, medium and high developed villages are 31.50, 44.31 and 46.46 per cent,
Earnings (Rs., per month) Total Region Development level of village
Majha Doaba Malwa Low Medium High
500-1000 27.13 16.92 27.13 32.32 31.89 18.70 30.97 1000-1500 40.50 41.29 41.09 39.90 31.50 44.31 46.46
1500+ 32.37 41.97 31.78 27.78 36.61 36.99 22.57
62
respectively. The effect of development on family earnings is clearly visible in this
range of family earnings. The situation is almost contrary in the family earnings
above Rs. 1500. The proportion of labourers, from low and medium developed
villages, is almost the same (37 per cent) in this bracket. Compared to it, the
proportion is just 22.57 per cent in high developed villages. One may like to construe
that level of development has a negative correlation with family earnings beyond a
certain income level. Though it is paradoxical situation it is not compatible with
theory. One may further like to construe that the proportionate increase in the earnings
of labour families is lower than the proportionate increase in growth rate.
As a result of low wages and low family earnings, a little more than 70 per
cent of casual labourers are under loan, ranging from Rs. 1000 to above Rs. 20,000
(table 6.7). In other words, nearly 30 per cent labourers have not taken any loan.
About 58 per cent labourers have raised loan between Rs. 1000 to Rs. 10,000.
Another 10.47 per cent are under loan from Rs. 10,000 to Rs. 20,000. There are only
2.48 per cent labourers who are under loan of more than Rs. 20,000.
The proportion of labourers without any loan in agriculture, non-agricultural
activities and in both these activities is 10.28, 55.61 and 34.11 per cent, respectively.
Within agriculture 10.48 per cent labourers are without loan. The corresponding
proportion of labourers within non-agricultural sector and within agricultural and non-
agriculture is 40.48 per cent and 32.88 per cent, respectively. Thus, the proportion of
labourers without loan, both inter- and intra-sectoral is highest in non-agricultural
sector. This may be because of higher wages and higher family earnings in this sector
as compared to other sectors.
A little more than three-fourth labourers within agriculture are under loan up
to Rs. 10,000. Compare to it, 44.90 per cent labourers within non-agricultural sector
are in this range of loan. The proportion of those labourers, who partly work in both
agricultural and non-agricultural sectors, in this range of loan is 56.31 per cent. In the
loan range of Rs. 10,000 to 20,000 the intra-sector proportion of labourers under loan
is 10.48, 11.22 and 9.46 per cent, respectively. The inter-sector proportion of
labourers, in this range, is 28.95, 43.42 and 27.63 per cent, respectively.
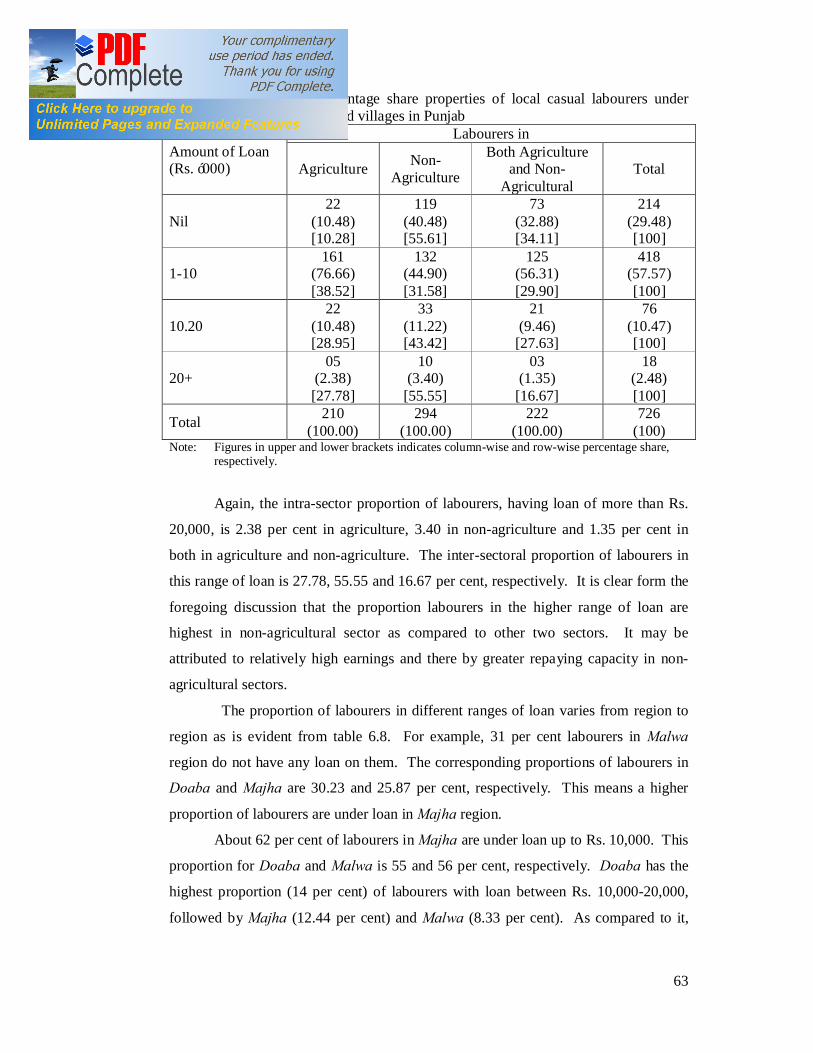
63
Table: 6.7: Sectoral percentage share properties of local casual labourers under loan in sampled villages in Punjab
Amount of Loan (Rs. ‘000)
Labourers in
Agriculture Non-Agriculture
Both Agriculture and Non-
Agricultural Total
Nil 22
(10.48) [10.28]
119 (40.48) [55.61]
73 (32.88) [34.11]
214 (29.48) [100]
1-10 161
(76.66) [38.52]
132 (44.90) [31.58]
125 (56.31) [29.90]
418 (57.57) [100]
10.20 22
(10.48) [28.95]
33 (11.22) [43.42]
21 (9.46)
[27.63]
76 (10.47) [100]
20+ 05
(2.38) [27.78]
10 (3.40)
[55.55]
03 (1.35)
[16.67]
18 (2.48) [100]
Total 210 (100.00)
294 (100.00)
222 (100.00)
726 (100)
Note: Figures in upper and lower brackets indicates column-wise and row-wise percentage share, respectively.
Again, the intra-sector proportion of labourers, having loan of more than Rs.
20,000, is 2.38 per cent in agriculture, 3.40 in non-agriculture and 1.35 per cent in
both in agriculture and non-agriculture. The inter-sectoral proportion of labourers in
this range of loan is 27.78, 55.55 and 16.67 per cent, respectively. It is clear form the
foregoing discussion that the proportion labourers in the higher range of loan are
highest in non-agricultural sector as compared to other two sectors. It may be
attributed to relatively high earnings and there by greater repaying capacity in non-
agricultural sectors.
The proportion of labourers in different ranges of loan varies from region to
region as is evident from table 6.8. For example, 31 per cent labourers in Malwa
region do not have any loan on them. The corresponding proportions of labourers in
Doaba and Majha are 30.23 and 25.87 per cent, respectively. This means a higher
proportion of labourers are under loan in Majha region.
About 62 per cent of labourers in Majha are under loan up to Rs. 10,000. This
proportion for Doaba and Malwa is 55 and 56 per cent, respectively. Doaba has the
highest proportion (14 per cent) of labourers with loan between Rs. 10,000-20,000,
followed by Majha (12.44 per cent) and Malwa (8.33 per cent). As compared to it,
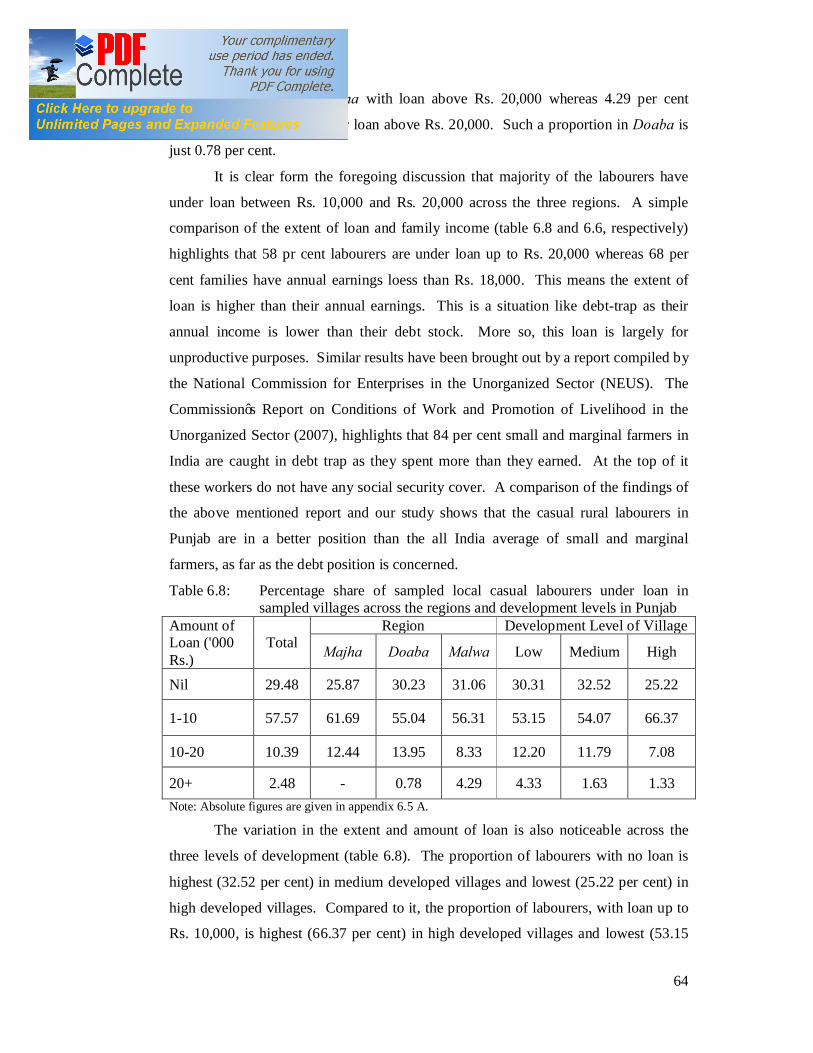
64
there is no labourer in Majha with loan above Rs. 20,000 whereas 4.29 per cent
labourers in Malwa are under loan above Rs. 20,000. Such a proportion in Doaba is
just 0.78 per cent.
It is clear form the foregoing discussion that majority of the labourers have
under loan between Rs. 10,000 and Rs. 20,000 across the three regions. A simple
comparison of the extent of loan and family income (table 6.8 and 6.6, respectively)
highlights that 58 pr cent labourers are under loan up to Rs. 20,000 whereas 68 per
cent families have annual earnings loess than Rs. 18,000. This means the extent of
loan is higher than their annual earnings. This is a situation like debt-trap as their
annual income is lower than their debt stock. More so, this loan is largely for
unproductive purposes. Similar results have been brought out by a report compiled by
the National Commission for Enterprises in the Unorganized Sector (NEUS). The
Commission’s Report on Conditions of Work and Promotion of Livelihood in the
Unorganized Sector (2007), highlights that 84 per cent small and marginal farmers in
India are caught in debt trap as they spent more than they earned. At the top of it
these workers do not have any social security cover. A comparison of the findings of
the above mentioned report and our study shows that the casual rural labourers in
Punjab are in a better position than the all India average of small and marginal
farmers, as far as the debt position is concerned.
Table 6.8: Percentage share of sampled local casual labourers under loan in sampled villages across the regions and development levels in Punjab
Amount of Loan ('000 Rs.)
Total Region Development Level of Village
Majha Doaba Malwa Low Medium High
Nil 29.48 25.87 30.23 31.06 30.31 32.52 25.22
1-10 57.57 61.69 55.04 56.31 53.15 54.07 66.37
10-20 10.39 12.44 13.95 8.33 12.20 11.79 7.08
20+ 2.48 - 0.78 4.29 4.33 1.63 1.33 Note: Absolute figures are given in appendix 6.5 A.
The variation in the extent and amount of loan is also noticeable across the
three levels of development (table 6.8). The proportion of labourers with no loan is
highest (32.52 per cent) in medium developed villages and lowest (25.22 per cent) in
high developed villages. Compared to it, the proportion of labourers, with loan up to
Rs. 10,000, is highest (66.37 per cent) in high developed villages and lowest (53.15
65
per cent) in low developed villages. In the range of loan between Rs. 10,000-20,000,
the proportion of labourers is highest (12.20 per cent) in low developed villages and
lowest (7.08 per cent) in high developed villages. The pattern is same above Rs.
20,000 also. The proportion of labourers under loan above Rs. 20,000 is highest (4.33
per cent) in low and lowest (1.33 per cent) in high developed villages.
It is clear from above that the proportion of labourers with loan above Rs.
10,000 is highest in low developed villages followed by medium and high developed
villages. This means, there is an inverse relationship between the amount and extent
of loan on one side and the level of development on the other side.
A comparison of table 6.6 with table 6.8 makes a sense. In the low developed
villages 63.39 per cent families have income up to Rs. 18,000 per annum whereas
65.35 per cent families are under loan up to Rs. 20,000. Similarly, 63 per cent
families in medium developed villages have family earnings up to Rs. 18000 whereas
65.86 per cent families are under loan of up to Rs. 20,000. In the case of high
developed villages 77.43 per cent families have annual income up to Rs. 18,000 but
73.45 per cent families are under loan up to Rs. 20,000. In addition to that small
proportion (ranging from 1.33 to 4.33 per cent) families are under loan above Rs.
20,000. Thus, the comparison of annual family income and the burden of loan, across
the three levels of development, also highlight a debt-trap like situation.
The main sources of loan are zamindars, kariana shops (provision stores) and
relatives, as is evident from table 6.9. Within agriculture, the most important source
of loan is zamindars (landlords) as nearly 63 per cent labourers take loan from them.
Kariana shops (provision stores) give goods on short term credit to labourers. The
proportion of such labourers is 34 per cent. A very small proportion of labourers
(3.19 per cent) take loan from relatives. It is, thus, clear that the labourers entirely
depend on non-institutional source of loan. The fact of the matter is that these
labourers are either not aware of institutional sources of loan or do not have nay
access to such sources.
It is very interesting to note that 72.57 per cent labourers, from the non-
agricultural sector, too, take loan from the zamindars. Only about 23 per cent
labourers in this sector take loan (in the form of goods on credit) from kariana shops.
Similarly, a little more than three-fourth labourers, working partly in agriculture and
partly in non-agricultural activities, depend on zamindars for loan.
66
Three very significant findings emerge out of the loan scenario. One, a very
sizeable majority (70 per cent) of casual labourers, not attached to zamindars but
working across the sectors, depend on zamindars for loan. Two, about one-fourth
labourers purchase goods on credit from kariana shops (mostly located in the village).
Three, the dependence of labourers for loan on their relatives is almost negligible. It
seems to be a natural phenomenon, as their relatives, being poor, too, have no surplus
for credit.
Table: 6.9: Sectoral proportion of casual labourers in terms of sources of loan in sampled villages in Punjab
Sources Agriculture Non-Agriculture Both Agriculture and Non-Agricultural Total
Zamindar 118
(62.77) [32.96]
127 (72.57) [35.48]
113 (75.84) [31.56]
358 (69.92) [100]
Kariana 64
(34.04) [49.23]
40 (22.86) [30.77]
26 (17.45) [20.00]
130 (25.39) [100]
Relatives 06
(3.19) [25.00]
08 (4.57)
[33.33]
10 (6.71)
[41.67]
24 (4.69) [100]
Total 188
(100) [36.72]
175 (100)
[34.18]
149 (100)
[29.10]
512 (100) [100]
Note: Figures in upper and lower brackets indicates column-wise and row-wise percentage share, respectively. In few cases there were more than one sources of loan, but the main source of loan is largely one.
Out of all the 358 labourers taking loan from zamindars, nearly one third is
from each sector, as is evident from table 6.9. As regards their dependence on kariana
shops, almost half the workers are from agriculture, less than one third from non-
agriculture and one fifth from both agriculture and non-agriculture, less than one third
from non-agriculture and one fifth from both agriculture and non-agriculture. The
proportion of labourers, across the sectors, taking loan from their relatives is highest
in combined agriculture and non-agriculture. The distribution of all the 512 labourers,
under loan, across the sectors is 36.72, 34.18 and 29.18 per cent, respectively.
Table 6.10 highlights the region-wise and level of development wise sources
of loan. Region-wise, Malwa ranks at number one as far as the proportion of
labourers is concerned in loan from zamindars. With 73.33 per cent share of
labourers in this category Doaba comes next. The corresponding proportion of
labourers in Majha is only 52.35 per cent. However, Majha has the highest
67
proportion of labourers (42.28 per cent) in the case of loan from kariana shops. The
proportion of labourers, taking loan from relatives across the regions, varies from 2.22
per cent in Doaba to 5.31 per cent in Majha. The interest rate on loan from zamindars
is quite high, ranging from 18 to 30 per cent per annum. Similarly, the kariana shop
owner charges a relatively high price of commodities sold on credit and if this amount
gets accumulated, the shop-owner starts charging a high rate of interest, often at
compound interest rate. As such, once a labourer falls in debt, it becomes almost
impossible for him to get rid of this problem. His meagre earnings and rising
expenditure on consumption and social needs make this problem worse.
It is interesting to note that the proportion labourers taking loan from
zamindars are highest (74.58 per cent) in low developed villages. The corresponding
proportion in medium and high developed villages is 68.67 and 66.27 per cent,
respectively. The position is altogether in the reverse order in the case of kariana
shop, as is visible from table 6.10. As regards the proportion of labourers, getting
loan from relatives, it is highest (5.65 per cent) in low, followed by medium and high
developed villages. This indicates the relatives help, though very meagre, is higher in
low developed villages than in high developed villages.
Table 6.10: Percentage share of sampled local casual labourers as per source of loan, in sampled villages across the regions and development levels in Punjab
Source of loan Total Region Development Level of Village
Majha Doaba Malwa Low Medium High Zamindar 69.92 52.35 73.33 78.39 74.58 68.67 66.27
Kariana shop 25.39 42.28 24.44 16.48 19.77 25.90 30.77
Relatives 4.69 5.37 2.22 5.13 5.65 5.42 2.96 Note: Absolute figures are given in appendix 6.6 A.
The purpose of loan and the proportion of labourers in each of these purposes,
across the sectors, are presented in table 6.11. Broadly, the labourers take loan for
four types of purposes. A large majority of labourers (54.49 per cent) use the loan to
meet their obligations towards household consumption expenditure. The proportion
of labourers who use loan to meet expenditure towards illness, marriage and purchase
of live stocks is 21.48, 20.51 and 3.52 per cent, respectively.
The sectoral distribution of labourers under loan presents a different scenario
as far as purpose of loan is concerned. Within the sectors, 19.15 per cent labourers in
68
agriculture use loan for the purpose of marriage of their daughters and sons. The
corresponding in non-agriculture is 16.57 per cent. The proportion of labourers,
working in both the activities, using loan for marriage is 26.85 per cent. Across the
sectors, the proportion of labourers using loan for marriage, is 34.29, 27.62 and 38.09
per cent, respectively. Thus, within and across the sectors, the proportions of
labourers using loan for marriage and working both in agriculture and non-agriculture,
are highest.
In the case of loan used for meeting household consumption expenditure,
within sectors, non-agricultural labourers have the highest proportion (61.71 per cent).
Agricultural labourers come next followed by labourers working in both the activities.
Across the sectors, too, non-agricultural workers have the highest proportion (38.71
per cent) that spent loan on household needs. The proportion of labourers in this
category of loan users is lowest in the third activity (i.e. labourers working both in
agriculture and non-agriculture).
Table: 6.11: Sectoral proportion of casual labourers in terms of purpose of loan in sampled villages in Punjab
Purpose Agriculture Non-Agriculture
Both Agriculture and Non-Agricultural Total
Household expenditure
104 (55.32) [37.28]
108 (61.71) [38.71]
67 (44.97) [24.01]
279 (54.49) [100]
Expenditure on illness
42 (22.34) [38.18]
32 (18.29) [29.09]
36 (24.16) [32.73]
110 (21.48) [100]
Purchase of live stock
06 (3.19) [33.33]
06 (3.43) [33.33]
06 (4.03) [33.33
18 (3.52) [100]
Marriage 36
(19.15) [34.29]
29 (16.57) [27.62]
40 (26.85) [38.09]
105 (20.51) [100]
Total 188
(100) [36.72]
175 (100)
[34.18]
149 (100)
[29.10]
512 (100) [100]
Note: Figures in lower and upper brackets indicates column-wise and row-wise percentage share, respectively.
As regards use of loan to meet expenditure towards illness, within the sectors,
the highest proportion (24.16 per cent) of labourers is in the third category of
activities. The lowest (18.29 per cent) of labourers is in non-agriculture. Across the
sectors, agriculture labourers have the highest proportion (38.18) in this category of
69
loan users. The lowest proportion (29.09 per cent) is that of non-agricultural
labourers.
A very small proportion of labourers (3 to 4 per cent), within the sectors, are
using loan to purchase live stock. Across the sectors the proportion of such labourers
is exactly equal.
The last row of table 6.11 highlights that out of 512 casual labourers under
loan the highest proportion (36.72 per cent) is that of agricultural labourers. The
proportion of non-agricultural labourers is 34.18 per cent. The remaining 29 per cent
labourers are those who are working partly in agriculture and partly in non-
agricultural activities.
Across the regions, the highest proportion of labourers use loan for household
expenditure is 59.06 per cent in Majha. This is followed by Doaba (57.78 per cent)
and Malwa (50.92 per cent). It is clear from table 6.12 that the proportion of
labourers, using loan on treatment of illness, varies from 15.56 per cent in Doaba to
24.16 per cent in Majha. The proportion of labourers, using loan for marriage
expenses, is highest (22.71 per cent) in Malwa, Doaba and Majha comes next (21.11
per cent and 16.11 per cent, respectively) in the descending order. The proportion of
labourers using loan to purchase live stock is 5.56 per cent, 4.40 per cent and 0.67 per
cent in Doaba, Malwa and Majha, respectively.
In the case of various levels of development, the labourers in high developed
villages have the highest proportion (62.13 per cent) who use loan to meet household
expenses. This is followed by medium (53.61 per cent) and low developed villages
(48.02 per cent) respectively. The proportion of labourers using loan for treatment of
illness ranges from 17.75 per cent in high developed villages to 24.29 per cent in low
developed villages. Again the proportion of labourers using loan for marriage
purposes is highest (24.86 per cent) in low developed villages, followed by medium
(20.48 per cent) and high developed (15.98 per cent) villages. The shares of labourers
who are using loan to purchase live stock are 2.82, 3.61 and 4.14 per cent,
respectively, in low, medium and high developed villages.
70
Table 6.12: Percentage share of sampled local casual labourers as per purpose of loan, in sampled villages across the regions and development levels in Punjab
Purpose of loan Total Region Development Level of Village Majha Doaba Malwa Low Medium High
Household expend 54.49 59.06 57.78 50.92 48.02 53.61 62.13
Exp. On illness 21.48 24.16 15.56 21.98 24.29 22.19 17.75
Marriage 20.51 16.11 21.11 22.71 24.86 20.48 15.98
Purchase of live stock 3.52 0.67 5.56 4.40 2.82 3.61 4.14 Note: Absolute figures are given in appendix 6.7 A.
It is important too, from the foregoing discussion, that a very high proportion
of labourers use loan for meeting household consumption needs and that, too, when
the cost of loan is very high. Taking the purchase of live stock as the only productive
use of loan, 96.48 per cent labourers make unproductive use of loan. Such a
proportion is highest (99.33 per cent) in Majha followed by 95.60 per cent in Malwa
and 94.44 per cent in Doaba regions, respectively. It is, again, very interesting
phenomenon that the proportion of labourers making unproductive use of loan is
highest (97.18 per cent) in low developed villages. The proportion of such labourers
declines with the increasing level of development. However, the difference is not
significant. The proportion of such labourers in medium and high developed villages
is 96.39 and 95.86 per cent, respectively. Enormously high proportion of labourers in
the unproductive use of loan is a serious phenomenon. Though the reason behind it is
largely their low earnings yet they will not be able to come out of this trap unless
serious measures are taken at the policy level.
71
Appendix to tables
Table 6.1 A: Sectoral distribution of sampled local casual labourers in agricultural and non-agricultural activities, as per wage rate in sampled villages in Punjab
Table 6.2 A: Wage rate of sampled local casual labourers in sampled villages across the regions and development levels in Punjab
Wage rate (Rs., per Day) Total Region Development Level of
Village Majha Doaba Malwa Low Medium High
40-60 106 16 13 77 48 27 31 60-80 375 111 65 199 117 133 125 80-100 230 72 48 110 80 81 69 100+ 15 2 3 10 9 5 1 Total 726 201 129 396 254 246 226
Table 6.3 A: Sectoral distribution of sampled local casual labourers according to total family earnings in sampled villages in Punjab
Earnings per month Total Agriculture Non-agriculture Both 500-1000 197 109 28 60 1000-1500 294 81 96 117 1500+ 235 20 170 45 Total 726 210 294 222
Table 6.4 A: Total family earnings of sampled local casual labourers in sampled villages across the regions and development levels in Punjab
(Rs. Per month)
Sector Wage rate (Rs., per day) Total 40-60 60-80 80-100 Above 100
Agriculture 210 57 142 10 1 Non-agriculture 294 16 71 193 14 Both Agri. & Non-Agri. 222 33 162 27 - Total 726 106 375 230 15
Earnings (Rs., per month) Total Region Development level of village
Majha Doaba Malwa Low Medium High 500-1000 197 34 35 128 81 46 70 1000-1500 294 83 53 158 80 109 105 1500+ 235 84 41 110 93 91 51 Total 726 201 129 396 254 246 226
72
Table 6.5 A: Number of sampled local casual labourers in terms of loan burden in sampled villages across the regions and development levels in Punjab
Amount of Loan ('000 Rs.)
Total Region Development Level of Village
Majha Doaba Malwa Low Medium High
Nil 214 77 80 57 52 39 120 1-10 418 135 133 150 124 71 223 10-20 76 31 29 16 25 18 33 20+ 18 11 4 3 - 1 17 Total 726 254 246 226 201 129 396
Table 6.6 A: Number of sampled local casual labourers in terms of source of loan in sampled villages across the regions and development levels in Punjab
Source of loan Total Region Development Level of Village
Majha Doaba Malwa Low Medium High Zamindar 358 78 66 214 132 114 112 Kariana shop 130 63 22 45 35 43 52 Relatives 24 8 2 14 10 9 5 Total 512 149 90 273 177 166 169
Table 6.7 A: Number of sampled local casual labourers in terms of purpose of loan in sampled villages across the regions and development levels in Punjab
Purpose of loan Total Region Development Level of Village Majha Doaba Malwa Low Medium High
Household expend 279 88 52 139 85 89 105 Exp. On illness 110 36 14 60 43 37 30 Marriage 105 24 19 62 44 34 27 Purchase of live stock 18 1 5 12 5 6 7 Total 512 149 90 273 177 166 169

73
CHAPTER 7
OCCUPATIONAL STRUCTURE, WAGES AND ASSETS OF LOCAL ATTACHED LABOUR IN RURAL PUNJAB
Though most of employers in rural area do not want to employ labourers on
permanent/regular basis yet there were 174 attached labourers in the sample of 900
labourers. It has also been observed that even the majority of labourers do not offer
them for attached labour. In our sample 80.44 per cent labourers were casually
employed. In fact, casualization of employment in rural India, in general, and that in
agriculture, in particular, is on the rise. The proportion of casual labourers in total
hired labour, across the major states in India, in agriculture reached to near 90 per
cent (Gill and Ghuman, 2001). In Punjab, the share of casual labour in hired labour in
major crops was around 75 per cent during the 1990s.
Table 7.1 shows that out of 174 attached labourers, 74.14 per cent in Malwa
region, 12.07 per cent in Doaba and 13.79 per cent in Majha. It is important to note
that the proportion of labourers, from Malwa, in total sample of 900 labourers is 58.33
per cent. The proportion of Malwa in the sample of 726 casual labourers is 54.54 per
cent. Clearly, the tradition of hiring attached labourers is more prevalent in Malwa is
compared to the other two regions.
Table 7.1: Number of percentage share of sampled local attached labourers in sampled villages across the regions and development levels in Punjab
Total Region Development level of village Majha Doaba Malwa Low Medium High
Number 174 24 21 129 46 54 74 Percentage share
100.00 13.79 12.07 74.14 26.44 31.03 42.53
Source: Field survey. Note: 1. The source of all the following tables in this chapter is also field survey. 2. There was no female labourer in the category of attached labourers.
With regard to development level of villages, the tradition of hiring attached
labour has a positive correlation with the level of development as is evident from table
7.1. The proportion of casual labourers in low, medium and high developed villages
is 26.44, 31.10 and 42.53 per cent, respectively. Compared to it, all the 900 sampled
labourers are evenly spread over all the development levels. The proportion of casual
labourers in low, medium and high developed villages, too, displays a similar

74
phenomenon. It is, thus, clear that the proportion of attached labourers is higher in
higher developed villages. Such a phenomenon seems some what paradoxical.
Table 7.2: Age structure of sampled local attached labourers in sampled villages across the regions and development levels in Punjab
Age (Years)
Total Region Development level of village Majha Doaba Malwa Low Medium High
Below 14
7 (4.02)
1 (4.17)
1 (4.76)
5 (3.88)
1 (2.17)
3 (5.56)
3 (4.05)
14-20 65 (37.36)
8 (33.33)
6 (28.57)
51 (39.53)
20 (43.48)
20 (37.04)
25 (33.78)
21-25 78 (44.83)
14 (58.33)
11 (52.38)
53 (41.09)
20 (43.48)
25 (46.30)
33 (44.59)
26-30 17 (9.77)
1 (4.17)
3 (14.24)
13 (10.8)
4 (8.70)
5 (9.26)
8 (18.81)
31 and above
7 (4.02)
- - 7 (5.43)
1 (2.17)
1 (1.85)
5 (6.76)
Total 174 (100.00)
24 (100.00)
21 (100.00)
129 (100.00)
46 (100.00)
54 (100.00)
74 (100.00)
Note: Figures in brackets indicate percentage share.
The age structure of local attached labour is presented in table 7.2. It is
important to note here that there exists child labour even in the attached local labour
in Punjab. The perusal of table 7.2 reveals that 4.02 per cent of the total sampled
attached labour was found below the age of 14 years, which is a child labour. The
attached labourers working in rural Punjab is between the age group of 14-20 is 37.36
per cent. The highest proportion of attached labourers (44.83 per cent) falls in the age
category of 21-25 years. Nearly ten per cent of attached labourers in rural Punjab are
in the age group of 26-30 years. There are only 4.02 per cent who are above 31 years
of age. Some what similar patterns of the attached labourers are observed from the
distribution of the workers across the regions such as Majha, Doaba and Malwa. The
perusal of the distribution of attached labourers across levels of development reveals
that the highest proportion of attached labourers lies in the age group of 21-25 years.
The proportion of attached labourers of low, medium and high development villages
are 43.48 per cent, 37.04 per cent and 33.78 per cent respectively. The analysis of the
table 7.2 clearly shows that more than 80 per cent of the attached labourers are in the
two categories of age, that is, 14-20 and 21-25. The incidence of child labour is quite
low but still persisting in the rural areas of Punjab.
As regards period of stay with the same employer, it varies from 1 to 4 year
(table 7.3). To begin with majority of the labourers enter into contract for one year
75
only. However, about 60 per cent labourers continue to stay with the same employer
for more than two years. To be specific, 40.23 per cent labourers continue to work
with the same employer between one to two years. Another 32.18 per cent labourers
stick to the same employer for two to four years. And 27.59 per cent labourers
continue to work with the same employer for more than four years.
Table 7.3: Number and percentage share of sampled local attached labourers in terms of period of stay with the same employer in sampled villages across the regions and development levels in Punjab
Stay (Years)
Total Region Development level of village Majha Doaba Malwa Low Medium High
1-2 70 (40.23)
5 (20.83)
7 (33.33)
58 (44.96)
27 (58.70)
196 (35.19)
24 (32.43)
2-4 56 (32.18)
14 (58.34)
9 (42.86)
33 (25.58)
11 (23.91)
23 (42.59)
22 (29.93)
4+ 48 (27.59)
5 (20.83)
5 (23.81)
38 (29.46)
8 (17.39)
12 (22.22)
28 (37.84)
Total 174 (100.00)
24 (100.00)
21 (100.00)
129 (100.00)
46 (100.00)
54 (100.00)
74 (100.00)
Note: 1. Figures in brackets indicate percentage share. 2. Though 40.23 per cent labourers have been staying with their present
employment between 1-2 years yet 95.40 per cent labourers enter into contract for only one year, to begin with.
Across the regions the proportion of labourers, working between one to two
years with the same employer, is 20.83, 33.33 and 44.96 per cent in Majha, Doaba
and Malwa. The situation is altogether reversed in the case of labourers sticking with
the same employer between two to four years. It is 58.34, 42.86 and 25.58 per cent in
Majha, Doaba and Malwa, respectively. The situation again reverses in the
attachment period beyond 4 years. The proportion is the highest in Malwa and lowest
in Majha. Thus, in the short period the mutual contract of labourers and employers is
higher in Malwa. In the medium period it is higher in Majha where as the loyalty is
higher in Malwa a bit longer period.
In terms of development level, nearly 59 per cent labourers in low developed
villages remain with the same employer from one to 2 years. The proportion is 35.19
and 32.43 per cent, respectively, in medium and high developed villages. The
proportion of labourers remaining with the same employer between two to four years
in low, medium and high developed villages is 23.91, 42.59 and 29.93 per cent,
respectively. The corresponding proportion of labourers for an attachment period
beyond four years is 17.39, 22.22 and 38 per cent, respectively. It is clear from the
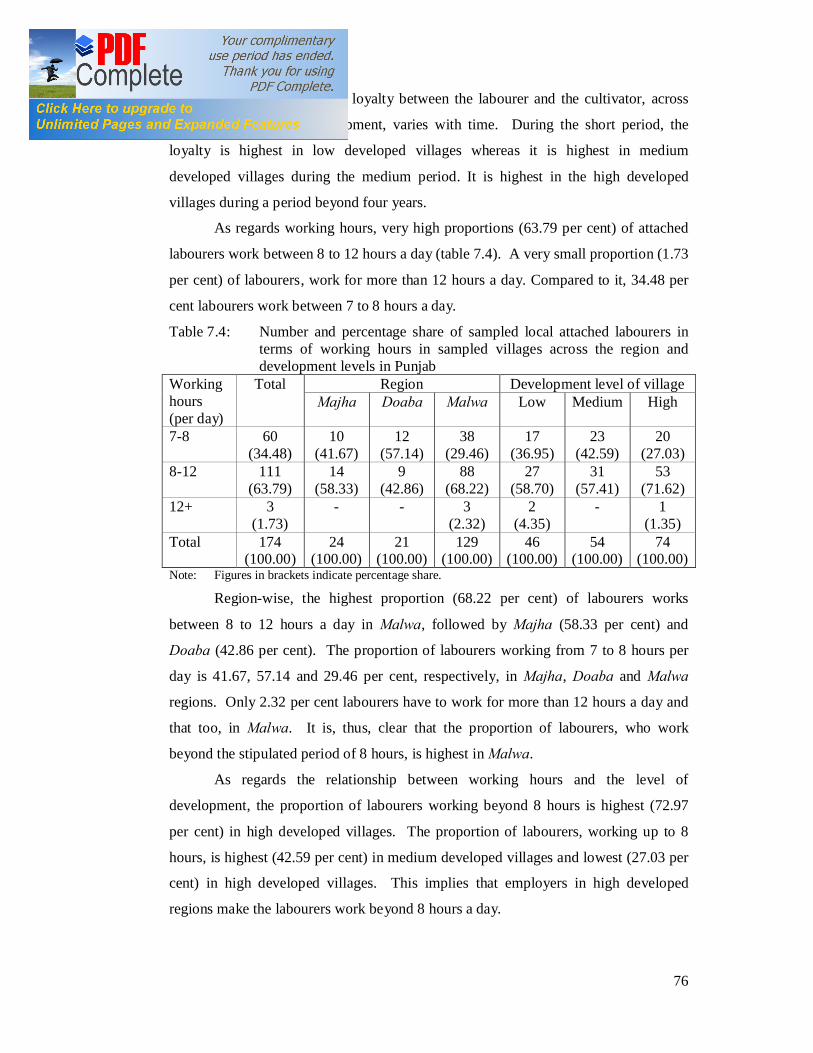
76
foregoing discussion that the loyalty between the labourer and the cultivator, across
the various levels of development, varies with time. During the short period, the
loyalty is highest in low developed villages whereas it is highest in medium
developed villages during the medium period. It is highest in the high developed
villages during a period beyond four years.
As regards working hours, very high proportions (63.79 per cent) of attached
labourers work between 8 to 12 hours a day (table 7.4). A very small proportion (1.73
per cent) of labourers, work for more than 12 hours a day. Compared to it, 34.48 per
cent labourers work between 7 to 8 hours a day.
Table 7.4: Number and percentage share of sampled local attached labourers in terms of working hours in sampled villages across the region and development levels in Punjab
Working hours (per day)
Total Region Development level of village Majha Doaba Malwa Low Medium High
7-8 60 (34.48)
10 (41.67)
12 (57.14)
38 (29.46)
17 (36.95)
23 (42.59)
20 (27.03)
8-12 111 (63.79)
14 (58.33)
9 (42.86)
88 (68.22)
27 (58.70)
31 (57.41)
53 (71.62)
12+ 3 (1.73)
- - 3 (2.32)
2 (4.35)
- 1 (1.35)
Total 174 (100.00)
24 (100.00)
21 (100.00)
129 (100.00)
46 (100.00)
54 (100.00)
74 (100.00)
Note: Figures in brackets indicate percentage share.
Region-wise, the highest proportion (68.22 per cent) of labourers works
between 8 to 12 hours a day in Malwa, followed by Majha (58.33 per cent) and
Doaba (42.86 per cent). The proportion of labourers working from 7 to 8 hours per
day is 41.67, 57.14 and 29.46 per cent, respectively, in Majha, Doaba and Malwa
regions. Only 2.32 per cent labourers have to work for more than 12 hours a day and
that too, in Malwa. It is, thus, clear that the proportion of labourers, who work
beyond the stipulated period of 8 hours, is highest in Malwa.
As regards the relationship between working hours and the level of
development, the proportion of labourers working beyond 8 hours is highest (72.97
per cent) in high developed villages. The proportion of labourers, working up to 8
hours, is highest (42.59 per cent) in medium developed villages and lowest (27.03 per
cent) in high developed villages. This implies that employers in high developed
regions make the labourers work beyond 8 hours a day.

77
Table 7.5, gives the wage structure of attached labourers across the regions
and across the levels of development. About 5 per cent labourers work on annual
wages of less than Rs. 10,000. In addition to cash wages, they may also be receiving
something in kind also. About 14 per cent of labourers are getting wages more than
Rs. 25,000 per annum. Thus, the lower and upper brackets of wages are below Rs.
10,000 and Rs. 25,000 per annum. Within this bracket, 7.47 per cent labourers’ annual
wage package is between Rs. 10,000 to 15,000. About 32 per cent and 42 per cent
labourers are getting wages between Rs. 15-20 thousands and Rs. 20-25 thousands,
respectively. Thus, nearly 13 per cent labourers receive wages between Rs. 15
thousands per annum and another 73.56 per cent get wages between 15 to 25
thousands.
Table 7.5: Number and percentage share of sampled local attached labourers, in annual wages, in sampled villages across the regions and development levels in Punjab
Annual Wages (‘000 Rs.)
Total Region Development level of village Majha Doaba Malwa Low Medium High
Upto 10 9 (5.17)
2 (8.33)
1 (4.76)
6 (4.65)
4 (8.70)
1 (1.85)
4 (5.41)
10-15 13 (7.47)
- - 13 (10.08)
7 (15.22)
4 (7.41)
2 (2.70)
15-20 55 (31.61)
8 (33.33)
5 (23.81)
42 (32.56)
11 (23.91)
19 (35.19)
25 (33.78)
20-25 73 (41.96)
11 (45.84)
9 (42.86)
53 (41.08)
18 (39.13)
23 (42.59)
32 (42.24)
25+ 24 (13.79)
3 (12.50)
6 (28.57)
15 (11.63)
6 (13.04)
7 (12.97)
11 (14.86)
Total 174 (100.00)
24 (100.00)
21 (100.00)
129 (100.00)
46 (100.00)
54 (100.00)
74 (100.00)
Note: 1. Figures in brackets indicate percentage share. 2. In addition to wages in cash 96.59 per cent of attached labourers, on an average, have
been getting something in kind in one form or the other such as meals, tea, snacks etc., and occasionally fodder for their cattles.
The proportion of labourers, getting wages below Rs. 10,000 per annum, is
8.33, 4.76 and 4.65 per cent in Majha, Doaba and Malwa regions, respectively. The
corresponding proportion of labourers in the highest bracket of wages is 12.50, 28.57
and 11.63 per cent, respectively. Only 10 per cent labourers in Malwa region get
wages between Rs. 10 to 15 thousands per annum. The proportion of labourers in the
wage bracket of Rs. 15-20 thousands is 33.33, 23.81 and 32.56, respectively, across
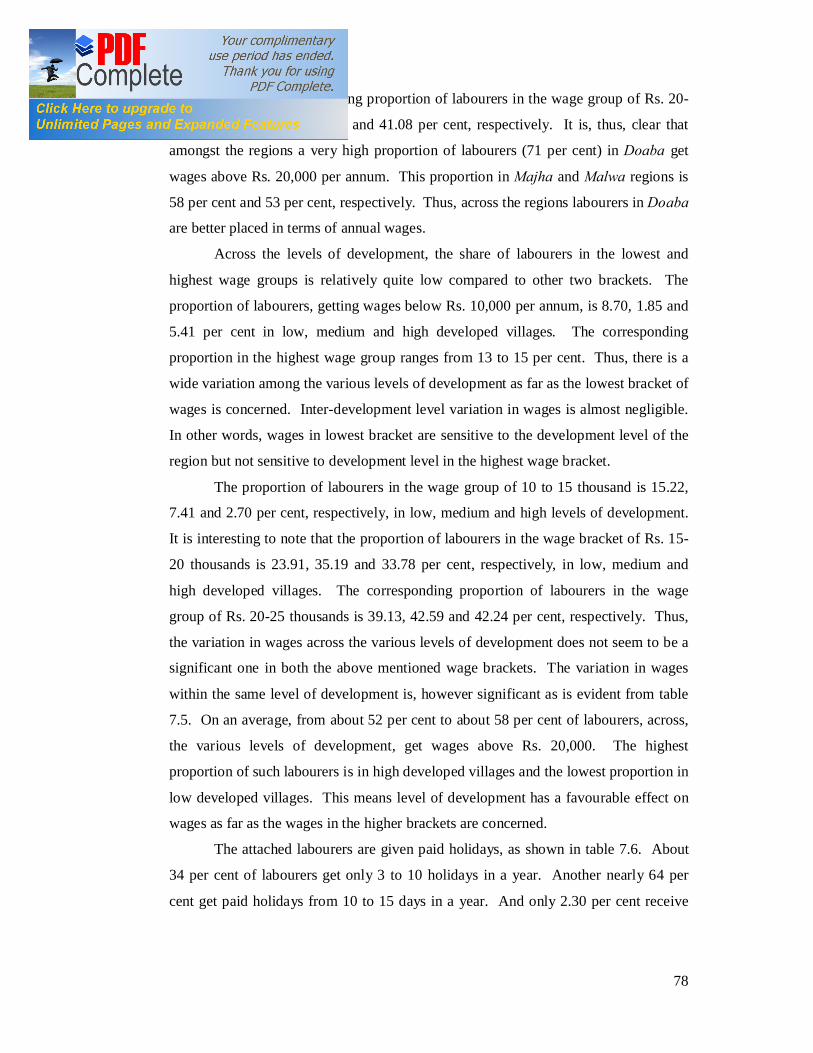
78
the regions. The corresponding proportion of labourers in the wage group of Rs. 20-
25 thousands is 45.84, 42.86 and 41.08 per cent, respectively. It is, thus, clear that
amongst the regions a very high proportion of labourers (71 per cent) in Doaba get
wages above Rs. 20,000 per annum. This proportion in Majha and Malwa regions is
58 per cent and 53 per cent, respectively. Thus, across the regions labourers in Doaba
are better placed in terms of annual wages.
Across the levels of development, the share of labourers in the lowest and
highest wage groups is relatively quite low compared to other two brackets. The
proportion of labourers, getting wages below Rs. 10,000 per annum, is 8.70, 1.85 and
5.41 per cent in low, medium and high developed villages. The corresponding
proportion in the highest wage group ranges from 13 to 15 per cent. Thus, there is a
wide variation among the various levels of development as far as the lowest bracket of
wages is concerned. Inter-development level variation in wages is almost negligible.
In other words, wages in lowest bracket are sensitive to the development level of the
region but not sensitive to development level in the highest wage bracket.
The proportion of labourers in the wage group of 10 to 15 thousand is 15.22,
7.41 and 2.70 per cent, respectively, in low, medium and high levels of development.
It is interesting to note that the proportion of labourers in the wage bracket of Rs. 15-
20 thousands is 23.91, 35.19 and 33.78 per cent, respectively, in low, medium and
high developed villages. The corresponding proportion of labourers in the wage
group of Rs. 20-25 thousands is 39.13, 42.59 and 42.24 per cent, respectively. Thus,
the variation in wages across the various levels of development does not seem to be a
significant one in both the above mentioned wage brackets. The variation in wages
within the same level of development is, however significant as is evident from table
7.5. On an average, from about 52 per cent to about 58 per cent of labourers, across,
the various levels of development, get wages above Rs. 20,000. The highest
proportion of such labourers is in high developed villages and the lowest proportion in
low developed villages. This means level of development has a favourable effect on
wages as far as the wages in the higher brackets are concerned.
The attached labourers are given paid holidays, as shown in table 7.6. About
34 per cent of labourers get only 3 to 10 holidays in a year. Another nearly 64 per
cent get paid holidays from 10 to 15 days in a year. And only 2.30 per cent receive
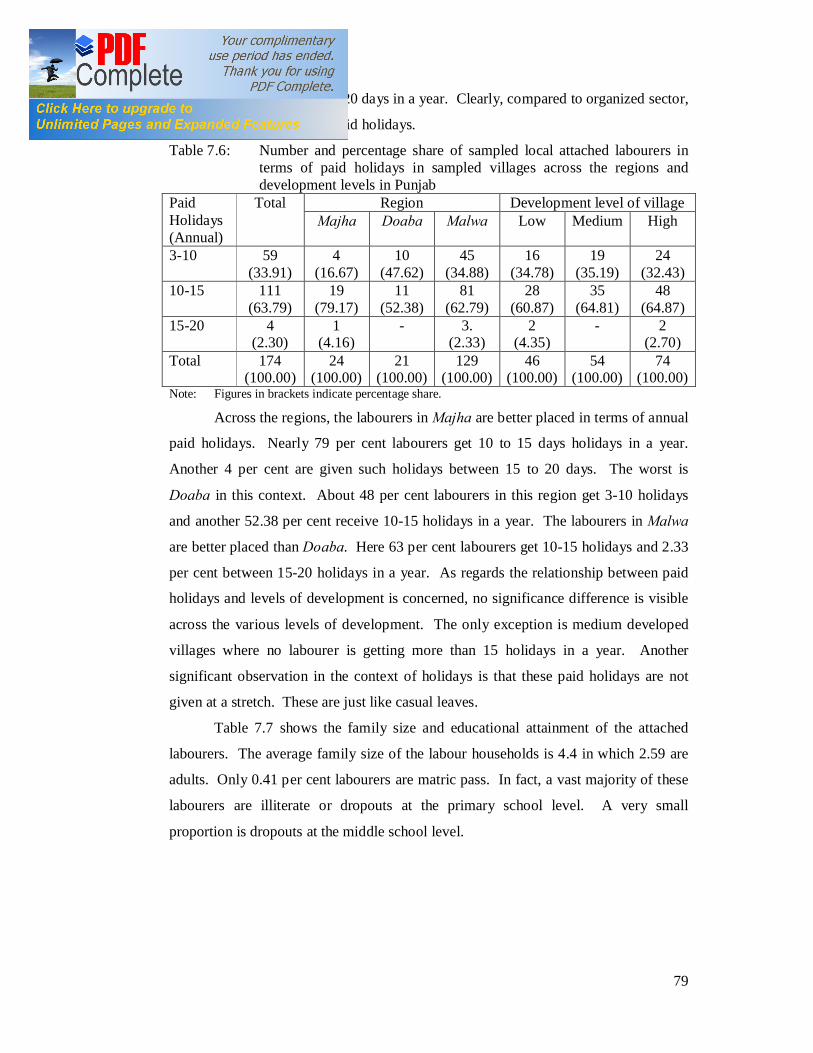
79
such holidays between 15 to 20 days in a year. Clearly, compared to organized sector,
these labourers get far less paid holidays.
Table 7.6: Number and percentage share of sampled local attached labourers in terms of paid holidays in sampled villages across the regions and development levels in Punjab
Paid Holidays (Annual)
Total Region Development level of village Majha Doaba Malwa Low Medium High
3-10 59 (33.91)
4 (16.67)
10 (47.62)
45 (34.88)
16 (34.78)
19 (35.19)
24 (32.43)
10-15 111 (63.79)
19 (79.17)
11 (52.38)
81 (62.79)
28 (60.87)
35 (64.81)
48 (64.87)
15-20 4 (2.30)
1 (4.16)
- 3. (2.33)
2 (4.35)
- 2 (2.70)
Total 174 (100.00)
24 (100.00)
21 (100.00)
129 (100.00)
46 (100.00)
54 (100.00)
74 (100.00)
Note: Figures in brackets indicate percentage share.
Across the regions, the labourers in Majha are better placed in terms of annual
paid holidays. Nearly 79 per cent labourers get 10 to 15 days holidays in a year.
Another 4 per cent are given such holidays between 15 to 20 days. The worst is
Doaba in this context. About 48 per cent labourers in this region get 3-10 holidays
and another 52.38 per cent receive 10-15 holidays in a year. The labourers in Malwa
are better placed than Doaba. Here 63 per cent labourers get 10-15 holidays and 2.33
per cent between 15-20 holidays in a year. As regards the relationship between paid
holidays and levels of development is concerned, no significance difference is visible
across the various levels of development. The only exception is medium developed
villages where no labourer is getting more than 15 holidays in a year. Another
significant observation in the context of holidays is that these paid holidays are not
given at a stretch. These are just like casual leaves.
Table 7.7 shows the family size and educational attainment of the attached
labourers. The average family size of the labour households is 4.4 in which 2.59 are
adults. Only 0.41 per cent labourers are matric pass. In fact, a vast majority of these
labourers are illiterate or dropouts at the primary school level. A very small
proportion is dropouts at the middle school level.
80
Table 7.6: Average family size, number of adults and educational attainment of sampled local attached labourers in sampled villages across the regions and development levels in Punjab
Group/ Sub group) Total Region Development level of village
Majha Doaba Malwa Low Medium High Family size 4.40 4.60 4.39 4.32 4.30 4.42 4.49 No. of adult members 2.59 2.86 2.56 2.53 2.57 2.71 2.57 10th pass 0.41 0.47 0.56 0.31 0.41 0.42 0.35
Across the regions, the family size varies from 4.32 (Malwa) to 4.60 (Majha).
Across the levels of development the family size varies between 4.30 in low
developed region to 4.49 in high developed region. Two very significant observations
are cropping up from the foregoing analysis. One the average family size of the
labourer households is quite reasonable in the context of overall average family size
in Punjab. Two, the average family size of labourer households is lower in relatively
backwards area, viz. Malwa. At the same time the family size is large in high
developed villages and small in low developed villages. It further implies that in the
labourer households, the level of educational attainment does not have any bearing on
the family size. It is clear from table 7.7, that the family size is lower in Malwa
whereas only 0.31 per cent labourers posses matric certificate. At the same time, the
proportion of labourers with matriculation is lowest (0.35 per cent) in high developed
villages but the average family size is largest. Thus, the often held view that
educational attainment limits the family size has not been upheld by these labourer
households.
As regards the average number of adult members is concerned, it varies from
2.53 per cent in Malwa to 2.86 per cent in Majha. Across the levels of development,
it varies from 2.57 per cent in low and high developed villages to 2.71 per cent in
medium developed villages.
The value of family assets, across the regions and levels of development, is
shown in table 7.8. The average value asset is Rs. 15829 per household. There is
high degree of variation as is clear from the value of standard deviation. The
labourers in Doaba have the highest (Rs. 18338) value of assets followed by Majha
and Malwa. The intra-region variation is highest in Doaba followed by Malwa and
Majha. It is astonishing to note that the average value of assets of labourers is highest
(Rs. 15836) in low developed villages and lowest in medium developed villages. The

81
variation is, however, highest in high developed villages, as is clear from the standard
deviation. The average level of family assets, in various regions and various levels of
development, however, is very low.
Table 7.8: Average family assets of sampled local attached labourers in sampled villages across the regions and development levels in Punjab
Assets (Rs.) Total Region Development level of village
Majha Doaba Malwa Low Medium High Average 15829 14818 18338 14093 15836 13865 15243 Standard Deviation
10978 6560 10161 8680 8387 6615 10521
Almost all the labourers have raised loan from their employers. The amount
of loan ranges from 4000 to over Rs. 15,000 plus (table 7.9). Nearly 23 per cent
labourers have raised loan from the employer above Rs. 15,000. Another 22.41 per
cent labourers are under loan from Rs. 10,000 to Rs. 15,000. Approximately 34 pr
cent labourers are under loan from Rs. 5,000 to Rs. 10,000. The remaining 20.69 per
cent labourers are having loan burden between Rs. 4 to 5 thousands.
Across the regions, 21.71 per cent labourers in Malwa are under loan and/or
have taken advance payment below Rs. 5,000. Compared to it, the proportion of such
labourers in Majha and Doaba is 20.83 per cent and 14.29 per cent, respectively. The
proportion of labourers having taken loan between Rs. 5 to 10 thousands is 37.21,
28.57 and 20.83 per cent in Malwa, Doaba and Majha regions, respectively. The
corresponding proportion in the range of Rs. 10 to 15 thousands is 20.93, 28.57 and
25 per cent, respectively. Within the region, the highest proportion of labourers under
loan above Rs. 15,000 is in Majha (33.34 per cent). It is followed by Doaba (28.57
per cent) and Malwa (20.15 per cent).
Table 7.9: Percentage share of sampled local attached labourers in terms of loan liability towards the employer, in sampled villages across the regions and development levels in Punjab
Range of loan (‘000 Rs.)
Total Region Development level of village Majha Doaba Malwa Low Medium High
4-5 20.69 20.83 14.29 21.71 17.39 27.78 17.57 5-10 33.91 20.83 28.57 37.21 23.91 37.04 37.84 10-15 22.41 25.00 28.57 20.93 26.09 26.09 18.92 15+ 22.99 33.34 28.57 20.15 32.61 11.11 25.68 Total 100.00 100.00 100.00 100.00 100.00 100.00 100.00 Note: Absolute figure are given in appendix 7.1 A.
82
Between various levels of development, the proportion of labourers having
loan below Rs. 5000 is 17.39, 27.78 and 17.57 per cent in low, medium and high
developed villages, respectively. The corresponding proportions of labourers in the
loan range of 5 to 10 thousands is 23.91, 37.04 and 37.84 per cent, respectively. It is
interesting to note that the proportion of labourers having loan below Rs. 5,000 is
almost same in low and high developed regions. It is almost same in medium and
high developed villages in the range of Rs. 5 to 10 thousands. Again the proportion of
labourers in the loan range of Rs. 10 to 15 thousands is same (26.09 per cent) in low
and medium developed villages. The highest proportion of labourers under loan
above Rs. 15,000 is 32.61 per cent in low developed villages followed by high and
medium developed villages. It is clear from the foregoing discussion that amount of
loan and the proportion of labourers in a particular range do not depict any clear cut
relationship with the level of development.
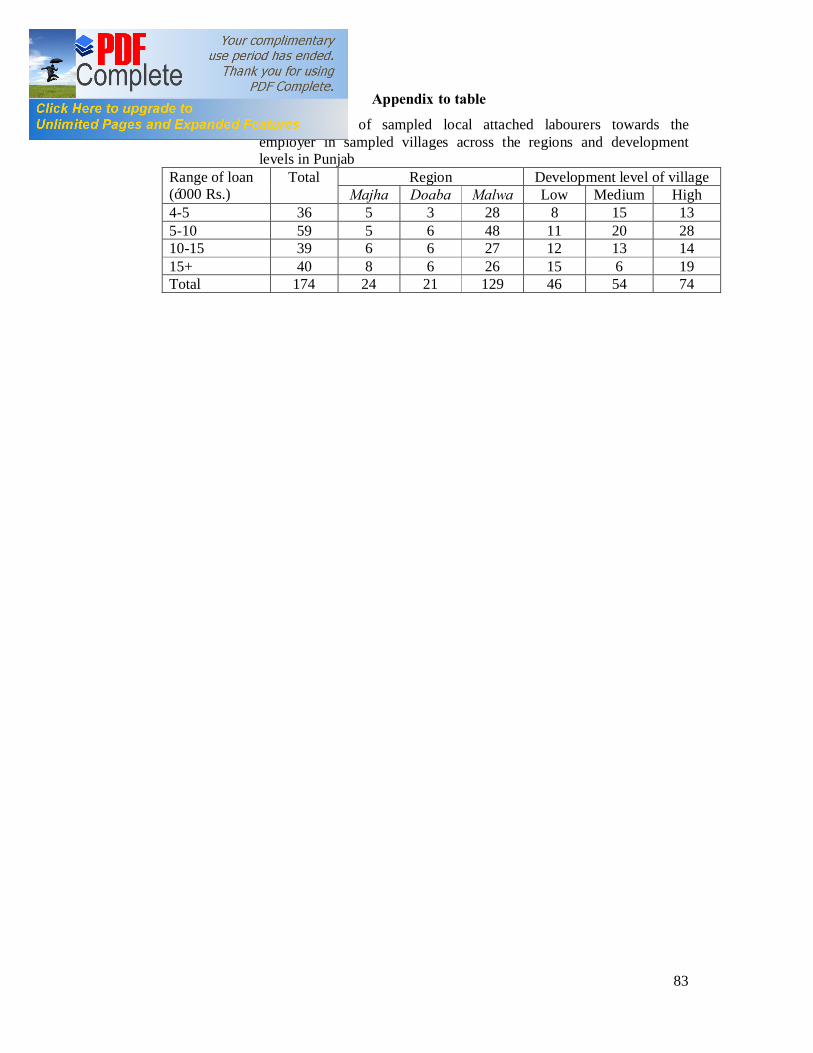
83
Appendix to table
Table 7.1 A: Loan liability of sampled local attached labourers towards the employer in sampled villages across the regions and development levels in Punjab
Range of loan (‘000 Rs.)
Total Region Development level of village Majha Doaba Malwa Low Medium High
4-5 36 5 3 28 8 15 13 5-10 59 5 6 48 11 20 28 10-15 39 6 6 27 12 13 14 15+ 40 8 6 26 15 6 19 Total 174 24 21 129 46 54 74
84
CHAPTER 8
SUMMARY AND POLICY IMPLICATIONS The substantial presence of migrant labour and huge surplus workforce in
agriculture and rural economy of Punjab presents a paradoxical situation. During the
last about two decades, the labour absorption capacity of Punjab agriculture has been
declining continuously. As such the availability of employment, in terms of man-
days, has reduced in a big way over the period of time. Both the cultivators and local
agricultural labour are becoming surplus. At the same time, there has been a
continuous inflow of migrant labour in Punjab agriculture.
Such a paradoxical situation poses a serious question about the status of local
agricultural labour in Punjab. It has been disturbing the minds of social scientists and
policy makers in Punjab. The issue needs a serious inquiry. The present study is an
effort in this direction. In fact, one of the major objectives of the study is to examine
the status of local agricultural labour in Punjab.
The findings of this scientifically designed empirical study are based
largely on actual primary data pertaining to 36 villages in Punjab. These villages
are located in 12 development blocks, in 12 districts of Punjab. The selected 12
districts represent all the three regions of Punjab, namely, Majha, Doaba and
Malwa. The districts are Gurdaspur, Amritsar, Tarantaran (Majha); Jalandhar,
Hoshiarpur (Doaba) and Ludhiana, Ferozepur, Mukatsar, Bathinda, Sangrur,
Fatehgarh Sahib and Patiala (Malwa). Thus, there are three districts from Majha, two
from Doaba and seven from Malwa. The selection of these districts is via blocks.
Based on the ranking (in the descending order) of blocks, by Economic and Statistical
Organization (ESO) of Punjab, we selected 12 blocks. Accordingly, three blocks
were randomly selected from the first 25 ranks (highly developed blocks). Six blocks
were randomly selected from the medium developed blocks. Out of these six blocks,
three were from 26-50 ranks, and another three were from 51-80 ranks, respectively.
The remaining three blocks were randomly selected from 81 to 122 blocks. Thus, our
sample represents various regions having different levels of development, spread over
the entire state of Punjab. And the selected 12 blocks are located in the above
mentioned 12 districts. So, there is one block from one district. It is important to
mention that there were only 122 blocks in Punjab when the ESO did the ranking
85
exercise. The ranking is based on a number of representative socio-economic
parameters.
At the second stage, we randomly selected three villages from each block.
The selection of villages was made out of the cluster of villages. One village each
was randomly selected from the high developed, medium developed and low
developed cluster of villages in each block. Thus, the entire sampling exercise has
been done with the help of multistage stratified random sampling technique.
On the basis of census survey of all the households, it has been found that
there were 7669 households in all the 36 sampled villages at the time of survey. The
survey pertains to the period; January to May 2007. To analyse the occupational,
income and asset structure of local rural agricultural labourers, we have randomly
selected 25 respondents from each selected village. Thus, in all, there were 900
respondents.
Out of all the 7669 households in the sampled 36 villages, 66.41 per cent are
from Malwa region and the remaining 9.48 per cent and 24.11 per cent are from
Doaba and Majha regions, respectively. It is nearly proportionate sample from the
respective shares of their population in Punjab’s total population. From amongst the
various levels of development, 28.26, 29.60 and 42.14 per cent households are from
amongst the low, medium and high developed villages, respectively.
Nearly, 67 per cent households are landless and about 33 per cent own
land. These estimates are almost similar to the latest NSSO estimates. From
amongst land owners, 51.20 per cent are marginal and small holders (up to 5
acres), 26 per cent between 5 to 10 acres, 9.53 per cent between 10 to 15 acres
and 13.21 per cent above 15 acres. The corresponding share of operational land
holding is 48.53, 26.56, 10.68 and 14.23 per cent respectively. This means 2.67
per cent marginal and small land owners are not engaged in agriculture. It
indicates that there has already started a slow process of de-peasantisation of
small and medium farmers in Punjab. The impact is more noticeable in the case
of small farmers. Nevertheless, there is net-leasing-out of land by every size-class
of land holdings.
It is important to note that out of 2506 land owning households only 2172
(86.67 per cent) households are actually engaged in farming. It means 13.33 per
86
cent land-owning households are not operating their land. The proportion of
small operational holding to own holding in that category is 78.22 per cent.
The average family size and the size of land holding have a positive
correlation. The small sized land owners have relatively smaller family size as
compared to large sized land owners. May be land is a uniting factor. Again the
farm households have a higher size of family as compared to non-farm and
labour households. There is no significant variation in the family size across the
regions and levels of development.
As regards level of education about 69 per cent households did not have
even a single member with qualification up to matric. Nearly 51 per cent farm-
households did not have any member with qualification up to matric. Amongst
the land owning households, a little more than two third households amongst
marginal land holders do not have any family member up to matric. This
proportion, however, falls as we move to higher level of land holdings. This
proportion is 54.31, 46.71, 41.00 and 33.53 per cent, respectively, in small, semi-
medium, medium and large land holders.
The relationship between educational level and level of development presents
a mixed picture. Nearly 73 per cent households in low developed villages did not
have a single family member with qualification up to matric. The corresponding
proportion in medium and high developed villages was 64.23 and 69.34 per cent,
respectively. Across the regions Malwa has the highest proportion of families (73 per
cent) in which there is no member even up to matric. The corresponding proportions
in Doaba and Majha are 35.49 and 33 per cent, respectively.
As regards non-farm employment, the average share of households in
non-farm activities in all the 36 villages came out to be 24.36 per cent. Across the
levels of development, 20.17, 26.43 and 25.71 per cent households, respectively in
low, medium and high developed villages, have employment in non-farm
activities. Out of the non-farm employment, 57.44, 50 and 55.11 per cent
households, respectively, across the three levels of development, are engaged in small
time self-employment. The remaining are in wage employment.
Across the regions, the proportion of households engaged in non-farm
activities are 22.77, 43.88 and 22.15 per cent in Majha, Doaba and Malwa,

87
respectively. From amongst these households, 43.94, 66.46 and 54.25 per cent are
self-employed across the respective regions. The rest are in wage employment.
As regards the attached employment of local rural labour, 99.31 per cent
marginal and 91.51 per cent small farmers did not have any attached labourer.
The corresponding proportion of such households in semi-medium, medium and large
holdings is 81.78, 63.60 and 44.71 per cent, respectively. Similarly, the proportion of
households having one or more than one attached labourer also increases with the
holding size. The proportion of households who are having two attached labourers is
4.18 and 11.78 in the case of medium and large holding size, respectively. Only 10
per cent of the big farmers are having three attached labourers. This means that the
demand for attached labour increases with the increase in farm size.
Heavy mechanization, massive use of herbicides, and short duration of peak
season in Punjab agriculture have led to a strange phenomenon. On the one hand,
demand for labour has declined and on the other hand, there is heavy demand for
casual labour during sowing and harvesting periods, which are termed as peak
periods.
The employment of casual labour and the farm size has a positive
relation. As we move to higher level of operational holdings, the proportion of
households hiring casual labour goes on increasing. The small farmers, however,
are an exception. Nearly 64 per cent of them hire casual labour. This
proportion is 32, 56, 57 and 63 per cent, respectively in the case of marginal,
semi-medium, medium and large operational holdings. Our study shows that 96
per cent marginal and 78 per cent small farmers employ up to 50 man-days
during one year. The corresponding proportions in the case of semi-medium,
medium and large operational holdings are, however, 34, 26 and 21 per cent,
respectively. In fact, 20 per cent semi-medium farmers hire casual labour
between 50 to 75 man days and 46 per cent hire them for more than 75 man-days
in a year. The proportion of medium and large farmers, hiring casual labour
above 75 man days in a year, is 60 per cent and 76 per cent, respectively. Thus,
the maximum demand for casual labour is coming from semi-medium, medium
and large farmers.
It is widely held view that migration and economic development are closely
connected. The workforce, especially of poorer households and relatively poorer
88
regions, migrates in search of better employment opportunities. Punjab state has been
continuously receiving substantial amount of migrant work force since the ushering in
of green revolution. The total number of migrants increased from 8,72,377 in 1981 to
17,52,718 persons in 2001. The growth rate of migrant population during the period
1981-2001 was 3.55 per cent per annum. The inflow of migrants increased at a fast
rate during the 1990s compared with the eighties. Uttar Pradesh and Haryana were
the major sources which have supplied migrants to Punjab state. The growth of
migrants also increased in Punjab from Bihar but still their proportion remained quite
less compared with the proportion of migrants from Uttar Pradesh and Haryana.
However, the urban migrants are predominantly from Uttar Pradesh and Bihar. The
proportion of Uttar Pradesh, among the eight major sender states, migrants in urban
areas of Punjab was 40 per cent and that of Bihar was only 19.42 per cent in the year
2001. Haryana and Uttar Pradesh remained predominant so far as rural-rural migrants
from other states to Punjab are concerned. The rural to rural migration has increased
but at a lower pace compared with influx of migrants to urban areas of Punjab. It is
generally believed that Census do not record migrants whose stay in the state is less
than six months. Therefore, this leads to an under estimation of migrant inflows.
The study has attempted to provide estimates related to regular/attached and
casual workforce coming to Punjab in search of earning livelihood. The total
estimated number of migrant labourers working in agriculture sector in Punjab
comes out to be 8,19,254 persons. This is 23.04 per cent of the agricultural
workforce in the state. The regular/attached labourers were just 1,23,639
persons. However, the large chunk of migrant workforce comes to Punjab as
casual labourers. The estimated number of casual migrant labourers is 6,95,615
persons. The majority of these migrant workers (more than 90 per cent) are able
to find work in agriculture only up to 50 days in a year. There are three peak
seasons – wheat harvesting, paddy sowing and paddy harvesting – when the migrant
workers are most needed in Punjab and after the peak season they usually go back to
their respective native places. Some of them shift to urban areas of Punjab, during the
lean season of agriculture.
On the basis of 900 sampled local labourers from 36 villages, we found that
80.67 per cent were casual labourers and only 19.33 per cent were attached labourers.
The extent of casualization of agricultural labour is highest in Majha, 89.33 per cent,
89
followed by Doaba and Malwa. From amongst the various levels of development, the
extent of casualization of labour is highest (84.67 per cent) in low developed and
lowest (75.33 per cent) in high developed villages.
It is important to note that all the local labourers in Punjab have their own
houses. Nearly 88 per cent of the labourers have semi-pacca houses and only 5.55 per
cent have pacca houses. As regards household assets, majority of the labourers own
the basic minimum household goods. Only 3.44 per cent have refrigerator, 32.44 per
cent have radio-transistor, 9.33 per cent have cooking gas, 2.44 per cent have
scooter/motor cycle, 95 per cent have fan and no household has cooler. Nearly 39 per
cent households have live-stock, mainly one milch animal. All the labour-households
have access to drinking water in the form of tap water (67.22 per cent) and owned
pump (28.56 per cent).
The occupational structure of all the 726 sampled casual labourers shows
that the share of agriculture, non-agriculture and partly in both is 28.92, 40.50
and 30.58 per cent, respectively. About 65 per cent work in their respective
villages; out of them 44.00, 15.25 and 40.68 per cent, respectively, work in
agriculture, non-agriculture and partly in agriculture and non-agricultural
sectors. Out of the remaining 35 per cent, working outside the village, the
respective proportions are 0.79, 87.40 and 11.81 per cent.
The predominant reason for the above mentioned phenomenon is
relatively higher wage rate in non-rural and non-agriculture sectors. Nearly 64
per cent of the labourers came out with such an explanation. About 23 per cent
labourers are going out for work because of non-availability of work in the
village. Nearly 13 per cent have mentioned that they are going out of their
village because of better working conditions. Thus, low wage in agriculture and
rural area, along with non-availability of work, is pushing the local rural labour
out of agriculture and rural area in Punjab. In fact, labour is being pushed out
of agriculture due to shrinking and low-wage-employment in agriculture in
Punjab (Ghuman, 2005). These labourers have to travel between 8 to 16 kms
daily. More than 88 per cent travel bicycle.
A comparative analysis of availability of work in agriculture, non-
agriculture and partly in agriculture and non-agriculture further shows that
within agriculture 32 per cent labourers get work only for 8 to 10 days in a
90
month. In the non-agricultural sectors, such a proportion is only 7.48 per cent.
About 67 per cent labourers in agriculture get work for 10 to 20 days in a month.
The proportion of such labourers in non-agricultural activities is 83.33 per cent.
A little less than one per cent workers in agriculture get work for more than 20
days in a month. In the non-agricultural sectors, such a proportion is 9.19 per
cent.
The proportion of those labourers who work partly in agriculture and
partly in non-agricultural activities in a range of 8-10 days per month is 13.06
per cent. Another 84.69 per cent of such labourers could get work between 10 to
20 days in a month. Only 2.25 per cent labourers in this category could find
work beyond 20 days in a month. Clearly, agriculture provides work for a lesser
number of days than the other sectors.
Amongst various regions the highest proportion of casual labourers (92%),
getting work for more than 10 days in a month, is in Majha. Around 80 per cent of
the labourers in Doaba and Malwa regions get work for more than 10 days in a
month. Amongst the levels of development, medium developed villages provide
work for more than 10 days to the highest proportions (88.62 per cent).
Amongst all the local casual labourers across the sectors, regions and
development levels, 62.27 per cent work for 7 to 8 hours, 25.21 per cent for 5 to 7
hours and 12.12 per cent for 8 to 10 hours in a day. Within the various categories of
employment 59 per cent in agriculture, 70 per cent in non-agricultural activities and
56 per cent in both agriculture and non-agriculture work for 7 to 8 hours a day. Out
of all the casual labourers, working for 5 to 7 hours in day, 40 per cent are partly in
agriculture and non-agricultural activities. However, out of all the labourers having a
working day of 7 to 8 hours and 8 to 10 hours, the highest proportion is in non-
agriculture sectors.
There is wide intra-regional variation in working hours. Within Majha 30, 59
and 11 per cent casual labourers work from 5 to 7, 7 to 8 and 8 to 10 hours a day. The
corresponding proportion of labourers in Doaba is 33, 51 and 16 per cent,
respectively. It is 20, 68 and 12 per cent in Malwa, respectively. The intra-regional
variations in terms of working hours are more pronounced in Malwa.
Within the category of low developed villages about 67 per cent labourers
work for 7 to 8 hours a day. The corresponding proportion in medium and high

91
developed regions is around 60 per cent. The proportions of labourers, with working
day of 8 to 10 hours, are 9, 15 and 12 per cent in low, medium and high developed
villages. The proportion of labourers with working day of 5 to 7 hours, across the
level of development, ranges from 24 to 27 per cent.
The per day average wage rate of local casual labourers working in
agriculture, non-agriculture and partly in both is Rs. 73, 95 and 77, respectively.
Given the working days in a month the average monthly wages of 8, 83 and 9 per
cent of local rural labourers in non-agricultural activities came out to be Rs. 856,
Rs. 1428 and Rs. 1903, respectively. As compared to it, the average monthly
wages of labourers working partly in both the sectors came out to be Rs. 697, Rs.
1161 and Rs. 1548 for 13, 85 and 2 per cent of the labourers. It is clear from the
foregoing discussion that the average monthly wages of agricultural labourers
are far less than their counter parts in non-agricultural activities. That is why
the majority of local rural labourers prefer to work outside agriculture. But the
problem is that the non-agriculture sector, too, is not in a position to provide
them enough employment opportunities. It is, however, significant to note that
the daily average wage rates are Rs. 76 and Rs. 97 for workers working in the
village and out of the village, respectively.
The wage rate varies from Rs. 40 to Rs. 100 per day across the sectors. The
proportion of labourers getting more than Rs. 100 in agriculture and non-agriculture is
0.48 and 4.76 per cent, respectively. On an average 14.60 per cent labourers get a
daily wage rate between Rs. 40 and Rs. 60 only. About 52 per cent labourers get
between Rs. 60 and Rs. 80 per day. Approximately 32 per cent labourers are getting a
wage rate between Rs. 80 and Rs. 100 a day. And only 2 per cent labourers get a
wage of more than Rs. 100 per day.
Across the regions, the daily average wage rate in Majha, Doaba and Malwa
is Rs. 76, Rs. 75 and Rs. 61, respectively. The average wage rate in low, medium and
high developed villages is Rs. 71, Rs. 70 and Rs. 61 per day, respectively. About 84,
74, 78 per cent labourers in Majha, Doaba and Malwa, respectively get average
monthly wages between Rs. 917 and Rs. 1142. The proportion of labourers in low,
medium and high developed villages, having monthly wages of Rs. 1062, Rs. 1043
and Rs. 921 is 76, 84 and 77 per cent, respectively. It implies that average monthly
wages are higher in low developed villages than the medium and high developed

92
villages for a significant proportion of labourers. It is clear from above that wage rate
is not strictly determined by the development levels of the villages. This tantamounts
to a paradoxical situation.
As regards family earnings, 27 per cent local casual labourers have a
meagre income between Rs. 500 to Rs. 1000 per month; 40.50 per cent earn
between Rs. 1000 and Rs. 1500 per month. The monthly earnings of the
remaining 32.37 per cent labourers are above Rs. 1500 per month. Nearly one-
third of the labourer families have daily earnings of Rs. 6.59 per person.
Together, nearly 68 per cent families end up with less than Rs. 10 per day per
person.
As a result of low wags and low family earnings about 70 per cent labourers
are under loan ranging from Rs. 1000 to Rs. 20000. Nearly 58 per cent of them have
a loan burden between Rs. 1000 and Rs. 10000. Another 10 per cent are under loan
between Rs. 10000 and Rs. 20000. There are only 2.48 per cent labourers having loan
more than Rs. 20000.
Across the sectors about 89, 44 and 66 per cent labourers in agriculture, non-
agriculture and in both are under loan burden. This means the incidence of loan is
much higher in agriculture than in non-agriculture sector.
The main sources of loan are Zamindars (landlords) and Kariana shops (retail
merchants). About 70 per cent labourers have taken loan from Zamindars and 25 per
cent from Kariana shops. It is strange to note that the proportion of labourers taking
loan from Zamindars is lower in agriculture than in non-agricultural activities.
In view of the low earnings, most of the labourers are constrained to use a
very high proportion of loan for meeting routine household expenses and social
obligations. Such a proportion is 96.48 per cent across the sectors, regions and
development levels. From the economists’ stand point, such a use of loan is not
desirable. However, the labourers are compelled to do so even to meet their
minimum household requirements. Out of total casual labourers under loan,
54.49 per cent use the loan to meet household expenses. Another 21.48 per cent
spend the loan amount on medical treatment and 20.51 per cent spend the loan
amount on marriage of sister, brother, son or daughter. Only 3.52 per cent of
the labourers use loan to purchase livestock.
93
Enormously high proportion of labourers using loan for meeting basic
requirements, low wage rate and low family earnings have pushed the labourers
to a virtual debt-trap.
Though the proportion of casual labour in the hired labour is substantial
yet the share of attached labour in total labour came out to be 19 per cent in
sampled villages of Punjab. There is positive correlation between the proportion
of attached labourers and the level of development. Out of the total 174 attached
labourers, 26.44 per cent are in low developed villages and 42.53 per cent are in high
developed villages. Within the low, medium and high developed villages, the
proportion of attached labour in respective total is 15.33, 18 and 24.67 per cent,
respectively.
It is significant to note that about 4 per cent of the attached labour falls in
the category of child labour. The proportion of child labour may be higher in
casual labour as the parents normally take their grown up children for work
along with them. The present study, however, has not recorded the age of casual
labourers. These children should have been in schools. Another 37 per cent of
the attached labour is in the age group of 14-20 years. It supplements the fact
that 90 per cent of the labour households do not have even one person with
matric qualifications.
The duration of working day of attached labour is well beyond 8 hours.
About 64 per cent labourers have to work between 8 to 12 hours in a day. Such a
proportion is highest in Malwa and lowest in Majha. The proportion of such
labourers is 72 per cent in high developed villages and 59 per cent in low developed
villages. Thus, across the regions and levels of development the working day of a
high proportion of attached labourers goes well beyond 8 hours. The length of the
working day and the level of development move in the same direction.
As regards annual wages, about 32 per cent attached labourers get wages
between Rs. 15 and Rs. 20 thousands. Another 42 per cent get wages between Rs.
20,000 to 25,000 per annum. About 14 per cent of these labourers earn more than Rs.
25 thousands per annum. The annual earnings of attached labourers are
significantly higher than the annual earnings of casual labourers. About 62 per
cent causal labourers earn less than Rs. 15 thousands per annum.
Approximately 34 per cent casual labourers’ monthly earnings vary between Rs.
94
15000 and Rs. 18000 per annum. Only 4 per cent casual labourers earn more
than Rs. 18000 per annum. The lower earnings are largely because of the lesser
number of working days on the one hand and lower wage rate on the other. The
former factor is much more significant. Contrary to it, 94 per cent of the
attached labourers earn more than Rs. 15000 per annum. The proportion of
such labourers increases as we move from the lower level to higher level of
development.
About 34 per cent of attached labourers get 3 to 10 paid holidays in a year.
Another 64 per cent get 10 to 15 paid holidays. The average family size of the
attached labourers is 4.4 persons per family with average number of adults being 2.59
per family. Only 0.41 per cent of the attached labourers are qualified up to 10th class.
The rest are either illiterate or semi-literate. A very small proportion of them are
literate.
On an average, the family assets of the attached labourers are worth Rs.
15829. The value of such assets is Rs. 18338 in Doaba, Rs. 14818 in Majha and Rs.
14093 in Malwa. It is interesting to note that the worth of family assets of the
labourers is highest (Rs. 15836) in low developed villages and lowest in medium
developed villages.
All the attached labourers are under loan ranging from Rs. 4000 to above Rs.
15,000. About 45 per cent of the attached labourers are under a loan of more than Rs.
10,000. Another 34 per cent of labourers are under a loan of Rs. 5000 to Rs. 10,000.
Their single most important source of loan is Zamindar and a very high proportion of
it is for meeting basic household consumption needs.
Policy implications and Recommendations
The substantial presence of migrant labour and prevalence of huge surplus
workforce in Punjab agriculture have wide ranging socio-economic implications for
the state. The skill and education level of the surplus workforce is not only low but
also irrelevant for most of the emerging non-farm employment opportunities. At the
same time, a good proportion of educated unemployed workforce, some how or the
other, is feeling shy to enter into non-farm employment which is largely available in
informal sector. May be most of the emerging employment opportunities in the
informal sector, inter alia, are below the aspirations of the unemployed youth in
Punjab.
95
Besides, the generation of rural non-farm employment is far below the
required level. Agriculture is pushing out the surplus labour but there is no pull effect
from the non-farm sectors. It has generated a serious crisis for agricultural workforce
and agrarian economy in particular and for rural economy in general.
In view of this, the main policy implications and recommendations of the
study, on the basis of analysis and field observations, are as under:
1. The development dynamism of the state has pushed substantial amount of workforce, both cultivators and labourers, out of agriculture. The transition would be very painful in the absence of some suitable policy measures. The State should draw out short, medium and long term policies to address this phenomenon.
2. In view of the shrinking employment elasticity, surplus workforce (both labourers and cultivators) in agriculture and future additions to that, a substantial proportion of agricultural workers need a systematic withdrawal out of agriculture. There is, thus, an urgent need to generate non-farm employment in the rural areas. That would require serious efforts and initiatives on the part of the government so that investment is encouraged in the relevant non-farm activities. In fact, development of rural-non-farm sector is sine qua non for smooth shifting of surplus workforce from agriculture to non-agricultural sectors in particular and for the development of rural economy, in general.
3. About 69 per cent rural households and 90 per cent of the rural labour households do not have even one member with matriculation. Such a dismal situation necessitates revamping of the rural school education in Punjab. The government must assume a lead role in making quality education available, accessible and affordable to the rural people.
4. In view of the low level of skill and non-employability of rural labour in non-farm sector, there is an urgent need to start short term skill oriented courses for updating their skill and make them employable. This should be a regular feature.
5. In view of the continuous inflow of migrant workers, there is a need to chalk-out suitable plans for the migrant as well as local labour.
6. The low wage rate, along with the lesser number of employment days, has worsened the economic plight of agricultural labourers. It is important to note that no casual labourer in agriculture is earning more than Rs. 1500 per month, on an average. Even in the case of family earnings, nearly 67 per cent families end up with a monthly income of less than Rs. 1500. Even in non-agricultural activities, 91 per cent casual labourers are earning less than Rs. 1500 per month. There is, thus, an urgent need to address this phenomenon by way of empowering workforce with skill and other measures.

96
7. In view of the significant difference in wage rate in agriculture and non-agricultural activities, there is a need to take suitable measures to raise wage rate in agriculture sector also.
8. As a result of low wages, low availability of work and low family earnings, more than 70 per cent of the casual labourers are under loan. They had taken loan from non-institutional sources at a very high interest rate. The fact of the matter is that a very high proportion of labourers take loan to meet household expenses, health, care and social commitments. These labourers are in a debt-trap. In view of this, their family income needs to be raised along with providing them institutional loan.
9. About 4 per cent of the attached agricultural labourers fall in the category of child labour which is not a healthy sign for a developed state like Punjab. The children should have been in the school rather than working as attached labour. Another 37 per cent of the attached labourers are in the age group of 14 to 20 years. This should be the serious concern of the government and policy makers.
10. The longer duration of working hours (64 per cent of the labourers work for 8 to 12 hours in a day) in the case of attached labour should also be a matter of concern for the government and policy makers.
11. The plight of agricultural/rural labour is closely connected with agrarian economy in particular and with the rural economy in general. As such, the government and policy makers should have to work out a holistic approach towards the development of rural economy as a whole. No partial or half-hearted measures would make any significant improvement. This should be topmost priority of the state. However, much would depend upon the political will and commitment.
12. Since the wage rate and total family earnings, even in the rural non-farm activities, are quite low the existing rural non farm activities need to be revamped keeping in view the minimum needs of labourers. Accordingly there is a need to promote agro-based industries in the rural areas so that the rural workers could get employment for a reasonable number of days at a decent wage rate. In fact setting up of new industrial units should be encouraged in the rural area.
13. Efforts must be made to bring more and more agro-based industries into the organized sector, preferably in the modern member based autonomous cooperatives which must be established without bureaucratic controls.
14. The provision of social security for the rural labour is imperative to take care of the education, health and marriage of their wards.
15. The Government should set up the Rural Labour Commission, to study and address the problems of rural labour.
97
BIBLIOGRAPHY
Bhalla Shiela (1987), “Trends in Employment in Indian Agriculture, Land and Assets
Distribution”, The Indian Journal of Labour Economics, Vol. 42, No. 4.
Chadha, G.K. (2002), “Rural Non-farm Employment in India: What does Recent
Experience Teach us?”, The Indian Journal of Labour Economics, Vol. 45,
No. 4, pp. 663-694.
Chand, Krishan (2002), Migrant Labour and the Trade Union Movement in
Punjab: A Case Study of the Sugar Industry, CRRID, Chandigarh.
Ghuman, Ranjit Singh (2001), “WTO and Indian Agriculture: Crisis and Challenges –
A Case Study of Punjab”, Man and Development, Vol. 23, No. 2, pp. 67-98.
Ghuman, Ranjit Singh (2005), “Rural Non-farm Employment Scenario: Reflections
from Recent Data in Punjab”, Economic and Political Weekly, Vol. 5, No.
41, pp. 4473-80.
Ghuman, Ranjit Singh, Sukhpal Sharma and Balwinder Singh (2002), “Non-farm
Employment in Punjab”, The Indian Journal of Labour Economics, Vol.
42, No. 4, pp. 853-870.
Ghuman, Ranjit Singh, Sukhwinder Singh and Jaswinder Singh Brar (2006), Rural
Students in Universities of Punjab, Punjabi University, Patiala.
Gill, Anita (2004), “Interlinked Agrarian Credit Markets: Case Study of Punjab”,
Economic and Political Weekly, Vol. 39, No. 33.
Gill, Sucha Singh (2002), “Agriculture, Crop Technology and Employment
Generation in Punjab”, in S.S. Johl and S.K. Ray, Future of Agriculture in
Punjab, CRRID, Chandigarh, pp. 56-68.
Gill, Sucha Singh and Ranjit Singh Ghuman (2001), “Changing Agrarian Relations in
India: Some Reflections from Recent Data”, The Indian Journal of Labour
Economics, Vol. 44, No. 4, pp. 809-826.
GOI (2001), Census of India 2001, Distribution of Workers and Non-workers, paper
3.
Government of India, National Commission for Enterprises in the Unorganised
Sector, Report on Conditions of Work and Promotion of Livelihood in the
Unorganised Sector (2007).
98
Government of Punjab (1998), Report on Unemployed Persons (Age group 18-35
years) Desirous of Seeking Self-employment in Punjab (unpublished),
Chandigarh.
Government of Punjab (2002), Report of the Expert Committee on Agriculture
Production Pattern Adjustment Programme in Punjab for Productivity
and Growth, Chandigarh.
Government of Punjab (2006), Statistical Abstract of Punjab.
Haan, Arjan de (2007), “International Migration in an Era of Globalisation: Has it
Come Out of its Marginality?” in George Mavrotas and Anthony Shorrocks
(eds.) Advancing Development: Core Themes in Global Economics,
Hampshire: Palgrave Macmillan.
Johl, S.S. and S.K. Ray (2002), Future of Agriculture in Punjab, CRRID,
Chandigarh.
Jolly, Richard (1970), “Rural-Urban Migration: Dimensions, Census, Issues and
Policies”, in Prospects for Employment Opportunities in Nineteen
Seventies, Cambridge: Cambridge University Press.
Kaldor, Nicholas (1967), Strategic Factors in Economic Development, Cornell
University Press, Ithaca, New York.
Kuznets, Simon (1965), Economic Growth and Structure, Oxford and IBH
Publishing Company, New Delhi.
Rangi, P.S., M.S. Sidhu and Harjit Singh (2004), “Casualisation of Agricultural
Labour in Punjab”, The Indian Journal of Labour Economics, Vol. 44, No.
4, pp. 957-970.
Shergill, H.S. (2006), Diversification of Cropping Pattern: A Re-Examination,
I.D.C., Chandigarh.
Sidhu, H.S. and Jasdeep Singh Toor (2002), “Nature and Determinants of Rural Non-
Farm Activities in Punjab”, The Indian Journal of Labour Economics, Vol.
45, No. 4, 2002, pp. 871-881.
Sidhu, M.S. and P.S. Rangi (2004), “Unemployment Problem in Punjab”,
Productivity, Vol. 45, No. 2, pp. 275-284.
Sidhu, M.S., Rangi, P.S. and Karam Singh (1997), A Study of Migrant Agricultural
Labour in Punjab, PAU, Ludhiana.
99
Singh, Sukhpal, Manjit Kaur and H.S. Kingra (2007), Flow of Funds to Farmers
and Indebtedness in Punjab, The Punjab State Farmers Commission,
Government of Punjab.
Singh Gurjinderjit and Joginder Singh (2006), “Green Revolution and Economic
Plight of Agricultural Labour in Punjab”, The Indian Journal of Labour
Economics, Vol. 49, No. 4, pp. 874-854.
Singh, Ram (2006), Migrant Labour in India, New Delhi: Classical Publishing
Company.
The Punjab State Farmers Commission, Government of Punjab (2006), Agricultural
and Rural Development, S.A.S. Nagar, Mohali.
Tadaro, M.P. and S.C. Smith (2003), Economic Development, Delhi: Pearson
Education.
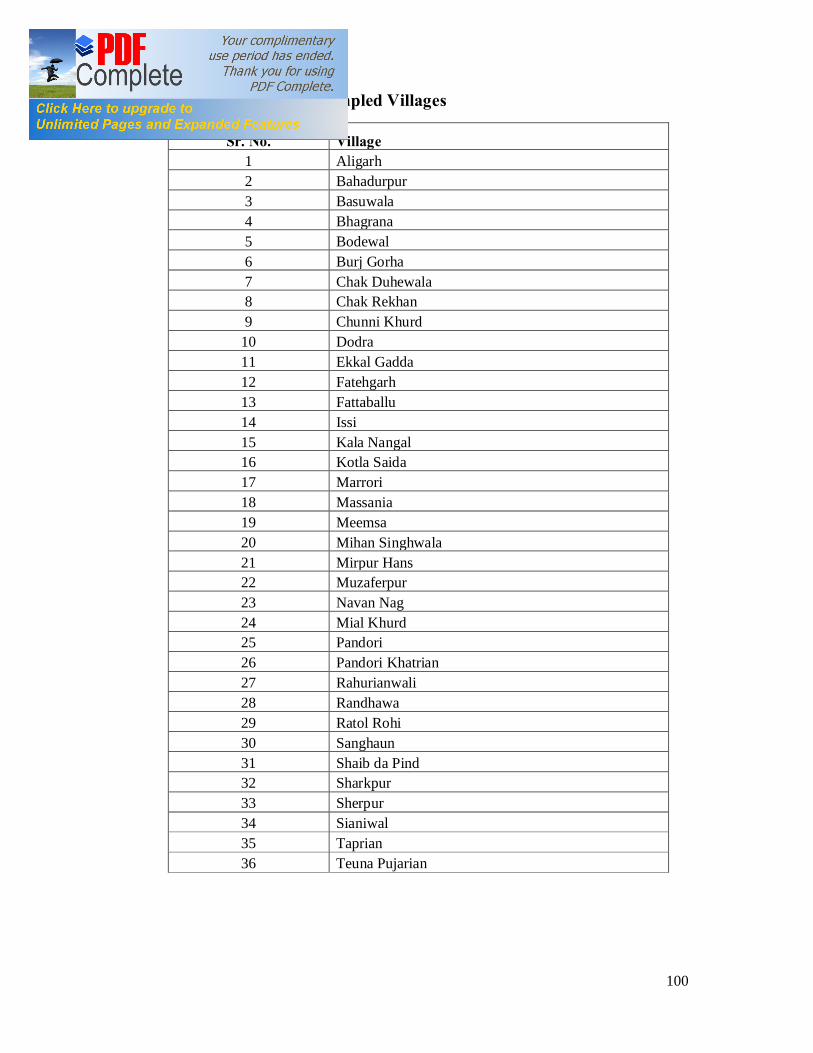
100
Appendix-I: List of Sampled Villages
Sr. No. Village 1 Aligarh 2 Bahadurpur 3 Basuwala 4 Bhagrana 5 Bodewal 6 Burj Gorha 7 Chak Duhewala 8 Chak Rekhan 9 Chunni Khurd
10 Dodra 11 Ekkal Gadda 12 Fatehgarh 13 Fattaballu 14 Issi 15 Kala Nangal 16 Kotla Saida 17 Marrori 18 Massania 19 Meemsa 20 Mihan Singhwala 21 Mirpur Hans 22 Muzaferpur 23 Navan Nag 24 Mial Khurd 25 Pandori 26 Pandori Khatrian 27 Rahurianwali 28 Randhawa 29 Ratol Rohi 30 Sanghaun 31 Shaib da Pind 32 Sharkpur 33 Sherpur 34 Sianiwal 35 Taprian 36 Teuna Pujarian

101
Appendix-II (a): District and Block-wise List of Sampled Villages
District Block Low Developed Village
Medium Developed Village
Highly Developed Village
Amritsar Khadoor Sahib Bodewal Chak Rekhan Ekkal Gadda
Amritsar Majitha Taprian Kotla Saida Navan Nag
Bhatinda Talwandi Sabo Fattaballu Fatehgarh Teuna Pujarian
Fatehgarh Sahib Khera Randhawa Bhagrana Chunni Khurd
Firozepur Zira Mihan Singhwala Ratol Rohi Pandori Khatrian
Gurdaspur Batala Massania Bahadurpur Kala Nangal
Hoshiarpur Mukerian Sherpur Shaib da Pind Pandori
Jalandhar Nakodar Muzaferpur Sharkpur Sianiwal
Ludhiana Jagraon Basuwala Mirpur Hans Aligarh
Mukatsar Mukatsar Rahurianwali Sanghaun Chak Duhewala
Patiala Samana Marrori Dodra Mial Khurd
Sangrur Dhuri Burj Gorha Issi Meemsa

102
Appendix-II (b): Location of Sampled Villages
Village Location
Aligarh 2 kms from Jagraon (Jagraon to Ludhiana road).
Bahadurpur 2 kms from Batala (Batala to Gurdaspur road)
Basuwala 10 kms from Jagraon (Jagraon to Raikot road).
Bhagrana 8 kms from Rajpura (Rajpura to Chuni-Khurd road).
Bodewal 6 kms from Raia (Raia to Khadoor Sahib road via Khalchian).
Burj Gorha 6 kms from Bagrian (Bagrian to Duri road).
Chak Duhewala 8 kms from Muktsar (Muktsar to Malot road).
Chak Rekhan 8 kms from Khadoor Sahib (Khadoor Sahib to Khalchian road).
Chunni Khurd 10 kms from Sirhind.
Dodra 5 kms from Samana (Samana to Bhawanigarh).
Ekkal Gadda 8 kms from Khadoor Sahib (Khadoor Sahib to Khalchian road).
Fatehgarh 4 kms from Talwandi Sabo (Talwandi Sabo to Mansa road).
Fattaballu 12 kms from Talwandi Sabo (Talwandi Sabo to Mansa road).
Issi 8 kms from Dhuri.
Kala Nangal 3 kms from Batala (Batala to Gurdaspur road).
Kotla Saida 2 kms from Kathu Nangal.
Marrori 6 kms from Samana town.
Massania 6 kms from Batala town.
Meemsa 10 kms from Dhuri (Dhuri to Bagrian road).
Mihan Singhwala 6 kms from Zira.
Mirpur Hans 4 kms from Jagraon.
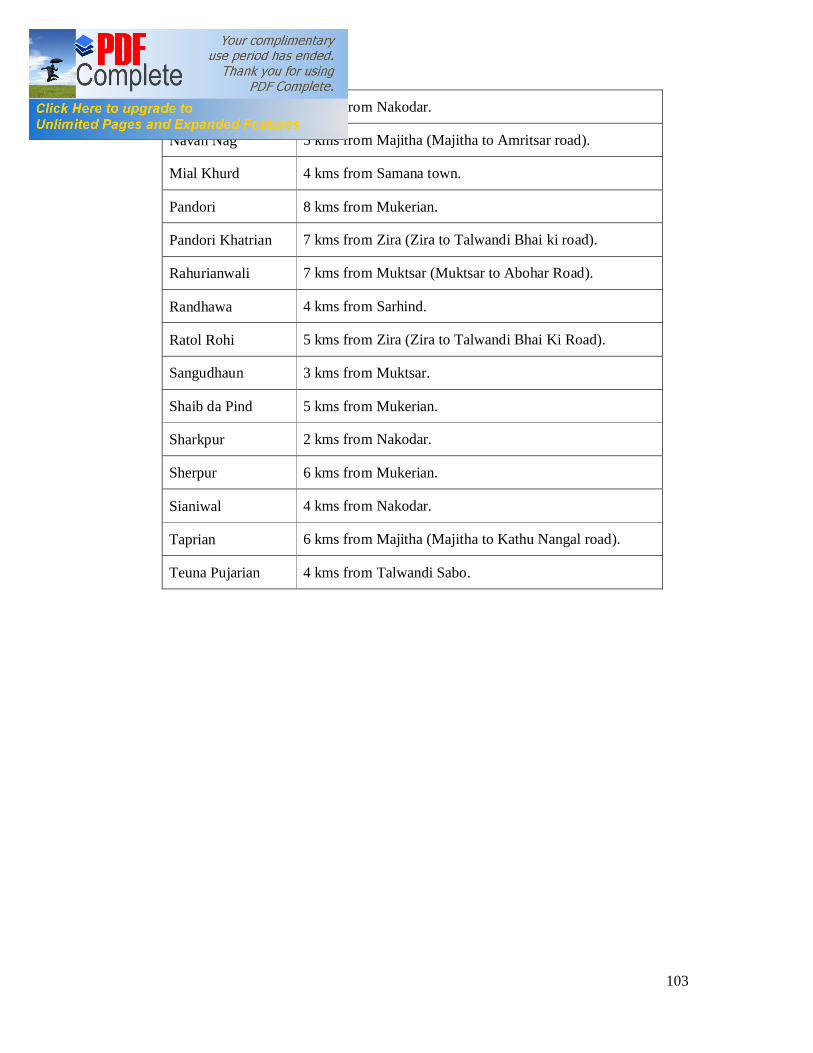
103
Muzaferpur 4 kms from Nakodar.
Navan Nag 5 kms from Majitha (Majitha to Amritsar road).
Mial Khurd 4 kms from Samana town.
Pandori 8 kms from Mukerian.
Pandori Khatrian 7 kms from Zira (Zira to Talwandi Bhai ki road).
Rahurianwali 7 kms from Muktsar (Muktsar to Abohar Road).
Randhawa 4 kms from Sarhind.
Ratol Rohi 5 kms from Zira (Zira to Talwandi Bhai Ki Road).
Sangudhaun 3 kms from Muktsar.
Shaib da Pind 5 kms from Mukerian.
Sharkpur 2 kms from Nakodar.
Sherpur 6 kms from Mukerian.
Sianiwal 4 kms from Nakodar.
Taprian 6 kms from Majitha (Majitha to Kathu Nangal road).
Teuna Pujarian 4 kms from Talwandi Sabo.
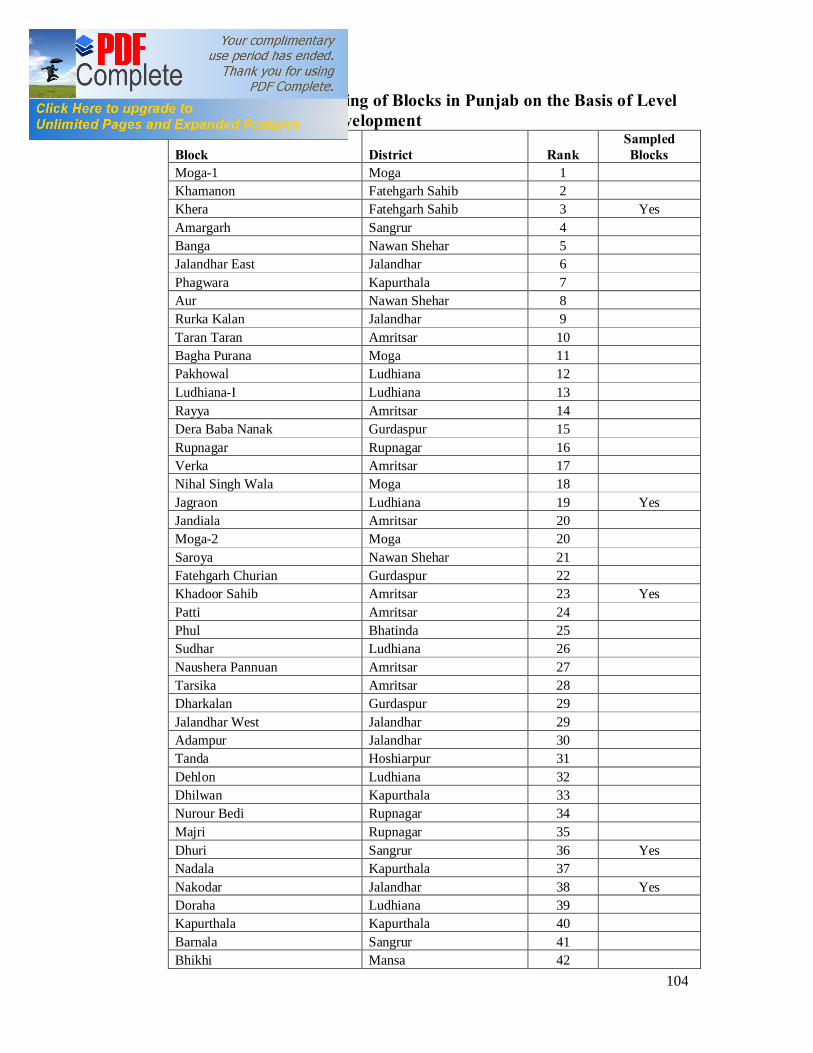
104
Appendix-III: Ranking of Blocks in Punjab on the Basis of Level of Development
Block District Rank Sampled Blocks
Moga-1 Moga 1 Khamanon Fatehgarh Sahib 2 Khera Fatehgarh Sahib 3 Yes Amargarh Sangrur 4 Banga Nawan Shehar 5 Jalandhar East Jalandhar 6 Phagwara Kapurthala 7 Aur Nawan Shehar 8 Rurka Kalan Jalandhar 9 Taran Taran Amritsar 10 Bagha Purana Moga 11 Pakhowal Ludhiana 12 Ludhiana-I Ludhiana 13 Rayya Amritsar 14 Dera Baba Nanak Gurdaspur 15 Rupnagar Rupnagar 16 Verka Amritsar 17 Nihal Singh Wala Moga 18 Jagraon Ludhiana 19 Yes Jandiala Amritsar 20 Moga-2 Moga 20 Saroya Nawan Shehar 21 Fatehgarh Churian Gurdaspur 22 Khadoor Sahib Amritsar 23 Yes Patti Amritsar 24 Phul Bhatinda 25 Sudhar Ludhiana 26 Naushera Pannuan Amritsar 27 Tarsika Amritsar 28 Dharkalan Gurdaspur 29 Jalandhar West Jalandhar 29 Adampur Jalandhar 30 Tanda Hoshiarpur 31 Dehlon Ludhiana 32 Dhilwan Kapurthala 33 Nurour Bedi Rupnagar 34 Majri Rupnagar 35 Dhuri Sangrur 36 Yes Nadala Kapurthala 37 Nakodar Jalandhar 38 Yes Doraha Ludhiana 39 Kapurthala Kapurthala 40 Barnala Sangrur 41 Bhikhi Mansa 42
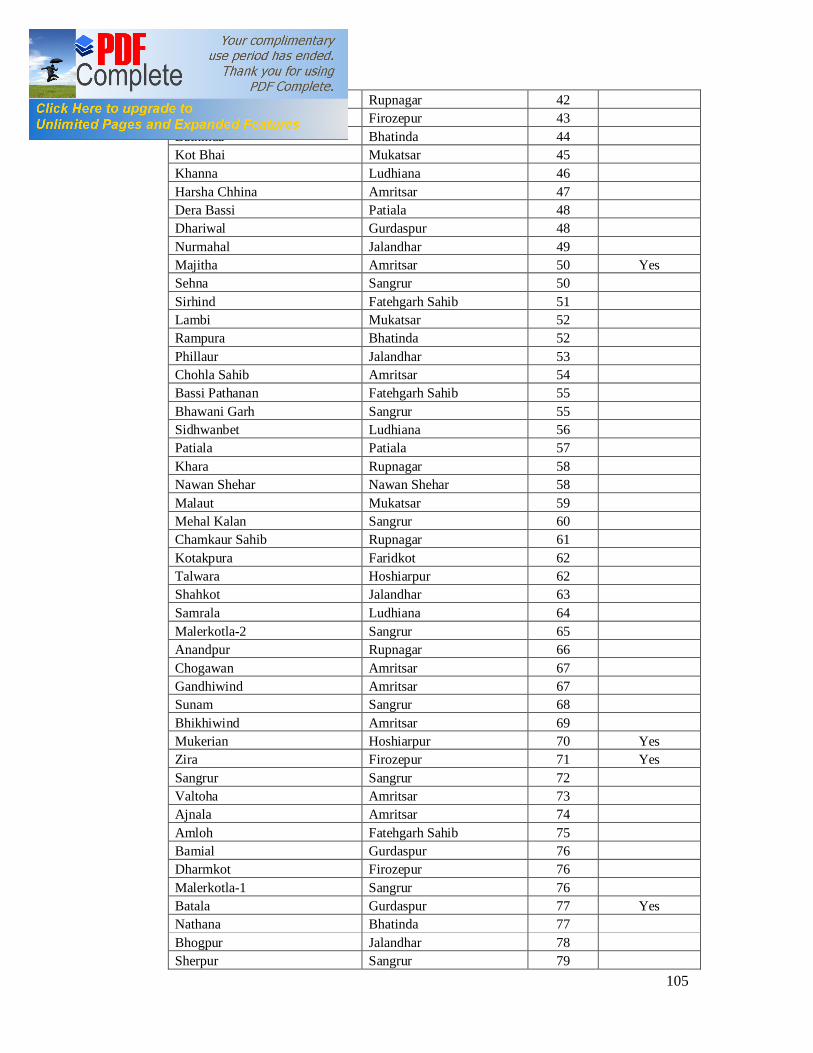
105
Morinda Rupnagar 42 Ghalkhurd Firozepur 43 Bathinda Bhatinda 44 Kot Bhai Mukatsar 45 Khanna Ludhiana 46 Harsha Chhina Amritsar 47 Dera Bassi Patiala 48 Dhariwal Gurdaspur 48 Nurmahal Jalandhar 49 Majitha Amritsar 50 Yes Sehna Sangrur 50 Sirhind Fatehgarh Sahib 51 Lambi Mukatsar 52 Rampura Bhatinda 52 Phillaur Jalandhar 53 Chohla Sahib Amritsar 54 Bassi Pathanan Fatehgarh Sahib 55 Bhawani Garh Sangrur 55 Sidhwanbet Ludhiana 56 Patiala Patiala 57 Khara Rupnagar 58 Nawan Shehar Nawan Shehar 58 Malaut Mukatsar 59 Mehal Kalan Sangrur 60 Chamkaur Sahib Rupnagar 61 Kotakpura Faridkot 62 Talwara Hoshiarpur 62 Shahkot Jalandhar 63 Samrala Ludhiana 64 Malerkotla-2 Sangrur 65 Anandpur Rupnagar 66 Chogawan Amritsar 67 Gandhiwind Amritsar 67 Sunam Sangrur 68 Bhikhiwind Amritsar 69 Mukerian Hoshiarpur 70 Yes Zira Firozepur 71 Yes Sangrur Sangrur 72 Valtoha Amritsar 73 Ajnala Amritsar 74 Amloh Fatehgarh Sahib 75 Bamial Gurdaspur 76 Dharmkot Firozepur 76 Malerkotla-1 Sangrur 76 Batala Gurdaspur 77 Yes Nathana Bhatinda 77 Bhogpur Jalandhar 78 Sherpur Sangrur 79

106
Khuianserver Firozepur 80 Lohian Khas Jalandhar 81 Sultanpur Lodhi Kapurthala 82 Machhiwara Ludhiana 83 Shri Hargobindpur Gurdaspur 84 Lehra Gaga Sangrur 85 Balachaur Nawan Shehar 86 Dasuya Hoshiarpur 87 Mukatsar Mukatsar 88 Yes Hoshiarpur-I Hoshiarpur 89 Garhshankar Hoshiarpur 90 Kalanaur Gurdaspur 90 Sangat Bhatinda 90 Faridkot Faridkot 91 Bhunerheri Patiala 92 Nabha Patiala 93 Hoshiarpur-II Hoshiarpur 94 Dinanagar Gurdaspur 95 Samana Patiala 96 Yes Qadian Gurdaspur 97 Gurdaspur Gurdaspur 98 Ghanaur Patiala 99 Ludhiana-II Ludhiana 100 Mahilpur Hoshiarpur 101 Talwandi Sabo Bhatinda 102 Yes Rajpura Patiala 103 Andana Sangrur 104 Bhunga Hoshiarpur 105 Mour Bhatinda 106 Fazilka Firozepur 107 Abohar Firozepur 108 Hazipur Hoshiarpur 109 Budhlada Mansa 110 Jalalabad Firozepur 111 Sanaur Patiala 112 Mansa Mansa 113 Makhu Firozepur 114 Mamdot Firozepur 115 Kahnuwan Gurdaspur 116 Jhunir Mansa 117 Narot Jaimal Singh Gurdaspur 117 Gurur Har Sahai Firozepur 118 Pathankot Gurdaspur 119 Sardulgarh Mansa 120 Patran Patiala 121 Ferozpur Firozepur 122
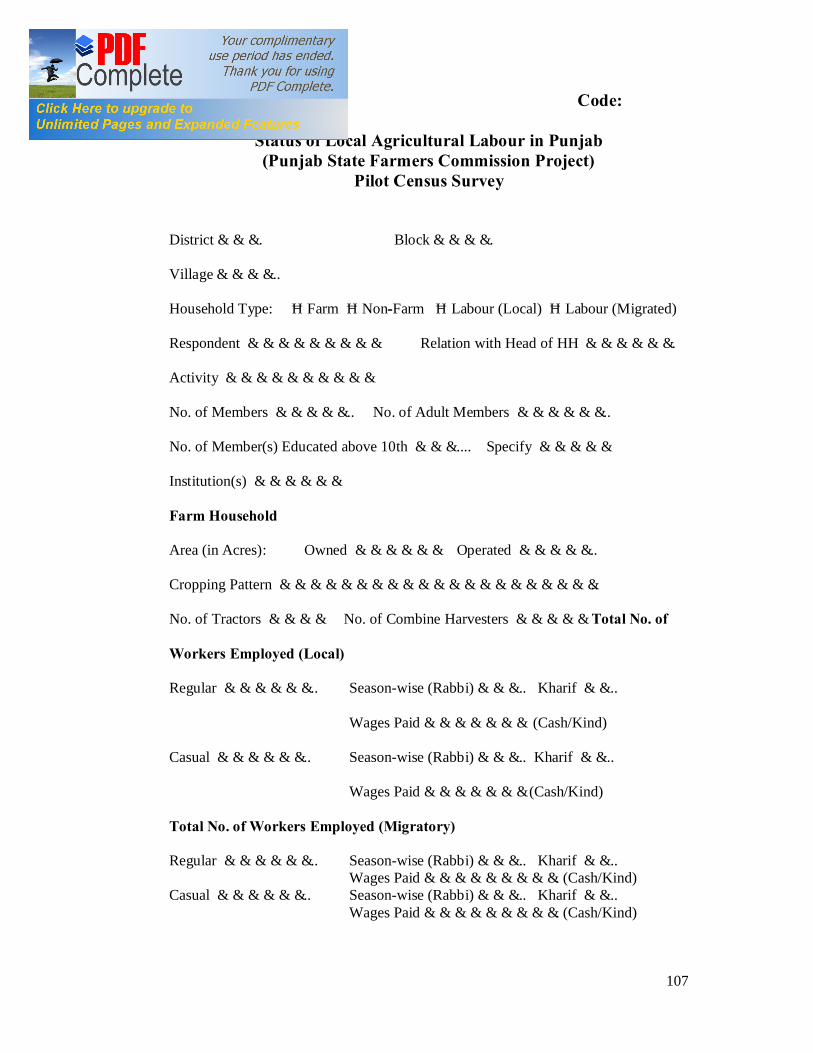
107
Appendix-IV Code: ………
Status of Local Agricultural Labour in Punjab (Punjab State Farmers Commission Project)
Pilot Census Survey
District………. Block………….
Village…………..
Household Type: Farm Non-Farm Labour (Local) Labour (Migrated)
Respondent ……………………… Relation with Head of HH ……………….
Activity …………………………
No. of Members …………….. No. of Adult Members ………………..
No. of Member(s) Educated above 10th ……….... Specify ……………
Institution(s) ………………
Farm Household
Area (in Acres): Owned ……………… Operated ……………..
Cropping Pattern ………………………………………………………..
No. of Tractors ………… No. of Combine Harvesters …………… Total No. of
Workers Employed (Local)
Regular ……………….. Season-wise (Rabbi)……….. Kharif ……..
Wages Paid………………… (Cash/Kind)
Casual ……………….. Season-wise (Rabbi)……….. Kharif ……..
Wages Paid………………… (Cash/Kind)
Total No. of Workers Employed (Migratory)
Regular ……………….. Season-wise (Rabbi)……….. Kharif …….. Wages Paid………………………. (Cash/Kind)
Casual ……………….. Season-wise (Rabbi)……….. Kharif …….. Wages Paid………………………. (Cash/Kind)
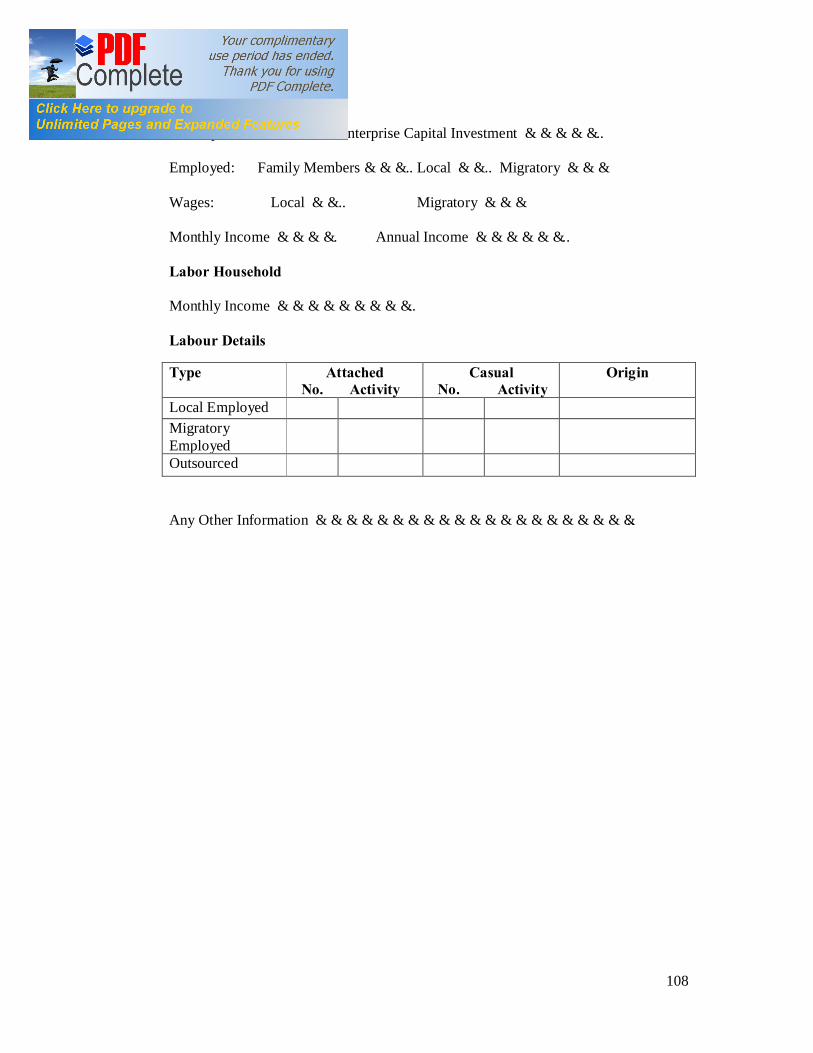
108
Non-Farm Household
Activity ……………….. Enterprise Capital Investment ……………..
Employed: Family Members……….. Local …….. Migratory ………
Wages: Local …….. Migratory ………
Monthly Income …………. Annual Income ………………..
Labor Household
Monthly Income ………………………..
Labour Details
Any Other Information ………………………………………………………..
Type Attached No. Activity
Casual No. Activity
Origin
Local Employed Migratory Employed
Outsourced
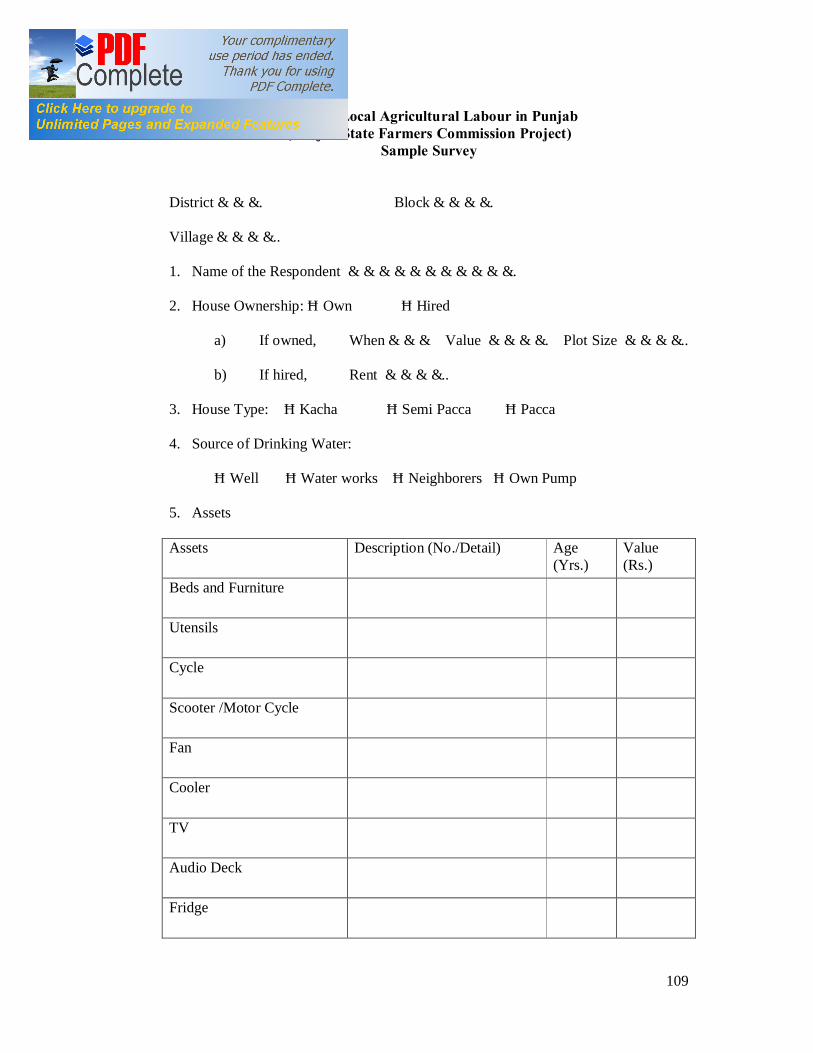
109
Code: ……… Status of Local Agricultural Labour in Punjab (Punjab State Farmers Commission Project)
Sample Survey
District………. Block………….
Village…………..
1. Name of the Respondent ……………………………..
2. House Ownership: Own Hired
a) If owned, When……… Value …………. Plot Size …………..
b) If hired, Rent …………..
3. House Type: Kacha Semi Pacca Pacca
4. Source of Drinking Water:
Well Water works Neighborers Own Pump
5. Assets
Assets Description (No./Detail) Age (Yrs.)
Value (Rs.)
Beds and Furniture
Utensils
Cycle
Scooter /Motor Cycle
Fan
Cooler
TV
Audio Deck
Fridge
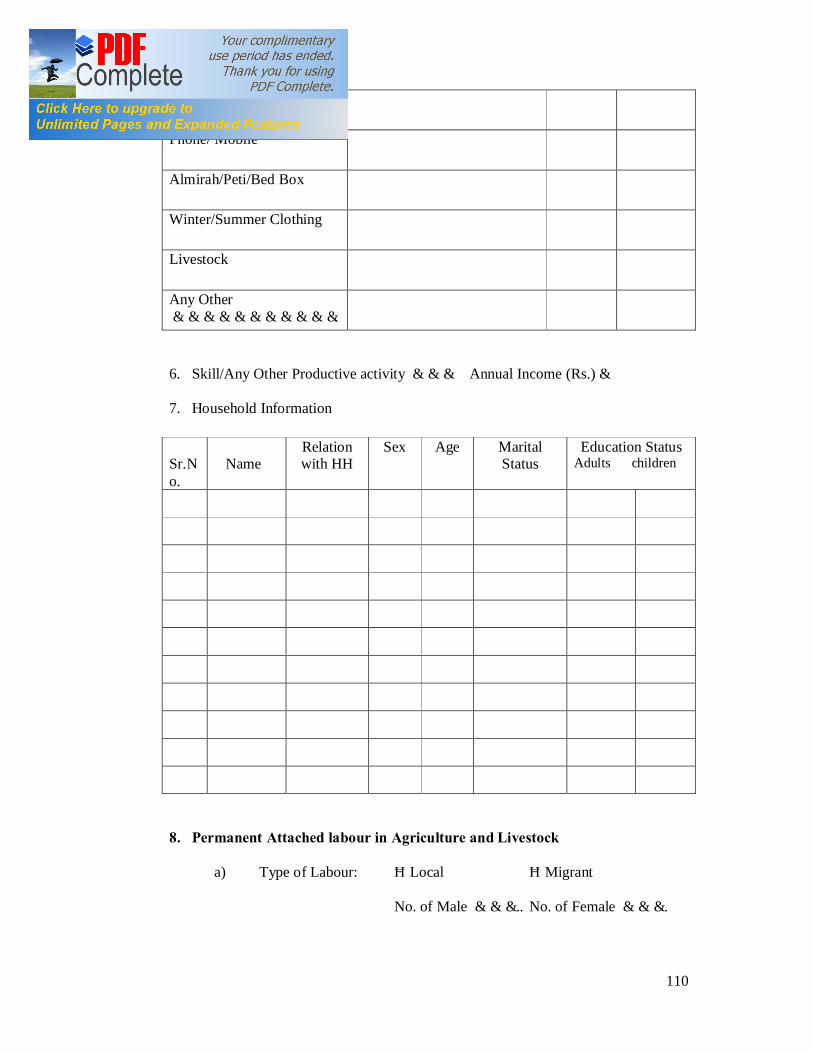
110
Gas/ Stove/Chulla
Phone/ Mobile
Almirah/Peti/Bed Box
Winter/Summer Clothing
Livestock
Any Other …………………………….
6. Skill/Any Other Productive activity ……… Annual Income (Rs.)…
7. Household Information
8. Permanent Attached labour in Agriculture and Livestock
a) Type of Labour: Local Migrant
No. of Male ……….. No. of Female ……….
Sr.No. Name
Relation with HH
Sex Age Marital Status
Education Status Adults children
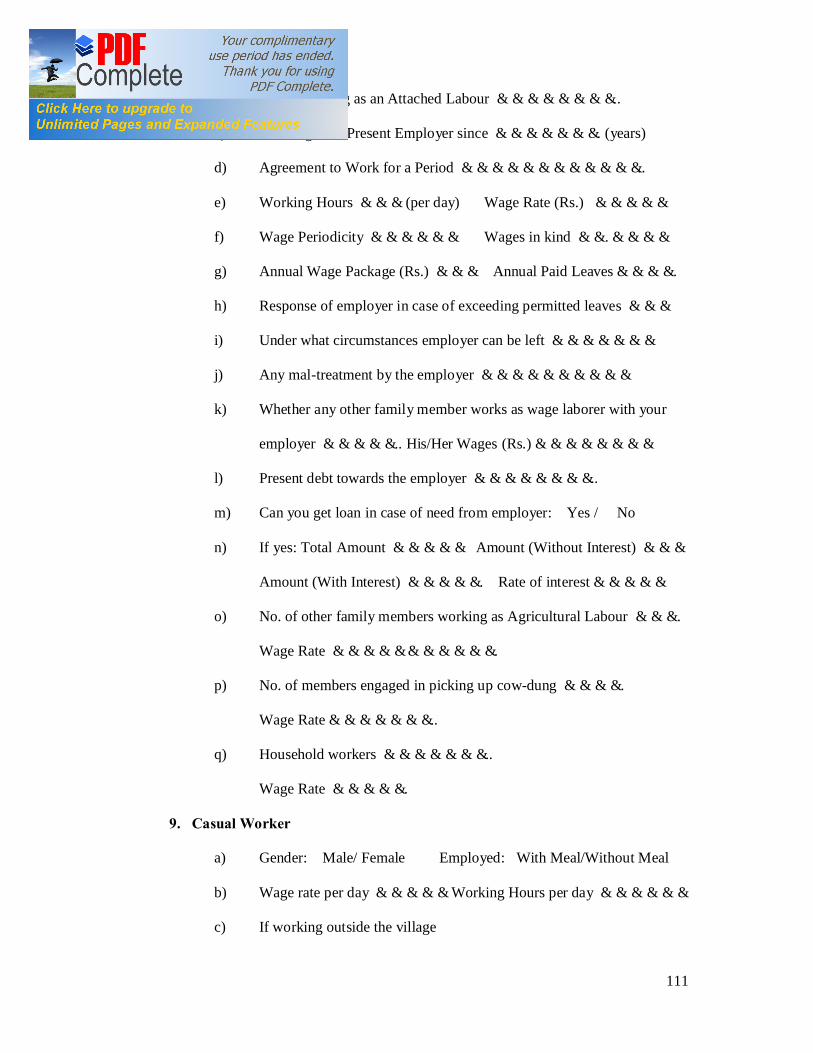
111
b) Age at Starting as an Attached Labour ……………………..
c) Working with Present Employer since …………………. (years)
d) Agreement to Work for a Period ………………………………..
e) Working Hours ……… (per day) Wage Rate (Rs.) ……………
f) Wage Periodicity ……………… Wages in kind …….…………
g) Annual Wage Package (Rs.) ……… Annual Paid Leaves………….
h) Response of employer in case of exceeding permitted leaves ………
i) Under what circumstances employer can be left …………………
j) Any mal-treatment by the employer …………………………
k) Whether any other family member works as wage laborer with your
employer …………….. His/Her Wages (Rs.)……………………
l) Present debt towards the employer ……………………..
m) Can you get loan in case of need from employer: Yes / No
n) If yes: Total Amount …………… Amount (Without Interest) ………
Amount (With Interest) ……………. Rate of interest……………
o) No. of other family members working as Agricultural Labour ……….
Wage Rate …………………………….
p) No. of members engaged in picking up cow-dung ………….
Wage Rate…………………..
q) Household workers …………………..
Wage Rate …………….
9. Casual Worker
a) Gender: Male/ Female Employed: With Meal/Without Meal
b) Wage rate per day …………… Working Hours per day ………………
c) If working outside the village
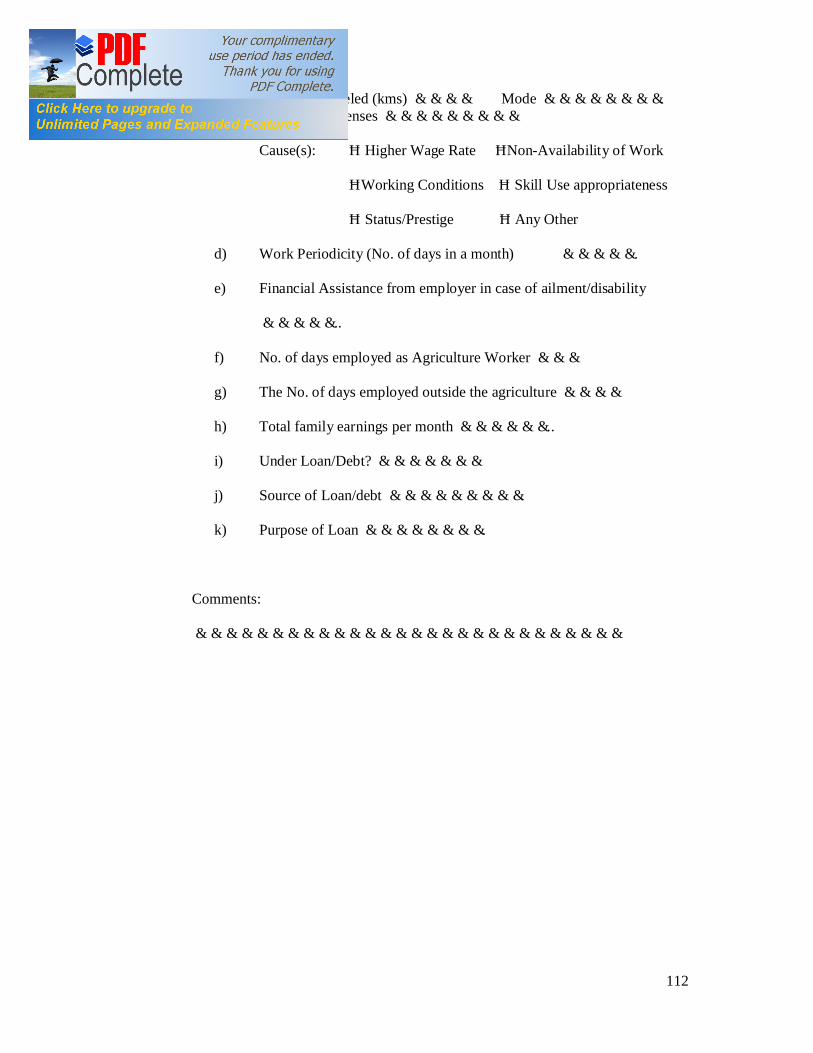
112
Distance Traveled (kms) ………… Mode ……………………. Traveling Expenses ………………………
Cause(s): Higher Wage Rate Non-Availability of Work
Working Conditions Skill Use appropriateness
Status/Prestige Any Other
d) Work Periodicity (No. of days in a month) …………….
e) Financial Assistance from employer in case of ailment/disability
……………..
f) No. of days employed as Agriculture Worker ………
g) The No. of days employed outside the agriculture …………
h) Total family earnings per month ………………..
i) Under Loan/Debt? …………………
j) Source of Loan/debt ……………………….
k) Purpose of Loan …………………….
Comments:
………………………………………………………………………….


![THE PUNJAB LABOUR WELFARE FUND ACT, 1965. · 1965 : Pb. Act 17] LABOUR WELFARE FUND THE PUNJAB LABOUR WELFARE FUND ACT, 1965. ( As amended upto 11th April, 2012) Arrangement of Sections](https://img.pdfslide.us/doc/110x75/5b909de009d3f2e6728c5cab/the-punjab-labour-welfare-fund-act-1965-1965-pb-act-17-labour-welfare.jpg)