Embed Size (px)
Citation preview
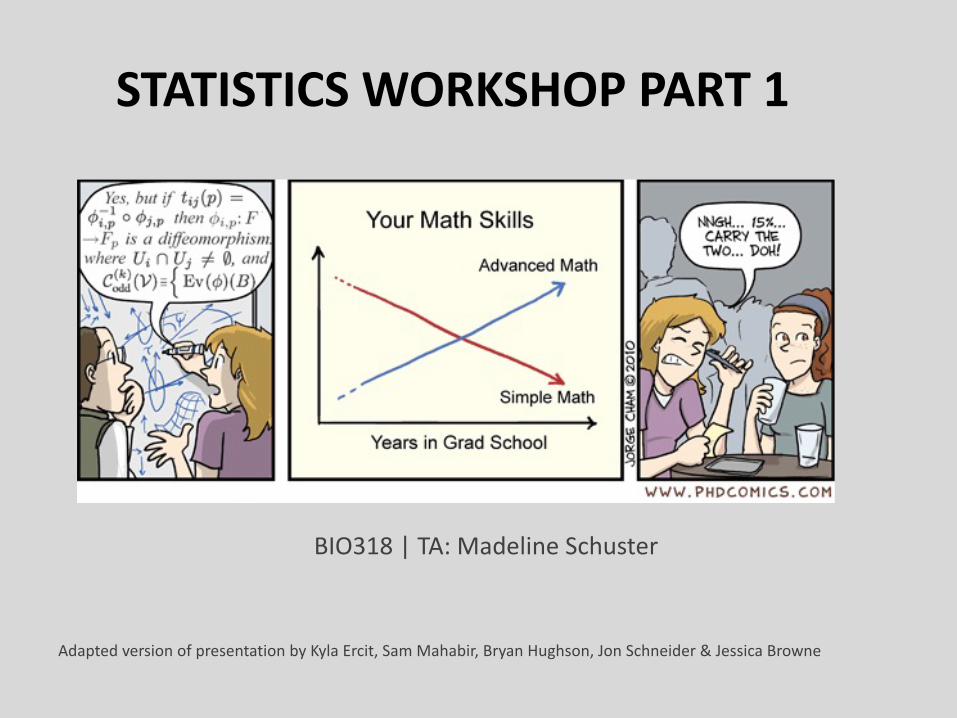
STATISTICS WORKSHOP PART 1
BIO318 | TA: Madeline Schuster
Adapted version of presentation by Kyla Ercit, Sam Mahabir, Bryan Hughson, Jon Schneider & Jessica Browne
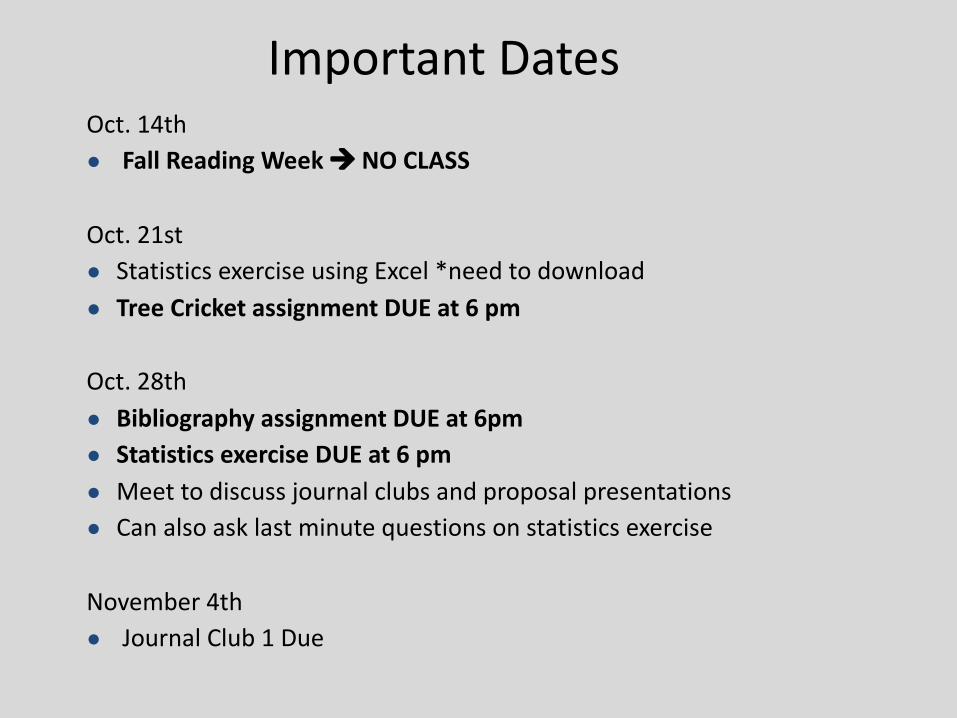
Important DatesOct. 14th● Fall Reading Week à NO CLASS
Oct. 21st● Statistics exercise using Excel *need to download ● Tree Cricket assignment DUE at 6 pm
Oct. 28th● Bibliography assignment DUE at 6pm● Statistics exercise DUE at 6 pm● Meet to discuss journal clubs and proposal presentations● Can also ask last minute questions on statistics exercise
November 4th● Journal Club 1 Due
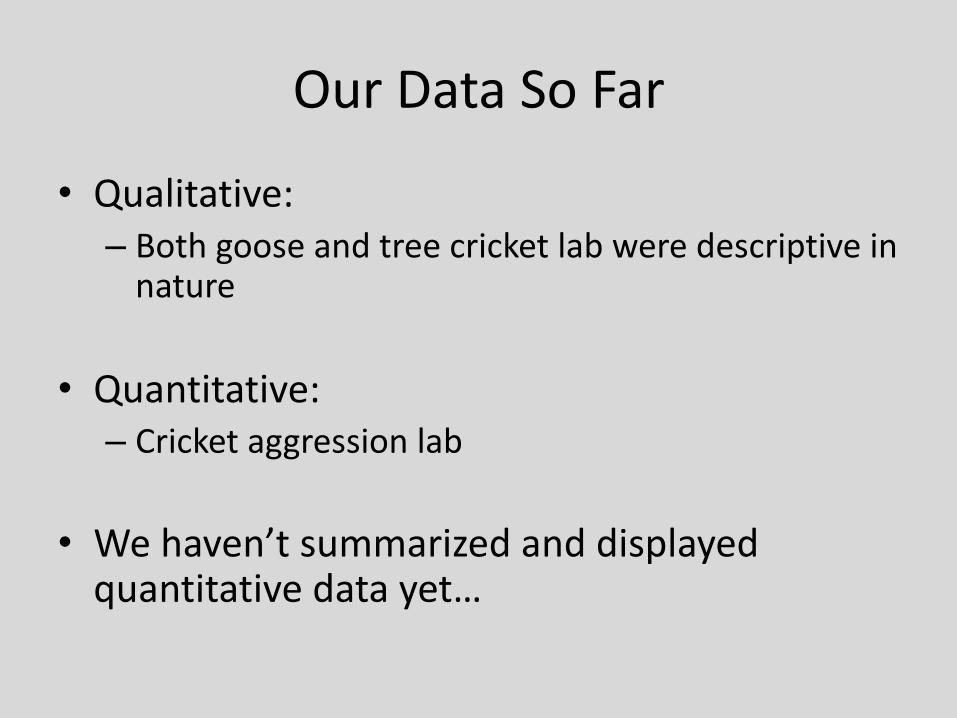
Our Data So Far
• Qualitative:– Both goose and tree cricket lab were descriptive in
nature
• Quantitative:– Cricket aggression lab
• We haven’t summarized and displayed quantitative data yet…
Stats Time!
Why Do We Need Stats?
• Organize and display raw data
• Make comparisons and interpret findings
• Draw scientifically relevant conclusions
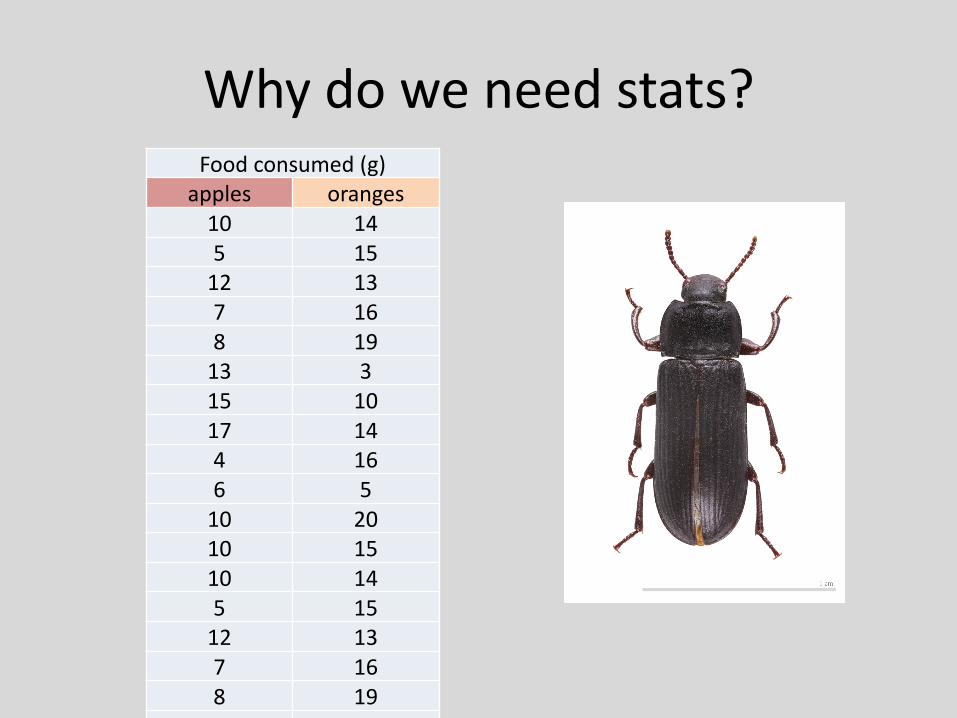
Why do we need stats?Food consumed (g)
apples oranges10 145 15
12 137 168 19
13 315 1017 144 166 5
10 2010 1510 145 15
12 137 168 19
13 3
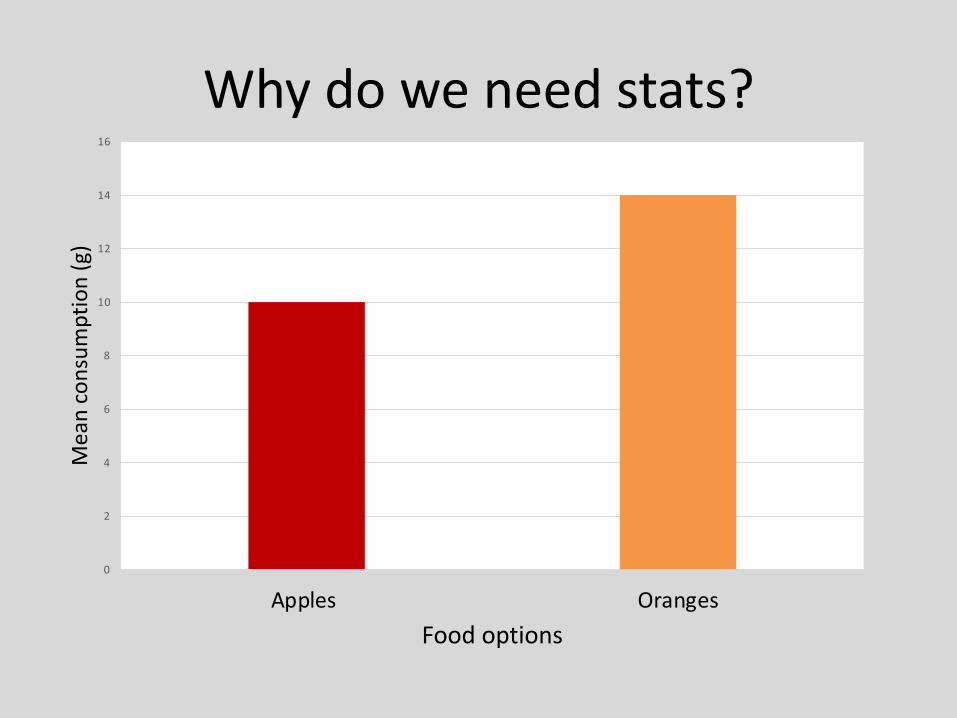
Why do we need stats?
0
2
4
6
8
10
12
14
16
Apples Oranges
Mea
n co
nsum
ptio
n (g
)
Food options
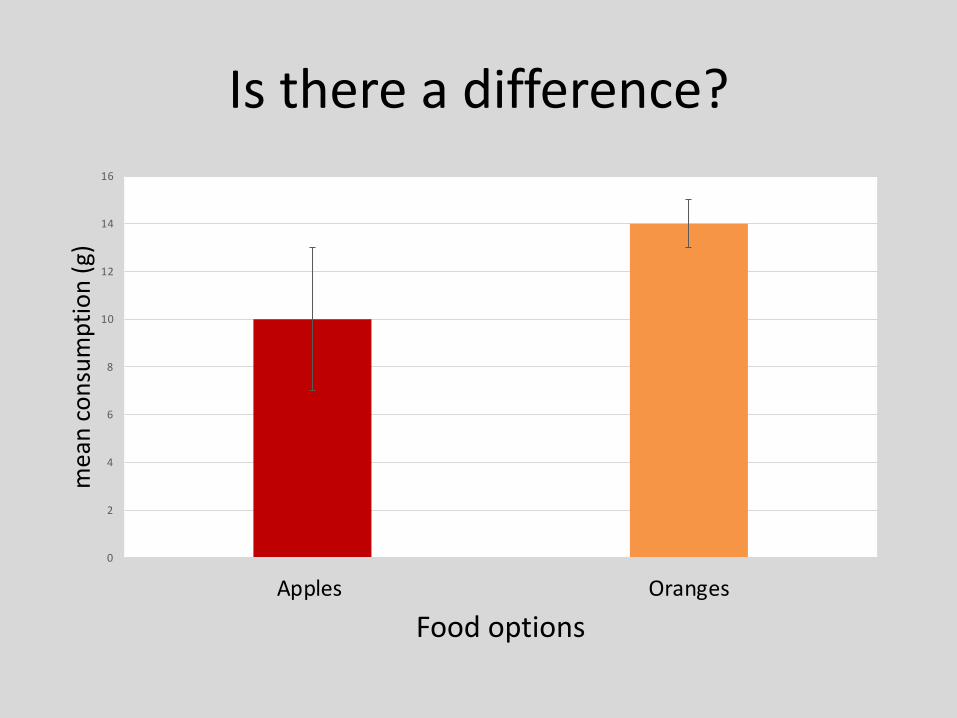
Is there a difference?
0
2
4
6
8
10
12
14
16
Apples Oranges
mea
n co
nsum
ptio
n (g
)
Food options
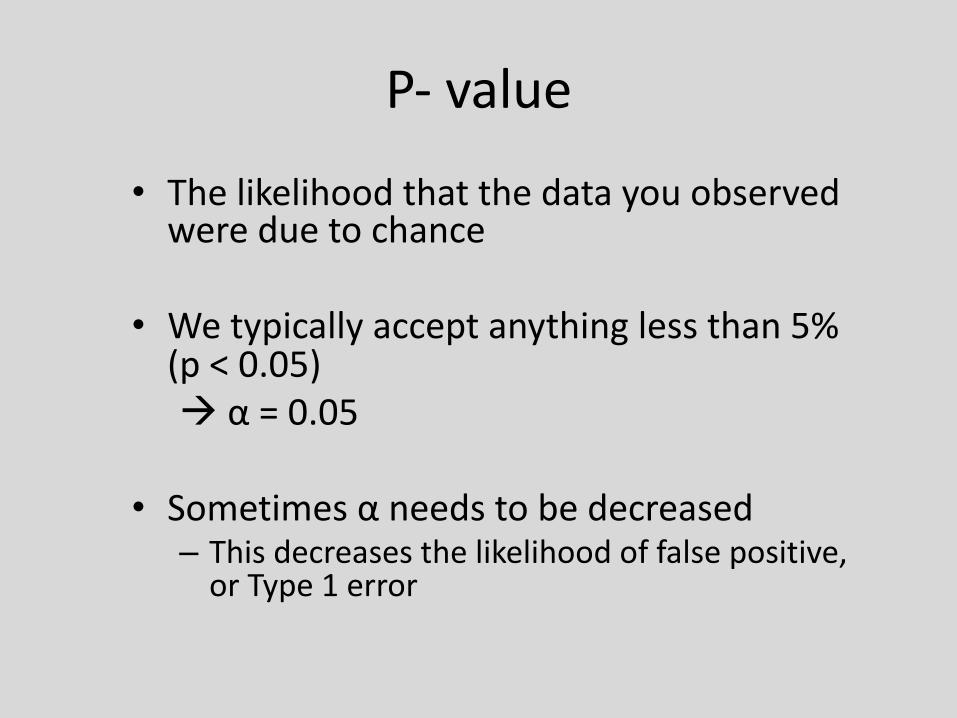
P- value
• The likelihood that the data you observed were due to chance
• We typically accept anything less than 5% (p < 0.05)à α = 0.05
• Sometimes α needs to be decreased– This decreases the likelihood of false positive,
or Type 1 error
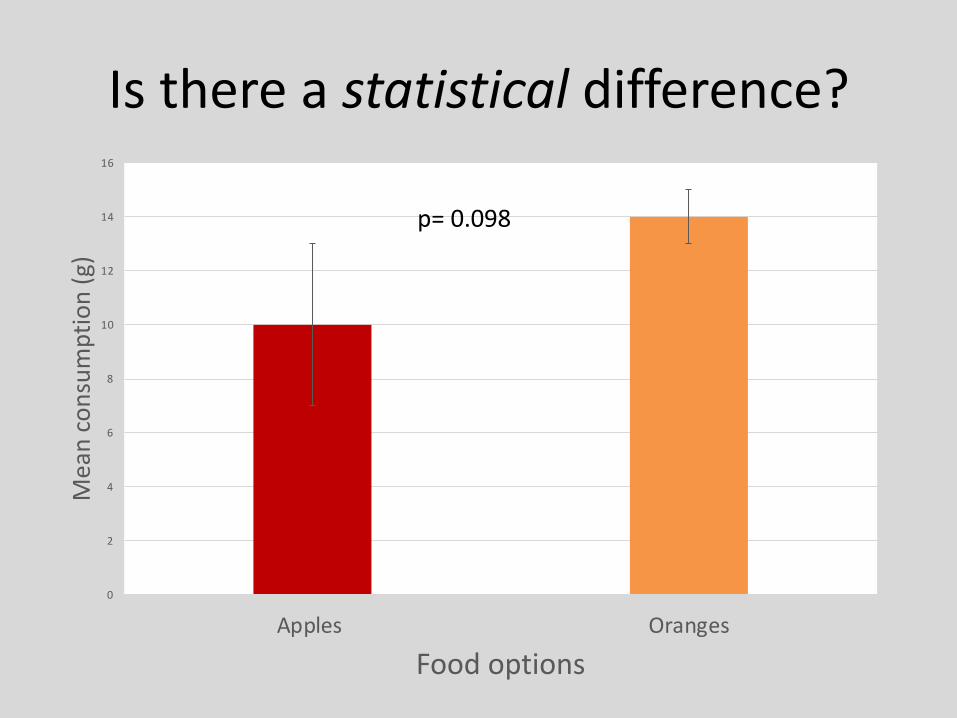
Is there a statistical difference?
0
2
4
6
8
10
12
14
16
Apples Oranges
Mea
n co
nsum
ptio
n (g
)
Food options
p= 0.098
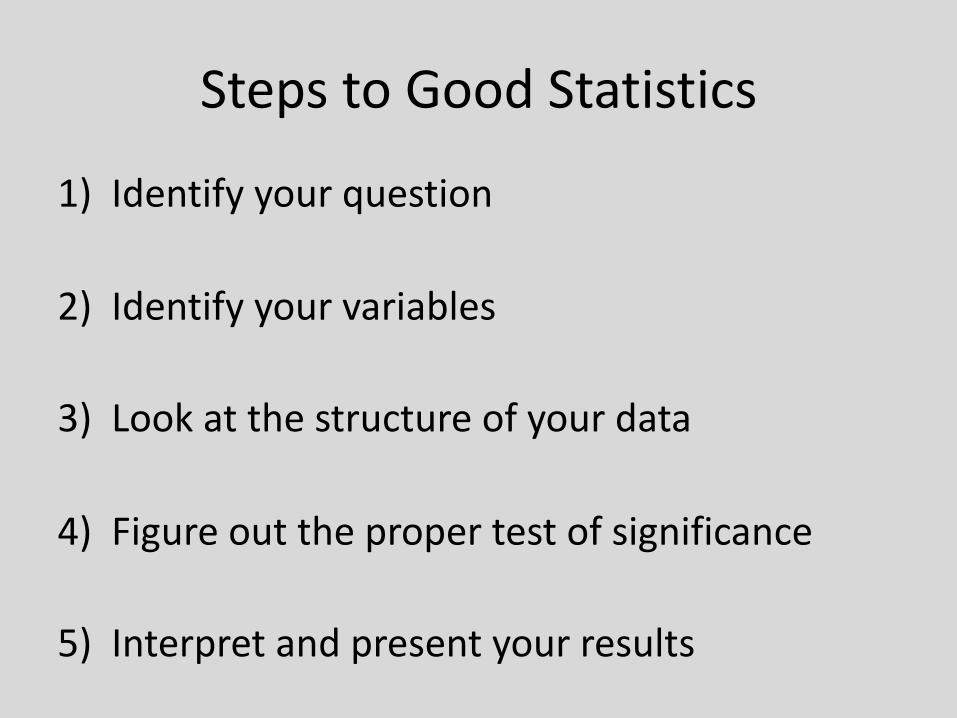
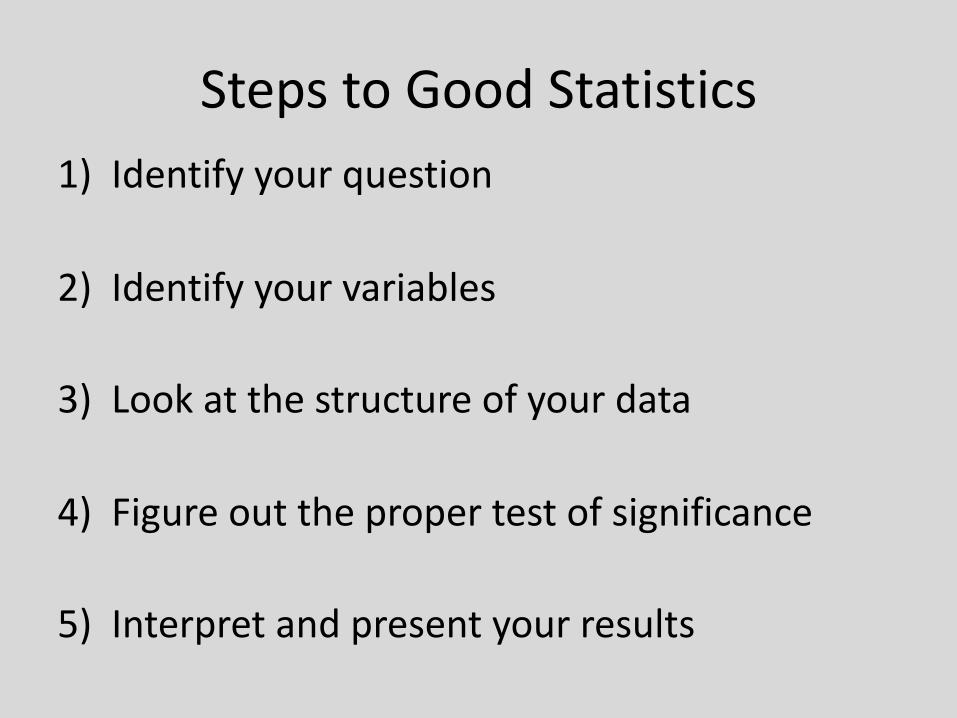
Steps to Good Statistics
1) Identify your question
2) Identify your variables
3) Look at the structure of your data
4) Figure out the proper test of significance
5) Interpret and present your results
1) Identify your question
2) Identify your variables
3) Look at the structure of your data
4) Figure out the proper test of significance
5) Interpret and present your results
Steps to Good Statistics
Identify the Question
• Consider the type of data you have (ie: averages, counts, co-varying factors, discrete data, continuous data, etc.)
• What am I asking statistically:– A difference in means between two treatments?– A difference in proportions/occurrence between two
treatments?– A relationship between two variables?
• How does B change as A increases?
Identify the Question
• Example:– Do cockroaches on diet A gain more weight than
cockroaches on diet B?
• The Statistical Question:– Is there a difference in mean weight between
cockroaches on diet A vs. cockroaches on diet B?• Difference in means
Identify the Question
• Example:– Do lions eat more prey in summer compared to
winter months?
• The Statistical Question:– Is there a difference in the sum of prey consumed
in summer compared to winter?• Difference in proportion/occurrence
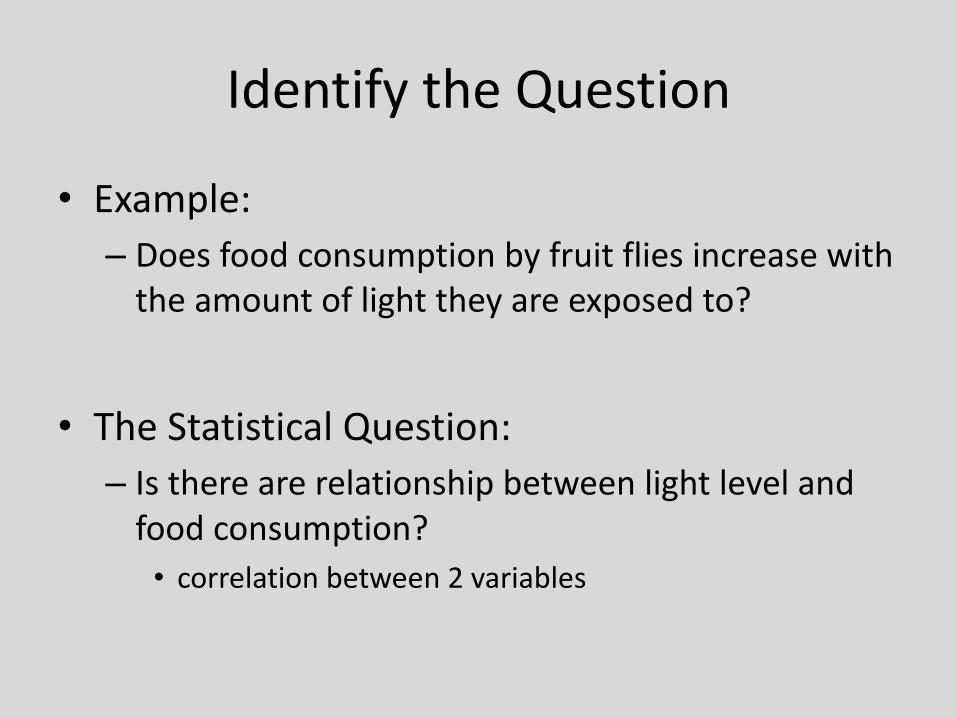
Identify the Question
• Example:– Does food consumption by fruit flies increase with
the amount of light they are exposed to?
• The Statistical Question:– Is there are relationship between light level and
food consumption?• correlation between 2 variables
1) Identify your question
2) Identify your variables
3) Look at the structure of your data
4) Figure out the proper test of significance
5) Interpret and present your results
Steps to Good Statistics
Identify the Variables• Which variable is:– Dependent à what you measure in the experiment,
presumably what is affected.• Response variable• Often a measure of behavioral response
– Independent à variable you have manipulated for your experiment• Explanatory variable• This is your “treatment”
• How many of each kind of variable do you have?
Identify the Variables• Which variable is:– Dependent à what you measure in the experiment,
presumably what is affected.• Response variable• Often a measure of behavioral response
– Independent à variable you have manipulated for your experiment• Explanatory/ Predictor variable• This is your “treatment”
• How many of each kind of variable do you have?
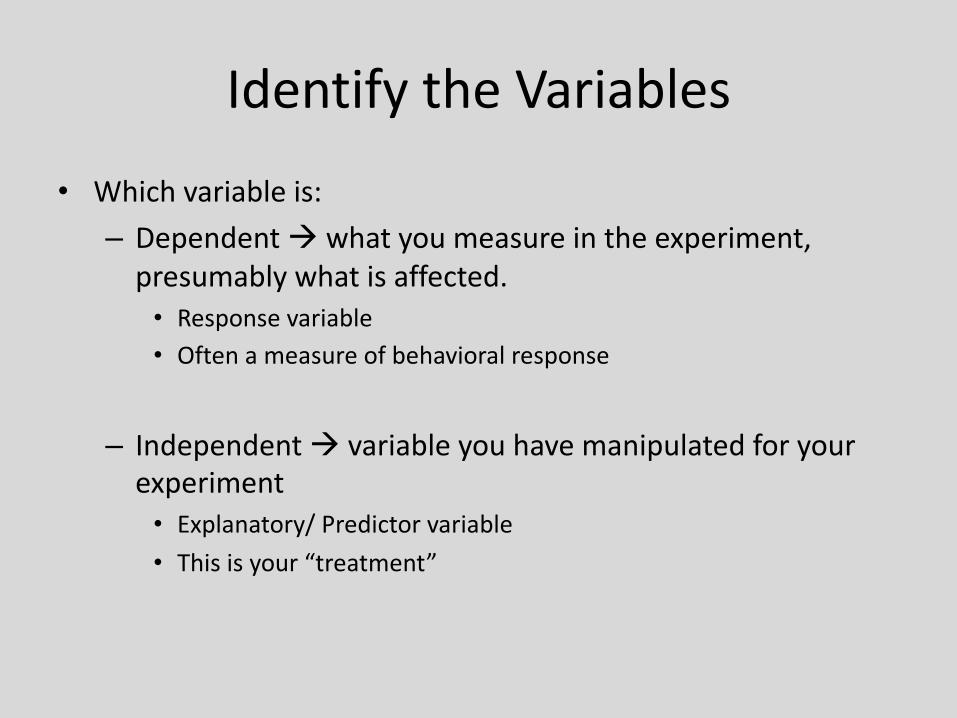
Identify the Variables
• Which variable is:– Dependent à what you measure in the experiment,
presumably what is affected.• Response variable• Often a measure of behavioral response
– Independent à variable you have manipulated for your experiment• Explanatory/ Predictor variable• This is your “treatment”
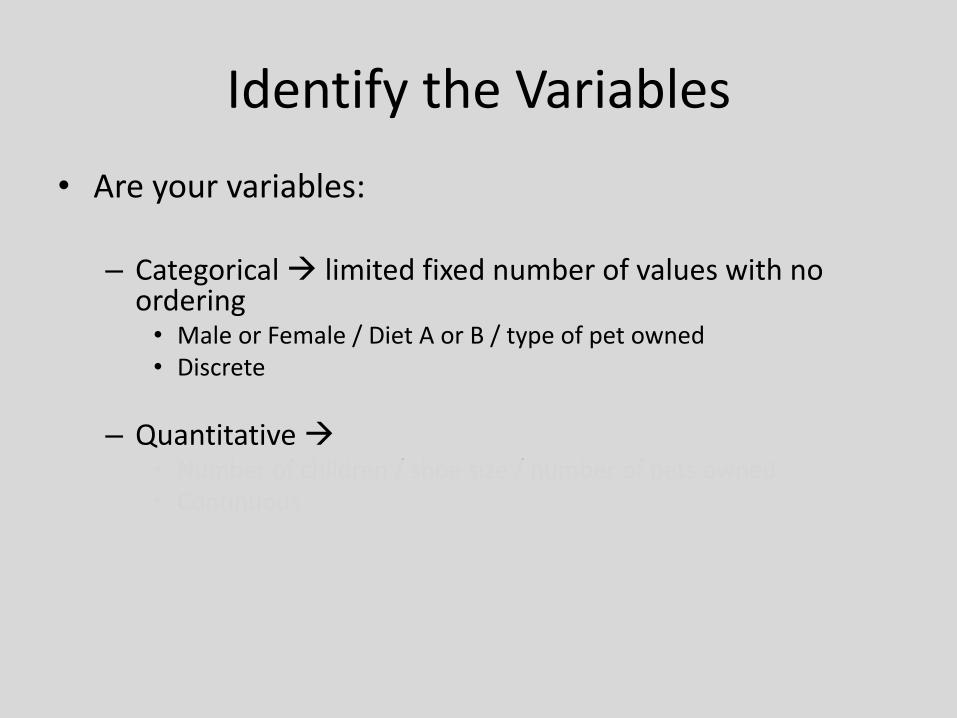
Identify the Variables• Are your variables:
– Categorical à limited fixed number of values with no ordering• Male or Female / Diet A or B / type of pet owned• Discrete
– Quantitative à measured on a numeric scale• Number of children / shoe size / number of pets owned• Continuous
• How many of each kind of variable do you have?
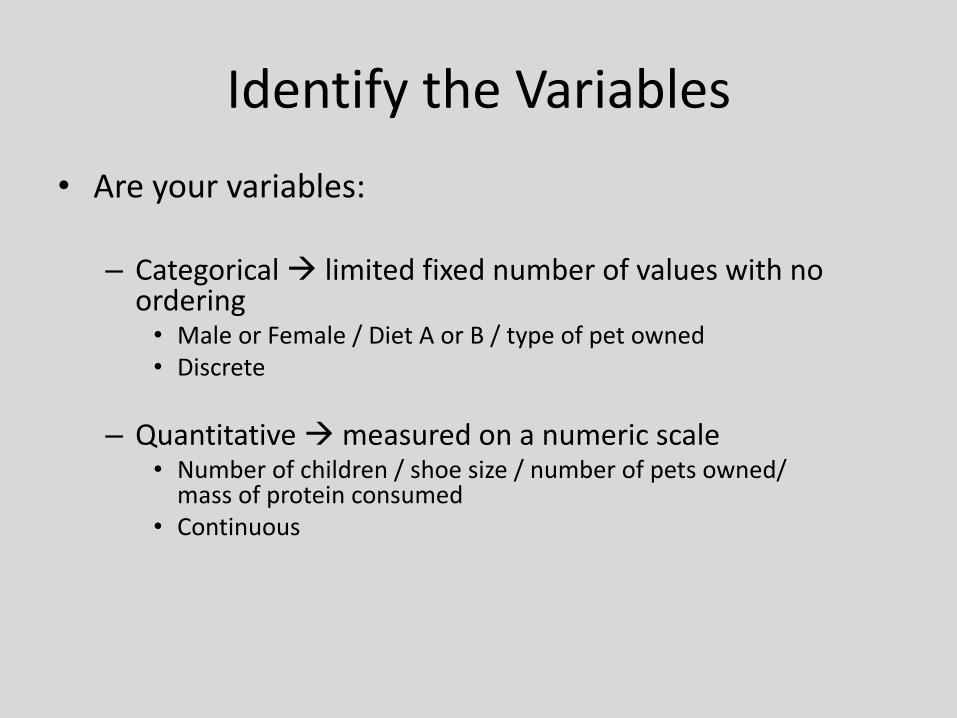
Identify the Variables• Are your variables:
– Categorical à limited fixed number of values with no ordering• Male or Female / Diet A or B / type of pet owned• Discrete
– Quantitative à measured on a numeric scale• Number of children / shoe size / number of pets owned/
mass of protein consumed• Continuous
• How many of each kind of variable do you have?
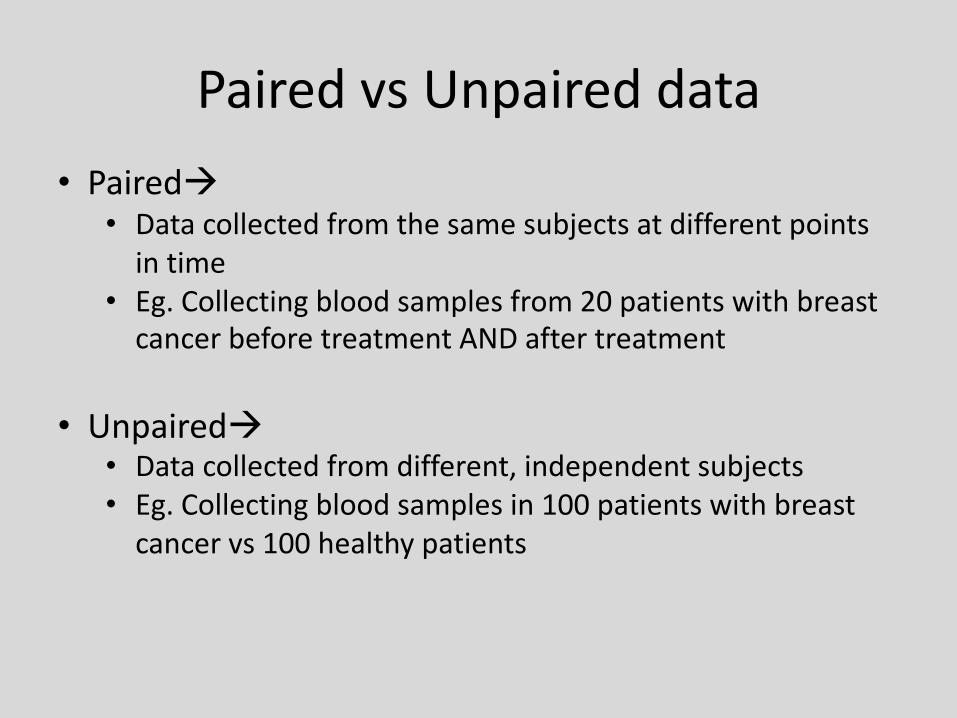
Paired vs Unpaired data• Pairedà• Data collected from the same subjects at different points
in time• Eg. Collecting blood samples from 20 patients with breast
cancer before treatment AND after treatment
• Unpairedà• Data collected from different, independent subjects• Eg. Collecting blood samples in 100 patients with breast
cancer vs 100 healthy patients
1) Identify your question
2) Identify your variables
3) Look at the structure of your data
4) Figure out the proper test of significance
5) Interpret and present your results
Steps to Good Statistics
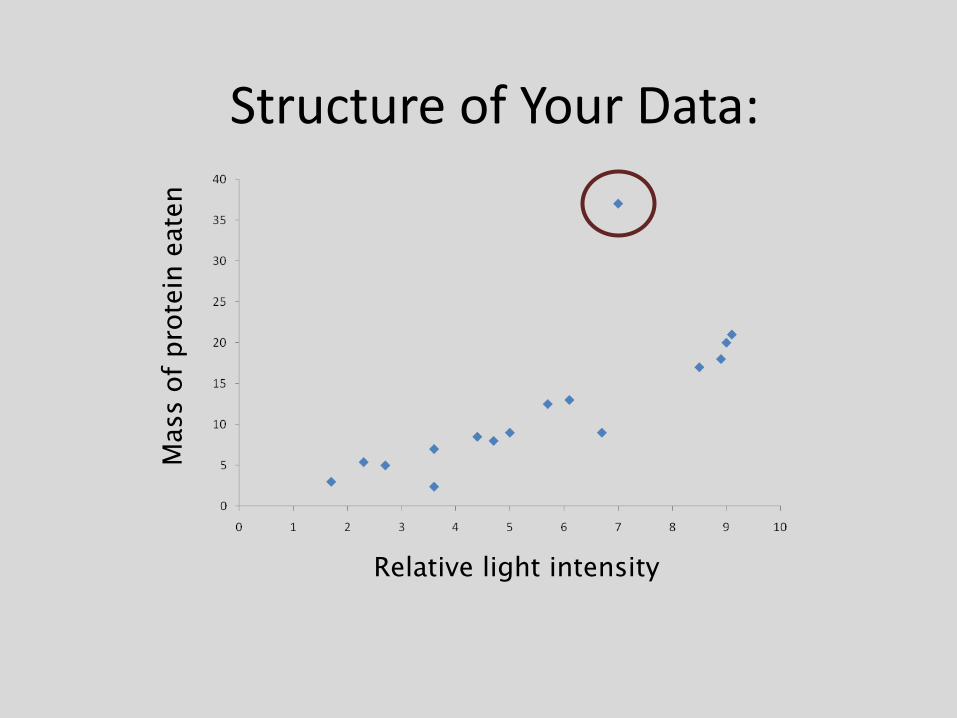
Structure of Your Data
• Examining and visualizing your data to:– Spot trends and outliers– Determine whether your data is parametric or
nonparametric
• Can include descriptive statistics: – Mean, Range, Variance, Standard Error
• Best way to look at structure is to plot it!
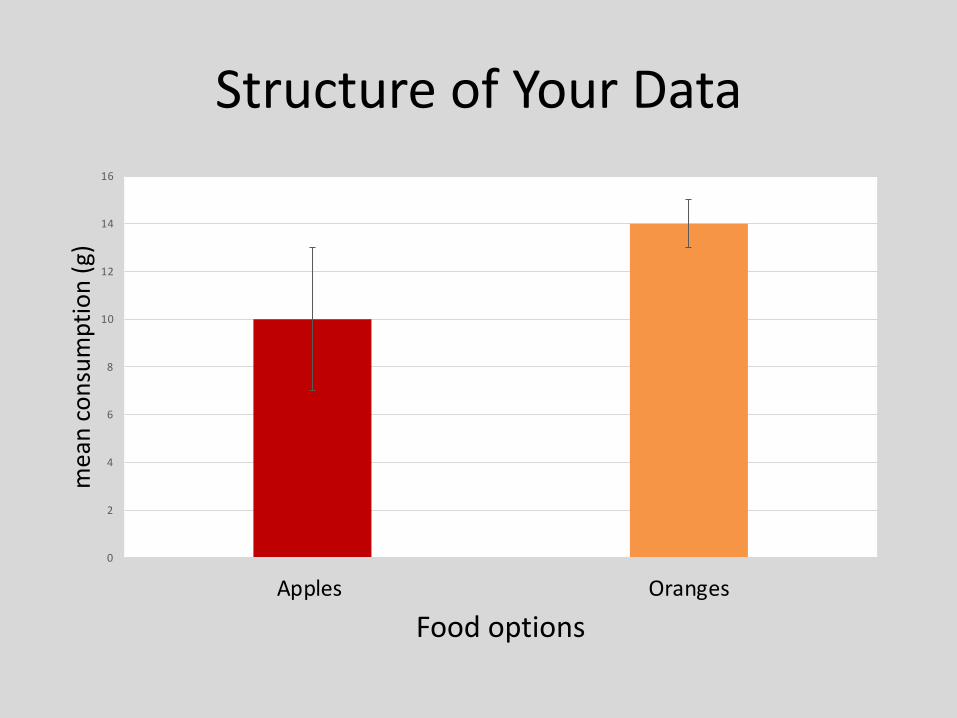
Structure of Your Data
0
2
4
6
8
10
12
14
16
Apples Oranges
mea
n co
nsum
ptio
n (g
)
Food options
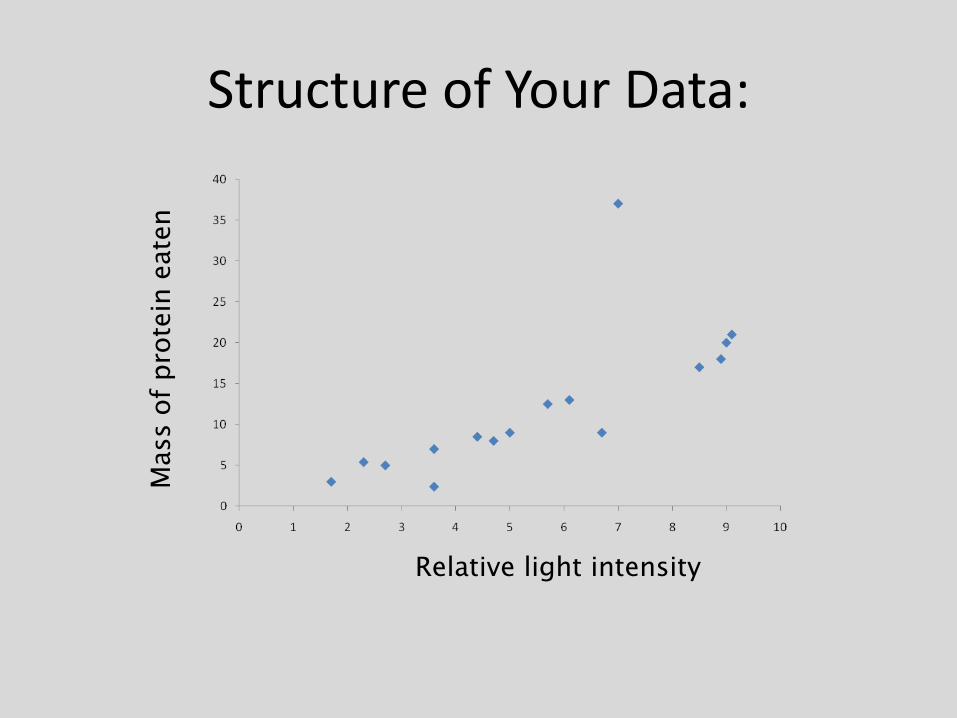
Structure of Your Data:
Relative light intensity
Mas
s of
pro
tein
eat
en
Relative light intensity
Mas
s of
pro
tein
eat
en
Structure of Your Data:
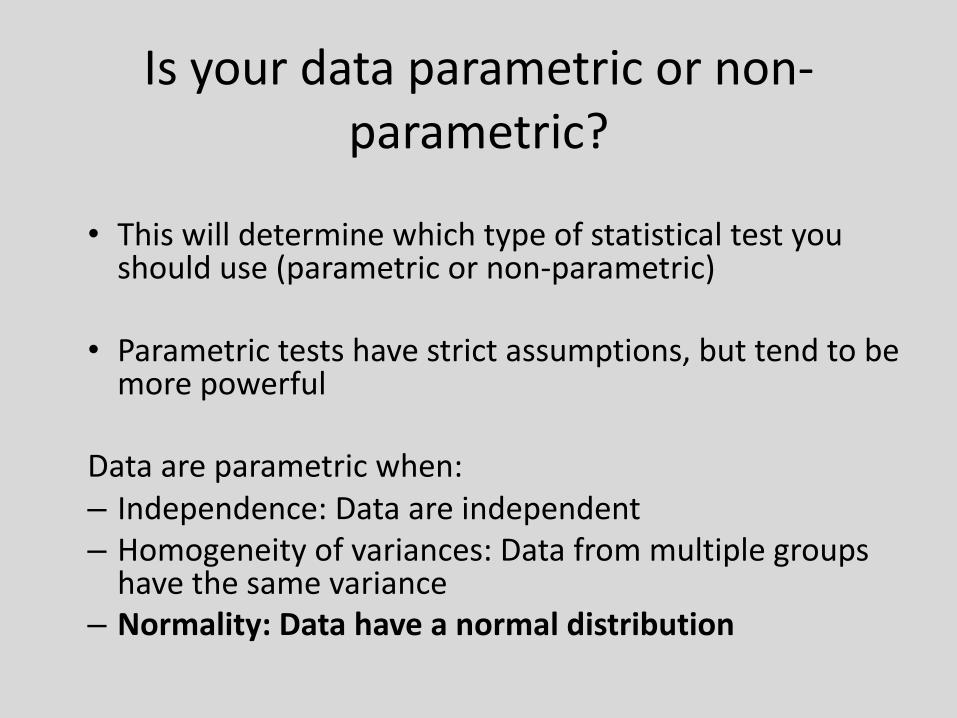
Is your data parametric or non-parametric?
• This will determine which type of statistical test you should use (parametric or non-parametric)
• Parametric tests have strict assumptions, but tend to be more powerful
Data are parametric when:– Independence: Data are independent– Homogeneity of variances: Data from multiple groups
have the same variance– Normality: Data have a normal distribution
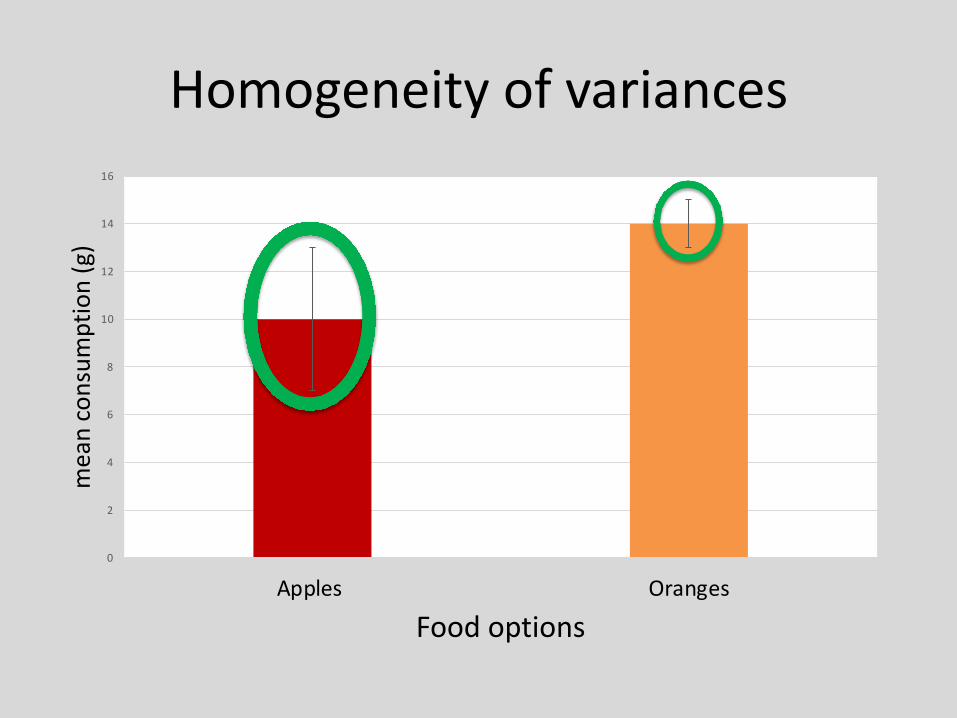
Homogeneity of variances
0
2
4
6
8
10
12
14
16
Apples Oranges
mea
n co
nsum
ptio
n (g
)
Food options
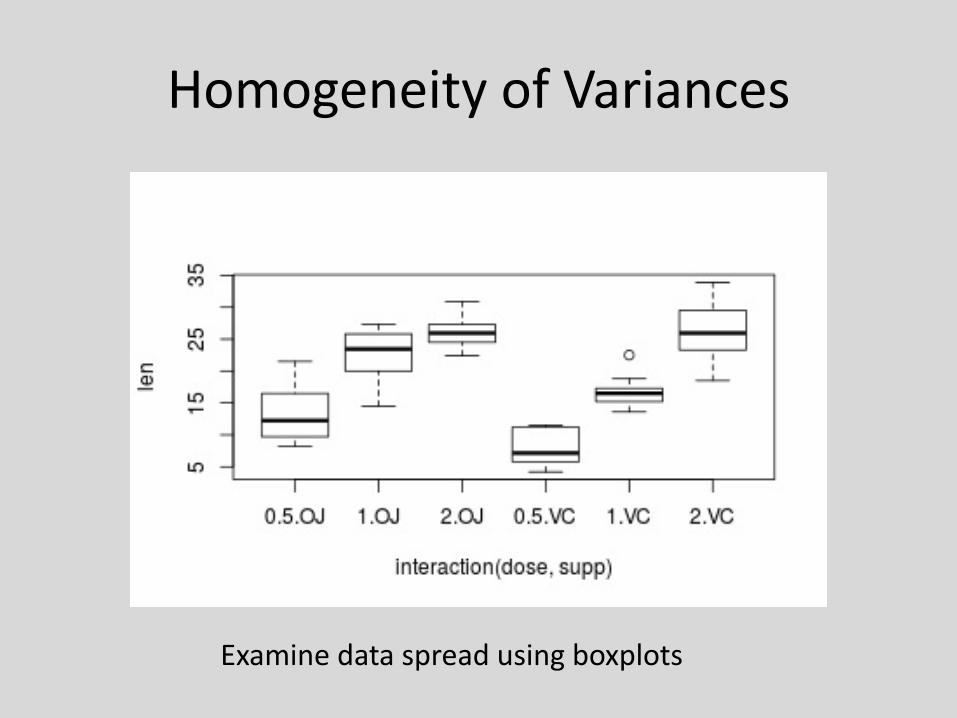
Homogeneity of Variances
Examine data spread using boxplots
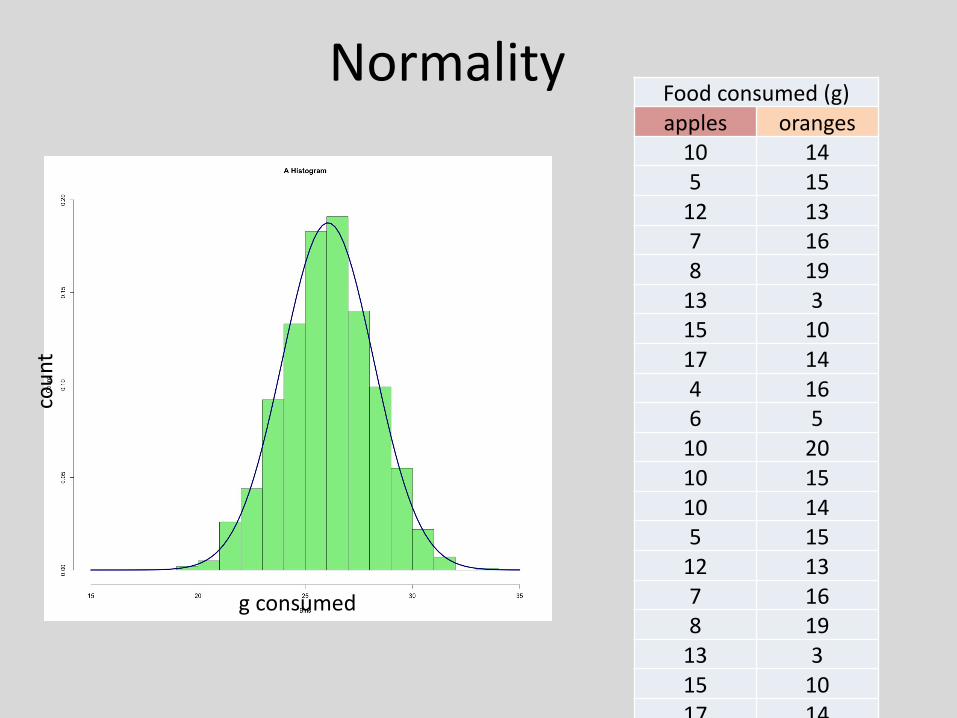
NormalityFood consumed (g)apples oranges
10 145 15
12 137 168 19
13 315 1017 144 166 5
10 2010 1510 145 15
12 137 168 19
13 315 1017 14
g consumed
coun
t
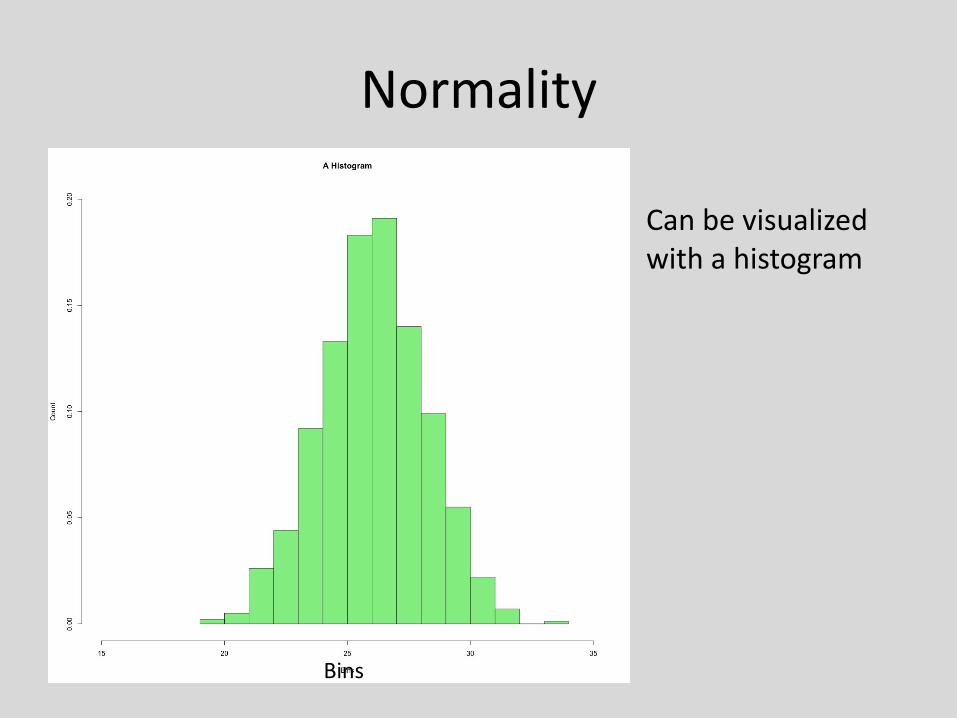
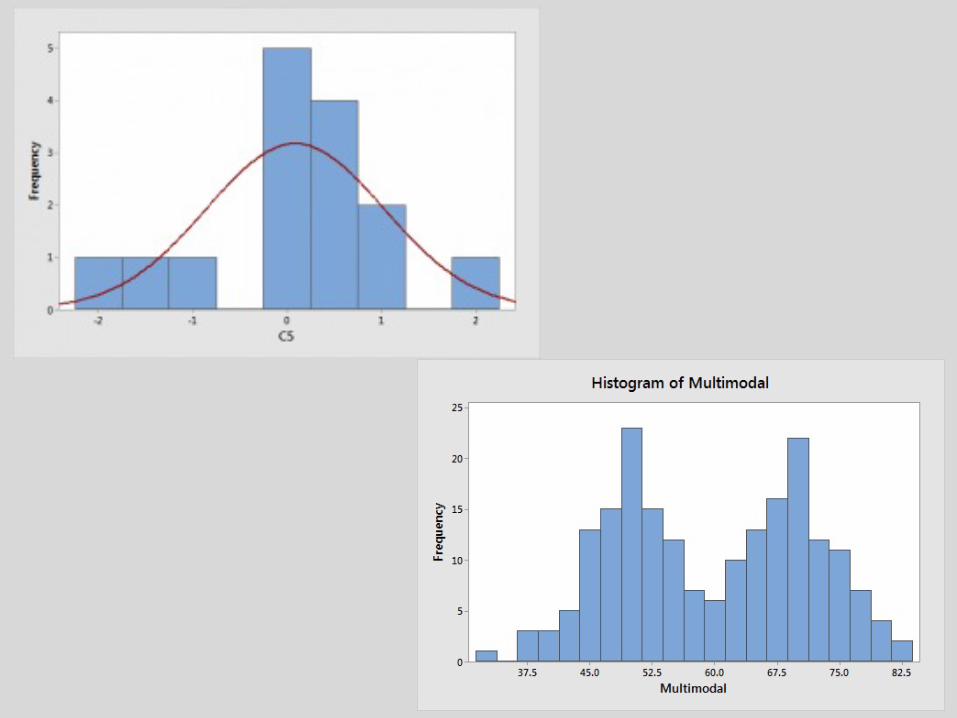
Normality
Can be visualized with a histogram
Bins
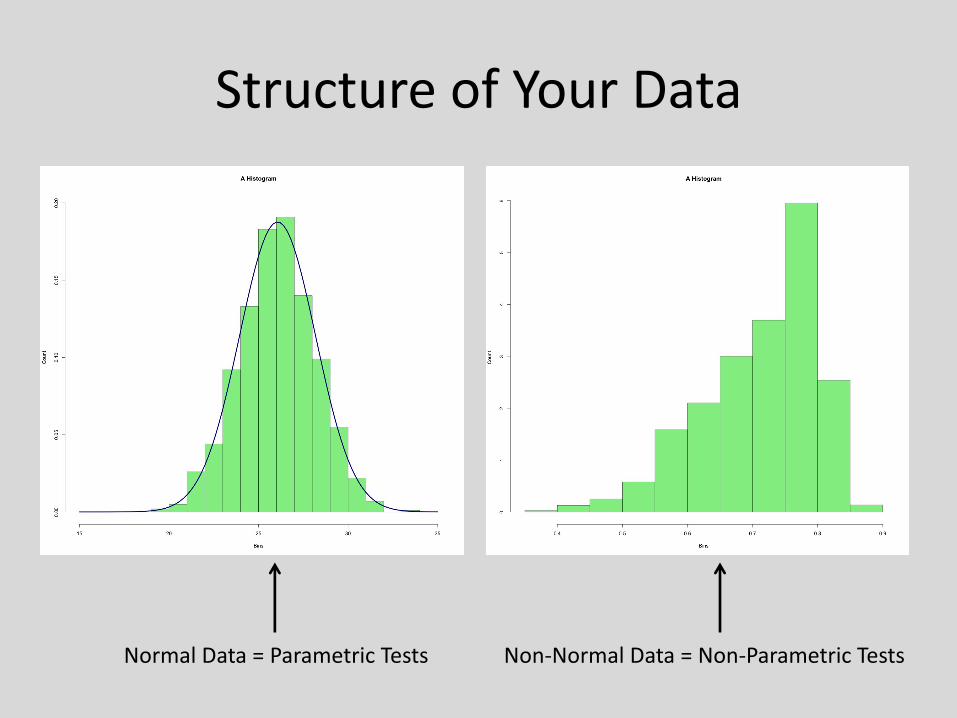
Structure of Your Data
Normal Data = Parametric Tests Non-Normal Data = Non-Parametric Tests
1) Identify your question
2) Identify your variables
3) Look at the structure of your data
4) Figure out the proper test of significance
5) Interpret and present your results
Steps to Good Statistics
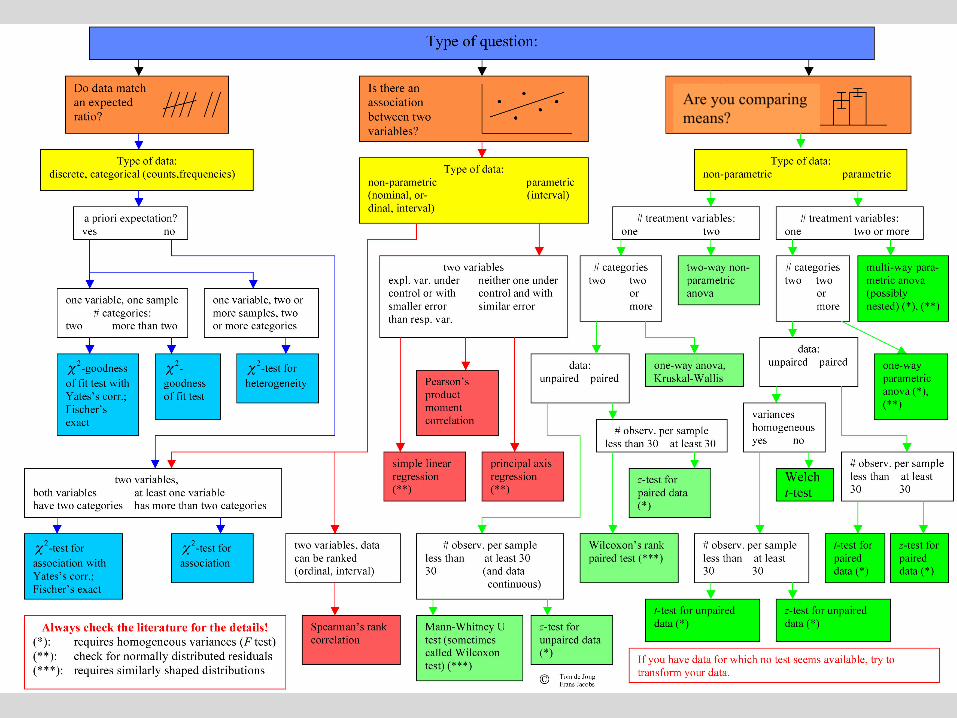
Are you comparing means?
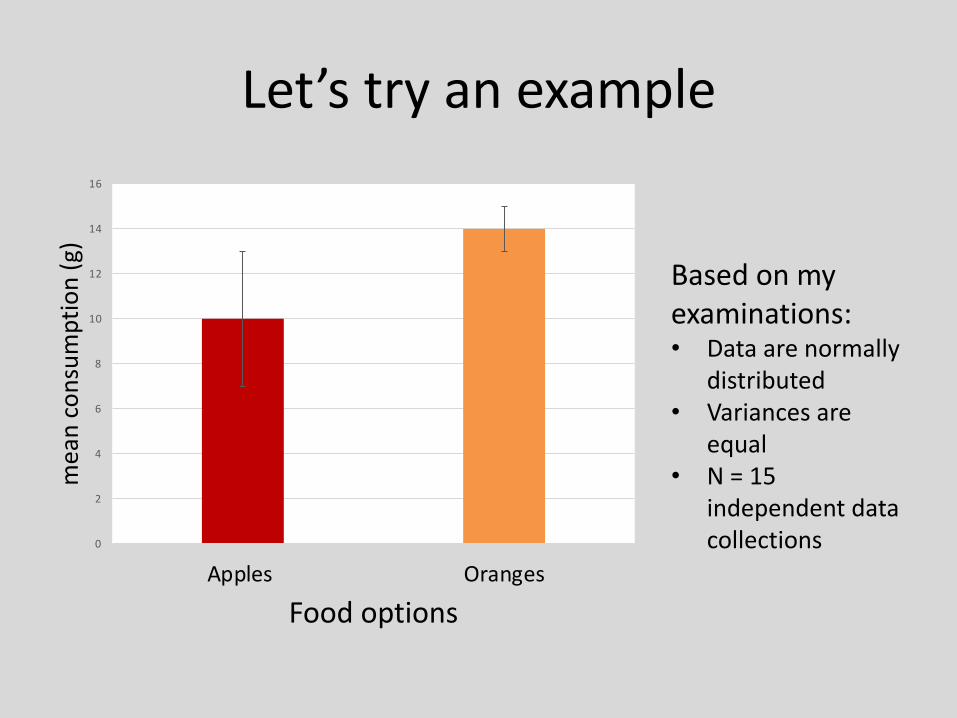
Let’s try an example
0
2
4
6
8
10
12
14
16
Apples Oranges
mea
n co
nsum
ptio
n (g
)
Food options
Based on my examinations: • Data are normally
distributed• Variances are
equal • N = 15
independent data collections
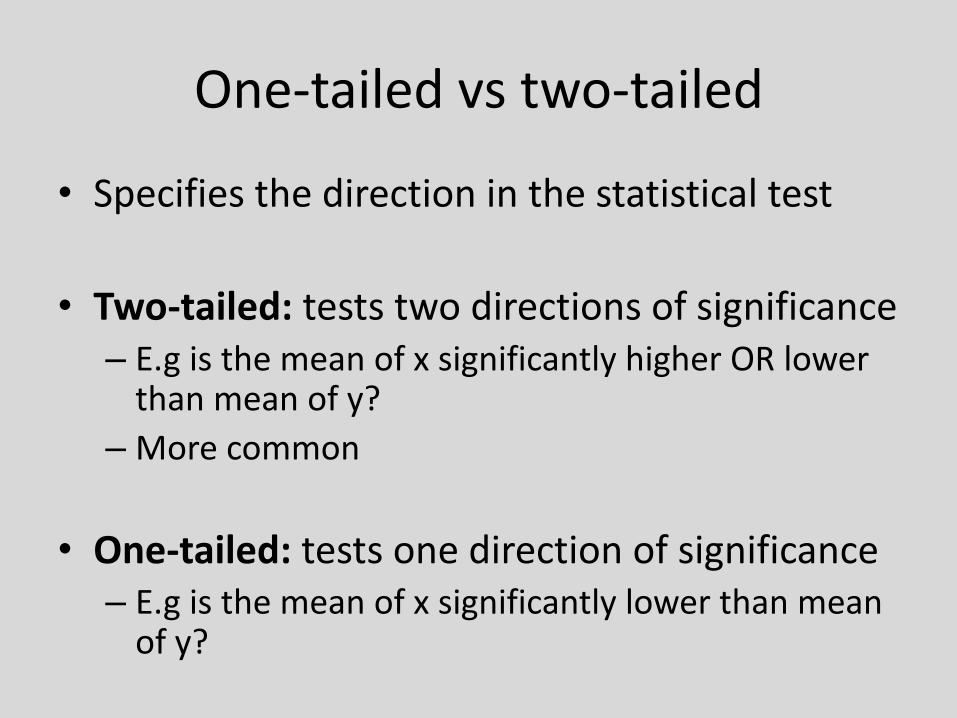
One-tailed vs two-tailed
• Specifies the direction in the statistical test
• Two-tailed: tests two directions of significance– E.g is the mean of x significantly higher OR lower
than mean of y?– More common
• One-tailed: tests one direction of significance– E.g is the mean of x significantly lower than mean
of y?
Run your Test!
• Programs to Consider:– Excel *what we will focus on– R *most common in biology– Minitab– SAS– SPSS
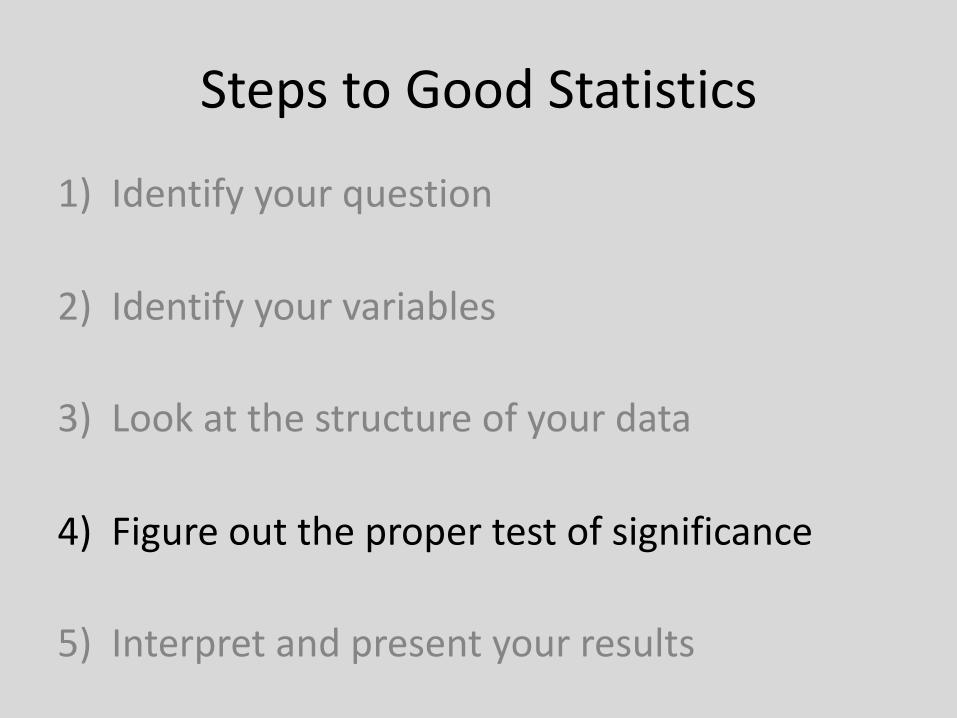
Steps to Good Statistics
1) Identify your question
2) Identify your variables
3) Look at the structure of your data
4) Figure out the proper test of significance
5) Interpret and present your results
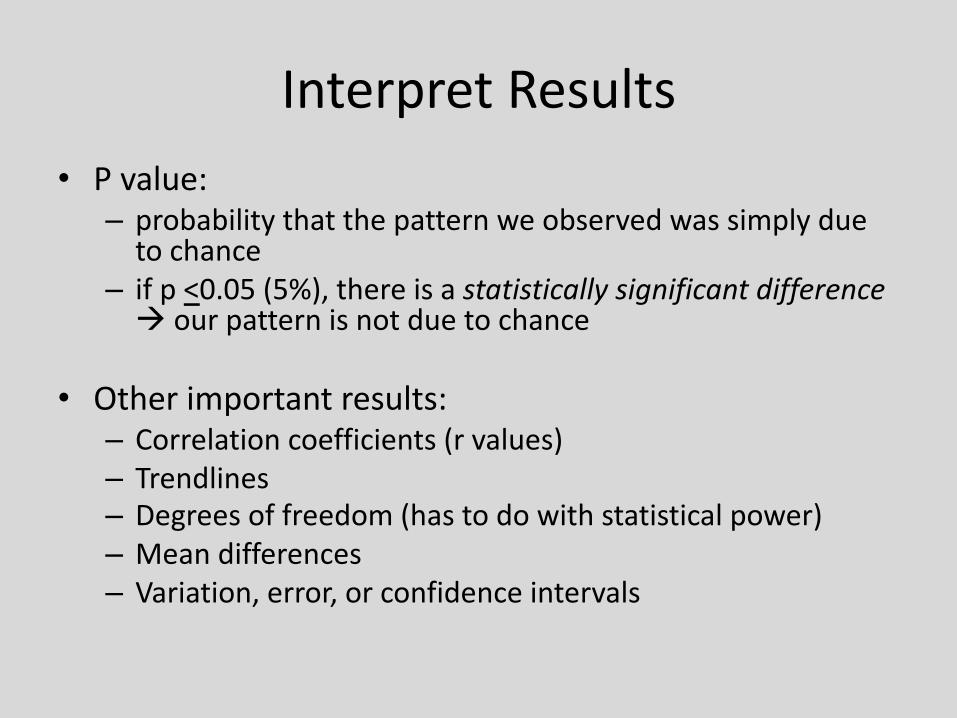
Interpret Results• P value:– probability that the pattern we observed was simply due
to chance– if p <0.05 (5%), there is a statistically significant difference à our pattern is not due to chance
• Other important results:– Correlation coefficients (r values)– Trendlines – Degrees of freedom (has to do with statistical power) – Mean differences – Variation, error, or confidence intervals
Display data
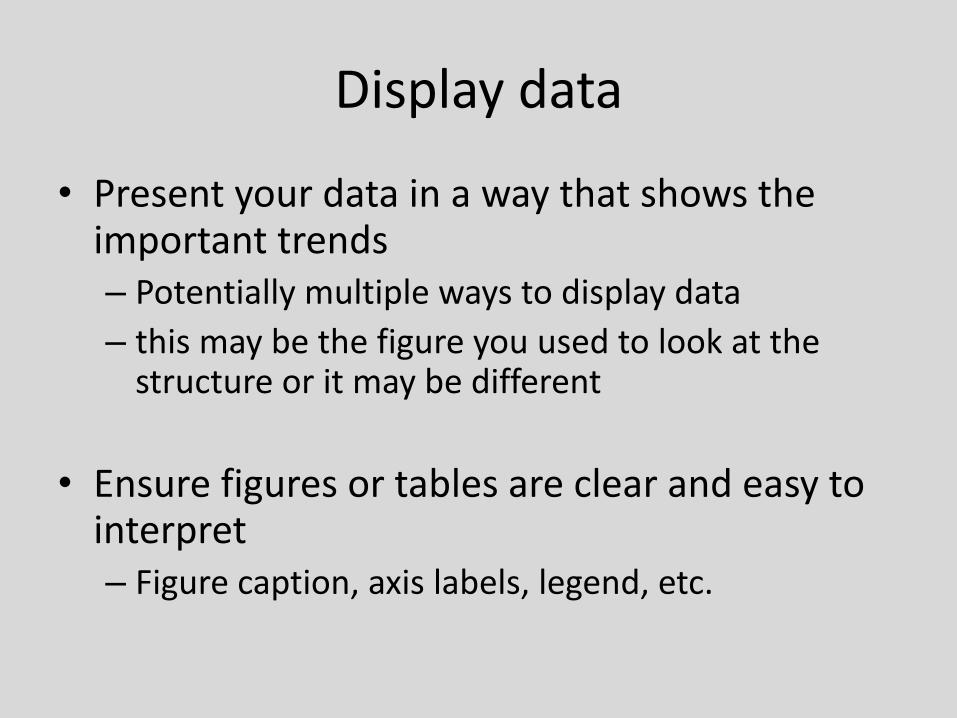
• Present your data in a way that shows the important trends – Potentially multiple ways to display data – this may be the figure you used to look at the
structure or it may be different
• Ensure figures or tables are clear and easy to interpret – Figure caption, axis labels, legend, etc.
Google is your friend
• There is lots of useful information about statistics – theory, code, step-by step explanations, forums, classes, example problems, etc.
• If you are unsure, first do an internet search -this is most like a real research environment
• There are different ways to do things, not just one right answer

Let’s Apply This –Cricket Aggression Time
Steps to Good Statistics1) Identify your question
2) Identify your variables
3) Look at the structure of your data
4) Figure out the proper test of significance
5) Interpret and present your results
• Question:– What is the effect of female presence on male-male
aggression in the Field Cricket?
• Hypothesis:– Female presence affects the aggressive behaviors of
male crickets
• Prediction:– Males will show a greater number and duration of
aggressive behaviours when a female is present
Cricket Aggression
• What are we asking statistically:– What is the difference in the occurrence of aggressive
behaviors between two treatments– What is the difference in song duration of males
when females are present vs. when they are absent
• What are we comparing? – Mean? Total counts? – Why?
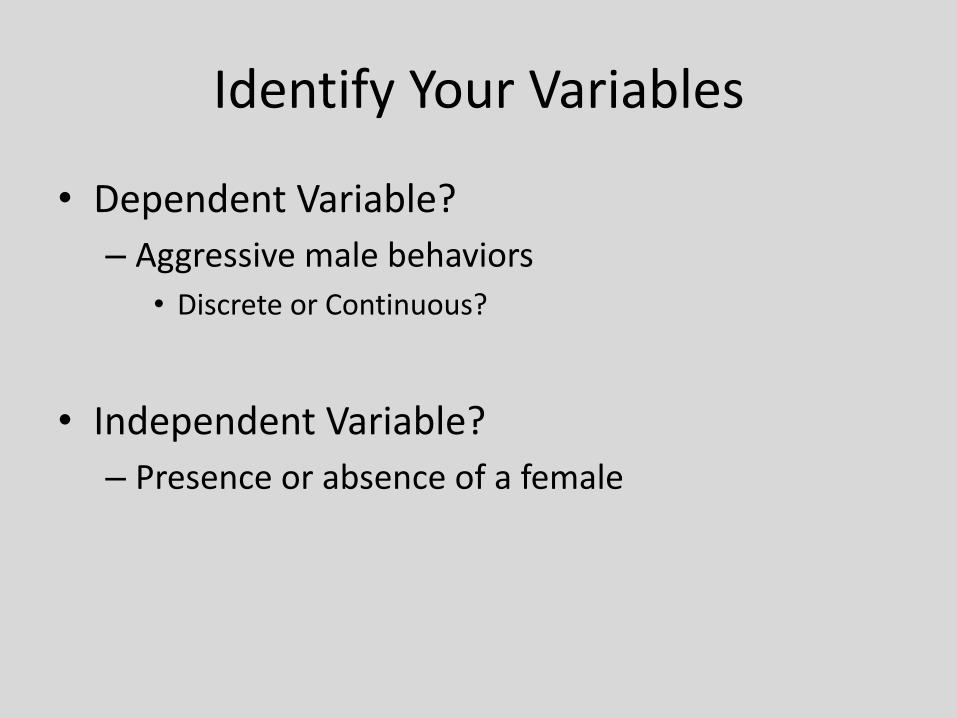
Identify Your Question
• Dependent Variable?– Aggressive male behaviors• Discrete or Continuous?
• Independent Variable?– Presence or absence of a female• Discrete or Continuous?
Identify Your Variables
• Dependent Variable?– Aggressive male behaviors• Discrete or Continuous?
• Independent Variable?– Presence or absence of a female• Discrete or Continuous?
Identify Your Variables
• Dependent Variable?– Aggressive male behaviors• Discrete or Continuous?
• Independent Variable?– Presence or absence of a female
Identify Your Variables
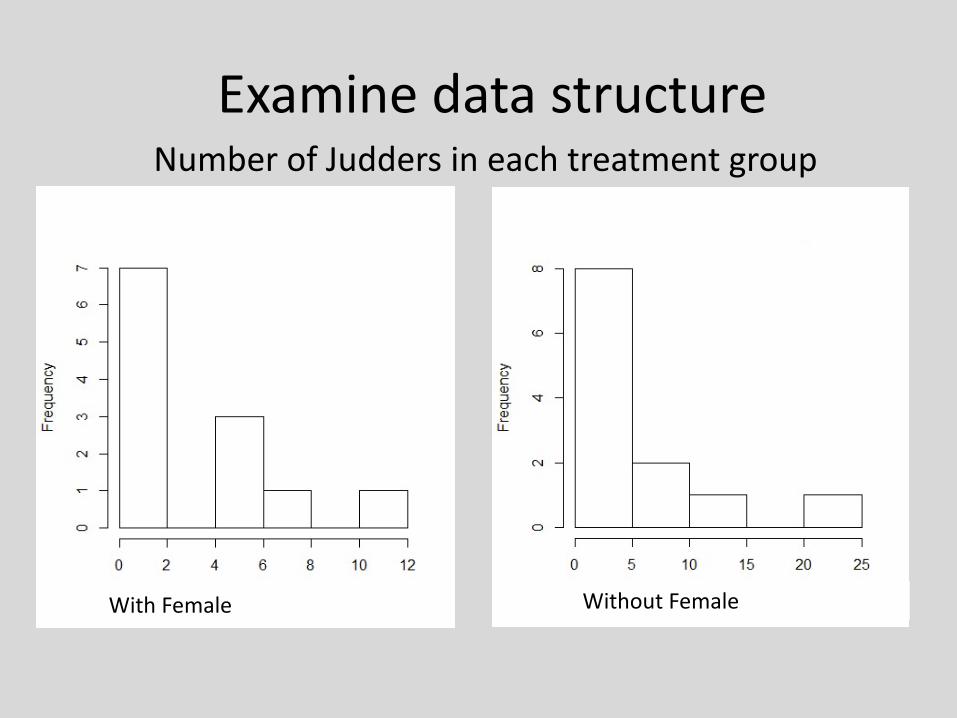
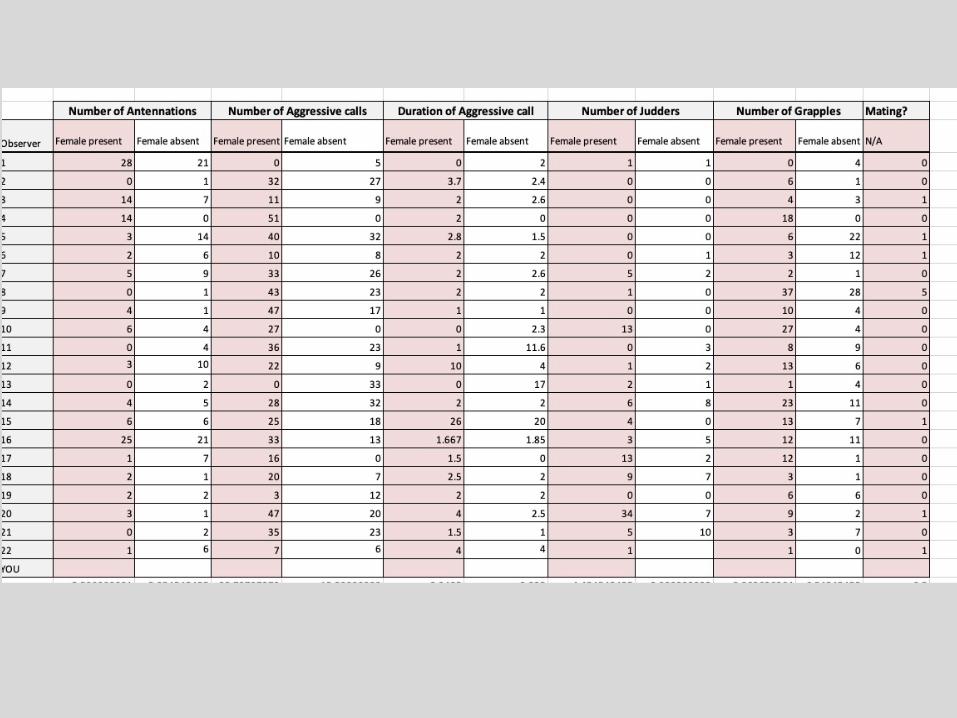
Examine data structure
With Female Without Female
Number of Judders in each treatment group
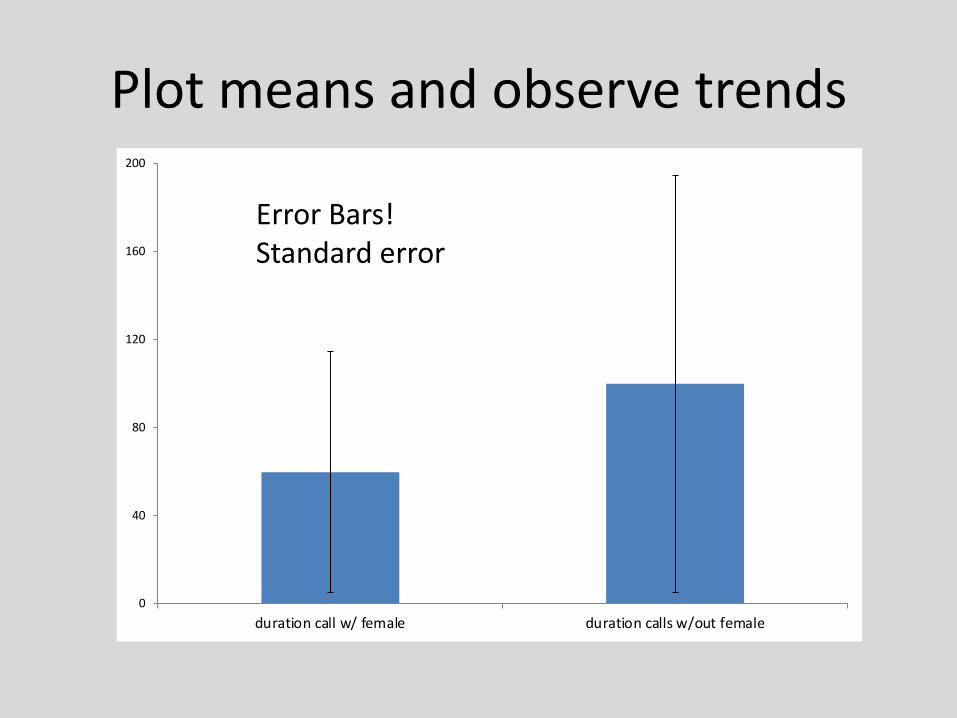
Plot means and observe trends
0
40
80
120
160
200
duration call w/ female duration calls w/out female
Error Bars!Standard error
Cricket Aggression Lab
• You will write up a full lab report with emphasis on Results
• Add your data to class data from last years cricket aggression lab and ANALYZE the results • Display data• Identify and describe any trends• Consider how you would test this statistically
Cricket Aggression Lab
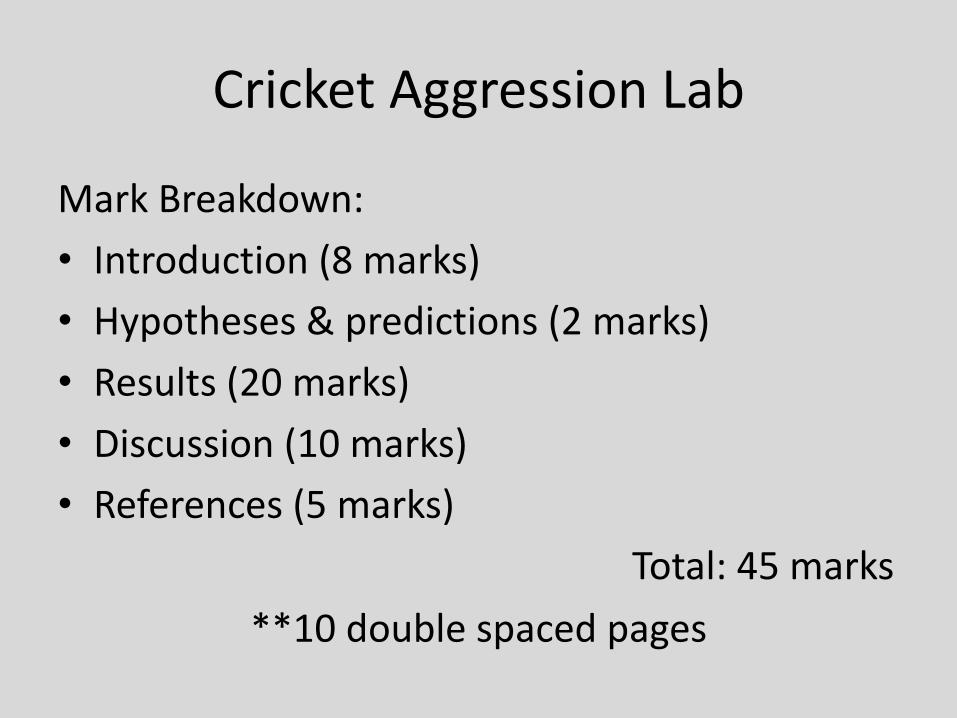
Mark Breakdown: • Introduction (8 marks)• Hypotheses & predictions (2 marks)• Results (20 marks)• Discussion (10 marks)• References (5 marks)
Total: 45 marks**10 double spaced pages
Cricket Aggression Lab
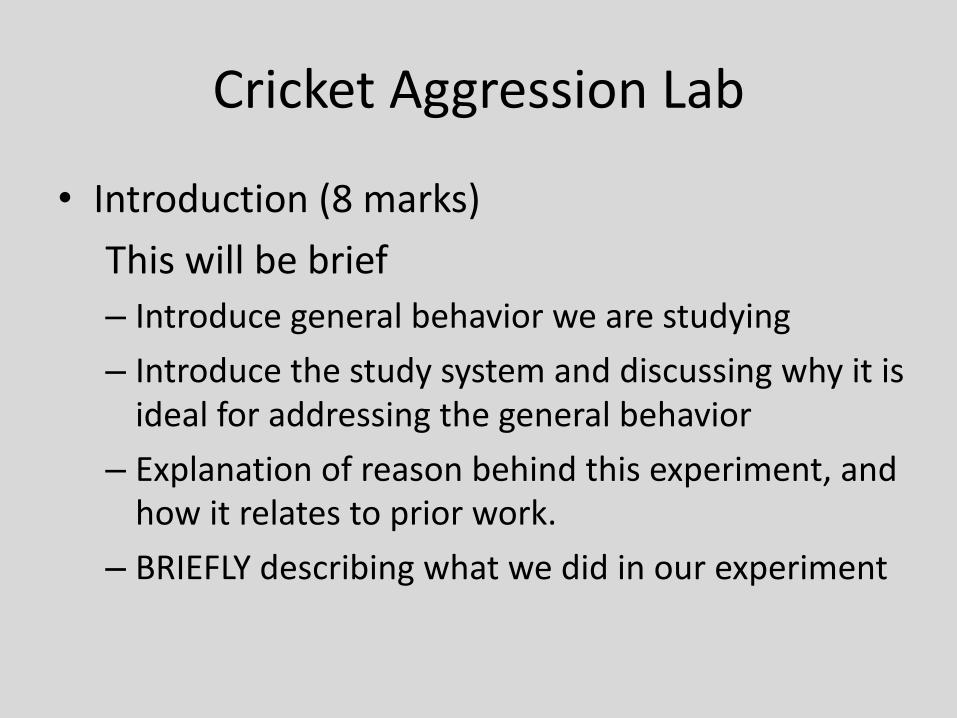
• Introduction (8 marks)This will be brief – Introduce general behavior we are studying– Introduce the study system and discussing why it is
ideal for addressing the general behavior– Explanation of reason behind this experiment, and
how it relates to prior work. – BRIEFLY describing what we did in our experiment
Cricket Aggression Lab
• Hypotheses (2 marks)– Hypotheses– Predictions– *Make sure you encompass all behaviors
Cricket Aggression Lab
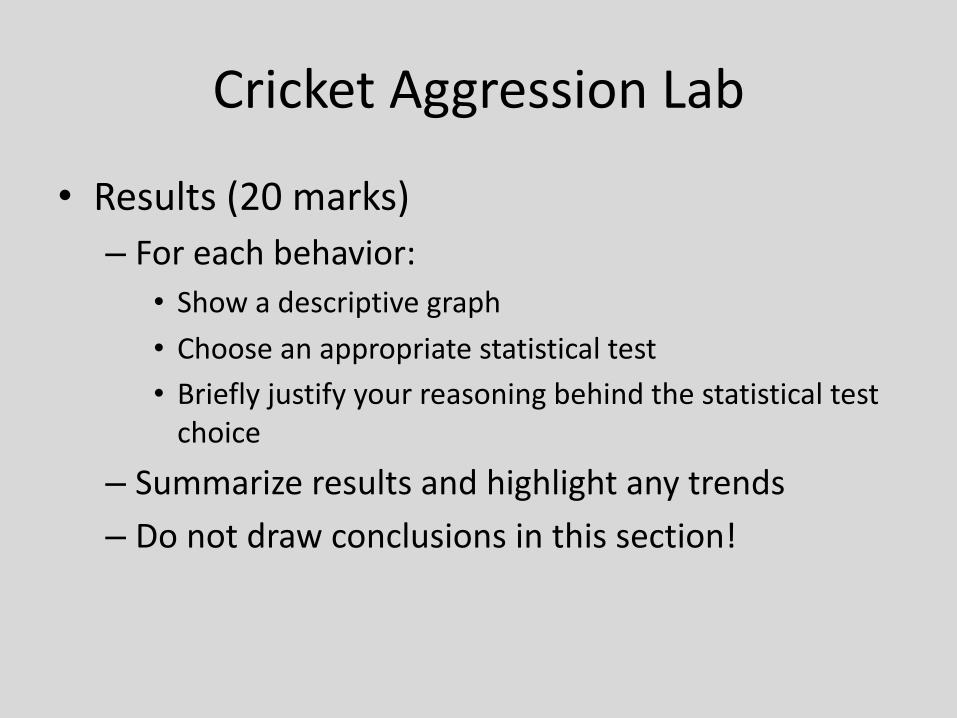
• Results (20 marks) – For each behavior: • Show a descriptive graph • Choose an appropriate statistical test• Briefly justify your reasoning behind the statistical test
choice
– Summarize results and highlight any trends – Do not draw conclusions in this section!
Cricket Aggression Lab
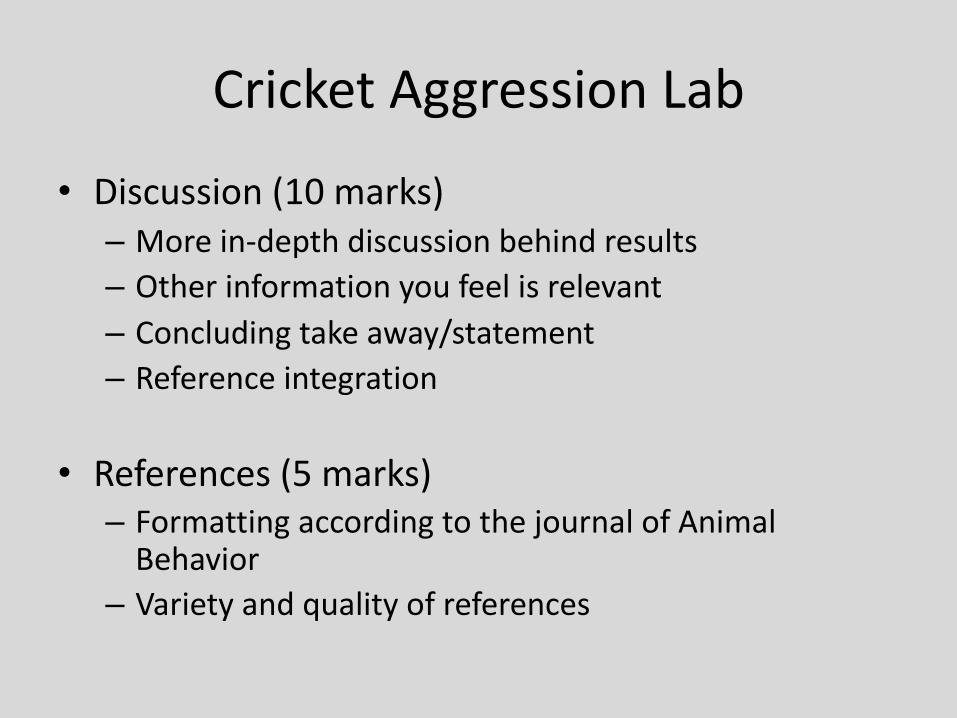
• Discussion (10 marks)– More in-depth discussion behind results– Other information you feel is relevant– Concluding take away/statement– Reference integration
• References (5 marks)– Formatting according to the journal of Animal
Behavior– Variety and quality of references
Next week
• Statistics workshop part 2: Stats exercise
• Handouts and data files can be downloaded on Weebly à you will complete 2
• We will start with an Excel tutorial, but you can complete the exercise in any program of your choice
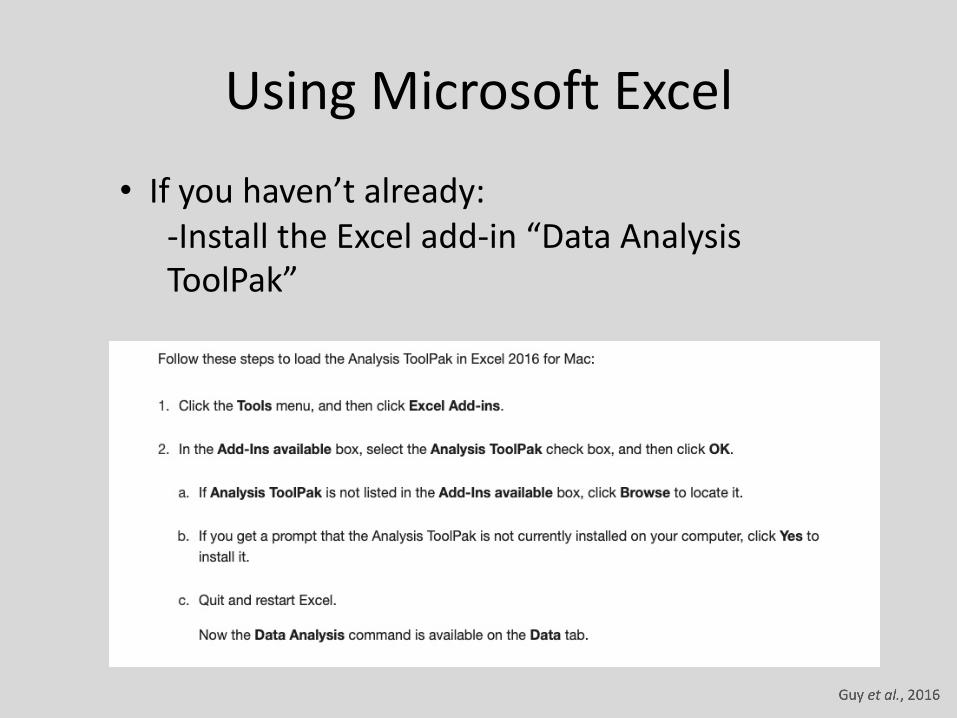
Using Microsoft Excel
• If you haven’t already:-Install the Excel add-in “Data Analysis ToolPak”
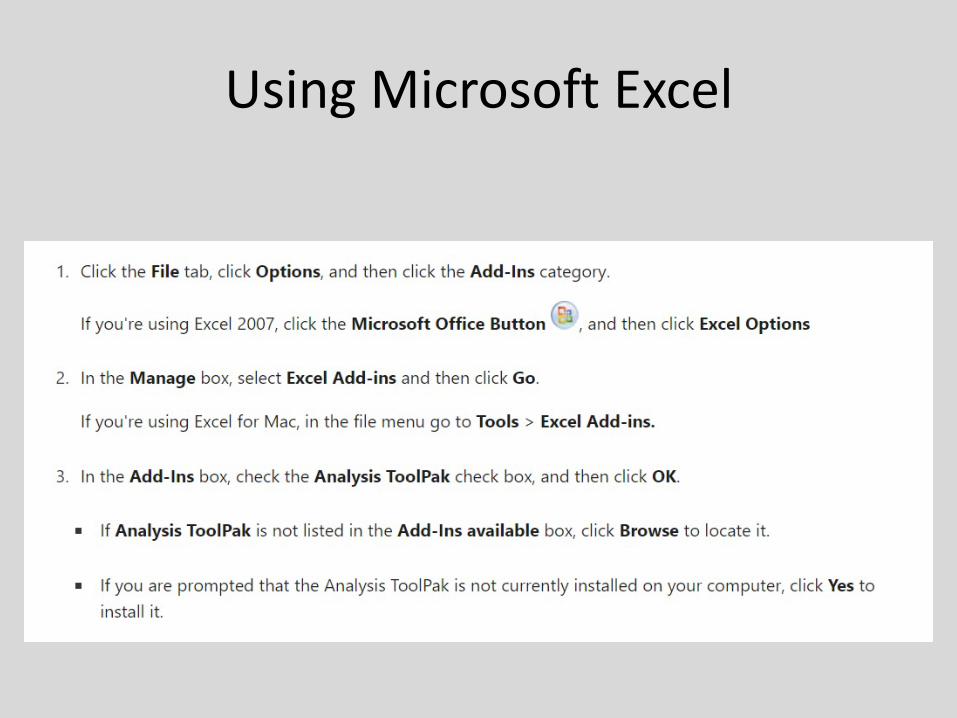
Using Microsoft Excel