Embed Size (px)
Citation preview

Statistical release P0307
Marriages and divorces
2011
Embargoed until:10 December 2012
09:00 Enquiries: Forthcoming issue: Expected release date
User Information Services Marriages and divorces, 2012 December 2013 012 310 8600 / 4892 / 8390
i Statistics South Africa P0307
Marriages and Divorces, 2011
PREFACE This statistical release presents information on civil marriages, customary marriages and civil unions that were registered in 2011 in the South African national marriage registration systems maintained by the Department of Home Affairs. It highlights trends in the number of marriages and unions as well as demographic and other characteristics of the couples. The release also reports on divorces that were granted in 2011 by the Department of Justice and Constitutional Development. It focuses on trends in divorces from civil marriages, characteristics of plaintiffs, age at the time of divorce, duration of marriage and divorces involving couples with children.
PJ Lehohla Statistician-General
ii Statistics South Africa P0307
Marriages and Divorces, 2011
CONTENTS PREFACE ................................................................................................................................................................. i LIST OF FIGURES ................................................................................................................................................. iii LIST OF TABLES ................................................................................................................................................... iv KEY FINDINGS ....................................................................................................................................................... 1 1. Introduction .................................................................................................................................................... 1
2. Marriages ....................................................................................................................................................... 2
2.1 Civil marriages ..................................................................................................................................... 2
2.1.1 Trends in civil marriages (2002–2011) ................................................................................... 2
2.1.2 Solemnisation of marriages .................................................................................................... 2
2.1.3 Marital status at the time of marriage ..................................................................................... 2
2.1.4 Age at the time of marriage .................................................................................................... 3
2.2 Customary marriages .......................................................................................................................... 4
2.2.1 Trends in the registration of customary marriages (2003–2011) ........................................... 4
2.2.2 Marital status at the time of customary marriage ................................................................... 4
2.2.3 Age at the time of customary marriage .................................................................................. 4
2.3 Civil unions .......................................................................................................................................... 4
2.3.1 Trends in the registration of civil unions (2007–2011) ........................................................... 4
2.3.2 Marital status at the time of civil union ................................................................................... 5
2.3.3 Age at the time of civil union .................................................................................................. 5
3. Divorces ......................................................................................................................................................... 5
3.1 Trends in divorces (2002–2011) ......................................................................................................... 5
3.2 Characteristics of plaintiffs .................................................................................................................. 5
3.3 Solemnisation of marriages that ended in divorce .............................................................................. 6
3.4 Number of times married ..................................................................................................................... 6
3.5 Age at the time of divorce ................................................................................................................... 6
3.6 Duration of marriage of divorcing couples ........................................................................................... 6
3.7 Divorces involving couples with children ............................................................................................. 7
4. Summary and concluding remarks ................................................................................................................ 7 EXPLANATORY NOTES ...................................................................................................................................... 41 1. Purpose of the statistical release ................................................................................................................ 41
2. Scope and coverage .................................................................................................................................... 41
3. Data ............................................................................................................................................................. 41
4. Limitations ................................................................................................................................................... 41
5. Definitions of terms ...................................................................................................................................... 41
6. Symbols ....................................................................................................................................................... 42 GENERAL INFORMATION ................................................................................................................................... 43
iii Statistics South Africa P0307
Marriages and Divorces, 2011
LIST OF FIGURES
Figure 1. Number of civil marriages by month of solemnisation, 2007–2011 .......................................................8
Figure 2. Number of civil marriages for bachelors and spinsters by age group, 2011 ..........................................9
Figure 3a. Median ages of bridegrooms and brides at the time of civil marriage, 2007–2011 .............................10
Figure 3b. Median ages of bachelors and spinsters at the time of civil marriage, 2007–2011 .............................10
Figure 3c. Median ages of widows and widowers at the time of civil marriage, 2007–2011 ................................11
Figure 3d. Median ages of male and female divorcees at the time of civil marriage, 2007–2011 ........................11
Figure 4a. Percentage distribution of civil marriages by age differences between spouses and marital status at the time of marriage (bachelors), 2011 .................................................................................12
Figure 4b. Percentage distribution of civil marriages by age differences between spouses and marital status at the time of marriage (widowers), 2011 ..................................................................................12
Figure 4c. Percentage distribution of civil marriages by age differences between spouses and marital status at the time of marriage (male divorcees), 2011 .........................................................................13
Figure 5. Percentage distribution of customary marriages by year of marriage and time it took to register the marriage, 2007–2011 .....................................................................................................................13
Figure 6. Median ages of bridegrooms and brides at the time of customary marriage, 2007–2011 ...................14
Figure 7. Percentage distribution of customary marriages by age differences between spouses at the time of marriages, 2007–2011 .............................................................................................................14
Figure 8. Median ages of spouses in civil unions, 2007–2011 ............................................................................15
Figure 9. Percentage distribution of civil unions by age differences between spouses at the time of union, 2007–2011 .................................................................................................................................15
Figure 10. Median ages of divorcees by sex and population group, 2011 ............................................................16
Figure 11. Number of divorces by age and population group (males), 2011 ........................................................16
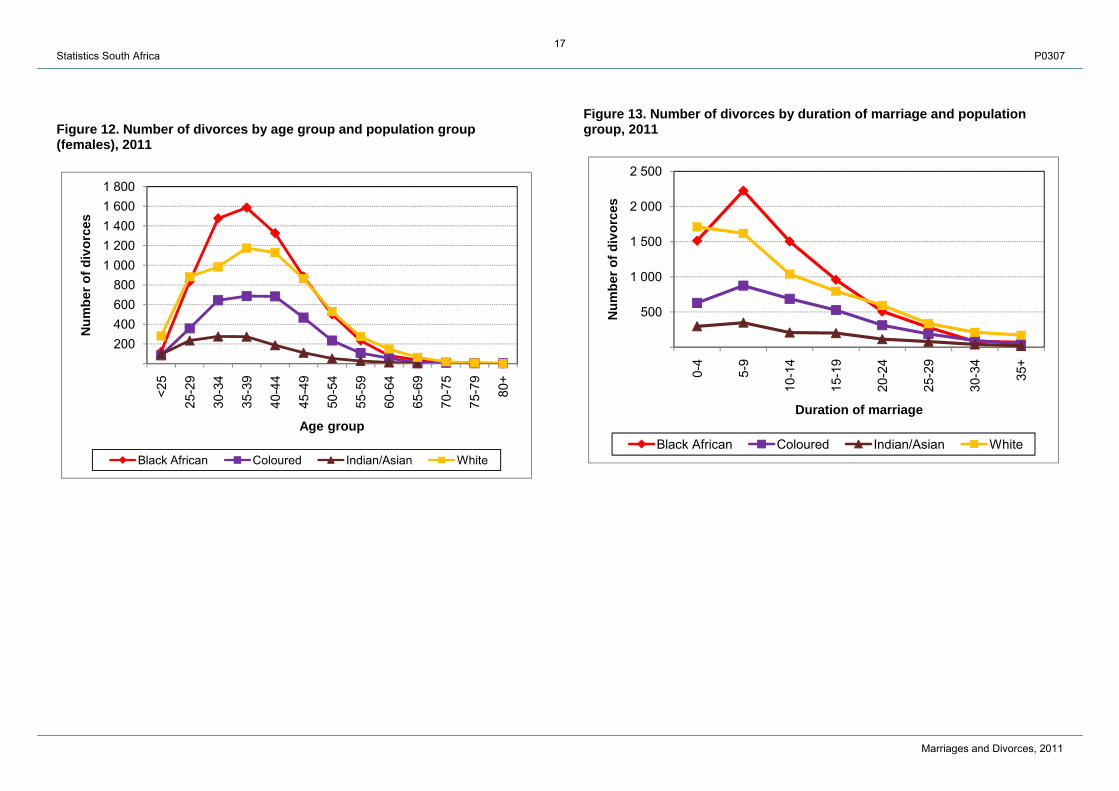
Figure 12. Number of divorce by age group and population group (females), 2011 .............................................17
Figure 13. Number of divorces by duration of marriage and population group, 2011 ...........................................17
iv Statistics South Africa P0307
Marriages and Divorces, 2011
LIST OF TABLES
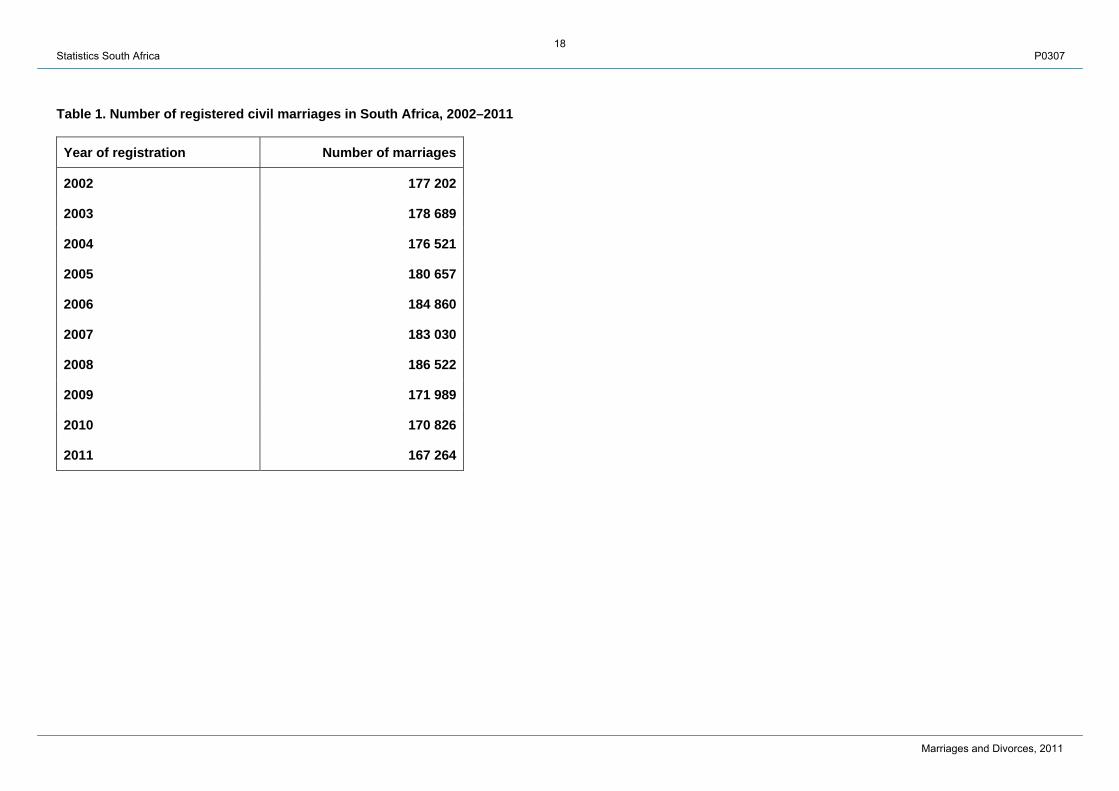
Table 1. Number of registered civil marriages in South Africa, 2002–2011 .......................................................18
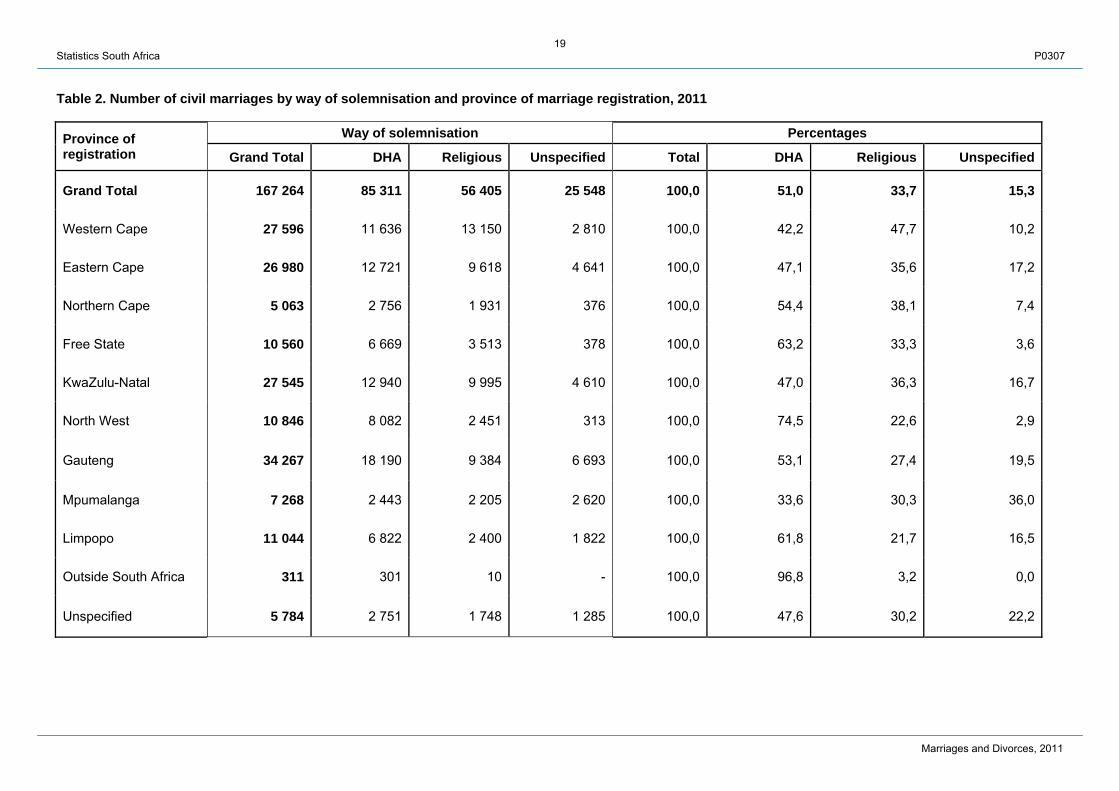
Table 2. Number of civil marriages by way of solemnisation and province of marriage registration, 2011 .......19
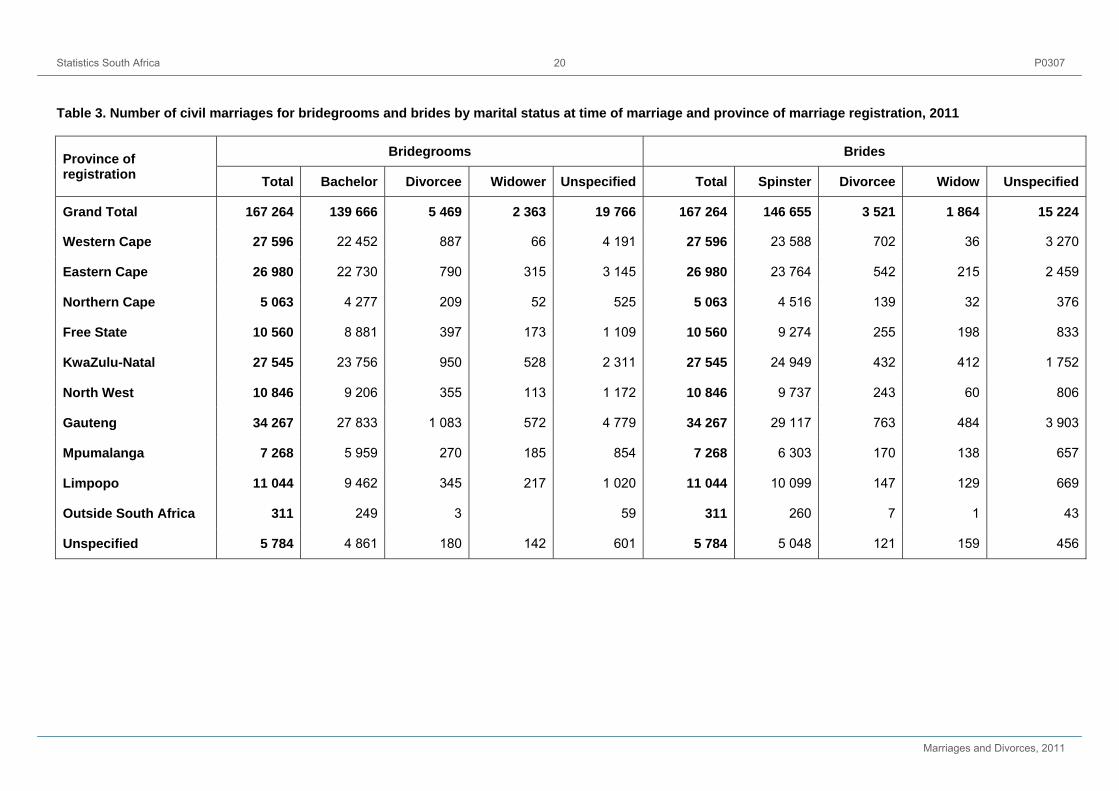
Table 3. Number of civil marriages for bridegrooms and brides by marital status at time of marriage and province of marriage registration, 2011 ................................................................................................20
Table 4. Number of civil marriages by marital status of husband and age differences between spouses at the time of marriage, 2011* ..............................................................................................................21
Table 5. Number of marriages by marital status at the time of marriage and ages of bridegrooms and brides, 2011 ..........................................................................................................................................22
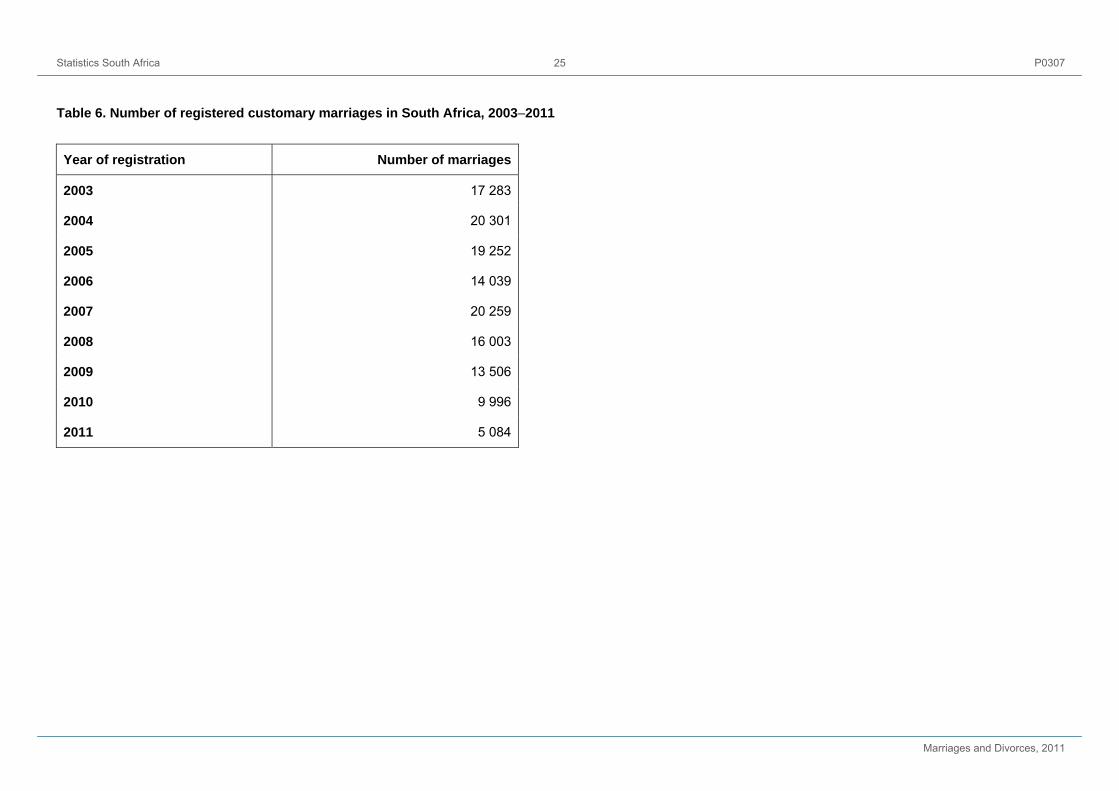
Table 6. Number of registered customary marriages in South Africa, 2003–2011 ............................................25
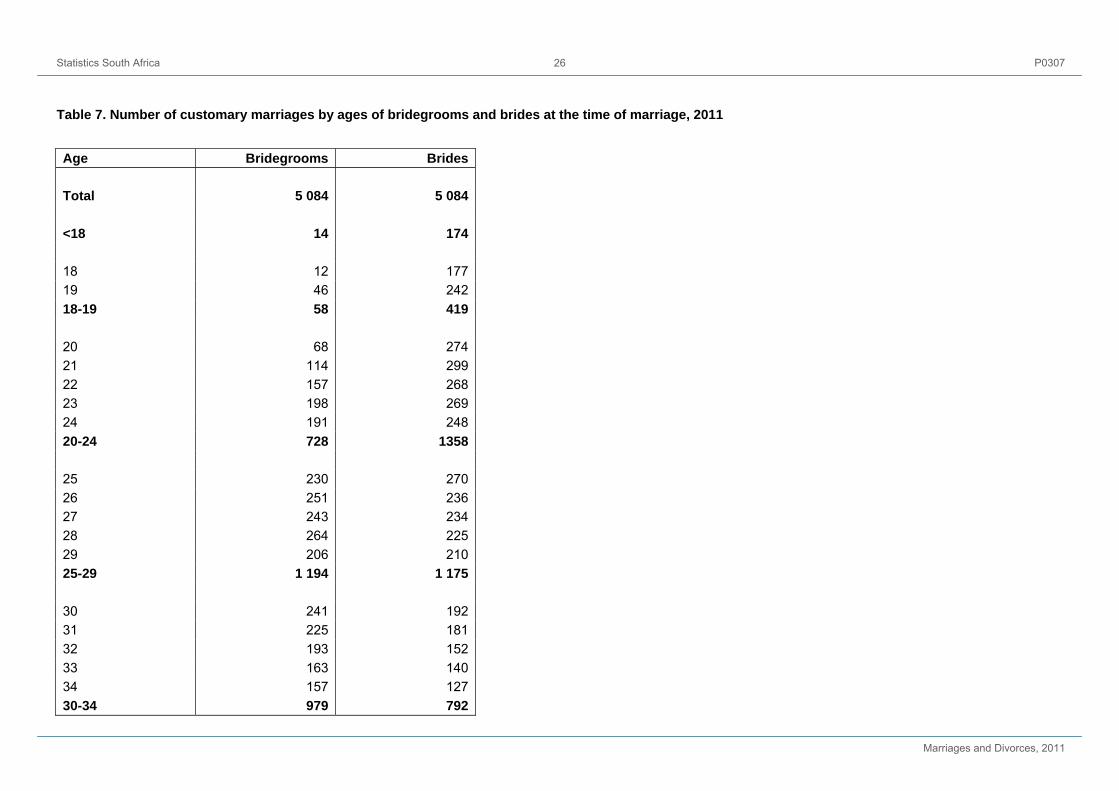
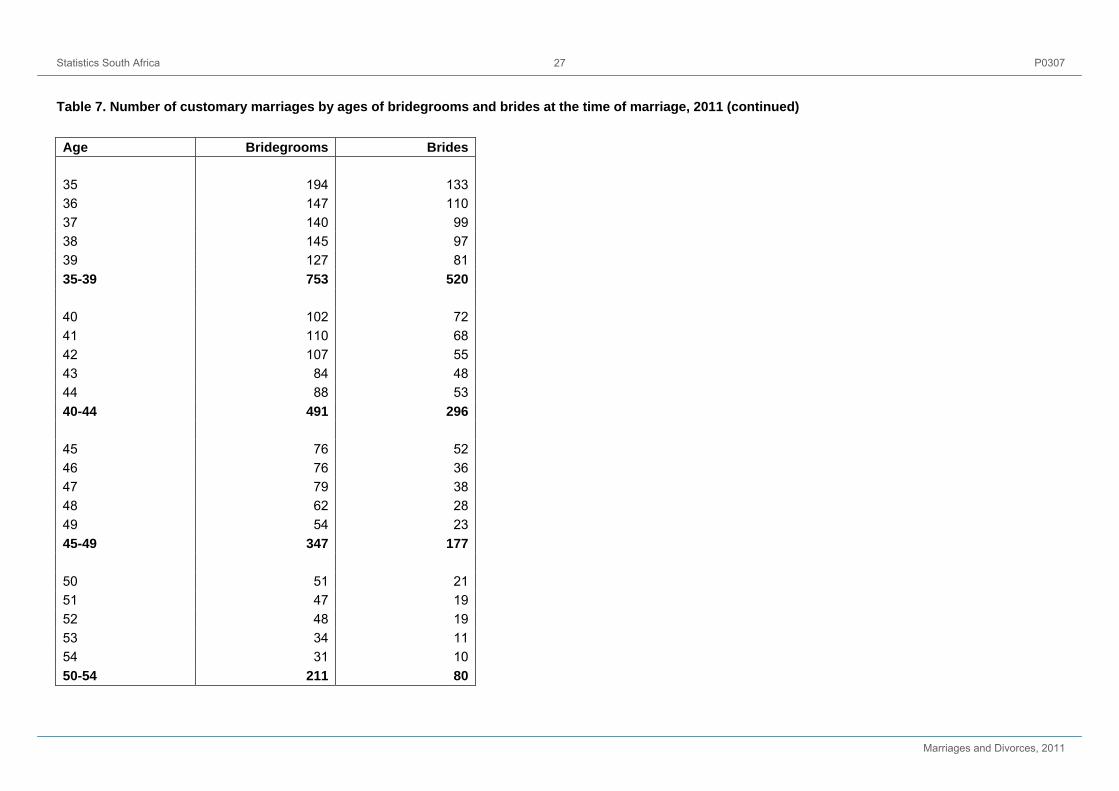
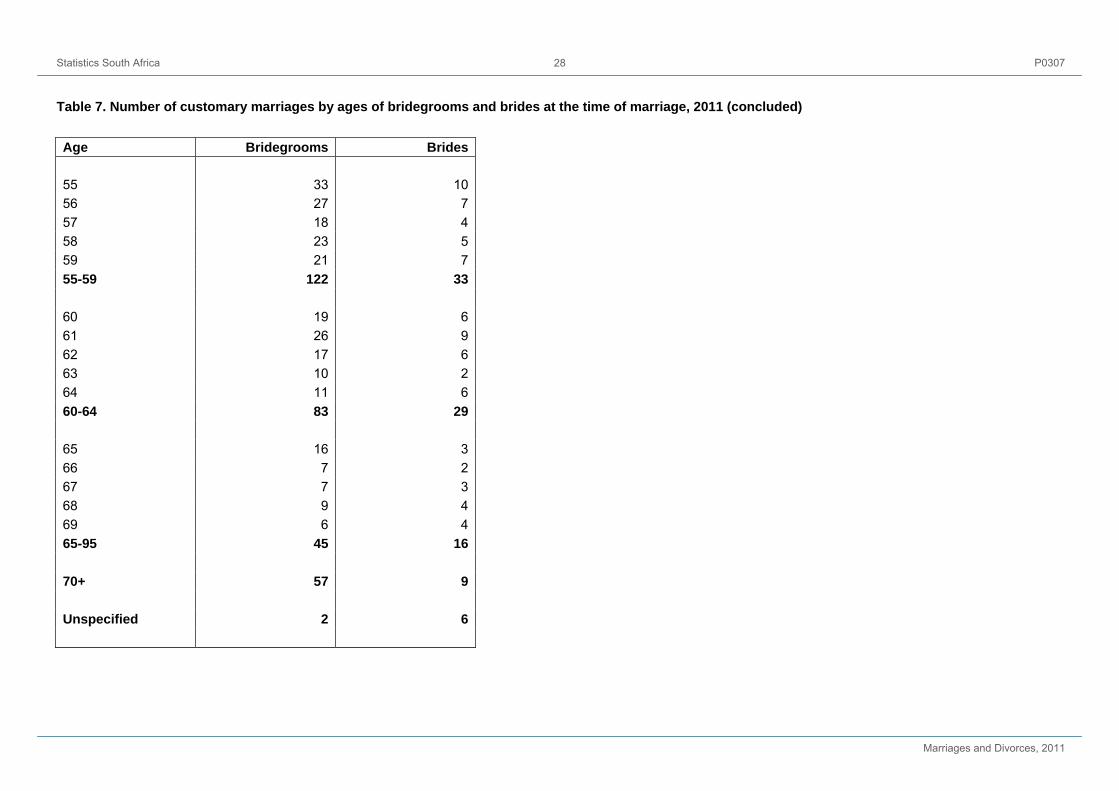
Table 7. Number of customary marriages by ages of bridegrooms and brides at the time of marriage, 2011 .....................................................................................................................................................26
Table 8. Number of registered civil unions in South Africa by province of registration, 2007–2011 ..................29
Table 9. Number of civil unions by ages of spouses-1 and spouses-2 at the time of civil union, 2011 .............30
Table 10. Number of published divorces in South Africa by population group, 2002–2011 ................................33
Table 11. Number of divorces by sex and population group of the plaintiff, 2011 ...............................................34
Table 12. Number of divorces by sex and type of occupation of the plaintiff, 2011 .............................................34
Table 13. Number of divorces by population group and way of solemnisation of the marriage, 2011 ................35
Table 14. Number of divorces by number of times married at the time of divorce, 2011 ....................................35
Table 15. Number of divorces by age and population group (males), 2011 ........................................................36
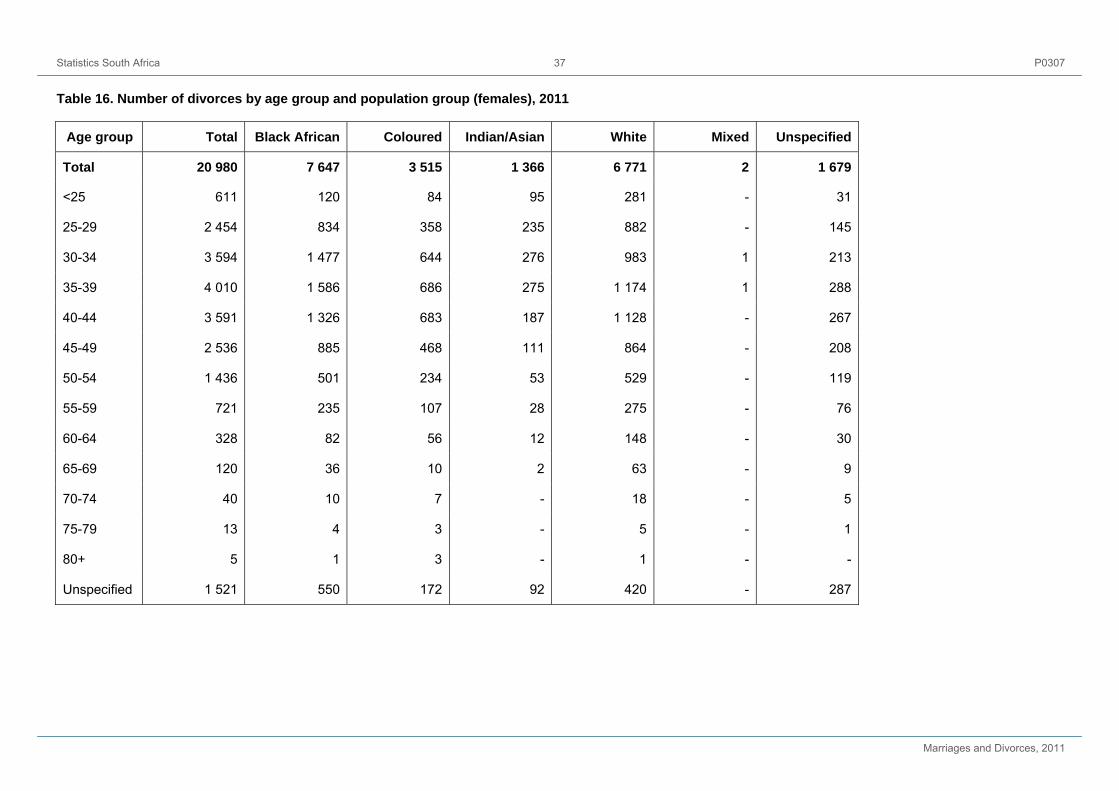
Table 16. Number of divorces by age group and population group (females), 2011 ...........................................37
Table 17. Number of marriages by duration of marriage and age group (males), 2011 ......................................38
Table 18. Number of marriages by duration of marriage and age group (females), 2011 ...................................39
Table 19. Number of divorces with and without children by population group, 2011 ...........................................40
Table 20. Number and percentage distribution of children involved in divorces, 2011 ........................................40
1 Statistics South Africa P0307
Marriages and Divorces, 2011
KEY FINDINGS
1. Introduction
There are two main sources of marriage and divorce statistics in South Africa; namely, those compiled from censuses and surveys and those compiled from vital registration and administrative records. The data from each of these sources give different aspects of information on marriages and divorces in the country. Census and survey data are by nature, subjective individual information that provide cross-sectional data on individuals’ marital status (single, married, divorced, widowed, etc). Therefore marriage and divorce in this context cover different types of marriages and associated divorces that took place at different periods in people’s lives. However, not all types of marriages and divorces are registered.
The specific types of marriage and divorce that can be registered in South Africa are stipulated and governed by legal frameworks. Unlike surveys, registered marriages and divorces data are based on continuous recording of these events as they take place. The management of registered marriages or unions is the responsibility of the Department of Home Affairs (DHA), with different legislations as follows:
Civil marriages are administered through the Marriage Act, 1961 (Act No. 25 of 1961) as amended, and its associated regulations.
Customary marriages are governed by the Recognition of Customary Marriages Act, 1998 (Act No. 120 of 1998) that came into effect on 15 November 2000.
The Civil Union Act, 2006 (Act No. 17 of 2006) governs civil unions and it came into operation on 30 November 2006.
The Department of Justice and Constitutional Development (DoJ&CD) is responsible for handling matters relating to the dissolution of registered marriages and civil unions. This responsibility of the department is mandated through:
The Divorce Act, 1979 (Act No.70 of 1979), as amended; and
The Jurisdiction of Regional Courts Amendment Act, 2008 (Act No. 31 of 2008) as amended, which came into effect on 9 August 2010.
Statistics South Africa (Stats SA) publishes data on marriages for citizens and permanent residents that are collected through the civil registration systems of DHA. Before 2008, the data in the annual release covered only civil marriages. However in 2009, Stats SA started publishing available data on customary marriages and civil unions. The registration of customary marriages and civil unions began in 2003 and 2007, respectively.
In addition to marriages and civil unions, Stats SA also publishes data on divorces from civil marriages. The divorces are successful applications for divorce in accordance with a decree that has been issued. Divorce cases belong to civil marriages that were registered in different years but whose divorce decrees were granted in the same year. Both the marriages and divorces data are based on the calendar year. It is important to note that although both the data on civil marriages and divorces are collected in the same year, the two data sets are not linked to each other. Hitherto, only divorce cases from civil marriages have been published. Publication of statistics on divorces from registered customary marriages and civil unions will be made available when sufficient data have been registered.
As a result of the coming into operation of the Jurisdiction of Regional Courts Amendment Act, 2008, there has been an increase in the number of courts mandated to deal with divorce cases from 12 to 62 courts. However, due to differentials in human, physical and technical infrastructure, not all the courts are in a position to deal with the demand of completing, compiling and mailing the divorce forms from the courts to Stats SA regularly. By September 2012, Stats SA had received divorce forms from 43 courts. The 2011 divorce forms that will be received later will be processed and used to update the 2011 results, which will be published in the 2012 annual release.
2 Statistics South Africa P0307
Marriages and Divorces, 2011
2. Marriages
2.1 Civil marriages
2.1.1 Trends in civil marriages (2002–2011)
Information provided in Table 1 shows that a total of 167 264 civil marriages of South African citizens and permanent residents was registered at the Department of Home Affairs in 2011. This number includes 311 (0,2%) marriages of South African citizens and permanent residents that were solemnised outside the borders of South Africa but subsequently registered in South Africa. The table further shows that the number of registered marriages fluctuated between 2002 and 2008, after which there was a consistent decline. During the period 2002–2011, the highest number of marriages was recorded in 2008 (186 522) and the lowest number in 2011 (167 264). The 2011 figure of 167 264 civil marriages shows a decrease of 2,1% from the 170 826 marriages recorded in 2010.
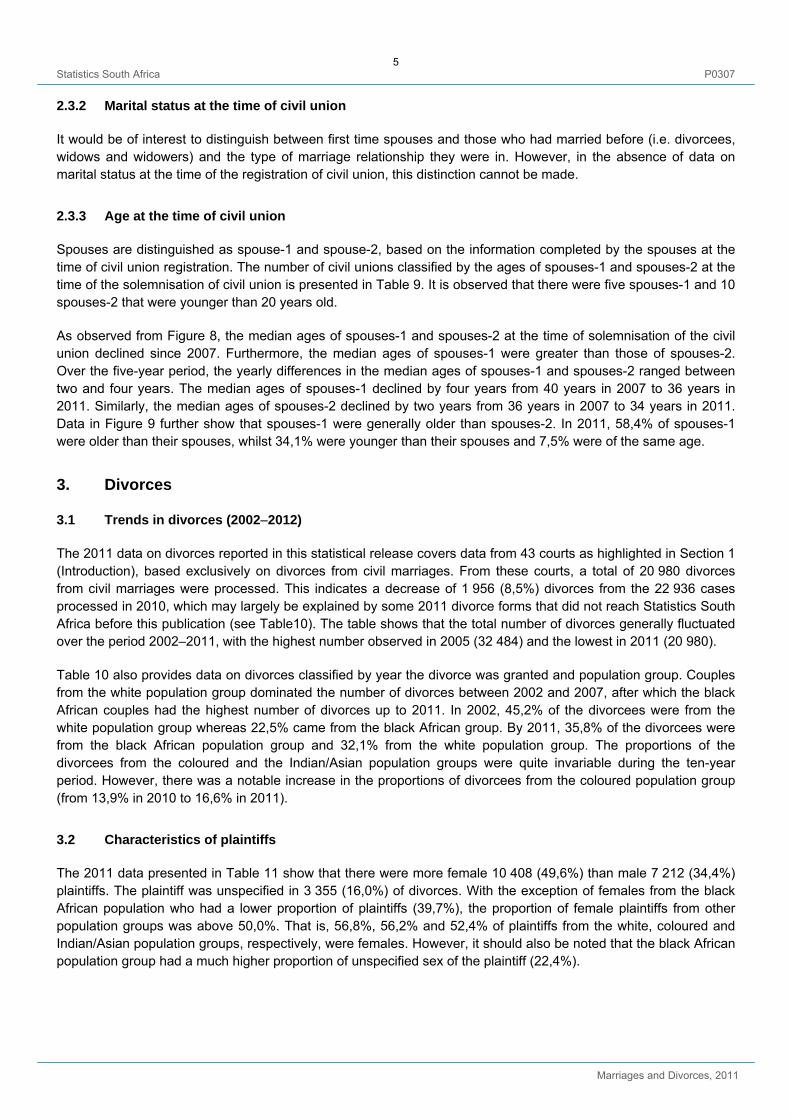
Over time, the number of civil marriages in South Africa varied by month of registration. As shown in Figure 1, the warmer months (beginning from September and peaking in December) are generally the most popular months for solemnising marriages. In 2011, the highest number of marriages [27 676; (16,5%)] took place in December compared to June which recorded the lowest number of marriages, [10 254; (6,1%)].
2.1.2 Solemnisation of marriages
The Marriage Act, 1961 (Act No. 25 of 1961) requires that only licensed marriage officers solemnise civil marriages and issue a marriage certificate. Civil marriages are generally solemnised at the offices of the DHA and at chapels or religious buildings. After a solemnisation ceremony, the marriage officer issues the couple with an unabridged marriage certificate (BI-27) free of charge and submits the marriage register at any DHA office for the recording of the marriage particulars in the National Population Register (NPR).
Table 2 shows the distribution of civil marriages registered in 2011 according to the way in which the marriage was solemnised: (i) ‘DHA marriages’ for marriages solemnised by DHA marriage officers and (ii) ‘religious marriages’ for marriages solemnised by priests/religious persons. It is observed that 85 311 (51,0%) of the 167 264 marriages were solemnised by DHA marriage officers and 56 405 (33,7%) by ‘religious’ rites. The type of solemnisation rite was not specified in 25 548 (15,3%) marriages.
The table also provides information on province of marriage registration. The province of registration is not necessarily the province of usual residence of the couple since couples could marry at a place of their choice and the registration of the marriage can take place in a DHA office of choice of the couple. In addition, a marriage officer can register the marriages he or she solemnises in any DHA office.
The results presented in Table 2 show that in 2011, the highest number of all marriages was registered in Gauteng [34 267; (20,5%)], followed by Western Cape [27 596; (16,5%)], KwaZulu-Natal [27 545; (16,5%)] and Eastern Cape [26 980 (16,1%)]. Western Cape had the highest proportion of registered marriages solemnised by ‘religious’ rites (47,7%) and Limpopo had the lowest (21,7%). The highest proportion of marriages solemnised by DHA marriage officers was observed in North West (74,5%) and the lowest in Mpumalanga (33,6%). However, these results need to be interpreted with caution given that the proportion of civil marriages with unspecified way of solemnisation differed widely by province. For example, 36,0% of marriages in Mpumalanga did not state the way of solemnisation compared to only 2,9% in North West.
2.1.3 Marital status at the time of marriage
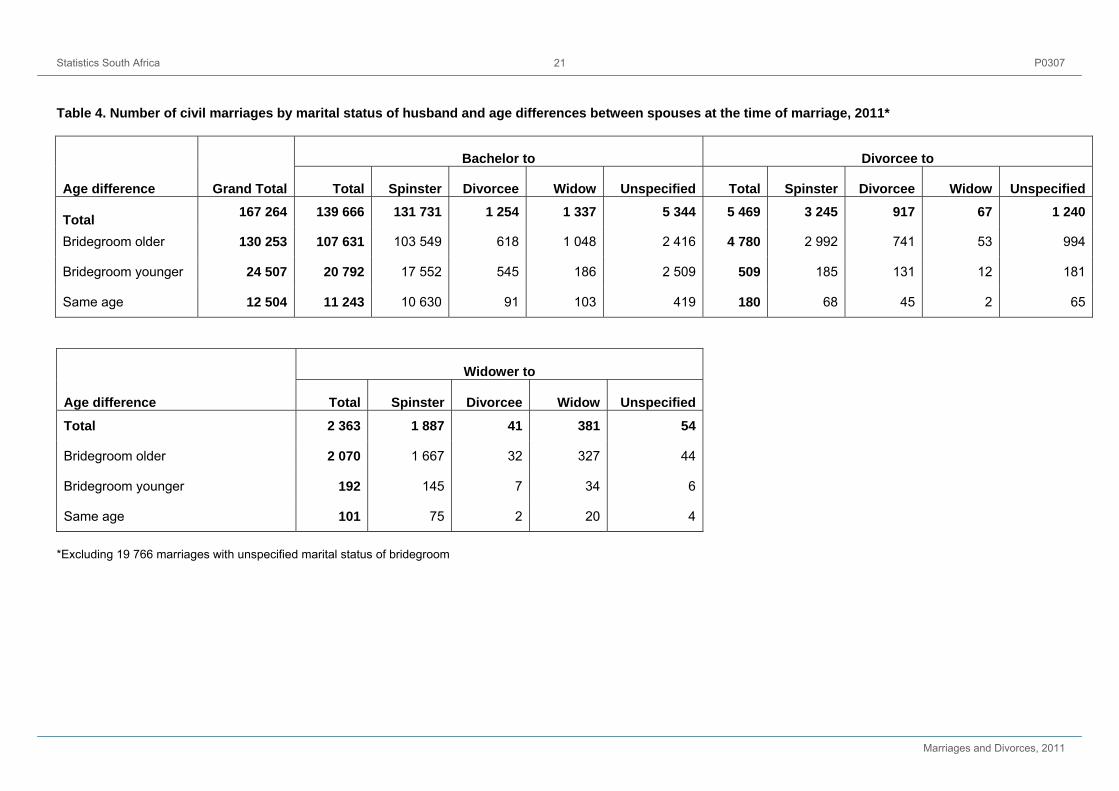
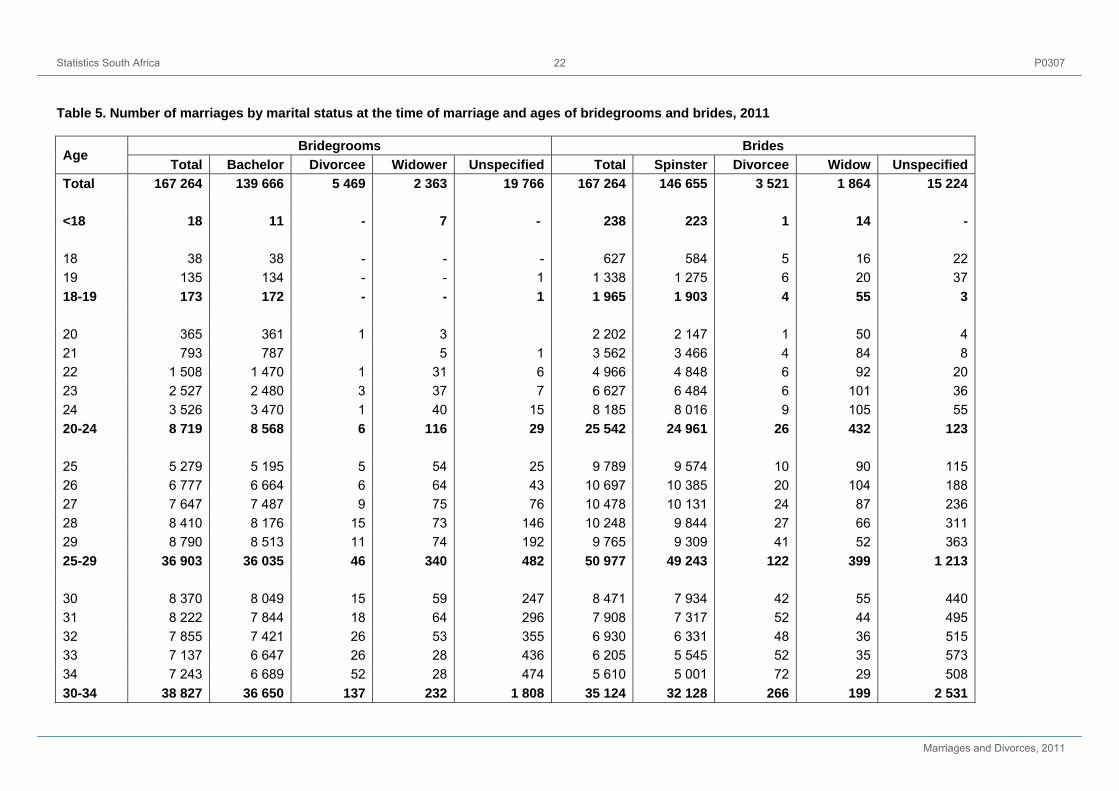
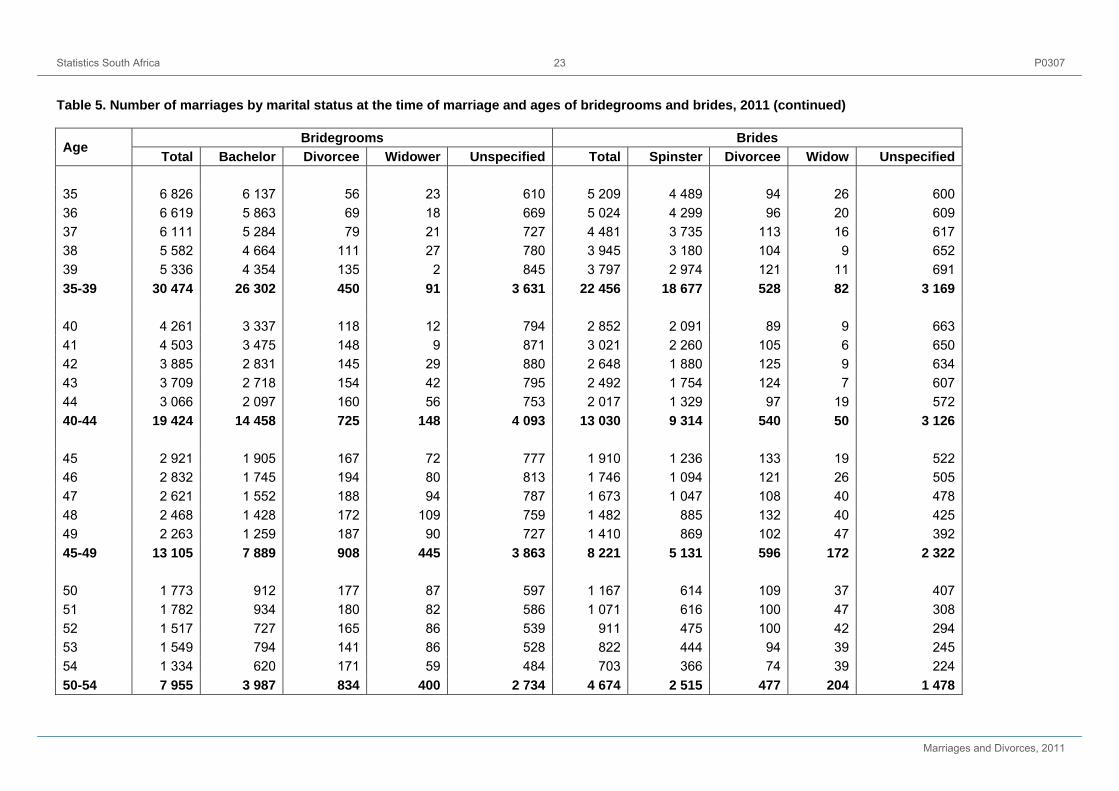
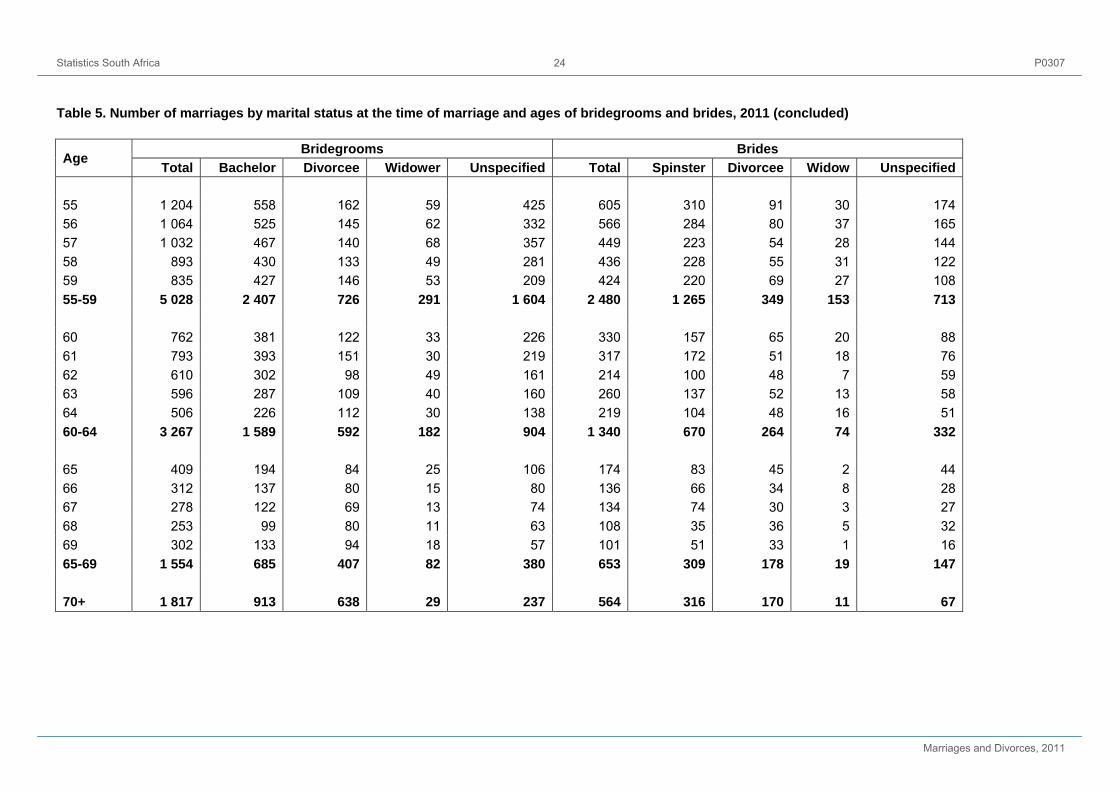
Data presented in Table 3 indicate that most of the marriages in 2011 for both bridegrooms and brides were first-time marriages. For bridegrooms, there were 139 666 (83,5%) bachelors, 5 469 (3,3%) divorcees and 2 363 (1,4%) widowers. For the brides, 146 655 (87,7%) were spinsters whilst 3 521 (2,1%) were divorcees and 1 864 (1,1%) were widowers. The marital status of 19 766 (11,8%) bridegrooms and 15 224 (9,1%) brides was not recorded.
3 Statistics South Africa P0307
Marriages and Divorces, 2011
It is also observed from Table 4 that irrespective of their marital status, men generally married women who had never been married (spinsters). Thus, 131 731 (94,3%), 1 254 (0,9%) and 1 337 (1,0%) spinsters, divorcees and widowers respectively married bachelors. In addition, irrespective of the fact that more divorcees and widowers married spinsters, the proportion of male divorcees who married female divorcees (16,8%) was higher than the proportion that married widows (1,2%). Similarly, the proportion of widowers who married widows (16,1%) was higher than the proportion that married female divorcees (1,7%).
2.1.4 Age at the time of marriage
Population scientists are interested in the age at first marriage or union because of its theoretical link to exposure to the risk of pregnancy, childbearing and ultimately to fertility. This link tends to be weakened in populations where pre-marital fertility is widespread. Nevertheless, age at first marriage or union continues to be a good proxy for measuring not only fertility but other health and socio-economic indicators relating particularly to the role and status of women in society. The importance of this indicator is, to some extent, underscored in South Africa through the marriage legislations that put restrictions on marriages involving minors (persons under 18 years old). These minors require the consent of a parent, a guardian or a commissioner of welfare before entering into a marriage. In addition to the above consent, boys under 18 years and girls under 16 years of age require the consent of the Minister of Home Affairs before they can marry.
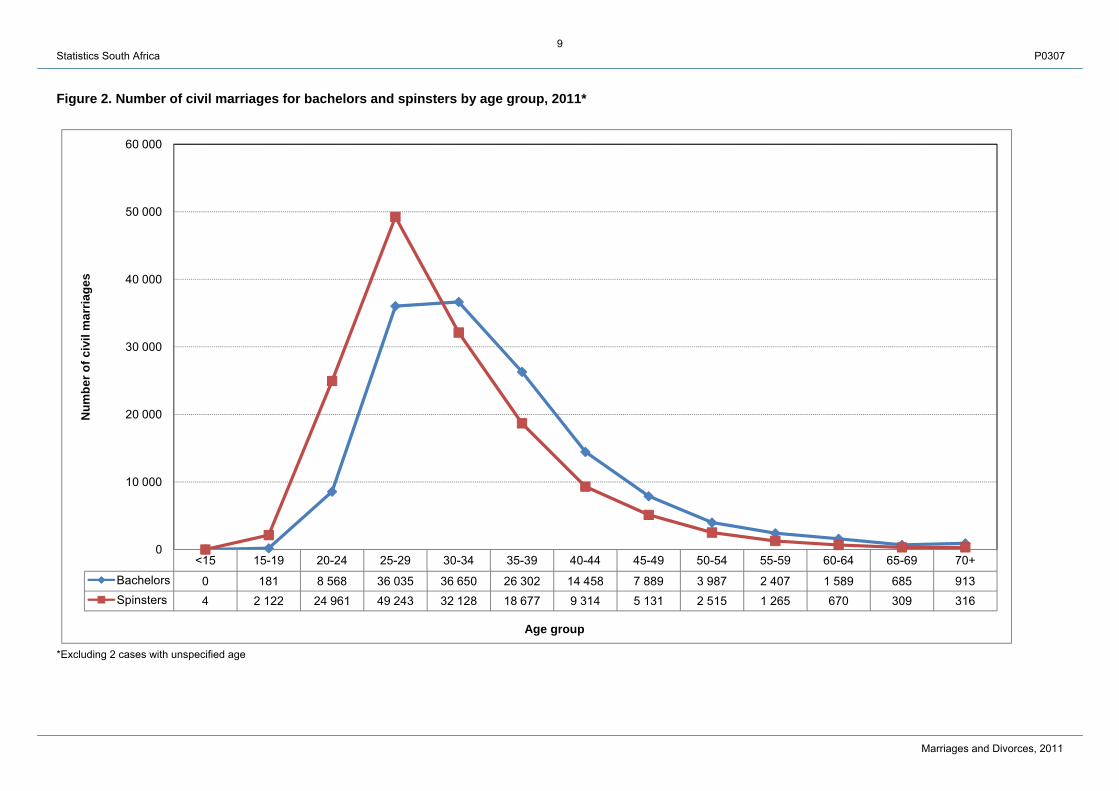
In 2011, marriages of 18 bridegrooms and 238 brides aged less than 18 years were registered, with 11 bridegrooms and 223 brides marrying for the first time (see Table 5). Furthermore, Figure 2 indicates that the highest number of bachelors [36 650 (26,2%)] were aged 30–34 years whereas the highest number of spinsters [49 243 (34,0%)] were aged 25–29 years. There were more spinsters compared to bachelors at younger ages (less than 30 years) and vice versa at older ages (30 years and older).
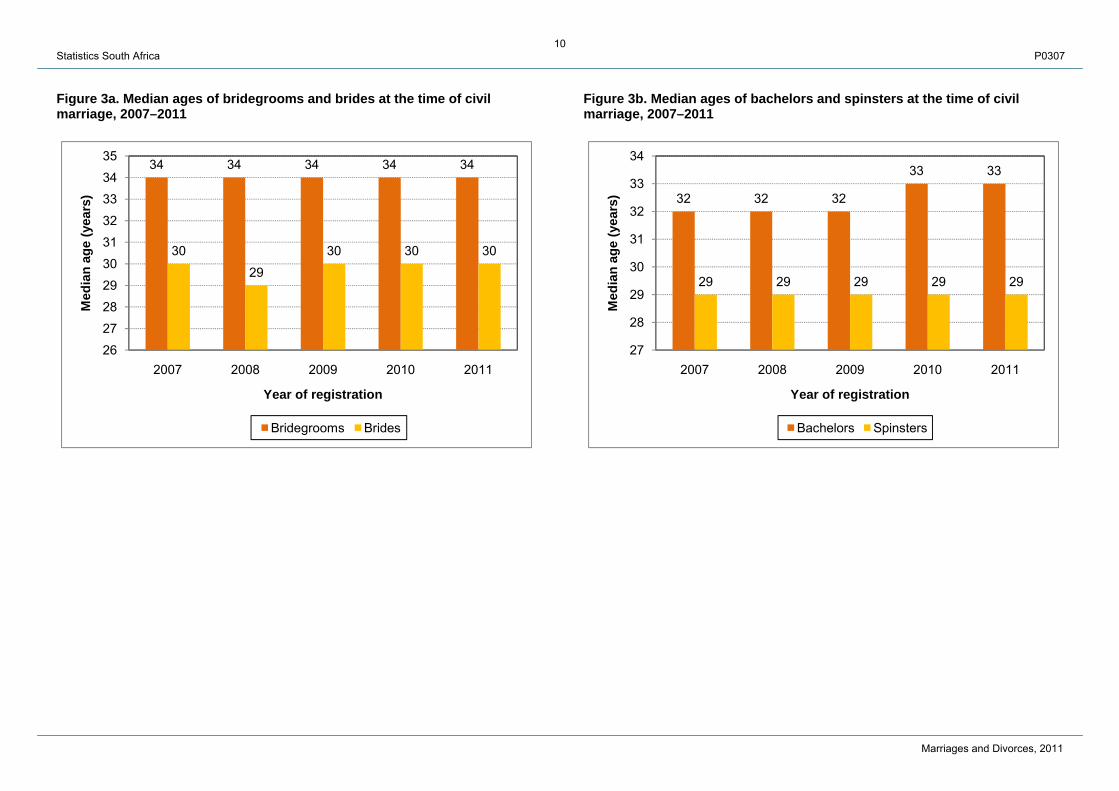
The overall median ages by year of registration presented in Figure 3a shows that the median ages have remained more or less constant for both bridegrooms (34 years) and brides (30 years), with a constant age difference of four years. Figure 3a to Figure 3d further show that women generally entered marriage at younger ages than men, with wide age difference between spouses depending on the marital status of couples at the time of current marriage. In addition, the median ages at current marriage was lowest for those marrying for the first time, followed by those widowed and highest for divorcees.
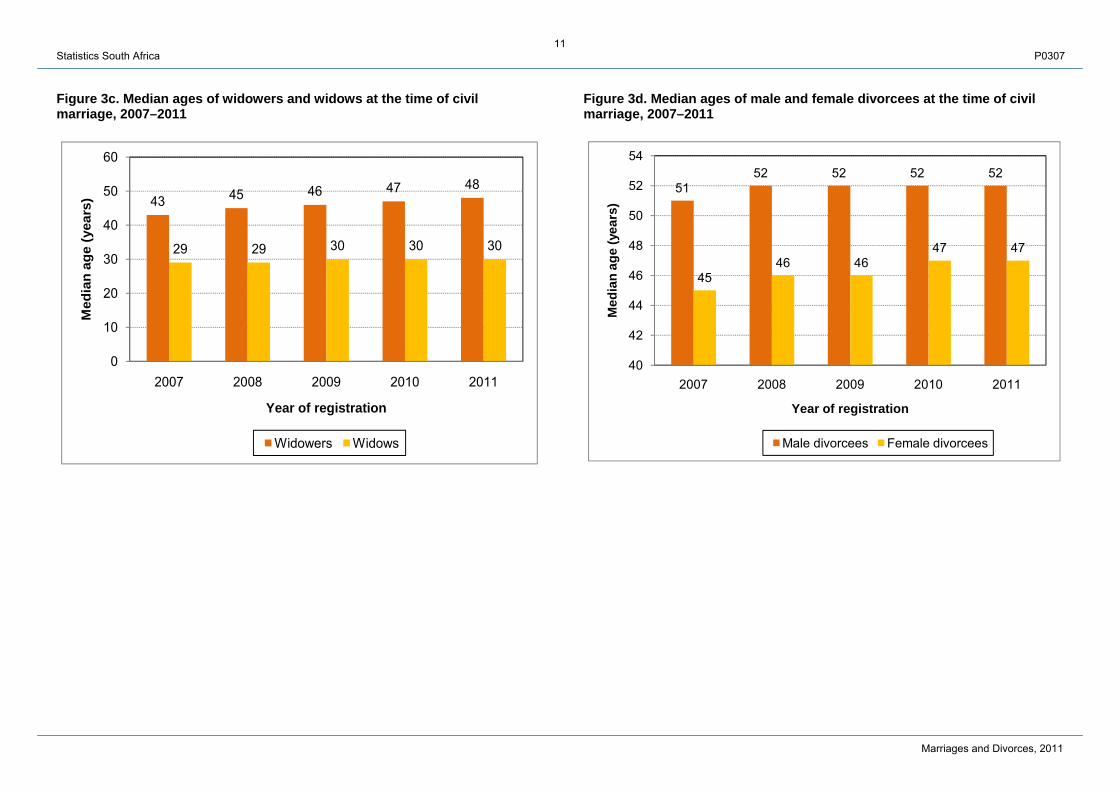
For first time marriages, the median ages for bachelors and spinsters were 34 years and 29 years respectively in 2011, giving an age difference of four years (see Figure 3b). The ages of brides remained at 29 years throughout the 5-year period between 2007 and 2011, while for males the median age was 32 years between 2007 and 2009 and increased to 33 years in 2010 and 2011. For remarriages, the median ages for widowers and widows in 2011 (Figure 3c) were 48 years and 30 years respectively, resulting in an eighteen-year age gap. The median ages for widowers consistently increased every year from 43 years in 2007 to 48 years in 2011 whereas the median ages for widows were quite stable at 29 years from 2007 to 2008, and increased to 30 years in 2009 until 2011. Median ages at marriage for divorcees are shown in Figure 3d. It is observed that the median ages for male divorcees were generally constant over the five-year period, with an increase of one year from 51 in 2007 to 52 in 2008, and remained at this level until 2011. In comparison, the median age of female divorcee increased from 45 years in 2007 to 47 years in 2011. There was a five-year age difference in the median ages between male and female divorcees in 2011.
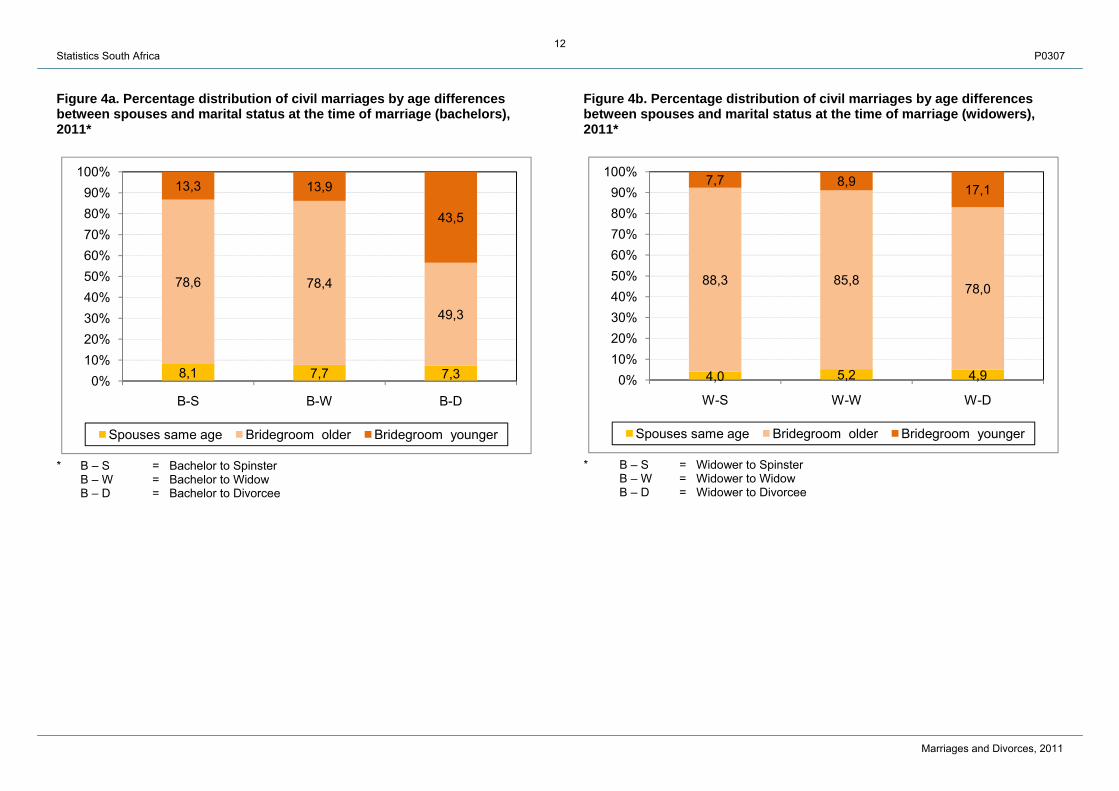
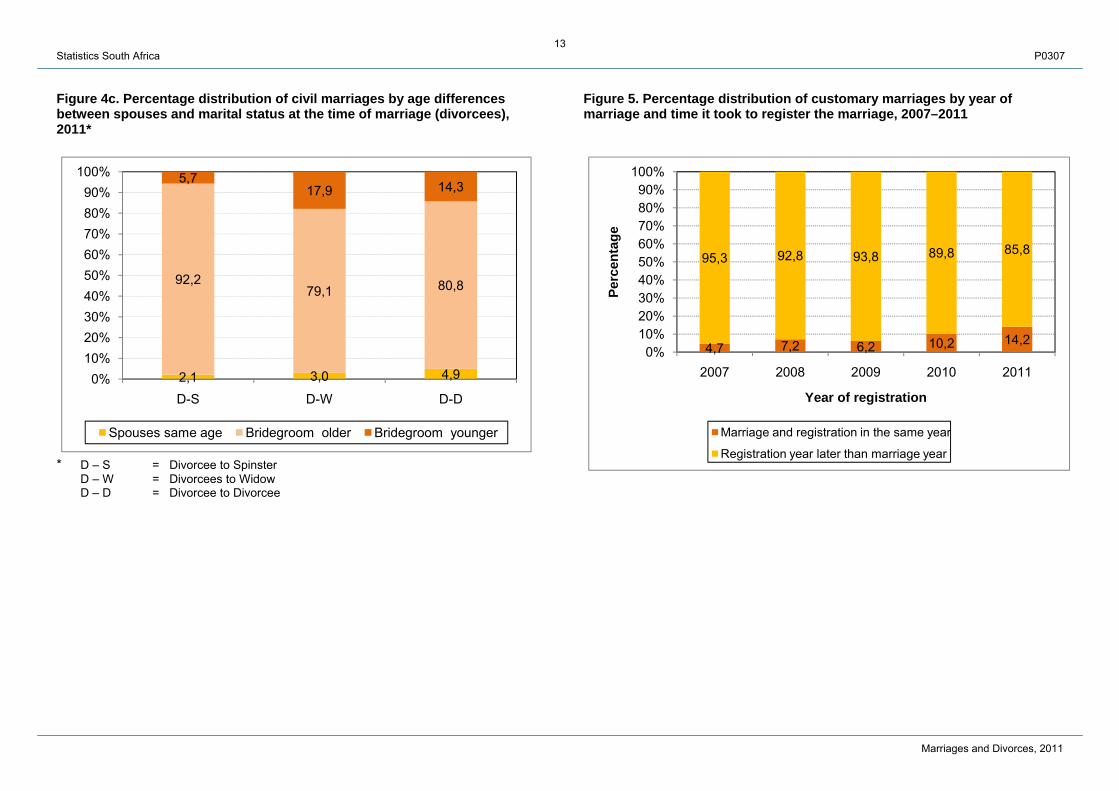
Despite the fact that men tend to marry younger women, data in Table 4 indicate that in 2011, 24 507 (14,7%) bridegrooms were younger than their brides whilst 12 504 (7,5%) were of the same age as their brides. This observed age pattern is the same irrespective of the marital status of the bridegroom at the time of marriage (see Figures 4a to 4c). However, the magnitude differs by the marital status of the spouses at the time of marriage. For example, as much as 43,5% of bachelors who married divorcees were younger than their brides (Figure 4a) and 17,9% of male divorcees who married widowed women were also younger than their brides (Figure 4c). A relatively smaller percentage (5,7%) was observed for male divorcees marrying spinsters who were older than themselves (Figure 4c).
4 Statistics South Africa P0307
Marriages and Divorces, 2011
2.2 Customary marriages
2.2.1 Trends in the registration of customary marriages (2003–2011)
In 2011, 5 084 customary marriages were registered at the Department of Home Affairs, indicating a decline of 49,1% from 9 996 customary marriages registered in 2010. It is observed from Table 6 that the number of registered customary marriages fluctuated between 2003 and 2007 after which there was a consistent decline. The highest number of registered customary marriages was recorded in 2004 (20 301) whilst the least number was recorded in 2011 (5 084).
The Recognition of Customary Marriages Act, 1998 (Act No. 120 of 1998) prescribes that customary marriages entered after the commencement of this Act must be registered within a period of three months after the conclusion of the marriage and those entered before the Act to be registered within 12 months of the commencement of the Act. Figure 5 shows that the majority of customary marriages were registered later than the year of marriage. During the period from 2007 to 2011, the proportion of marriages that were registered in the same year they took place, ranged from only 4,7% in 2007 to 14,2% in 2011, indicating a modest increase over time.
2.2.2 Marital status at the time of customary marriage
Since the Recognition of Customary Marriages Act, 1998 does not prohibit a male person already in a customary marriage to enter into a civil marriage or another customary marriage, it would be of interest to distinguish between first time spouses and those who have married before (i.e. those in polygynous marriages, divorcees, widows and widowers). However, in the absence of data on marital status at the time of the registration of customary marriage, this distinction cannot be made.
2.2.3 Age at the time of customary marriage
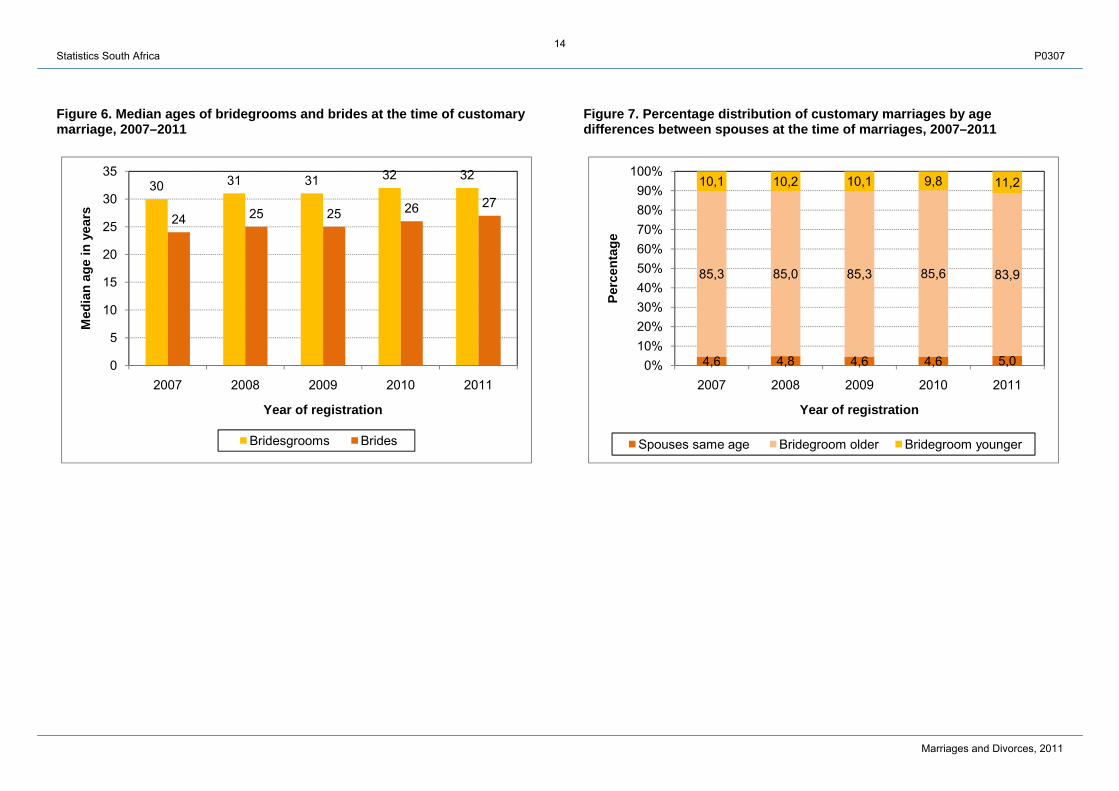
The age distribution of bridegrooms and brides at the time of customary marriage is presented in Table 7. In 2011, there were 14 (0,3%) bridegrooms and 174 (3,4%) brides who were younger than 18 years. The median ages at the time of customary marriage are presented in Figure 6. Similar to civil marriages, bridegrooms were generally older than brides, with an age difference of about five to six years for customary marriages registered between 2007 and 2011.
For both bridegrooms and brides, median ages at the time of customary marriage increased gradually over time – median ages of bridegrooms increased from 30 years in 2007 to 32 years in 2011 and those for brides increased from 24 years to 27 years during the same period. A further comparison of the ages of bridegrooms and brides (see Figure 7) shows that in 2011, 83,9% of bridegrooms were older than their brides whilst 11,2% were younger than their brides and 5,0% were of the same age.
2.3 Civil unions
2.3.1 Trends in the registration of civil unions (2007–2011)
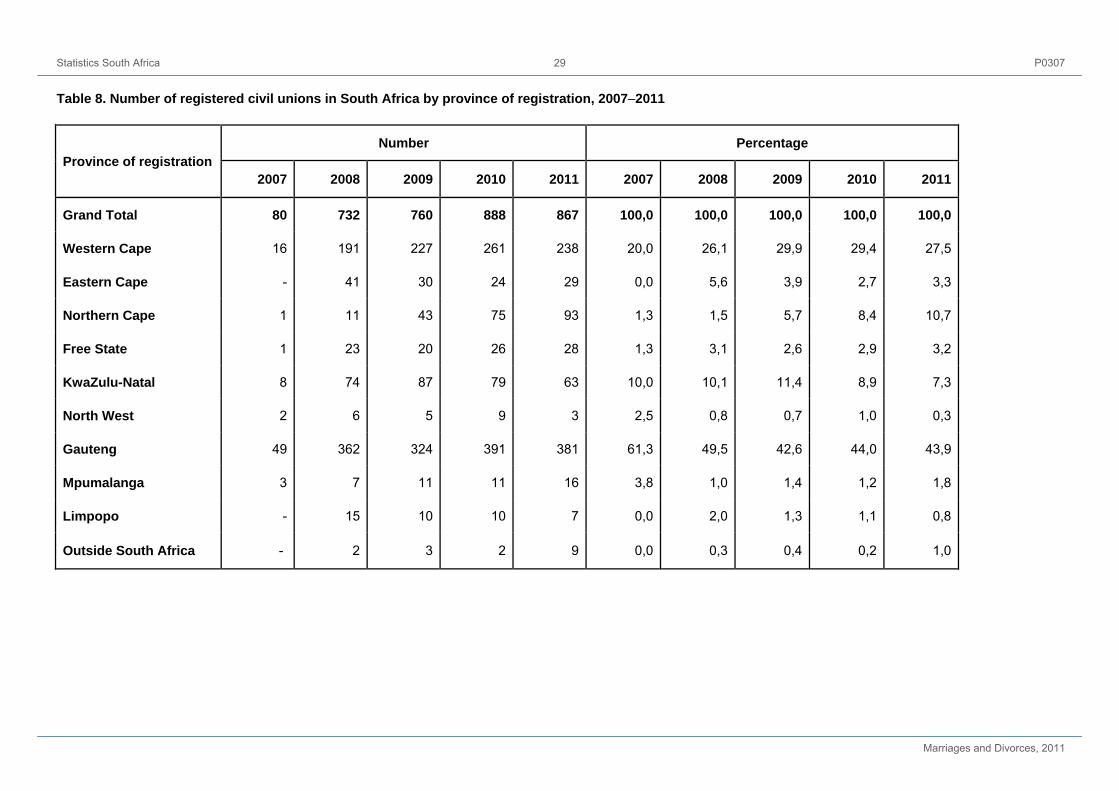
Data in Table 8 show that in 2011, 867 civil unions were registered (including the registration of nine civil unions of South African citizens and permanent residents living outside South Africa). In general, the number of civil unions registered in South Africa increased from 80 in 2007 to 888 in 2010 and then declined marginally to 867 in 2011. The provincial distribution of civil unions registered in 2011 indicates that Gauteng (381) and Western Cape (238) were the provinces with the highest number of registrations of civil unions. In total, nearly three quarters (71,4%) of civil unions in 2011 were registered in these two provinces. Since 2008, the lowest number of registered civil unions was recorded in North West, with only three civil unions registered in 2011.
5 Statistics South Africa P0307
Marriages and Divorces, 2011
2.3.2 Marital status at the time of civil union
It would be of interest to distinguish between first time spouses and those who had married before (i.e. divorcees, widows and widowers) and the type of marriage relationship they were in. However, in the absence of data on marital status at the time of the registration of civil union, this distinction cannot be made.
2.3.3 Age at the time of civil union
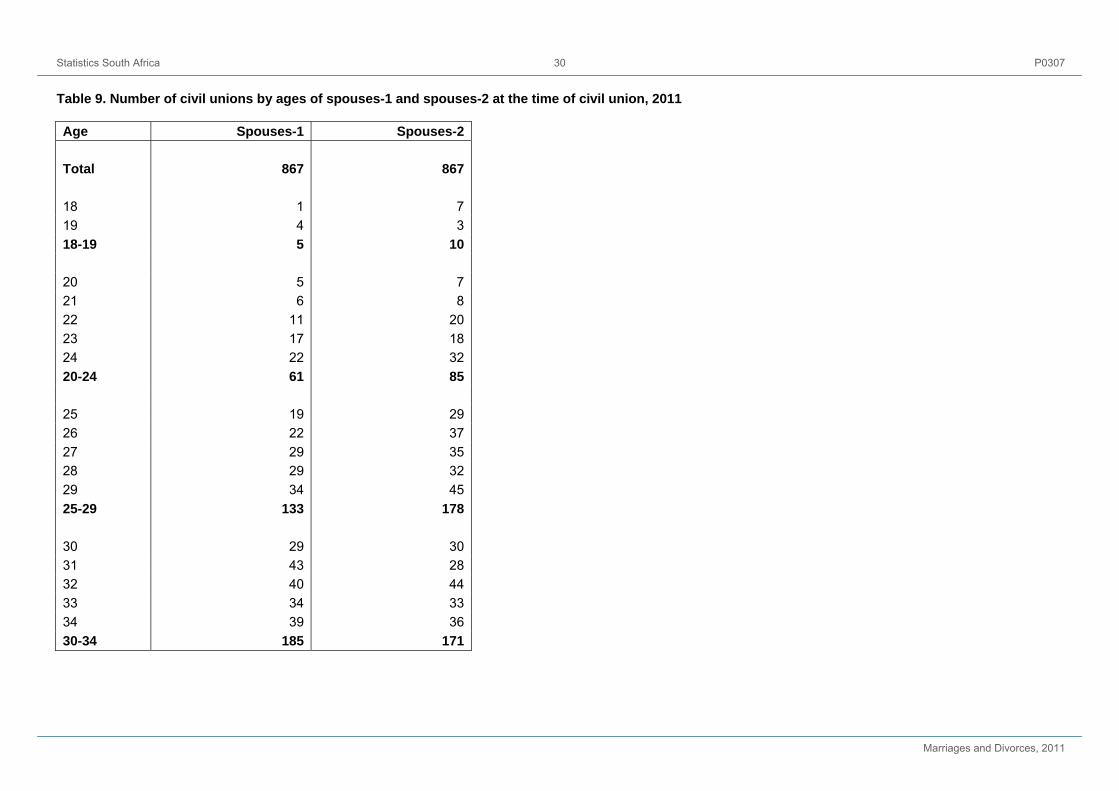
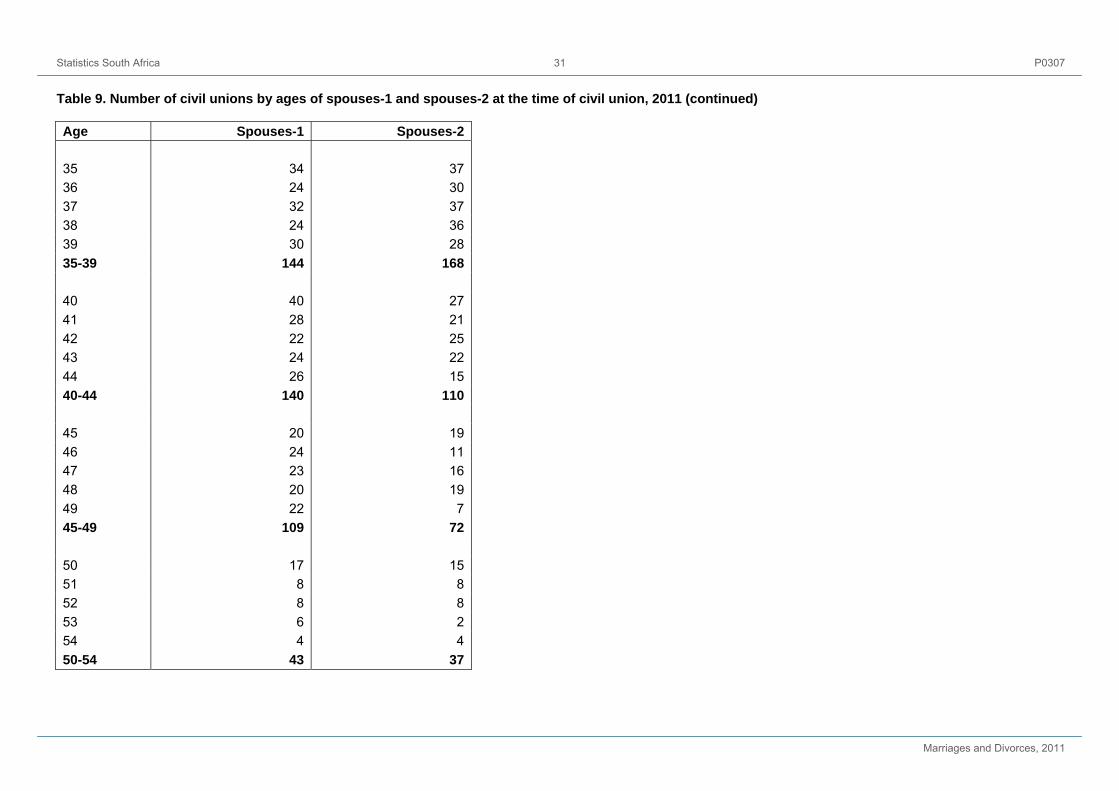
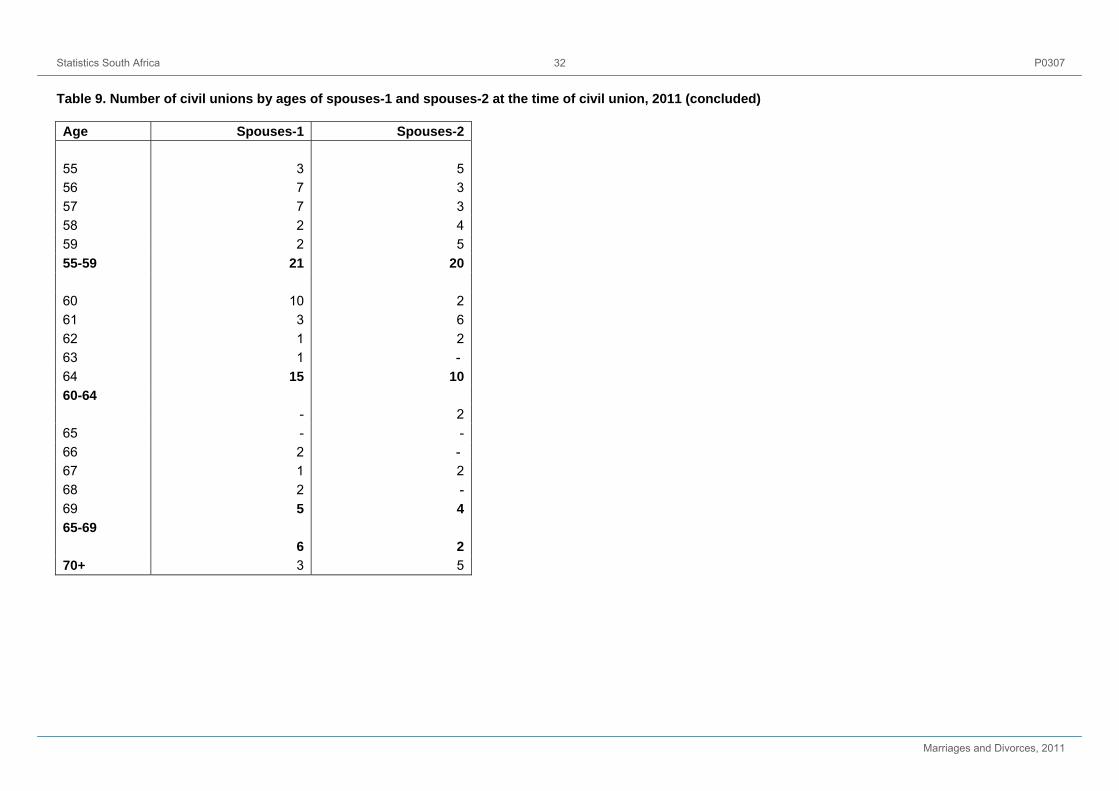
Spouses are distinguished as spouse-1 and spouse-2, based on the information completed by the spouses at the time of civil union registration. The number of civil unions classified by the ages of spouses-1 and spouses-2 at the time of the solemnisation of civil union is presented in Table 9. It is observed that there were five spouses-1 and 10 spouses-2 that were younger than 20 years old.
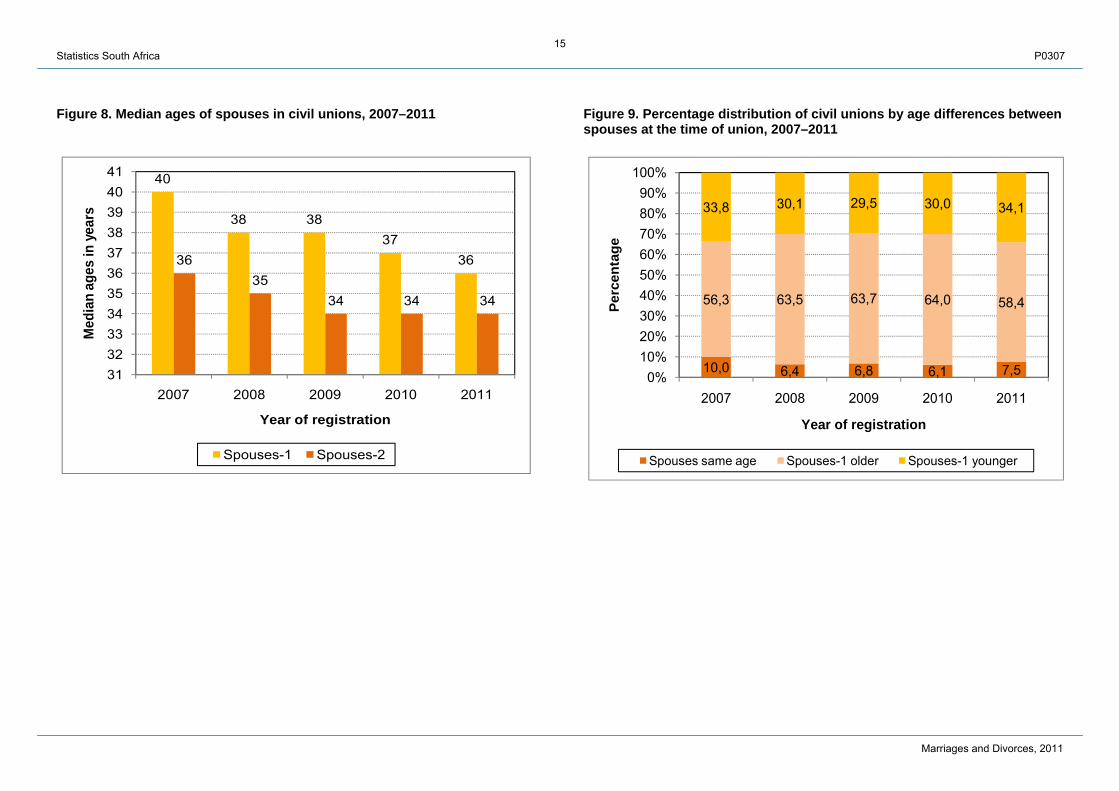
As observed from Figure 8, the median ages of spouses-1 and spouses-2 at the time of solemnisation of the civil union declined since 2007. Furthermore, the median ages of spouses-1 were greater than those of spouses-2. Over the five-year period, the yearly differences in the median ages of spouses-1 and spouses-2 ranged between two and four years. The median ages of spouses-1 declined by four years from 40 years in 2007 to 36 years in 2011. Similarly, the median ages of spouses-2 declined by two years from 36 years in 2007 to 34 years in 2011. Data in Figure 9 further show that spouses-1 were generally older than spouses-2. In 2011, 58,4% of spouses-1 were older than their spouses, whilst 34,1% were younger than their spouses and 7,5% were of the same age.
3. Divorces
3.1 Trends in divorces (2002–2012)
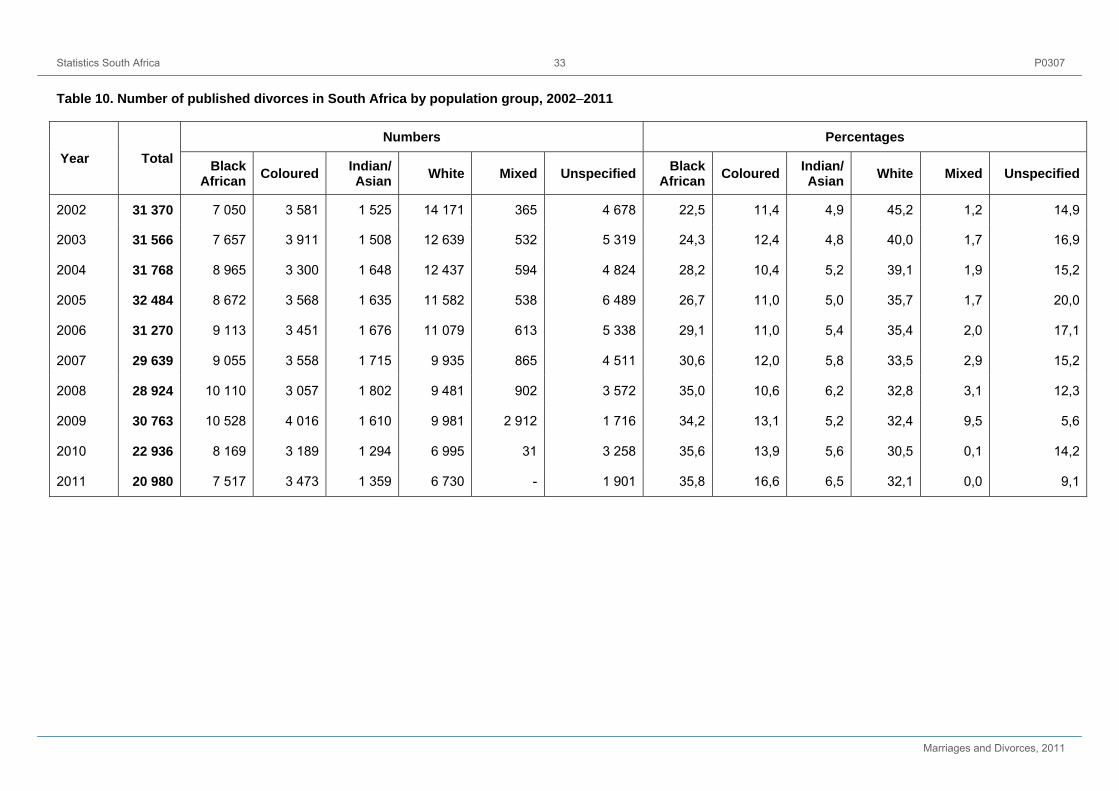
The 2011 data on divorces reported in this statistical release covers data from 43 courts as highlighted in Section 1 (Introduction), based exclusively on divorces from civil marriages. From these courts, a total of 20 980 divorces from civil marriages were processed. This indicates a decrease of 1 956 (8,5%) divorces from the 22 936 cases processed in 2010, which may largely be explained by some 2011 divorce forms that did not reach Statistics South Africa before this publication (see Table10). The table shows that the total number of divorces generally fluctuated over the period 2002–2011, with the highest number observed in 2005 (32 484) and the lowest in 2011 (20 980).
Table 10 also provides data on divorces classified by year the divorce was granted and population group. Couples from the white population group dominated the number of divorces between 2002 and 2007, after which the black African couples had the highest number of divorces up to 2011. In 2002, 45,2% of the divorcees were from the white population group whereas 22,5% came from the black African group. By 2011, 35,8% of the divorcees were from the black African population group and 32,1% from the white population group. The proportions of the divorcees from the coloured and the Indian/Asian population groups were quite invariable during the ten-year period. However, there was a notable increase in the proportions of divorcees from the coloured population group (from 13,9% in 2010 to 16,6% in 2011).
3.2 Characteristics of plaintiffs
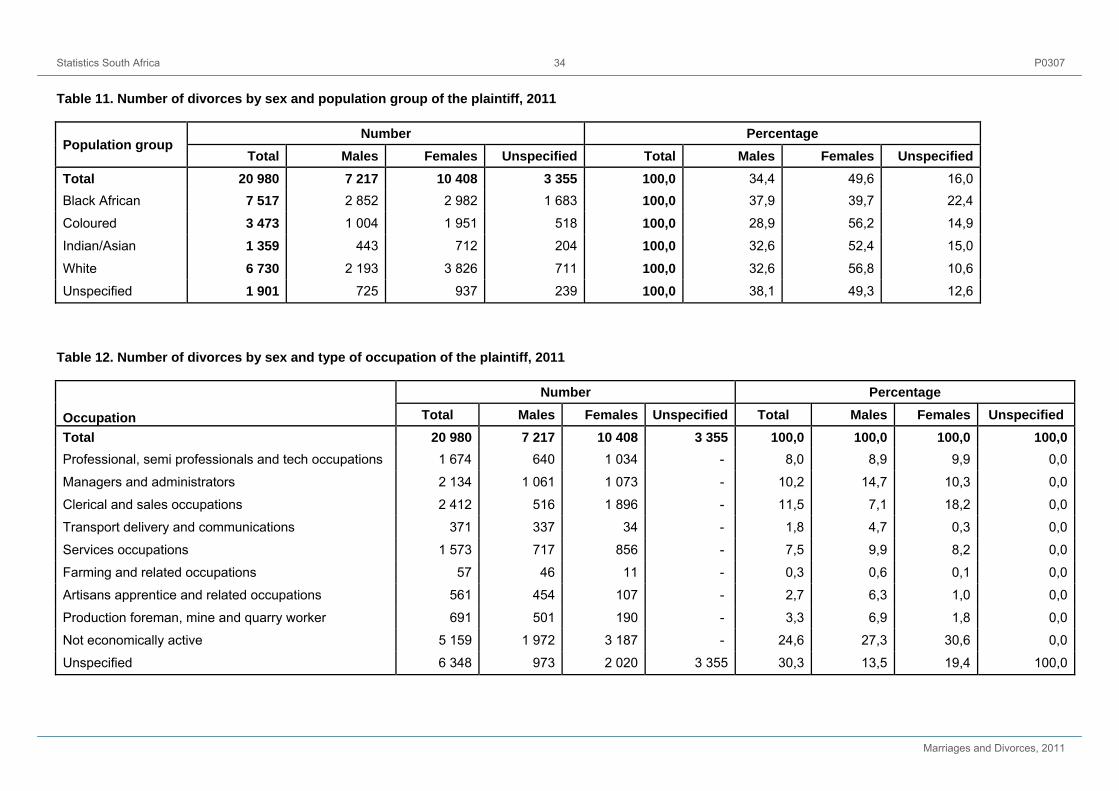
The 2011 data presented in Table 11 show that there were more female 10 408 (49,6%) than male 7 212 (34,4%) plaintiffs. The plaintiff was unspecified in 3 355 (16,0%) of divorces. With the exception of females from the black African population who had a lower proportion of plaintiffs (39,7%), the proportion of female plaintiffs from other population groups was above 50,0%. That is, 56,8%, 56,2% and 52,4% of plaintiffs from the white, coloured and Indian/Asian population groups, respectively, were females. However, it should also be noted that the black African population group had a much higher proportion of unspecified sex of the plaintiff (22,4%).
6 Statistics South Africa P0307
Marriages and Divorces, 2011
Table 12 provides information on the occupation of the plaintiffs. It is noted that a high proportion of the plaintiffs (13,5% of the males and 19,4% of the females) did not indicate the type of occupation they were engaged in at the time of divorce. In addition, 27,3% and 30,6% of the males and females respectively were not economically active at the time of divorce.
For specified occupations, most of those who divorced in 2011 were in clerical and sales occupations (11,5%) and managers and administrators (10,2%), with some differences observed by sex of the plaintiff. Husbands who divorced were largely managers and administrators (14,7%) while females who divorces were mainly in clerical and sales occupations (18,2%). Less than a quarter of males (23,6%) and females (20,2%) were in the professional and managerial occupations. Very few plaintiffs were in farming and related occupations.
3.3 Solemnisation of marriages that ended in divorce
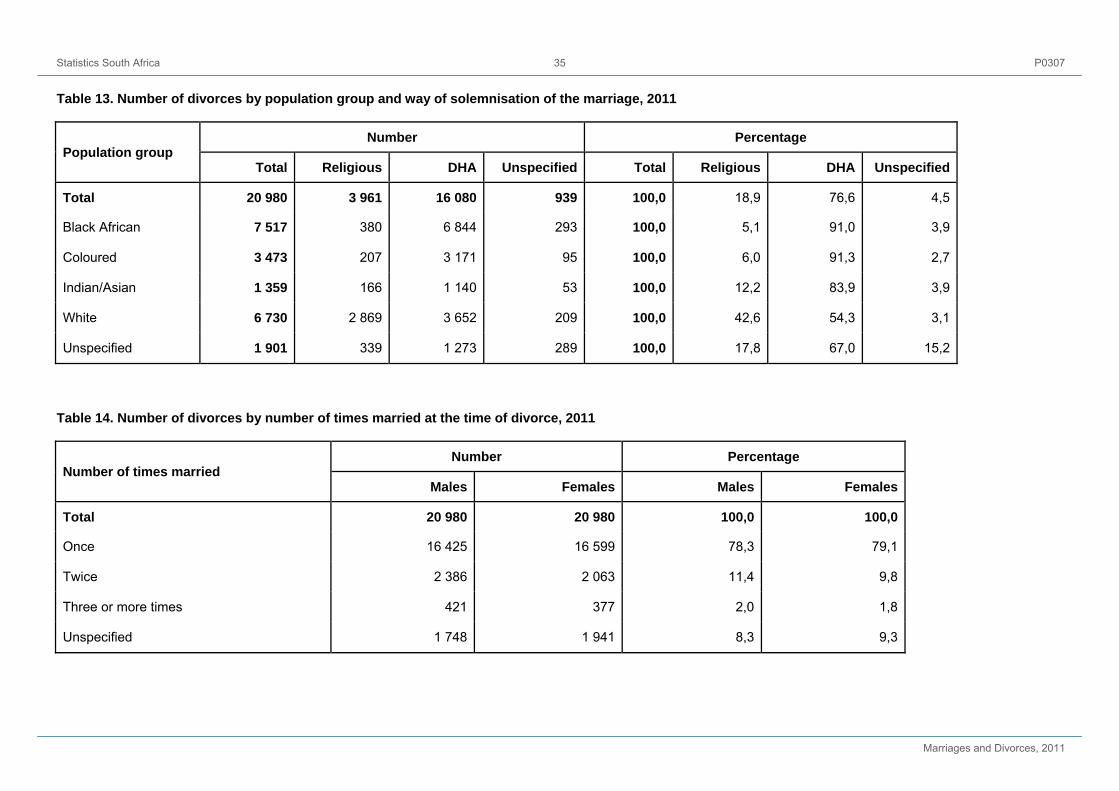
Data presented in Table 13 show that 3 961 (18,9%) of the 2011 divorce cases were from marriages that were solemnised by religious rites and 16 080 (76,6%) by DHA marriage officers. This indicates that in general, the marriages that are eventually dissolved are mostly solemnised by DHA marriage officers, which also follows from the fact that most marriages are solemnised in this way. A similar pattern was also found among all population groups, although the magnitude differs. Over 90% of divorces for the black African (91,0%) and the coloured (91,3%) population groups were solemnised by DHA marriage officials, compared to 83,9% for Indians/Asians and 42,6% for the white population.
3.4 Number of times married
Table 14 shows that the 2011 divorce cases for both males and females were mainly from individuals who had married once. About 80,0% of divorces for males and females were from first-time marriages compared to approximately 10,0% from second-time marriages. About 2,0% of males and females were getting divorced for at least the third time.
3.5 Age at the time of divorce
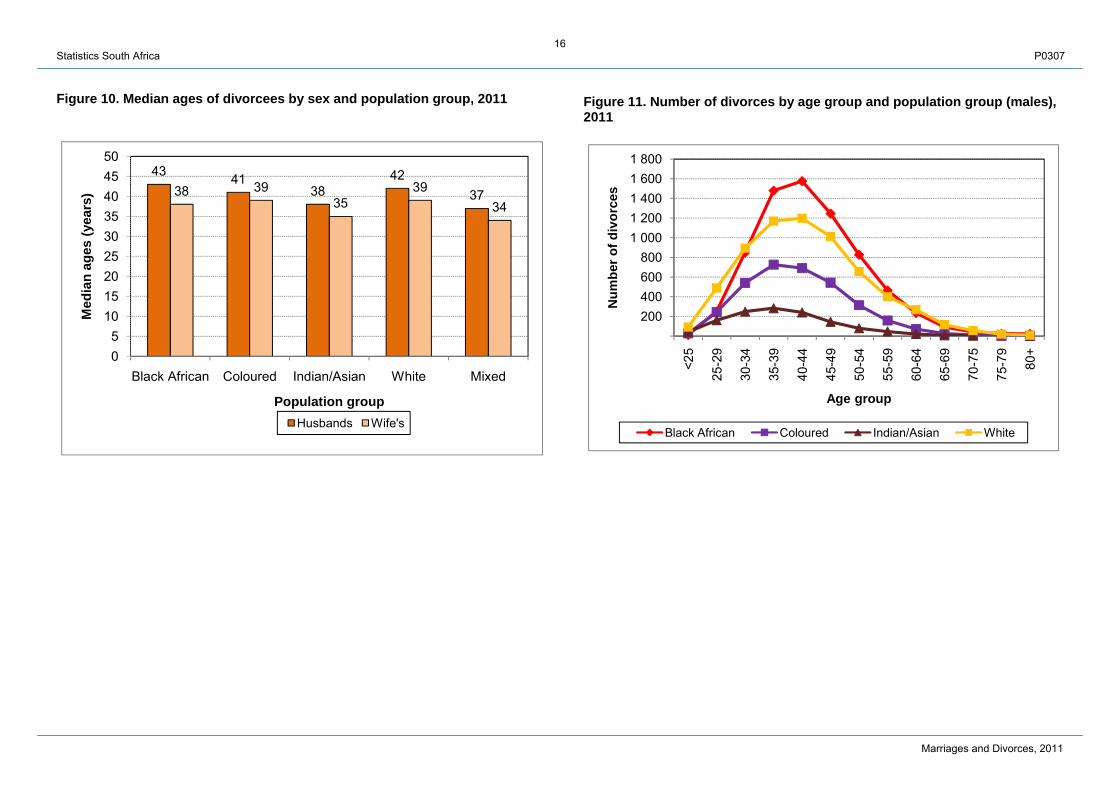
The median ages at divorce in 2011 were 42 years for males and 38 years for females, indicating that males generally divorced at older ages than females, with a difference of about four years. The median age for males was up from 41 years in 2010 while it remained the same for females for 2010 and 2011. The pattern of median ages in 2011 by population group (see Figure 10) shows that black African males had the highest median age (43 years) at the time of divorce while females from the mixed group had the lowest median age (34 years). The age difference at the time of divorce was highest for black African couples (five years) and was between two and three years for other couples.
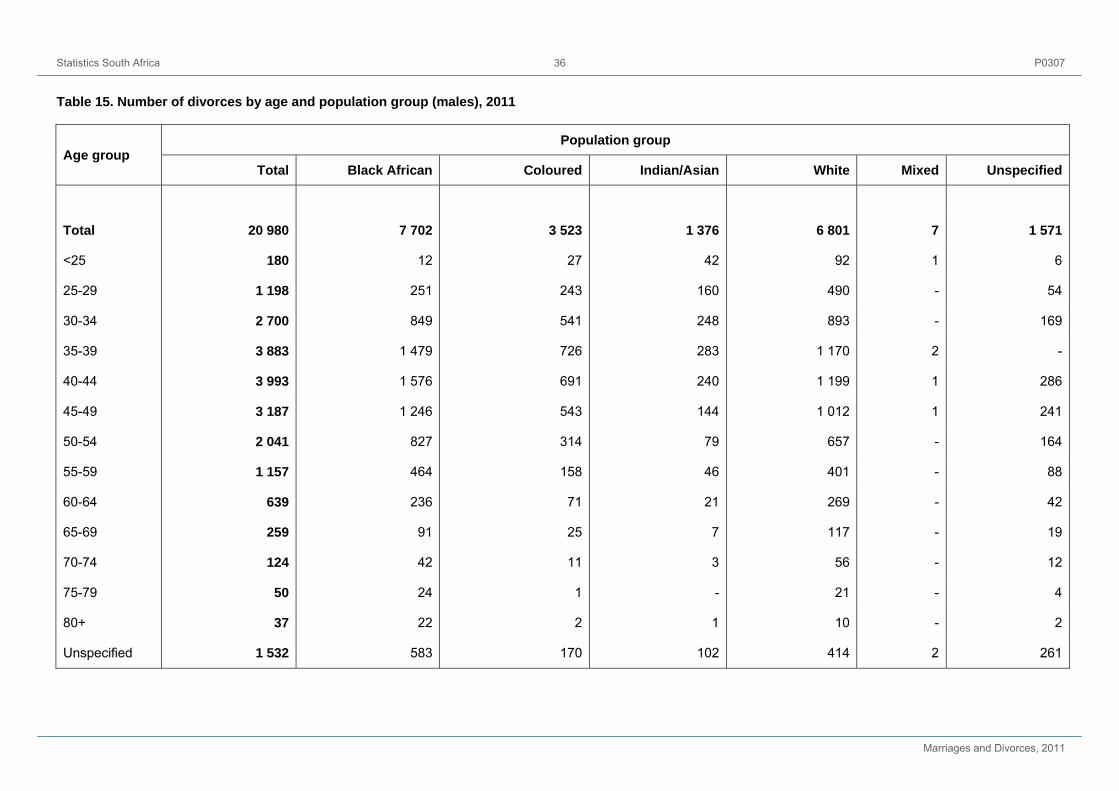
Detailed information on age by population groups and sex is presented in Figures 11 and 12 as well as Tables 15 and 16. Although there are differences in the ages at which most males and females from the various population groups divorced, the age patterns are quite similar. The data reveal that there were fewer divorces among the younger (less than 25 years old) and the older (55 years and older) divorcees. For male divorcees, the peak age group at divorce was 35–39 for Indian/Asian and coloured population groups while the peak for the black African and white population groups was 40–44 (Figure 11). In the case of females, the peak age group was generally at age group 35–39 for all population groups (Figure 12).
3.6 Duration of marriage of divorcing couples
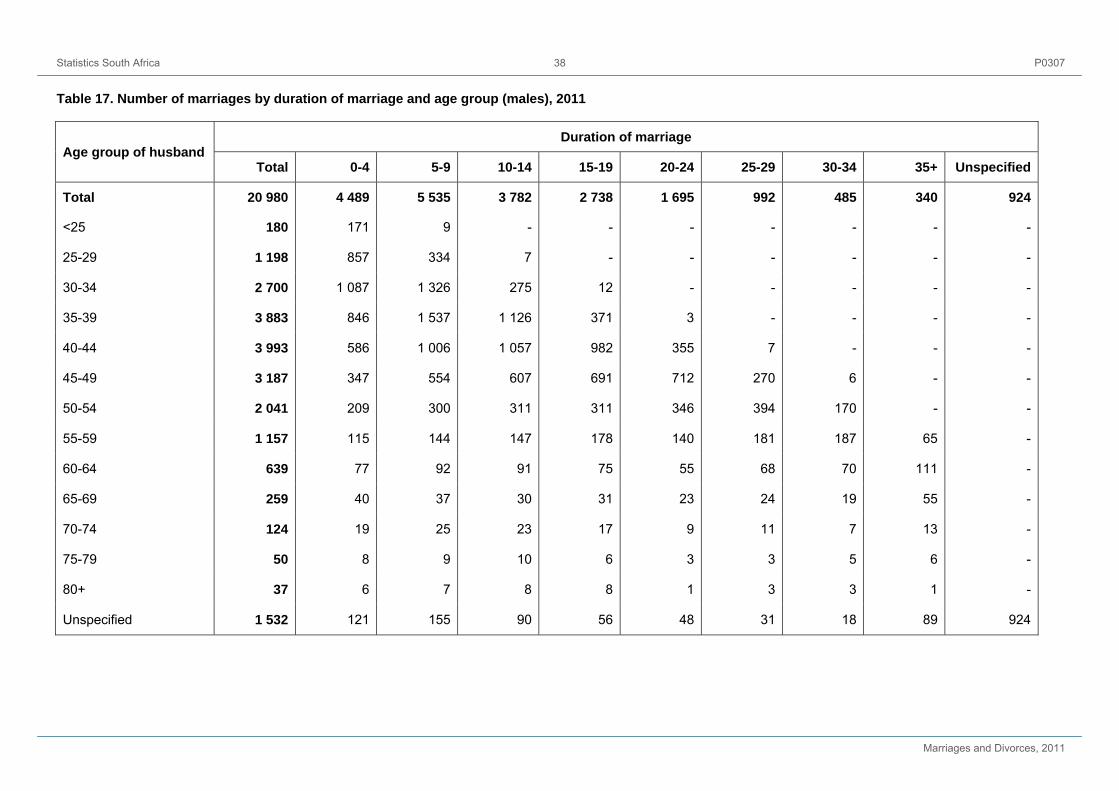
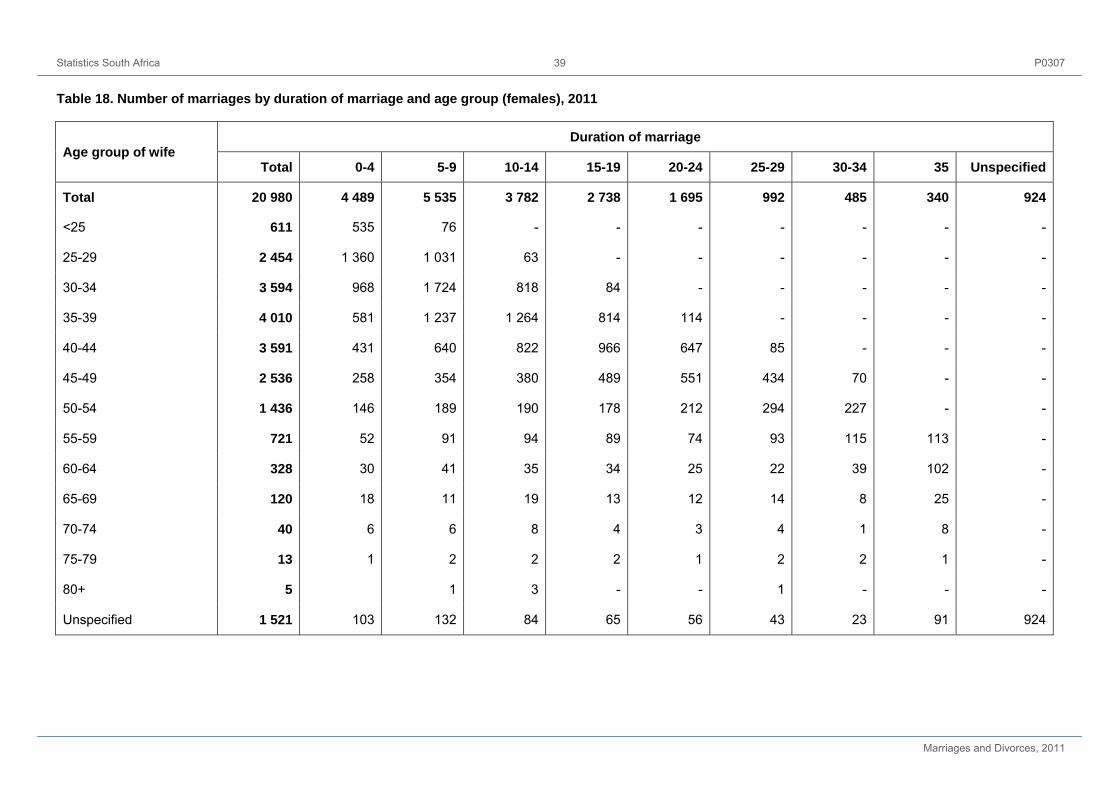
Tables 17 and Table 18 show the number of divorcees by duration of marriage for divorces granted in 2011. The largest number [5 535 (26,4%)] of the divorces were for marriages that lasted between five and nine years. This group is followed by marriages that lasted less than five years [4 489 (21,4%)]. Thus, almost half (47,8%) of the 20 980 divorces in 2011 were marriages that lasted for less than 10 years.
7 Statistics South Africa P0307
Marriages and Divorces, 2011
Divorces for the black African, coloured and Indian/Asian population groups occurred mostly to couples who had married for five to nine years whereas for the white population group those that divorced did so mostly during their first five years of marriage (see Figure 13). Furthermore, the number of divorces for the white population consistently declined as the duration of marriage increased and this pattern is observed for marriages lasting for five to nine years for the other population groups.
3.7 Divorces involving couples with children
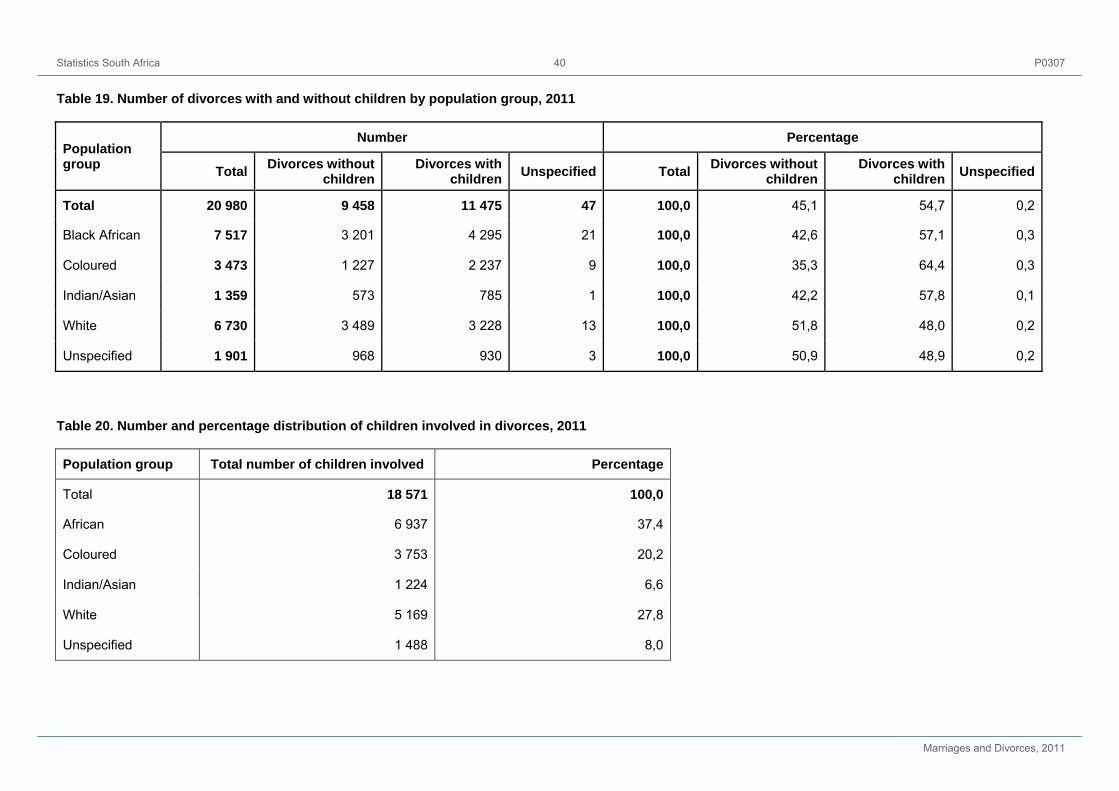
In 2011, 11 475 (54,7%) of the 20 980 divorces had children younger than 18 years (see Table 19). The proportions of divorces with children were quite high among the coloured population group (64,4%), Indians/Asians (57,8%) and the black Africans (57,1%). The distribution of the number of children affected by divorce shows that 37,4% were from the black African population group; 27,1% from the white population group and 20,2% from the coloured population group. As provided in Table 20, there were 18 571 children (younger than 18 years old) involved in divorce indicating that, on average, there was between one and two children per divorce.
4. Summary and concluding remarks
This statistical release provided information on civil and customary marriages, civil unions and divorces for 2011, based on data from the South African national marriage registration systems of the Department of Home Affairs (DHA) and data of divorces granted by the Department of Justice and Constitutional Development. The information on marriages and divorces is important for understanding the formation and dissolution of marriage relationships.
In total, 167 264 civil marriages were registered in South Africa in 2011, most of which were solemnised by DHA marriage officers. The highest number of civil marriages was registered in Gauteng, followed by KwaZulu- Natal and Eastern Cape, and the lowest was registered in Mpumalanga. The majority of civil marriages in 2011 for both brides and bridegrooms were first time marriages, with women generally entering into marriage at younger ages than men.
The number of registered customary marriages was 5 084 in 2011, which declined from a total of 9 996 recorded in 2010. The majority of bridegrooms were older than their brides, with the gap in median ages at registration of marriage much wider for customary marriages than other types of marriages.
Less than one thousand (867) civil unions were registered in South Africa in 2011, most of which were registered in Gauteng and Western Cape, and lowest in North West. Spouses recorded as spouses-1 were usually older than those recorded as spouses-2.
With regard to divorces, the data from the 43 courts showed that 20 980 divorces were granted in South Africa in 2011. Among these divorcees, there was an apparent increase in the proportion of divorces for black Africans from 2002 to 2008 while the reverse was true for the white population group. Divorces were mainly from people who had married for the first time. There were more female than male plaintiffs although males generally divorced at a later age than females. About 18 571 children were affected by divorces that took place in 2011.
Overall, the information provided in this release showed fluctuations over time in the number of marriages, unions and divorces in the country. Areas of improvement in the quality of data were noted, particularly relating to completeness of information pertaining to unspecified province of registration, way of solemnisation and marital status at time of marriage for the data on marriages and civil unions; and unspecified population group and occupation of plaintiff for the divorces data. Concerted efforts are needed from the public, the Department of Home Affairs, the Department of Justice and Constitutional Development and Statistics South Africa to improve the quality and content of information on marriages and divorces in South Africa.
8 Statistics South Africa P0307
Marriages and Divorces, 2011
Figure 1. Number of civil marriages by month of solemnisation, 2007–2011
Jan Feb Mar Apr May Jun Jul Aug Sep Oct Nov Dec2007 13 145 11 985 15 587 14 614 12 362 9 587 12 903 13 002 17 028 15 354 16 958 30 5052008 12 750 12 955 15 374 15 600 13 182 12 307 12 519 13 121 15 595 16 152 16 923 30 0442009 12 408 11 674 10 436 14 069 12 355 10 586 11 588 11 836 14 668 17 162 16 943 28 2642010 11 996 12 204 14 487 13 788 12 550 10 594 11 368 10 129 14 549 16 329 15 774 27 0582011 11 353 11 403 13 802 14 808 10 794 10 254 10 767 10 730 13 883 15 828 15 966 27 676
5 000
10 000
15 000
20 000
25 000
30 000
35 000
Num
ber o
f civ
il m
arria
ges
Month of solemnisation
9 Statistics South Africa P0307
Marriages and Divorces, 2011
Figure 2. Number of civil marriages for bachelors and spinsters by age group, 2011*
<15 15-19 20-24 25-29 30-34 35-39 40-44 45-49 50-54 55-59 60-64 65-69 70+Bachelors 0 181 8 568 36 035 36 650 26 302 14 458 7 889 3 987 2 407 1 589 685 913Spinsters 4 2 122 24 961 49 243 32 128 18 677 9 314 5 131 2 515 1 265 670 309 316
0
10 000
20 000
30 000
40 000
50 000
60 000
Num
ber o
f civ
il m
arria
ges
Age group
*Excluding 2 cases with unspecified age
10 Statistics South Africa P0307
Marriages and Divorces, 2011
Figure 3a. Median ages of bridegrooms and brides at the time of civil marriage, 2007–2011
34 34 34 34 34
30
29
30 30 30
26
27
28
29
30
31
32
33
34
35
2007 2008 2009 2010 2011
Med
ian
age
(yea
rs)
Year of registration
Bridegrooms Brides
Figure 3b. Median ages of bachelors and spinsters at the time of civil marriage, 2007–2011
32 32 32
33 33
29 29 29 29 29
27
28
29
30
31
32
33
34
2007 2008 2009 2010 2011
Med
ian
age
(yea
rs)
Year of registration
Bachelors Spinsters
11 Statistics South Africa P0307
Marriages and Divorces, 2011
Figure 3c. Median ages of widowers and widows at the time of civil marriage, 2007–2011
43 45 46 47 48
29 29 30 30 30
0
10
20
30
40
50
60
2007 2008 2009 2010 2011
Med
ian
age
(yea
rs)
Year of registration
Widowers Widows
Figure 3d. Median ages of male and female divorcees at the time of civil marriage, 2007–2011
5152 52 52 52
4546 46
47 47
40
42
44
46
48
50
52
54
2007 2008 2009 2010 2011
Med
ian
age
(yea
rs)
Year of registration
Male divorcees Female divorcees
12 Statistics South Africa P0307
Marriages and Divorces, 2011
Figure 4a. Percentage distribution of civil marriages by age differences between spouses and marital status at the time of marriage (bachelors), 2011*
8,1 7,7 7,3
78,6 78,4
49,3
13,3 13,9
43,5
0%10%20%30%40%50%60%70%80%90%
100%
B-S B-W B-D
Spouses same age Bridegroom older Bridegroom younger
* B – S = Bachelor to Spinster B – W = Bachelor to Widow B – D = Bachelor to Divorcee
Figure 4b. Percentage distribution of civil marriages by age differences between spouses and marital status at the time of marriage (widowers), 2011*
4,0 5,2 4,9
88,3 85,878,0
7,7 8,9 17,1
0%10%20%30%40%50%60%70%80%90%
100%
W-S W-W W-D
Spouses same age Bridegroom older Bridegroom younger
* B – S = Widower to Spinster B – W = Widower to Widow B – D = Widower to Divorcee
13 Statistics South Africa P0307
Marriages and Divorces, 2011
Figure 4c. Percentage distribution of civil marriages by age differences between spouses and marital status at the time of marriage (divorcees), 2011*
2,1 3,0 4,9
92,279,1 80,8
5,717,9 14,3
0%10%20%30%40%50%60%70%80%90%
100%
D-S D-W D-D
Spouses same age Bridegroom older Bridegroom younger
* D – S = Divorcee to Spinster D – W = Divorcees to Widow D – D = Divorcee to Divorcee
Figure 5. Percentage distribution of customary marriages by year of marriage and time it took to register the marriage, 2007–2011
4,7 7,2 6,2 10,2 14,2
95,3 92,8 93,8 89,8 85,8
0%10%20%30%40%50%60%70%80%90%
100%
2007 2008 2009 2010 2011
Perc
enta
ge
Year of registration
Marriage and registration in the same year
Registration year later than marriage year
14 Statistics South Africa P0307
Marriages and Divorces, 2011
Figure 6. Median ages of bridegrooms and brides at the time of customary marriage, 2007–2011
30 31 31 32 32
24 25 25 26 27
0
5
10
15
20
25
30
35
2007 2008 2009 2010 2011
Med
ian
age
in y
ears
Year of registration
Bridesgrooms Brides
Figure 7. Percentage distribution of customary marriages by age differences between spouses at the time of marriages, 2007–2011
4,6 4,8 4,6 4,6 5,0
85,3 85,0 85,3 85,6 83,9
10,1 10,2 10,1 9,8 11,2
0%10%20%30%40%50%60%70%80%90%
100%
2007 2008 2009 2010 2011
Perc
enta
ge
Year of registration
Spouses same age Bridegroom older Bridegroom younger
15 Statistics South Africa P0307
Marriages and Divorces, 2011
Figure 8. Median ages of spouses in civil unions, 2007–2011
40
38 3837
363635
34 34 34
3132333435363738394041
2007 2008 2009 2010 2011
Med
ian
ages
in y
ears
Year of registration
Spouses-1 Spouses-2
Figure 9. Percentage distribution of civil unions by age differences between spouses at the time of union, 2007–2011
10,0 6,4 6,8 6,1 7,5
56,3 63,5 63,7 64,0 58,4
33,8 30,1 29,5 30,0 34,1
0%10%20%30%40%50%60%70%80%90%
100%
2007 2008 2009 2010 2011
Perc
enta
ge
Year of registration
Spouses same age Spouses-1 older Spouses-1 younger
16 Statistics South Africa P0307
Marriages and Divorces, 2011
Figure 10. Median ages of divorcees by sex and population group, 2011
43 4138
423738 39
3539
34
05
101520253035404550
Black African Coloured Indian/Asian White Mixed
Med
ian
ages
(yea
rs)
Population groupHusbands Wife's
Figure 11. Number of divorces by age group and population group (males), 2011
200400600800
1 0001 2001 4001 6001 800
<25
25-2
9
30-3
4
35-3
9
40-4
4
45-4
9
50-5
4
55-5
9
60-6
4
65-6
9
70-7
5
75-7
9
80+
Num
ber o
f div
orce
s
Age group
Black African Coloured Indian/Asian White
17 Statistics South Africa P0307
Marriages and Divorces, 2011
Figure 12. Number of divorces by age group and population group (females), 2011
200400600800
1 0001 2001 4001 6001 800
<25
25-2
9
30-3
4
35-3
9
40-4
4
45-4
9
50-5
4
55-5
9
60-6
4
65-6
9
70-7
5
75-7
9
80+
Num
ber o
f div
orce
s
Age group
Black African Coloured Indian/Asian White
Figure 13. Number of divorces by duration of marriage and population group, 2011
500
1 000
1 500
2 000
2 500
0-4
5-9
10-1
4
15-1
9
20-2
4
25-2
9
30-3
4
35+
Num
ber o
f div
orce
s
Duration of marriage
Black African Coloured Indian/Asian White
18 Statistics South Africa P0307
Marriages and Divorces, 2011
Table 1. Number of registered civil marriages in South Africa, 2002–2011
Year of registration Number of marriages
2002 177 202
2003 178 689
2004 176 521
2005 180 657
2006 184 860
2007 183 030
2008 186 522
2009 171 989
2010 170 826
2011 167 264
19 Statistics South Africa P0307
Marriages and Divorces, 2011
Table 2. Number of civil marriages by way of solemnisation and province of marriage registration, 2011
Province of registration
Way of solemnisation Percentages
Grand Total DHA Religious Unspecified Total DHA Religious Unspecified
Grand Total 167 264 85 311 56 405 25 548 100,0 51,0 33,7 15,3
Western Cape 27 596 11 636 13 150 2 810 100,0 42,2 47,7 10,2
Eastern Cape 26 980 12 721 9 618 4 641 100,0 47,1 35,6 17,2
Northern Cape 5 063 2 756 1 931 376 100,0 54,4 38,1 7,4
Free State 10 560 6 669 3 513 378 100,0 63,2 33,3 3,6
KwaZulu-Natal 27 545 12 940 9 995 4 610 100,0 47,0 36,3 16,7
North West 10 846 8 082 2 451 313 100,0 74,5 22,6 2,9
Gauteng 34 267 18 190 9 384 6 693 100,0 53,1 27,4 19,5
Mpumalanga 7 268 2 443 2 205 2 620 100,0 33,6 30,3 36,0
Limpopo 11 044 6 822 2 400 1 822 100,0 61,8 21,7 16,5
Outside South Africa 311 301 10 - 100,0 96,8 3,2 0,0
Unspecified 5 784 2 751 1 748 1 285 100,0 47,6 30,2 22,2
Statistics South Africa P0307
Marriages and Divorces, 2011
20
Table 3. Number of civil marriages for bridegrooms and brides by marital status at time of marriage and province of marriage registration, 2011
Province of registration
Bridegrooms Brides
Total Bachelor Divorcee Widower Unspecified Total Spinster Divorcee Widow Unspecified
Grand Total 167 264 139 666 5 469 2 363 19 766 167 264 146 655 3 521 1 864 15 224
Western Cape 27 596 22 452 887 66 4 191 27 596 23 588 702 36 3 270
Eastern Cape 26 980 22 730 790 315 3 145 26 980 23 764 542 215 2 459
Northern Cape 5 063 4 277 209 52 525 5 063 4 516 139 32 376
Free State 10 560 8 881 397 173 1 109 10 560 9 274 255 198 833
KwaZulu-Natal 27 545 23 756 950 528 2 311 27 545 24 949 432 412 1 752
North West 10 846 9 206 355 113 1 172 10 846 9 737 243 60 806
Gauteng 34 267 27 833 1 083 572 4 779 34 267 29 117 763 484 3 903
Mpumalanga 7 268 5 959 270 185 854 7 268 6 303 170 138 657
Limpopo 11 044 9 462 345 217 1 020 11 044 10 099 147 129 669
Outside South Africa 311 249 3 59 311 260 7 1 43
Unspecified 5 784 4 861 180 142 601 5 784 5 048 121 159 456
Statistics South Africa P0307
Marriages and Divorces, 2011
21
Table 4. Number of civil marriages by marital status of husband and age differences between spouses at the time of marriage, 2011*
Age difference Grand Total
Bachelor to Divorcee to
Total Spinster Divorcee Widow Unspecified Total Spinster Divorcee Widow Unspecified Total 167 264 139 666 131 731 1 254 1 337 5 344 5 469 3 245 917 67 1 240
Bridegroom older 130 253 107 631 103 549 618 1 048 2 416 4 780 2 992 741 53 994
Bridegroom younger 24 507 20 792 17 552 545 186 2 509 509 185 131 12 181
Same age 12 504 11 243 10 630 91 103 419 180 68 45 2 65
Age difference
Widower to
Total Spinster Divorcee Widow Unspecified
Total 2 363 1 887 41 381 54
Bridegroom older 2 070 1 667 32 327 44
Bridegroom younger 192 145 7 34 6
Same age 101 75 2 20 4
*Excluding 19 766 marriages with unspecified marital status of bridegroom
Statistics South Africa P0307
Marriages and Divorces, 2011
22
Table 5. Number of marriages by marital status at the time of marriage and ages of bridegrooms and brides, 2011
Age Bridegrooms Brides
Total Bachelor Divorcee Widower Unspecified Total Spinster Divorcee Widow UnspecifiedTotal 167 264 139 666 5 469 2 363 19 766 167 264 146 655 3 521 1 864 15 224 <18 18 11 - 7 - 238 223 1 14 - 18 38 38 - - - 627 584 5 16 2219 135 134 - - 1 1 338 1 275 6 20 3718-19 173 172 - - 1 1 965 1 903 4 55 3 20 365 361 1 3 2 202 2 147 1 50 421 793 787 5 1 3 562 3 466 4 84 822 1 508 1 470 1 31 6 4 966 4 848 6 92 2023 2 527 2 480 3 37 7 6 627 6 484 6 101 3624 3 526 3 470 1 40 15 8 185 8 016 9 105 5520-24 8 719 8 568 6 116 29 25 542 24 961 26 432 123 25 5 279 5 195 5 54 25 9 789 9 574 10 90 11526 6 777 6 664 6 64 43 10 697 10 385 20 104 18827 7 647 7 487 9 75 76 10 478 10 131 24 87 23628 8 410 8 176 15 73 146 10 248 9 844 27 66 31129 8 790 8 513 11 74 192 9 765 9 309 41 52 36325-29 36 903 36 035 46 340 482 50 977 49 243 122 399 1 213 30 8 370 8 049 15 59 247 8 471 7 934 42 55 44031 8 222 7 844 18 64 296 7 908 7 317 52 44 49532 7 855 7 421 26 53 355 6 930 6 331 48 36 51533 7 137 6 647 26 28 436 6 205 5 545 52 35 57334 7 243 6 689 52 28 474 5 610 5 001 72 29 50830-34 38 827 36 650 137 232 1 808 35 124 32 128 266 199 2 531
Statistics South Africa P0307
Marriages and Divorces, 2011
23
Table 5. Number of marriages by marital status at the time of marriage and ages of bridegrooms and brides, 2011 (continued)
Age Bridegrooms Brides
Total Bachelor Divorcee Widower Unspecified Total Spinster Divorcee Widow Unspecified 35 6 826 6 137 56 23 610 5 209 4 489 94 26 60036 6 619 5 863 69 18 669 5 024 4 299 96 20 60937 6 111 5 284 79 21 727 4 481 3 735 113 16 61738 5 582 4 664 111 27 780 3 945 3 180 104 9 65239 5 336 4 354 135 2 845 3 797 2 974 121 11 69135-39 30 474 26 302 450 91 3 631 22 456 18 677 528 82 3 169 40 4 261 3 337 118 12 794 2 852 2 091 89 9 66341 4 503 3 475 148 9 871 3 021 2 260 105 6 65042 3 885 2 831 145 29 880 2 648 1 880 125 9 63443 3 709 2 718 154 42 795 2 492 1 754 124 7 60744 3 066 2 097 160 56 753 2 017 1 329 97 19 57240-44 19 424 14 458 725 148 4 093 13 030 9 314 540 50 3 126 45 2 921 1 905 167 72 777 1 910 1 236 133 19 52246 2 832 1 745 194 80 813 1 746 1 094 121 26 50547 2 621 1 552 188 94 787 1 673 1 047 108 40 47848 2 468 1 428 172 109 759 1 482 885 132 40 42549 2 263 1 259 187 90 727 1 410 869 102 47 39245-49 13 105 7 889 908 445 3 863 8 221 5 131 596 172 2 322 50 1 773 912 177 87 597 1 167 614 109 37 40751 1 782 934 180 82 586 1 071 616 100 47 30852 1 517 727 165 86 539 911 475 100 42 29453 1 549 794 141 86 528 822 444 94 39 24554 1 334 620 171 59 484 703 366 74 39 22450-54 7 955 3 987 834 400 2 734 4 674 2 515 477 204 1 478
Statistics South Africa P0307
Marriages and Divorces, 2011
24
Table 5. Number of marriages by marital status at the time of marriage and ages of bridegrooms and brides, 2011 (concluded) Age
Bridegrooms Brides Total Bachelor Divorcee Widower Unspecified Total Spinster Divorcee Widow Unspecified
55 1 204 558 162 59 425 605 310 91 30 17456 1 064 525 145 62 332 566 284 80 37 16557 1 032 467 140 68 357 449 223 54 28 14458 893 430 133 49 281 436 228 55 31 12259 835 427 146 53 209 424 220 69 27 10855-59 5 028 2 407 726 291 1 604 2 480 1 265 349 153 713 60 762 381 122 33 226 330 157 65 20 8861 793 393 151 30 219 317 172 51 18 7662 610 302 98 49 161 214 100 48 7 5963 596 287 109 40 160 260 137 52 13 5864 506 226 112 30 138 219 104 48 16 5160-64 3 267 1 589 592 182 904 1 340 670 264 74 332 65 409 194 84 25 106 174 83 45 2 4466 312 137 80 15 80 136 66 34 8 2867 278 122 69 13 74 134 74 30 3 2768 253 99 80 11 63 108 35 36 5 3269 302 133 94 18 57 101 51 33 1 1665-69 1 554 685 407 82 380 653 309 178 19 147 70+ 1 817 913 638 29 237 564 316 170 11 67
Statistics South Africa P0307
Marriages and Divorces, 2011
25
Table 6. Number of registered customary marriages in South Africa, 2003–2011
Year of registration Number of marriages
2003 17 283
2004 20 301
2005 19 252
2006 14 039
2007 20 259
2008 16 003
2009 13 506
2010 9 996
2011 5 084
Statistics South Africa P0307
Marriages and Divorces, 2011
26
Table 7. Number of customary marriages by ages of bridegrooms and brides at the time of marriage, 2011
Age Bridegrooms Brides Total 5 084 5 084 <18 14 174 18 12 17719 46 24218-19 58 419 20 68 27421 114 29922 157 26823 198 26924 191 24820-24 728 1358 25 230 27026 251 23627 243 23428 264 22529 206 21025-29 1 194 1 175 30 241 19231 225 18132 193 15233 163 14034 157 12730-34 979 792
Statistics South Africa P0307
Marriages and Divorces, 2011
27
Table 7. Number of customary marriages by ages of bridegrooms and brides at the time of marriage, 2011 (continued) Age Bridegrooms Brides 35 194 13336 147 11037 140 9938 145 9739 127 8135-39 753 520 40 102 7241 110 6842 107 5543 84 4844 88 5340-44 491 296 45 76 5246 76 3647 79 3848 62 2849 54 2345-49 347 177 50 51 2151 47 1952 48 1953 34 1154 31 1050-54 211 80
Statistics South Africa P0307
Marriages and Divorces, 2011
28
Table 7. Number of customary marriages by ages of bridegrooms and brides at the time of marriage, 2011 (concluded) Age Bridegrooms Brides 55 33 1056 27 757 18 458 23 559 21 755-59 122 33 60 19 661 26 962 17 663 10 264 11 660-64 83 29 65 16 366 7 267 7 368 9 469 6 465-95 45 16 70+ 57 9 Unspecified 2 6
Statistics South Africa P0307
Marriages and Divorces, 2011
29
Table 8. Number of registered civil unions in South Africa by province of registration, 2007–2011
Province of registration Number Percentage
2007 2008 2009 2010 2011 2007 2008 2009 2010 2011
Grand Total 80 732 760 888 867 100,0 100,0 100,0 100,0 100,0
Western Cape 16 191 227 261 238 20,0 26,1 29,9 29,4 27,5
Eastern Cape - 41 30 24 29 0,0 5,6 3,9 2,7 3,3
Northern Cape 1 11 43 75 93 1,3 1,5 5,7 8,4 10,7
Free State 1 23 20 26 28 1,3 3,1 2,6 2,9 3,2
KwaZulu-Natal 8 74 87 79 63 10,0 10,1 11,4 8,9 7,3
North West 2 6 5 9 3 2,5 0,8 0,7 1,0 0,3
Gauteng 49 362 324 391 381 61,3 49,5 42,6 44,0 43,9
Mpumalanga 3 7 11 11 16 3,8 1,0 1,4 1,2 1,8
Limpopo - 15 10 10 7 0,0 2,0 1,3 1,1 0,8
Outside South Africa - 2 3 2 9 0,0 0,3 0,4 0,2 1,0
Statistics South Africa P0307
Marriages and Divorces, 2011
30
Table 9. Number of civil unions by ages of spouses-1 and spouses-2 at the time of civil union, 2011 Age Spouses-1 Spouses-2 Total 867 867 18 1 719 4 318-19 5 10 20 5 721 6 822 11 2023 17 1824 22 3220-24 61 85 25 19 2926 22 3727 29 3528 29 3229 34 4525-29 133 178 30 29 3031 43 2832 40 4433 34 3334 39 3630-34 185 171
Statistics South Africa P0307
Marriages and Divorces, 2011
31
Table 9. Number of civil unions by ages of spouses-1 and spouses-2 at the time of civil union, 2011 (continued) Age Spouses-1 Spouses-2 35 34 3736 24 3037 32 3738 24 3639 30 2835-39 144 168 40 40 2741 28 2142 22 2543 24 2244 26 1540-44 140 110 45 20 1946 24 1147 23 1648 20 1949 22 745-49 109 72 50 17 1551 8 852 8 853 6 254 4 450-54 43 37
Statistics South Africa P0307
Marriages and Divorces, 2011
32
Table 9. Number of civil unions by ages of spouses-1 and spouses-2 at the time of civil union, 2011 (concluded) Age Spouses-1 Spouses-2 55 3 556 7 357 7 358 2 459 2 555-59 21 20 60 10 261 3 662 1 263 1 - 64 15 1060-64 - 265 - -66 2 - 67 1 268 2 -69 5 465-69 6 270+ 3 5
Statistics South Africa P0307
Marriages and Divorces, 2011
33
Table 10. Number of published divorces in South Africa by population group, 2002–2011
Year TotalNumbers Percentages
Black African Coloured Indian/
Asian White Mixed Unspecified BlackAfrican Coloured Indian/
Asian White Mixed Unspecified
2002 31 370 7 050 3 581 1 525 14 171 365 4 678 22,5 11,4 4,9 45,2 1,2 14,9
2003 31 566 7 657 3 911 1 508 12 639 532 5 319 24,3 12,4 4,8 40,0 1,7 16,9
2004 31 768 8 965 3 300 1 648 12 437 594 4 824 28,2 10,4 5,2 39,1 1,9 15,2
2005 32 484 8 672 3 568 1 635 11 582 538 6 489 26,7 11,0 5,0 35,7 1,7 20,0
2006 31 270 9 113 3 451 1 676 11 079 613 5 338 29,1 11,0 5,4 35,4 2,0 17,1
2007 29 639 9 055 3 558 1 715 9 935 865 4 511 30,6 12,0 5,8 33,5 2,9 15,2
2008 28 924 10 110 3 057 1 802 9 481 902 3 572 35,0 10,6 6,2 32,8 3,1 12,3
2009 30 763 10 528 4 016 1 610 9 981 2 912 1 716 34,2 13,1 5,2 32,4 9,5 5,6
2010 22 936 8 169 3 189 1 294 6 995 31 3 258 35,6 13,9 5,6 30,5 0,1 14,2
2011 20 980 7 517 3 473 1 359 6 730 - 1 901 35,8 16,6 6,5 32,1 0,0 9,1
Statistics South Africa P0307
Marriages and Divorces, 2011
34
Table 11. Number of divorces by sex and population group of the plaintiff, 2011
Population group Number Percentage
Total Males Females Unspecified Total Males Females UnspecifiedTotal 20 980 7 217 10 408 3 355 100,0 34,4 49,6 16,0Black African 7 517 2 852 2 982 1 683 100,0 37,9 39,7 22,4
Coloured 3 473 1 004 1 951 518 100,0 28,9 56,2 14,9
Indian/Asian 1 359 443 712 204 100,0 32,6 52,4 15,0
White 6 730 2 193 3 826 711 100,0 32,6 56,8 10,6
Unspecified 1 901 725 937 239 100,0 38,1 49,3 12,6 Table 12. Number of divorces by sex and type of occupation of the plaintiff, 2011
Occupation
Number Percentage Total Males Females Unspecified Total Males Females Unspecified
Total 20 980 7 217 10 408 3 355 100,0 100,0 100,0 100,0 Professional, semi professionals and tech occupations 1 674 640 1 034 - 8,0 8,9 9,9 0,0
Managers and administrators 2 134 1 061 1 073 - 10,2 14,7 10,3 0,0
Clerical and sales occupations 2 412 516 1 896 - 11,5 7,1 18,2 0,0
Transport delivery and communications 371 337 34 - 1,8 4,7 0,3 0,0
Services occupations 1 573 717 856 - 7,5 9,9 8,2 0,0
Farming and related occupations 57 46 11 - 0,3 0,6 0,1 0,0
Artisans apprentice and related occupations 561 454 107 - 2,7 6,3 1,0 0,0
Production foreman, mine and quarry worker 691 501 190 - 3,3 6,9 1,8 0,0
Not economically active 5 159 1 972 3 187 - 24,6 27,3 30,6 0,0
Unspecified 6 348 973 2 020 3 355 30,3 13,5 19,4 100,0
Statistics South Africa P0307
Marriages and Divorces, 2011
35
Table 13. Number of divorces by population group and way of solemnisation of the marriage, 2011
Population group Number Percentage
Total Religious DHA Unspecified Total Religious DHA Unspecified
Total 20 980 3 961 16 080 939 100,0 18,9 76,6 4,5
Black African 7 517 380 6 844 293 100,0 5,1 91,0 3,9
Coloured 3 473 207 3 171 95 100,0 6,0 91,3 2,7
Indian/Asian 1 359 166 1 140 53 100,0 12,2 83,9 3,9
White 6 730 2 869 3 652 209 100,0 42,6 54,3 3,1
Unspecified 1 901 339 1 273 289 100,0 17,8 67,0 15,2
Table 14. Number of divorces by number of times married at the time of divorce, 2011
Number of times married Number Percentage
Males Females Males Females
Total 20 980 20 980 100,0 100,0
Once 16 425 16 599 78,3 79,1
Twice 2 386 2 063 11,4 9,8
Three or more times 421 377 2,0 1,8
Unspecified 1 748 1 941 8,3 9,3
Statistics South Africa P0307
Marriages and Divorces, 2011
36
Table 15. Number of divorces by age and population group (males), 2011
Age group Population group
Total Black African Coloured Indian/Asian White Mixed Unspecified
Total 20 980 7 702 3 523 1 376 6 801 7 1 571
<25 180 12 27 42 92 1 6
25-29 1 198 251 243 160 490 - 54
30-34 2 700 849 541 248 893 - 169
35-39 3 883 1 479 726 283 1 170 2 -
40-44 3 993 1 576 691 240 1 199 1 286
45-49 3 187 1 246 543 144 1 012 1 241
50-54 2 041 827 314 79 657 - 164
55-59 1 157 464 158 46 401 - 88
60-64 639 236 71 21 269 - 42
65-69 259 91 25 7 117 - 19
70-74 124 42 11 3 56 - 12
75-79 50 24 1 - 21 - 4
80+ 37 22 2 1 10 - 2
Unspecified 1 532 583 170 102 414 2 261
Statistics South Africa P0307
Marriages and Divorces, 2011
37
Table 16. Number of divorces by age group and population group (females), 2011
Age group Total Black African Coloured Indian/Asian White Mixed Unspecified
Total 20 980 7 647 3 515 1 366 6 771 2 1 679
<25 611 120 84 95 281 - 31
25-29 2 454 834 358 235 882 - 145
30-34 3 594 1 477 644 276 983 1 213
35-39 4 010 1 586 686 275 1 174 1 288
40-44 3 591 1 326 683 187 1 128 - 267
45-49 2 536 885 468 111 864 - 208
50-54 1 436 501 234 53 529 - 119
55-59 721 235 107 28 275 - 76
60-64 328 82 56 12 148 - 30
65-69 120 36 10 2 63 - 9
70-74 40 10 7 - 18 - 5
75-79 13 4 3 - 5 - 1
80+ 5 1 3 - 1 - -
Unspecified 1 521 550 172 92 420 - 287
Statistics South Africa P0307
Marriages and Divorces, 2011
38
Table 17. Number of marriages by duration of marriage and age group (males), 2011
Age group of husband Duration of marriage
Total 0-4 5-9 10-14 15-19 20-24 25-29 30-34 35+ Unspecified
Total 20 980 4 489 5 535 3 782 2 738 1 695 992 485 340 924
<25 180 171 9 - - - - - - -
25-29 1 198 857 334 7 - - - - - -
30-34 2 700 1 087 1 326 275 12 - - - - -
35-39 3 883 846 1 537 1 126 371 3 - - - -
40-44 3 993 586 1 006 1 057 982 355 7 - - -
45-49 3 187 347 554 607 691 712 270 6 - -
50-54 2 041 209 300 311 311 346 394 170 - -
55-59 1 157 115 144 147 178 140 181 187 65 -
60-64 639 77 92 91 75 55 68 70 111 -
65-69 259 40 37 30 31 23 24 19 55 -
70-74 124 19 25 23 17 9 11 7 13 -
75-79 50 8 9 10 6 3 3 5 6 -
80+ 37 6 7 8 8 1 3 3 1 -
Unspecified 1 532 121 155 90 56 48 31 18 89 924
Statistics South Africa P0307
Marriages and Divorces, 2011
39
Table 18. Number of marriages by duration of marriage and age group (females), 2011
Age group of wife Duration of marriage
Total 0-4 5-9 10-14 15-19 20-24 25-29 30-34 35 Unspecified
Total 20 980 4 489 5 535 3 782 2 738 1 695 992 485 340 924
<25 611 535 76 - - - - - - -
25-29 2 454 1 360 1 031 63 - - - - - -
30-34 3 594 968 1 724 818 84 - - - - -
35-39 4 010 581 1 237 1 264 814 114 - - - -
40-44 3 591 431 640 822 966 647 85 - - -
45-49 2 536 258 354 380 489 551 434 70 - -
50-54 1 436 146 189 190 178 212 294 227 - -
55-59 721 52 91 94 89 74 93 115 113 -
60-64 328 30 41 35 34 25 22 39 102 -
65-69 120 18 11 19 13 12 14 8 25 -
70-74 40 6 6 8 4 3 4 1 8 -
75-79 13 1 2 2 2 1 2 2 1 -
80+ 5 1 3 - - 1 - - -
Unspecified 1 521 103 132 84 65 56 43 23 91 924
Statistics South Africa P0307
Marriages and Divorces, 2011
40
Table 19. Number of divorces with and without children by population group, 2011
Population group
Number Percentage
Total Divorces without children
Divorces with children Unspecified Total Divorces without
childrenDivorces with
children Unspecified
Total 20 980 9 458 11 475 47 100,0 45,1 54,7 0,2
Black African 7 517 3 201 4 295 21 100,0 42,6 57,1 0,3
Coloured 3 473 1 227 2 237 9 100,0 35,3 64,4 0,3
Indian/Asian 1 359 573 785 1 100,0 42,2 57,8 0,1
White 6 730 3 489 3 228 13 100,0 51,8 48,0 0,2
Unspecified 1 901 968 930 3 100,0 50,9 48,9 0,2
Table 20. Number and percentage distribution of children involved in divorces, 2011
Population group Total number of children involved Percentage
Total 18 571 100,0
African 6 937 37,4
Coloured 3 753 20,2
Indian/Asian 1 224 6,6
White 5 169 27,8
Unspecified 1 488 8,0
Statistics South Africa P0307
Marriages and Divorces, 2011
41
EXPLANATORY NOTES
1. Purpose of the statistical release
The purpose of the statistical release is to provide information on marriages, unions and divorces recorded in South Africa in 2011. The data on marriages and unions was gathered from the Department of Home Affairs while information for divorces came from the Department of Justice and Constitutional Development through divorce courts, based on the number of divorce forms that had reached Stats SA by the time of publication of this release.
2. Scope and coverage
The data on marriages currently cover registered civil marriages, customary marriages and civil unions in South Africa. The divorce data cover cases for filed divorces from civil marriages that had been granted. Undocumented cases of abandonment or divorces that had been granted by religious or traditional authorities are not reported in the release. Divorce data from registered customary marriages and civil unions will be reported when sufficient data become available
3. Data
Stats SA downloads the data on civil marriages, customary marriages and civil unions from the Department of Home Affairs (DHA) through State Information Technology Agency (SITA). The data are processed and analysed for publication.
Data on divorces are collected from the divorce courts using a standard structured questionnaire prepared by Stats SA. The questionnaires are regularly completed by the courts as divorce decrees are granted. They are consolidated and mailed to Stats SA head office. At Stats SA the questionnaires are sorted and captured according to court and calendar month; processed, analysed and published.
4. Limitations
The release focuses on presenting the demographic characteristics of the married and divorced persons. The information does not cover other important issues such as the causes and impact of divorce.
The marriages and divorces data reported in this release are not linked, although both refer to registrations in 2011. Divorces come from marriages that were registered in different years.
5. Definitions of terms
Civil marriages: these are marriages registered according the Marriage Act, 1961 (Act No. 25 of 1961). In the release the term ‘civil’ is used to include marriages that were solemnised by marriage officers in the Department of Home Affair and those that were solemnised by religious marriage officers.
Customary marriages: these are marriages that are negotiated, celebrated or concluded according to any of the systems of indigenous African customary law which exist in South Africa as prescribed in the Recognition of Customary Marriages Act,1998 (Act No. 120 of 1998).
Statistics South Africa P0307
Marriages and Divorces, 2011
42
Civil unions: refers to the voluntary union of two persons who are both 18 years of age or older, which is solemnised and registered by way of either a marriage or a civil partnership, in accordance with the procedures prescribed in the Civil Union Act, 2006 (Act No. 17 of 2006).
Mixed population group: refers to couples with different racial backgrounds.
Occupation: occupation is coded using the Standard Classification of Occupations, Report No 09-90-01, first Edition, 1986 published by Stats SA.
6. Symbols
- = Nil
‹ = Less than
≥ = Equal to and greater than
Statistics South Africa P0307
Marriages and Divorces, 2011
43
GENERAL INFORMATION
Marriages and divorces, 2011
Published by Statistics South Africa, Private Bag X44, Pretoria 0001
© Statistics South Africa, 2012
Users may apply or process this data, provided Statistics South Africa (Stats SA) is acknowledged as the original source of the data; that it is specified that the application and/or analysis is the result of the user’s independent processing of the data; and that neither the basic data nor any reprocessed version or application thereof may be sold or offered for sale in any form whatsoever without prior permission from Stats SA.
Stats SA publishes approximately 300 different statistical releases each year. It is not economically viable to produce them in more than one of South Africa's eleven official languages. Since the releases are used extensively, not only locally but also by international economic and social-scientific communities, Stats SA releases are published in English only.
This publication is available on the Internet at www.statssa.gov.za.
Stats SA products A complete set of Stats SA publications is available at the Stats SA Library and the following libraries: National Library of South Africa, Pretoria Division National Library of South Africa, Cape Town Division Natal Society Library, Pietermaritzburg Library of Parliament, Cape Town Bloemfontein Public Library Johannesburg Public Library Eastern Cape Library Services, King William’s Town Central Regional Library, Polokwane Central Reference Library, Nelspruit Central Reference Collection, Kimberley Central Reference Library, Mmabatho
Stats SA also provides a subscription service.
Enquiries:
Printing and distribution User Information service
Tel: (012) 310 8251 (012) 310 8600
Fax: (012) 321 7381 (012) 310 8500 / 8495