Embed Size (px)
Citation preview
1
2
Table of Contents
3
List of Tables
4
Introduction
5
Key Points
5
Statistics of the exporters’ and importers’ register – Q1 2020
6
Exports and imports by exporters’ and importers’ sector and main goods (HS) - Q1
2020
8
Exports and imports by exporters’ and importers’ sector and top trade partners - Q1
2020
10
Exports and imports by exporters’ and importers’ sector and Standard International
Trade Classification (SITC4) - Q1 2020
11
Statistical Tables
20
Explanatory notes
3
List of Tables
11
Table 1: Non-oil exports through the ports of the Emirate of Abu Dhabi by exporters’
sector - Q1 2020
11
Table 2: Imports through the ports of the Emirate of Abu Dhabi by importers’ sector -
Q1 2020
12
Table 3: Non-oil exports through the ports of the Emirate of Abu Dhabi by exporters’
sector and main exporters’ goods (HS) - Q1 2020
13
Table 4: Imports through the ports of the Emirate of Abu Dhabi by importers’ sector and
main importers’ goods (HS) - Q1 2020
14
Table 5: Non-oil exports through the ports of the Emirate of Abu Dhabi by exporters’
sector and top trade partners - Q1 2020
15
Table 6: Imports through the ports of the Emirate of Abu Dhabi by importers’ sector
and top trade partners - Q1 2020
16
Table 7: Non-oil exports through the ports of the Emirate of Abu Dhabi by exporters’
sector and Standard International Trade Classification (SITC4) - Q1 2020
18
Table 8: Imports through the ports of the Emirate of Abu Dhabi by importers’ sector and
Standard International Trade Classification (SITC4) - Q1 2020
4
Introduction
This publication presents statistics on the value of the exports and Imports from exporters’ and
importers’ register by sectors, which entered or exited the territory of the Emirate of Abu Dhabi through
the ports of Abu Dhabi (comprising air, sea and road ports) in Q1 2020. It should be noted that foreign
trade data presented in this publication do not cover non-oil exports and imports through ports of the
other Emirates in the UAE.
The data of exporter and importer records have been sourced from the Abu Dhabi Department of
Finance – Customs Administration, and the scope of the statistics therefore is restricted to the trade
flows recorded at ports under the jurisdiction of the Customs Administration. The publication highlights
the relative importance of each individual component of exporters and importers.
The data are presented according to the Standard International Trade Classification (SITC4), the
Harmonized System (HS) sections and by country for total exporters and importers.
The Explanatory Notes section at the end of this publication defines the key terms and technical
concepts used in the compilation of exporters’ and importers’ statistics. Readers are encouraged to
refer to that section while reading the statistics and information outlined in the publication.
5
Key Points
Statistics of the exporters’ and importers’ register – Q1 2020
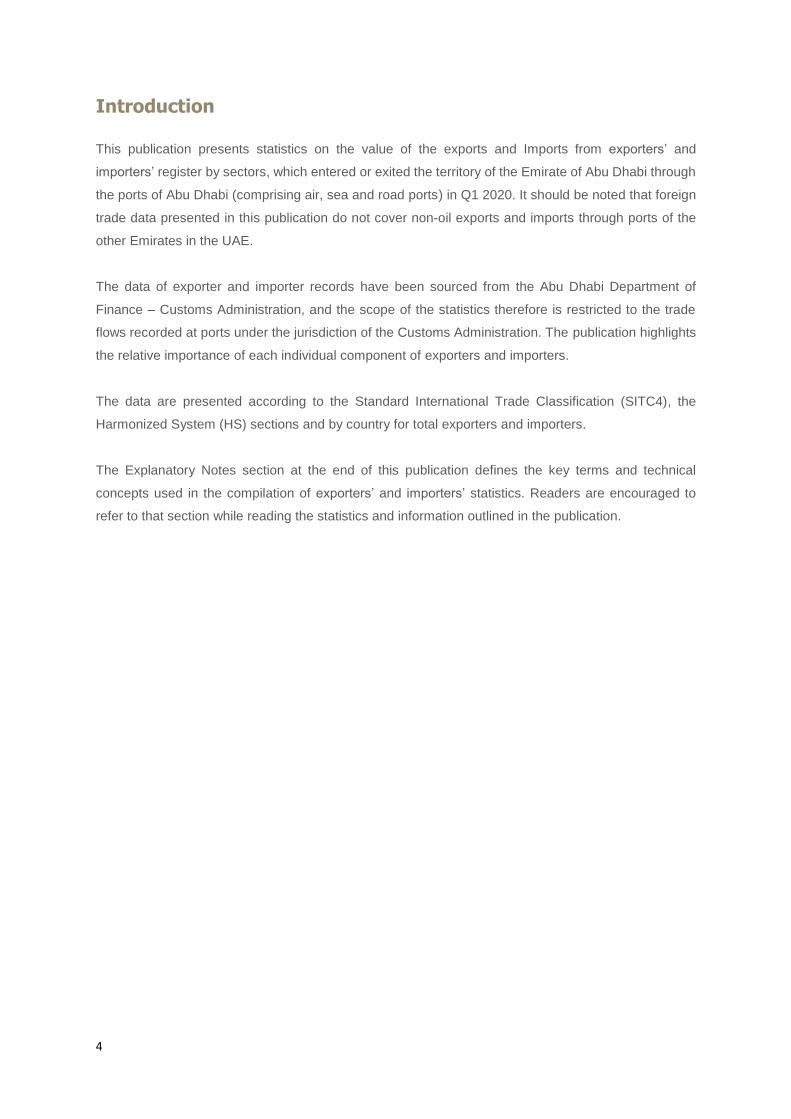
The value of exports through Abu Dhabi ports decreased by 4.3% from AED 27.8 billion in Q1 2019 to
AED 26.6 billion in the same period of 2020. The business sector decreased by AED 800.3 million or
3.0%, the government sector decreased by 83.3%, while the individual sector increased by 6.2%
compared with the same period of 2019.
Total exports value decreased by AED 4.3 billion or 13.8% during Q1 2020 compared with Q4 2019.
This was as a result of decreases in the value of the individual sector, business sector and government
sector by 14.5%, 11.1% and 91.5% respectively over the same period.
The value of imports increased by 16.9% from AED 24.2 billion in Q1 2019 to AED 28.3 billion in Q1
2020. The business sector increased by AED 5.0 billion or 24.3%. and the individual sector increased
by AED 8.0 million or 6.6%, while the value of the government sector decreased by 24.7% during the
same period.
Imports values increased by AED 351.7 million or 1.3% during Q1 2020 compared with Q4 2019. The
value of the government sector and individual sector decreased by 39.7%, and 29.6% respectively,
while the value of the business sector increased by 9.3% over the same period.
Figure 1: Percentage contribution to the value of exports and imports by sector - Q1
2020
Source: Statistic Centre – Abu Dhabi The data for 2020 are preliminary
0.5
90.0
9.5
Percentage contribution by importers' sectors
Individual Business Government
3.2
96.5
0.3
Percentage contribution by exporters' sectors
Individual Business Government
6
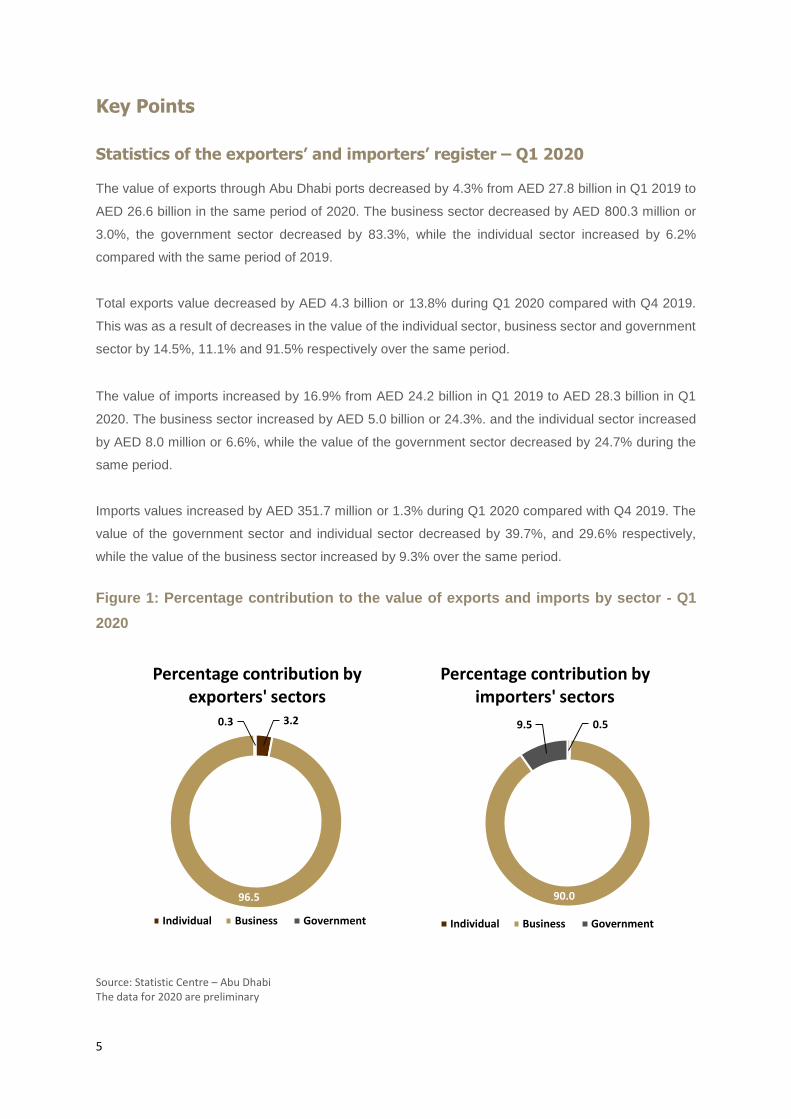
Figure 2: Exports and imports by exporters’ and importers’ sector Q1 2020
Source: Statistic Centre – Abu Dhabi The data for 2020 are preliminary
Exports and imports by exporters’ and importers’ sector and main goods
(HS) Q1 2020
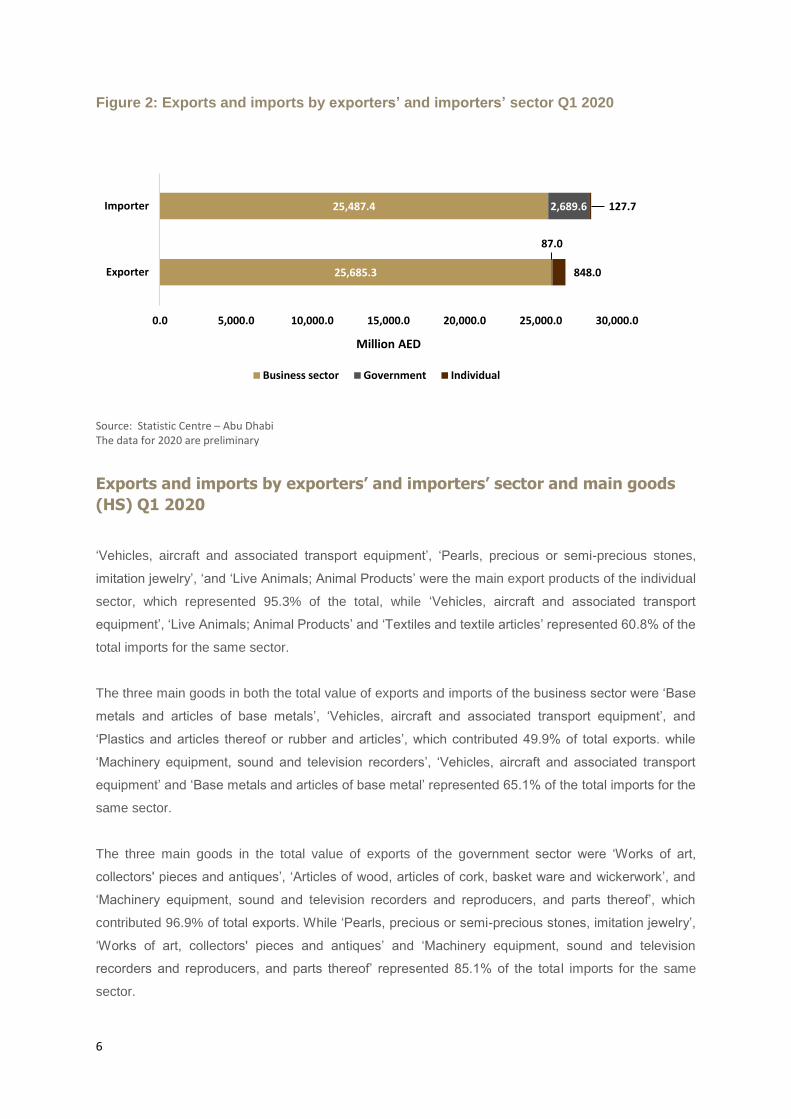
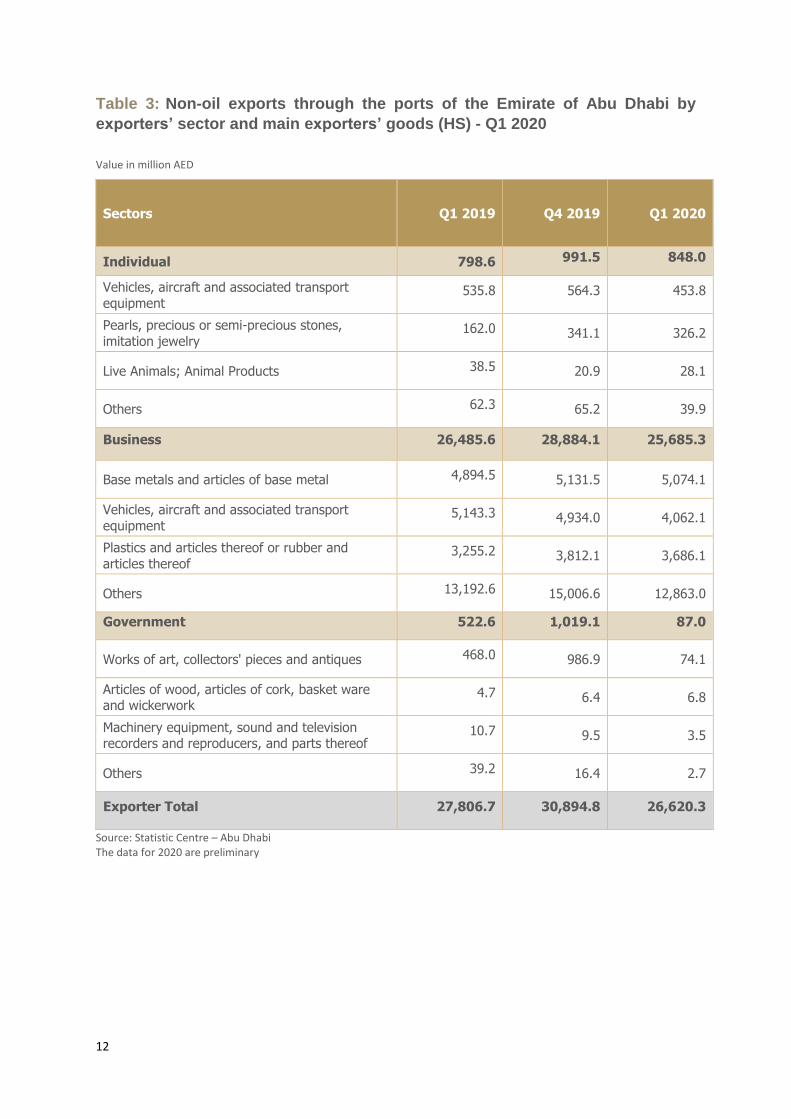
‘Vehicles, aircraft and associated transport equipment’, ‘Pearls, precious or semi-precious stones,
imitation jewelry’, ‘and ‘Live Animals; Animal Products’ were the main export products of the individual
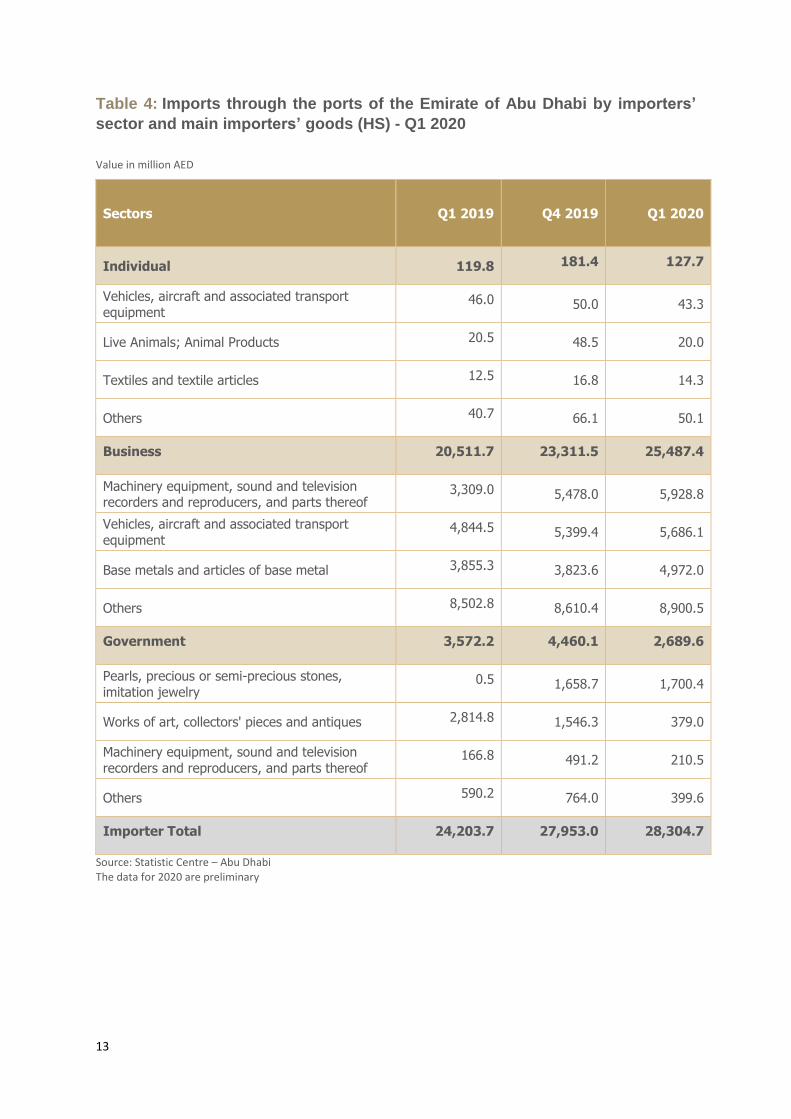
sector, which represented 95.3% of the total, while ‘Vehicles, aircraft and associated transport
equipment’, ‘Live Animals; Animal Products’ and ‘Textiles and textile articles’ represented 60.8% of the
total imports for the same sector.
The three main goods in both the total value of exports and imports of the business sector were ‘Base
metals and articles of base metals’, ‘Vehicles, aircraft and associated transport equipment’, and
‘Plastics and articles thereof or rubber and articles’, which contributed 49.9% of total exports. while
‘Machinery equipment, sound and television recorders’, ‘Vehicles, aircraft and associated transport
equipment’ and ‘Base metals and articles of base metal’ represented 65.1% of the total imports for the
same sector.
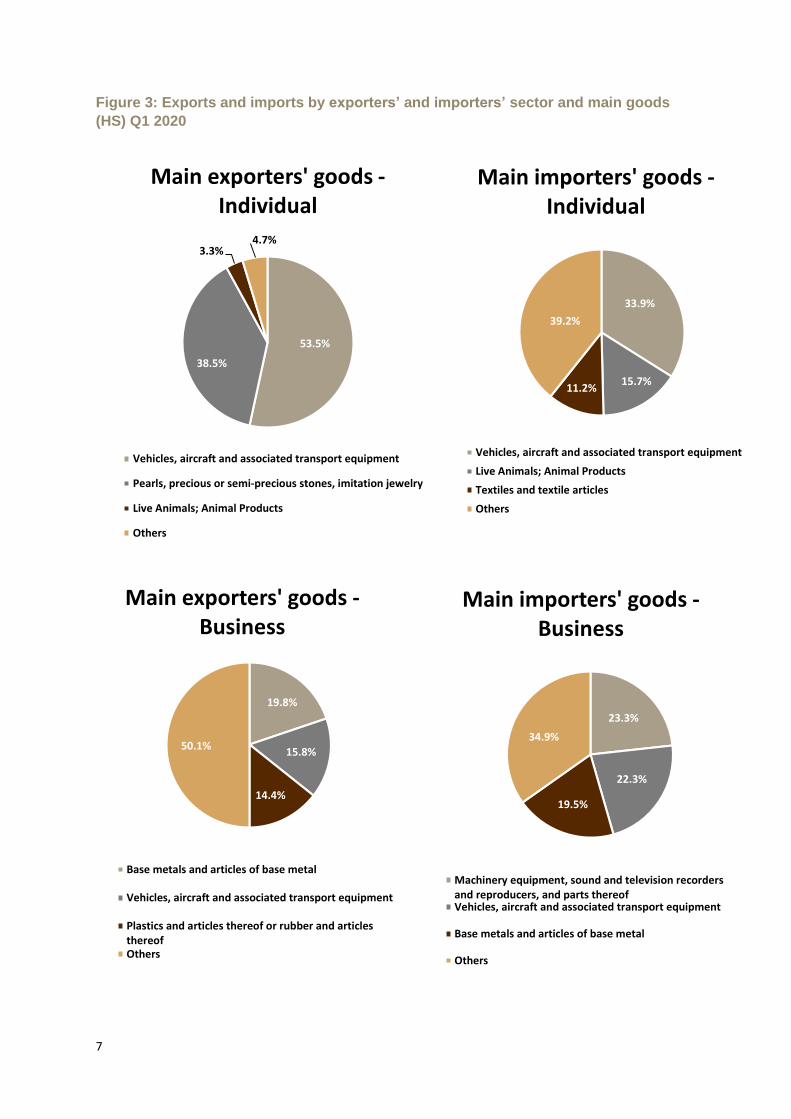
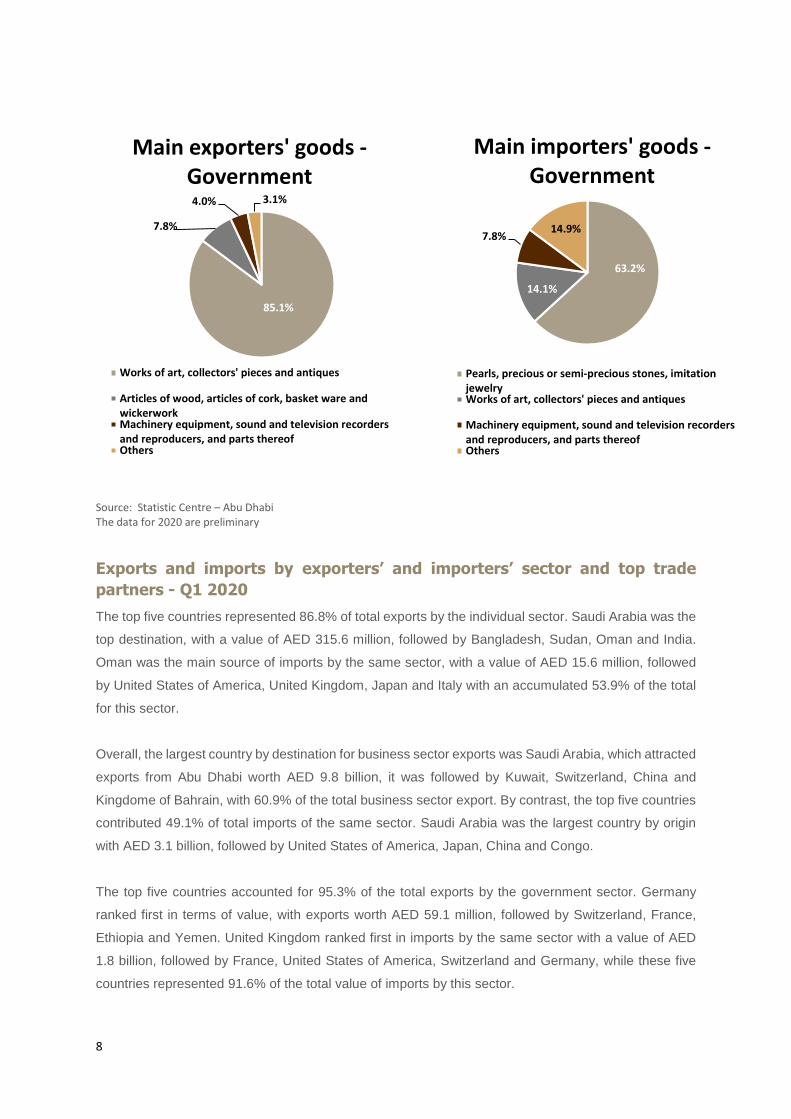
The three main goods in the total value of exports of the government sector were ‘Works of art,
collectors' pieces and antiques’, ‘Articles of wood, articles of cork, basket ware and wickerwork’, and
‘Machinery equipment, sound and television recorders and reproducers, and parts thereof’, which
contributed 96.9% of total exports. While ‘Pearls, precious or semi-precious stones, imitation jewelry’,
‘Works of art, collectors' pieces and antiques’ and ‘Machinery equipment, sound and television
recorders and reproducers, and parts thereof’ represented 85.1% of the total imports for the same
sector.
25,685.3
25,487.4
87.0
2,689.6
848.0
127.7
0.0 5,000.0 10,000.0 15,000.0 20,000.0 25,000.0 30,000.0
Exporter
Importer
Million AED
Business sector Government Individual
7
Figure 3: Exports and imports by exporters’ and importers’ sector and main goods
(HS) Q1 2020
53.5%
38.5%
3.3%4.7%
Main exporters' goods -Individual
Vehicles, aircraft and associated transport equipment
Pearls, precious or semi-precious stones, imitation jewelry
Live Animals; Animal Products
Others
33.9%
15.7%11.2%
39.2%
Main importers' goods -Individual
Vehicles, aircraft and associated transport equipment
Live Animals; Animal Products
Textiles and textile articles
Others
19.8%
15.8%
14.4%
50.1%
Main exporters' goods -Business
Base metals and articles of base metal
Vehicles, aircraft and associated transport equipment
Plastics and articles thereof or rubber and articlesthereofOthers
23.3%
22.3%
19.5%
34.9%
Main importers' goods -Business
Machinery equipment, sound and television recordersand reproducers, and parts thereofVehicles, aircraft and associated transport equipment
Base metals and articles of base metal
Others
8
Source: Statistic Centre – Abu Dhabi The data for 2020 are preliminary
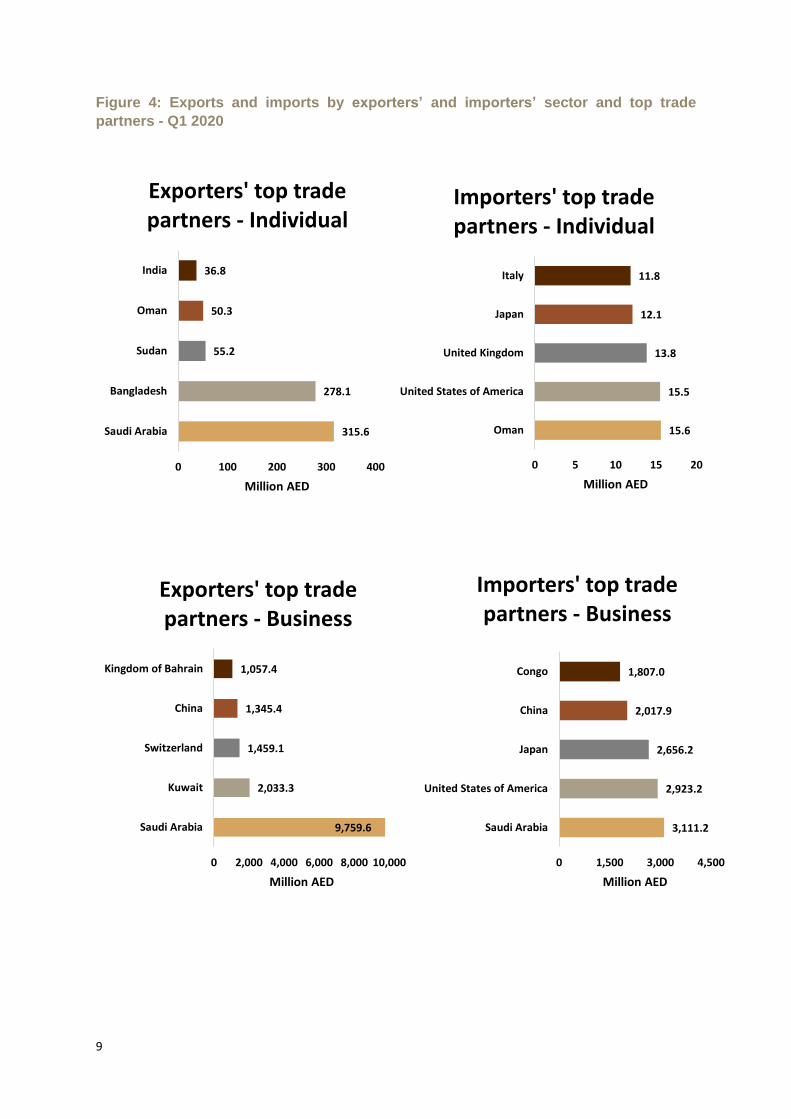
Exports and imports by exporters’ and importers’ sector and top trade
partners - Q1 2020
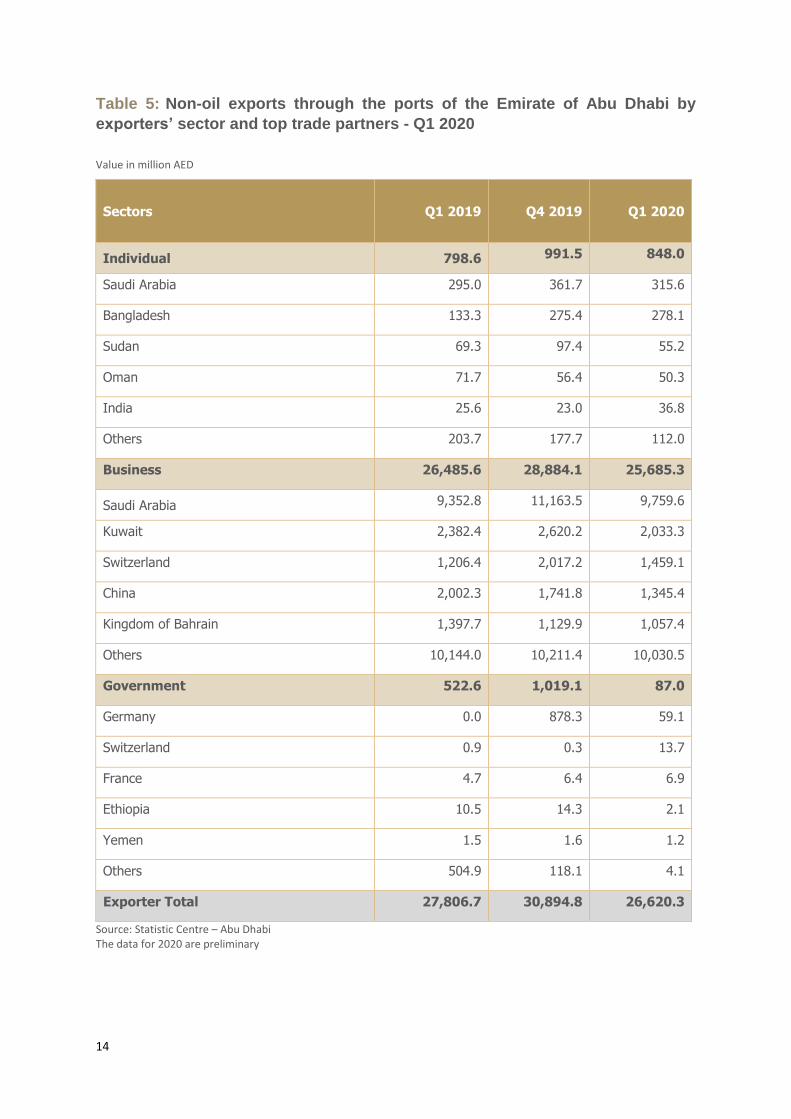
The top five countries represented 86.8% of total exports by the individual sector. Saudi Arabia was the
top destination, with a value of AED 315.6 million, followed by Bangladesh, Sudan, Oman and India.
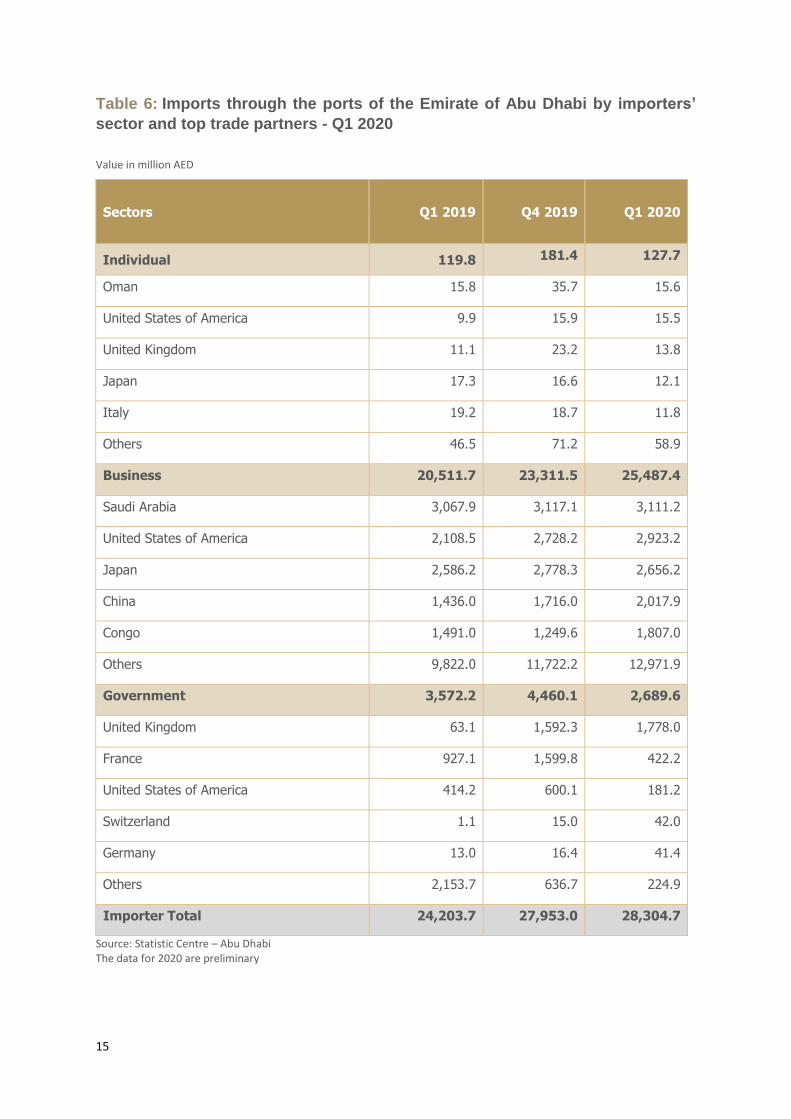
Oman was the main source of imports by the same sector, with a value of AED 15.6 million, followed
by United States of America, United Kingdom, Japan and Italy with an accumulated 53.9% of the total
for this sector.
Overall, the largest country by destination for business sector exports was Saudi Arabia, which attracted
exports from Abu Dhabi worth AED 9.8 billion, it was followed by Kuwait, Switzerland, China and
Kingdome of Bahrain, with 60.9% of the total business sector export. By contrast, the top five countries
contributed 49.1% of total imports of the same sector. Saudi Arabia was the largest country by origin
with AED 3.1 billion, followed by United States of America, Japan, China and Congo.
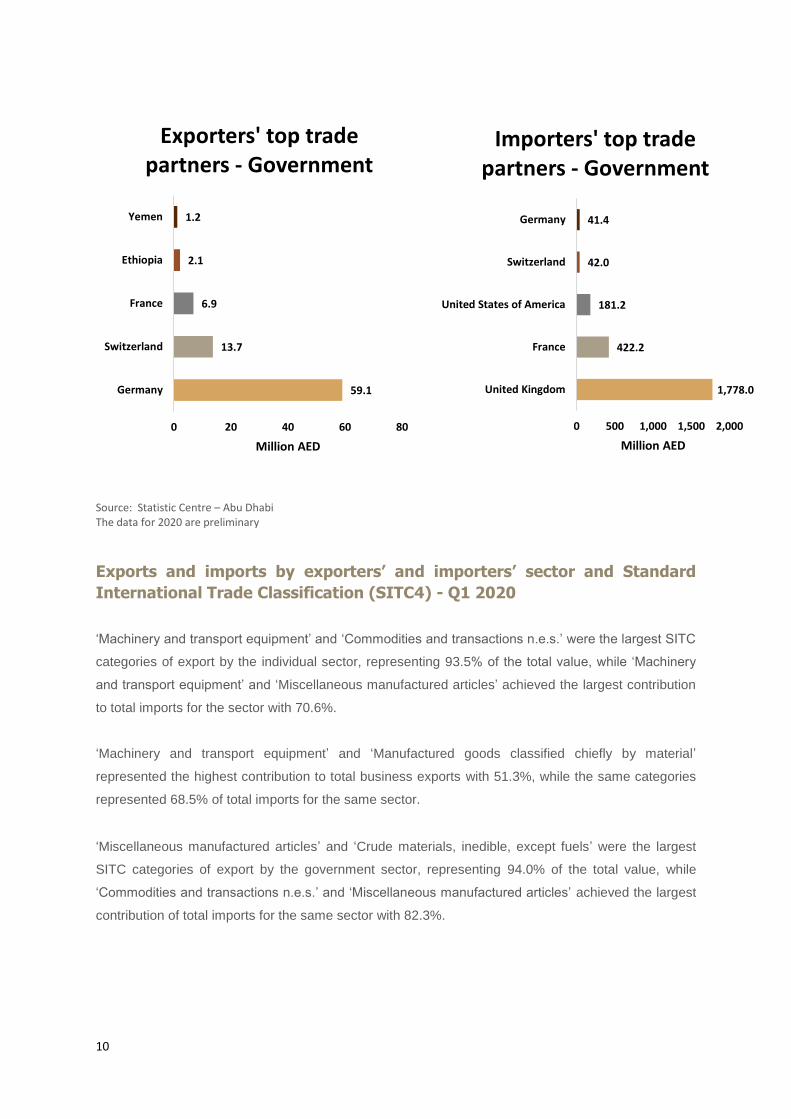
The top five countries accounted for 95.3% of the total exports by the government sector. Germany
ranked first in terms of value, with exports worth AED 59.1 million, followed by Switzerland, France,
Ethiopia and Yemen. United Kingdom ranked first in imports by the same sector with a value of AED
1.8 billion, followed by France, United States of America, Switzerland and Germany, while these five
countries represented 91.6% of the total value of imports by this sector.
85.1%
7.8%
4.0% 3.1%
Main exporters' goods -Government
Works of art, collectors' pieces and antiques
Articles of wood, articles of cork, basket ware andwickerworkMachinery equipment, sound and television recordersand reproducers, and parts thereofOthers
63.2%
14.1%
7.8%14.9%
Main importers' goods -Government
Pearls, precious or semi-precious stones, imitationjewelryWorks of art, collectors' pieces and antiques
Machinery equipment, sound and television recordersand reproducers, and parts thereofOthers
9
Figure 4: Exports and imports by exporters’ and importers’ sector and top trade
partners - Q1 2020
315.6
278.1
55.2
50.3
36.8
0 100 200 300 400
Saudi Arabia
Bangladesh
Sudan
Oman
India
Million AED
Exporters' top trade partners - Individual
15.6
15.5
13.8
12.1
11.8
0 5 10 15 20
Oman
United States of America
United Kingdom
Japan
Italy
Million AED
Importers' top trade partners - Individual
9,759.6
2,033.3
1,459.1
1,345.4
1,057.4
0 2,000 4,000 6,000 8,000 10,000
Saudi Arabia
Kuwait
Switzerland
China
Kingdom of Bahrain
Million AED
Exporters' top trade partners - Business
3,111.2
2,923.2
2,656.2
2,017.9
1,807.0
0 1,500 3,000 4,500
Saudi Arabia
United States of America
Japan
China
Congo
Million AED
Importers' top trade partners - Business
10
Source: Statistic Centre – Abu Dhabi The data for 2020 are preliminary
Exports and imports by exporters’ and importers’ sector and Standard
International Trade Classification (SITC4) - Q1 2020
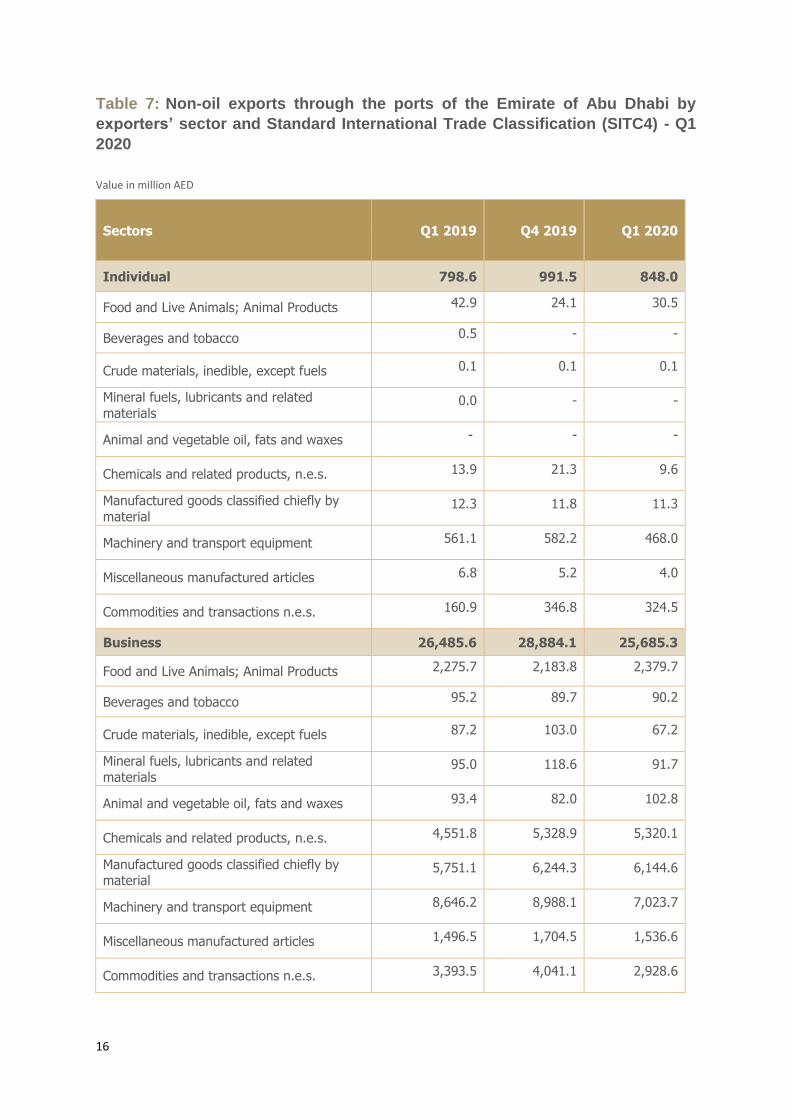
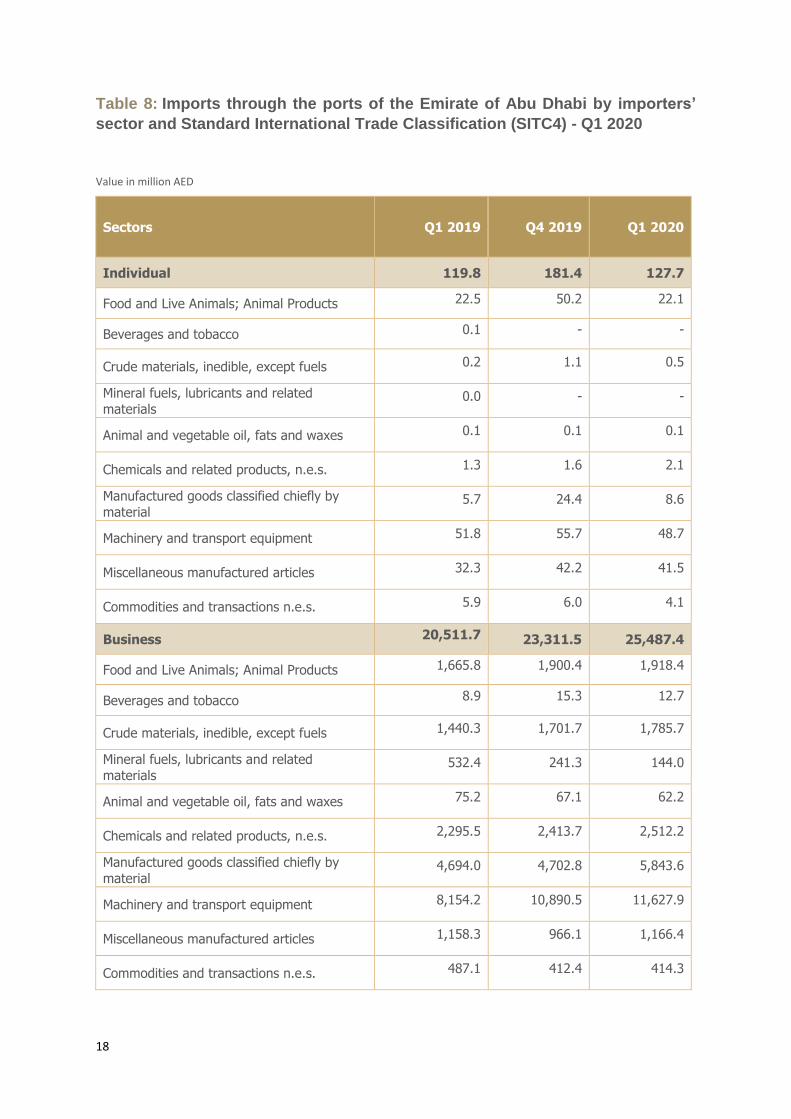
‘Machinery and transport equipment’ and ‘Commodities and transactions n.e.s.’ were the largest SITC
categories of export by the individual sector, representing 93.5% of the total value, while ‘Machinery
and transport equipment’ and ‘Miscellaneous manufactured articles’ achieved the largest contribution
to total imports for the sector with 70.6%.
‘Machinery and transport equipment’ and ‘Manufactured goods classified chiefly by material’
represented the highest contribution to total business exports with 51.3%, while the same categories
represented 68.5% of total imports for the same sector.
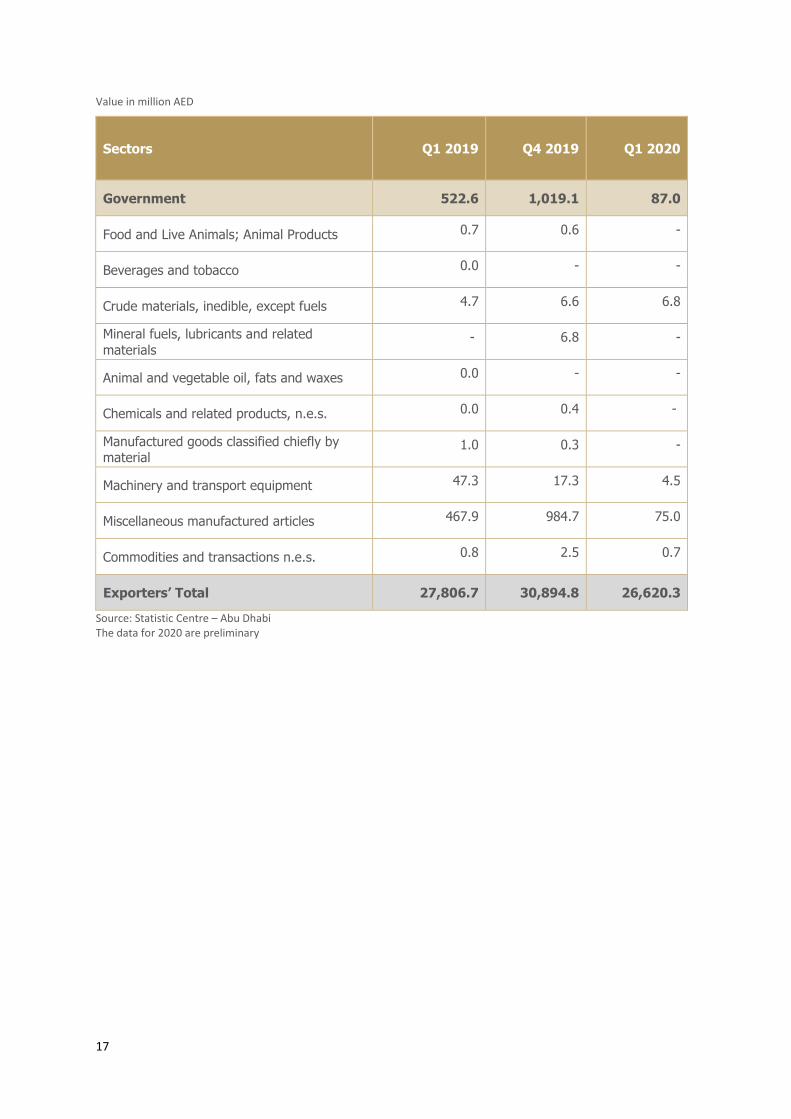
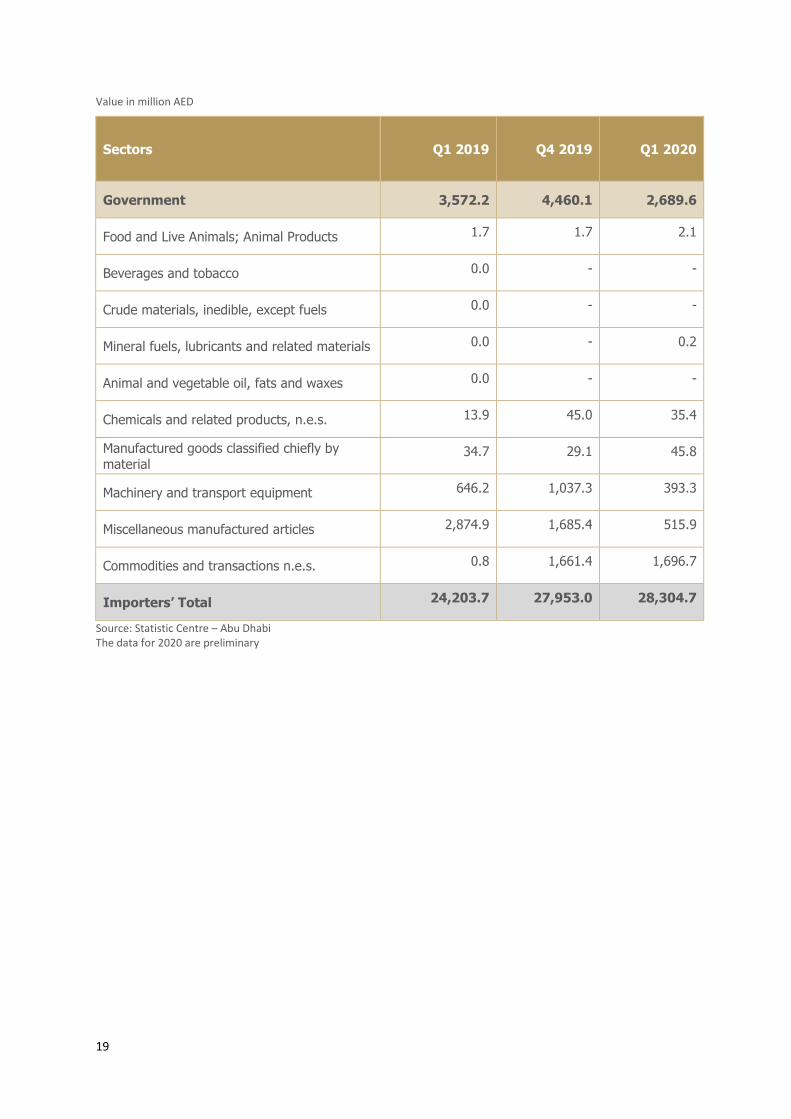
‘Miscellaneous manufactured articles’ and ‘Crude materials, inedible, except fuels’ were the largest
SITC categories of export by the government sector, representing 94.0% of the total value, while
‘Commodities and transactions n.e.s.’ and ‘Miscellaneous manufactured articles’ achieved the largest
contribution of total imports for the same sector with 82.3%.
59.1
13.7
6.9
2.1
1.2
0 20 40 60 80
Germany
Switzerland
France
Ethiopia
Yemen
Million AED
Exporters' top trade partners - Government
1,778.0
422.2
181.2
42.0
41.4
0 500 1,000 1,500 2,000
United Kingdom
France
United States of America
Switzerland
Germany
Million AED
Importers' top trade partners - Government
11
Statistical Tables
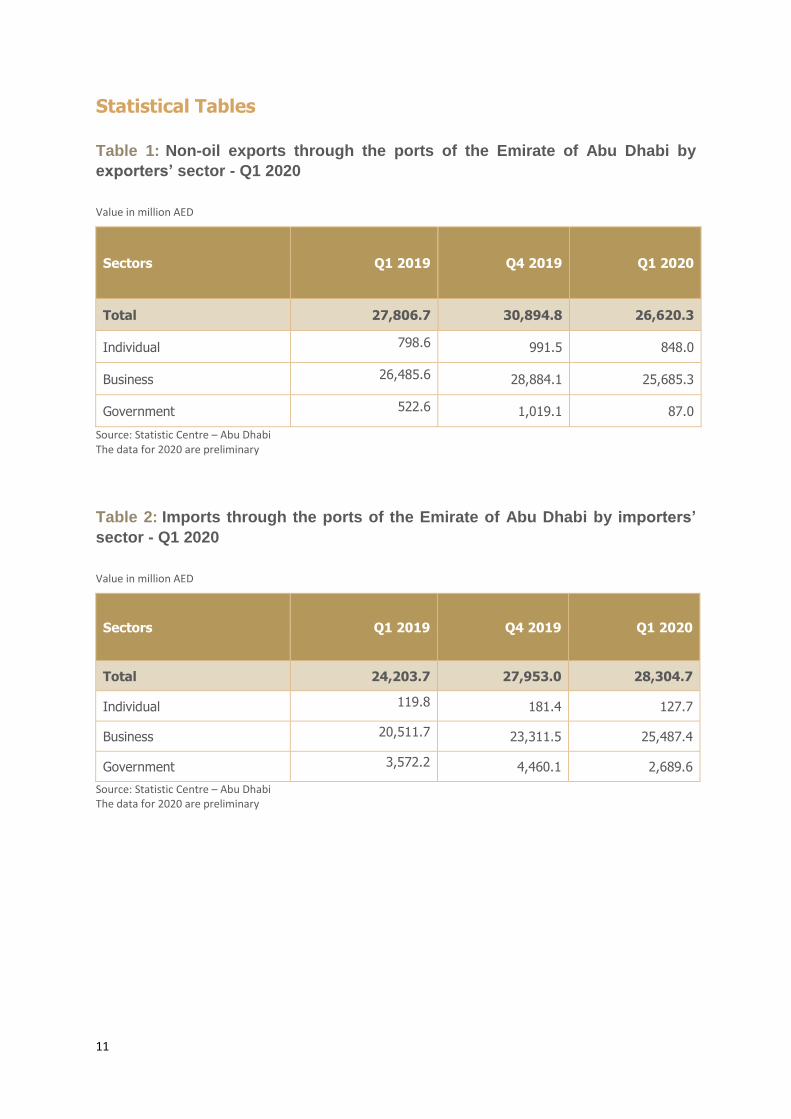
Table 1: Non-oil exports through the ports of the Emirate of Abu Dhabi by
exporters’ sector - Q1 2020
Value in million AED
Sectors Q1 2019 Q4 2019 Q1 2020
Total 27,806.7 30,894.8 26,620.3
Individual 798.6 991.5 848.0
Business 26,485.6 28,884.1 25,685.3
Government 522.6 1,019.1 87.0
Source: Statistic Centre – Abu Dhabi The data for 2020 are preliminary
Table 2: Imports through the ports of the Emirate of Abu Dhabi by importers’
sector - Q1 2020
Value in million AED
Sectors Q1 2019 Q4 2019 Q1 2020
Total 24,203.7 27,953.0 28,304.7
Individual 119.8 181.4 127.7
Business 20,511.7 23,311.5 25,487.4
Government 3,572.2 4,460.1 2,689.6
Source: Statistic Centre – Abu Dhabi The data for 2020 are preliminary
12
Table 3: Non-oil exports through the ports of the Emirate of Abu Dhabi by
exporters’ sector and main exporters’ goods (HS) - Q1 2020
Value in million AED
Sectors Q1 2019 Q4 2019 Q1 2020
Individual 798.6 991.5 848.0
Vehicles, aircraft and associated transport
equipment 535.8 564.3 453.8
Pearls, precious or semi-precious stones,
imitation jewelry 162.0 341.1 326.2
Live Animals; Animal Products 38.5 20.9 28.1
Others 62.3 65.2 39.9
Business 26,485.6 28,884.1 25,685.3
Base metals and articles of base metal 4,894.5 5,131.5 5,074.1
Vehicles, aircraft and associated transport
equipment 5,143.3 4,934.0 4,062.1
Plastics and articles thereof or rubber and
articles thereof 3,255.2 3,812.1 3,686.1
Others 13,192.6 15,006.6 12,863.0
Government 522.6 1,019.1 87.0
Works of art, collectors' pieces and antiques 468.0 986.9 74.1
Articles of wood, articles of cork, basket ware and wickerwork
4.7 6.4 6.8
Machinery equipment, sound and television recorders and reproducers, and parts thereof
10.7 9.5 3.5
Others 39.2 16.4 2.7
Exporter Total 27,806.7 30,894.8 26,620.3
Source: Statistic Centre – Abu Dhabi The data for 2020 are preliminary
13
Table 4: Imports through the ports of the Emirate of Abu Dhabi by importers’
sector and main importers’ goods (HS) - Q1 2020
Value in million AED
Sectors Q1 2019 Q4 2019 Q1 2020
Individual 119.8 181.4 127.7
Vehicles, aircraft and associated transport
equipment 46.0 50.0 43.3
Live Animals; Animal Products 20.5 48.5 20.0
Textiles and textile articles 12.5 16.8 14.3
Others 40.7 66.1 50.1
Business 20,511.7 23,311.5 25,487.4
Machinery equipment, sound and television recorders and reproducers, and parts thereof
3,309.0 5,478.0 5,928.8
Vehicles, aircraft and associated transport
equipment 4,844.5 5,399.4 5,686.1
Base metals and articles of base metal 3,855.3 3,823.6 4,972.0
Others 8,502.8 8,610.4 8,900.5
Government 3,572.2 4,460.1 2,689.6
Pearls, precious or semi-precious stones,
imitation jewelry 0.5 1,658.7 1,700.4
Works of art, collectors' pieces and antiques 2,814.8 1,546.3 379.0
Machinery equipment, sound and television
recorders and reproducers, and parts thereof 166.8 491.2 210.5
Others 590.2 764.0 399.6
Importer Total 24,203.7 27,953.0 28,304.7
Source: Statistic Centre – Abu Dhabi The data for 2020 are preliminary
14
Table 5: Non-oil exports through the ports of the Emirate of Abu Dhabi by
exporters’ sector and top trade partners - Q1 2020
Value in million AED
Sectors Q1 2019 Q4 2019 Q1 2020
Individual 798.6 991.5 848.0
Saudi Arabia 295.0 361.7 315.6
Bangladesh 133.3 275.4 278.1
Sudan 69.3 97.4 55.2
Oman 71.7 56.4 50.3
India 25.6 23.0 36.8
Others 203.7 177.7 112.0
Business 26,485.6 28,884.1 25,685.3
Saudi Arabia 9,352.8 11,163.5 9,759.6
Kuwait 2,382.4 2,620.2 2,033.3
Switzerland 1,206.4 2,017.2 1,459.1
China 2,002.3 1,741.8 1,345.4
Kingdom of Bahrain 1,397.7 1,129.9 1,057.4
Others 10,144.0 10,211.4 10,030.5
Government 522.6 1,019.1 87.0
Germany 0.0 878.3 59.1
Switzerland 0.9 0.3 13.7
France 4.7 6.4 6.9
Ethiopia 10.5 14.3 2.1
Yemen 1.5 1.6 1.2
Others 504.9 118.1 4.1
Exporter Total 27,806.7 30,894.8 26,620.3
Source: Statistic Centre – Abu Dhabi The data for 2020 are preliminary
15
Table 6: Imports through the ports of the Emirate of Abu Dhabi by importers’
sector and top trade partners - Q1 2020
Value in million AED
Sectors Q1 2019 Q4 2019 Q1 2020
Individual 119.8 181.4 127.7
Oman 15.8 35.7 15.6
United States of America 9.9 15.9 15.5
United Kingdom 11.1 23.2 13.8
Japan 17.3 16.6 12.1
Italy 19.2 18.7 11.8
Others 46.5 71.2 58.9
Business 20,511.7 23,311.5 25,487.4
Saudi Arabia 3,067.9 3,117.1 3,111.2
United States of America 2,108.5 2,728.2 2,923.2
Japan 2,586.2 2,778.3 2,656.2
China 1,436.0 1,716.0 2,017.9
Congo 1,491.0 1,249.6 1,807.0
Others 9,822.0 11,722.2 12,971.9
Government 3,572.2 4,460.1 2,689.6
United Kingdom 63.1 1,592.3 1,778.0
France 927.1 1,599.8 422.2
United States of America 414.2 600.1 181.2
Switzerland 1.1 15.0 42.0
Germany 13.0 16.4 41.4
Others 2,153.7 636.7 224.9
Importer Total 24,203.7 27,953.0 28,304.7
Source: Statistic Centre – Abu Dhabi The data for 2020 are preliminary
16
Table 7: Non-oil exports through the ports of the Emirate of Abu Dhabi by
exporters’ sector and Standard International Trade Classification (SITC4) - Q1
2020
Value in million AED
Sectors Q1 2019 Q4 2019 Q1 2020
Individual 798.6 991.5 848.0
Food and Live Animals; Animal Products 42.9 24.1 30.5
Beverages and tobacco 0.5 - -
Crude materials, inedible, except fuels 0.1 0.1 0.1
Mineral fuels, lubricants and related
materials 0.0 - -
Animal and vegetable oil, fats and waxes - - -
Chemicals and related products, n.e.s. 13.9 21.3 9.6
Manufactured goods classified chiefly by
material 12.3 11.8 11.3
Machinery and transport equipment 561.1 582.2 468.0
Miscellaneous manufactured articles 6.8 5.2 4.0
Commodities and transactions n.e.s. 160.9 346.8 324.5
Business 26,485.6 28,884.1 25,685.3
Food and Live Animals; Animal Products 2,275.7 2,183.8 2,379.7
Beverages and tobacco 95.2 89.7 90.2
Crude materials, inedible, except fuels 87.2 103.0 67.2
Mineral fuels, lubricants and related
materials 95.0 118.6 91.7
Animal and vegetable oil, fats and waxes 93.4 82.0 102.8
Chemicals and related products, n.e.s. 4,551.8 5,328.9 5,320.1
Manufactured goods classified chiefly by material
5,751.1 6,244.3 6,144.6
Machinery and transport equipment 8,646.2 8,988.1 7,023.7
Miscellaneous manufactured articles 1,496.5 1,704.5 1,536.6
Commodities and transactions n.e.s. 3,393.5 4,041.1 2,928.6
17
Value in million AED
Sectors Q1 2019 Q4 2019 Q1 2020
Government 522.6 1,019.1 87.0
Food and Live Animals; Animal Products 0.7 0.6 -
Beverages and tobacco 0.0 - -
Crude materials, inedible, except fuels 4.7 6.6 6.8
Mineral fuels, lubricants and related
materials - 6.8 -
Animal and vegetable oil, fats and waxes 0.0 - -
Chemicals and related products, n.e.s. 0.0 0.4 -
Manufactured goods classified chiefly by material
1.0 0.3 -
Machinery and transport equipment 47.3 17.3 4.5
Miscellaneous manufactured articles 467.9 984.7 75.0
Commodities and transactions n.e.s. 0.8 2.5 0.7
Exporters’ Total 27,806.7 30,894.8 26,620.3
Source: Statistic Centre – Abu Dhabi The data for 2020 are preliminary
18
Table 8: Imports through the ports of the Emirate of Abu Dhabi by importers’
sector and Standard International Trade Classification (SITC4) - Q1 2020
Value in million AED
Sectors Q1 2019 Q4 2019 Q1 2020
Individual 119.8 181.4 127.7
Food and Live Animals; Animal Products 22.5 50.2 22.1
Beverages and tobacco 0.1 - -
Crude materials, inedible, except fuels 0.2 1.1 0.5
Mineral fuels, lubricants and related
materials 0.0 - -
Animal and vegetable oil, fats and waxes 0.1 0.1 0.1
Chemicals and related products, n.e.s. 1.3 1.6 2.1
Manufactured goods classified chiefly by
material 5.7 24.4 8.6
Machinery and transport equipment 51.8 55.7 48.7
Miscellaneous manufactured articles 32.3 42.2 41.5
Commodities and transactions n.e.s. 5.9 6.0 4.1
Business 20,511.7 23,311.5 25,487.4
Food and Live Animals; Animal Products 1,665.8 1,900.4 1,918.4
Beverages and tobacco 8.9 15.3 12.7
Crude materials, inedible, except fuels 1,440.3 1,701.7 1,785.7
Mineral fuels, lubricants and related
materials 532.4 241.3 144.0
Animal and vegetable oil, fats and waxes 75.2 67.1 62.2
Chemicals and related products, n.e.s. 2,295.5 2,413.7 2,512.2
Manufactured goods classified chiefly by
material 4,694.0 4,702.8 5,843.6
Machinery and transport equipment 8,154.2 10,890.5 11,627.9
Miscellaneous manufactured articles 1,158.3 966.1 1,166.4
Commodities and transactions n.e.s. 487.1 412.4 414.3
19
Value in million AED
Sectors Q1 2019 Q4 2019 Q1 2020
Government 3,572.2 4,460.1 2,689.6
Food and Live Animals; Animal Products 1.7 1.7 2.1
Beverages and tobacco 0.0 - -
Crude materials, inedible, except fuels 0.0 - -
Mineral fuels, lubricants and related materials 0.0 - 0.2
Animal and vegetable oil, fats and waxes 0.0 - -
Chemicals and related products, n.e.s. 13.9 45.0 35.4
Manufactured goods classified chiefly by material
34.7 29.1 45.8
Machinery and transport equipment 646.2 1,037.3 393.3
Miscellaneous manufactured articles 2,874.9 1,685.4 515.9
Commodities and transactions n.e.s. 0.8 1,661.4 1,696.7
Importers’ Total 24,203.7 27,953.0 28,304.7
Source: Statistic Centre – Abu Dhabi The data for 2020 are preliminary
20
Explanatory notes
Technical notes
Data source
Data are obtained from the exporters’ and importers’ record of the Department of Finance – Customs
Administration. The data are processed and provided to Statistic Centre – Abu Dhabi for further editing,
compilation and reclassified according to statistical classifications for foreign trade statistics.
Valuation
In line with the World Customs Organization (WCO) agreement on valuation:
Exports (including re-exports) are valued free on board (fob), which represents the value at the
export border, and includes inland freight costs and packaging
Imports are valued on the cost insurance and freight (c.i.f.) basis, which represents the value
at the import border, and includes the additional cost of freight and insurance in transporting
the goods internationally
Revision Policy
Monthly estimates of Foreign Trade are released on the following schedule: “Preliminary” estimates,
based on administrative data that are incomplete or subject to further revision by the source agency,
are released near the end of the second month after the end of the reference month. No further updates
are incorporated into the monthly Foreign Trade statistics until the source finalize its data four months
after the end of the reference calendar year.
These revisions are necessary to incorporate definition and classification changes or to reflect the
introduction of new and improved methodologies and new data.
New methods, definitions, techniques, systems, guidelines, classifications
Changes due to the introduction of a new method, guidelines, technique or classification system can
lead to revisions after the time series data have been finalized. For instance, in 2019, the methodology
for the registration of customs declarations of exports and re-exports was modified by the Customs
Department to include all goods exported from the ports of the Emirate of Abu Dhabi regardless of the
source of those goods. The non-oil exports series was revised for 2015-2020 to provide users with an
updated statistical time series of Foreign Trade data to users.
21
Notes on Tables
Changes (levels and %) in all tables are based on unrounded numbers.
Relative importance is calculated as the ratio between the value of the sub-group and the total
value for all groups, expressed as a percentage.
Totals in some tables may not add up due to rounding.
The data for 2020 are preliminary.
Symbols used
‘-‘ nil or rounded to zero
‘..’ Not applicable
n.e.s. denotes ‘not elsewhere specified’
Glossary
This publication contains certain terms specific to foreign merchandise trade and necessary when
analyzing the trade statistics of Abu Dhabi Emirate. They include the following terms:
Classifications
The non-oil foreign merchandise trade statistics are presented in accordance with the two main
internationally recommended output classifications: Harmonized System (HS) and Standard
International Trade Classification (SITC4).
If users require statistics by the detailed Harmonized Commodity Description and Coding System (HS),
these are available from SCAD on request. The HS is an input classification, and is the basis on which
traders record goods with Customs.
Exporter and importer register
Is an official book in the Department of Finance – Customs Administration and contains data about
exports or imports of goods by individuals, companies and entities through the ports of the Emirate of
Abu Dhabi
Importer
Means the natural or legal person importing the goods.
Exporter
Means the natural or legal person exporting the goods.
Imports
Imports are goods that enter Abu Dhabi’s customs and economic district from various parts of the world,
excluding other emirates in the United Arab Emirates, and receive customs clearance. Goods are
22
considered imports regardless of whether they enter the Emirate directly or are retrieved from customs
warehouses, temporary entry areas or free zones inside the country. These goods receive customs
clearance in order to become part of Abu Dhabi’s merchandise balance.
Non-oil Exports
Non-oil exports include goods that are entirely produced locally or in whose production process local
resources are used. Non-oil exports through the ports of Abu Dhabi include goods that were produced
in other Emirates in the United Arab Emirates. Oil is excluded from these goods. These goods leave
Abu Dhabi’s customs and economic district to the outside world, reducing the Emirate’s non-oil
merchandise trade deficit. In this publication, the value of exports is the sum of exports and re-exports.
Individual sector
Represent natural persons residing in the Emirate of Abu Dhabi (citizens and non-nationals) who import
and export through the ports of the Emirate of Abu Dhabi.
Business sector
Represent all local and foreign companies and establishments operating in the Emirate of Abu Dhabi
that have imported and exported through the ports of the Emirate of Abu Dhabi.
Government sector
Represent all ministries, federal and local departments and diplomatic bodies operating in the Emirate
of Abu Dhabi that have imported and exported through the ports of the Emirate of Abu Dhabi.
Preliminary estimates
Estimates that have been calculated using only secondary data sources and methods. Users of this
data should be aware that preliminary estimates will be revised when primary data sources become
available for that time period.
Final estimates
Once primary data are incorporated into the foreign trade statistics, it is considered as final and are not
revised unless future primary data become available.
More information
For more information about foreign trade and other official statistics for Abu Dhabi Emirate, please visit
the statistics link on the SCAD website at http://www.scad.gov.ae
23