Embed Size (px)
Citation preview

8/20/2019 Statistical+Abstract+of+Delhi+2014
http://slidepdf.com/reader/full/statisticalabstractofdelhi2014 1/190
HAS
Government of NCT of Delhi
STATISTICAL ABSTRACT
OF DELHI
2014
Directorate of Economics and StatisticsVikas Bhawan-II, 3rd Floor (B-Wing),Bela Road,Delhi-54

8/20/2019 Statistical+Abstract+of+Delhi+2014
http://slidepdf.com/reader/full/statisticalabstractofdelhi2014 2/190
GOVERNMENT OF NATIONAL CAPITAL TERRITORY OF
DELHI
Statistical abstract of Delhi
2014
DIRECTORATE OF ECONOMICS & STATISTICSVIKAS BHAWAN-II, IIIRD FLOOR ‘B’ WING,
BELA ROAD, NEAR METCALF HOUSE,
DELHI- 110054.

8/20/2019 Statistical+Abstract+of+Delhi+2014
http://slidepdf.com/reader/full/statisticalabstractofdelhi2014 3/190
PREFACE
The present Statistical Abstract 2014 is the Seventh in the series brought out
by this Directorate on the basis of secondary data sources. The un iq ue ne ss of
Statistical Abstract i s t h a t i t contains time series data on various socio-economic
parameters and serves as an effective quantitative tool for reaching to logical conclusions
in the context of planning and public policy making.
T h e p r e s e n t e d i t i o n o f Statistical Abstract is thoroughly improved in
terms of coverage and quality. The broad subjects covered include population, data on
different sectors of the economy, napmely, agriculture, industry and infrastructure
sector, economic indicators like Gross State Domestic Product & Per Capita Income,
level & pattern of household consumer expenditure, poverty, prices etc. This publication
has taken care to include information on social welfare aspects. Data of other
states/UTs has also been presented in respect of select indicators for comparison
purpose.
The report has been prepared by Planning & Coordination unit of this
Directorate under the guidance of Dr. R.N. Sharma, Joint Director and Dr. Shikha
Anand, Deputy Director. The preparation of the Abstract was supervised by Mrs Sunita
Jain, Assistant Director and Sh. Ashish Verma, Statistical Officer. The special effort
made by Mrs Neetu Bharti and Mrs. Mamta Rani, Statistical Assistants to bring out this
report deserves special appreciation. The Directorate is indebted to all the
departments/offices/organizations for extending active co-operation by providing
requisite data. Suggestions, if any, for the improvement of the future versions of the
report are welcome.
Place: Delhi Dr. B.K. Sharma
Date: November, 2014 Director

8/20/2019 Statistical+Abstract+of+Delhi+2014
http://slidepdf.com/reader/full/statisticalabstractofdelhi2014 4/190
TEAM
DR. R.N.SHARMA : JOINT DIRECTOR
DR. SHIKHA ANAND : DEPUTY DIRECTOR
Mrs. SUNITA JAIN : ASSISTANT DIRECTOR
SH. ASHISH VERMA : STATISTICAL OFFICER
Mrs. NEETU BHARTI : STATISTICAL ASSISTANT
Mrs. MAMTA RANI : STATISTICAL ASSISTANT

8/20/2019 Statistical+Abstract+of+Delhi+2014
http://slidepdf.com/reader/full/statisticalabstractofdelhi2014 5/190
C O N T E N T S
Delhi at a Glance
Executive Summary i-vii
Chapter
No.
Table
No.
Items Page No.
1. AREA AND POPULATION 1
1 Area & Population of Delhi 1991 to 2011 2-3
1.1 Population Characteristics-Delhi 1981-2011 4
1.2 Population and Decennial Growth of Delhi 1901 to 2011 5
1.3 Area under local bodies wise 1961 to 2011 6
1.4 Population under local bodies 1961 to 2001 7
1.5 Sex Ratio under Local Bodies & Urban/Rural 1961-2011 8
1.6 Scheduled Caste Population under Local Bodies 1961 to 2001 9
1.7Density of Population in Local bodies & Urban/ Rural
according to 1961 to 201110
1.8 District wise Population, Density & Sex Ratio &Literacy DataOf Delhi 2001 & 2011
11
1.9 District wise Sex Ratio &Literacy Data Of Delhi 2001 & 2011 12
1.10Percentage of Total Main, Marginal and Non-workers 1991 &
201113-17
1.11Distribution of Population by Scheduled Languages in Delhi
1991 & 200118
1.12 Population by Religion 1961 to 2001 19
1.13 Population by Age Groups 1971 to 2011 20-21
1.14 Literacy Rate by Sex 1931 to 2011 22
1.15 Slum population of Delhi 2011 23
1.16 Houseless & Households Population 2011 24
1.17No. of Houses &Households and their Amenities 1991 &
201125
8/20/2019 Statistical+Abstract+of+Delhi+2014
http://slidepdf.com/reader/full/statisticalabstractofdelhi2014 6/190
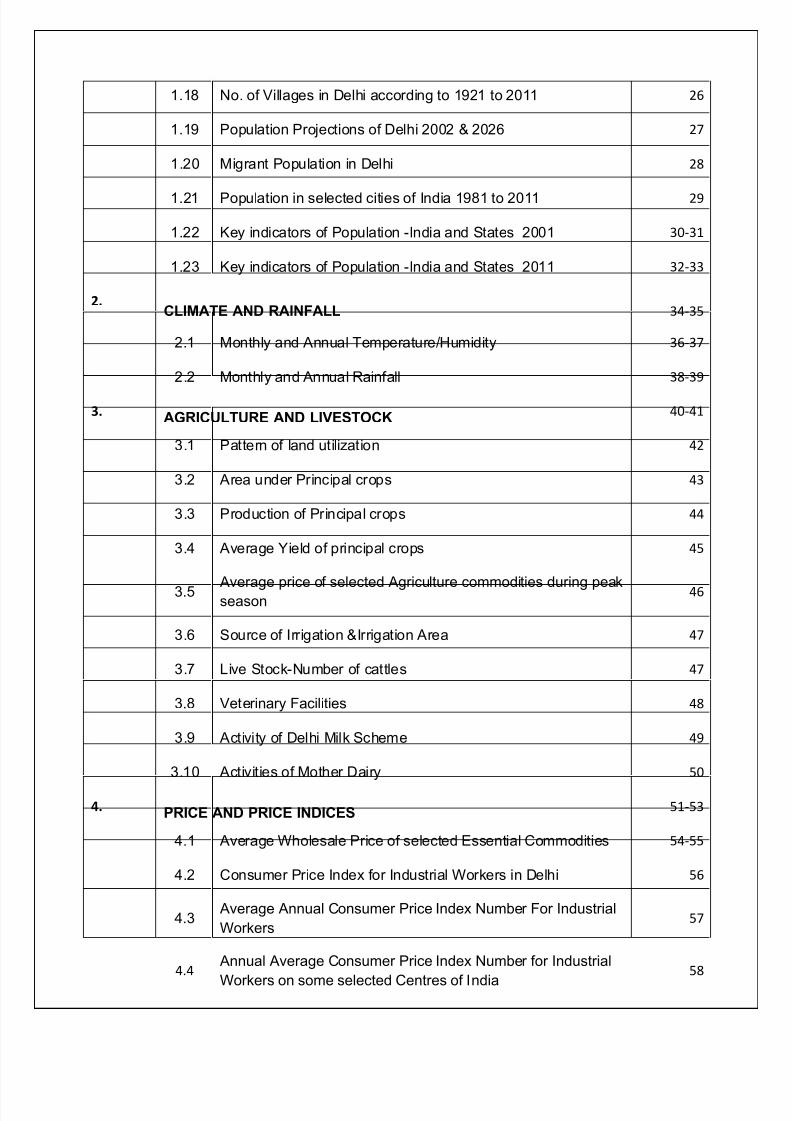
1.18 No. of Villages in Delhi according to 1921 to 2011 26
1.19 Population Projections of Delhi 2002 & 2026 27
1.20 Migrant Population in Delhi 28
1.21 Population in selected cities of India 1981 to 2011 29
1.22 Key indicators of Population -India and States 2001 30-31
1.23 Key indicators of Population -India and States 2011 32-33
2.CLIMATE AND RAINFALL 34-35
2.1 Monthly and Annual Temperature/Humidity 36-37
2.2 Monthly and Annual Rainfall 38-39
3. AGRICULTURE AND LIVESTOCK 40-41
3.1 Pattern of land utilization 42
3.2 Area under Principal crops 43
3.3 Production of Principal crops 44
3.4 Average Yield of principal crops 45
3.5 Average price of selected Agriculture commodities during peakseason 46
3.6 Source of Irrigation &Irrigation Area 47
3.7 Live Stock-Number of cattles 47
3.8 Veterinary Facilities 48
3.9 Activity of Delhi Milk Scheme 49
3.10 Activities of Mother Dairy 50
4. PRICE AND PRICE INDICES 51-53
4.1 Average Wholesale Price of selected Essential Commodities 54-55
4.2 Consumer Price Index for Industrial Workers in Delhi 56
4.3 Average Annual Consumer Price Index Number For Industrial
Workers57
4.4 Annual Average Consumer Price Index Number for Industrial
Workers on some selected Centres of India
58

8/20/2019 Statistical+Abstract+of+Delhi+2014
http://slidepdf.com/reader/full/statisticalabstractofdelhi2014 7/190
4.5 Index number of Wholesale Prices in India 59
5.INFRASTRUCTURE
60-61
5.1 Electricity Generation 62
5.2 Electricity Consumption 63
5.3 No. of electricity consumers category wise 64
5.4 No. of water consumers category wise 65
5.5 Length of roads 66
5.6 No. of Registered Motor Vehicles 67
5.7 Percentage distribution of registered vehicle to the total 67-68
5.8 Working of Delhi transport corporation 69
5.9 Post offices and Telephone connections 70
6. TRADE, COMMERCE & INDUSTRY 71-73
6.1 Distribution of registered companies and their brief features 74
6.2Industrial Classification of New Registration of Companies
Limited by share in Delhi75-77
6.3 Annual survey of Industries 78
6.4 Index. No. of Industrial Production 79
6.5 Registered Dealers & Receipts under Sales Tax Act in Delhi 80
6.6District wise distribution of Establishment in Delhi as per 6th
Economic Census81
6.7Distribution of Establishment by major activity group –
Economic Census82
6.8 Unorganized Manufacturing Activities in Delhi 83
6.9 Un – organized Manufacturing Enterprises & Employment 84
6.10 Unorganized Service Sector Employment 85
6.11 Unorganized Service Sector Enterprise 86
7. FINANCE, BANKING & INSURANCE 87-88
7.1 No. of Banks in Delhi 89
7.2 Distribution of Deposits in Banks 90

8/20/2019 Statistical+Abstract+of+Delhi+2014
http://slidepdf.com/reader/full/statisticalabstractofdelhi2014 8/190
7.3Occupational Classification of Outstanding Credit of
Scheduled Commercial Banks91-92
7.4 Progress of Life Insurance 93
7.5 Co-operative societies in Delhi 94
7.6 Progress of Consumer Cooperative Stores 95-96
7.7 Collections under Saving Schemes in Delhi 97-99
7.8 Principal Heads of Revenue Receipts 100
7.9 Principal Heads of Expenditure (Revenue Account) 101
7.10 Principal Head of Capital Budget 102
8. ECONOMIC INDICATORS 103-105
8.1 State Domestic Product & related aggregates 106
8.2 Gross State Domestic Product by broad Economic Activity 107
8.3 Net State Domestic Product by broad Economic Activity 108
8.4Percentage Distribution of GSDP by economic activity at
Constant Prices 2004-05109
8.5
Percentage Distribution of NSDP by economic activity at
Constant Prices 2004-05 110
8.6 State/UT Per capita Income 111
8.7 Monthly per capita Expenditure 112
8.8 Selected Economic(Poverty) Indicators of States / UT 113-114
9. EDUCATION 115-116
9.1 General Education - Education Institutions 117
9.2 Enrollment In Educational Institutions 117
9..3 Teachers In Educational Institutional 118
9.4State/UT Wise Gross Enrollment Ratio In Schools For General
Education(2006-2007)119-120
9.5State/UT Wise Dropout Ratio In Schools For General
Education(2006-2007)121
9.6Results Of Central Board Of Secondary Examination In Delhi
& India 122

8/20/2019 Statistical+Abstract+of+Delhi+2014
http://slidepdf.com/reader/full/statisticalabstractofdelhi2014 9/190
9.7 Higher Education - Number Of Higher Education Institutions 123
9.8 Teaching Faculty 123
9.9 Enrolment 123
9.10 Technical/Vocational Training – No. of Institutions 124
9.11 Enrolment 124
9.12 Number Of Instructors 124
9.13 Literacy Rate For Delhi 125
10. LABOUR &EMPLOYMENT 126-127
10.1 Survey Results – Employment & Unemployment in Delhi 128
10.2 Distribution Of Workers By Major Groups As Per Economic Census 129
10.3Number Of Workers District Wise Under 6th Economics
Census (2013) In Delhi130
10.4National Employment Service - Employment Exchange
Statistics131
10.5Occupational Distribution Of Registered Applicants In
Employment Exchange132
10.6Educational Classifications Of Applicants Registered In
Employment Exchange133-134
10.7Labour Welfare- Minimum Rate Of Wages In Scheduled
Employments135
10.8 Number Of Trade Unions & Industrial Disputes 136
10.9 Child Labour 137
11. HEALTH INDICATORS 138-139
11.1 Distribution Of Health Institutions 140
11.2 Number Of Dispensaries 140
11.3 Selected Vital Rates Of Delhi 141
11.4 Major Causes Of Deaths 142
11.5 Family Welfare Programmes 143
11.6 Immunization 144

8/20/2019 Statistical+Abstract+of+Delhi+2014
http://slidepdf.com/reader/full/statisticalabstractofdelhi2014 10/190
11.7 District Wise Disabled Population In Delhi-2011 145
11.8 Aged Population In Delhi 145
11.9 State/UT Wise Selected Vital Indicators 146
11.10 Total Fertility Rate (15-49) 147
11.11 State wise Proportion Of Aged Persons, Dependency Ratio 148
12. WELFARE STATISTICS 149-150
12.1 Women Welfare 151
12.2 Social Defence Programme 152
12.3 Child Welfare 153
12.4 Social Security/Others 154
12.5 Scheme for Society 155
12.6 Welfare Of Physically Handicapped(Ph) 156
12.7 Slum & JJ Clusters Welfare 157
12.8 Public Distribution System In Delhi 158
13.
POLICE, CRIME & ACCIDENTS
159-160
13.1 Police Stations, Police Posts & Police Strength in Delhi 161
13.2 Crimes in Delhi 162-163
13.3 Properties Stolen & Recovered in Delhi 164
13.4 Accidents in Delhi 165-166
14. CONCEPTS & DEFINITIONS 167-171
8/20/2019 Statistical+Abstract+of+Delhi+2014
http://slidepdf.com/reader/full/statisticalabstractofdelhi2014 11/190
Delhi Statistical Abstract, 2014
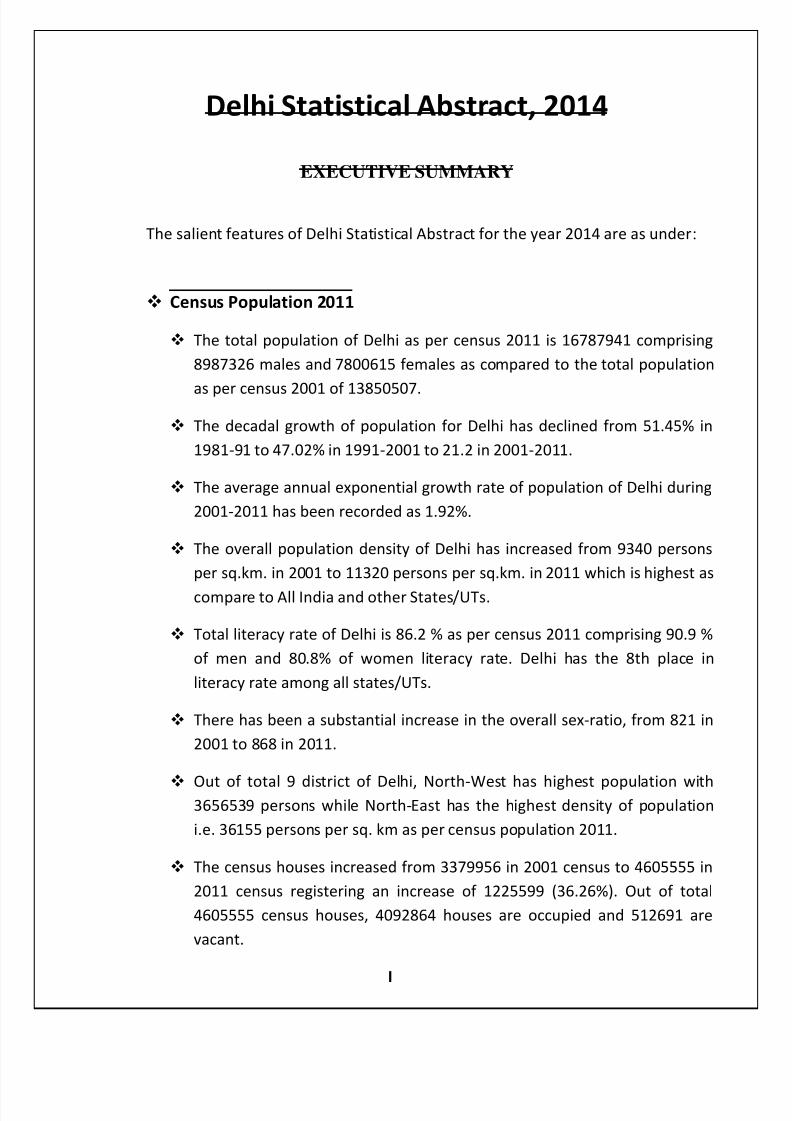
EXECUTIVE SUMMARY
The salient features of Delhi Statistical Abstract for the year 2014 are as under:
Census Population 2011
The total population of Delhi as per census 2011 is 16787941 comprising
8987326 males and 7800615 females as compared to the total population
as per census 2001 of 13850507.
The decadal growth of population for Delhi has declined from 51.45% in
1981-91 to 47.02% in 1991-2001 to 21.2 in 2001-2011.
The average annual exponential growth rate of population of Delhi during
2001-2011 has been recorded as 1.92%.
The overall population density of Delhi has increased from 9340 persons
per sq.km. in 2001 to 11320 persons per sq.km. in 2011 which is highest as
compare to All India and other States/UTs.
Total literacy rate of Delhi is 86.2 % as per census 2011 comprising 90.9 %
of men and 80.8% of women literacy rate. Delhi has the 8th place in
literacy rate among all states/UTs.
There has been a substantial increase in the overall sex-ratio, from 821 in
2001 to 868 in 2011.
Out of total 9 district of Delhi, North-West has highest population with3656539 persons while North-East has the highest density of population
i.e. 36155 persons per sq. km as per census population 2011.
The census houses increased from 3379956 in 2001 census to 4605555 in
2011 census registering an increase of 1225599 (36.26%). Out of total
4605555 census houses, 4092864 houses are occupied and 512691 are
vacant.
I

8/20/2019 Statistical+Abstract+of+Delhi+2014
http://slidepdf.com/reader/full/statisticalabstractofdelhi2014 12/190
Total households in Delhi are 3340538 comprising 79115 Rural and
3261423 Urban Households in 2011 as compared to the total households
as per Census 2001 of 2554149.
Climate & Rainfall
Maximum temperature is recorded during the month of May, 2013 i.e
41.50C and Minimum temperature is recorded during the month of
January, 2013 i.e. 6.10C. Maximum Humidity is recorded during the
Month of Jan and Dec, 2013 i.e. 94% and Minimum Humidity is recorded
during the Month of May, 2013 i.e. 40 %.
Total rainfall during the year 2013 is 1113.9 mm. Rainy day is count whenrain fall is 2.5 mm or more in a day. Maximum rainy days are in the month
of August 2013 i.e. 14 days.
Agriculture & Livestock
Percentage of land utilization in Delhi estimated during 2014-15 is as
follows:- 13.03% area would be use as fallow land, 15.70% net area
would be use for sown and rest 62.85% area are not available for
cultivation (excluding forest area).
Maximum area used for the production of wheat i.e. 19450 hectares and
86498 metric ton of wheat was produced during the year 2013-14.
Total number of live stock in Delhi during the year 2012 was 365967 which
include cattle, buffaloes, sheep, horses, pigs, camels, goats & others.
Total provisional number of Veterinary Hospital in Delhi during the year
2013-14 is 49. In Delhi, there is 25 Veterinary Dispensaries & 58 Veterinary
Doctor during the year 2013-14.
Total no. of Delhi Milk Scheme Depots during the year 2013-14 is 1056.
Daily average procurement of Milk during the year 2013-14 is 1.41 lakhs
Kgs.
Total Bulk vending booths of mother dairy is 1443 during the year 2013-
2014.
ii

8/20/2019 Statistical+Abstract+of+Delhi+2014
http://slidepdf.com/reader/full/statisticalabstractofdelhi2014 13/190
Price & Price Indices
Consumer Price Index for industrial workers of Delhi during the year 2013
is 209 which was 191 in the year 2012.
Average Annual Consumer Price Index for industrial worker in India and 4metro cities are as follows:- 232 in India,209 in Delhi, 237 in Mumbai, 218
in Chennai and 222 in Kolkata during 2013.
Index no. of wholesale Price in India during the year 2013-14 is increased
to 177.6 as compared to 167.6 in the year 2012-13.
Infrastructure
Total electricity available in Delhi during the year 2013-14 is 34729 million
units which comprising 4723 million units generated locally and 30006
million units purchased from other States.
Total consumption of electricity in Delhi during 2013-14 is 23781 million
units out of which 11609 million units used for domestic purpose, 6786
million units used for commercial purpose, 3064 million units used for
industrial purpose and rest in others.
Total numbers of electricity and water consumers in Delhi during 2013-14
are 4897361 and 2071804 respectively.
Total numbers of registered motor vehicles in Delhi during 2013-14 are
8293167 out of which 63.88 are of motor cycles/scooters, 31.70% are of
cars & jeeps and rest are used for commercial purposes as Auto Rickshaw,
Taxes, buses and goods vehicles.
Total no. of DTC buses in the fleet are 5216 in 2013-14 out of which 2506
are of law floor Non AC, 1275 are of Low Floor AC and 1435 are Standard
buses.
Total no. of Post Offices in Delhi during 2013 is 577.
Total no. of Telephone connections in Delhi during 2014 is 45688835.
iii

8/20/2019 Statistical+Abstract+of+Delhi+2014
http://slidepdf.com/reader/full/statisticalabstractofdelhi2014 14/190
Trade, Commerce & Industry
No. of already registered companies working in Delhi during 2012-13 are
173336, total newly registered companies during the year 2012-13 are
16055 and 1229 companies ceased to work.
Index no. of industrial production for the year 2012-13 is 115.94 (base
year 2004-05=100).
According to 6th
Economic Census 2013 (provisional results) total
establishments in Delhi were 893177 which include 463843 outside HH
with fixed structure establishment, 206440 outside HH without fixed
structure establishments and 222894 inside HH establishments.
According to 6th
Economic Census 2013 (provisional results) totalhandicraft/handloom establishments were 22308 and number of
establishments with 8 or more workers were 29680.
Finance Banking And Insurance
Total no. of banks in Delhi during 2014 is 3249 which includes 499 State
Bank of India & their subsidiaries, 1882 Nationalised banks and rest 868
other commercial banks.
Total no. of registered cooperative societies in Delhi during 2013-14 is
5541 out of which 3879 no. of cooperative societies are in working
position.
Economic Indicators
Gross State Domestic Product (GSDP) of Delhi at current prices is expected
to increase from Rs.100325 Cr. in 2004-05 to Rs. 348221 Cr. In 2012-13
and Rs. 404576 Cr. in 2013-14.
The Net State Domestic Product (NSDP) of Delhi at current prices is
expected to touch a level of Rs. 332521 Cr. in 2012-13 and Rs. 387097 Cr.
in 2013-14 as compared to Rs. 94717 Cr. During 2004-05.
Per capital income for the year 2013-14 at current prices is estimated as
Rs. 219979.
iv

8/20/2019 Statistical+Abstract+of+Delhi+2014
http://slidepdf.com/reader/full/statisticalabstractofdelhi2014 15/190
According 68th NSS Round Report (July, 2011- June, 2012) Monthly per
capital expenditure of Delhi is Rs. 3842 in Urban and Rs. 2561 in Rural.
Education
Total no. of school in Delhi during 2013-14 are 5401 which includes 2657Primary schools, 728 middle schools and 2016 Sec./Sr.Sec. Schools.
Total no. of students in schools in Delhi during 2013-14 is 41.95 lakhs
comprising 22.49 lakhs boy and 19.46 lakhs girl students.
Total no. of teachers in Delhi schools is 137385 during 2013-14 comprises
37685 males and 99700 female teachers. It includes 28312 teachers at
Primary level, 9316 at middle level and 99757 teachers at Sec./Sr.Sec.
level schools.
Gross Enrolments ratio of Delhi for general education is 127.7 at primary
level, 108.8 at middle, 100.2, at secondary level and 64.7 Sr. Sec. Level in
the year 2010-11.
Dropout ratio in Delhi schools for general education is 5.9 for classes I-V,
22.9 for classes I-X in the year 2010-11.
CBSE result in Delhi in the year 2014 is 98.31 passing percentage for
Secondary level and 86.78 passing percentage for Sr. Secondary level.
Total technical/vocation training institutes in Delhi during 2013-14 is 101
which includes 16 ITIs, 61 ITCs, 1 BTCs, 1 CSI/IBBS, 1 WCSC and 21
Polytechnic Institutes.
According to Census 2011 literacy rate of Delhi is 86.2% comprising 91.9%
male literacy and 80.8% female literacy.
Labour & Employment
According NSS 68th Round July, 2011-June, 2012, Labour Force
Participation Rate worked out to 350, employment rate worked out to 334
and unemployment rate worked out 45 in Delhi.
According to 6th
Economics Census 2013(provisional results) Total no. of
workers in Delhi were 2984850 includes 2049068 hired workers (1801274
male & 247794 female) and 935782 non-hired workers (819719 male &
116063 female).
v

8/20/2019 Statistical+Abstract+of+Delhi+2014
http://slidepdf.com/reader/full/statisticalabstractofdelhi2014 16/190
Minimum wage rates in scheduled employment w.e.f. Oct, 2013 are as
follows: Rs. 311 for unskilled, Rs.344 for semi skilled, Rs.377 for skilled,
Rs. 343 Non-matric and clerical and non technical staff, Rs. 377 for Matric
Clerical and Non-Technical Staff and Rs. 411 for Graduate and above
clerical and non-technical staff.
Total no. of Trade Unions in Delhi during 2013 is 1238.
Health
Total no. of Health Institutes in Delhi during 2013 is 3797 in MCD, 10 in
NDMC, 3 in DCB and 15 Govt. of India Institutions. There are 930 Private
Regd. Nursing Homes during the year 2013.
Total no. of dispensaries in Delhi Govt. during 2013 is 604 which include
454 dispensaries of DHS.
According to CRS, birth rate, death rate and infant mortality rate in Delhi
during 2013 is 21.07, 5.52 and 22 respectively.
Average no. of births per day in Delhi during 2013 is 1014 and average no.
of death per day in Delhi during 2013 is 266.
Maximum no. of death in Delhi cause by Heart Attack i.e. 14.12% during
2013 and 6.03% deaths are due to Cancer.
Welfare Statistics
Total no. of residential Institutes for the women in Delhi during
2013-14 is 03. Average no. of women beneficiaries from these institutes
are 146.
Total no. of work centres for women in Delhi during 2013-14 are 18.
Average no. of women beneficiaries from these centres are 40.
No. of observation homes in Delhi is 07, Average no. of beneficiaries from
these homes is 188 during the year 2013-14.
No. of institutes for mentally retarded children in Delhi is 6, Average no of
beneficiaries from these institutes is 1055.
Vi

8/20/2019 Statistical+Abstract+of+Delhi+2014
http://slidepdf.com/reader/full/statisticalabstractofdelhi2014 17/190
Total no. of homes for aged & infirm persons in Delhi during 2013-14 is 54.
Average no. of beneficiaries from girl child protection scheme in Delhi is
186866 during 2013-14.
Average no. of beneficiaries from unemployment allowance to disabledpersons in Delhi during 2013-14 is 45471.
No. of fair price shops in Delhi during 2013-14 is 2396 and No. of food card
holders in Delhi are 17.79 lakhs during 2013-14.
Police, Crime & Accidents
Total no. of police stations in Delhi during 2013 is 181. Total police
strength in Delhi during 2013 is 84536 which include 50 commissioners &Addl. Commissioner of police joint commissioner, 455 Deputy/ Asstt.
Commissioner of police, 7461 inspector & sub-inspectors, 27569 Asstt.
Sub- Inspectors & Head Constable and 49001 constable & mounted
constables & other.
Crimes in Delhi during 2013 is as follows:- 517 Murders, 33 Dacoity ,1245
Robbery, 2835 Burglary,30124 Theft, 585 Attempt to Murder, 97 Arson,
1636 Rape, 144 Dowry Death, 916 Eve teasing and 3515 Molestation of
Women.
Total no. of missing persons in Delhi during 2013 are 20800 which
comprising 10198 Males & 10602 Females. Total no. of missing persons
traced by police during 2013 are 14977 which comprising 7554 Males &
7423 Females.
Total no. of fire & Road Accidents in Delhi during 2013 is 22750 and 7566
respectively.
⊗⊗⊗⊗⊗⊗⊗⊗
Vii

8/20/2019 Statistical+Abstract+of+Delhi+2014
http://slidepdf.com/reader/full/statisticalabstractofdelhi2014 18/190
DELHI AT A GLANCE
(POPULATION CENSUS 2011 )
*Presently 11 revenue District and 33 sub district
Number of Administrative Units
Number of
districtsNumber of Sub-District (Tehsil)
Number of Villages
Inhabited Un-inhabitedNumber of
Towns
9* 27* 112 105 7
113(110 censustowns and 3statutory town )
S.NO. DESCRIPTION TOTAL URBAN RURAL
1.
Area
(in sq. km.)
1483.00 1113.65(P) 369.35(P)
2. Population
Persons 16787941 16368899 419042
Males 8987326 8761005 226321
Females 7800615 7607894 192721
3. Population (0-6 age group)
Persons 2012454 1955738 56716
Males 1075440 1044181 31259
Females 937014 911557 25457
4.Decennial Population (%)(1991-2001)
20.96 26.56 -55.61
5. Literacy Rate (%) 86.2 90.9 80.8
7. Density of Population(Sq. km) 11320 14694 1136
8.Sex Ratio(female per 1000 males)
868 868 852
9. Working Population
9.1 Main Workers
Total 5307329 5188819 118510
Males 4562710 4459142 103568
Females 744619 729677 14942
9.2 Marginal Workers
Total 279720 268003 11717
Males 199316 191384 7932
Females 80404 76619 3785
9.3 Non Worker
Total 11200892 10912077 288815
Males 4225300 4110479 114821
Females 6975592 6801589 173994
S.NO State Economy 2011-12(2nd
RE) 2012-13(1st
RE) 2013-14(AE)
1 GSDP at Current price (Rs. lakh) 29695688 34822116 40457565
2 GSDP at 2004-05 price (Rs. lakh) 19754364 21597106 23615645
3 NSDP at Current Price (Rs. lakh) 28271666 33252052 38709664
4 NSDP at 2004-05 Price (Rs. lakh) 18767200 20539577 224655275 Per Capita Income at Current Price
(Rs. lakh)166883 192587 219979
8/20/2019 Statistical+Abstract+of+Delhi+2014
http://slidepdf.com/reader/full/statisticalabstractofdelhi2014 19/190
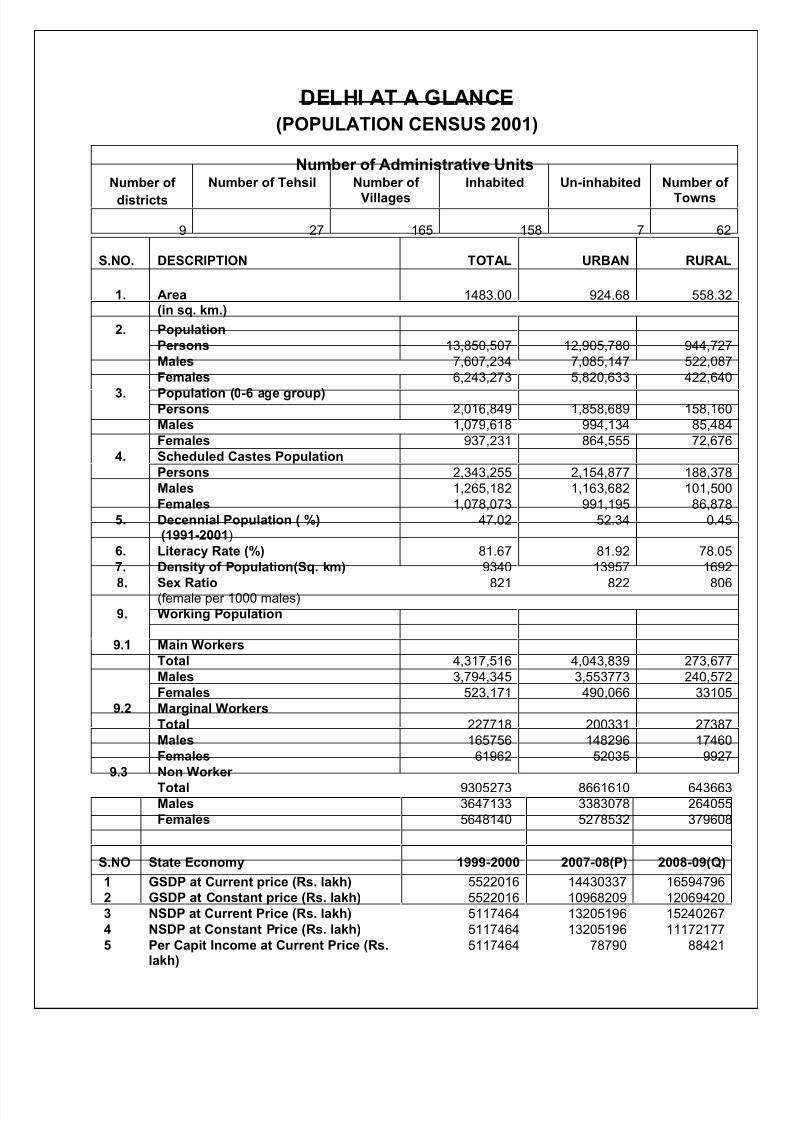
DELHI AT A GLANCE
(POPULATION CENSUS 2001)
Number of Administrative UnitsNumber of
districts
Number of Tehsil Number of
Villages
Inhabited Un-inhabited Number of
Towns
9 27 165 158 7 62
S.NO. DESCRIPTION TOTAL URBAN RURAL
1. Area(in sq. km.)
1483.00 924.68 558.32
2. Population
Persons 13,850,507 12,905,780 944,727
Males 7,607,234 7,085,147 522,087
Females 6,243,273 5,820,633 422,640
3. Population (0-6 age group)Persons 2,016,849 1,858,689 158,160
Males 1,079,618 994,134 85,484
Females 937,231 864,555 72,676
4. Scheduled Castes Population
Persons 2,343,255 2,154,877 188,378
Males 1,265,182 1,163,682 101,500
Females 1,078,073 991,195 86,878
5. Decennial Population ( %)(1991-2001)
47.02 52.34 0.45
6. Literacy Rate (%) 81.67 81.92 78.05
7. Density of Population(Sq. km) 9340 13957 1692
8. Sex Ratio(female per 1000 males) 821 822 806
9. Working Population
9.1 Main Workers
Total 4,317,516 4,043,839 273,677
Males 3,794,345 3,553773 240,572
Females 523,171 490,066 33105
9.2 Marginal Workers
Total 227718 200331 27387
Males 165756 148296 17460
Females 61962 52035 9927
9.3 Non Worker
Total 9305273 8661610 643663Males 3647133 3383078 264055
Females 5648140 5278532 379608
S.NO State Economy 1999-2000 2007-08(P) 2008-09(Q)
1 GSDP at Current price (Rs. lakh) 5522016 14430337 16594796
2 GSDP at Constant price (Rs. lakh) 5522016 10968209 12069420
3 NSDP at Current Price (Rs. lakh) 5117464 13205196 15240267
4 NSDP at Constant Price (Rs. lakh) 5117464 13205196 11172177
5 Per Capit Income at Current Price (Rs.lakh)
5117464 78790 88421

8/20/2019 Statistical+Abstract+of+Delhi+2014
http://slidepdf.com/reader/full/statisticalabstractofdelhi2014 20/190
1
CHAPTER ONE
AREA AND POPULATION
• Area & Population of Delhi 1991 to 2011
• Population Characteristics-Delhi 1981-2011
• Population and Decennial Growth of Delhi 1901 to 2011
• Area under local bodies wise 1961 to 2011
• Population under local bodies 1961 to 2011
• Sex Ratio under Local Bodies & Urban/Rural 1961-2011• Scheduled Caste Population under Local Bodies 1961 to 2001
• Density of Population in Local bodies & Urban/ Rural according to 1961 to 2011
• District wise Population, Density & Sex Ratio &Literacy Data Of Delhi 2001 & 2011
• District wise Sex Ratio &Literacy Data Of Delhi 2001 & 2011
• Percentage of Total Main, Marginal and Non-workers 1991 & 2011
• Distribution of Population by Scheduled Languages in Delhi 1991 & 2001
• Population by Religion 1961 to 2001
• Population by Age Groups 1971 to 2011
• Literacy Rate by Sex 1931 to 2011
• Slum population of Delhi 2011
• Houseless & Households Population 2011
•
No. of Houses & Households and their Amenities 1991 & 2011• No. of Villages in Delhi according to 1921 to 2011
• Population Projections of Delhi 2002 & 2026
• Migrant Population in Delhi
• Population in selected cities of India 1981 to 2011
• Key indicators of Population -India and States 2001& 2011

8/20/2019 Statistical+Abstract+of+Delhi+2014
http://slidepdf.com/reader/full/statisticalabstractofdelhi2014 21/190
2
In context of Delhi, the literal meaning of population is “the whole number of people or
inhabitants in the state”. Populations are affected by many factors, the main natural ones
being birth rates and death rates which affect the level of natural change (increase or
decrease) within the population. Other factors that affect the change in a population’s growth
include the impact of urbanisation, emancipation of women, agricultural changes and
education.
This Chapter presents an analytical view with respect to the population of Delhi
with the help of statistical as well as pictorial depictions of the related aspects and
outcomes.
POPULATION OF DELHI
After independence Seventh Population Census was undertaken in the entire area of
NCT of Delhi between 9th February to 28th February 2011 with a provisional round from 1st to
5th March, 2011. As such, the population of Delhi, as on 1st March, 2011, has been worked
out at 16.79 millions as against 13.85 millions as on 1st March, 2001. This reflects decennial
growth of 21.2% of population after 2001 census. The corresponding percentage at All-India
level has been worked out at 17.7%. The total population of Delhi is 1.39% of the All-India
Population. Figures at a glance – Population characteristics 2011 are given in Table 1.1.
Decennial Population Growth Rate in Delhi is given in Table 1.2.
AREA OF NCT OF DELHI
The total area of NCT of Delhi is 1483 Sq. Kms. As per Population Census 1991, its
rural and urban composition is given below:
Rural Area : 797.66 Sq. Kms.
Urban Area : 685.34 Sq. Kms.
------------------------
1483.00 Sq. Kms.
------------------------
During Population Census 2001, the area of NCT of Delhi has remained the same at
1483 Sq. Kms. However, its rural-urban composition has undergone change due to
CHAPTER 1:AREA & POPULATION

8/20/2019 Statistical+Abstract+of+Delhi+2014
http://slidepdf.com/reader/full/statisticalabstractofdelhi2014 22/190
3
urbanisation of villages. According to the estimates of Directorate of Census Operations,
Delhi, its rural-urban break-up of NCT of Delhi is given below:
Rural Area : 558.32 Sq. Kms.
Urban Area : 924.68 Sq. Kms.
-----------------------
1483.00Sq. Kms.
------------------------
According to Population Census 2011, the area of NCT of Delhi has remained the
same at 1483 Sq. Kms. However, its rural-urban composition has undergone change due to
urbanization of villages. According to the provisional estimates of Directorate of Census
Operations, Delhi, its rural-urban break-up of NCT of Delhi is given below:
Rural Area : 369.35 Sq. Kms.
Urban Area : 1113.65 Sq. Kms.
-----------------------
1483.00Sq. Kms.
-----------------------
AVERAGE ANNUAL EXPONENTIAL GROWTH RATE OF POPULATION IN DELHI
The annual average exponential growth rate of population of Delhi was the highest
(6.42%) during 1941-1951 due to large scale migration from Pakistan to India after partition in
1947. Since then the annual growth has been recorded 4.22 % during 1951-1961, 4.25%
during 1961-1971, 4.25% during 1971-1981, 4.15% during 1981-1991 and 3.85% during
1991-2001. The annual growth rate of population of Delhi during 2001-2011 has been
recorded as 1.92%

8/20/2019 Statistical+Abstract+of+Delhi+2014
http://slidepdf.com/reader/full/statisticalabstractofdelhi2014 23/190
4
TABLE 1.1 POPULATION CHARACTERISTICS – DELHI
SL. NO. ITEM 1981 1991 2001 2011
1. Total Population 6220406 9420644 13850507 16787941
2. Average Annual
Exponential Growth Rate
4.25 4.15 3.85 1.92
3. Density of Population 4194 6352 9340 11320
4. No. of Household (Total) 1211784 1860748 2554149 3435999
(a) No. of Household Rural 71922 163920 169528 79574
(b) No. of Household Urban 1139862 1696828 2384621 3356425
5. Male Population 3440081 5155512 7607234 8987326
6. Female Population 2780325 4265132 6243273 7800615
7. Sex Ratio 808 827 821 868
8.(a) Rural Population 452206 949019 944727 419042
(b) Urban Population 5768200 8471625 12905780 16368899
9. SC Population 1121643 1794836 2343255 2812309
10.(a) Literacy 61.54 75.29 81.67 86.2
(b) Literacy Rate Male 68.40% 82.01% 87.33% 90.9
( c ) Literacy Rate Female 53.07% 66.99% 74.71% 80.8
11.(a) Main Workers 31.94 31.51 31.17 31.6
(b) Marginal Workers 0.25 0.13 1.64 1.7
(c) Non-Workers 67.81 68.36 67.18 66.7
Source: Population Census 1981 to 2011, Dte. Of Census Operations, Delhi.

8/20/2019 Statistical+Abstract+of+Delhi+2014
http://slidepdf.com/reader/full/statisticalabstractofdelhi2014 24/190
5
TABLE 1.2 POPULATIONS AND DECENNIAL GROWTH
Year Delhi Population Percentage variation since previous
census
Urban Rural Total Urban Rural Total
1. 2. 3. 4. 5. 6. 7.
1901 214115 191704 405819 - - -
1911 237944 175907 413851 11.13 -8.24 1.98
1921 304220 184032 488252 27.85 4.62 17.98
1931 447442 188804 636246 47.08 2.59 30.31
1941 695686 222253 917939 55.48 17.72 44.27
1951 1437134 306938 1744072 106.58 38.10 90.00
1961 2359408 299204 2658612 64.17 -2.52 52.44
1971 3647023 418675 4065698 54.57 39.93 52.93
1981 5768200 452206 6220406 58.16 8.01 53.00
1991 8471625 949019 9420644 46.87 109.86 51.45
2001 12905780 944727 13850507 52.34 -0.45 47.02
2011 16368899 419042 16787941 26.8 -55.6 21.2
Source: Population Census 1901 to 2011, Dte. Of Census Operations, Delhi.

8/20/2019 Statistical+Abstract+of+Delhi+2014
http://slidepdf.com/reader/full/statisticalabstractofdelhi2014 25/190
6
TABLE 1.3 AREA UNDER LOCAL BODIES WISE & SECTOR WISE(in Sq. Km.)
Census Year MCD NDMC Cantonment Total
AreaUrban Rural
TotalArea
1961 1398 43 43 1484 327 1158 1484
Percentage 94 3 3 100 22 78 100
1971 1399 43 43 1485 446 1039 1485
Percentage 94 3 3 100 30 70 100
1981 1397 43 43 1483 592 891 1483
Percentage 94 3 3 100 40 60 100
1991 1397 43 43 1483 685 798 1483
Percentage 94 3 3 100 46 54 100
2001 1397 43 43 1483 925 558 1483
Percentage 94 3 3 100 62 38 100
2011* -- -- -- 1483 1114 369 1483
Percentage -- -- -- 100 75 25 100
*Provisional Census Population 2011Source: Population Census 1961 to 2001, Dte. Of Census Operations, Delhi.

8/20/2019 Statistical+Abstract+of+Delhi+2014
http://slidepdf.com/reader/full/statisticalabstractofdelhi2014 26/190
7
TABLE 1.4 POPULATION UNDER LOCAL BODIES
Year MCD NDMC Cantonment Total
M F Total M F Total M F Total M F Total
1961 1314965 1045997 2360962 151408 110137 261545 23005 13100 36105 1489378 1169234 2658612
% 56 44 89 58 42 10 64 36 1 56 44 100
1971 2049553 1657005 3706558 172400 129401 301801 35562 21777 57339 2257515 1808183 4065698
% 55 45 91 57 43 7 62 38 1 56 44 100
1981 3233032 2629172 5862204 155609 117427 273036 51440 33726 85166 3440081 2780325 6220406
% 55 45 94 57 43 4 60 40 1 55 45 100
1991 4931494 4093460 9024954 166374 134923 301297 57644 36749 94393 5155512 4265132 9420644
% 55 45 96 55 45 3 61 39 1 55 45 100
2001 7365684 6057543 13423227 165723 136640 302363 75827 49090 124917 7607234 6243273 13850507
% 55 45 97 55 45 2 61 39 1 55 45 100
2011 NA NA 16419787 NA NA 257803 NA NA 110351 8987326 7800615 16787941
% - - 97 - - 2 - - 1 54 46 100
Source: Population Census 1961 to 2001, Dte. Of Census Operations, Delhi.

8/20/2019 Statistical+Abstract+of+Delhi+2014
http://slidepdf.com/reader/full/statisticalabstractofdelhi2014 27/190
8
TABLE 1.5 SEX RATIO UNDER LOCAL BODIES & URBAN/RURAL(Female per 1000 male)
Year MCD NDMC Cantonment Urban Rural Delhi
1 2 3 4 5 6 7
1961 788 727 569 777 847 785
1971 808 751 612 798 825 801
1981 813 755 656 808 810 808
1991 830 811 638 830 807 8272001 822 825 647 822 806 821
2011 869 838 731 868 852 868
Source: Population Census 1961 to 2011, Dte. Of Census Operations, Delhi,

8/20/2019 Statistical+Abstract+of+Delhi+2014
http://slidepdf.com/reader/full/statisticalabstractofdelhi2014 28/190
9
TABLE 1.6 SCHEDULED CASTE POPULATION UNDER LOCAL BODIES
Year Scheduled Caste Population
MCD NDMC Cantonment Total
Male Female Total Male Female Total Male Female Total Male Female Total
1 2 3 4 5 6 7 8 9 10 11 12 13
1961 167519 137379 304898 18279 11855 30134 3672 2851 6523 189470 189470 378940
54.9 45.1 100.0 60.7 39.3 100.0 56.3 43.7 100.0 50.0 50.0 100.0
1971 320993 259280 580273 27082 19412 46494 4945 3986 8931 353020 282678 635698
55.3 44.7 100.0 58.2 41.8 100.0 55.4 44.6 100.0 55.5 44.5 100.0
1981 589317 481000 1070317 20967 15512 36479 8266 6581 14847 618550 503093 1121643
55.1 44.9 100.0 57.5 42.5 100.0 55.7 44.3 100.0 55.1 44.9 100.0
1991 940191 785560 1725751 30043 23887 53930 8456 6699 15155 978690 816146 1794836
54.5 45.5 100.0 55.7 44.3 100.0 55.8 44.2 100.0 54.5 45.5 100.0
2001 1224992 1044156 2269148 29919 25294 55213 10271 8623 18894 1265182 1078073 2343255
54.0 46.0 100.0 54.2 45.8 100.0 54.4 45.6 100.0 54.0 46.0 100.0
2011 NA NA NA NA NA NA NA NA NA 1488800 1323509 2812309
NA NA NA NA NA NA NA NA NA 53.0 47.0 100.0
Source: Population Census 1961 to 2011, Dte. Of Census Operations, Delhi.

8/20/2019 Statistical+Abstract+of+Delhi+2014
http://slidepdf.com/reader/full/statisticalabstractofdelhi2014 29/190
10
TABLE 1.7 DENSITY OF POPULATION IN LOCAL BODIES & URBAN/RURAL
(Persons per Sq. Km.)
Year MCD NDMC Cantonment Delhi Urban Rural Delhi
1961 1791 6119 840 1792 7225 258 1792
1971 2649 7061 1334 2738 8172 403 2738
1981 4195 6388 1982 4194 9745 507 4194
1991 6459 7050 2197 6352 12361 1190 6352
2001 9607 7074 2907 9340 13957 1692 9340
2011* -- -- -- -- 14694 1136 11320
*Provisional Census Population 2011
Source: Population Census 1961 to 2011Dte. Of Census Operations, Delhi.

8/20/2019 Statistical+Abstract+of+Delhi+2014
http://slidepdf.com/reader/full/statisticalabstractofdelhi2014 30/190
11
TABLE 1.8 DISTRICT WISE POPULATION, DENSITY DATA OF DELHI, 2011 & 2001
Source: Population Census 2011,Dte. Of Census Operations, Delhi.
SL.
NO.
District / State Total Population Population in % Density
(Per sq. km)
2011 2001 2011 2001 2011 2001
1 NCT of Delhi 16787941 13850507 100 100 11320 9340
2 North-West 3656539 2860869 21.8 20.7 8254 6502
3 North 887978 781525 5.3 5.6 14557 13246
4 North-East 2241624 1768061 13.3 12.8 36155 29468
5 East 1709346 1463583 10.2 10.6 27132 22868
6 New Delhi 142004 179112 0.85 1.3 4057 5117
7 Central 582320 646385 3.5 4.7 27730 25855
8 West 2543243 2128908 15.1 15.4 19563 16503
9 South-West 2292958 1755041 13.6 12.7 5446 4169
10 South 2731929 2267023 16.3 16.4 11060 9068

8/20/2019 Statistical+Abstract+of+Delhi+2014
http://slidepdf.com/reader/full/statisticalabstractofdelhi2014 31/190
12
TABLE 1.9 DISTRICT WISE, SEX RATIO & LITERACY RATE DATA OF 2011 & 2001
Source: Population Census 2011,Dte. Of Census Operations, Delhi.
SL.
NO.
District / State Sex Ratio
(female per ‘000 males)
Literacy Rate
2011 2001 2011 2001
1 NCT of Delhi 868 821 86.2 81.67
2 North-West 865 820 84.4 80.57
3 North 869 826 86.9 80.1
4 North-East 886 849 83.1 77.53
5 East 884 843 89.3 84.91
6 New Delhi 822 792 88.3 83.24
7 Central 892 842 85.1 79.69
8 West 875 830 87.0 83.39
9 South-West 840 784 88.3 83.61
10 South 862 799 86.6 81.96

8/20/2019 Statistical+Abstract+of+Delhi+2014
http://slidepdf.com/reader/full/statisticalabstractofdelhi2014 32/190
13
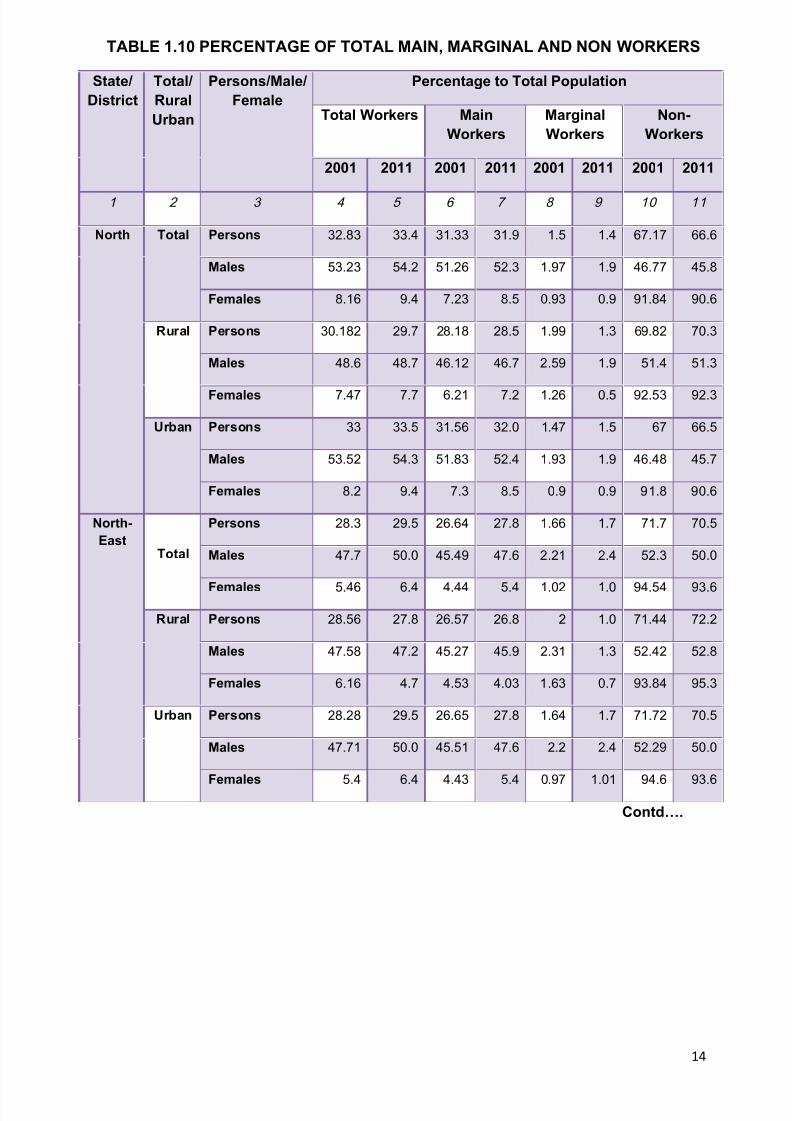
TABLE 1.10 PERCENTAGES OF TOTAL MAIN, MARGINAL AND NON WORKERS
State/
District
Total/
Rural
Urban
Persons/Male/
Female
Percentage to Total Population
Total Workers Main Workers Marginal
Workers
Non-Workers
2001 2011 2001 2011 2001 2011 2001 2011
1 2 3 4 5 6 7 8 9 10 11
Delhi Total Persons 32.82 33.3 31.17 31.6 1.64 1.7 67.18 66.7
Males 52.06 53.0 49.88 50.8 2.18 2.2 47.94 47.0
Females 9.37 10.6 8.38 9.5 0.99 1.0 90.63 89.4
Rural Persons 31.87 31.1 28.97 28.3 2.9 2.8 68.13 68.9
Males 49.42 49.3 46.08 45.8 3.34 3.5 50.58 50.7
Females 10.18 9.7 7.83 7.8 2.35 2.0 89.82 90.2
Urban Persons 32.89 33.3 31.33 31.7 1.55 1.6 67.11 66.7
Males 52.25 53.1 50.16 50.9 2.09 2.2 47.75 46.9
Females 9.31 10.6 8.42 9.6 0.89 1.0 90.69 89.4
North
West
Total Persons 32.14 32.5 30.49 31.0 1.65 1.5 67.86 67.5
Males 51.21 52.1 49.08 50.1 2.12 2.0 48.79 47.9
Females 8.89 9.8 7.81 8.9 1.08 0.8 91.11 90.2
Rural Persons 31.27 31.5 28.01 28.8 3.26 2.72.7 68.73 68.5
Males 48.11 49.5 44.48 45.9 3.74 3.6 51.89 50.5
Females 10.42 10.5 7.65 8.7 2.671 1.7 89.58 89.5
Urban Persons 32.23 32.6 30.72 31.2 1.49 1.4 67.77 67.4
Males 51.52 52.3 49.69 50.4 1.96 1.9 48.48 47.7
Females 8.74 9.8 7.64 9.0 0.92 0.8 91.26 90.2
Contd….
8/20/2019 Statistical+Abstract+of+Delhi+2014
http://slidepdf.com/reader/full/statisticalabstractofdelhi2014 33/190
14
TABLE 1.10 PERCENTAGE OF TOTAL MAIN, MARGINAL AND NON WORKERS
State/
District
Total/
Rural
Urban
Persons/Male/
Female
Percentage to Total Population
Total Workers Main
Workers
Marginal
Workers
Non-
Workers
2001 2011 2001 2011 2001 2011 2001 2011
1 2 3 4 5 6 7 8 9 10 11
North Total Persons 32.83 33.4 31.33 31.9 1.5 1.4 67.17 66.6
Males 53.23 54.2 51.26 52.3 1.97 1.9 46.77 45.8
Females 8.16 9.4 7.23 8.5 0.93 0.9 91.84 90.6
Rural Persons 30.182 29.7 28.18 28.5 1.99 1.3 69.82 70.3
Males 48.6 48.7 46.12 46.7 2.59 1.9 51.4 51.3
Females 7.47 7.7 6.21 7.2 1.26 0.5 92.53 92.3
Urban Persons 33 33.5 31.56 32.0 1.47 1.5 67 66.5
Males 53.52 54.3 51.83 52.4 1.93 1.9 46.48 45.7
Females 8.2 9.4 7.3 8.5 0.9 0.9 91.8 90.6
North-
EastTotal
Persons 28.3 29.5 26.64 27.8 1.66 1.7 71.7 70.5
Males 47.7 50.0 45.49 47.6 2.21 2.4 52.3 50.0
Females 5.46 6.4 4.44 5.4 1.02 1.0 94.54 93.6
Rural Persons 28.56 27.8 26.57 26.8 2 1.0 71.44 72.2
Males 47.58 47.2 45.27 45.9 2.31 1.3 52.42 52.8
Females 6.16 4.7 4.53 4.03 1.63 0.7 93.84 95.3
Urban Persons 28.28 29.5 26.65 27.8 1.64 1.7 71.72 70.5
Males 47.71 50.0 45.51 47.6 2.2 2.4 52.29 50.0
Females 5.4 6.4 4.43 5.4 0.97 1.01 94.6 93.6
Contd….

8/20/2019 Statistical+Abstract+of+Delhi+2014
http://slidepdf.com/reader/full/statisticalabstractofdelhi2014 34/190
15
TABLE 1.10 PERCENTAGE OF TOTAL MAIN, MARGINAL AND NON WORKERS
State/
District
Total/
Rural
Urban
Persons/Male/
Female
Percentage to Total Population
Total
Workers
Main
Workers
Marginal
Workers
Non-
Workers
2001 2011 2001 2011 2001 2011 2001 2011
1 2 3 4 5 6 7 8 9 10 11
East Total Persons 32.48 33.9 31.17 32.5 1.3 1.4 67.52 66.1
Males 52.08 53.7 50.29 51.7 1.79 1.9 47.92 46.3
Females 9.22 11.6 8.49 10.7 0.73 0.9 90.78 88.4
Rural Persons 40.39 38.2 39.31 37.3 1.05 0.9 59.63 61.8
Males 57.83 57.1 56.6 56.0 1.24 1.0 42.17 43.0
Females 18.56 17.1 17.73 16.4 0.83 0.8 81.44 82.9
Urban Persons 32.38 33.9 31.07 32.5 1.31 1.4 67.62 66.1
Males 52.01 53.7 50.21 51.7 1.79 1.9 47.99 46.3
Females 9.11 11.6 8.38 10.6 0.73 0.9 90.89 88.4
New
Delhi
Total Persons 37.74 41.9 35.97 39.8 1.77 2.2 62.26 58.1
Males 55.25 60.2 52.81 57.6 2.44 2.6 44.75 39.8
Females 15.62 19.7 14.71 18.0 0.92 1.6 84.38 80.3
Rural Persons - - - - - - - -
Males - - - - - - -
Females - - - - - - -
Urban Persons 37.74 41.9 35.97 39.8 1.77 2.2 62.26 58.1
Males 55.25 60.2 52.81 57.6 2.44 2.6 44.75 39.8
Females 15.62 19.7 14.71 18.0 0.92 1.6 84.38 80.3
Contd….

8/20/2019 Statistical+Abstract+of+Delhi+2014
http://slidepdf.com/reader/full/statisticalabstractofdelhi2014 35/190
16
TABLE 1.10 PERCENTAGE OF TOTAL MAIN, MARGINAL AND NON WORKERS
State/
District
Total/
Rural
Urban
Persons/Male/
Female
Percentage to Total Population
Total
Workers
Main Workers Marginal
Workers
Non-
Workers
2001 2011 2001 2011 2001 2011 2001 2011
1 2 3 4 5 6 7 8 9 10 11
Central Total Persons 34.63 35.6 33 33.7 1.63 2.0 65.37 64.4
Males 55.89 57.7 53.7 55.2 2.19 2.5 44.11 42.3
Females 9.4 10.8 8.43 9.5 0.97 1.4 90.6 89.2
Rural Persons - - - - - - - -
Males - - - - - - - -
Females - - - - - - - -
Urban Persons 34.63 35.6 33004 33.7 1.63 2.0 65.37 64.4
Males 55.89 57.7 53.7 55.2 2.19 2.5 44.11 42.3
Females 9.4 10.8 8.43 9.5 0.97 1.4 90.6 89.2
West Total Persons 33.86 34.4 32.25 33.0 1.62 1.4 66.14 65.6
Males 53.05 54.0 50.87 52.2 2.18 1.8 46.95 46.0
Females 10.76 11.9 9.83 11.1 0.93 0.9 89.24 80.1
Rural Persons 33.97 28.8 31.52 26.2 2.46 2.6 66.03 71.2
Males 53.18 48.3 50.12 44.8 3.05 3.5 46.82 51.7
Females 8.64 7.4 6.98 5.8 1.66 1.6 91.36 92.6
Urban Persons 33.86 34.4 32.28 33.0 1.58 1.4 66.14 65.6
Males 53.04 54.0 50.9 52.2 2.14 1.8 46.96 46.0
Females 10.84 12.0 9.94 11.8 0.9 0.9 89.16 88.0
Contd….

8/20/2019 Statistical+Abstract+of+Delhi+2014
http://slidepdf.com/reader/full/statisticalabstractofdelhi2014 36/190
17
TABLE 1.10 PERCENTAGE OF TOTAL MAIN, MARGINAL AND NON WORKERS
State/
District
Total/
Rural
Urban
Persons/Male/
Female
Percentage to Total Population
Total
Workers
Main Workers Marginal
Workers
Non-
Workers
2001 2011 2001 2011 2001 2011 2001 2011
1 2 3 4 5 6 7 8 9 10 11
South-
West
Total Persons 34.33 34.7 32.47 32.7 1.86 2.0 65.67 65.3
Males 52.97 53.6 50.64 51.1 2.32 2.5 47.03 46.4
Females 10.57 12.2 9.29 10.8 1.28 1.3 89.43 87.8
Rural Persons 32.99 30.7 28.44 27.2 4.55 3.4 67.01 69.3
Males 48.62 48.9 43.77 44.9 4.84 4.0 51.38 51.0
Females 14.13 9.4 9.94 6.6 4.19 2.8 85.87 90.6
Urban Persons 34.53 35.0 33.06 33.1 1.47 1.9 65.47 65.0
Males 53.59 53.9 51.63 51.5 1.96 2.4 46.41 46.1
Females 10.03 12.4 9.19 11.1 0.83 1.2 89.97 87.6
South Total Persons 34.34 33.8 32.61 31.8 1.74 2.0 65.66 66.2
Males 53.07 52.9 50.66 50.1 2.41 2.7 46.93 47.1
Females 10.91 11.8 10.01 10.6 0.9 1.2 89.09 88.2
Rural Persons 32.59 34.7 31.093 32.0 1.5 2.6 67.41 65.3
Males 51.46 52.5 49.32 49.1 2.14 3.4 48.54 47.5
Females 8.41 12.0 7.74 10.3 0.67 1.6 91.59 88.0
Urban Persons 34.48 33.8 32.72 31.83 1.76 2.0 65.52 66.2
Males 53.19 52.9 50.77 50.1 2.43 2.7 46.81 47.1
Females 11.1 11.8 10.18 10.6 0.92 1.2 88.9 88.2
Source: Population Census 2001 & 2011, Dte. Of Census Operations, Delhi,
8/20/2019 Statistical+Abstract+of+Delhi+2014
http://slidepdf.com/reader/full/statisticalabstractofdelhi2014 37/190
18
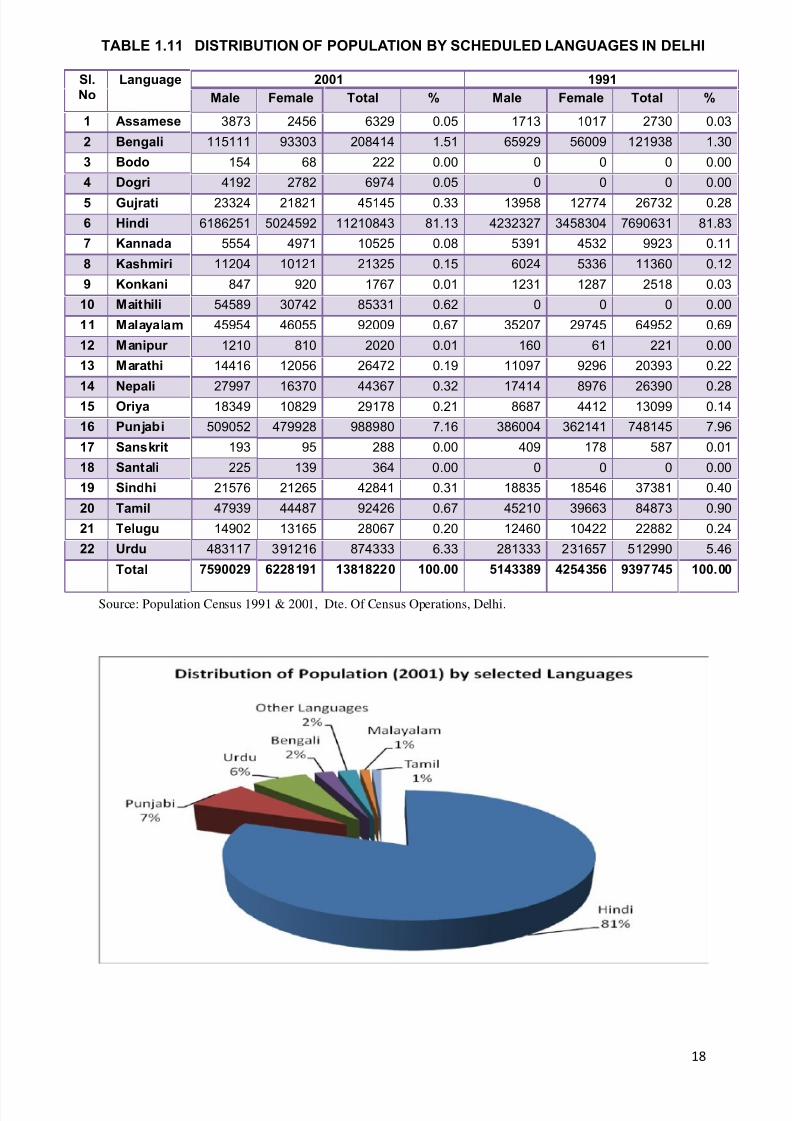
TABLE 1.11 DISTRIBUTION OF POPULATION BY SCHEDULED LANGUAGES IN DELHI
Sl.No
Language 2001 1991
Male Female Total % Male Female Total %
1 Assamese 3873 2456 6329 0.05 1713 1017 2730 0.03
2 Bengali 115111 93303 208414 1.51 65929 56009 121938 1.30
3 Bodo 154 68 222 0.00 0 0 0 0.00
4 Dogri 4192 2782 6974 0.05 0 0 0 0.00
5 Gujrati 23324 21821 45145 0.33 13958 12774 26732 0.28
6 Hindi 6186251 5024592 11210843 81.13 4232327 3458304 7690631 81.83
7 Kannada 5554 4971 10525 0.08 5391 4532 9923 0.11
8 Kashmiri 11204 10121 21325 0.15 6024 5336 11360 0.12
9 Konkani 847 920 1767 0.01 1231 1287 2518 0.03
10 Maithili 54589 30742 85331 0.62 0 0 0 0.00
11 Malayalam 45954 46055 92009 0.67 35207 29745 64952 0.69
12 Manipur 1210 810 2020 0.01 160 61 221 0.00
13 Marathi 14416 12056 26472 0.19 11097 9296 20393 0.22
14 Nepali 27997 16370 44367 0.32 17414 8976 26390 0.2815 Oriya 18349 10829 29178 0.21 8687 4412 13099 0.14
16 Punjabi 509052 479928 988980 7.16 386004 362141 748145 7.96
17 Sanskrit 193 95 288 0.00 409 178 587 0.01
18 Santali 225 139 364 0.00 0 0 0 0.00
19 Sindhi 21576 21265 42841 0.31 18835 18546 37381 0.40
20 Tamil 47939 44487 92426 0.67 45210 39663 84873 0.90
21 Telugu 14902 13165 28067 0.20 12460 10422 22882 0.24
22 Urdu 483117 391216 874333 6.33 281333 231657 512990 5.46
Total 7590029 6228191 13818220 100.00 5143389 4254356 9397745 100.00
Source: Population Census 1991 & 2001, Dte. Of Census Operations, Delhi.

8/20/2019 Statistical+Abstract+of+Delhi+2014
http://slidepdf.com/reader/full/statisticalabstractofdelhi2014 38/190
19
TABLE 1.12 POPULATION BY RELIGION
Year HINDU SIKHS MUSLIMS JAINS CHRISTIAN BUDDHISM OTHER TOTAL
1961
%
2234597 203916 155453 29595 29269 5466 316 2658612
84.05 7.67 5.85 1.11 1.10 0.21 0.01 100.00
1971
%
3407835 291123 263019 50513 43720 8720 768 4065698
83.82 7.16 6.47 1.24 1.08 0.21 0.02 100.00
1981
%
5200432 393921 481802 73917 61609 7117 1608 6220406
83.60 6.33 7.75 1.19 0.99 0.11 0.03 100.00
1991
%
7882164 455657 889641 94672 83152 13906 1452 9420644
83.67 4.84 9.44 1.00 0.88 0.15 0.02 100.00
2001
%
11358049 555602 1623520 155122 130319 23705 4190 13850507
82.00 4.01 11.72 1.12 0.94 0.17 0.03 100.00
Source: Population Census 1961 & 2001, Dte. of Census Operations, Delhi.

8/20/2019 Statistical+Abstract+of+Delhi+2014
http://slidepdf.com/reader/full/statisticalabstractofdelhi2014 39/190
20
TABLE 1.13 POPULATION BY AGE GROUPS
Year 0-14 15-19 20-24
M F T M F T M F T
1 2 3 4 5 6 7 8 9 10 11
1971 Urban 728636 654248 1382884 211039 167091 378130 212633 165654 378287
Rural 101181 86815 187996 23269 18056 41325 18764 16472 35236
Total 829817 741063 1570880 234308 185147 419455 231397 182126 413523
1981 Urban 1066113 957082 2023195 343418 264204 607622 370844 296662 667506
Rural 100431 87533 187964 27975 20321 48296 25303 20249 45552
Total 1166544 1044615 2211159 371393 284525 655918 396147 316911 713058
1991 Urban 1522633 1370513 2893146 465845 359995 825840 486728 401021 887749
Rural 202704 177632 380336 52423 36608 89031 51463 43654 95117
Total 1725337 1548145 3273482 518268 396603 914871 538191 444675 982866
2001 Urban 2217345 1931892 4149237 760194 571683 1331877 760840 572167 1333007
Rural 185356 158346 343702 56303 39799 96102 53766 40087 93853
Total 2402701 2090238 4492939 816497 611482 1427979 814606 612254 1426860
2011 Urban 2388611 2049106 4437717 900202 722806 1623008 927606 792047 1719653
Rural 70658 56944 127602 24916 19451 44367 23805 20602 44407
Total 2459269 2106050 4565319 925118 742257 1667375 951411 812649 1764060
Year
25-29 30-39 40-49
M F T M F T M F T
12 13 14 15 16 17 18 19 20
1971 Urban 182055 139995 322050 288700 216457 505157 206170 134436 340606
Rural 16968 13997 30965 25805 21569 47374 18911 14875 33786
Total 199023 153992 353015 314505 238026 552531 225081 149311 374392
1981 Urban 321737 247823 569560 452171 335524 787695 309394 225040 534434
Rural 21547 15956 37503 28414 22754 51168 19841 15449 35290
Total 343284 263779 607063 480585 358278 838863 329235 240489 569724
1991 Urban 466694 395422 862116 730420 570149 1300569 458770 336438 795208
Rural 50486 44186 94672 79668 57798 137466 43460 29063 72523
Total 517180 439608 956788 810088 627947 1438035 502230 365501 867731
2001 Urban 695562 571621 1267183 1128092 934624 2062716 765520 582580 1348100
Rural 49156 42586 91742 82445 65845 148290 48706 35661 84367
Total 744718 614207 1358925 1210537 1000469 2211006 814226 618241 1432467
2011 Urban 857612 771464 1629076 1421741 1266721 2688462 1060924 901848 1962772
Rural 20584 18666 39250 34169 31312 65481 25161 20477 45638
Total 878196 790130 1668326 1455910 1298033 2753943 1086085 922325 2008410
Year 50-59 60+ Age no stated

8/20/2019 Statistical+Abstract+of+Delhi+2014
http://slidepdf.com/reader/full/statisticalabstractofdelhi2014 40/190
21
M F T M F T M F T
21 22 23 24 25 26 27 28 29
1971 Urban 113907 71411 185318 84520 69219 153739 431 421 852
Rural 12316 9012 21328 12196 8403 20599 14 52 66
Total 126223 80423 206646 96716 77622 174338 445 473 918
1981 Urban 185262 131308 316570 137988 117403 255391 3321 2906 6227
Rural 12731 10013 22744 13468 10004 23472 123 94 217
Total 197993 141321 339314 151456 127407 278863 3444 3000 6444
1991 Urban 261969 204331 466300 216171 185815 401986 21226 17485 38711
Rural 21564 16285 37849 20798 16736 37534 2490 2001 4491
Total 283533 220616 504149 236969 202551 439520 23716 19486 43202
2001 Urban 401232 315944 717176 344527 332335 676862 11835 7787 19622
Rural 23525 18804 42329 21939 20849 42788 891 663 1554
Total 424757 334748 759505 366466 353184 719650 12726 8450 21176
2011 Urban 632118 539597 1171715 563297 557014 1120311 8894 7291 16185
Rural 13289 11357 24646 13458 13676 27134 281 236 517
Total 645407 550954 1196361 576755 570690 1147445 9175 7527 16702
Source: Population Census 1971 & 2011Dte. Of Census Operations, Delhi

8/20/2019 Statistical+Abstract+of+Delhi+2014
http://slidepdf.com/reader/full/statisticalabstractofdelhi2014 41/190
22
TABLE 1.14 LITERACY RATES BY SEX 1931-2011
Source: Population Census 1931 & 2011Dte. Of Census Operations, Delhi.
Year Total
Population
Literate Persons
Male Female Total
No. % No. % No. %
1931 636246 73377 19.86% 16095 6.03% 89472 14.06%
1941 917939 171233 31.99% 58370 15.25% 229603 25.01%
1951 1744072 424118 42.99% 244955 32.34% 669073 38.36%
1961 2658612 904801 60.75% 497497 42.55% 1402298 52.75%
1971 4065698 1438268 63.71% 863337 47.55% 2301605 56.61%
1981 6220406 2352883 68.40% 1475443 53.07% 3828326 61.54%
1991 9420644 3539500 82.01% 2342797 66.99% 5882297 75.29%
2001 13850507 5700847 87.33% 3963917 74.71% 9664764 81.67%
2011 16787941 7194856 90.9% 5542911 80.8% 12737767 86.2%

8/20/2019 Statistical+Abstract+of+Delhi+2014
http://slidepdf.com/reader/full/statisticalabstractofdelhi2014 42/190
23
TABLE 1.15 SLUM POPULATION (As per Census 2011)
Item Total Male Female
No. of Households 367893 - -
Total slum population 1785390 974329 811061
Slum Population (0-6 age group) 229029 119508 109521
SC Slum Population 482870 260511 222359
Literates 1169712 688085 481627
Total Workers 631539 542437 89102
Main Workers 588543 511363 77180
i) Cultivators 995 791 204
ii) Agricultural labours 3683 2883 800
iii) Household Industry Workers 19655 16617 3038
iv) Other Workers 564210 491072 73138
Marginal Workers 42996 31074 11922
i) Cultivators 365 214 151
ii) Agricultural labours 651 469 182
iii) Household Industry Workers 1648 898 750
iv) Other Workers 40332 29493 10839
Non Workers 1153851 431892 721959
Source: Population Census 2011, Dte. Of Census Operations, Delhi.

8/20/2019 Statistical+Abstract+of+Delhi+2014
http://slidepdf.com/reader/full/statisticalabstractofdelhi2014 43/190
24
TABLE 1.16 HOUSELESS HOUSEHOLDS & POPULATION (As per Census 2011)
Item Total Male Female
No. of Houseless Households Total 23175 - -
Urban 23078 - -
Rural 97 - -
Total houseless population Total 47076 37836 9240
Urban 46724 37630 9094
Rural 352 206 146
Houseless Population (0-6 age group) Total 3594 1809 1785
Urban 3527 1774 1753
Rural 67 35 32
SC Houseless Population Total 6346 4644 1702
Urban 6278 4608 1670
Rural 68 36 32
Literates Total 20059 17666 2393
Urban 19931 17568 2363
Rural 128 98 30
Total Workers 34561 31807 2754
i) Cultivators Total 80 74 6
ii) Agricultural labourers Total 152 132 20
iii) Household Industry Workers Total 501 360 141
iv) Other Workers Total 29521 27405 2116
Main Workers Total 30254 27971 2283
Marginal Workers Total 4307 3836 471
Non Workers Total 12515 6029 6486
Source: Population Census 2011,Dte. Of Census Operations, Delhi.
8/20/2019 Statistical+Abstract+of+Delhi+2014
http://slidepdf.com/reader/full/statisticalabstractofdelhi2014 44/190
25
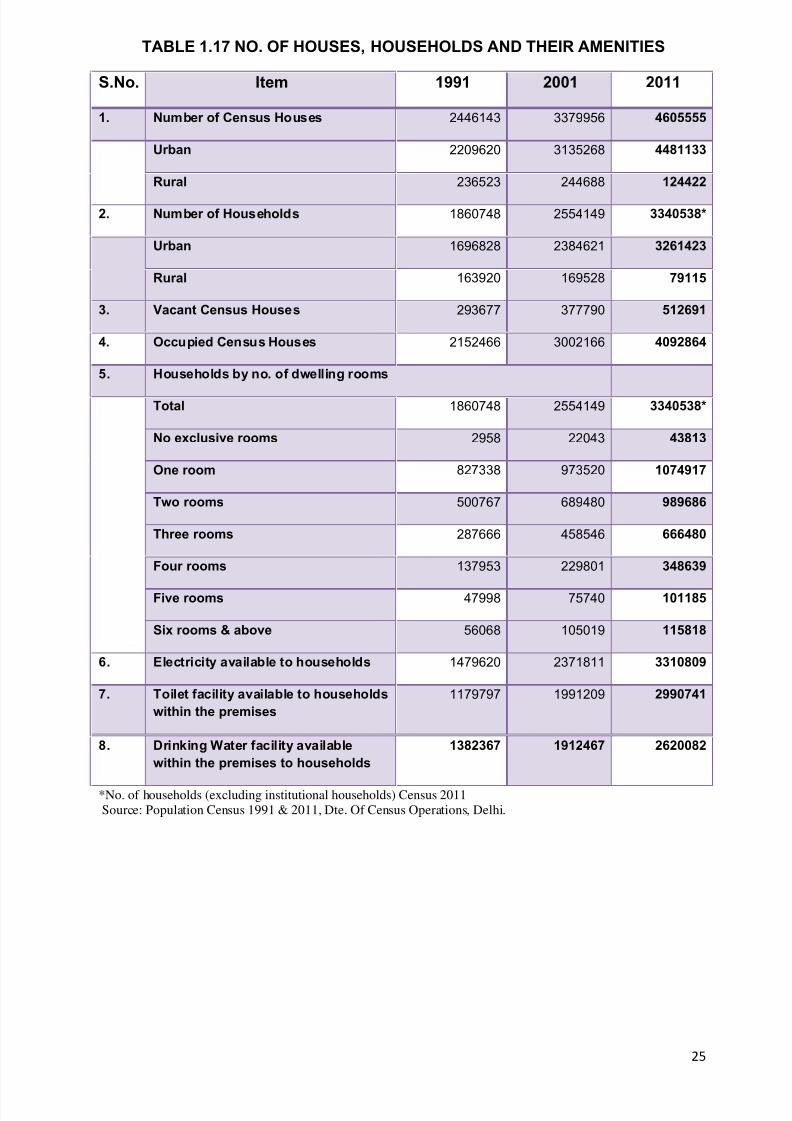
TABLE 1.17 NO. OF HOUSES, HOUSEHOLDS AND THEIR AMENITIES
S.No. Item 1991 2001 2011
1. Number of Census Houses 2446143 3379956 4605555
Urban 2209620 3135268 4481133
Rural 236523 244688 124422
2. Number of Households 1860748 2554149 3340538*
Urban 1696828 2384621 3261423
Rural 163920 169528 79115
3. Vacant Census Houses 293677 377790 512691
4. Occupied Census Houses 2152466 3002166 4092864
5. Households by no. of dwelling rooms
Total 1860748 2554149 3340538*
No exclusive rooms 2958 22043 43813
One room 827338 973520 1074917
Two rooms 500767 689480 989686
Three rooms 287666 458546 666480
Four rooms 137953 229801 348639
Five rooms 47998 75740 101185
Six rooms & above 56068 105019 115818
6. Electricity available to households 1479620 2371811 3310809
7. Toilet facility available to households
within the premises
1179797 1991209 2990741
8. Drinking Water facility available
within the premises to households
1382367 1912467 2620082
*No. of households (excluding institutional households) Census 2011Source: Population Census 1991 & 2011, Dte. Of Census Operations, Delhi.

8/20/2019 Statistical+Abstract+of+Delhi+2014
http://slidepdf.com/reader/full/statisticalabstractofdelhi2014 45/190
26
TABLE 1.18 NUMBER OF VILLAGES IN DELHI
*As per Provisional Population Census – 2011
Source: Population Census 1921 & 2001, Dte. Of Census Operations, Delhi.
Census Number of Villages
Year Total Uninhabited Inhabited
1921 357 43 314
1931 356 49 307
1941 354 49 305
1951 341 37 304
1961 300 24 276
1971 258 15 243
1981 231 17 214
1991 209 10 199
2001 165 7 158
2011* 112 7 105

8/20/2019 Statistical+Abstract+of+Delhi+2014
http://slidepdf.com/reader/full/statisticalabstractofdelhi2014 46/190
27
TABLE 1.19 POPULATION PROJECTION OF DELHI
(’000)
YEAR As on Ist march As on Ist July As on Ist October
Male Female Urban Rural Male Female Urban Rural Male Female Urban Rural
2002 7846 6428 13338 936 7927 6490 13485 932 7988 6538 13597 929
2003 8086 6612 13773 925 8168 6675 13921 922 8229 6723 14033 919
2004 8330 6799 14213 916 8413 6863 14363 913 8475 6911 14477 909
2005 8579 6990 14664 905 8664 7055 14817 902 8728 7104 14933 899
2006 8835 7186 15126 895 8923 7253 15284 892 8989 7303 15403 889
2007 9098 7386 15600 884 9187 7454 15761 880 9255 7506 15882 879
2008 9365 7590 16081 874 9456 7659 16245 870 9525 7711 16369 867
2009 9639 7798 16574 863 9733 7869 16742 860 9803 7922 16869 856
2010 9922 8013 17082 853 10018 8085 17255 848 10091 8140 17386 845
2011 10215 8235 17608 842 10315 8311 17787 839 10391 8368 17923 836
2012 10518 8465 18151 832 10621 8543 18335 829 10699 8602 18475 826
2013 10828 8700 18707 821 10934 8780 18896 818 11014 8841 19039 816
2014 11149 8943 19281 811 11258 9026 19476 808 11340 9088 19623 805
2015 11481 9195 19875 801 11594 9281 20077 798 11679 9346 20230 795
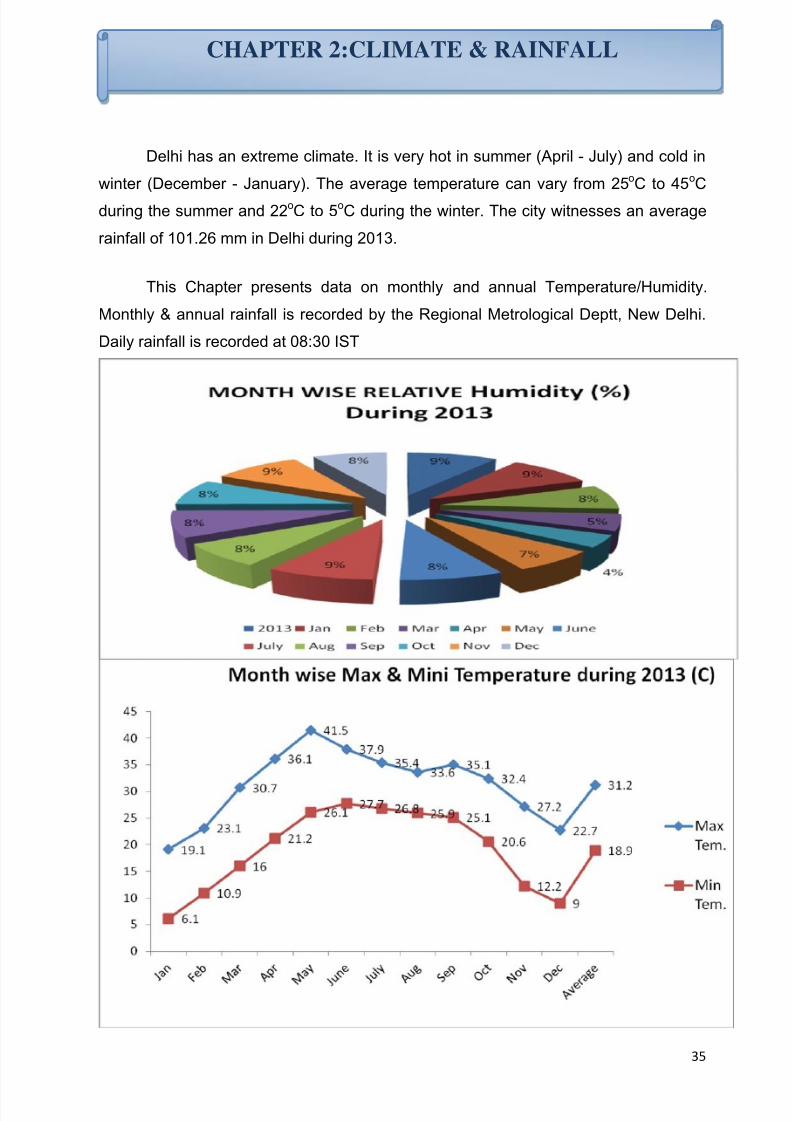
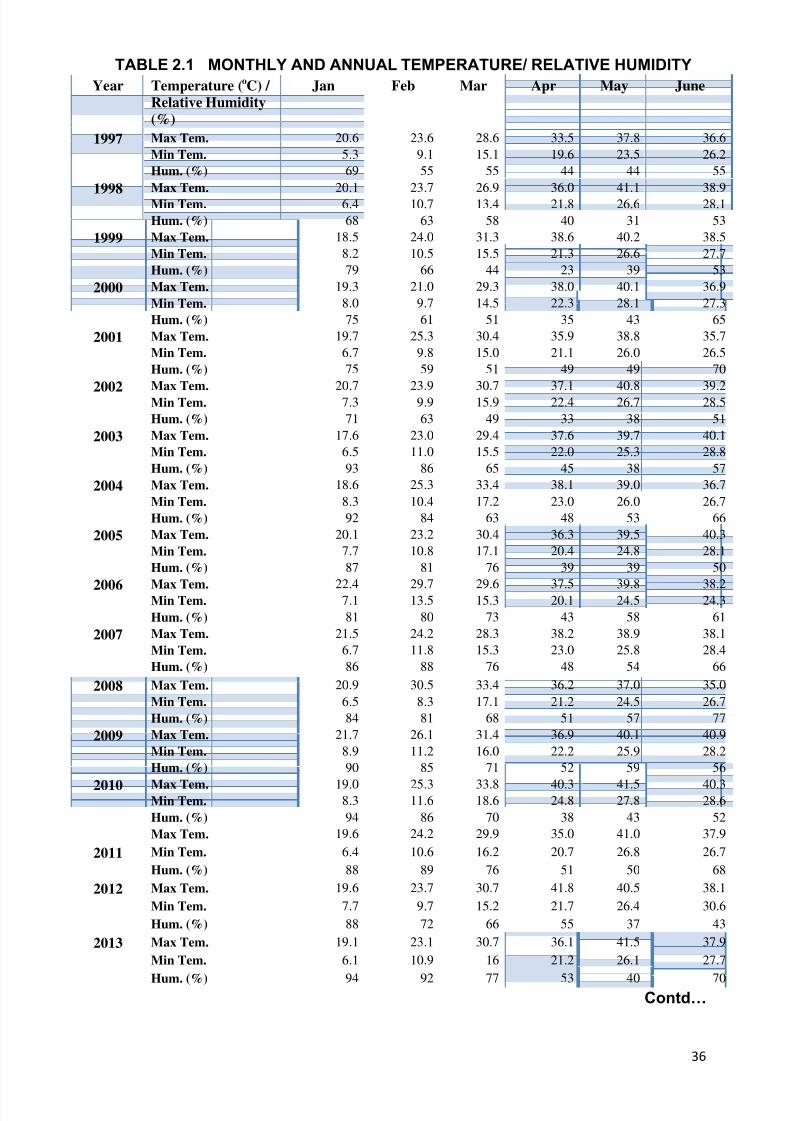
2016 11827 9458 20493 792 11944 9547 20703 788 12033 9615 20862 786
2017 12175 9722 21114 783 12293 9811 21325 779 12382 9879 21485 776
2018 12532 9991 21751 772 12653 10083 21967 769 12745 10152 22131 766
2019 12897 10267 22402 762 13021 10361 22623 759 13115 10432 22790 757
2020 13270 10549 23066 753 13397 10644 23292 749 13492 10716 23463 745
2021 13650 10835 23743 742 13779 10932 23973 738 13877 11006 24147 736
2022 14036 11126 24467 695 14167 11225 24713 679 14266 11299 24899 666
2023 14430 11422 25212 640 14563 11523 25466 620 14664 11599 25658 605
2024 14830 11723 25986 567 14965 11825 26249 541 15068 11903 26448 523
2025 15235 12028 26795 468 15373 12132 27070 435 15477 12210 27278 409
2026 15645 12337 27246 736 15784 12441 27935 290 15889 12520 28155 254
Source: Dte. Of Census Operations, Delhi.

8/20/2019 Statistical+Abstract+of+Delhi+2014
http://slidepdf.com/reader/full/statisticalabstractofdelhi2014 47/190
28
TABLE 1.20 MIGRANT POPULATION IN DELHI
S.NO Description 1981 1991 2001
A Total in Migrants 2989121 3723462 6014458
Males (in %) 54.7 53.8 55.5
Females (in %) 45.3 46.2 44.5
B Reasons for migration (in %)
Work/employment 27.8 29.1 33.4
Business - 4.4 0.7
Education 2.3 1.4 1.4
Marriage 14.3 19 15.3
Moved after birth - - 2.1
Moved with household 41.4 38.3 33.7
Others 14.2 7.8 13.4
C Duration of residence at the place of enumeration (in %)
Less than 1 year 6.7 3.8 2.6
1-4 years 25.6 21.5 18.4
5-9 years 19.2 19.8 18.2
10-19 years 20.2 26.5 27.5
20+ years 23.6 26.8 26.8
Duration not stated 4.7 1.6 6.6
Source: Population Census 1981 & 2001Dte. Of Census Operations, Delhi.

8/20/2019 Statistical+Abstract+of+Delhi+2014
http://slidepdf.com/reader/full/statisticalabstractofdelhi2014 48/190
29
TABLE 1.21 POPULATIONS IN SELECTED CITIES OF INDIA
Census Year Delhi Greater Mumbai
Kolkata Chennai Bangalore Hyderabad Ahmedabad
1991 Persons 8419084 12596243 11021918 5421985 4130288 4344437 3312216
Male 4601590 6891222 6022489 2805566 2170985 2251452 1753320
Female 3817494 5705021 4999429 2616419 1959303 2092985 1558896
Sexratio
830 828 830 933 902 930 889
2001 Persons 12877470 16434386 13205697 6560242 5701446 5742036 4525013Male 7069371 9021789 7064138 3355524 2988561 2973472 2401422
Female 5808099 7412597 6141559 3204718 2712885 2768564 2123591
Sexratio
821 822 869 955 908 960 884
2011*Persons 16314838 18414288 14112536 8696010 8499399 7749334 6352254
Male 8739213 9894088 7319682 4389200 4441248 3985240 33482643003990Female 7575625 8520200 6792854 4306810 4058151 3764094
Sexratio
867 861 928 981 914 945 897
*Provisional population census 2011
Source: Population Census 1991 & 2001, Dte. Of Census Operations, Delhi.
8/20/2019 Statistical+Abstract+of+Delhi+2014
http://slidepdf.com/reader/full/statisticalabstractofdelhi2014 49/190
30
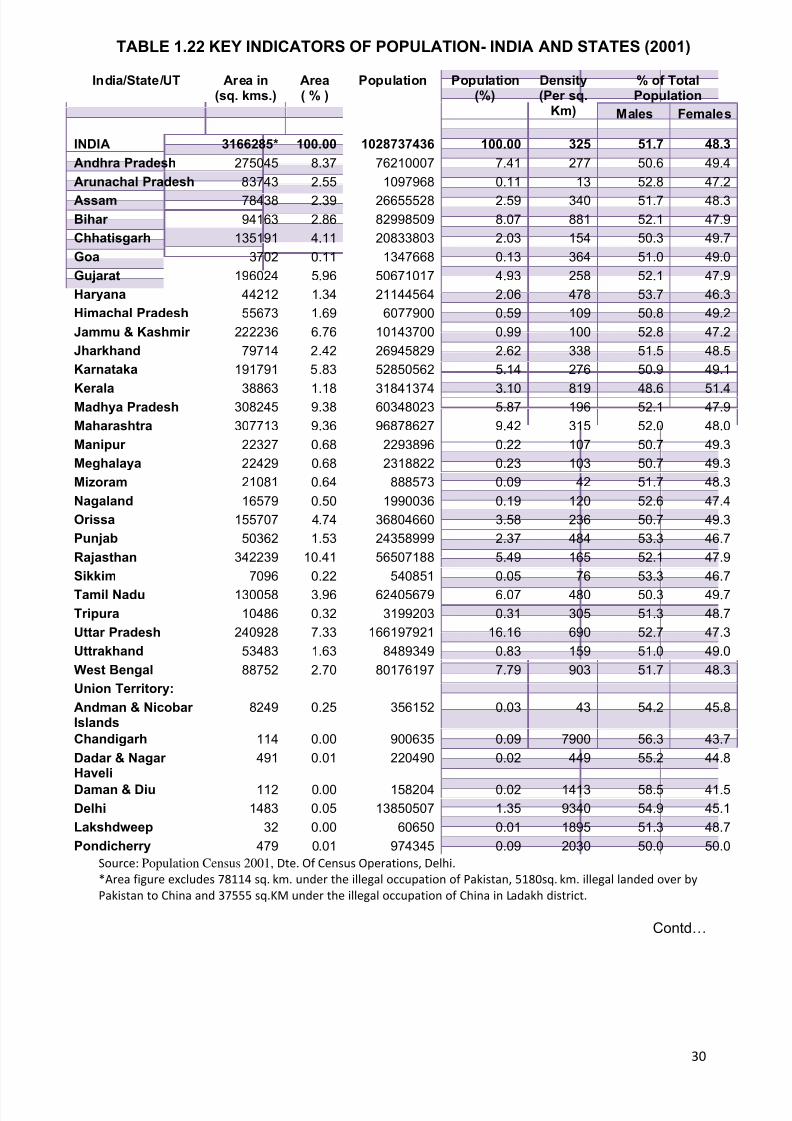
TABLE 1.22 KEY INDICATORS OF POPULATION- INDIA AND STATES (2001)
India/State/UT Area in(sq. kms.)
Area( % )
Population Population(%)
Density(Per sq.
Km)
% of TotalPopulation
Males Females
INDIA 3166285* 100.00 1028737436 100.00 325 51.7 48.3
Andhra Pradesh 275045 8.37 76210007 7.41 277 50.6 49.4
Arunachal Pradesh 83743 2.55 1097968 0.11 13 52.8 47.2
Assam 78438 2.39 26655528 2.59 340 51.7 48.3
Bihar 94163 2.86 82998509 8.07 881 52.1 47.9
Chhatisgarh 135191 4.11 20833803 2.03 154 50.3 49.7
Goa 3702 0.11 1347668 0.13 364 51.0 49.0
Gujarat 196024 5.96 50671017 4.93 258 52.1 47.9
Haryana 44212 1.34 21144564 2.06 478 53.7 46.3
Himachal Pradesh 55673 1.69 6077900 0.59 109 50.8 49.2
Jammu & Kashmir 222236 6.76 10143700 0.99 100 52.8 47.2
Jharkhand 79714 2.42 26945829 2.62 338 51.5 48.5
Karnataka 191791 5.83 52850562 5.14 276 50.9 49.1
Kerala 38863 1.18 31841374 3.10 819 48.6 51.4Madhya Pradesh 308245 9.38 60348023 5.87 196 52.1 47.9
Maharashtra 307713 9.36 96878627 9.42 315 52.0 48.0
Manipur 22327 0.68 2293896 0.22 107 50.7 49.3
Meghalaya 22429 0.68 2318822 0.23 103 50.7 49.3
Mizoram 21081 0.64 888573 0.09 42 51.7 48.3
Nagaland 16579 0.50 1990036 0.19 120 52.6 47.4
Orissa 155707 4.74 36804660 3.58 236 50.7 49.3
Punjab 50362 1.53 24358999 2.37 484 53.3 46.7
Rajasthan 342239 10.41 56507188 5.49 165 52.1 47.9
Sikkim 7096 0.22 540851 0.05 76 53.3 46.7
Tamil Nadu 130058 3.96 62405679 6.07 480 50.3 49.7
Tripura 10486 0.32 3199203 0.31 305 51.3 48.7
Uttar Pradesh 240928 7.33 166197921 16.16 690 52.7 47.3
Uttrakhand 53483 1.63 8489349 0.83 159 51.0 49.0
West Bengal 88752 2.70 80176197 7.79 903 51.7 48.3
Union Territory:
Andman & Nicobar Islands
8249 0.25 356152 0.03 43 54.2 45.8
Chandigarh 114 0.00 900635 0.09 7900 56.3 43.7
Dadar & Nagar Haveli
491 0.01 220490 0.02 449 55.2 44.8
Daman & Diu 112 0.00 158204 0.02 1413 58.5 41.5
Delhi 1483 0.05 13850507 1.35 9340 54.9 45.1
Lakshdweep 32 0.00 60650 0.01 1895 51.3 48.7
Pondicherry 479 0.01 974345 0.09 2030 50.0 50.0
Source: Population Census 2001, Dte. Of Census Operations, Delhi.
*Area figure excludes 78114 sq. km. under the illegal occupation of Pakistan, 5180sq. km. illegal landed over by
Pakistan to China and 37555 sq.KM under the illegal occupation of China in Ladakh district.
Contd…

8/20/2019 Statistical+Abstract+of+Delhi+2014
http://slidepdf.com/reader/full/statisticalabstractofdelhi2014 50/190
31
TABLE 1.22 KEY INDICATORS OF POPULATION- INDIA AND STATES (2001)
India/State/UTs
% of TotalPopulation
% of Slum
Population tototal
urbanpopulati
on
Sexratio
(Females per 1,000
males)
Literacy rate (%) % of SCPopulation
to TotalPopulation
% of STPopulation
to TotalPopulationRural Urban Persons M F
INDIA 72.19 27.81 15.0 933 64.9 75.3 53.7 16.20 8.20
AndhraPradesh
72.70 27.30 24.9 978 60.5 70.3 50.4 16.19 6.59
ArunachalPradesh
79.25 20.75 0.0 893 54.3 63.8 43.5 0.06 64.22
Assam 87.10 12.90 2.4 935 63.3 71.3 54.6 6.85 12.41
Bihar 89.54 10.46 6.1 919 47.0 59.7 33.1 15.72 0.91
Chhatisgarh 79.91 20.09 19.5 989 64.7 77.4 51.9 11.61 31.76
Goa 50.24 49.76 2.2 961 82.0 88.4 75..4
1.77 0.04
Gujarat 62.64 37.36 9.9 920 69.1 79.7 57.8 7.09 14.76Haryana 71.08 28.92 23.2 861 67.9 78.5 55.7 19.35 0.00
HimachalPradesh
90.20 9.8 0.0 968 76.5 85.3 67.4 24.72 4.02
Jammu &Kashmir
75.19 24.81 10.7 892 55.5 66.6 43.0 7.59 10.90
Jharkhand 77.76 22.24 5.0 941 53.6 67.3 38.9 11.84 26.30
Karnataka 66.01 33.99 7.8 965 66.6 76.1 56.9 16.20 6.55
Kerala 74.04 25.96 0.8 1058 90.9 94.2 87.7 9.81 1.14
MadhyaPradesh
73.54 24.46 15.1 919 63.7 76.1 50.3 15.17 20.27
Maharashtra 57.57 42.43 27.3 922 76.9 86.0 67.0 10.20 8.85
Manipur 74.89 25.11 0.0 974 68.9 77.9 59.7 2.77 34.20
Meghalaya 80.42 19.58 19.0 972 62.6 65.4 59.6 0.48 85.94
Mizoram 50.37 49.63 0.0 935 88.8 90.7 86.7 0.03 94.46
Nagaland 82.77 17.23 0.0 900 66.6 71.2 61.5 0.00 89.15
Orissa 85.01 14.99 11.4 972 63.1 75.3 50.5 16.53 22.13
Punjab 66.08 33.92 14.0 876 69.7 75.2 63.4 28.85 0.00
Rajasthan 76.61 23.39 9.8 921 60.4 75.7 43.9 17.16 12.56
Sikkim 88.93 11.07 0.0 875 68.8 76.0 60.4 5.02 20.6
Tamil Nadu 55.96 44.04 10.4 987 73.5 82.4 64.4 19.00 1.04
Tripura 82.94 17.06 5.5 948 73.2 81.0 64.9 17.37 31.05
Uttar Pradesh 79.22 20.78 12.7 898 56.3 68.8 42.2 21.15 0.06
Uttrakhand 74.33 25.67 9.0 962 71.6 83.3 59.6 17.87 3.20
West Bengal 72.03 27.97 18.4 934 68.6 77.0 59.6 23.02 5.50Union Territory:
Andman &Nicobar Islands
67.37 32.63 14.0 846 81.3 86.3 75.2 0.00 8.27
Chandigarh 10.23 89.77 13.2 777 81.9 86.1 76.5 17.50 0.00
Dadar & Nagar Haveli
77.11 22.89 0.0 812 57.6 71.2 40.2 1.86 62.24
Daman & Diu 63.75 36.25 0.0 710 78.2 86.8 65.6 3.06 8.85
Delhi 6.82 93.18 15.7 821 81.7 87.3 74.7 16.92 0.00
Lakshadweep 55.54 44.46 0.0 948 86.7 92.5 80.5 0.00 94.51
Pondicherry 33.43 66.57 11.3 1001 81.2 88.6 73.9 16.19 0.00
Source: Population Census 2001, Dte. Of Census Operations, Delhi.

8/20/2019 Statistical+Abstract+of+Delhi+2014
http://slidepdf.com/reader/full/statisticalabstractofdelhi2014 51/190
32
TABLE 1.23 KEY INDICATORS OF POPULATION- INDIA AND STATES (2011)
India/State/UT Area in(sq. kms.)*
Population Population(%)
Density(Per sq.
Km)
Population
Males Females
INDIA 3287240 1210569573 100.00 382 623121843 587447730
Andhra Pradesh 275045 84580777 7.0 308 42442146 42138631
ArunachalPradesh
83743 1383727 0.11 17 713912 669815
Assam 78438 31205576 2.58 398 15939443 15266133
Bihar 94163 104099452 8.60 1106 54278157 49821295
Chhatisgarh 135191 25545198 2.11 189 12832895 12712303
Goa 3702 1458545 0.12 394 739140 719405
Gujarat 196024 60439692 5.00 308 31491260 28948432
Haryana 44212 25351462 2.09 573 13494734 11856728
Himachal Pradesh 55673 6864602 0.57 123 3481873 3382729
Jammu & Kashmir 222236 12541302 1.04 124 6640662 5900640
Jharkhand 79714 32988134 2.73 414 16930315 16057819
Karnataka - 61095297 5.05 319 30966657 30128640
Kerala 38863 33406061 2.76 860 16027412 17378641Madhya Pradesh 135191 72626809 6.0 236 37612306 35014503
Maharashtra 307713 112374333 9.28 365 58243056 54131277
Manipur 22327 2570390 0.21 115 1290171 1280219
Meghalaya 22429 2966889 0.25 132 1491832 1475057
Mizoram 21081 1097206 0.09 52 555339 541867
Nagaland 16579 1978502 0.16 119 1024649 953853
Orissa 155707 41974218 3.47 270 21212136 20762082
Punjab 50362 27743338 2.29 551 14639465 13103873
Rajasthan 342239 68548437 5.66 200 35550997 32997440
Sikkim 7096 610577 0.05 86 323070 287507
Tamil Nadu 130058 72147030 5.96 555 36137975 36009055
Tripura 10486 3673917 0.30 350 1874376 1799541
Uttar Pradesh 240928 199812341 16.51 829 104480510 95331831
Uttrakhand 53483 10086292 0.83 189 5137773 4948519
West Bengal 88752 91276115 7.54 1028 46809027 44467088
Union Territory:
Andman &Nicobar Islands
8249 380581 0.03 46 202871 177710
Chandigarh 114 1055450 0.09 9258 580663 474787
Dadar & Nagar Haveli
- 343709 0.03 700 193760 149940
Daman & Diu - 243247 0.02 2191 150301 92946Delhi 1483 16787941 1.39 11320 8987326 7800615
Lakshdweep Under process 64473 0.01 2149 33123 31350
Pondicherry 479 1247953 0.10 2547 612511 635442*provisional
Population Census 2011
Contd...

8/20/2019 Statistical+Abstract+of+Delhi+2014
http://slidepdf.com/reader/full/statisticalabstractofdelhi2014 52/190
33
TABLE 1.23 KEY INDICATORS OF POPULATION- INDIA AND STATES (2011)
India/State/UTs
% of Total Population Sex ratio(Femalesper 1,000
males)
Literacy rate (%)
Rural Urban Persons M F
INDIA 68.8 32.2 943 73.0 80.9 64.6
Andhra Pradesh 66.6 33.4 993 67.0 74.9 59.1Arunachal
Pradesh77.1 22.9 938 65.4 72.6 57.7
Assam 85.9 14.1 958 72.2 77.8 66.3
Bihar 88.7 11.3 918 61.8 71.2 51.5
Chhattisgarh 76.8 23.2 991 70.3 80.3 60.2
Goa 37.8 62.2 973 88.7 92.6 84.7
Gujarat 57.4 42.6 919 78.0 85.8 69.7
Haryana 65.1 34.9 879 75.6 84.1 65.9
Himachal Pradesh 90.0 10.0 972 82.8 89.5 75.9
Jammu & Kashmir 72.6 27.4 889 67.2 76.8 56.4
Jharkhand 76.0 24.0 949 66.4 76.8 55.4
Karnataka 61.3 38.7 973 75.4 82.5 68.1Kerala 52.3 47.7 1084 94.0 96.1 92.1
Madhya Pradesh 72.4 27.6 981 69.3 78.7 59.2
Maharashtra 54.8 45.2 929 82.3 88.4 75.9
Manipur 67.5 32.5 992 79.2 86.1 72.4
Meghalaya 79.9 20.1 989 74.4 76.0 72.9
Mizoram 47.9 52.1 976 91.3 93.3 89.3
Nagaland 71.1 28.9 931 79.6 82.8 76.1
Orisha 83.3 16.7 979 72.9 81.6 64.0
Punjab 62.5 37.5 895 75.8 80.4 70.7
Rajasthan 75.1 24.9 928 66.1 79.2 52.1
Sikkim 74.8 25.2 890 81.4 86.6 75.6
Tamil Nadu 51.6 48.4 996 80.1 86.8 73.4Tripura 73.8 26.2 960 87.2 91.5 82.7
Uttar Pradesh 77.7 22.3 912 67.7 77.3 57.2
Uttarakhand 69.8 30.2 963 78.8 87.4 70.0
West Bengal 68.1 31.9 950 76.3 81.7 70.5
Andman &Nicobar Islands
62.3 37.7 876 86.6 90.3 82.4
Chandigarh 2.7 97.3 818 86.0 90.0 81.2
Dadar & Nagar Haveli
53.3 46.7 774 76.2 85.2 64.3
Daman & Diu 24.8 75.2 618 87.1 91.5 79.5
Delhi 2.5 97.5 868 86.2 90.9 80.8
Lakshadweep 21.9 78.1 947 91.8 95.6 87.9Pondicherry 31.7 68.3 1037 85.8 91.3 80.7
Population Census 2011
Source: Dte. Of Census Operations, Delhi.
******

8/20/2019 Statistical+Abstract+of+Delhi+2014
http://slidepdf.com/reader/full/statisticalabstractofdelhi2014 53/190
34
CHAPTER TWO
CLIMATE & RAINFALL
• Monthly and Annual Temperature/Humidity
• Monthly and Annual Rainfall
8/20/2019 Statistical+Abstract+of+Delhi+2014
http://slidepdf.com/reader/full/statisticalabstractofdelhi2014 54/190
35
Delhi has an extreme climate. It is very hot in summer (April - July) and cold in
winter (December - January). The average temperature can vary from 25oC to 45oC
during the summer and 22oC to 5oC during the winter. The city witnesses an average
rainfall of 101.26 mm in Delhi during 2013.
This Chapter presents data on monthly and annual Temperature/Humidity.
Monthly & annual rainfall is recorded by the Regional Metrological Deptt, New Delhi.
Daily rainfall is recorded at 08:30 IST
CHAPTER 2:CLIMATE & RAINFALL
8/20/2019 Statistical+Abstract+of+Delhi+2014
http://slidepdf.com/reader/full/statisticalabstractofdelhi2014 55/190
36
TABLE 2.1 MONTHLY AND ANNUAL TEMPERATURE/ RELATIVE HUMIDITY
Contd…
Year Temperature (oC) /
Relative Humidity
(%)
Jan Feb Mar Apr May June
1997 Max Tem. 20.6 23.6 28.6 33.5 37.8 36.6
Min Tem. 5.3 9.1 15.1 19.6 23.5 26.2
Hum. (%) 69 55 55 44 44 55
1998Max Tem. 20.1 23.7 26.9 36.0 41.1 38.9
Min Tem. 6.4 10.7 13.4 21.8 26.6 28.1
Hum. (%) 68 63 58 40 31 53
1999 Max Tem. 18.5 24.0 31.3 38.6 40.2 38.5
Min Tem. 8.2 10.5 15.5 21.3 26.6 27.7
Hum. (%) 79 66 44 23 39 53
2000 Max Tem. 19.3 21.0 29.3 38.0 40.1 36.9
Min Tem. 8.0 9.7 14.5 22.3 28.1 27.3
Hum. (%) 75 61 51 35 43 65
2001 Max Tem. 19.7 25.3 30.4 35.9 38.8 35.7
Min Tem. 6.7 9.8 15.0 21.1 26.0 26.5
Hum. (%) 75 59 51 49 49 70
2002Max Tem. 20.7 23.9 30.7 37.1 40.8 39.2
Min Tem. 7.3 9.9 15.9 22.4 26.7 28.5
Hum. (%) 71 63 49 33 38 51
2003 Max Tem. 17.6 23.0 29.4 37.6 39.7 40.1
Min Tem. 6.5 11.0 15.5 22.0 25.3 28.8
Hum. (%) 93 86 65 45 38 57
2004 Max Tem. 18.6 25.3 33.4 38.1 39.0 36.7
Min Tem. 8.3 10.4 17.2 23.0 26.0 26.7
Hum. (%) 92 84 63 48 53 66
2005 Max Tem. 20.1 23.2 30.4 36.3 39.5 40.3
Min Tem. 7.7 10.8 17.1 20.4 24.8 28.1
Hum. (%) 87 81 76 39 39 50
2006 Max Tem. 22.4 29.7 29.6 37.5 39.8 38.2Min Tem. 7.1 13.5 15.3 20.1 24.5 24.3
Hum. (%) 81 80 73 43 58 61
2007 Max Tem. 21.5 24.2 28.3 38.2 38.9 38.1
Min Tem. 6.7 11.8 15.3 23.0 25.8 28.4
Hum. (%) 86 88 76 48 54 66
2008 Max Tem. 20.9 30.5 33.4 36.2 37.0 35.0
Min Tem. 6.5 8.3 17.1 21.2 24.5 26.7
Hum. (%) 84 81 68 51 57 77
2009 Max Tem. 21.7 26.1 31.4 36.9 40.1 40.9
Min Tem. 8.9 11.2 16.0 22.2 25.9 28.2
Hum. (%) 90 85 71 52 59 56
2010 Max Tem. 19.0 25.3 33.8 40.3 41.5 40.3Min Tem. 8.3 11.6 18.6 24.8 27.8 28.6
Hum. (%) 94 86 70 38 43 52
Max Tem. 19.6 24.2 29.9 35.0 41.0 37.9
2011 Min Tem. 6.4 10.6 16.2 20.7 26.8 26.7
Hum. (%) 88 89 76 51 50 68
2012 Max Tem. 19.6 23.7 30.7 41.8 40.5 38.1
Min Tem. 7.7 9.7 15.2 21.7 26.4 30.6
Hum. (%) 88 72 66 55 37 43
2013 Max Tem. 19.1 23.1 30.7 36.1 41.5 37.9
Min Tem. 6.1 10.9 16 21.2 26.1 27.7
Hum. (%) 94 92 77 53 40 70

8/20/2019 Statistical+Abstract+of+Delhi+2014
http://slidepdf.com/reader/full/statisticalabstractofdelhi2014 56/190
37
TABLE 2.1 MONTHLY AND ANNUAL TEMPERATURE/ RELATIVE HUMIDITY
Year Temperature (0C)
/Relative Humidity(%)
July Aug Sep Oct Nov Dec Average
1997 Max Tem. 35.4 33.3 34.1 29.2 - - 26.1
Min Tem. 27.4 26.1 25.3 18.5 - - 16.3
Hum. (%) 72 77 73 74 - - 51.5
1998 Max Tem. 34.6 33.4 33.8 31.1 27.6 22.2 30.8
Min Tem. 27.4 26.5 26.2 21 13.5 7.9 19.1
Hum. (%) 73 81 75 69 67 76 62.81999 Max Tem. 35.7 35.2 33.7 32.9 28.6 23.7 31.7
Min Tem. 28.0 27.1 25.9 19.4 12.5 7.3 19.2
Hum. (%) 69 65 75 63 57 74 58.9
2000 Max Tem. 33.7 34.3 34.4 34.7 - - 26.8
Min Tem. 24.8 26.8 25.2 20.2 - - 17.2
Hum. (%) 77 75 63 58 - - 50.3
2001 Max Tem. 34.7 35.2 36.3 34.2 29.4 23.6 39.9
Min Tem. 27.8 26.9 24.8 19.9 12.7 8.9 18.8
Hum. (%) 75 69 56 62 62 77 62.8
2002 Max Tem. 39.4 34.5 32.5 33.3 28.2 24.1 32.0
Min Tem. 30.5 27.5 23.7 19.8 13.1 8.4 19.5
Hum. (%) 47 76 77 65 66 75 59.32003 Max Tem. 34.2 33.7 32.7 32.9 28.3 20.9 30.8
Min Tem. 26.2 26.8 25.2 18.2 11.7 9.7 18.9
Hum. (%) 85 85 84 73 75 88 72.8
2004 Max Tem. 38.0 33.7 35.4 31.3 28.6 23.2 31.9
Min Tem. 28.4 26.2 25.1 19 12.8 9.4 19.4
Hum. (%) 65 84 68 81 77 84 72.1
2005 Max Tem. 34.2 35.7 33.0 33.2 29.0 22.7 31.5
Min Tem. 27.1 27.3 25.1 18.8 12.2 6.0 18.8
Hum. (%) 82 69 81 70 71 79 68.7
2006 Max Tem. 34.9 35.4 34.5 33.6 28.9 23.3 32.3
Min Tem. 27.1 27.1 24.7 20.5 13.9 9.2 18.9
Hum. (%) 79 79 78 73 83 85 72.8
2007 Max Tem. 35.9 35.1 34.5 33.4 29.0 22.9 31.7
Min Tem. 27.6 27.2 25.2 17.5 12.6 8.0 19.1
Hum. (%) 77 82 80 67 86 83 74.4
2008 Max Tem. 35.3 33.7 33.9 34.2 29.0 24.5 31.96
Min Tem. 27.1 26.4 24.5 20.9 12.9 10.2 18.85
Hum. (%) 83 84 80 78 84 88 76.25
2009 Max Tem. 36.9 35.4 34.1 32.9 27.2 23.6 32.26
Min Tem. 28.3 27.2 25.1 19.1 13.4 8.6 19.50
Hum. (%) 75 80 95 89 97 97 78.83
2010 Max Tem. 35.6 33.6 31.0 32.9 27.4 22.3 31.91
Min Tem. 27.7 26.7 24.6 21.1 15.4 7.8 20.25
Hum. (%) 81 88 89 79 86 88 74.5
Max Tem. 34.6 33.9 33.9 33.3 29.4 23.7 34.28
Min Tem. 27.3 26.7 25.5 20.1 14.9 7.9 19.15
2011 Hum. (%) 81 85 82 71 82 88 75.91
Max Tem. 36.9 33.1 33.8 32.7 23 22.3 31.35
Min Tem. 28.6 26.4 25.1 18.5 12.2 9.1 19.27
2012 Hum. (%) 72 85 79 73 81 83 69.5
Max Tem. 35.4 33.6 35.1 32.4 27.2 22.7 31.2
Min Tem. 26.8 25.9 25.1 20.6 12.2 9 18.9
2013 Hum. (%) 82 85 75 84 81 94 77
Source: Regional Meteorological Department, New DelhiNote: Relative Humidity at 08.30 IST

8/20/2019 Statistical+Abstract+of+Delhi+2014
http://slidepdf.com/reader/full/statisticalabstractofdelhi2014 57/190
38
TABLE 2.2 MONTHLY & ANNUAL RAINFALL(Rainfall in mms)
Year Rainy
Days/Rainfall
Jan Feb Mar Apr May Jun July
1
1996 Rainy Days 2 1 1 2 6 13
Total Rainfall 7.2 21.2 4.5 1.6 15.0 109.2 180.9
1997 Rainy Days 2 3 4 4 7 10 15
Total Rainfall 10.0 2.3 11.4 46.6 55.2 157.0 57.8
1998 Rainy Days - 2 2 1 2 5 10
Total Rainfall - 26.0 30.0 5.0 130.1 131.2 138.1
1999 Rainy Days 3 - - - 2 5 7
Total Rainfall 59.7 1.8 0.6 0.0 14.8 72.6 114.1
2000 Rainy Days 3 2 2 - 3 7 12
Total Rainfall 32.8 60.3 21.6 1.0 15.6 129.4 295.8
2001 Rainy Days 1 1 1 2 6 9 9
Total Rainfall 14.6 14.7 5.2 36.3 77.9 128.3 129.7
2002 Rainy Days 2 2 - - 4 3 1
Total Rainfall 20.7 16.8 2.6 0.6 129.3 48.4 7.2
2003 Rainy Days 3 2 1 0 1 7 16
Total Rainfall 38.5 27.9 5.0 0.9 6.0 164.2 632.2
2004 Rainy Days 4 0 0 4 3 4 2
Total Rainfall 16.0 - 0.0 67.5 37.7 72.5 13.8
2005 Rainy Days - 3 4 - - 5 11
Total Rainfall 3.4 47.6 34.6 4.5 4.2 69.2 193.9
2006 Rainy Days 0 0 3 0 3 8 9
Total Rainfall 0.9 0.0 25.3 2.4 57.3 124.3 313.3
2007 Rainy Days 0 5 4 0 5 5 11
Total Rainfall 1.7 76.2 61.6 0.4 71.5 150.9 163.1
2008 Rainy Days 0 1 0 3 9 6 10
Total Rainfall 1.8 3.1 0.0 38.6 165.0 91.6 146.2
2009 Rainy Days 1 1 1 1 4 3 5
Total Rainfall 5.8 4.7 9.6 3.2 65.8 19.0 161.2
2010 Rainy Days 1 2 0 0 0 0 12
Total Rainfall 6.2 30.1 0.0 0.2 5.4 3.9 239.6
Rainy Days 0 5 0 1 2 6 9
2011 Total Rainfall 0.5 53.7 3.8 8.7 24.8 88.3 111.6
2012 Rainy Days 2 0 1 3 0 1 7
Total Rainfall 13.9 1.6 6.2 18.3 3.2 15.5 94.8
Rainy Days 2 6 2 1 0 7 10
2013 Total Rainfall 33.5 103.1 10.9 10.8 trace 119.5 340.5

8/20/2019 Statistical+Abstract+of+Delhi+2014
http://slidepdf.com/reader/full/statisticalabstractofdelhi2014 58/190
39
TABLE 2.2 MONTHLY & ANNUAL RAINFALL(Rainfall in mms)
Year Rainy
Days/Rainfall
Aug Sep Oct Nov Dec Total Average
1996 Rainy Days 14 9 1 - - 50 4.17
Total Rainfall 328.8 151.8 20.7 - - 840.9 70.08
1997
Rainy Days 12 7 4 - - 68 5.67
Total Rainfall 189.9 84.3 56 - - 670.5 55.88
1998 Rainy Days 12 8 3 1 - 46 3.83
Total Rainfall 234.2 286.7 54.7 15 - 2221.9 185.16
1999 Rainy Days 3 4 2 - - 26 2.17
Total Rainfall 64.6 75.7 26.3 0 - 430.2 35.85
2000 Rainy Days 10 2 - - - 41 3.42
Total Rainfall 151.4 272 0 - - 979.9 81.66
2001 Rainy Days 6 2 2 - - 39 3.25
Total Rainfall 233.1 47.4 6.6 - 0 693.8 57.82
2002 Rainy Days 6 7 - 25 2.08
Total Rainfall 115.2 202.6 1 - 0.5 544.9 45.41
2003 Rainy Days 12 8 0 0 1 51 4.25
Total Rainfall 156.2 100.2 0 30.2 1161.3 96.78
2004 Rainy Days 13 1 3 0 0 34 2.83
Total Rainfall 274.7 3 89 0 0 574.21 47.85
2005 Rainy Days 5 8 - - - 36 3.00
Total Rainfall 132 231.6 - 0.5 - 721.5 60.13
2006 Rainy Days 4 6 0 0 1 34 2.83
Total Rainfall 98 129.6 3.4 0 3.2 757.7 63.14
2007 Rainy Days 6 6 0 0 0 42 3.50
Total Rainfall 214.3 85.6 0 1.8 0.1 827.2 68.93
2008 Rainy Days 11 6 0 1 0 47 3.91
Total Rainfall 301.7 165.4 0.0 3.4 0.0 916.8 76.4
2009 Rainy Days 12 7 1 2 0 38 3.16
Total Rainfall 216.6 191.2 5.4 10.4 2.8 695.7 57.975
2010 Rainy Days 17 16 0 2 0 50 4.17
Total Rainfall 455.1 329.3 0.0 26.0 3.5 1099.3 91.60
2011 Rainy Days 12 9 0 0 0 44 3.67
Total Rainfall 190.3 225.8 0 0 0.6 708.1 59.01
Rainy Days 17 6 1 0 0 38 3.17
2012 Total Rainfall 378.8 54.8 8.1 1.1 2.3 598.6 49.88
2013 Rainy Days 14 4 3 0 1 50 4.54
Total Rainfall 321.4 94.4 72.7 0.5 6.6 1113.9 101.26
Rainy day is when rain fall is 2.5 MM or more in a day.
Source: Regional Meteorological Department, New Delhi
******
8/20/2019 Statistical+Abstract+of+Delhi+2014
http://slidepdf.com/reader/full/statisticalabstractofdelhi2014 59/190
40
CHAPTER THREE
AGRICULTURE & LIVESTOCK
• Pattern of land utilization
• Area under Principal crops
• Production of Principal crops
• Average Yield of principal crops
• Average price of selected Agriculture commodities during peakseason
• Source of Irrigation &Irrigation Area
• Live Stock-Number of cattles
• Veterinary Facilities• Activity of Delhi Milk Scheme
• Activities of Mother Dairy
8/20/2019 Statistical+Abstract+of+Delhi+2014
http://slidepdf.com/reader/full/statisticalabstractofdelhi2014 60/190
41
In Delhi, Agriculture comprises agriculture proper, livestock and livestock
products and operation of irrigation system.
The economic activities included in agriculture proper are (i) growing of fieldcrops, fruits, nuts, seeds, and vegetables, (ii) management of tea, coffee and rubber
plantations, (iii) agricultural and horticultural services on a fee or on contract basis
such as harvesting, baling and thrashing, operation of tobacco for marketing, pest
control, spraying, pruning, picking and packing and (iv) ancillary activities of cultivators
such as gur making ,transportation of own produce to primary markets, activities
yielding rental income from farm building and farm machinery.
Livestock and livestock products include breeding and rearing of animals and
poultry besides private veterinary services, production of milk slaughtering,
preparation and dressing of meat, production of raw hides and skins, eggs, dung, raw
wool, honey and silkworm cocoons etc.
This chapter contains tables regarding pattern of Land utilization, Area,
Production and Yield per hectare of principal crops in Delhi, production of principal
crops, Average Agricultural commodities during peak season besides irrigation and
irrigated Areas. The said data is presented in tables 3.1 to 3.6 and the source of
information is Agricultural Deptt, Govt. of National Capital Territory of Delhi.
The Statistics of live stock and Poultry, veterinary facilities, activities of Delhi
Milk scheme and Mother Dairy are included in this section. The said data are supplied
by Animal Husbandry Department, Govt. of National Capital Territory of Delhi, and
Delhi Milk Scheme & Mother Dairy respectively.
CHAPTER 3:AGRICULTURE & LIVESTOCK

8/20/2019 Statistical+Abstract+of+Delhi+2014
http://slidepdf.com/reader/full/statisticalabstractofdelhi2014 61/190
42
TABLE 3.1 PATTERN OF LAND UTILIZATION(in hectres)
Year Total Area(Excludingforest area)
Fallow Land Net AreaSown
Area notavailable for cultivation
1980-81 147488 32707 58551 52077
1985-86 147488 12816 56234 713301990-91 147488 12864 48357 742481995-96 147488 8190 47015 829941996-97 147488 10995 10575 83482
1997-98 147488 9811 41701 837141998-99 147488 10016 41495 837141999-00 147488 10167 41386 837142000-01 147488 11544 34034 896892001-02 147488 19427 29116 896882002-03 147488 18649 29477 89606
2003-04 147488 19014 26971 893262004-05 147488 19389 24214 884422005-06 147488 19287 23809 884422006-07 147488 19287 23109 957982007-08 147488 19345 23056 939442008-09 147488 19522 23025 938642009-10 147488 19227 23575 914252010-11 147488 20043 22124 927002011-12 147488 19234 22885 908752012-13 147488 19230 23118 91058
2013-14 147488 19225 23150 927012014-15* 147488 19225 23150 92701
* Estimated
Source: Agriculture Department, GNCT of Delhi.
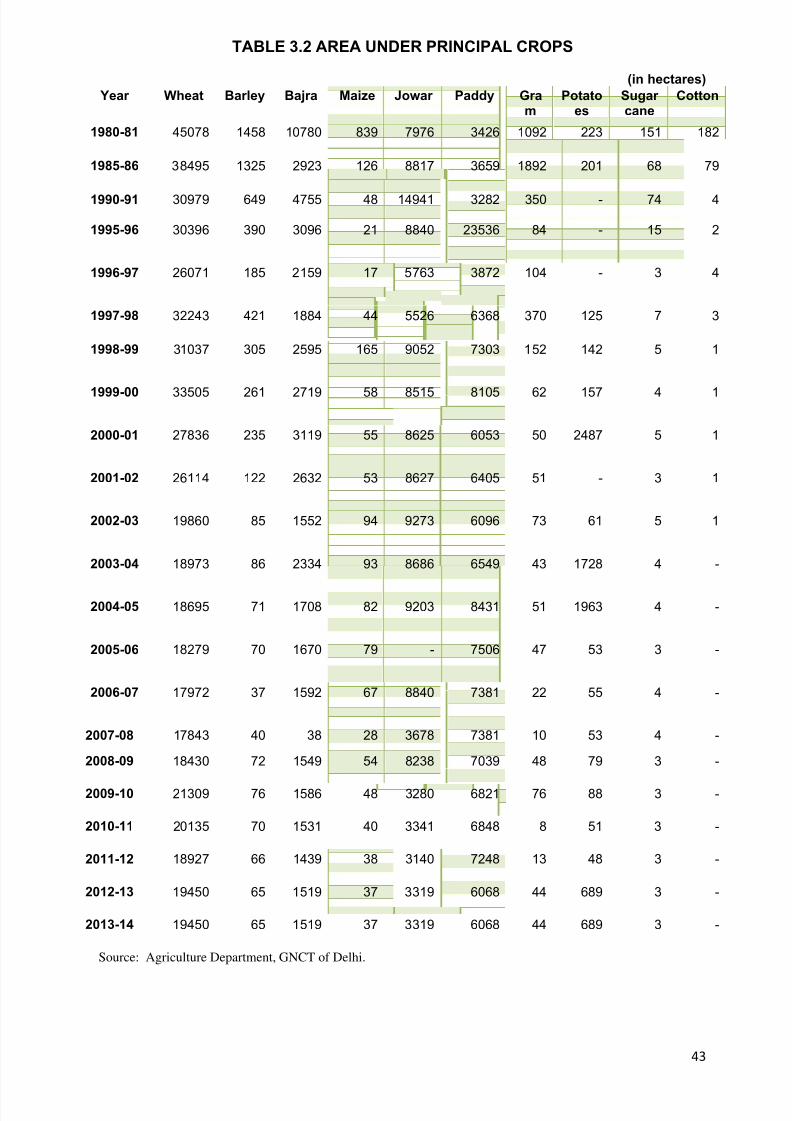
8/20/2019 Statistical+Abstract+of+Delhi+2014
http://slidepdf.com/reader/full/statisticalabstractofdelhi2014 62/190
43
TABLE 3.2 AREA UNDER PRINCIPAL CROPS
(in hectares)
Source: Agriculture Department, GNCT of Delhi.
Year Wheat Barley Bajra Maize Jowar Paddy Gram
Potatoes
Sugar cane
Cotton
1980-81 45078 1458 10780 839 7976 3426 1092 223 151 182
1985-86 38495 1325 2923 126 8817 3659 1892 201 68 79
1990-91 30979 649 4755 48 14941 3282 350 - 74 4
1995-96 30396 390 3096 21 8840 23536 84 - 15 2
1996-97 26071 185 2159 17 5763 3872 104 - 3 4
1997-98 32243 421 1884 44 5526 6368 370 125 7 3
1998-99 31037 305 2595 165 9052 7303 152 142 5 1
1999-00 33505 261 2719 58 8515 8105 62 157 4 1
2000-01 27836 235 3119 55 8625 6053 50 2487 5 1
2001-02 26114 122 2632 53 8627 6405 51 - 3 1
2002-03 19860 85 1552 94 9273 6096 73 61 5 1
2003-04 18973 86 2334 93 8686 6549 43 1728 4 -
2004-05 18695 71 1708 82 9203 8431 51 1963 4 -
2005-06 18279 70 1670 79 - 7506 47 53 3 -
2006-07 17972 37 1592 67 8840 7381 22 55 4 -
2007-08 17843 40 38 28 3678 7381 10 53 4 -
2008-09 18430 72 1549 54 8238 7039 48 79 3 -
2009-10 21309 76 1586 48 3280 6821 76 88 3 -
2010-11 20135 70 1531 40 3341 6848 8 51 3 -
2011-12 18927 66 1439 38 3140 7248 13 48 3 -
2012-13 19450 65 1519 37 3319 6068 44 689 3 -
2013-14 19450 65 1519 37 3319 6068 44 689 3 -

8/20/2019 Statistical+Abstract+of+Delhi+2014
http://slidepdf.com/reader/full/statisticalabstractofdelhi2014 63/190
44
TABLE 3.3 PRODUCTIONS OF PRINCIPAL CROPS(in metric
ton) Year Wheat Barley Bajra Maize Jowar Paddy Gram Other
PulsesPotatoes
Sugar cane
Total foodgrains
1 2 3 4 5 6 7 8 9 10 11 12
1980-81 120088 2600 11330 531 3227 7767 1135 895 1643 304 149520
1985-86 110644 2364 1863 78 3771 8069 2120 897 1491 34 131331
1990-91 110891 1448 8154 28 6716 11562 414 375 438 41 140067
1995-96 84955 122 5686 15 3974 15532 16 34 - 8 110342
1996-97 90102 51 2236 12 2619 11807 15 59 - 3 106904
1997-98 29362 106 1055 29 2149 5269 53 24 923 4 38974
1998-99 107732 83 2091 132 4058 16198 36 77 1048 3 131458
1999-00 122054 98 3749 42 3681 22198 13 30 1155 2 153022
2000-01 97937 75 4634 90 8177 17130 8 25 45950 29 174055
2001-02 91651 - 5140 95 4400 18095 11 34 - 2 119428
2002-03 79710 - 2804 228 4013 19361 - 11 97532 - 203659
2003-04 82893 255 5767 184 10727 26674 64 36 40128 297 167025
2004-05 80800 191 3117 125 6350 42324 75 42 38290 301 171615
2005-06 79404 183 3081 144 - 31638 67 - 841 225 115583
2006-07 78534 96 2882 122 10917 31000 31 624 871 301 125378
2007-08 79975 188 2934 126 8351 31337 68 41 889 226 125378
2008-09 80355 202 2943 99 7950 29810 70 30 1325 226 123010
2009-10 92480 214 2979 1054 31681 28512 67 63 21999 266 179315
2010-11 87385 197 2876 878 32270 28625 75 52 15862 226 168446
2011-12 82142 195 2689 843 30328 30297 72 58 14928 226 161709
2012-13 84802 183 3815 828 30082 29652 62 53 14652 226 164355
2013-14(E) 86498 183 3815 828 30082 29652 62 53 14652 226 166026
E-Estimated
Source: Agriculture Department GNTCD

8/20/2019 Statistical+Abstract+of+Delhi+2014
http://slidepdf.com/reader/full/statisticalabstractofdelhi2014 64/190
45
TABLE 3.4 AVERAGE YIELD OF PRINCIPAL CROPS( kg. per hectare)
Year Wheat Barley Bajra Maize Jowar Paddy Gram Potatoes Sugar cane
1 2 3 4 5 6 7 8 9 10
1985-86 2874 1784 637 619 428 2205 1120 7418 500
1990-91 3580 2231 1715 583 450 3523 1183 7424 554
1995-96 2795 313 1837 714 450 2508 190 - 533
1996-97 3456 276 1036 706 454 3049 144 - 1000
1997-98 911 252 560 659 389 827 143 7384 571
1998-99 3471 272 806 800 448 2218 237 7380 600
1999-00 3643 375 1379 724 432 2828 210 7357 500
2000-01 3518 319 1486 1636 948 2830 160 18476 57130
2001-02 3510 332 1953 1799 510 2825 216 7317 667
2002-03 4014 - 1807 2430 433 3176 - 7319 -
2003-04 4369 2965 2471 1976 1235 4073 1235 23222 74131
2004-05 4322 2686 1825 1530 690 5020 1980 19506 75200
2005-06 4344 2608 1845 1820 - 4215 1430 15867 75000
2006-07 4344 2584 1810 1814 1235 4210 1422 15836 75235
2007-08 4355 2611 1849 1826 945 4230 1446 15875 75333
2008-09 4360 2610 1900 1825 965 4235 1450 15885 75235
2009-10 4340 2810 1875 2158 960 4180 1450 15890 75235
2010-11 4350 2816 1878 2200 965 4250 1450 15890 75235
2011-12 4340 2985 1872 2050 965 4180 1323 17360 75235
2012-13 4360 2828 1872 1950 966 4322 1477 16448 75235
2013-14(E) 5232 2828 1878 1950 966 4322 1477 16448 75235
E-EstmatedSource: Agriculture Department, GNCT of Delhi.

8/20/2019 Statistical+Abstract+of+Delhi+2014
http://slidepdf.com/reader/full/statisticalabstractofdelhi2014 65/190
46
TABLE 3.5AVERAGE PRICE OF SELECTED AGRICULTURAL COMMODITIES
DURING PEAK SEASON(In Rs. per Quintal)
Year/ Wheat Barley Bajra Maize Paddy Gram Potatoes
PeakSeason
(May &June)
( April &May)
(Nov. &Dec.)
(Nov.) (Nov. &Dec.)
(15th Apl to31st May)
(Jan. & Feb.)
1 2 3 4 5 6 7 8
1980-81 157.82 131.39 127.76 138.31 478.75 432.86 85.28
1985-86 186.75 165 190.5 191 831.75 517.75 189
1990-91 271.18 280.41 219.5 228.16 1178 656.2 265
1995-96 422.12 398.75 430.75 407 1634.4 977.29 243.5
1996-97 481.25 408.75 401.25 460 1860 1032.5 303.12
1997-98 641.25 564.37 360 - 2500 1303.75 237.5
1998-99 599.4 515 448.1 576.2 662.5 1314.2 613.8
1999-00 686 545 577 640 641 1389 175
2000-01 780 372 375 529 600 1436 188
2001-02 738 489 382 - - 1782 398
2002-03 762 556 584 - - 1823 279
2003-04 770 700 - - - 1825 -
2004-05 780 890 615 428 2672 2000 380
2005-06 779 689 721 - 3692 1536 409
2006-07 953 886 822 - 4121 2297 483
2007-081187 996 758 - 1300 2687 -
2008-091245 1150 850 - 1350 - 1388
2009-101325 1200 975 - 1800 2400 1300
2010-11
13501200 1000 - 1800 2500 1400
2011-12 1280 1500 1300 1600 1950 3600 1400
2012-13 1450 1500 1450 1600 2200 3800 1500
2013-14(E) 1600 1500 14500 1600 2200 3900 2000
E- EstimatedSource: Agriculture Department, GNCT of Delhi.

8/20/2019 Statistical+Abstract+of+Delhi+2014
http://slidepdf.com/reader/full/statisticalabstractofdelhi2014 66/190
47
TABLE 3.6 SOURCE OF IRRIGATION & IRRIGATED AREA(In Hectares)
Years Canal Tanks Tube-wells
Other Sources
Wells Other NetArea
Irrigated
AreaIrrigated
Under MoreOne Crop
GrossArea
Irrigated
1 2 3 4 5(3+4) 6(1+5) 7 8(6+7)
2004-05 2384 - 15535 4574 20109 22493 5660 28153
2005-06 2277 - 20782 1171 21953 24230 9967 37197
2006-07 2255 - 18381 1156 19537 22742 12243 32196
2007-08 2249 - 20355 1428 21783 24232 7387 31619
2008-09 2245 - 20390 1102 21492 23737 7370 31107
2009-10 2238 - 20140 1065 21205 23442 7310 30752
2010-11 2241 - 20343 1392 21742 23982 8309 32291
2011-12 2225 - 18581 980 19561 21786 7875 29661
2012-13 2225 - 18586 975 19561 21786 7875 29661
2013-14* 2225 - 18586 975 19561 21786 7875 29661
*EstimatedSource: Joint Director Agriculture, Govt. of NCT of Delhi
TABLE 3.7 LIVE STOCK- NUMBER OF CATTLES Year* Cattle Buffaloes Sheep Horses
&Ponies
Pigs Camels Goats Other Live
stock
TotalLive
Stock
Poultry
1 2 3 4 5 6 7 8 9 10 11
1987 56228 218515 5416 1107 26946 141 12147 5992 326492 300379
1992 40701 248660 198 748 11996 23 16225 1127 319678 301050
1997 95660 203054 10674 1131 30534 99 25358 1611 368121 1327885
2003 91589 230552 3377 1353 29463 76 16779 1589 374778 458682
2007 107730 266626 5896 393 21019 10 21176 369 423319 49550
2012(P) 86411 162142 932 2494 76346 157 30470 6815 365967 76312
Live Stock Census is conducted after every 5 years.
Source: Directorate of Animal Husbandry, GNCT of Delhi.

8/20/2019 Statistical+Abstract+of+Delhi+2014
http://slidepdf.com/reader/full/statisticalabstractofdelhi2014 67/190
48
TABLE 3.8 VETERINARY FACILITIES
Year Hospitals Dispensaries Doctors* AnimalsTreated:Indoor/Outdoor
Castrations ArtificialInsemination
Vaccination(H.S &FMD)
PrivateClinics
1 2 3 4 5 6 7 8 9
1995-96 48 24 59 355650 1050 17250 145500 70
1996-97
48 27 60 358000 700 18500 143000 75
1997-98
48 27 59 360000 815 18000 109740 71
1998-99
48 27 61 381529 1247 12558 159130 72
1999-00
48 28 60 368656 952 11697 363000 72
2000-01
48 27 54 363555 1394 13232 358396 72
2001-02
48 27 54 364592 717 12277 462618 72
2002-03
48 27 54 376734 816 12667 248032 72
2003-04
48 27 45 390023 804 14232 300211 72
2004-05
48 27 46 405009 65 17263 926902 72
2005-06
48 27 46 506017 121 16176 581954 72
2006-
07
48 27 41 470879 1150 19028 555439 72
2007-
0847 27 33 485501 343 14606 365625 201
2008-09
48 29 47 462778 247 8397 550139 201
2009-10
45 29 45 406878 80 6611 279079 201
2010-11
48 27 41 483709 275 6476 377985 212
2011-12
46 28 40 415986 45 1719 354133 NA
2012-13
46 28 58 391152 180 13180 594465 NA
2013-14
49 25 58 378359 58 14809 571000 NA
*Doctors under GNCT of Delhi only.
Source: Directorate of Animal Husbandry

8/20/2019 Statistical+Abstract+of+Delhi+2014
http://slidepdf.com/reader/full/statisticalabstractofdelhi2014 68/190
49
TABLE 3.9 ACTIVITIES OF DELHI MILK SCHEME Year No. of
MilkDepots
Procurement of
Milk(Daily
average)(in lakhKgs.)
Distribution of Milk
(dailyaverage)(in lakhlitres)
Sale
Butter
(M.Tonns)
Ghee
(M.ton)
Yoghur
t (‘000)(In 100
ml.Kullar)
Flavored
Milk(in ‘000)
(in 200ml.pouches)
Dahi
(in200gms
kullar ) (in
‘000)
Pane
er (M
tonns)
Chh z
pouch200g(000)
1 2 3 4 5 6 7 8 9 10 11
1985-86 1171 2.3 2.94 89 637 - - - --
1990-91 1335 3.03 4.88 81 388 - - - - -
1995-96 1250 2.03 3.21 38 400 601 - - - -
1996-97 1234 2.43 3.25 50 656 557 - - - -
1997-98 1244 2.51 3.36 66 899 527 - - - -
1998-99 1275 2.58 3.61 73 743 683 - - - -
1999-00 1278 2.84 3.82 42 857 713 81 - - -
2000-01 1559 1.86 2.15 71 761 1030 500 50 - -
2001-02 1565 1.93 2.06 87 667 962 879 169 16 -
2002-03 1500 1.85 1.95 97 795 871 794 218 52 -
2003-04 1452 2.07 2.52 54 291 848 698 285 55 102
2004-05 1474 2.72 3.32 41 576 707 611 308 60147
2005-06 1531 2.82 3.5 34 594 682 514 311 60193
2006-07 1513 2.61 2.99 37 415 441 114 170 34109
2007-08 1564 2.28 3.33 39 505 170 114 95 3586
2008-09 1077 3.18 3.76 36.71 606 217 300 234 38124
2009-10 1120 2.59 3.62 34.69 348 142 202 113 43146
2010-11 1606 2.01 3.24 41.70 458 171 151 83 39160
2011-12 1280 2.37 3.07 50.17 508.33 166 72 109 44.29166
2012-13 1239 2.95 3.00 77.70 693.19 220 142 246 54.77232
2013-14 1056 1.41 2.76 29.77 235.01 286 97 172 57.11 281
Source: Delhi Milk Scheme, Govt. of India, New Delhi.
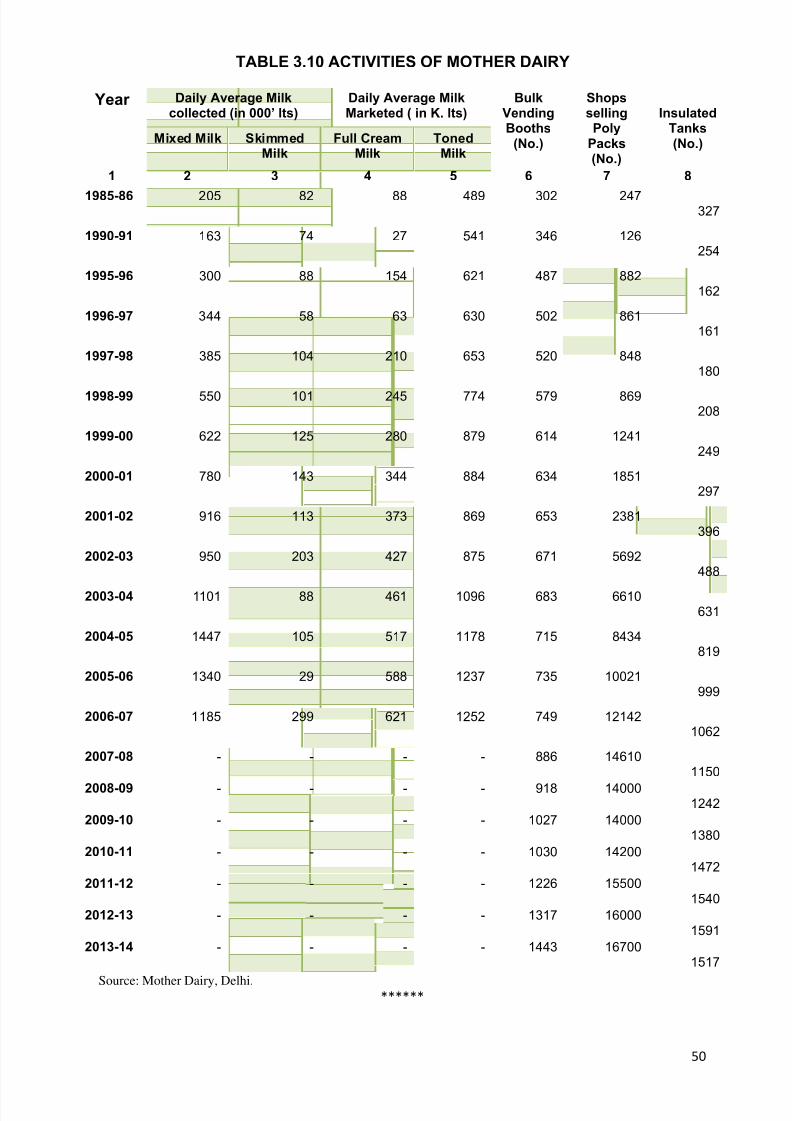
8/20/2019 Statistical+Abstract+of+Delhi+2014
http://slidepdf.com/reader/full/statisticalabstractofdelhi2014 69/190
50
TABLE 3.10 ACTIVITIES OF MOTHER DAIRY
Year Daily Average Milkcollected (in 000’ lts)
Daily Average MilkMarketed ( in K. lts)
BulkVendingBooths
(No.)
ShopssellingPoly
Packs(No.)
InsulatedTanks(No.)Mixed Milk Skimmed
MilkFull Cream
MilkTonedMilk
1 2 3 4 5 6 7 8
1985-86 205 82 88 489 302 247327
1990-91 163 74 27 541 346 126254
1995-96 300 88 154 621 487 882162
1996-97 344 58 63 630 502 861161
1997-98 385 104 210 653 520 848180
1998-99 550 101 245 774 579 869208
1999-00 622 125 280 879 614 1241249
2000-01 780 143 344 884 634 1851297
2001-02 916 113 373 869 653 2381396
2002-03 950 203 427 875 671 5692488
2003-04 1101 88 461 1096 683 6610631
2004-05 1447 105 517 1178 715 8434819
2005-06 1340 29 588 1237 735 10021999
2006-07 1185 299 621 1252 749 121421062
2007-08 - - - - 886 146101150
2008-09 - - - - 918 140001242
2009-10 - - - - 1027 140001380
2010-11 - - - - 1030 142001472
2011-12 - - - - 1226 155001540
2012-13 - - - - 1317 160001591
2013-14 - - - - 1443 167001517
Source: Mother Dairy, Delhi.******

8/20/2019 Statistical+Abstract+of+Delhi+2014
http://slidepdf.com/reader/full/statisticalabstractofdelhi2014 70/190
51
CHAPTER FOUR
PRICE & PRICE INDICES
• Average Wholesale Price of selected Essential Commodities
• Consumer Price Index for Industrial Workers in Delhi
• Average Annual Consumer Price Index Number For Industrial Workers
• Annual Average Consumer Price Index Number for Industrial Workers on some selected Centres of India
• Index number of Wholesale Prices in India

8/20/2019 Statistical+Abstract+of+Delhi+2014
http://slidepdf.com/reader/full/statisticalabstractofdelhi2014 71/190
52
Prices affect all sections of society and as such price Statistics are regarded as
most important economic data reflecting changes in the economy of a country. Their
influence is on a wide range of economic activities and a constant watch on prices
become necessary for the operation and regulation of economic policies as well as for
the purpose of Planning and Policy formulation.
The price statistics are extremely useful in a number of ways as will be clear
from the following points:-
1. Price Statistics are useful to the Govt. and the private employers for adjustingwages and salaries of the employees.
2. Price data are needed to control prices of commodities.
3. Price data are needed in order to evaluate the terms of trade.
4. Price data reveal the inflationary and deflationary pressures and help in taking
suitable corrective action.
5. These are useful in evolving a suitable price policy.
WHOLE SALE PRICES (WPI)
It is a general purpose index to measure the variations in the whole sale price
levels in the state with base year 1999-2000=100. It covers 18 commodities for which
prices are collected from different markets of Delhi. Table no. 4.1 presents average
wholesale prices of the commodities form 1999 to 2013; while Index numbers of
wholesale prices in India with base year 2004-05= 100 present in Table no. 4.5
The Wholesale prices are collected by Agricultural Marketing, Delhi, while indexno. is prepared by Ministry of Commerce Industry.
CHAPTER 4:PRICE & PRICE INDICES

8/20/2019 Statistical+Abstract+of+Delhi+2014
http://slidepdf.com/reader/full/statisticalabstractofdelhi2014 72/190
53
CONSUMER PRICE INDEX (CPI)
The Labour Bureau Shimla has been compiling and releasing regularly the
monthly Consumer Price Index Number for Industrial Workers which is one of the
important economic indicators of inflationary measures in the country. The index
measures the overall changes in the level of average retail price of a fixed set of
goods and services consumed by the target population. The base year of the currentCPI for industrial workers is 2001=100. The source of weights for this index is a family
living survey, which includes the whole centre of Delhi.
The Index Number is compiled for following major groups:-
(1) Food
(2) Pan, Supari, Tobacco and Intoxicants
(3) Fuel and Light
(4) Housing
(5) Clothing, Bedding & Footwear and
(6) Miscellaneous
Table 4.2 contains Group-wise CPI for Industry Workers in Delhi from 1980 to
2013 while table 4.3 presents Group/Sub-group wise CPI for Industrial workers in ratio
of All India & 4 metro cities. Table 4.4 contains Annual average CPI for some selected
centers of India.

8/20/2019 Statistical+Abstract+of+Delhi+2014
http://slidepdf.com/reader/full/statisticalabstractofdelhi2014 73/190
54
TABLE 4.1 AVERAGE WHOLESALE PRICE OF SOME ESSENTIAL
COMMODITIES
(Rs. Per Qtl.)
Year Wheat
(Kalyan)
Rice
(Basmati)
Gram
(Grarra)
Dal
Arhar
(Split)
Dal Moong
(Chhilka)
Dal Urad
(Chhilka)
Sugar Gur Chillies
(Red)
Turmeric
1999 759 3686 1420 2550 2286 2309 1588 1159 4732 3575
2000 772 3514 1482 2371 2456 2891 1593 1138 4358 3404
2001 749 3266 1989 2174 2562 3177 1550 1228 3799 2787
2002 804 3306 1869 2186 2803 2563 1437 1159 3184 2706
2003 842 3671 1651 2160 2651 2036 1415 1006 4047 3531
2004 803 3637 1531 2678 2456 2207 1590 1340 3851 3756
2005 837 3721 1757 2400 2775 2527 1887 1653 3242 3211
2006 1064 3942 2676 2712 4060 4300 2052 1602 5201 3413
2007 1109 4184 2461 3364 3784 3931 1605 1401 5116 3108
2008 1194 4817 2572 3805 3458 3354 1761 1648 4720 4458
2009 1314 4758 2644 4602 4351 3997 2479 2274 5472 5233
2010 1350 5245 2372 6172 6940 6393 3152 2957 7901 14058
2011 1275 5175 3300 6235 5775 4980 3146 3190 9249 5200
2012 1675 5200 4200 6350 5400 4600 3425 2700 4000 5800
2013 1745 5800 3300 6500 6300 4700 3250 2850 8100 7400
Source: Directorate of Agriculture Marketing, Delhi
Contd….

8/20/2019 Statistical+Abstract+of+Delhi+2014
http://slidepdf.com/reader/full/statisticalabstractofdelhi2014 74/190
55
TABLE 4.1 AVERAGE WHOLESALE PRICE OF SOME ESSENTIAL COMMODITIES
Year Mustard Oil
(Kachi
Ghani)
(kg)15 kg
Desi
Ghee
(15 kg )
Vanaspati
(Panghat)
(15 Kg)
Potato
Desi
(40 Kgs)
Onion
Dry
(40 Kgs)
Eggs
(100)
(No.)
Meat
(per
Qtl)
Kerosene
Oil Tin
(18 Lts.)
1999 601 1880 576 183 371 117 7720 --
2000 496 1753 444 225 428 135 7854 --
2001 510 1790 510 438 592 132 8031 --
2002 600 1968 669 486 577 127 8491 --
2003 799 2211 748 338 602 183 9289 --
2004 809 2366 795 428 560 133 10000 --
2005 730 2309 715 405 749 148 10078 --
2006 764 2416 790 571 456 131 11404 --
2007 840 2693 884 685 1107 173 11122 9.11
2008 1047 2880 1061 465 712 150 11271 9.18
2009 1075 3035 794 767 996 187 11768 9.23
2010 974 3456 858 535 1283 231 19266 9.32
2011 1295 4110 1120 546 1015 295 22000 14.83
2012 1350 4250 1110 600 1125 270 23000 14.83
2013 1250 4300 1125 710 1100 240 26000 NA
Source: Directorate of Agriculture Marketing, Delhi

8/20/2019 Statistical+Abstract+of+Delhi+2014
http://slidepdf.com/reader/full/statisticalabstractofdelhi2014 75/190
56
TABLE 4.2 CONSUMER PRICE INDEX FOR INDUSTRIAL WORKERS IN DELHI
(Base year: 2001 = 100)
Year FoodGroup
Pan-supari,Tobacco
and
Intoxicants
Fuel &light
Housing Clothing,Bedding
&
Footwear
Miscellaneous GeneralIndex
1980* 413 463 461 258 461 424 416
1985* 638 705 813 372 643 624 632
1990** 210 250 144 195 159 183 195
1995** 376 389 198 247 281 311 327
1996** 392 423 224 250 303 351 346
1997** 423 478 266 258 327 421 380
998** 496 532 288 413 354 437 447
1999** 484 564 290 614 370 491 480
2000** 503 584 371 637 381 587 514
2001** 509 652 427 662 378 617 529
2002** 516 666 481 682 383 686 550
2003** 542 678 481 704 381 716 570
2004** 565 716 519 781 389 723 598
2005** 576 725 586 1047 405 734 648
2006 117 110 149 120 110 129 122
2007 129 117 149 122 112 135 128
2008 142 124 152 124 116 141 137
2009 158 131 152 132 120 149 147
2010 174 146 163 150 131 160 163
2011 189 171 181 167 155 163 176
2012 206 193 203 175 179 177 191
2013 231 220 220 190 190 186 209
* Base year: 1960 = 100
** Base year: 1982=100
Shifted to new series w.e.f 01.01.2006Source: Labour Bureau, Ministry of Labour, Shimla

8/20/2019 Statistical+Abstract+of+Delhi+2014
http://slidepdf.com/reader/full/statisticalabstractofdelhi2014 76/190
57
TABLE 4.3 AVERAGE ANNUAL CONSUMER GROUP/SUB GROUP PRICE INDEXNUMBER FOR INDUSTRIAL WORKERS (METRO CITIES)
(Base Year:2001=100)
SL.No.
Sub-Group All India Delhi Mumbai Chennai Kolkata
1 FOOD 2012 2013 2012 2013 2012 2013 2012 2013 2012 2013
a) Cereals &Products
197 230 152 172 190 207 171 222 189 209
b) Pulses & Products 241 254 238 249 249 262 212 221 260 290
c) Oils & Fats 264 269 231 224 300 328 246 271 264 263
d) Meat, Fish & Eggs 264 306 268 283 269 314 269 312 255 306
e) Milk & Products 228 247 212 223 226 242 251 251 197 204
f) Condiments &Spices
209 293 181 297 192 280 239 296 223 307
g) Vegetables &Fruits
230 273 230 277 230 273 234 280 237 280
h) Others Food 218 240 208 229 214 241 224 239 191 241
IA.FOOD GROUP 223 254 206 231 226 255 221 254 217 250
IB.Pan, Supari,Tobacco &Intoxicants
215 244 193 220 223 252 248 284 229 273
II. Fuel & Light 208 226 203 220 241 267 168 181 214 233
III. Housing 235 251 175 190 198 220 172 185 185 189
IV. Clothing, Bedding& Footwear
166 179 179 190 178 187 149 166 183 204
MISCELLANEOUS
a) Medical Care 182 200 199 235 190 212 199 203 167 181
b) Education,Recreation &
Amusement
148 154 179 163 216 241 90 106 120 128
c) Transport &Communication 205
226169
180188
213197
209186
237
d) Personal care &Effects
174 187 156 167 165 179 198 215 163 176
e) Others 195 213 189 214 197 211 199 220 182 201
V.MiscellaneousGroup
178 193 177 186 191 212 177 194 158 176
GENERAL INDEX 209 232 191 209 212 237 195 218 198 222
Source: Labour Bureau, Ministry of Labour, Shimla.

8/20/2019 Statistical+Abstract+of+Delhi+2014
http://slidepdf.com/reader/full/statisticalabstractofdelhi2014 77/190
58
TABLE 4.4 ANNUAL AVERAGE CONSUMER PRICE INDEX NUMBER FOR INDUSTRIAL
WORKERS ON SOME SELECTED CENTRES OF INDIA
(Base Year: 2001=100)
Year Mumbai Chennai Ahemdabad Amritsar Kolkata Hyderabad Kanpur Nagpur Delhi All
India
2004* 604 549 507 452 565 512 489 524 598 514
2005* 611 565 519 492 492 532 520 554 648 536
2006** 126 118 120 120 130 116 125 130 122 123
2007 134 124 129 139 132 123 132 140 128 131
2008 144 135 138 149 142 135 141 151 137 142
2009 159 149 151 163 156 152 158 174 147 157
2010 174 161 171 190 172 165 183 203 163 176
2011 192 171 186 208 185 174 200 220 176 192
2012 212 196 206 227 199 190 214 240 191 209
2013 237 218 233 240 222 207 237 265 209 232
* Base Year =1982
**Shifted to new series on base: 2001=100 from 2006
Source: Labour Bureau, Ministry of Labour, Shimla.

8/20/2019 Statistical+Abstract+of+Delhi+2014
http://slidepdf.com/reader/full/statisticalabstractofdelhi2014 78/190
59
TABLE 4.5 INDEX NUMBER OF WHOLESALE PRICES IN INDIA
(Base: 2004-05= 100)
S.No. Group Annual Averages
2008-09 2009-10 2010-11 2011-12 2012-13 2013-14
A. Food Articles 134.8 155.4 179.6 192.7 211.8 238.9
B. Non Food Articles 129.2 136.2 166.6 182.7 201.9 213.2
C. Minerals 186.5 202.9 253.3 320.7 346.9 346.5
II FUEL POWER LIGHT &
LUBRICANTS
135.0 132.1 148.4 169.0 186.5
205.4
A. Food Products 119.9 136.1 141.2 151.2 163.5 168.8
B. Beverages, Tobacco
and Tobacco Products
128.3 136.2 146.2 163.3 175.3
186.0
C. Textiles 103.2 106.7 119.6 128.5 131.4 139.0
D. Wood & Wood Products 130.7 143.3 149.0 161.0 171.0 179.1
E. Paper & Paper Products 116.3 118.9 125.2 132.0 136.6 143.0
F. Leather and Leather
Products
122.3 128.4 127.1 130.0 134.2
143.1
G. Rubber & PlasticProducts 117.3 118.2 126.1 133.6 137.5 146.0
H. Chemical & Chemical
Products
118.1 117.8 124.0 134.7 143.6
148.9
I. Non- Metallic Mineral
Products
131.7 140.9 144.6 152.9 163.3
166.2
J. Basic Metals Alloys &
Metals Products
138.0 129.5 140.7 156.3 166.1
164.5
K. Machinery & Machine
Tools
117.4 118.0 121.3 125.1 128.4
131.5
L. Transport Equipment &
Parts
113.3 p116.8 120.3 124.6 129.8
134.5
General Index
( All Commodities)
126.0 130.8 143.3 156.1 167.6 177.6
Source: Ministry of Commerce & Industry.
******

8/20/2019 Statistical+Abstract+of+Delhi+2014
http://slidepdf.com/reader/full/statisticalabstractofdelhi2014 79/190
60
CHAPTER FIVE
INFRASTRUCTURE
• Electricity Generation• Electricity Consumption
• No. of electricity consumers category wise
• No. of water consumers category wise
• Length of roads
• No. of Registered Motor Vehicles
• Percentage distribution of registered vehicle to the total
• Working of Delhi transport corporation
• Post offices and Telephone connections

8/20/2019 Statistical+Abstract+of+Delhi+2014
http://slidepdf.com/reader/full/statisticalabstractofdelhi2014 80/190
61
Infrastructure is basic physical and organizational structures needed for the
operation of a society or enterprise, or the services and facilities necessary for an
economy to function. It can be generally defined as the set of interconnected structural
elements that provide framework supporting an entire structure of development. It is
an important term for judging a states development.
The term typically refers to the technical structures that support a society, such
as roads, water supply, sewers, electrical grids, telecommunications, and so forth, and
can be defined as the physical components of interrelated systems providing
commodities and services essential to enable, sustain, or enhance societal living
conditions.
ELECTRICITY
This Section contains the data regarding generation and consumption of
electricity in the state. Given tables pertain to Electricity Generation, Electricity
Consumption and number of Electricity Consumers category wise. Data is provided
by Delhi Electricity Regulatory Commission (DERC).
WATER
This section includes the table regarding no. of water consumers category wise
(Domestic and Commercial / Industrial), no. of metered and unmetered connections
year wise. Source of information is Delhi Jal Board.
ROADS & TRANSPORT
The data contained in the table relates to the roads maintained and constructed
by MCD, NDMC, Delhi Cantonment Board and Public work Department (Includes
National Highways and Other roads) which is provided by Local Bodies & PWD Deptt.
Data on Motor Vehicles and road accidents is provided by office of the Commissioner
of Transport and Delhi Police respectively. The information on road transport (no. of
buses, buses on road, Daily average passengers in lakhs, Inter state bus routes,
workshops, depots) has been given by the Delhi Transport Corporation.
CHAPTER 5:INFRASTRUCTURE
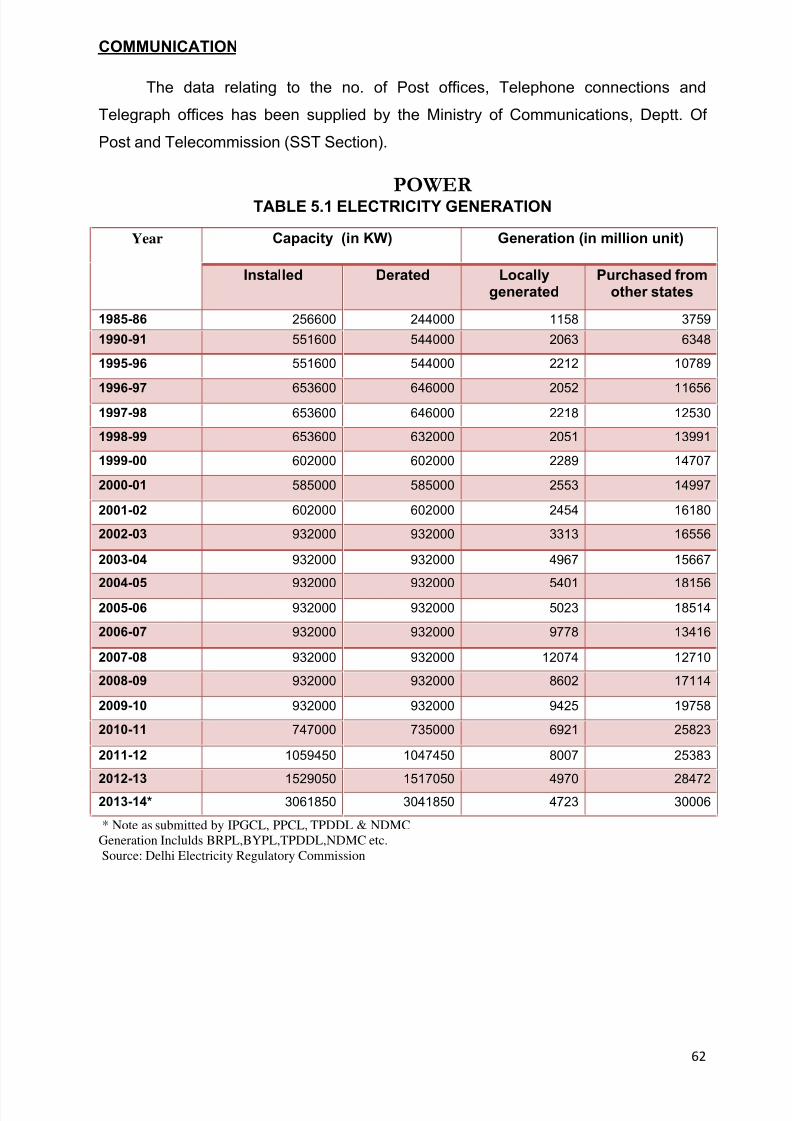
8/20/2019 Statistical+Abstract+of+Delhi+2014
http://slidepdf.com/reader/full/statisticalabstractofdelhi2014 81/190
62
COMMUNICATION
The data relating to the no. of Post offices, Telephone connections and
Telegraph offices has been supplied by the Ministry of Communications, Deptt. Of
Post and Telecommission (SST Section).
POWER TABLE 5.1 ELECTRICITY GENERATION
Year Capacity (in KW) Generation (in million unit)
Installed Derated Locallygenerated
Purchased fromother states
1985-86 256600 244000 1158 3759
1990-91 551600 544000 2063 6348
1995-96 551600 544000 2212 10789
1996-97 653600 646000 2052 116561997-98 653600 646000 2218 12530
1998-99 653600 632000 2051 13991
1999-00 602000 602000 2289 14707
2000-01 585000 585000 2553 14997
2001-02 602000 602000 2454 16180
2002-03 932000 932000 3313 16556
2003-04 932000 932000 4967 15667
2004-05 932000 932000 5401 181562005-06 932000 932000 5023 18514
2006-07 932000 932000 9778 13416
2007-08 932000 932000 12074 12710
2008-09 932000 932000 8602 17114
2009-10 932000 932000 9425 19758
2010-11 747000 735000 6921 25823
2011-12 1059450 1047450 8007 25383
2012-13 1529050 1517050 4970 28472
2013-14* 3061850 3041850 4723 30006
* Note as submitted by IPGCL, PPCL, TPDDL & NDMC
Generation Inclulds BRPL,BYPL,TPDDL,NDMC etc.
Source: Delhi Electricity Regulatory Commission
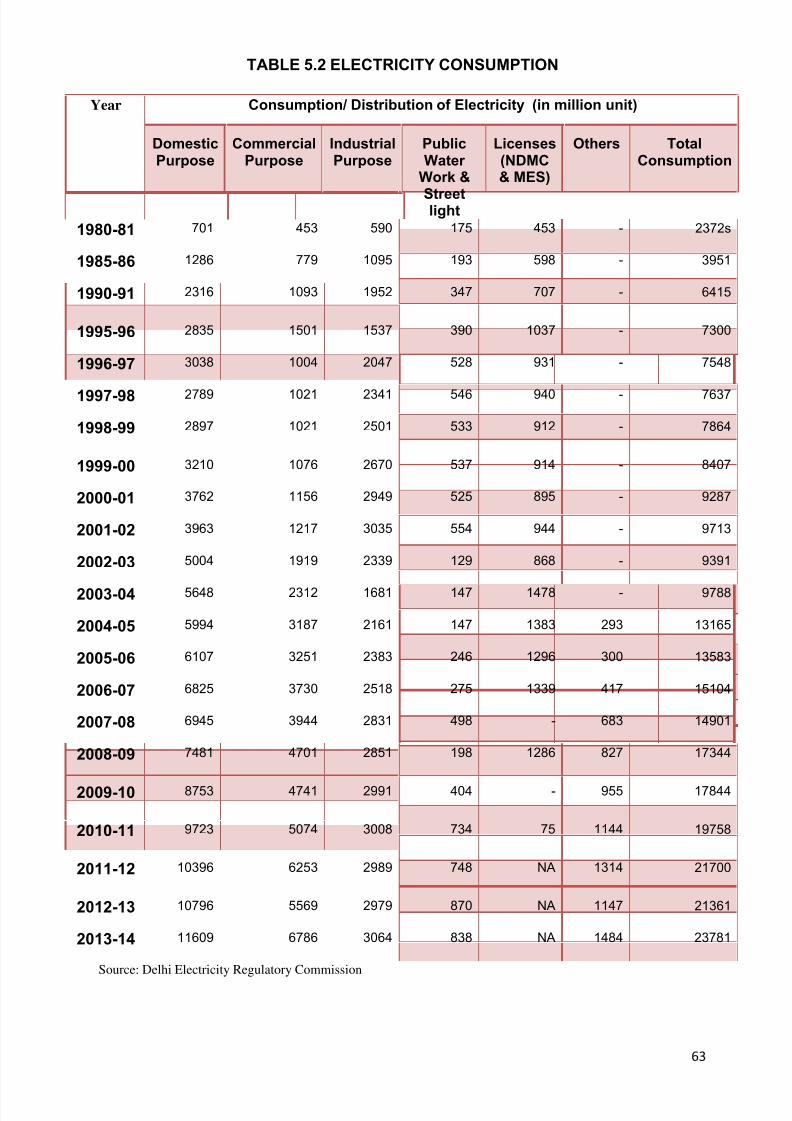
8/20/2019 Statistical+Abstract+of+Delhi+2014
http://slidepdf.com/reader/full/statisticalabstractofdelhi2014 82/190
63
TABLE 5.2 ELECTRICITY CONSUMPTION
Year Consumption/ Distribution of Electricity (in million unit)
DomesticPurpose
CommercialPurpose
IndustrialPurpose
PublicWater
Work &
Streetlight
Licenses(NDMC& MES)
Others TotalConsumption
1980-81 701 453 590 175 453 - 2372s
1985-86 1286 779 1095 193 598 - 3951
1990-91 2316 1093 1952 347 707 - 6415
1995-96 2835 1501 1537 390 1037 - 7300
1996-97 3038 1004 2047 528 931 - 7548
1997-98 2789 1021 2341 546 940 - 7637
1998-99 2897 1021 2501 533 912 - 7864
1999-00 3210 1076 2670 537 914 - 8407
2000-01 3762 1156 2949 525 895 - 9287
2001-02 3963 1217 3035 554 944 - 9713
2002-03 5004 1919 2339 129 868 - 9391
2003-04 5648 2312 1681 147 1478 - 9788
2004-05 5994 3187 2161 147 1383 293 13165
2005-06 6107 3251 2383 246 1296 300 13583
2006-07 6825 3730 2518 275 1339 417 15104
2007-08 6945 3944 2831 498 - 683 14901
2008-09 7481 4701 2851 198 1286 827 17344
2009-10 8753 4741 2991 404 - 955 17844
2010-11 9723 5074 3008 734 75 1144 19758
2011-12 10396 6253 2989 748 NA 1314 21700
2012-13 10796 5569 2979 870 NA 1147 21361
2013-14 11609 6786 3064 838 NA 1484 23781
Source: Delhi Electricity Regulatory Commission

8/20/2019 Statistical+Abstract+of+Delhi+2014
http://slidepdf.com/reader/full/statisticalabstractofdelhi2014 83/190
64
TABLE 5. 3 NO. OF ELECTRICITY CONSUMERS CATEGORY WISE
Year DomesticConsumers
(lights &fans,heat &
power)
CommercialConsumers
(lights &fans
(HT),heat &power)
Industrial consumers Others(Agricul
ture)
TotalConsumers
LowVoltage
HighVoltage
PublicWater
Work &Streetlightin
g
Licenses
(NDMC &
MES)
1980-81 806812 162241 41165 205 1073 2 - 1011498
1985-86 1088360 182376 59055 283 1589 2 - 1331665
1990-91 1420214 201725 79023 362 1898 2 - 1703224
1995-96 1666581 230731 94088 387 2213 2 - 1994002
1996-97 1713474 251501 96191 732 2217 2 - 2064117
1997-98 1760354 269400 97023 831 2217 2 - 2129827
1998-99 1822793 290974 98249 852 2269 2 - 2215139
1999-00 1922487 337813 104416 916 2272 2 - 2367906
2000-01 2021666 415117 108509 924 2382 2 - 2548600
2001-02 2094171 437323 109609 934 2585 2 - 2644624
2002-03 2075657 385419 81170 868 185 2 21811 2565112
2003-04 2197166 388367 80720 380 184 2 21651 2688470
2004-05 2163779 525253 81274 639 209 2 15440 2786596
2005-06 2182101 546858 84525 849 435 5 23036 2837809
2006-07 2304111 488574 64480 - 1234 5 10095 2868499
2007-08 2627975 610896 91466 - 3418 5 13780 3347540
2008-09 2755225 591024 70101 - 4100 - 8470 3428920
2009-10 3000383 656218 63531 - 264 - 56371 3776767
2010-11 3258647 704373 67549 - 561 - 16065 4047195
2011-12 3464611* 764627 59432 - 635 - 11565 4300861
2012-13 3616611 775001 57267 - 4495 - 10598 4463971
2013-14 3954019 847980 56180 - 6207 - 19933** 4897361
*This includes 1698 no. of consumers pertaining to JJ clusters
**This includes Agriculture,Mushroom,DIAL,DMRC,Advertisement,Railway Traction,Self consumption,Temporary connection etc.
Source: Delhi Electricity Regulatory Commission

8/20/2019 Statistical+Abstract+of+Delhi+2014
http://slidepdf.com/reader/full/statisticalabstractofdelhi2014 84/190
65
TABLE 5.4 NO. OF WATER CONSUMERS CATEGORY WISE
Year No. of MeteredConnections
No. of UnmeteredConnection
s
Water Consumption Galloons(in lakhs K Litres)
Per CapitaConsumption of Water (Galloons
per day)Domestic Commercial/I
ndustrial
1980-81 355157 13143 1542 411 32.07
1985-86 501174 10054 2524 513 40.22
1990-91 678461 226960 4013 527 49.03
1995-96 853807 315687 4114 627 43.76
1996-97 915974 284917 8377 1478 51
1997-98 1915170 290217 8120 1408 51
1998-99 958432 297182 8451 1491 51
1999-00 997057 300102 8451 1491 51
2000-01 1034724 312000 9295 1475 50
2001-02 1102326 313112 9296 1640 40
2002-03 1139373 322460 9624 1312 39.5
2003-04 1173693 329278 9770 1332 39
2004-05 1216542 335052 9842 1343 48.2
2005-06 1256040 342867 9770 1332 47.5
2006-07 1296094 340651 10976 955 48
2007-08 1329953 345651 11102 1160 48
2008-09 1338944 373354 11997 1260 50
2009-10 1427768 357256 12413* 1258* 50
2010-11 1480441 314774 13754* - 50
2011-12 1540968 399930 12789* 1296* 50
2012-13 1542825 438791 13837* 49
2013-14 1602099 469705 13837* 48
*Including wastage/ water losses
Source: Delhi Jal Board, Jhandewalan, New Delhi.
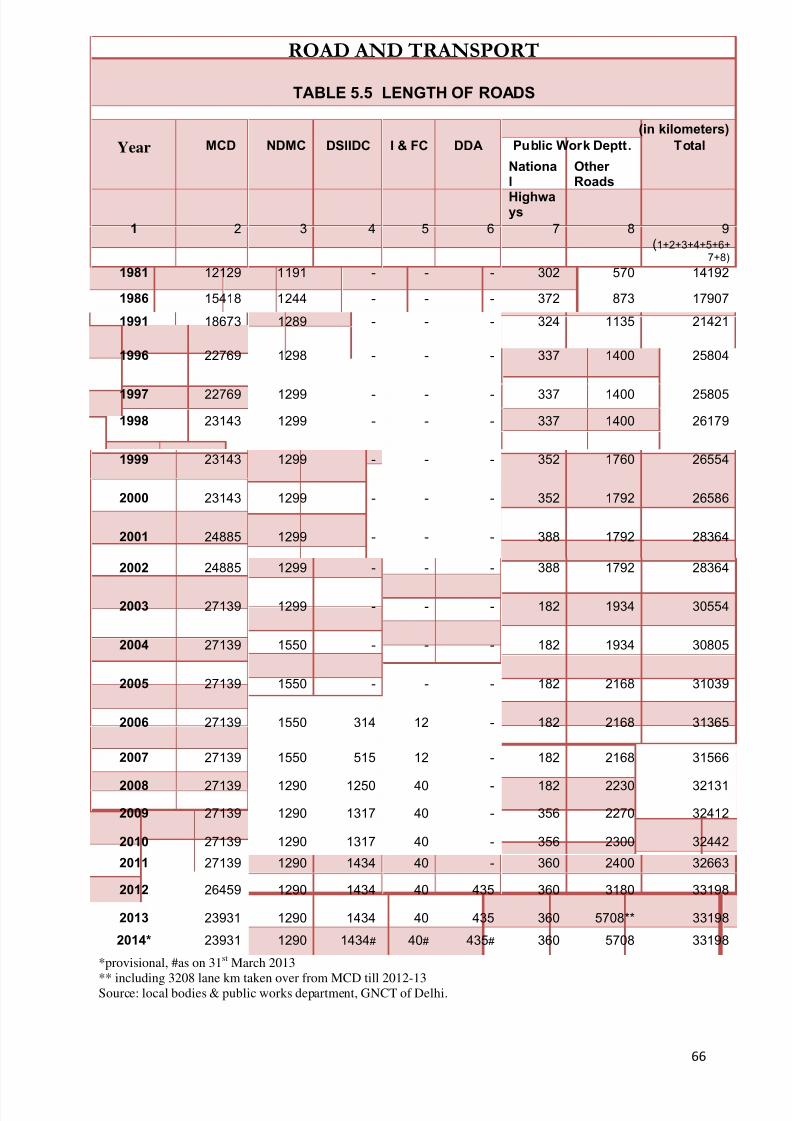
8/20/2019 Statistical+Abstract+of+Delhi+2014
http://slidepdf.com/reader/full/statisticalabstractofdelhi2014 85/190
66
ROAD AND TRANSPORT
TABLE 5.5 LENGTH OF ROADS
(in kilometers)
Year MCD NDMC DSIIDC I & FC DDA Public Work Deptt. Total
National
Highways
Other Roads
1 2 3 4 5 6 7 8 9(1+2+3+4+5+6+
7+8)
1981 12129 1191 - - - 302 570 14192
1986 15418 1244 - - - 372 873 17907
1991 18673 1289 - - - 324 1135 21421
1996 22769 1298 - - - 337 1400 25804
1997 22769 1299 - - - 337 1400 25805
1998 23143 1299 - - - 337 1400 26179
1999 23143 1299 - - - 352 1760 26554
2000 23143 1299 - - - 352 1792 26586
2001 24885 1299 - - - 388 1792 28364
2002 24885 1299 - - - 388 1792 28364
2003 27139 1299 - - - 182 1934 30554
2004 27139 1550 - - - 182 1934 30805
2005 27139 1550 - - - 182 2168 31039
2006 27139 1550 314 12 - 182 2168 31365
2007 27139 1550 515 12 - 182 2168 31566
2008 27139 1290 1250 40 - 182 2230 32131
2009 27139 1290 1317 40 - 356 2270 32412
2010 27139 1290 1317 40 - 356 2300 32442
2011 27139 1290 1434 40 - 360 2400 32663
2012 26459 1290 1434 40 435 360 3180 33198
2013 23931 1290 1434 40 435 360 5708** 33198
2014* 23931 1290 1434# 40# 435# 360 5708 33198
*provisional, #as on 31st March 2013
** including 3208 lane km taken over from MCD till 2012-13Source: local bodies & public works department, GNCT of Delhi.

8/20/2019 Statistical+Abstract+of+Delhi+2014
http://slidepdf.com/reader/full/statisticalabstractofdelhi2014 86/190
67
TABLE 5.6 NO. OF REGISTERED MOTOR VEHICLES
Year Personal Vehicles Commercial Vehicles Total
Cars &Jeeps
M. Cycles/Scooters
Autorickshaw
Taxis Buses* GoodVehicles
1980-81 117213 334389 19947 6255 7912 35741 521457
1985-86 174890 637267 30354 8654 13815 58925 923905
1990-91 383610 1191186 62007 10026 18651 99078 17645581995-96 617585 1707528 77884 13384 27473 131877 2575731
1996-97 705923 1876053 80210 15015 29572 140922 2847695
1997-98 765470 1991710 80210 16654 32333 146668 3033045
1998-99 818962 2101876 86985 17136 35254 150243 3210456
1999-00 869820 2184581 86985 17762 37733 156157 3353038
2000-01 920723 2230534 86985 18362 41483 158492 3456579
2001-02 968894 2265955 86985 20628 47578 161650 3551690
2002-03 1214693 2517788 49538 9936 18731 129723 3940409
2003-04 1314672 2665750 52905 11495 21962 135671 4202455
2004-05 1431638 2844004 53656 13511 24235 140982 4508026
2005-06 1466641 3062536 73644 20693 43500 141996 4809010
2006-07 1589872 3299838 74189 24958 46581 149972 5185410
2007-08 1729695 3578199 75297 30704 52763* 160726 5627384
2008-09 1859370 3797943 83948 40072 55148 175250 6011731
2009-10 2013680 4055229 86482 45240 58047* 193205 6451883
2010-11 2173323 4342403 88181 57958 61471 209370 6932706
2011-12 2343113 4644146 88197 69780 64033 228886 7438155
2012-13 2474087 4962507 86838 70335 39694 140942 7774403
2013-14 2629343 5297697 91840 78686 40947 154654 8293167
TABLE 5.7 PERCENTAGE DISTRIBUTION OF REGISTERED VEHICLES TO THE TOTAL
Year Personal Vehicles Commercial Vehicles Total
Cars &Jeeps
M. Cycles/Scooters
Autorickshaw
Taxis Buses* GoodVehicles
1980-81 22.48 64.13 3.83 1.20 1.52 6.85 100.00
1990-91 21.74 67.51 3.51 0.57 1.06 5.61 100.00
2000-01 26.64 64.53 2.52 0.53 1.20 4.59 100.00
2006-07 30.66 63.64 1.43 0.48 0.90 2.89 100.00
2007-08 30.73 63.58 1.33 0.54 0.93 2.85 100.00
2008-09 30.92 63.17 1.40 0.66 0.91 2.91 100.00
2009-10 31.21 62.85 1.34 0.70 0.89 2.99 100.00
2010-11 31.34 62.64 1.27 0.84 0.89 3.02 100.00
2011-12 31.50 62.43 1.19 0.94 0.86 3.08 100.00
2012-13 31.83 63.83 1.11 0.90 0.51 1.81 100.00
2013-14 31.70 63.88 1.11 0.95 0.49 1.86 100.00
* Ambulance & other passenger vehicles are included.
Source: Transport Department, GNCT of Delhi.

8/20/2019 Statistical+Abstract+of+Delhi+2014
http://slidepdf.com/reader/full/statisticalabstractofdelhi2014 87/190
68
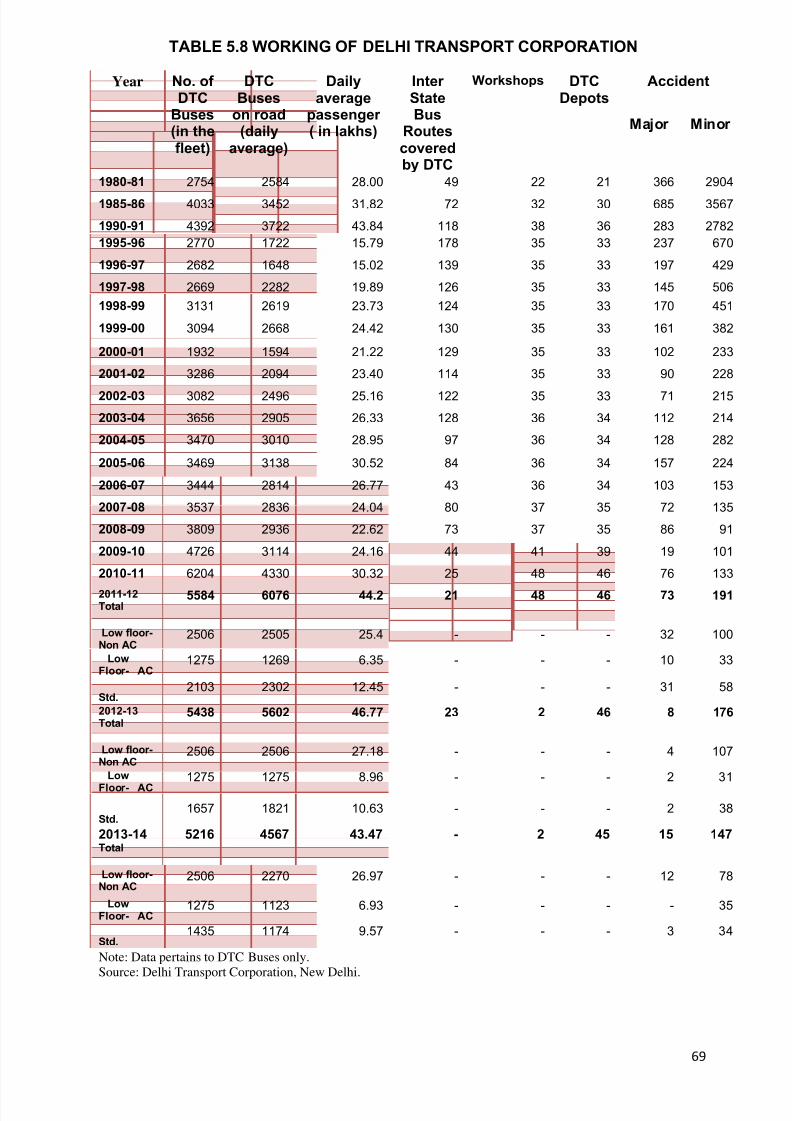
8/20/2019 Statistical+Abstract+of+Delhi+2014
http://slidepdf.com/reader/full/statisticalabstractofdelhi2014 88/190
69
TABLE 5.8 WORKING OF DELHI TRANSPORT CORPORATION
Year No. of DTC
Buses(in thefleet)
DTCBuses
on road(daily
average)
Dailyaverage
passenger ( in lakhs)
Inter StateBus
Routescoveredby DTC
Workshops DTCDepots
Accident
Major Minor
1980-81 2754 2584 28.00 49 22 21 366 2904
1985-86 4033 3452 31.82 72 32 30 685 3567
1990-91 4392 3722 43.84 118 38 36 283 2782
1995-96 2770 1722 15.79 178 35 33 237 670
1996-97 2682 1648 15.02 139 35 33 197 429
1997-98 2669 2282 19.89 126 35 33 145 506
1998-99 3131 2619 23.73 124 35 33 170 451
1999-00 3094 2668 24.42 130 35 33 161 382
2000-01 1932 1594 21.22 129 35 33 102 233
2001-02 3286 2094 23.40 114 35 33 90 228
2002-03 3082 2496 25.16 122 35 33 71 215
2003-04 3656 2905 26.33 128 36 34 112 214
2004-05 3470 3010 28.95 97 36 34 128 282
2005-06 3469 3138 30.52 84 36 34 157 224
2006-07 3444 2814 26.77 43 36 34 103 153
2007-08 3537 2836 24.04 80 37 35 72 135
2008-09 3809 2936 22.62 73 37 35 86 91
2009-10 4726 3114 24.16 44 41 39 19 101
2010-11 6204 4330 30.32 25 48 46 76 133
2011-12Total
5584 6076 44.2 21 48 46 73 191
Low floor-Non AC
2506 2505 25.4 - - - 32 100
LowFloor- AC
1275 1269 6.35 - - - 10 33
Std.2103 2302 12.45 - - - 31 58
2012-13Total
5438 5602 46.77 23 2 46 8 176
Low floor-Non AC
2506 2506 27.18 - - - 4 107
Low
Floor- AC1275 1275 8.96 - - - 2 31
Std.1657 1821 10.63 - - - 2 38
2013-14Total
5216 4567 43.47 - 2 45 15 147
Low floor-Non AC
2506 2270 26.97 - - - 12 78
LowFloor- AC
1275 1123 6.93 - - - - 35
Std.1435 1174 9.57 - - - 3 34
Note: Data pertains to DTC Buses only.Source: Delhi Transport Corporation, New Delhi.
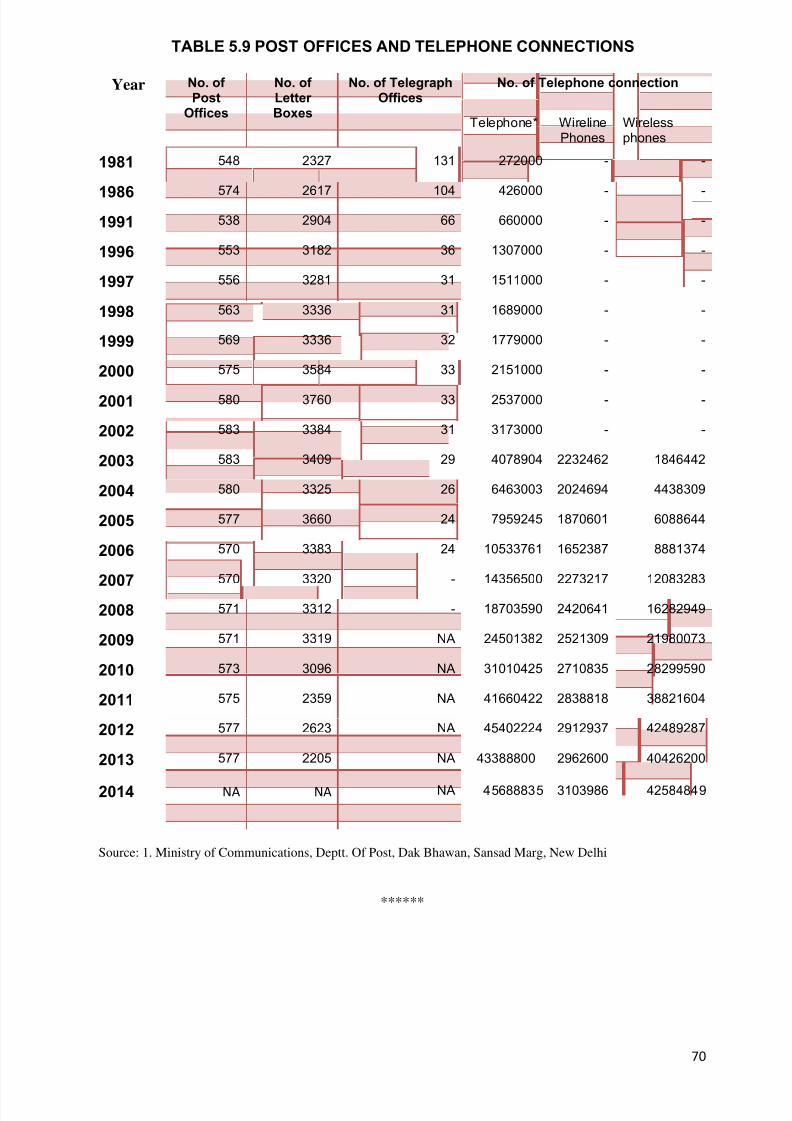
8/20/2019 Statistical+Abstract+of+Delhi+2014
http://slidepdf.com/reader/full/statisticalabstractofdelhi2014 89/190
70
TABLE 5.9 POST OFFICES AND TELEPHONE CONNECTIONS
Year No. of Post
Offices
No. of Letter Boxes
No. of TelegraphOffices
No. of Telephone connection
Telephone* WirelinePhones
Wirelessphones
1981 548 2327 131 272000 - -
1986 574 2617 104 426000 - -
1991 538 2904 66 660000 - -
1996 553 3182 36 1307000 - -
1997 556 3281 31 1511000 - -
1998 563 3336 31 1689000 - -
1999 569 3336 32 1779000 - -
2000 575 3584 33 2151000 - -
2001 580 3760 33 2537000 - -
2002 583 3384 31 3173000 - -
2003 583 3409 29 4078904 2232462 1846442
2004 580 3325 26 6463003 2024694 4438309
2005 577 3660 24 7959245 1870601 6088644
2006 570 3383 24 10533761 1652387 8881374
2007 570 3320 - 14356500 2273217 12083283
2008 571 3312 - 18703590 2420641 16282949
2009 571 3319 NA 24501382 2521309 21980073
2010 573 3096 NA 31010425 2710835 28299590
2011 575 2359 NA 41660422 2838818 38821604
2012 577 2623 NA 45402224 2912937 42489287
2013 577 2205 NA 43388800 2962600 40426200
2014 NA NA NA 45688835 3103986 42584849
Source: 1. Ministry of Communications, Deptt. Of Post, Dak Bhawan, Sansad Marg, New Delhi
******

8/20/2019 Statistical+Abstract+of+Delhi+2014
http://slidepdf.com/reader/full/statisticalabstractofdelhi2014 90/190
71
CHAPTER SIX
TRADE, COMMERCE & INDUSTRIES
• Distribution of registered companies and their brief features
• Major activity wise distribution of newly registered companies• Annual survey of Industries
• Index. No. of Industrial Production
• Registered Dealers & Receipts under Sales Tax Act in Delhi
• District wise distribution of Establishment in Delhi
• Distribution of Establishment by major activitygroup – Economic Census
• Unorganized Manufacturing Activities in Delhi
• Un – organized Manufacturing Enterprises & Employment
• Unorganized Service Sector Employment• Unorganized Service Sector Enterprise

8/20/2019 Statistical+Abstract+of+Delhi+2014
http://slidepdf.com/reader/full/statisticalabstractofdelhi2014 91/190
72
Trade refers to the act or process of buying, selling, or exchanging
commodities, at either wholesale or retail, within a country or between states.
Commerce is the whole system of an economy that constitutes an environment
for business. This is in contrast with business, the value-creating activities of an
organization for profit. The system includes legal, economic, political, social, cultural,
and technological systems that are in operation in any country. Thus, commerce is a
system or an environment that affects the business prospects of an economy or a
nation-state. We can also define it as a second component of business which includes
all activities, functions and institutions involved in transferring goods from producers to
consumer.
Industry is the production of an economic good or service within an economy.
Industry is often classified into three sectors: primary or extractive, secondary or
manufacturing, and tertiary or services.
Industries can be classified on the basis of raw materials, size and ownership.
• Raw Materials: Industries may be agriculture based, Marine based, Mineral
based, Forest based.
• Size: It refers to the amount of capital invested, number of people employed
and the volume of production.• Ownership: Industries can be classified into private sector, state owned or
public sector, joint sector and co-operative sector
In this chapter, an analysis of the subject has been attempted with the help of
statistical presentation of the elements constituting the Trade, Commerce & Industries.
CHAPTER 6:TRADE, COMMERCE & INDUSRIES

8/20/2019 Statistical+Abstract+of+Delhi+2014
http://slidepdf.com/reader/full/statisticalabstractofdelhi2014 92/190
73
JOINT STOCK COMPANIES
Data regarding Companies are collected under the companies act, 1956 by
Deptt. Of Company Affairs, Government of India. This section includes the information
about no. of companies and their capital activity wise distribution of newly registered
companies are also presented in this section. Data is provided by Deptt. Of Company
Affairs, Govt. Of India.
INDUSTRIES & TAX
The data regarding No. of registered factories, their Productive Capital (Fixed
and Working), total No. of Employee and their emolument is present in table 6.3 while
table 6.4 includes Index number of industrial Production (General Index,
Manufacturing and Electricity). Data is provided by DES relates to the period from
1980-81 till now.
Information regarding total number of Registered dealers under Local and
Central Act, Receipts of Local sales tax and Central sales Tax is given in Table No.
6.5 and the source of information is Trade & Taxes Deptt. Of GNCTD.
ECONOMIC CENSUS
The Fifth Economic Census in respect of NCT of Delhi was conducted under the
ages of Directorate of Economics & Statistics. Economics Census is the complete
enumeration of entrepreneurial activities operating in the geographical boundaries of
State/ Country at a given point of time to come out with the official count of
establishments and their characteristics. Fifth& Sixth Economic Census briefly
includes all types of entrepreneurial activities in the field of agriculture (except crop
production and plantation) as well as non- agriculture. Entrepreneurial activities mean,
all those economic activities dealing with the production or distribution of
goods/services not solely for the purpose of own consumption. The result of 6th
Economic Census are shown in table 6.6 while table 6.8 presents the NSS 62nd
Survey Results of un-organized Manufacturing Activities. This data is provided by
Directorate of Economics & Statistics, Govt. of NCT of Delhi.

8/20/2019 Statistical+Abstract+of+Delhi+2014
http://slidepdf.com/reader/full/statisticalabstractofdelhi2014 93/190
74
TABLE 6.1 DISTRIBUTION OF REGISTERED COMPANIES
R- Revised, P-Provisional
@ Paid up Capital data for companies (nos. given in Parenthesis as compiled from MCA-21
Source: Ministry of Corporate Affairs, Govt. of India.
Year Companies Working Newly registeredCompanies
Company ceased to work
No. Paid up capital(Rs. In Crores)
No. Authorizedcapital
(Rs. In Crores)
No. Paid upcapital(Rs. InCrores)
1980-81 8021 6287.00 1144 113.41 30 0.34
1985-86 19587 12454.00 3026 1385.28 12 0.04
1990-91 3934 21733.20 3978 1102.80 1 -
1995-96 73154 43075.80 10669 4659.10 14 2.37
1996-97 81640 48685.40 8514 3138.07 11 0.31
1997-98 88304 58753.40 6687 1622.91 3 -
1998-99 94231 66917.10 6004 2864.07 61 0.31
1999-00 99944 73945.10 5747 2690.55 6 -
2000-01 105182 87431.05 5256 12992.71 1 0.78
2001-02 109429 92513.77 4419 1110.86 121 0.03
2002-03 113965 107002.01 4793 859.64 143 0.04
2003-04 119706 123215.63 5836 1226.12 44 0.00
2004-05 128561 192695.38 8922 1446.82 26 0.00
2005-06 141561 132261.00(92870)@
13372 6243.29 316 0.95
2006-07 139976 136695(124151)@
13060 25498.33 4114 19.53
2007-08 152740 198149(13055)@
14473 17724.55 15815 54.91
2008-09 157194 197353(144094)@
12261 7704.06 7 1.33
2009-10167329 262257
(116583)R@11740 4108.39 73 3.13
2010-11148680
262256.58 15544 7551.44 686 21.83
2011-12 159299 291309.34 16722 8477.3 3719 257.35
2012-13 173336 335949.25 16055 14670.04 1229 127.35

8/20/2019 Statistical+Abstract+of+Delhi+2014
http://slidepdf.com/reader/full/statisticalabstractofdelhi2014 94/190
75
TABLE 6.2 Industrial Classification of New Registration of Companies Limited
by share in Delhi
Year Agriculture & AlliedActivities
Mining & Quarrying Electricity, Gas &Water
Processing & Manf.Food stuffs, textiles,
water & woodproducts
No. of Companies
AuthorizedCapital (Rs. In
lakhs)
No. of Companies
AuthorizedCapital
(Rs. Inlakhs)
No. of Companies
AuthorizedCapital
(Rs. Inlakhs)
No. of Companies
AuthorizedCapital
(Rs. Inlakhs)
1980-81
14 130.9 7 320 - - 320 3.2
1985-86
54 672 1 925 - - 925 9.25
1990-91
56 1131 22 1064 7 1065 1064 10.64
1995-96
309 6207 28 2156 36 4409 2156 24303
1996-97
275 4725 14 1800 - - 1800 14765
1997-
98
285 5184 18 1741 - - 1741 23373
1998-99
103 3674 15 1337 - - 1337 11879
1999-00
42 854 7 1440 8 80095 1440 23561
2000-01
7 15 10 1376 23 36856 1376 4110
2001-02
24 379 16 1153 18 1220 1153 4455
2002-03
27 113 14 1343 22 1525 1343 22185
2003-04
56 671 19 1529 30 1001 1529 9096
2004-05
61 336 38 1547 49 1129 1547 21630
2005-06
73 1584 23 1889 74 928134 1889 267924
2006-07
97 4891 85 1389 125 865352 1389 60705
2007-08
187 4672 150 1533 203 164693 1533 41849
2008-09
140 3192 94 1408 221 147598 1408 58577
2009-10
111 13428 50 1326 188 5514 1326 18154
2010-11
150 2623 104 1656 389 70935 1656 26166
2011-12
215 16113 121 2448 238 228318 1069 62062
2012-13
163 2064 66 1223 225 53725 968 31657
2013-14
143 1709 71 51613 190 64155 993 25388
Contd…..

8/20/2019 Statistical+Abstract+of+Delhi+2014
http://slidepdf.com/reader/full/statisticalabstractofdelhi2014 95/190
76
TABLE 6.2 Industrial Classification of New Registration of Companies Limited
by share in Delhi
Year Processing & Manf.Metal, chemicals &products thereof
Other processing &Manf.
Construction & Utilities Trade & Finance
No. of Companies
AuthorizedCapital
(Rs. Inlakhs)
No. of Companies
AuthorizedCapital
(Rs. Inlakhs)
No. of Companies
AuthorizedCapital
(Rs. Inlakhs)
No. of Companies
Authorized
Capital(Rs. Inlakhs)
1980-81
320 3780 142 1568 67 1210 323 2243
1985-86
925 101305 298 4913 234 3946 974 20459
1990-91
1064 17347 7 1065 116 1038 731 37105
1995-96
2156 88979 36 4409 291 106857 2217 74073
1996-97
1800 58856 48 4170 552 9893 1601 31149
1997-98
1741 46365 30 2528 646 9475 1112 18170
1998-99
1337 60042 23 6154 367 12385 1269 20711
1999-00
1440 49648 8 80095 180 4168 1783 59025
2000-01
1376 142193 23 36856 194 26378 1032 20265
2001-02
1153 11749 18 1220 279 6164 1146 16468
2002-03
1343 13110 22 1525 408 9125 1096 8311
2003-04
1529 35766 30 1001 685 18872 1218 14787
2004-05
1547 30432 49 1129 1280 25581 1658 21138
2005-06
1889 51764 92 7337 3078 40586 1744 28529
2006-07
1389 643760 125 865352 2324 230550 1149 1175634
2007-08
1533 191085 203 164693 3754 512110 1643 118146
2008-
09
1408 74792 221 147598 2126 33251 2063 51541
2009-10
1326 99461 188 5514 979 23241 1423 38445
2010-11
1656 75483 389 70935 1538 35450 1930 32940
2011-12
1307 112322 189 18593 1590 225077 2049 109022
2012-13
1192 83620 180 3366 1438 22588 2295 30623
2013-14
1054 43557 178 5726 1235 16553 2066 51681
Contd….

8/20/2019 Statistical+Abstract+of+Delhi+2014
http://slidepdf.com/reader/full/statisticalabstractofdelhi2014 96/190
77
TABLE 6.2 Industrial Classification of New Registration of Companies Limited
by share in Delhi
Year Transport, Storage &Communication
Finance,Insurance,real estate business &services
Social,Personal & other Services
Total
No. of Compani
es
AuthorizedCapital(Rs. In
lakhs)
No. of Companies
Authorized Capital(Rs. Inlakhs)
No. of Companies
Authorized Capital(Rs. Inlakhs)
No. of Companie
s
Authorized Capital(Rs. Inlakhs)
1980-81 41 970 83 276 28 284 1144 10533
1985-86 62 608 250 2678 32 604 3026 135196
1990-91 167 22468 131 13097 60 1263 2808 94744
1995-96 443 13698 4255 142835 119 3418 10669 465914
1996-97 427 6322 182 5328 2895 45400 8514 180914
1997-98 412 7475 204 4333 1480 44368 6687 162290
1998-99 357 4719 190 3054 1743 43301 6004 286425
1999-00 303 3333 257 6590 1239 41354 5747 269055
2000-01 362 1005770 308 8268 1591 55368 5256 1299273
2001-02 205 1027 175 4429 1026 64437 4419 110995
2002-03 270 1497 195 1768 926 28215 4793 86050
2003-04 297 13027 162 1592 1259 27686 5836 122670
2004-05 435 4604 348 3975 2654 35402 8922 144682
2005-06 436 34916 494 5791 4096 185600 13372 624329
2006-07 391 596599 913 77769 5575 738935 13168 4401444
2007-08 490 37794 728 35553 4429 205360 14487 1326468
2008-09 608 12637 818 28360 4360 341950 12661 770407
2009-10 539 7751 1210 33516 5087 169077 11740 410839
2010-11 733 157588 1324 27976 6625 322861 15544 755144
2011-12 759 330227 7635 344200 15141 92915 16713 1541297
2012-13 751 12124 7183 1050391 1577 18690 16038 1310071
2013-14 722 31831 8315 582305 1784 55946 16751 930464
Source: Ministry of Corporate Affairs, Govt. of India.

8/20/2019 Statistical+Abstract+of+Delhi+2014
http://slidepdf.com/reader/full/statisticalabstractofdelhi2014 97/190
78
TABLE 6.3 ANNUAL SURVEY OF INDUSTRIES
Year No. of RegisteredFactoriescovered
Productive Capital(Rs, in lakhs)
All Employees TotalEmoluments
( Rs. inLakhs)Fixed
CapitalWorkingCapital
Workers Other than
workers
1980-81* 507 40249 18639 72859 23170 9375
1985-86* 697 80563 49504 77208 29561 18462
1990-91* 264 203786 82221 56204 26444 31208
1995-96 3631 343367 325330 121029 121029 77877
1996-97 3715 366006 599284 115318 115318 82757
1997-98 3561 232544 672734 92017 92017 74537
1998-99 3619 188166 288591 85592 39202 65711
1999-00 3596 202955 395293 85986 47141 75152
2000-01 3498 221314 296226 82174 38324 74524
2001-02 3409 224959 297495 78331 39634 99085
2002-03 3413 244829 359853 85552 41180 116500
2003-04 3193 209862 300963 90923 37726 98350
2004-05 3154 235690 291035 80923 40207 95623
2005-06 3305 258908 366611 87588 40015 130113
2006-07 3268 291370 350263 89431 40521 148568
2007-08 3198 291381 424957 88588 39266 157892
2008-09 3026 312873 328715 87752 39264 131273
2009-10 2878 386654 604005 84408 36753 159046
2010-11 2878 446921 821634 79036 43495 197163
2011-12 2976 893782 1035209 76867 41911 226033
Source- Directorate of economics & Statistics, Govt. of NCT of Delhi

8/20/2019 Statistical+Abstract+of+Delhi+2014
http://slidepdf.com/reader/full/statisticalabstractofdelhi2014 98/190
79
TABLE 6.4 INDEX NO. OF INDUSTRIAL PRODUCTION(Base 1993-94=100)
Year General Index Manufacturing Electricity
Weight (100.00) (79.02) (20.98)
1995-96 235.94 249.28 185.69
1996-97 205.14 212.34 178.03
1997-98 196.00 197.46 190.5
1998-99 205.68 208.95 193.33
1999-00 94.28 93.77 102.69
2000-01 103.28 102.63 114.27
2001-02 109.38 109.02 115.24
2002-03 115.85 115.44 122.57
2003-04 123.35 122.01 145.5
2004-05 141.66 140.96 153.34
2005-06 135.70 134.64 153.18
2006-07 136.35 135.26 154.39
Base Year 1999 – 2000
Year General Index Manufacturing Electricity
Weight (100.00) (79.02) (20.98)
2006-07 163.33 167.66 150.35
2007-08 172.11 177.54 155.85
2008-09 144.81 144.80 144.86
2009-10 123.06 119.85 132.69
Base Year 2004-05=100
Year General Index Manufacturing Electricity
Weight (100.00) (79.02) (20.98)
2009-10 117.01 128.17 90.58
2010-11 117.17 132.01 82.02
2011-12 123.21 139.14 85.49
2012-13 115.94 124.99 94.52
Source: Dte. Of Economics & Statistics, Delhi
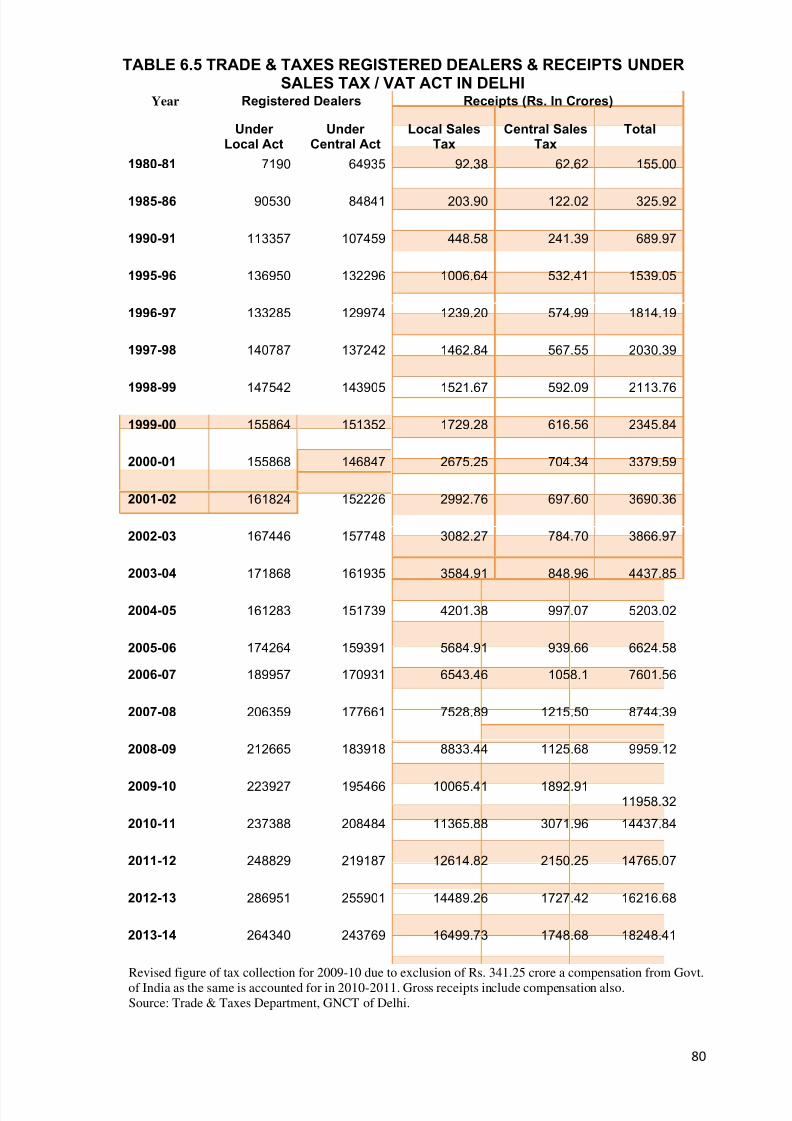
8/20/2019 Statistical+Abstract+of+Delhi+2014
http://slidepdf.com/reader/full/statisticalabstractofdelhi2014 99/190
80
TABLE 6.5 TRADE & TAXES REGISTERED DEALERS & RECEIPTS UNDERSALES TAX / VAT ACT IN DELHI
Year Registered Dealers Receipts (Rs. In Crores)
Under Local Act
Under Central Act
Local SalesTax
Central SalesTax
Total
1980-81 7190 64935 92.38 62.62 155.00
1985-86 90530 84841 203.90 122.02 325.92
1990-91 113357 107459 448.58 241.39 689.97
1995-96 136950 132296 1006.64 532.41 1539.05
1996-97 133285 129974 1239.20 574.99 1814.19
1997-98 140787 137242 1462.84 567.55 2030.39
1998-99 147542 143905 1521.67 592.09 2113.76
1999-00 155864 151352 1729.28 616.56 2345.84
2000-01 155868 146847 2675.25 704.34 3379.59
2001-02 161824 152226 2992.76 697.60 3690.36
2002-03 167446 157748 3082.27 784.70 3866.97
2003-04 171868 161935 3584.91 848.96 4437.85
2004-05 161283 151739 4201.38 997.07 5203.02
2005-06 174264 159391 5684.91 939.66 6624.58
2006-07 189957 170931 6543.46 1058.1 7601.56
2007-08 206359 177661 7528.89 1215.50 8744.39
2008-09 212665 183918 8833.44 1125.68 9959.12
2009-10 223927 195466 10065.41 1892.9111958.32
2010-11 237388 208484 11365.88 3071.96 14437.84
2011-12 248829 219187 12614.82 2150.25 14765.07
2012-13 286951 255901 14489.26 1727.42 16216.68
2013-14 264340 243769 16499.73 1748.68 18248.41
Revised figure of tax collection for 2009-10 due to exclusion of Rs. 341.25 crore a compensation from Govt.
of India as the same is accounted for in 2010-2011. Gross receipts include compensation also.
Source: Trade & Taxes Department, GNCT of Delhi.

8/20/2019 Statistical+Abstract+of+Delhi+2014
http://slidepdf.com/reader/full/statisticalabstractofdelhi2014 100/190
81
TABLE 6.6 DISTRICT WISE NUMBER OF ESTABLISHMENTS WITH SELECTEDPRINCIPLE CHARACTERISTICS IN DELHI
(as per 6th Econonic Census, 2013)
District OutsideHH with
Fixedstructure
OutsideHH
withoutFixed
structure
InsideHH
Total Total of Handicraft /Hanloom/
establishment
No. of establishmentwith 8 or more
workers
North West
49954 20252 22927 93133 1743 2873North
35980 22637 16258 74875 845 6799North East
20705 32805 40563 94073 2415 1254East
41757 19538 21034 82329 1823 1595New Delhi
29602 3001 5895 38498 1444 2916Central
124136 13290 15818 153244 4250 4317West
59683 20943 25898 106524 3474 2230South West
21198 7784 12971 41953 1762 713South
22371 19502 17363 59236 1465 1020Shahadra
24319 24164 24273 72756 1054 2646South-East
34138 22524 19894 76556 2033 3317Total
463843 206440 222894 893177 22308 29680HH-Household
Source: Report on Sixth Economic Census 2013 (PROVISIONAL RESULTS) in Delhi - Dte. Of Economics &
Statistics, Delhi.
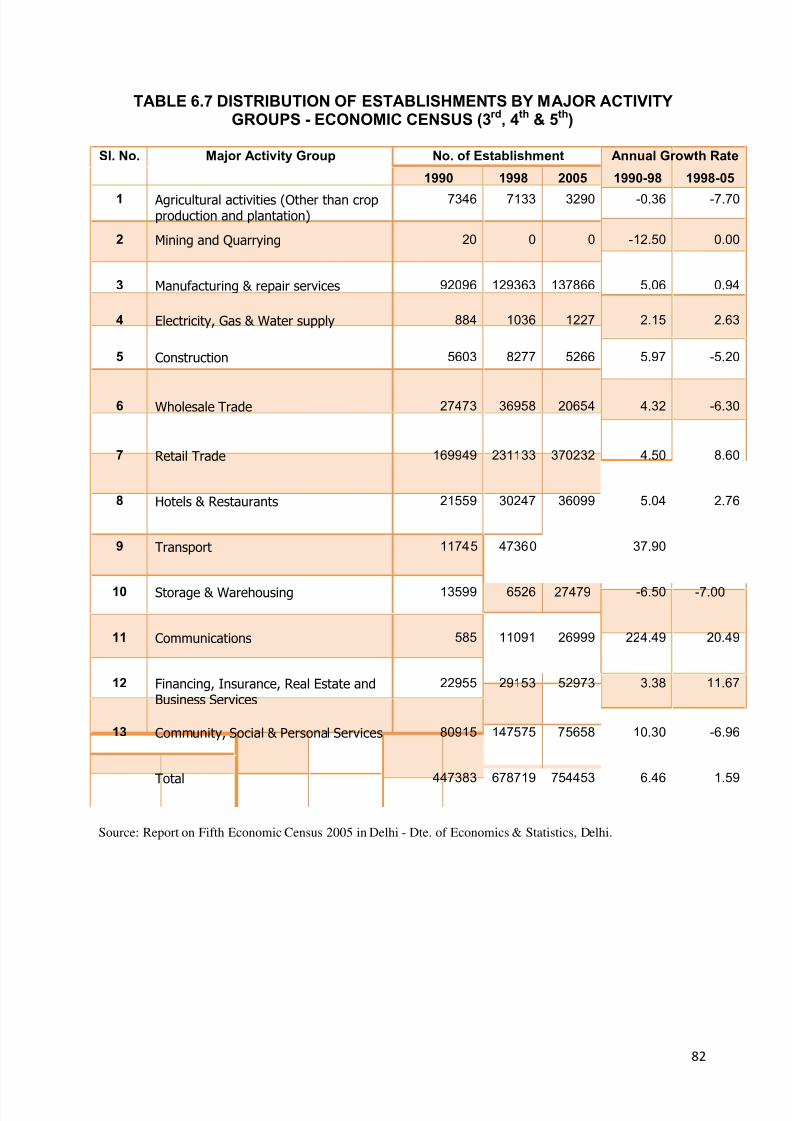
8/20/2019 Statistical+Abstract+of+Delhi+2014
http://slidepdf.com/reader/full/statisticalabstractofdelhi2014 101/190
82
TABLE 6.7 DISTRIBUTION OF ESTABLISHMENTS BY MAJOR ACTIVITYGROUPS - ECONOMIC CENSUS (3rd, 4th & 5th)
Sl. No. Major Activity Group No. of Establishment Annual Growth Rate
1990 1998 2005 1990-98 1998-05
1 Agricultural activities (Other than cropproduction and plantation)
7346 7133 3290 -0.36 -7.70
2 Mining and Quarrying 20 0 0 -12.50 0.00
3 Manufacturing & repair services 92096 129363 137866 5.06 0.94
4 Electricity, Gas & Water supply 884 1036 1227 2.15 2.63
5 Construction 5603 8277 5266 5.97 -5.20
6 Wholesale Trade 27473 36958 20654 4.32 -6.30
7 Retail Trade 169949 231133 370232 4.50 8.60
8 Hotels & Restaurants 21559 30247 36099 5.04 2.76
9 Transport 11745 47360
27479
37.90
-7.0010 Storage & Warehousing 13599 6526 -6.50
11 Communications 585 11091 26999 224.49 20.49
12 Financing, Insurance, Real Estate andBusiness Services
22955 29153 52973 3.38 11.67
13 Community, Social & Personal Services 80915 147575 75658 10.30 -6.96
Total 447383 678719 754453 6.46 1.59
Source: Report on Fifth Economic Census 2005 in Delhi - Dte. of Economics & Statistics, Delhi.

8/20/2019 Statistical+Abstract+of+Delhi+2014
http://slidepdf.com/reader/full/statisticalabstractofdelhi2014 102/190
83
SURVEY RESULTS
TABLE 6.8 UNORGANIZED MANUFACTURING ACTIVITIES IN DELHIS.No Item Unorganized Manufacturing Enterprises
NSS 51st Round(July 1994-June 1995)
NSS 56th Round(July 2000-June 2001)
NSS 62n
Round(July 2005-June 2006)
OAME Estt. Total OAME Estt. Total OAME Estt. Total
A No. of Enterprises
51867 77111 128978 59670 130607 190277 15040 85700 100740
B
Employment(Rs. in
lakhs)
1.01 6.05 7.06 0.92 7.02 7.94 0.24 4.58 4.82
C AverageEmployment
1.9 7.8 5.5 1.5 5.4 4.2 1.58 5.34 4.78
D
Gross Value Added per enterprise(in Rs.)
48799 152942 111062 52123 235095 177716 80974 369438 326371
E Gross Value Added per worker (in
Rs.)
25037 19501 20294 33955 43711 42585 51319 69158 68278
OAME - Own Account Manufacturing Establishment
Estt. – Establishment
NSS - National Sample Survey
Source: Dte. Of Economics & Statistics

8/20/2019 Statistical+Abstract+of+Delhi+2014
http://slidepdf.com/reader/full/statisticalabstractofdelhi2014 103/190
84
TTAABBLLEE 66..99 UUNN--OORRGGAANNIISSEEDD MMAANNUUFFAACCTTUURRIINNGG EENNTTEERRPPRRIISSEESS && EEMMPPLLOO Y YMMEENNTT
IndustryCode
Description Enterprise Percentage Employment Percentage
15 Manufacture of Food Products &Beverages
5907 5.86 17372 3.61
17 Manufacture of Textiles 3941 3.91 14675 3.05
18 Manufacture of Wearing Apparels;Dressing & Dyeing of Fur
28495 28.29 135847 28.21
19 Tanning & Dressing of Leather:Mfg. Of Luggage, Handbags,Footwear etc.
3467 3.44 20333 4.22
20 Manufacture of Wood Products 1239 1.23 3820 0.79
21 Manufacture of Paper & paper Products
2380 2.36 12703 2.64
22 Publishing, Printing & reproductionof Recorded Media
4256 4.22 31979 6.64
24 Manufacture of Chemicals &Chemical Products
164 0.16 369 0.08
25 Manufacture of Rubber & PlasticsProducts
1862 1.85 8382 1.74
26 Manufacture of Other Non-MetallicMineral Products
683 0.68 1784 0.37
27 Manufacture of Basic Metals 603 0.60 5183 1.08
28 Manufacture of Fabricated MetalProducts, Except Machinery &Equipment
22165 22.00 103341 21.46
29 Manufacture of Machinery &Equipment
4916 4.88 23887 4.96
30 Manufacture of Office, Accounting &Computing Machinery
1 0.00 4 0
31 Manufacture of Electrical Machinery& Apparatus
3480 3.45 18902 3.93
32 Manufacture of Radio, Television &Communication Equipment & Apparatus
2179 2.16 11723 2.43
33 Manufacture of Medical, Precision &optical Instruments, Watches &Clocks
672 0.67 3490 0.72
34 Manufacture of Motor Vehicles,Trailers & Semi-Trailers
5354 5.31 30530 6.34
35 Manufacture of Other TransportEquipment
1676 1.66 9924 2.06
36 Manufacture of Furniture; Mfg. NEC 7300 7.25 27290 5.67
Total 100740 100.00 481538 100
Source: NSS 62nd Round ((July 2005-June 2006) - Dte. Of Economics & Statistics

8/20/2019 Statistical+Abstract+of+Delhi+2014
http://slidepdf.com/reader/full/statisticalabstractofdelhi2014 104/190
85
TABLE 6.10 UNORGANISED SERVICE SECTOR EMPLOYMENT
DISTRIBUTION OF EMPLOYMENT (2001-2002)
TabulationCategory
NIC Code 1988 Description NSS 57th Round (2001-02)
Employment % Rank
OAE ESTT Total
H1 551 Hotels 75 7630 7705 1.30 9
H2 552 Restaurant 26566 65924 92490 15.63 3Sub-Total 26641 73554 100195 16.93
11 6302 Storage and Warehousing 0 64 64 0.01 10
12 6021,60221,60231 Mechanized road transport 27547 4401 31948 5.40 8
13 601,60222,60232,61,6301,6303,6304,6309
Other Transport & Related Activities
28953 9830 38783 6.55 7
14 64 Communication 12738 31429 44167 7.46 6
Sub-Total 69238 45724 114962 19.43
K 70-74 Real Estate, Renting andBusiness activities
18428 83104 101532 17.16 2
M 80 Education 13896 69763 83659 14.14 4
N 85 Health and social work 14198 48926 63124 10.67 5O 90,911,9191,92,93 Other community, socialand personal serviceactivities & other transport
78119 50203 128322 21.68 1
Total 220520 371274 591794
Percentage to Total 37.26 62.74 100.00
DISTRIBUTION OF EMPLOYMENT (2006-07)
Tabulation
Category
NIC Code 1988 Description NSS 63r
Round (2006-07)
Employment % Rank
OAE ESTT Total
H1 551 Hotels 333 23911 24244 3.77 9
H2 552 Restaurant 16233 72915 89148 13.85 2
Sub-Total 16566 96826 113392 17.62 -
11 6302 Storage and Warehousing 0 0 0 0.00 12
12 6021,60221,60231
Mechanized road transport 17616 41780 59396 9.23 8
13 601,60222,60232,61,6301,6303,6304,6309
Non-mechanized transport,water transport and other related Activities
20514 41515 62029 9.64 7
14 64 Communication 39931 22180 62111 9.65 6
Sub-Total 78061 105475 183536 28.52 -
J1 659 Non-Banking financial institutionsexcept Insurance and Pensionfunding
326 5595 5921 0.92 10
J2 66,67 Insurance and Pension funding &auxiliary activities
1423 4079 5502 0.86 11
Sub-Total 1749 9674 11423 1.78 -
K 70-74 Real Estate, Renting andBusiness activities
22860 81367 104227 16.20 1
M 80 Education 10609 68559 79168 12.30 4
N 85 Health and social work 11358 53979 65337 10.15 5
O 90,9191,9199,92,93
Other community, social andpersonal service activities
28692 57731 86423 13.43 3
Total 169895 473611 643506 100.00
-
Percentage to Total 26.40 73.60 100.00
Source: - NSS 57th Round from 2001-02 & NSS 63rd Round from 2006-07

8/20/2019 Statistical+Abstract+of+Delhi+2014
http://slidepdf.com/reader/full/statisticalabstractofdelhi2014 105/190
86
TABLE 6.11 UNORGANISED SERVICE SECTOR ENTERPRISESDISTRIBUTION OF ENTERPRISES (2001-2002)
TabulationCategory
NIC Code 1988 Description NSS 57th Round (2001-02)
Employment % Rank
OAE ESTT Total
H1 551 Hotels 75 1024 1099 0.45 9
H2 552 Restaurant 19413 15006 34419 14.06 3
Sub-Total 19488 16030 35518 14.51
11 6302 Storage and Warehousing 0 30 30 0.01 10
12 6021,60221,60231 Mechanized road transport 27122 1010 28132 11.49 5
13 601,60222,60232,61,6301,6303,6304,6309
Other Transport & Related Activities
28543 2108 30651 12.52 4
14 64 Communication 10521 5725 16246 6.63 8
Sub-Total 66186 8873 75059 30.65
K 70-74 Real Estate, Renting andBusiness activities
14616 20591 35207 14.38 2
M 80 Education 12578 9755 22333 9.12 6
N 85 Health and social work 13247 8232 21479 8.77 7
O 90,911,9191,92,93 Other community, social andpersonal service activities &other transport
43462 11815 55277 22.57 1
Total 169577 75296 244873
Percentage to Total 69.25 30.75 100.00
DISTRIBUTION OF ENTERPRISES (2006-07)
TabulationCategory
NIC Code 1988 Description NSS 63rd Round (2006-07)
Employment % Rank
OAE ESTT Total
H1 551 Hotels 19 1738 1757 0.73 10
H2 552 Restaurant 12635 15863 28498 11.90 4
Sub-Total 12654 17601 30255 12.64 -
11 6302 Storage and Warehousing 0 0 0 0.00 12
12 6021,60221,60231
Mechanized road transport, water transport and other related Activities
17539 3980 21519 8.99 6
13 60222,60232,61,6301,6303,6304,6309
Non-mechanized transport, water transport and other related ActivitiesRelated Activities
20367 5698 26065 10.89 5
14 64 Communication 37125 6929 44054 18.40 1
Sub-Total 75031 16607 91638 38.27 -
J1 659 Non-Banking financial institutionsexcept Insurance and Pensionfunding
82 953 1035 0.43 11
J2 66,67 Insurance and Pension funding &auxiliary activities
1329 594 1923 0.80 9
Sub-Total 1411 1547 2958 1.24 -
K 70-74 Real Estate, Renting and Businessactivities
18881 22365 41246 17.23 2
M 80 Education 7099 6520 13619 5.69 8
N 85 Health and social work 9934 10101 20035 8.37 7
O 90,9191,9199,92,93
Other community, social andpersonal service activities & other transport
22271 17425 39696 16.58 3
Total 147281 92166 239447 100.00
-
Percentage to Total 61.51 38.49 100.00
Source: - NSS 57th Round from 2001-02 & NSS 63rd
Round from 2006-07******

8/20/2019 Statistical+Abstract+of+Delhi+2014
http://slidepdf.com/reader/full/statisticalabstractofdelhi2014 106/190
87
CHAPTER SEVEN
FINANCE, PUBLIC FINANCE, BANKING
& INSURANCE
• No. of Banks in Delhi
• Distribution of Deposits in Banks
• Occupational Classification of Outstanding Credit of ScheduledCommercial Banks
• Progress of Life Insurance
• Co-operative societies in Delhi
• Progress of Consumer Cooperative Stores
• Collections under Saving Schemes in Delhi
• Principal Heads of Revenue Receipts
• Principal Heads of Expenditure (Revenue Account)
• Principal Head of Capital Budget

8/20/2019 Statistical+Abstract+of+Delhi+2014
http://slidepdf.com/reader/full/statisticalabstractofdelhi2014 107/190
88
It includes commercial banks, Banking department of RBI, Non Financial
Banking Institutions, post office saving bank, Employee Provident fund Organization
and postal life Insurance.
This chapter presents data on number of Banks, deposits and advances of
Scheduled Commercial Banks. Source for this information is Reserve Bank of India.
The information regarding Life Insurance is presented in table 7.4 while tables 7.5 &
7.6 include the data pertain to Co-Operative Sector. Information is provided by Life
Insurance Corporation of India and Registrar Co-operative Societies respectively.
Table 7.7 include the data pertain to collections under small savings schemes in Delhi.
The information related to revenue receipts, expenditure and capital Budget related to
Delhi are also present in table 7.8, 7.9 and 7.10 respectively.
CHAPTER 7: FINANCE, PUBLIC FINANCE,
BANKING & INSURANCE

8/20/2019 Statistical+Abstract+of+Delhi+2014
http://slidepdf.com/reader/full/statisticalabstractofdelhi2014 108/190
89
TABLE 7.1 NO. OF BANKS IN DELHI
(as on 31st March)
Year SBI & subsidiaries Nationalized Banks Other Commercial
Banks
Total
1980 172 596 92 860
1985 241 716 93 1050
1990 265 774 82 1121
1995 278 813 94 1185
1996 281 834 108 1223
1997 284 835 117 1236
1998 290 865 134 1289
1999 291 901 151 1343
2000 307 1014 178 1499
2001 311 1011 198 1520
2002 312 1018 185 1515
2003 310 1029 231 1570
2004 313 1052 261 1626
2005 320 1079 330 1729
2006 328 1114 389 1831
2007 343 1222 408 1993
2008 379 1304 466 2149
2009 401 1383 535 2319
2010 420 1496 547 2463
2011 451 1573 706 2730
2012 462 1667 772 2901
2013 487 1773 818 3078
2014 499 1882 868 3249
*from 2010 onwards 2 Regional Rural Banks are also added
Banks branch data includes administrative offices, other scheduled commercial banks comprise private
sector, foreign & Regional rural Banks, Nationalized Banks includes IDBI Ltd. Since March 05
Source: Reserve Bank of India, Mumbai.

8/20/2019 Statistical+Abstract+of+Delhi+2014
http://slidepdf.com/reader/full/statisticalabstractofdelhi2014 109/190
90
TABLE 7.2 DISTRIBUTIONS OF DEPOSITS IN BANKS
(As on 31st March)
Year Current Accounts Saving Accounts Fixed Accounts Total Accounts
Accounts(in ’000.)
Deposits(in
crores)
Accounts(in ‘000.)
Deposits(in
crores)
Accounts(in ’000.)
Deposits(in
crores)
Accounts(in’000.)
Deposits(in
crores)
1980* 370 640 3625 710 2106 2338 6101 3688
1985* 616 1420 5556 2080 3124 4864 9296 8364
1990 1202 3240 8934 3890 4005 9888 14141 17018
1995 1369 9222 11035 7977 4639 22190 17043 39389
1996 1286 9439 10639 8884 4754 24246 16679 42569
1997 1353 10507 10814 10576 4968 29492 17135 50575
1998 1368 11555 10287 12290 4973 37911 16628 61756
1999 1337 13806 10112 13897 4965 47204 16414 74907
2000 1288 14950 10388 16539 5055 58188 16731 89677
2001 1253 16664 10678 19205 5721 70569 17652 106438
2002 1181 18354 10932 21992 6062 81013 18175 121359
2003 1219 19768 11058 25238 6061 97448 18338 142454
2004 1305 29457 11848 31845 5949 121699 19102 183001
2005 1305 31626 12223 38053 5529 153983 19057 223662
2006 1429 37104 12994 44450 4950 188200 19373 269754
2007 1518 44607 13532 49129 5078 242331 20128 336067
2008 1474 67705 15155 55395 5804 305144 22433 428244
2009 1674 76929 16411 65025 6690 373078 24774 515032
2010 2017 62637 29140 124354 6626 378022 37783 565013
2011 2182 121464 21790 100283 6948 414176 30921 635923
2012 2193 115568 20417 105223 7708 463341 30318 684133
2013 2513 84350 22270 114753 8958 553083 33741 752186
Source: Reserve Bank of India, Mumbai.

8/20/2019 Statistical+Abstract+of+Delhi+2014
http://slidepdf.com/reader/full/statisticalabstractofdelhi2014 110/190
91
TABLE 7.3OCCUPATIONAL CLASSIFICATION OF OUTSTANDING CREDIT OF SCHEDULED
COMMERCIAL BANKS
Year Agriculture & AlliedActivities
Industry Transport Trade
No. of
Accounts
Amount
Outstanding(in Rs. Cr.)
No. of
Accounts
Amount
Outstanding(in Rs. Cr.)
No. of
Accounts
Amount
Outstanding(in Rs. Cr.)
No. of
Accounts
Amount
Outstanding(In Rs. Cr.)
1980 15460 130 34041 728 7196 37 29053 1533
1985 18606 231 39227 1638 13887 96 48725 1315
1990 28627 124 60410 3761 16516 139 73495 1446
1996 42122 891 67839 13099 12801 211 65211 4148
1997 11592 395 66973 14640 9525 131 62560 4072
1998 12779 302 58498 17157 9187 205 59278 5520
1999 3653 1536 88372 22046 8508 330 56853 5565
2000 10032 695 124658 25946 8100 389 53847 8117
2001 13187 1590 98221 30085 7094 327 55770 11052
2002 6387 2172 92956 32103 5546 615 41196 12641
2003 5884 3613 101830 36507 4404 476 42675 12935
2004 12996 4955 65769 51339 6059 749 36315 12524
2005 8238 6756 71387 66632 6710 568 42675 18398
2006 8273 11671 125314 81027 8343 1029 50097 19874
2007 11788 16251 70044 97602 7829 1916 121355 27597
2008 23342 13948 388102 123793 18898 2338 59151 24871
2009 26603 16823 190348 171869 26704 4431 102255 35196
2010 12772 19949 169501 189186 43350 7241 94517 39834
2011 28397 20289 83843 225139 39957 9721 81347 41829
2012 30501 1977989 297327 32205222 53522 921290 165811 5451780
2013 28131 1628907 112190 39179438 104436 959216 114666 6766874
(Contd…)

8/20/2019 Statistical+Abstract+of+Delhi+2014
http://slidepdf.com/reader/full/statisticalabstractofdelhi2014 111/190
92
TABLE 7.3OCCUPATIONAL CLASSIFICATION OF OUTSTANDING CREDIT OF SCHEDULED
COMMERCIAL BANKS
Source: Reserve Bank of India, Mumbai.
Year Personal Loan &Professional Services
Finance & all others Total
No. of Accounts
AmountOutstanding
(in Rs. Cr.)
No. of Accounts
AmountOutstanding
(in Rs. Cr.)
No. of Accounts
AmountOutstanding
(in Rs. Cr.)1980 125846 87 74069 115 285665 2630
1985 147773 202 123971 265 392189 3747
1990 219867 712 157917 695 556832 6877
1996 526475 2501 149504 3400 863952 24250
1997 526066 3033 150225 3542 826941 25813
1998 485000 3471 117771 4673 742513 31328
1999 656753 4071 140511 5939 954650 39487
2000 664922 5232 95862 7822 957421 48201
2001 1476730 7070 109081 11184 1760083 61308
2002 1070945 8707 117999 15544 1335029 71782
2003 936557 12333 134587 18442 1225937 84306
2004 1048610 19308 144327 17173 1314076 106048
2005 1346745 28388 154039 19102 1629794 139844
2006 1751743 45424 213231 24462 2157001 183487
2007 2015484 55716 191123 34716 2417623 233798
2008 1693845 34009 239591 51889 2422929 250848
2009 244812 81382 132455 44677 2927177 354380
2010 1352239 87653 319175 54956 1991554 398819
2011 1892232 125225 322552 91809 2448328 514012
2012 2823611 13724195 369133 9903304 3739905 64183780
2013 3161865 13652542 230369 9204396 3751657 71391373

8/20/2019 Statistical+Abstract+of+Delhi+2014
http://slidepdf.com/reader/full/statisticalabstractofdelhi2014 112/190
93
TABLE 7.4 PROGRESS OF LIFE INSURANCE
Year Individual Insurance Group Insurance
Businessin force atthe end of the period
NewBusinessduring the
period
PremiumIncome
during theperiod
Averagepremiumon sumassured
per thousand(in Rs.)
Businessin forceat theend of
theperiod
NewBusiness
duringthe
period
PremiumIncome
during theperiod
1990-91 5162 1171 282 44.52 3141 481 57
1995-96 11265 2252 622 41.36 6081 172 159
1996-97 13106 2463 766 48.88 5796 202 185
1997-98 15328 2792 920 32.95 6253 275 209
1998-99 17540 3226 1010 31.3 6679 426 209
1999-00 20310 3701 1321 35.69 7142 463 362
2000-01 23964 4580 1793 39.15 9367 1375 494
2001-02 31687 8143 1926 49.2 13932 497 486
2002-03 38068 8184 2850 103.92 8917 1248 935
2003-04 44285 8336 3340 56.75 9533 1624 1199
2004-05 48974 7438 3364 98.73 12726 2122 790
2005-06 56302 10547 4209 114.34 14569 2319 593
2006-07 66972 13626 5556 168.88 27464 11258 819
2007-08 69712 6623 1905 156.92 48553 23912 2023
2008-09 5559.47 2033.56 6835.47180.36
1209.50 1795.83 791.03
2009-10 5580.18 2298.01 6876.66 121.62 9249.00 2133.00 2603.00
2010-11 6458.16 2227.38 5883.06 106.57 3495.00 8705.06 9429.94
2011-12 6995.45 1445.23 6036.10 NA 4202.88 2455.01 774.96
2012-13 7309.32 1606.90 5995.05 NA 29479.70 3763.25 4250.42
2013-14 161353.98* 1675.55 6161.53 40.27 34433.10 5330.04* 473.27
*sum Assured
Source: Life Insurance Corporation, Northern Zonal Office, New Delhi.
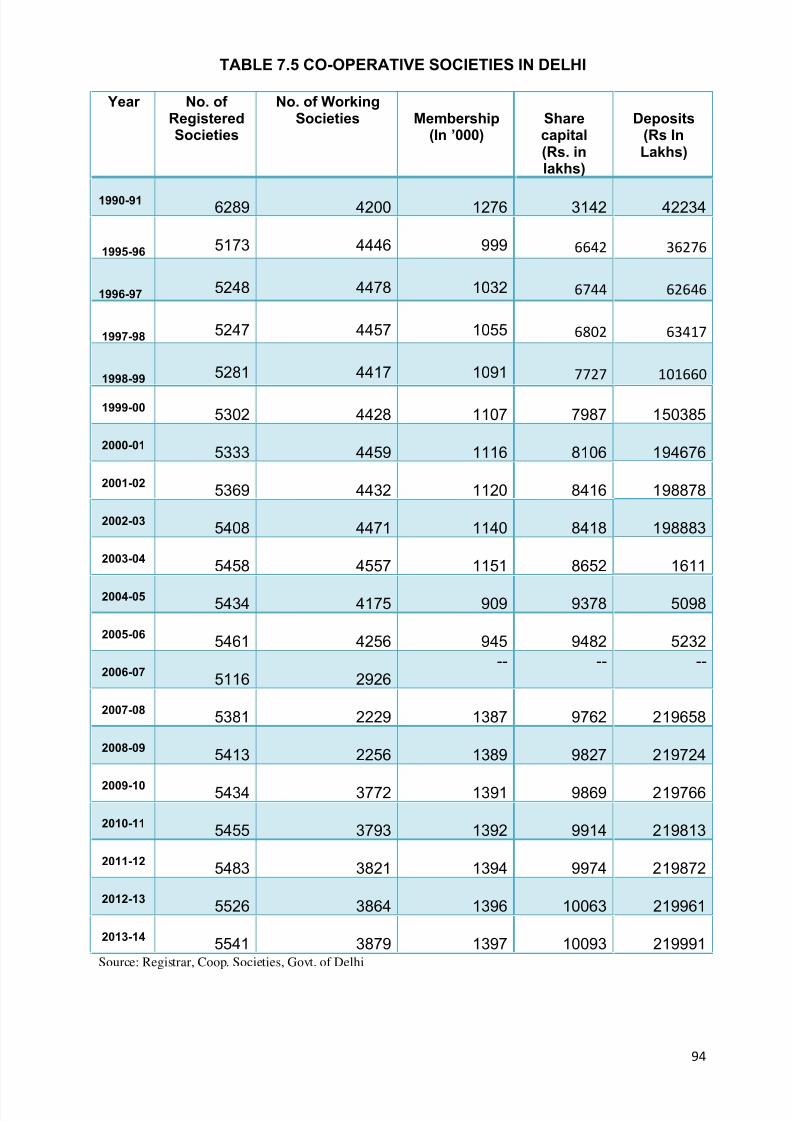
8/20/2019 Statistical+Abstract+of+Delhi+2014
http://slidepdf.com/reader/full/statisticalabstractofdelhi2014 113/190
94
TABLE 7.5 CO-OPERATIVE SOCIETIES IN DELHI
Year No. of RegisteredSocieties
No. of WorkingSocieties Membership
(In ’000)Sharecapital(Rs. inlakhs)
Deposits(Rs InLakhs)
1990-916289 4200 1276 3142 42234
1995-96 5173 4446 999 6642 36276
1996-97 5248 4478 1032 6744 62646
1997-98 5247 4457 1055 6802 63417
1998-99 5281 4417 1091 7727 101660
1999-005302 4428 1107 7987 150385
2000-015333 4459 1116 8106 194676
2001-025369 4432 1120 8416 198878
2002-035408 4471 1140 8418 198883
2003-045458 4557 1151 8652 1611
2004-055434 4175 909 9378 5098
2005-065461 4256 945 9482 5232
2006-075116 2926
-- -- --
2007-085381 2229 1387 9762 219658
2008-095413 2256 1389 9827 219724
2009-10 5434 3772 1391 9869 219766
2010-115455 3793 1392 9914 219813
2011-125483 3821 1394 9974 219872
2012-135526 3864 1396 10063 219961
2013-145541 3879 1397 10093 219991
Source: Registrar, Coop. Societies, Govt. of Delhi

8/20/2019 Statistical+Abstract+of+Delhi+2014
http://slidepdf.com/reader/full/statisticalabstractofdelhi2014 114/190
95
TABLE 7.6 PROGRESS OF CONSUMER COOPERATIVE STORES
Year Membership (in '000) No. of Branches
DelhiConsumer
Coop.Wholesale
Ltd.
KendriyaBhandar
Coop.Store Ltd.
Delhi fruit &vegetableConsumer
Coop.Federation
Ltd.
DelhiConsumer
Coop.Wholesale
Ltd.
KendriyaBhandar
Coop. StoreLtd.
Delhi fruit&
vegetableConsumer
Coop.Federation
Ltd.1990-91 603 73315 78 19 78 31
1995-96 579 88143 74 60 24 30
1996-97 578 95158 74 66 25 30
1997-98 579 77233 75 80 104 29
1998-99 579 77236 75 80 112 29
1999-00 579 77237 77 88 112 29
2000-01 579 77238 77 93 118 27
2001-02 579 77238 77 74 119 27
2002-03 602 78542 77 72 114 27
2003-04 602 79020 82 73 114 28
2004-05 619 - - 86 8 -
2005-06 622 79020 82 87 8 28
2006-07 622 82536 86 84115
28
2007-08 622 83548 86 84 116 28
2008-09 622 84122 69 84 119 28
2009-10 622 NA 28 89 NA 28
2010-11 601 NA 68 92 NA 28
2011-12 601 93400 69 98 132 28
2012-13 601 94800 69 99 134 28
2013-14 601 NA 70 101 NA 28
Contd…

8/20/2019 Statistical+Abstract+of+Delhi+2014
http://slidepdf.com/reader/full/statisticalabstractofdelhi2014 115/190
96
TABLE 7.6 PROGRESS OF CONSUMER COOPERATIVE STORES
Year Share Capital (Rs. In lakhs) Sale (Rs. In lakhs) Profit (Rs. In lakhs)
DelhiConsu
mer Coop.WholesaleLtd.
KendriyaBhandar
Coop.Store Ltd.
Delhi fruit& veget-
ableConsumer
Coop.Federation
Ltd.
DelhiConsumer
Coop.Wholesale
Ltd.
KendriaBhandar
Coop.Store Ltd.
Delhifruit &
vegetab-le
Consumer Coop.Federati
on Ltd.
Super Bazar
Coop. StoreLtd.
DelhiConsum
er Coop.
Wholesale Ltd.
KendriaBhandar
Coop.StoreLtd.
Delhifruit &veget-able
Consu-mer
Coop.
Feder-ationLtd.
1990-91 41.36 76.35 2.69 2319.00 4500.00 278.65 9832.63 0.71 75.00 0.33
1995-96 35.00 76.99 2.51 7529.00 12541.01 336.50 139.50 0.42 216.17 1.50
1996-97 36.55 77.93 2.51 11007.00 16496.97 487.00 141.04 - 305.12 2.50
1997-98 36.52 78.18 2.69 11438.00 20589.00 358.00 12845.35 - 407.41 -2.21
1998-99 36.52 78.23 2.70 13916.36 23307.00 490.00 12637.00 - 400.00 -1.34
1999-00 36.52 78.23 2.71 13904.72 23164.00 425.00 8300.00 1.36 403.95 2.82
2000-01 36.52 78.23 2.72 15107.52 27841.57 439.00 - 3.21 425.00 -
2001-02 36.52 78.23 2.72 12196.84 26850.36 450.00 3663.15 - 492.49 -
2002-03 36.53 80.80 2.76 12200.00 26427.00 426.00 - -1.80 596.37 0.37
2003-04 36.51 80.31 2.90 12496.00 29266.00 443.00 - -1.78 - 0.50
2004-05 36.51 81.31 - 13973.00 - - - - - -
2005-06 36.51 81.31 - 13468.00 30127.00 492.00 - 1.90 640.32 2.46
2006-07 36.84 86.29 4.25 18017.00 21879 446.00 - 9.52 184.89 0.40
2007-08 36.84 87.42 4.25 22005 25304 486 - 6.19 351.46 1.09
2008-09 36.53 88.06 4.25 25480 30686 499 - - 201.23 0.50
2009-10 36.53 NA 4.25 29961 NA 493 - NA NA 1.00
2010-11 36.53 NA 3.48 31573 NA 616 - 4.37 NA 1.51
2011-12 36.53 93.43 3.48 37783 51616 646 - 78.58 656.05 1.54
2012-13 36.53 94.81 3.48 40918 60814 637 - 95.22 603.83 1.55
2013-14 36.53 NA 3.48 42703 NA 643 - NA 1.55 1.60
Source: Registrar, Cooperative Societies, Delhi.

8/20/2019 Statistical+Abstract+of+Delhi+2014
http://slidepdf.com/reader/full/statisticalabstractofdelhi2014 116/190
97
TABLE 7.7 COLLECTIONS UNDER SAVING SCHEMES IN DELHI
(Rs in Lakhs )
Year Gross/Net Post Office
Saving Bank
Post Office
Time
Deposit
scheme
Cumulative
Time Deposit
Post
Office
Recurring
Deposit
National
Saving
Certificate
(VIII)2001-02 Gross 54755 16517 - 24130 32504
Net 2754 9239 (-) 2 13424 8073
2002-03 Gross 67459 33213 - 32645 43230
Net 8381 18804 (-) 2 17144 12124
2003-04 Gross 87442 67577 - 44814 55666
Net 7432 48778 (-)1 25736 23005
2004-05 Gross 116662 78179 -- 58269 56521
Net 12080 42448 (-)45 33711 20543
2005-06 Gross 130655 68989 2497* 66580 54850
Net 13390 17892 2440* 35655 17314
2006-07 Gross 136554 56687 (-)2497** 77634 44149
Net 1305465 (-)7677 (-)2498** 36087 3515
2007-08 Gross 137913 34033 1573** 74494 29154
Net 1022 (-)36152 1573** 11095 (-)3559
2008-09 Gross 146639 34110 2570 71211 32962
Net 3087 (-)33795 2196 (-)11354 (-)6908
2009-10 Gross 186877 52296 -- 74398 53646
Net 17985 (-)7245 (-)267 (-)12253 6131
2010-11 Gross 227867 50409 -- 82739 47101
Net 1916 (-)54 -- (-)404 (-)8185
2011-12 Gross 228534 29668 -- 79071 42606
Net 9835 (-)13645 -- 4358 (-)6818
2012-13 Gross 269292 54683 - 104787 60603
Net 29684 17223 - 17255 14858
2013-14 Gross 255838 82311 - 8684 61247
Net (-)435 29901 - 26275 28412
*figures shown are provisional
** Book adjustment by post Audit Department
Contd…

8/20/2019 Statistical+Abstract+of+Delhi+2014
http://slidepdf.com/reader/full/statisticalabstractofdelhi2014 117/190
98
TABLE 7.7 COLLECTIONS UNDER SAVING SCHEMES IN DELHI
(Rs in Lakhs )
Year Gross/Net National
Saving
Certificate
(IX)
Discharge
of Old
N.S.Cs
Social
Security
Certificate
Indira
Vikas
Patra
Public
Provident
Fund
NSS-
1987
2001-02 Gross -- (-)63 -- -- 23637 --
Net -- (-)707 -- (-)21969 20204 (-)4643
2002-03 Gross -- -- -- (-)12 34742 4617
Net -- (-)45 -- (-)39648 30075 (-)6338
2003-04 Gross -- -- -- -- 32972 --
Net -- (-)21725 -- 29778 23314 (-)3483
2004-05 Gross -- -- -- -- 49211 --
Net -- (-)316 -- (-)15222 41655 (-)3945
2005-06 Gross -- -- -- -- 36239 594*
Net -- 1025** -- (-)13846 23059 (-)3911
2006-07 Gross -- -- -- -- 70921 3287**
Net -- (-)228 -- 7376** 52378 (-)3995
2007-08 Gross -- -- -- -- 35788 186
Net -- (-)8 -- (--)388 16131 (-)5544
2008-09 Gross -- -- -- -- 40627 --
Net -- (-)199 -- (-)12682 17863 (-)4971
2009-10 Gross -- -- -- 01 48070 905
Net -- (-)615 -- (-)187 28659 (-)2619
2010-11 Gross -- -- -- 8 108452 22181
Net -- -0.03 -- (-)84 163868 18037
2011-12 Gross -- 5563 -- -- 141773 5137
Net -- (-)1184 -- (-)129 109144 (-)176
2012-13 Gross 3531 -- -- -- 94453 1932
Net 3531 (-)1041 - (-)72 53897 (-)3313
2013-14 Gross 5528 - - - 140759 4903
Net 5528 (-)047 - (-)1409 92967 339
*figures shown are provisional
** Book adjustment by post Audit Department
Contd…

8/20/2019 Statistical+Abstract+of+Delhi+2014
http://slidepdf.com/reader/full/statisticalabstractofdelhi2014 118/190
99
TABLE 7.7 COLLECTIONS UNDER SAVING SCHEMES IN DELHI
(Rs in Lakhs )
Year Gross/Net NSS-1992 Monthly
Income
Scheme
Krisan Vikas
Patra
Sr. Citizen
Sav. Sch.
Total
2001-02 Gross 140 101013 74709 -- 327342
Net (-)211 89318 41631 -- 157113
2002-03 Gross 160 164735 88270 -- 469059
Net (-)100 149962 54449 -- 244804
2003-04 Gross 4066 230955 110874 -- 634366
Net 3865 178758 51313 -- 307214
2004-05 Gross 417 257113 94090 166881 877343
Net 70 177071 63212 166576 537878
2005-06 Gross -- 199762 92371 107230 759767
Net 214* 144247 28370 104818 340667
2006-07 Gross 91** 93083 67769 71733 619411
Net (-)164 (-)19787 5955 59199 143226
2007-08 Gross 2 61447 41442 17379 433411
Net (-)243 (-)61302 (-)29494 (-)12674 (-)119543
2008-09 Gross 2196 106352 47956 13600 498245
Net 2091 (-)64299 (-)22161 (-)22675 (-)153809
2009-10 Gross 7081 282167 67480 13364 973236
Net 7018 78935 15959 54905 249562
2010-11 Gross 562 259997 66147 127114 992577
Net 502 1956 9577 54688 241814
2011-12 Gross 33 102233 19148 27687 681453
Net (-)1781 (-)84259 (-)27517 (-)44389 (-)56561
2012-13 Gross 34 77134 2374 17787 686610
Net (-)348 (-)40388 (-)87412 (-)30528 (-)26655
2013-14 Gross 116 65389 295 14618 717844
Net 061 (-)10681 (-)68487 (-)21379 7713
Source: Regional Director, National Savings, GOI, New Delhi

8/20/2019 Statistical+Abstract+of+Delhi+2014
http://slidepdf.com/reader/full/statisticalabstractofdelhi2014 119/190
100
TABLE 7.8 PRINCIPAL HEADS OF REVENUE RECEIPTS(in thousands)
Sr.n
o.
Item ACTUAL
2012-2013
BUDGET
ESTIMATES
2013-2014
REVISED
ESTIMATES
2013-14
BUDGET
ESTIMATES
2014-15
1. Tax Revenue
a) Land Revenue 72 300 200 200b) Stamps and
registration
fees
30980588 52999700 37999800 47999800
Total(i) 30980660 53000000 38000000 48000000
a) State Excise 28697436 35000000 32000000 36000000
b) Sales Tax 158036842 195000000 182000000 210000000
c) Taxes on
vehicles
12401848 16000000 14000000 16000000
d) Others 4198435 5540000 4750000 5710000
Total (ii) 203334561 251540000 232750000 267710000
TOTAL TAX REVENUE(i +ii) 234315221 304540000 270750000 315710000
2. Non Tax Revenue
i) Interest receipts and
Dividends
3662762 6398800 7725000 8033000
ii) General Services 1431079 1421800 1705800 1900850
iii) Social services 872407 862500 1012000 1177300
iv) Economic services 303063 445700 436500 498950TOTAL-NON TAX REVENUE 626911 9128800 10879300 11610100
3. Grants-in- AID 15025162 27007000 22869100 36720900
Total Revenue
Receipts(1+2+3)
255609694 340675800 304498400 364041000
Source: Annual Financial Statement 2014-15,Ministry of Finance

8/20/2019 Statistical+Abstract+of+Delhi+2014
http://slidepdf.com/reader/full/statisticalabstractofdelhi2014 120/190
101
TABLE 7.9 PRINCIPAL HEADS OF EXPENDITURE (REVENUE ACCOUNT)(in thousands)
Sr No Items ACTUAL
2012-2013
BUDGET
ESTIMATES
2013-2014
REVISED
ESTIMATES
2013-14
BUDGET
ESTIMATES
2014-15
1. Non- Development Expenditure
(A) General Services:
i)Organ of state 5253515 7263680 7403256 8004350
ii ) Fiscal services 14719585 14748411 12138698 15942504
iii) Interest Payment and Servicing of
Debts.
28628832 30250000 28243000 32795300
iv) Administrative services 8773327 11234547 10185193 12494918
V) Pensions and Miscellaneiou General 10425 1647000 105750 1257000
TOTAL (A) 57385684 65143638 58075897 70494072
2. Development Expenditure
(B) Social and Community Services 117374327 141964549 131199090 161490062
1. Education, Sports, Art and
culture
50928034 60452545 58669258 69973932
i) General Education 48221228 56877290 55363416 65659263
ii) Technical Education 1730071 2274860 2077122 2905169
iii) Others 976735 1300395 1228720 14095002. Health and Family Welfare 25083325 33193600 28678867 37316011
i) Medical and Public Health 24280615 32201100 27932547 36391011
ii) Family welfare 802710 992500 746320 925000
3. Water supply, Sanitation,
Housing & Urban Development
23808763 27192944 22065426 30305212
i) Water supply and Sanitation 5204000 5810000 4477000 11145300
ii) Housing 5025468 4933200 4508300 5202900
iii) Urban development 13579295 16449744 13080126 13957012
4. Information and Broadcasting 140350 250000 332800 237700
5. Welfare of SC,ST & BCs 2054136 2845440 3229117 3169060
6. Labour and Labour welfare 803788 1173240 1014978 13475317. Social welfare and Nutrition 14451244 16734359 17098640 19029573
i) Relife on account of Natural
Calamities
123203 278550 243116 245370
ii) Nutrition 2644519 3309900 3416050 4309700
iii) Social Security & Welfare 11683522 13145909 13439474 14474503
8. Others 104687 122421 110004 111043
(C ) Economic services 23508239 28443172 37830771 32394740
i) Agriculture and Allied Activities 784226 1019382 934358 994085
ii) Rural Development 81356 99289 95068 121737
iii) Irrigation and Flood control 1085078 1228100 1243300 1337500
iv) Energy 6913837 7185000 10731800 8902500
v) Industries & Minerals 271405 416748 354572 401072
vi) Transport 12197846 14820800 20769500 16990100
vii) Science, Technology &
Environment
323865 262900 301900 374750
viii) Others 1850626 3410953 3400273 3272996
TOTAL (B + C) 140882566 170407721 169029861 193884802
3. Grants-in- AID 8325337 7995641 8045034 1129926
Total Expenditure
(1 +2+3)206593587 243547000 235150792 275408800
Source: Annual Financial Statement 2014-15,Ministry of Finance
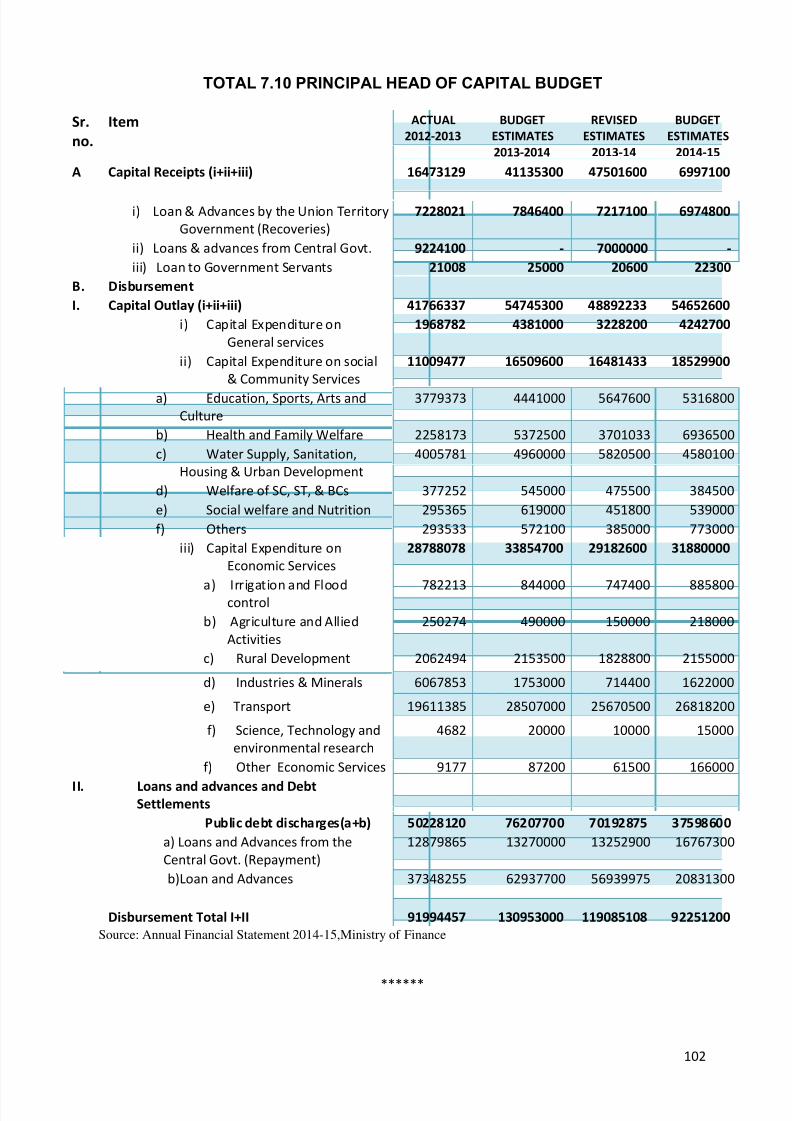
8/20/2019 Statistical+Abstract+of+Delhi+2014
http://slidepdf.com/reader/full/statisticalabstractofdelhi2014 121/190
102
TOTAL 7.10 PRINCIPAL HEAD OF CAPITAL BUDGET
Sr.
no.
Item ACTUAL
2012-2013
BUDGET
ESTIMATES
2013-2014
REVISED
ESTIMATES
2013-14
BUDGET
ESTIMATES
2014-15
A Capital Receipts (i+ii+iii) 16473129 41135300 47501600 6997100
i) Loan & Advances by the Union Territory
Government (Recoveries)
7228021 7846400 7217100 6974800
ii) Loans & advances from Central Govt. 9224100 - 7000000 -
iii) Loan to Government Servants 21008 25000 20600 22300
B. Disbursement
I. Capital Outlay (i+ii+iii) 41766337 54745300 48892233 54652600
i) Capital Expenditure on
General services
1968782 4381000 3228200 4242700
ii) Capital Expenditure on social
& Community Services
11009477 16509600 16481433 18529900
a) Education, Sports, Arts and
Culture
3779373 4441000 5647600 5316800
b) Health and Family Welfare 2258173 5372500 3701033 6936500
c) Water Supply, Sanitation,
Housing & Urban Development
4005781 4960000 5820500 4580100
d) Welfare of SC, ST, & BCs 377252 545000 475500 384500
e) Social welfare and Nutrition 295365 619000 451800 539000
f) Others 293533 572100 385000 773000
iii) Capital Expenditure on
Economic Services
28788078 33854700 29182600 31880000
a) Irrigation and Floodcontrol
782213 844000 747400 885800
b) Agriculture and Allied
Activities
250274 490000 150000 218000
c) Rural Development 2062494 2153500 1828800 2155000
d) Industries & Minerals 6067853 1753000 714400 1622000
e) Transport 19611385 28507000 25670500 26818200
f) Science, Technology and
environmental research
4682 20000 10000 15000
f) Other Economic Services 9177 87200 61500 166000
II. Loans and advances and DebtSettlements
Public debt discharges(a+b) 50228120 76207700 70192875 37598600
a) Loans and Advances from the
Central Govt. (Repayment)
12879865 13270000 13252900 16767300
b)Loan and Advances 37348255 62937700 56939975 20831300
Disbursement Total I+II 91994457 130953000 119085108 92251200
Source: Annual Financial Statement 2014-15,Ministry of Finance
******

8/20/2019 Statistical+Abstract+of+Delhi+2014
http://slidepdf.com/reader/full/statisticalabstractofdelhi2014 122/190
103
CHAPTER EIGHTECONOMIC INDICATORS
•
State Domestic Product & related aggregates• Gross State Domestic Product by broad Economic Activity
• Net State Domestic Product by broad Economic Activity
• Percentage Distribution of GSDP by economic activity at ConstantPrices 2004-05
• Percentage Distribution of NSDP by economic activity at ConstantPrices 2004-05
• State/UT Per capita Income
• Monthly per capita Expenditure
• Selected Economic(Poverty) Indicators of States / UT

8/20/2019 Statistical+Abstract+of+Delhi+2014
http://slidepdf.com/reader/full/statisticalabstractofdelhi2014 123/190
104
State Income of Delhi and it contributory elements can be considered as
effective indicators of the economy of the State.
The estimates of State Domestic Product are prepared for all the sectors of
economy both in terms of Gross and Net basis. The difference between the two is that
in the gross estimates, no deduction is made for Consumption of Fixed Capital (CFC)
which takes place in the process of production, whereas in the net estimates, CFC is
subtracted from the gross value figures. Net State Domestic Product is also called
State Income.
For the purpose of estimation of SDP, the whole economy of the state has been
divided into seventeen (17) sub-sectors in conformity with the procedure followed at
the national level to estimate the National Income estimates. The procedure is
followed by each state and union territory of the country to make the estimates
comparable. The fourteen sectors have been further categorized into three broad
sectors as follows.
(i) Primary Sector
• Agriculture and Livestock
• Forestry and logging
• Fishing
• Mining and Quarrying(ii) Secondary Sector
• Manufacturing (Registered)
• Manufacturing (Un-Registered)
• Electricity, Gas and Water Supply• Construction
(iii) Tertiary Sector
• Trade, Hotels and Restaurants.
• Railways
• Transport by Other Means
• Storage
• Communication
• Banking and Insurance
• Real Estate, ownership of dwellings, business and legal services
• Public Administration
CHAPTER 8:ECONOMIC INDICATORS

8/20/2019 Statistical+Abstract+of+Delhi+2014
http://slidepdf.com/reader/full/statisticalabstractofdelhi2014 124/190
105
• Other services
The estimates of State Domestic Product (SDP) of the National Capital Territory of
Delhi are prepared at current and constant prices by the Directorate of Economics &
Statistics, Delhi. The estimates of SDP at current prices are obtained by evaluating
the product at current prices prevailing during the year. The estimates of SDP at
current prices, over the time do not reveal actual economic growth because these
contain the combined effect of (i) the changes in volume of goods and services and (ii)
the changes in the prices of goods and services. In order to eliminate the effect of
price changes/inflation, the estimates of SDP are also prepared by evaluating the
goods and services at the prices prevailing in the fixed year known as base year and
are known as the estimates of State Domestic Product at constant prices. (i.e. 2004-
05 prices)
This chapter deals with information pertaining to State Income by Industry at
current prices and at constant (2004-2005) Prices.
Broad Economic Activities are divided into three sectors namely.
I. The Primary sector includes Agriculture and allied activities, Mining & quarrying.
II. The Secondary sector includes Manufacturing, Electricity, Gas, Water, Supply
and Construction Sector.
III. The territory sector includes Trade, Hotel and Restaurants, Transport storage &
Communications, Finance, Insurance, Real Estate/ Business services,
Community, Social & Personal Services.
Table 8.1 to 8.5 presents GSDP/NSDP by Broad Economic Activity at current
and constant prices while table 8.6 & 8.7 presents per capita income & monthly per
capita expenditure in Delhi with comparison to other states respectively. Table 8.7
presents the population below poverty line. Data is compiled and provided by DES.

8/20/2019 Statistical+Abstract+of+Delhi+2014
http://slidepdf.com/reader/full/statisticalabstractofdelhi2014 125/190
106
TABLE 8.1 STATE DOMESTIC PRODUCT & RELATED AGGREGATES
Year GSDP (Rs. In Lakh) NSDP (Rs. In Lakh) Per Capita Income(in Rs.)
CurrentPrices
At 2004-05 Prices
CurrentPrices
At 2004-05 Prices
CurrentPrices
At 2004-05Prices
2004-05 10032452 10032452 9471686 9471686 63877 63877
2005-06 11537425 11040607 10912742 10447341 72208 69128
2006-07 13558365 12407958 12827639 11744414 83275 76243
2007-08 15794718 13796086 14951854 13068304 95241 83243
2008-09 18953312 15579109 17882152 14696123 111756 91845
2009-10 21761858 16863753 20537637 15904354 125936 97525
2010-11(3rd RE)
25275279 18076539 24123363 17223524 145129 103619
2011-12(2nd RE)
29695688 19754364 28271666 18767200 166883 110780
2012-13(1st RE)
34822116 21597106 33252052 20539577 192587 118960
2013-14(AE)
40457565 23615645 38709664 22465527 219979 127667
RE-Revised Estimate, A- Advanced Estimate
Source: Directorate of Economics & Statistics

8/20/2019 Statistical+Abstract+of+Delhi+2014
http://slidepdf.com/reader/full/statisticalabstractofdelhi2014 126/190
107
TABLE 8.2 GROSS STATE DOMESTIC PRODUCT BY BROAD ECONOMIC ACTIVITY
Year Current Prices (Rs. In Lakh) Constant Prices (2004-05) (Rs. In Lakh)
PrimarySector
SecondarySector
TerritorySector
TotalGDSP
PrimarySector
SecondarySector
TerritorySector
TotalGDSP
2004-05 109901 1849876 8072675 10932452 109901 1870876 8072675 10053452
2005-06 111478 2048930 9377017 11537425 105697 1952555 8982355 11040607
2006-07 118673 2365419 11074273 13558365 106908 2091464 10209586 12407958
2007-08 123807 2773232 12897679 15794718 103907 2197891 11494288 13796086
2008-09 134055 3180591 15638666 18953312 103234 2325425 13150450 15579109
2009-10 192262 3514594 18055002 21761858 130696 2346119 14386938 16863753
2010-11(3
rdRE)
236303 3597146 21441830 25275279 141034 2196235 15739270 18076539
2011-12(2
ndRE)
281899 3847591 25566198 29695688 143385 2107156 17503823 19754364
2012-13
(1st RE)
341941 4225860 30254315 34822116 145899 2144190 19307017 21597106
2013-14(AE)
366803 4598681 35492081 40457565 150589 2173260 21291795 23615645
RE-Revised Estimate, A- Advanced Estimate
Source: Directorate of Economics & Statistics

8/20/2019 Statistical+Abstract+of+Delhi+2014
http://slidepdf.com/reader/full/statisticalabstractofdelhi2014 127/190
108
TABLE 8.3 NET STATE DOMESTIC PRODUCT BY BROAD ECONOMICACTIVITY
Year Current Prices(Rs in Lakh) Constant Prices (2004-05) (Rs. In Lakh)
PrimarySector
SecondarySector
TerritorySector
TotalNDSP
PrimarySector
SecondarySector
TerritorySector
TotalNDSP
2004-05 108442 1638698 7724546 9471686 108442 1638698 7724546 9471686
2005-06 110014 1818493 8984235 10912742 104297 1733963 8609081 10447341
2006-07 117023 2085379 10625237 12827639 105422 1836648 9802344 11744414
2007-08 121886 2415317 12414651 14951854 102271 1887203 11078830 13068304
2008-09 131867 2762075 14988209 17882152 101494 1970798 12623831 14696123
2009-10 189672 3009704 17338261 20537637 128831 1939454 13836069 15904354
2010-11
(3rd RE)
233086 3229012 20661265 24123363 138902 1908374 15176248 17223524
2011-12(2
ndRE)
278505 3395313 24597848 28271666 141267 1780484 16845449 18767200
2012-13(1
stRE)
338145 3745245 29168662 33252052 143655 1802582 18593340 20539577
2013-14(AE)
362755 4072180 34274728 38709664 148313 1812579 20504636 22465527
RE-Revised Estimate, A- Advanced Estimate
Source: Directorate of Economics & Statistics

8/20/2019 Statistical+Abstract+of+Delhi+2014
http://slidepdf.com/reader/full/statisticalabstractofdelhi2014 128/190
109
TABLE 8.4 PERCENTAGE DISTRIBUTION OF GSDP BY ECONOMIC ACTIVITY ATCONSTANT PRICES Base Year 2004-05
Year Agricultureand AlliedActivities
Mining &Quarrying
Manu-facturing
Electricity,Gas &Water Supply
Const-ruction
Trade,Hotels &Restura-
rents
Transport,Storage &Communi-
cations
Fin, Ins,Real
EstateBusinessServices
Commu-nity,
Social &PersonalServices
2004-05 1.09 0.0 7.31 1.41 9.73 20.99 8.83 35.77 14.87
2005-06 0.95 0.00 7.19 1.26 9.24 22.03 7.98 36.70 14.65
2006-07 0.86 0.00 6.86 1.47 8.53 21.52 8.26 38.79 13.71
2007-08 0.75 0.00 6.82 1.36 7.74 22.05 8.26 40.50 12.50
2008-09 0.66 0.0 5.86 1.98 7.09 19.34 8.34 40.99 15.74
2009-10 0.77 0.00 5.49 1.59 6.73 18.08 8.34 43.76 15.13
2010-11(3
rdRE)
0.78 0.00 6.00 0.77 5.39 18.82 8.34 45.65 14.26
2011-12(2nd
RE) 0.73 0.00 5.43 0.77 4.47 19.39 7.99 46.17 15.06
2012-13(1
stRE)
0.68 0.00 5.01 0.68 4.24 20.19 7.59 47.58 14.07
2013-14(AE)
0.63 0.00 4.66 0.56 3.99 21.49 7.44 47.34 13.91
RE-Revised Estimate, A- Advanced Estimate
Source: Directorate of Economics & Statistics

8/20/2019 Statistical+Abstract+of+Delhi+2014
http://slidepdf.com/reader/full/statisticalabstractofdelhi2014 129/190
110
TABLE 8.5 PERCENTAGE DISTRIBUTION OF NSDP BY ECONOMIC ACTIVITY ATCONSTANT PRICE Base Year 2004-05
Year Agricultur e andAllied
Activities
Mining &Quarrying
Manuf-acturing
ElectricityGas &Water Supply
Const-ruction
Trade,Hotels &Restau-
rants
Transport,Storage &Communi-
cations
Fin, Ins,Real
Estate/BusinessServices
Community, Social &PersonalServices
2004-05 1.14 0.00 6.73 0.67 9.90 22.02 8.58 36.61 14.35
2005-06 1.00 0.00 6.64 0.58 9.38 23.05 7.74 37.54 14.07
2006-07 0.90 0.00 6.33 0.70 8.61 22.50 8.03 39.78 13.15
2007-08 0.78 0.00 6.37 0.31 7.76 23.04 8.08 41.58 12.07
2008-09 0.69 0.000 5.41 0.97 7.03 20.26 8.12 42.30 15.22
2009-10 0.81 0.00 5.13 0.45 6.62 18.92 8.06 45.20 14.81
2010-11(3
rdRE)
0.80 0.00 5.51 0.37 5.20 19.49 8.09 46.69 13.85
2011-12(2
ndRE)
0.75 0.00 4.92 0.37 4.19 20.16 7.55 47.34 14.71
2012-13(1
stRE)
0.70 0.00 4.49 0.33 3.95 20.98 7.07 48.76 13.71
2013-14(AE)
0.65 0.00 4.14 0.27 3.67 23.35 6.84 48.49 13.58
R-Revised P – Provisional Q - Quick Estimates A - AdvancedSource: Directorate of Economics & Statistics

8/20/2019 Statistical+Abstract+of+Delhi+2014
http://slidepdf.com/reader/full/statisticalabstractofdelhi2014 130/190
111
TABLE 8.6 SELECTED ECONOMIC INDICATORS OF STATES/UT:PER CAPITA INCOME (Rs.)
India/States Per Capita Income(Rs.)
Base
Year
2004-05
At
Constant
Prices
(2011-12)
At
Current
Prices
(2011-12)
At
Constant
Prices
(2012-13)
At
Current
Prices
(2012-13)
At
Constant
Prices
(2013-14)
At
Current
Prices
(2013-14)
INDIA 24143 38048 61855 38856 67839 39904 74380Andhra
Pradesh
25321
42589 69742 44526 78958 46788 88876
Arunachal
Pradesh
26610
35231 68667 35845 76218 37767 84869
Assam 16782 22420 36415 23448 40475 24533 46354
Bihar 7914 13149 22582 14362 27202 15650 31229
Chhattisgarh 18559 27163 48366 27421 52983 28113 58297
Delhi 63877 110780 166883 118960 192587 127667 219979
Goa 76968 129397 211570 132121 200514 NA NA
Gujarat 32021 57447 87175 61220 96976 NA NA
Haryana 37972 61716 106358 64136 119158 67317 132089
Himachal
Pradesh
33348
49203 75185 51730 83899 54494 92300
Jammu &
Kashmir
21734
28833 46734 29754 52250 31054 58593
Jharkhand 18510 25265 36554 27010 40238 28882 46131
Karnataka 26882 41492 68053 42976 76578 45024 84709
Kerala 31871 52095 78387 56115 88527 NA NA
Madhya
Pradesh
15442
23447 37979 25463 44989 27917 54030
Maharashtra 35915 61468 93748 64218 103991 69584 114392
Manipur 18640 22739 34518 22395 36937 NA NA
Meghalaya 24086 34217 50316 34004 52090 37439 58522
Mizoram 24662 37921 53624 39347 63413 NA NA
Nagaland 30441 46340 63781 48111 70274 49963 77529
Orissa 17650 24151 41876 25415 49241 25891 54241
Punjab 33103 46325 76895 47834 84526 49411 92638
Rajasthan 18565 28429 52735 29244 59097 30120 65098
Sikkim 26693 73704 130127 78427 151395 83527 176491
Tamil Nadu 30062 57093 89050 58360 98628 62361 112664
Tripura 24394 39382 54077 42315 60963 NA NA
Uttar Pradesh 12950 17980 30071 18595 33616 19234 37630
Uttrakhand 24726 52607 85372 54462 92191 56822 103349
West Bengal 22649 32164 53383 33889 61352 36527 69413
Andaman &
nicobar
40921
68356 89642 71896 97687 72716 107418
Chandigarh 74173 80801 136883 79153 141926 82798 156951
Pondicherry48302 80517 103149 87177 114034 96222 148784
Source: Central Statistical Organization, Govt. of India
Note Population as per the Provisional Figures released by RGI for Census 2011 have been used

8/20/2019 Statistical+Abstract+of+Delhi+2014
http://slidepdf.com/reader/full/statisticalabstractofdelhi2014 131/190
112
TABLE 8.7 MONTHLY PER CAPITA EXPENDITURE
India/States Monthly per Capita
Expenditure (inRs)
63rd NSS Round
(July 2006-June2007)
Monthly per CapitaExpenditure (in Rs)
64th
NSS Round(July 2007-June
2008)
Monthly per Capita
Expenditure(in Rs) 66
thNSS
Round
(July 2009-June2010)
Monthly per CapitaExpenditure
(in Rs) 68th
NSSRound
(July 2011-June
2012)
Rural Urban Rural Urban Rural Urban Rural Urban
INDIA 695.16 1312.50 772.36 1471.54 1054 1984 1430 2630
AndhraPradesh
727.14 1360.68 816.17 1549.55 1234 2338 1754 2685
ArunachalPradesh
916.62 NA 1087.48 NA 1546 1947 1782 2654
Assam 721.37 1368.88 798.79 1451.92 1003 1755 1219 2189
Bihar 541.33 864.96 597.64 1080.19 780 1238 1127 1507
Chhatisgarh 528.31 1048.27 581.64 1502.86 784 1647 1027 1868
Delhi 1304.27 1972.19 1703.30 2046.43 1761 2905 2561 3842
Goa NA NA NA NA NA NA 2408 3051
Gujarat 796.58 1421.96 874.70 1471.32 1110 1909 1536 2581
Haryana 1012.73 1336.09 1034.45 1627.57 1510 2321 2176 3817
HimachalPradesh
1117.49 1732.91 1148.44 NA 1536 2654 2034 3259
Jammu &Kashmir
972.76 1284.54 992.76 1396.86 1344 1759 1743 2485
Jharkhand 553.02 1119.24 592.38 1395.39 825 1584 1006 2018
Karnataka 624.27 1180.16 818.97 1667.73 1020 2053 1561 3026
Kerala 1250.35 1681.48 1382.92 1947.96 1835 2413 2669 3408
MadhyaPradesh
514.93 1001.70 633.76 1189.95 903 1666 1152 2058
Maharashtra 776.09 1673.49 867.91 1709.08 1153 2437 1619 3189
Manipur 796.34 NA 842.92 1007.98 1027 1106 1502 1483
Meghalaya 774.92 NA 904.34 NA 1110 1629 1475 2436
Mizoram NA 1564.19 NA 1800.23 1262 1947 1644 2568
Nagaland NA NA NA NA NA NA 2059 2284
Odisha 458.56 1072.13 558.95 1438.35 818 1548 1003 1941
Punjab 1198.13 1609.16 1272.53 1632.92 1649 2109 2345 2794
Rajasthan 767.39 1184.70 801.23 1265.10 1179 1663 1598 2442
Sikkim NA NA NA NA NA NA 1565 2608
Tamil Nadu 728.78 1227.19 834.12 1409.82 1160 1948 1693 2622
Tripura 577.26 1170.26 801.68 NA 1176 1871 1334 2144
Uttar Pradesh
653.18 996.38 680.46 1120.84 899 1574 1156 2051
Uttarakhand NA 1154.77 901.00 NA 1747 1745 1726 2339
West Bengal 629.86 1371.26 701.59 1452.04 952 1965 1291 2591
Source: 63rd
, 64th
and 66th
NSS Round, Household Expenditure Report
Source: Directorate of Economics & Statistics

8/20/2019 Statistical+Abstract+of+Delhi+2014
http://slidepdf.com/reader/full/statisticalabstractofdelhi2014 132/190
113
TABLE 8.8 SELECTED ECONOMIC (POVERTY) INDICATORS OF STATES/UTNumber and Percentage of Population below poverty line by states/UT-2009-10
(Tendulkar Methodology)
India/States Rural Urban Total
%age of Persons
No. of Persons(Lakhs)
%age of Persons
No. of Persons(Lakhs)
%age of Persons
No. of Persons(Lakhs)
INDIA 33.8 2782.1 20.9 764.7 29.8 3546.8Andhra Pradesh 22.8 127.9 17.7 48.7 21.1 176.6
ArunachalPradesh
26.2 2.7 24.9 0.8 25.9 3.5
Assam 39.9 105.3 26.1 11.2 37.9 116.4
Bihar 55.3 498.7 39.4 44.8 53.5 543.5
Chhatisgarh 56.1 108.3 23.8 13.6 48.7 121.9
Delhi 7.7 0.3 14.4 22.9 14.2 23.3
Goa 11.5 0.6 6.9 0.6 8.7 1.3
Gujarat 26.7 91.6 17.9 44.6 23.0 136.2
Haryana 18.6 30.4 23.0 19.6 20.1 50.0
Himachal
Pradesh
9.1 5.6 12.6 0.9 9.5 6.4
Jammu &Kashmir
8.1 7.3 12.8 4.2 9.4 11.5
Jharkhand 41.6 102.2 31.1 24.0 39.1 126.2
Karnataka 26.1 97.4 19.6 44.9 23.6 142.3
Kerala 12.0 21.6 12.1 18.0 12.0 39.6
Madhya Pradesh 42.0 216.9 22.9 44.9 36.7 261.8
Maharashtra 29.5 179.8 18.3 90.9 24.5 270.8
Manipur 47.4 8.8 46.4 3.7 47.1 12.5
Meghalaya 15.3 3.5 24.1 1.4 17.1 4.9
Mizoram 31.1 1.6 11.5 0.6 21.1 2.3
Nagaland 19.3 2.8 25.0 1.4 20.9 4.1
Orissa 39.2 135.5 25.9 17.7 37.0 153.2Puducherry 0.2 0.0 1.6 0.1 1.2 0.1
Punjab 14.6 25.1 18.1 18.4 15.9 43.5
Rajasthan 26.4 133.8 19.9 33.2 24.8 167.0
Sikkim 15.5 0.7 5.0 0.1 13.1 0.8
Tamil Nadu 21.2 78.3 12.8 43.5 17.1 121.8
Tripura 19.8 5.4 10.0 0.9 17.4 6.3
Uttar Pradesh 39.4 600.6 31.7 137.3 37.7 737.9
Uttarakhand 14.9 10.3 25.2 7.5 18.0 17.9
West Bengal 28.8 177.8 22.0 62.5 26.7 240.3
Andaman &Nicobar Island
0.4 0.01 0.3 0.004 0.4 0.01
Chandigarh 10.3 0.03 9.2 1.92 9.2 0.95Dadra and Nagar 55.9 1.02 17.7 0.25 39.1 1.27
Daman and Diu 34.2 0.22 33.0 0.54 33.3 0.75
Lakshwadeep 22.2 0.03 1.7 0.01 6.8 0.04
Notes:
1. Population as on 1st
March 2010 has been used for estimating number of persons below poverty line.
(interpolated between 2001 and 2011 population census)
2. Poverty line of Tamil Nadu is used for Andaman and Nicobar Island.
3. Urban Poverty line of Punjab is used for both rural and urban area of Chandigarh.
4. Poverty line of Maharashtra is used for Dadra & Nagar Haveli
5. Poverty line of Goa is used for Daman & Diu.
6. Poverty line of Kerala is used for Lakshadweep.
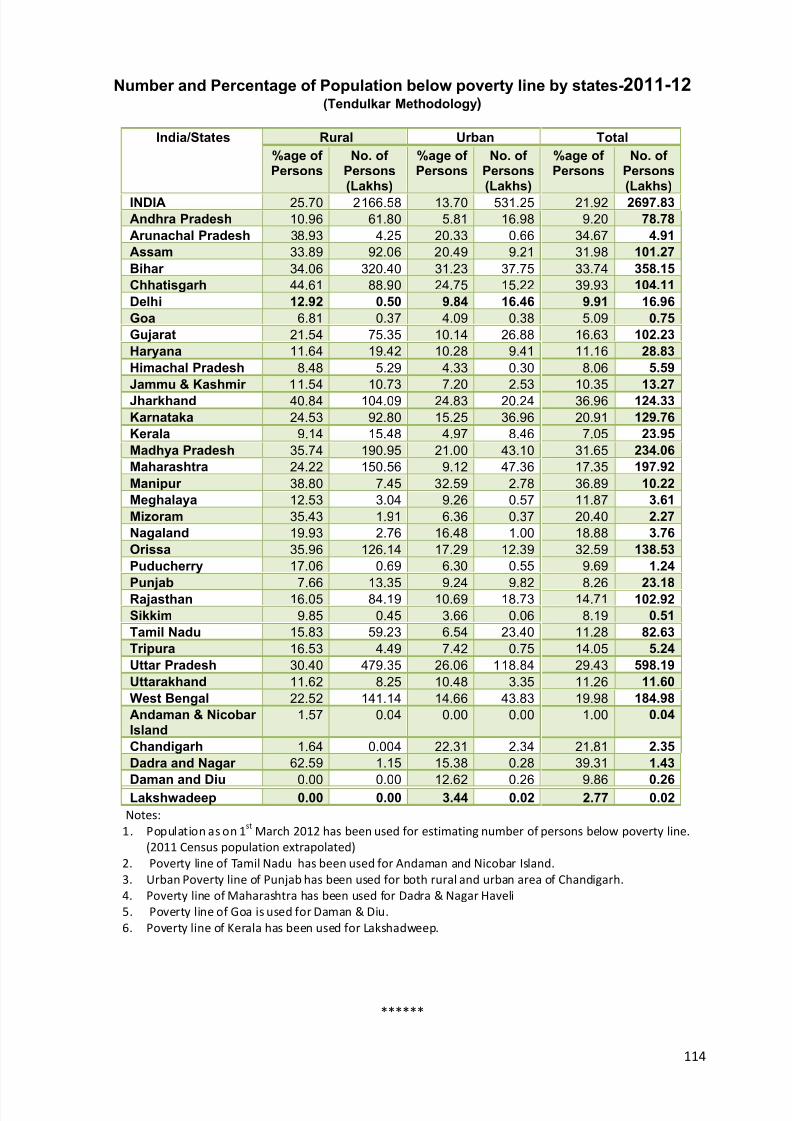
8/20/2019 Statistical+Abstract+of+Delhi+2014
http://slidepdf.com/reader/full/statisticalabstractofdelhi2014 133/190
114
Number and Percentage of Population below poverty line by states-2011-12(Tendulkar Methodology)
India/States Rural Urban Total
%age of Persons
No. of Persons(Lakhs)
%age of Persons
No. of Persons(Lakhs)
%age of Persons
No. of Persons(Lakhs)
INDIA 25.70 2166.58 13.70 531.25 21.92 2697.83
Andhra Pradesh 10.96 61.80 5.81 16.98 9.20 78.78
Arunachal Pradesh 38.93 4.25 20.33 0.66 34.67 4.91
Assam 33.89 92.06 20.49 9.21 31.98 101.27
Bihar 34.06 320.40 31.23 37.75 33.74 358.15
Chhatisgarh 44.61 88.90 24.75 15.22 39.93 104.11
Delhi 12.92 0.50 9.84 16.46 9.91 16.96
Goa 6.81 0.37 4.09 0.38 5.09 0.75
Gujarat 21.54 75.35 10.14 26.88 16.63 102.23
Haryana 11.64 19.42 10.28 9.41 11.16 28.83
Himachal Pradesh 8.48 5.29 4.33 0.30 8.06 5.59
Jammu & Kashmir 11.54 10.73 7.20 2.53 10.35 13.27
Jharkhand 40.84 104.09 24.83 20.24 36.96 124.33
Karnataka 24.53 92.80 15.25 36.96 20.91 129.76
Kerala 9.14 15.48 4.97 8.46 7.05 23.95
Madhya Pradesh 35.74 190.95 21.00 43.10 31.65 234.06
Maharashtra 24.22 150.56 9.12 47.36 17.35 197.92
Manipur 38.80 7.45 32.59 2.78 36.89 10.22
Meghalaya 12.53 3.04 9.26 0.57 11.87 3.61
Mizoram 35.43 1.91 6.36 0.37 20.40 2.27
Nagaland 19.93 2.76 16.48 1.00 18.88 3.76
Orissa 35.96 126.14 17.29 12.39 32.59 138.53
Puducherry 17.06 0.69 6.30 0.55 9.69 1.24
Punjab 7.66 13.35 9.24 9.82 8.26 23.18Rajasthan 16.05 84.19 10.69 18.73 14.71 102.92
Sikkim 9.85 0.45 3.66 0.06 8.19 0.51
Tamil Nadu 15.83 59.23 6.54 23.40 11.28 82.63
Tripura 16.53 4.49 7.42 0.75 14.05 5.24
Uttar Pradesh 30.40 479.35 26.06 118.84 29.43 598.19
Uttarakhand 11.62 8.25 10.48 3.35 11.26 11.60
West Bengal 22.52 141.14 14.66 43.83 19.98 184.98
Andaman & Nicobar Island
1.57 0.04 0.00 0.00 1.00 0.04
Chandigarh 1.64 0.004 22.31 2.34 21.81 2.35
Dadra and Nagar 62.59 1.15 15.38 0.28 39.31 1.43
Daman and Diu 0.00 0.00 12.62 0.26 9.86 0.26Lakshwadeep 0.00 0.00 3.44 0.02 2.77 0.02
Notes:
1. Population as on 1st
March 2012 has been used for estimating number of persons below poverty line.
(2011 Census population extrapolated)
2. Poverty line of Tamil Nadu has been used for Andaman and Nicobar Island.
3. Urban Poverty line of Punjab has been used for both rural and urban area of Chandigarh.
4. Poverty line of Maharashtra has been used for Dadra & Nagar Haveli
5. Poverty line of Goa is used for Daman & Diu.
6. Poverty line of Kerala has been used for Lakshadweep.
******
8/20/2019 Statistical+Abstract+of+Delhi+2014
http://slidepdf.com/reader/full/statisticalabstractofdelhi2014 134/190
115
CHAPTER NINE
EDUCATION
• General Education - Education Institutions
• Enrollment In Educational Institutions
• Teachers In Educational Institutional
• State/UT Wise Gross Enrollment Ratio In Schools For GeneralEducation(2006-2007)
• State/UT Wise Dropout Ratio In Schools For GeneralEducation(2006-2007)
• Results Of Central Board Of Secondary Examination In Delhi &
India• Higher Education - Number Of Higher Education Institutions
• Teaching Faculty in Higher Education
• Enrolment in Higher Education
• Technical/Vocational Training – No. of Institutions
• Enrolment in Technical/Vocational Training
• Number Of Instructors in Technical/Vocational Training
• Literacy Rate For Delhi

8/20/2019 Statistical+Abstract+of+Delhi+2014
http://slidepdf.com/reader/full/statisticalabstractofdelhi2014 135/190
116
Education holds the key to economic growth, social transformation,
modernization and national integration. The National Policy on Education formulated
in 1986 and modified in 1992 aims to provide education of a comparable quality up to
a given level to all students irrespective of their caste, creed residence or sex. It aims
at promotion of a national, a sense of common citizenship and composite culture and
strengthening national integration. It lays stress on the need for a radical
transformation of the education system to improve its quality at all stages and gives
much greater attention to Science and Technology. All children are proposed to beprovided free and compulsory education up to 14 years of age.
This section describes the educational development in Delhi. Tables given in
this section contain data regarding general education, higher education,
technical/vocational training and literacy rate of Delhi.
GENERAL EDUCATION
This section present tables regarding number of schools, number of enrolment,
Teachers employed in the primary, middle & sec. /sr. secondary school of Delhi for the
year 2001-02 to 2013-14. Information regarding State/UT wise Gross Enrollment
Ratio for classes I-V, VI-VIII and IX-XII during the year 2010-11. State/UT wise
Dropout Ratio in Schools for classes I-V, VI-VIII and IX-XII during the year 2010-11 is
also presented in this section. Literacy rate of Delhi was 81.67 % as per 2001 Census
has increased to 86.2% as per 2011 Census. The source of this data is Dte. of Education and Ministry of HRD, Govt. of India respectively.
HIGHER EDUCATION AND TECHNICAL/VOCATIONAL TRAINING
Available information in this section is regarding No. of Colleges, Universities,
Teaching Faculty & No. of Students enrolled for Education. This information is
provided by Dte. Of Higher Education, GNCTD. Apart from this the data source for
vocational training in Delhi is Dte. Of Training and Technical Education GNCTD.
CHAPTER 9:EDUCATION

8/20/2019 Statistical+Abstract+of+Delhi+2014
http://slidepdf.com/reader/full/statisticalabstractofdelhi2014 136/190
117
TABLE9.2 ENROLLMENT IN EDUCATIONAL INSTITUIONS
Year No. of students
Primary Middle Sec/Sr. Secondary Total
Boys Girls Total Boys Girls Total Boys Girls Total Boys Girls
2005-
06
937711 849100 1786811 466898 419362 886260 353620 337487 691107 1758229 1605949
2006-
07
882968 768051 1651019 468942 419553 888495 404398 352056 756454 1756308 1539660
2007-
08
896591 777969 1674560 509189 446244 955433 414159 360676 774835 1819939 1584888
2008-
09
897235 788278 1685513 521525 446652 968177 525021 387566 912587 1943781 1622496
2009-
10
904651 795288 1699939 540708 456572 997280 486375 419382 905757 1932334 1671242
2010-
11
920149 810974 1731123 530569 452380 982949 566251 491541 1057792 2016969 1754895
2011-
12
963694 844137 1807831 546394 464236 1010630 629895 539721 1169616 2139983 1848094
2012-
13
961165 846607 1807772 574348 489551 1063899 658449 565940 1224389 2193962 1902098
2013-
14
980954 850725 1831679 600410 516570 1116980 667515 578419 1245934 2248879 1945714
GENERAL EDUCATION
TABLE9.1 EDUCATIONAL INSTITUTIONS
Year Number of Educational Institutions
Total No. of
Primary
Schools
Total No. of Middle
Schools
Total No. of Sec/Sr.
Secondary Schools
Total No. of
Schools
2001-02 2406 679 1605 4690
2002-03 2106 661 1624 4391
2003-04 2126 671 1678 4475
2004-05 2463 635 1712 4810
2005-06 2617 645 1750 5012
2006-07 2595 640 1750 4985
2007-08 2569 640 1768 4977
2008-09 2593 659 1759 5011
2009-10 2586 583 1824 4993
2010-11 2563 588 1872 5023
2011-12 2581 600 1890 5071
2012-13 2580 564 1962 5106
2013-14 2657 728 2016 5401

8/20/2019 Statistical+Abstract+of+Delhi+2014
http://slidepdf.com/reader/full/statisticalabstractofdelhi2014 137/190
118
TABLE 9.3 TEACHERS IN EDUCATIONAL INSTITUTIONS
Year No. of teachers
Primary Middle Sec/Sr. Secondary Total
Male Female Total Male Female Total Male Female Total Male Female
2001-02 8258 14680 22938 2872 5333 8205 22734 33039 55773 33864 53052
2002-03 7408 15203 22611 1911 6384 8295 19530 38485 58015 28849 60072
2003-04 7630 15300 22930 2468 6724 9192 20032 39031 59063 30130 61055
2004-05 7560 15415 22975 2473 6737 9210 20064 39082 59146 30097 61234
2005-06 6728 19228 25956 1823 5403 7226 20248 40901 61149 28799 65532
2006-07 7467 16440 23907 1611 6237 7848 20239 45791 66030 29317 68468
2007-08 6233 15645 21878 1572 7240 8812 20911 48210 69121 28716 71095
2008-09
7693 18539 26232 1580 6293 7873 21065 50133 71198 30338 74965
2009-10
8373 19610 27983 1222 6075 7297 22152 52619 74771 31747 78304
2010-11
8353 20335 28688 1269 6213 7482 23132 55982 79114 32754 82530
2011-12
7867 20086 27953 1284 6745 8029 24092 58281 82373 33243 85112
2012-13
7760 20533 28293 1112 6118 7230 25682 64348 90030 34554 90999
2013-14
7330 20982 28312 1471 7845 9316 28884 70873 99757 37685 99700
Note: It includes Govt. Aided and Unaided (recognized) schools Source: Directorate of Education2010-11(as on 30-9-2011)

8/20/2019 Statistical+Abstract+of+Delhi+2014
http://slidepdf.com/reader/full/statisticalabstractofdelhi2014 138/190
119
TABLE 9.4 STATE/UT WISE GROSS ENROLLMENT RATIO IN SCHOOLS FORGENERAL EDUCATION (2010-11)
India/State Classes I - V(6-10 years)
Classes VI -VIII(11- 13 years)
Boys Girls Total Boys Girls TotalIndia 114.9 116.3 115.5 87.5 82.9 85.2
Andhra Pradesh 99.7 99.4 99.5 80.3 79.9 80.1
Arunachal Pradesh 184.5 176.9 180.8 108.5 102.6 105.5
Assam 93.1 95.6 94.3 67.2 68.7 67.9
Bihar 131.3 123.6 127.7 68.4 60.4 64.6
Chhatisgarh 125.6 120.0 122.8 90.2 84.7 87.5
Delhi 126.0 129.6 127.7 110.9 106.4 108.8
Goa 106.9 101.5 104.3 99.2 92.2 95.8
Gujarat 119.4 121.4 120.3 89.5 81.5 85.7
Haryana 90.6 100.2 94.9 82.3 84.8 83.5
Himachal Pradesh 109.1 109.4 109.2 116.0 111.4 113.8
Jammu & Kashmir 108.3 111.7 109.9 96.6 92.6 94.7
Jharkhand 145.9 148.5 147.1 81.7 81.0 81.3
Karnataka 105.2 104.1 104.7 92.2 89.1 90.7
Kerala 91.4 91.5 91.4 106.5 101.3 103.9
Madhya Pradesh 131.2 139.7 135.2 100.2 102.6 101.4
Maharashtra 105.5 103.7 104.7 95.1 89.6 92.4
Manipur 195.7 188.4 192.1 108.5 100.8 104.6
Meghalaya 193.7 196.3 195.0 85.9 96.2 91.0
Mizoram 191.7 180.0 186.0 108.2 101.3 104.8
Nagaland 103.7 102.8 103.3 59.4 60.7 60..
Orissa 118.7 120.1 119.4 83.3 80.7 82.0
Punjab 83.3 85.5 84.3 82.0 79.4 80.8
Rajasthan 110.3 109.5 109.9 91.0 73.0 82.4
Sikkim 176.4 172.6 174.5 77.4 94.3 85.8
Tamil Nadu 111.0 112.6 111.8 113.0 111.5 112.3Tripura 134.9 133.3 134.1 92.2 91.5 91.9
Uttar Pradesh 123.8 130.4 126.9 84.1 75.5 79.9
Uttrakhand 107.9 110.2 109.0 102.6 109.2 105.8
West Bengal 91.5 93.9 92.7 84.6 88.0 86.3
Source: Statistics of school education 2010-11, Ministry of HRD, Govt. of India
Contd……

8/20/2019 Statistical+Abstract+of+Delhi+2014
http://slidepdf.com/reader/full/statisticalabstractofdelhi2014 139/190
120
TABLE 9.4 STATE/UT WISE GROSS ENROLLMENT RATIO IN SCHOOLS FORGENERAL EDUCATION (2010-11)
India/State Classes IX - X(14-15 years)
Classes XI -XII(16- 17 years)
Boys Girls Total Boys Girls Total
India 69.2 60.9 65.2 42.3 36.2 39.4Andhra Pradesh 67.1 67.3 67.2 50.1 44.9 47.5
Arunachal Pradesh 73.3 67.9 70.6 49.1 45.7 47.5
Assam 52.0 46.9 49.5 18.2 14.6 16.4
Bihar 46.3 37.0 41.8 24.1 18.0 21.2
Chhatisgarh 63.6 58.9 61.3 36.9 30.0 33.5
Delhi 101.9 98.4 100.2 65.1 64.2 64.7
Goa 67.8 64.7 66.3 57.2 59.2 58.2
Gujarat 71.3 56.5 64.3 40.0 33.5 36.9
Haryana 71.5 73.9 72.6 66.3 63.3 64.9
Himachal Pradesh 102.4 101.0 101.7 78.4 76.9 77.7
Jammu & Kashmir 66.8 63.2 65.1 42.9 40.9 42.0
Jharkhand 47.4 63.2 65.1 13.3 11.8 12.6
Karnataka 74.0 43.1 45.3 41.9 43.6 42.8
Kerala 101.6 99.7 100.6 64.1 72.1 68.0
Madhya Pradesh 80.4 52.8 67.0 54.4 37.5 46.3
Maharashtra 76.0 71.2 73.7 61.3 51.1 56.4
Manipur 83.5 80.1 81.8 39.0 32.1 35.5
Meghalaya 49.0 49.9 49.5 13.7 17.3 15.5
Mizoram 75.4 78.3 76.8 41.2 40.2 40.7
Nagaland 27.4 29.5 28.4 18.3 16.7 17.5
Orissa 60.7 56.8 58.8 26.4 21.6 24.0
Punjab 64.8 65.8 65.2 42.2 42.1 42.2
Rajasthan 72.4 50.1 61.8 49.9 31.3 41.1
Sikkim 53.2 50.1 61.8 29.0 31.8 30.4
Tamil Nadu 81.4 83.3 82.3 45.1 55.9 50.4
Tripura 73.0 73.3 73.1 31.9 30.8 35.8
Uttar Pradesh 75.0 60.4 68.1 40.2 30.8 35.8
Uttrakhand 89.0 84.8 87.0 59.0 57.4 58.3
West Bengal 58.3 59.7 59.0 35.0 31.6 33.3
Source: Statistics of school education 2010-11, Ministry of HRD, Govt. of India

8/20/2019 Statistical+Abstract+of+Delhi+2014
http://slidepdf.com/reader/full/statisticalabstractofdelhi2014 140/190
121
TABLE 9.5 STATE/UT WISE DROPOUT RATIO IN SCHOOLS FOR GENERAL
EDUCATION (2010-11)
India/State Classes I - V Classes I -VIII Classes I – X
Boys Girls Total Boys Girls Total Boys Girls Total
India 29.0 25.4 27.4 40.6 41.2 40.8 50.2 47.7 49.2
Andhra Pradesh 18.1 16.7 17.4 33.0 32.7 32.9 45.8 46.6 46.2
Arunachal Pradesh 43.8 42.1 43.0 51.7 49.1 50.5 62.3 61.3 61.7
Assam 33.2 26.4 29.9 49.8 58.2 54.0 76.8 78.1 77.4
Bihar 39.2 30.7 35.7 58.5 58.0 58.3 64.4 58.9 62.2
Delhi 3.7 8.5 5.9 - - - 19.7 26.3 22.9
Goa - 2.4 - - - - 29.3 26.9 28.1
Gujarat 36.9 6.6 25.7 44.6 49.4 46.7 61.1 52.4 57.9
Haryana 9.8 8.9 9.4 5.3 3.9 4.6 13.2 7.1 10.4
Himachal Pradesh 3.9 3.6 3.8 - - - 15.2 17.0 16.0
Jammu & Kashmir 9.8 6.8 8.4 7.8 4.0 6.1 47.1 38.9 43.6
Jharkhand* 31.0 25.6 28.4 48.4 41.2 45.1 70.6 68.1 69.5
Karnataka 9.2 8.5 8.9 20.1 21.5 20.8 44.5 42.1 43.3
Kerala - - - - - - - - -
Madhya Pradesh 33.5 25.0 29.5 34.0 27.0 30.7 44.3 59.3 51.1
Maharashtra 21.4 19.0 20.3 24.5 27.4 25.9 36.5 40.0 38.2
Manipur 46.1 45.3 45.7 51.7 53.9 52.8 45.7 44.8 45.3
meghalaya 61.0 55.7 58.4 72.5 68.3 70.4 76.7 76.7 77.4
Mizoram 37.1 38.7 37.9 37.5 35.7 36.7 55.0 52.3 53.7
Nagaland 40.1 39.8 39.9 45.2 45.6 45.4 75.8 74.4 75.1
Orissa 11.0 2.4 7.0 54.4 55.6 55.0 67.2 59.7 64.0
Punjab 4.4 14.9 9.4 5.2 13.7 9.2 30.2 30.7 30.5
Rajasthan 49.9 51.5 50.6 49.2 58.1 53.3 68.2 69.0 68.5
Sikkim 14.9 - 6.8 47.8 29.6 39.1 63.7 56.5 60.2
Tamil Nadu - - - 7.8 8.2 8.0 28.2 23.6 25.9Tripura 31.9 30.3 31.3 50.2 45.9 48.2 59.1 57.5 58.4
Uttar Pradesh33.5
34.8 34.1 49.3 50.2 49.7 29.8 14.4 24.0
Uttarakhand * 33.5 32.2 32.9 33.7 29.3 31.6 31.8 41.3 36.6
West Bengal 29.8 27.0 28.4 50.4 47.7 49.1 64.9 63.5 64.2
*Dropout rates are shown combined with the respective parent state.
Note-zero indicates that either dropout rate is zero or less then zero.
Source: Statistics of school education 2010-11, Ministry of HRD, Govt. of India

8/20/2019 Statistical+Abstract+of+Delhi+2014
http://slidepdf.com/reader/full/statisticalabstractofdelhi2014 141/190
122
TABLE 9.6 RESULTS OF CENTRAL BOARD OF SECONDARY EXAMINATION IN
DELHI & INDIA
Year Secondary Sr. Secondary
Delhi India Delhi India
Pass Percentage Pass Percentage Pass Percentage Pass Percentage
Boys Girls Total Boys Girls Total Boys Girls Total Boys Girls Total
1999 46.94 50.92 48.78 64.50 63.96 64.27 62.67 75.77 68.86 70.80 79.39 74.49
2000 48.46 51.85 50.03 65.57 65.12 65.37 64.75 78.91 71.48 72.11 81.94 76.35
2001 48.16 51.54 49.72 66.84 66.29 66.61 66.68 77.40 71.75 71.42 80.22 75.20
2002 53.59 56.47 54.91 69.64 69.24 69.53 64.86 77.74 71.04 70.91 80.86 75.20
2003 57.67 59.57 57.47 67.49 68.75 68.02 68.75 81.22 74.63 68.62 80.33 73.59
2004 57.54 62.32 59.75 71.46 73.28 72.22 69.43 82.58 75.75 71.29 82.28 76.00
2005 59.41 62.51 60.84 74.13 75.26 74.60 72.59 82.99 77.61 73.78 83.17 77.80
2006 67.23 69.10 68.11 76.77 77.70 77.16 75.12 83.51 79.16 75.93 84.41 79.55
2007 76.75 77.68 77.18 84.24 84.72 84.44 78.28 85.88 81.93 77.37 85.02 80.64
2008 82.10 83.75 82.87 86.46 87.96 87.08 80.65 86.93 83.69 77.59 85.41 80.91
2009 87.21 88.25 87.70 88.18 89.78 88.84 80.80 88.04 84.25 77.40 85.94 81.00
2010
88.15 90.05 89.04 88.30 90.68 89.28 81.12 89.13 84.97 75.90 85.28 79.87
2011
95.43 96.33 95.85 96.28 97.08 96.61 81.58 89.72 85.45 76.78 86.57 80.88
2012
97.57 98.32 97.92 97.98 98.48 98.19 81.14 90.06 85.40 75.80 86.21 80.19
2013
98.11 98.74 98.40 98.64 98.94 98.76 82.44 91.42 86.78 77.78 87.98 82.1
2014
97.88 98.81 98.31 98.74 99.06 98.87 82.09 91.72 86.78 78.27 88.52 82.66
Note: All India includes Ajmer, Chandigarh, Delhi, Guwahati, Chennai & Allahabad
Source: Central Board of Secondary Examination
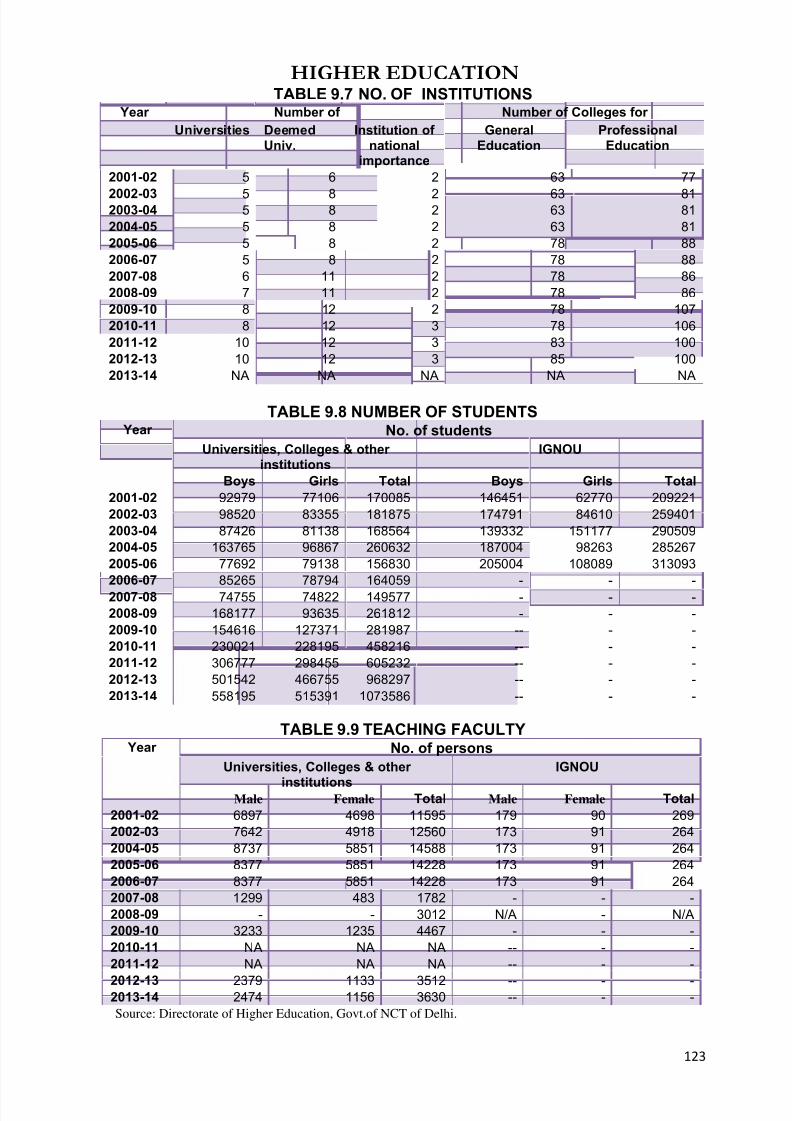
8/20/2019 Statistical+Abstract+of+Delhi+2014
http://slidepdf.com/reader/full/statisticalabstractofdelhi2014 142/190
123
HIGHER EDUCATIONTABLE 9.7 NO. OF INSTITUTIONS
Year Number of Number of Colleges for
Universities DeemedUniv.
Institution of national
importance
GeneralEducation
ProfessionalEducation
2001-02 5 6 2 63 77
2002-03 5 8 2 63 812003-04 5 8 2 63 81
2004-05 5 8 2 63 81
2005-06 5 8 2 78 88
2006-07 5 8 2 78 88
2007-08 6 11 2 78 86
2008-09 7 11 2 78 86
2009-10 8 12 2 78 107
2010-11 8 12 3 78 106
2011-12 10 12 3 83 100
2012-13 10 12 3 85 100
2013-14 NA NA NA NA NA
TABLE 9.8 NUMBER OF STUDENTS Year No. of students
Universities, Colleges & other institutions
IGNOU
Boys Girls Total Boys Girls Total
2001-02 92979 77106 170085 146451 62770 209221
2002-03 98520 83355 181875 174791 84610 259401
2003-04 87426 81138 168564 139332 151177 290509
2004-05 163765 96867 260632 187004 98263 285267
2005-06 77692 79138 156830 205004 108089 313093
2006-07 85265 78794 164059 - - -
2007-08 74755 74822 149577 - - -
2008-09 168177 93635 261812 - - -
2009-10 154616 127371 281987 -- - -
2010-11 230021 228195 458216 -- - -
2011-12 306777 298455 605232 -- - -
2012-13 501542 466755 968297 -- - -
2013-14 558195 515391 1073586 -- - -
TABLE 9.9 TEACHING FACULTY Year No. of persons
Universities, Colleges & other
institutions
IGNOU
Male Female Total Male Female Total
2001-02 6897 4698 11595 179 90 269
2002-03 7642 4918 12560 173 91 264
2004-05 8737 5851 14588 173 91 264
2005-06 8377 5851 14228 173 91 264
2006-07 8377 5851 14228 173 91 264
2007-08 1299 483 1782 - - -
2008-09 - - 3012 N/A - N/A
2009-10 3233 1235 4467 - - -
2010-11 NA NA NA -- - -
2011-12 NA NA NA -- - -
2012-13 2379 1133 3512 -- - -2013-14 2474 1156 3630 -- - -
Source: Directorate of Higher Education, Govt.of NCT of Delhi.

8/20/2019 Statistical+Abstract+of+Delhi+2014
http://slidepdf.com/reader/full/statisticalabstractofdelhi2014 143/190
124
TECHNICAL/VOCATIONAL TRAINING
TABLE 9.10 NO. OF INSTITUTIONS Year No. of Institutions
ITI ITC’s** BTC CSI/IBBS WCSC Polytechnic*
1999-00 11 7 1 1 - 9
2000-01 11 7 1 1 - 9
2001-02 11 7 1 1 - 16
2002-03 11 9 1 1 - 16
2003-04 11 19 1 1 - 16
2004-05 11 23 1 1 - 17
2005-06 12 24 1 1 - 17
2006-07 16 55 1 1 - 18
2007-08 16 55 1 1 - 19
2008-09 16 57 1 1 - 21
2009-10 16 61 1 1 - 11
2010-11 16 61 1 1 - 20
2011-12 17 56 1 1 - 20
2012-13 16 61 1 1 - 20
2013-14 16 61 1 1 1 21
TABLE 9.11 ENROLMENT Year Enrollment in
ITI ITC’s** BTC CSI/IBBS WCSC Polytechnic*1999-00 7334 1589 989 297 - 6583
2000-01 7287 1803 1154 282 - 6612
2001-02 7394 1595 2132 135 - 9030
2002-03 7523 1632 2233 348 - 9223
2003-04 8060 2046 2382 186 - 9351
2004-05 7879 2597 1764 170 - 9680
2005-06 7755 2714 1715 159 - 9813
2006-07 6753 2391 239 88 - 9824
2007-08 8399 2297 553 221 - 10491
2008-09 9385 2329 566 195 - 11671
2009-10 7828 1666 604 220 - 11752
2010-11 8445 1836 512 155 - 12800
2011-12 7545 1762 512 155 - 12211
2012-13 8531 2135 447 110 - 12358
2013-14 8541 2292 685 104 174 15519
TABLE 9.12 NO. OF INSTRUCTORS
Year Teachers/Lecturers in
ITI ITC’s** BTC CSI/IBSS WCSC Polytechnic*1999-00 735 139 45 04 - -
2000-01 723 141 42 05 - 478
2001-02 678 165 43 05 - -
2002-03 653 167 39 04 - 559
2003-04 601 239 36 03 - 562
2004-05 600 295 30 03 - 5742005-06 589 297 29 04 - 582
2006-07 557 245 31 04 - 606
2007-08 554 276 31 04 - 617
2008-09 540 256 45 04 - 645
2009-10 463 251 42 05 - 632
2010-11 453 251 40 05 - 645
2011-12 521 242 32 03 - 636
2012-13 776 249 32 03 - 636
2013-14 715 263 32 03 13 919Source: Directorate of Technical Education, Govt.of NCT of Delhi.
* Govt., Govt. Aided, Sponsored & Private, ** Private & Affiliated with TTE
ITI’s – Industrial Training Institute, ITC- Industrial Training Centres ,BTC- Basic Training Centre, CSI- Commercial Sector Institute .

8/20/2019 Statistical+Abstract+of+Delhi+2014
http://slidepdf.com/reader/full/statisticalabstractofdelhi2014 144/190
125
TABLE 9.13 LITERACY RATE
Year TotalPopulation
Literate Persons
Male Female Total
No. % No. % No. %
1931 636246 73377 19.86 16095 6.03 89472 14.06
1941 917939 171233 31.99 58370 15.25 229603 25.01
1951 1744072 424118 42.99 244955 32.34 669073 38.36
1961 2658612 904801 60.75 497497 42.55 1402298 52.75
1971 4065698 1438268 63.71 863337 47.55 2301605 56.61
1981 6220406 2352883 68.40 1475443 53.07 3828326 61.54
1991 9420644 3539500 82.01 2342797 66.99 5882297 75.29
2001 13850507 5700847 87.33 3963917 74.71 9664764 81.67
2011 16787941 7194856 90.9 5542911 80.8 12737767 86.2
Source: Directorate of Census Operations, Delhi.
[

8/20/2019 Statistical+Abstract+of+Delhi+2014
http://slidepdf.com/reader/full/statisticalabstractofdelhi2014 145/190
126
CHAPTER TEN
LABOUR & EMPLOYMENT
• Survey Results – Employment & Unemployment in Delhi
• Distribution Of Workers By Major Groups As Per Economic Census
• Number Of Workers District Wise Under 5th Economics Census(2005) In Delhi
• Administrative Statistics - Number of Employees Working In Govt.Of N.C.T of Delhi
• Number Of Employees Working In Autonomous Bodies
• Number Of Employees Working In Local Bodies
• Number of Employees In MCD, NDMC, Delhi Cantt. Board
• National Employment Service - Employment Exchange Statistics
• Occupational Distribution Of Registered Applicants In EmploymentExchange
• Educational Classifications Of Applicants Registered In EmploymentExchange
•
Labour Welfare- Minimum Rate Of Wages In ScheduledEmployments
• Number Of Trade Unions & Industrial Disputes
• Child Labour

8/20/2019 Statistical+Abstract+of+Delhi+2014
http://slidepdf.com/reader/full/statisticalabstractofdelhi2014 146/190
127
The main function of the Directorate of Employment, GNCT of Delhi is to render
employment service to the job-seekers, job-providers and all other concerned through
its 9 District Employment Exchanges /02 Special Employment Exchanges for PH &
1 Special Employment Exchange for Ex-Servicemen, UEI&GB located at University of
Delhi, Jawaharlal Nehru University and Jamia Millia Islamia University. This includes
online registration of the job-seekers, updation /modification of their registration,
receiving of the requisition of vacancies from the employers and sponsoring the
names of registrants as per the requirements of the job providers for employment.
Besides, this Directorate is also providing vocational guidance/skill development
training to the job-seekers.
This section describes the employment and unemployment condition in Delhi.
The table under this section presents Survey reports of various NSS rounds on
Employment & Unemployment in Delhi and distribution of workers by major economic
activity and no. of workers etc. as per Economic Census. As the part of Administrative
statistics tables regarding number of employees working in Govt. of N.C.T. of Delhi,
Autonomous bodies and local bodies have been included in this section. The data is
provided and compiled by DES, Delhi.
NATIONAL EMPLOYMENT SERVICE
This section presents data regarding number of employment exchanges,
number of Registration and vacancies notified. The source of information is Dte. Of
Employment, GNCTD.
LABOUR WELFARE
The statistics under this section pertaining to minimum rate of wages in
Scheduled Employment, no. of Trade Unions & Industrial Disputes. Information on
Child Labour in Delhi with comparison to other states is also included in this section.
Source of information is Labour Deptt. GNCTD AND Census of India-2001
CHAPTER 10: LABOUR & EMPLOYMENT

8/20/2019 Statistical+Abstract+of+Delhi+2014
http://slidepdf.com/reader/full/statisticalabstractofdelhi2014 147/190
128
SURVEY RESULTSTABLE 10.1 EMPLOYMENT & UNEMPLOYMENT IN DELHI
(Per thousand population)
NSS Round Labour Force ParticipationRate
Employment Rate Unemployment Rate
Male Female Combined
Male Female Combined
Male Female Combined
NSS 55thRound(July 1999- June2000)
530 99 335 493 51 293 70 487 126
NSS 57thRound(July 2001 -June 2002)
834 96 485 788 84 455 55 125 62
NSS 58thRound(July 2002 -December 2002)
784 79 474 738 77 447 47 3 27
NSS 59thRound(Jan.2003 -Dec. 2003)
768 102 466 735 95 444 33 7 22
NSS 61stRound(July 2004 -June 2005)
544 79 335 528 75 325 30 46 32
NSS 62nd
Round(July 2005 -June 2006)
568 88 353 546 84 339 39 46 40
NSS 64t
Round(july2007-june2008
580 79 355 549 74 337 52 60 53
NSS 66t
RoundJuly2009-June 2010
555 78 335 538 75 324 31 41 32
NSS 68th
RoundJuly2011-June 2012
589 75 350 566 68 334 40 90 45
Source: Dte. of Economics & Statistics, Delhi

8/20/2019 Statistical+Abstract+of+Delhi+2014
http://slidepdf.com/reader/full/statisticalabstractofdelhi2014 148/190
129
TABLE 10.2 DISTRIBUTION OF WORKERS BY MAJOR ACTIVITY GROUPS ASPER ECONOMIC CENSUS
S.No Major Activity Group Workers AV. Annual GrowthRate
1990 1998 2005 1990-98 1998-05
1 Agricultural activities (Otherthan crop production andplantation)
20727 22334 12262 0.97 -6.44
2 Mining and Quarrying 9430 0 0 -12.50 0
3 Manufacturing & repair services 636471 1440076 1212154 15.78 -2.26
4 Electricity, Gas & Water supply 20491 115477 29427 57.94 -10.65
5 Construction 10878 22289 15900 13.11 -4.04
6 Wholesale Trade 105094 158147 151423 6.31 -0.61
7 Retail Trade 339716 535887 900811 7.22 9.73
8 Hotels & Restaurants 80224 115470 156979 5.49 5.14
9 Transport 62137 136719 108956 15 -4.78
10 Storage & Warehousing 32855 27056 -2.21
11 Communications 51164 97498 90028 11.32 -1.09
12 Financing, Insurance, RealEstate and Business Services
194156 207465 296954 0.86 6.16
13 Community, Social & PersonalServices
521199 622454 581413 2.43 -0.94
Total 2084542 3500872 3556307 8.49 0.23
Source: Report on Fifth Economic Census 2005 in Delhi - Dte. Of Economics & Statistics, Delhi

8/20/2019 Statistical+Abstract+of+Delhi+2014
http://slidepdf.com/reader/full/statisticalabstractofdelhi2014 149/190
130
TABLE 10.3 District Wise Number Of Total And Non-Hired Persons Usually
Working Under 6th Economic Census 2013 In Delhi
Name of District
No. of Persons employed on last working day
Hired Non-Hired All Average
HiredEmployment per Estt
.
AverageEmployment
per Estt in 6th
economiccensus
AverageEmployment
per Estt in 5th
economiccensus
MALE FEMALE MALE FEMALE
NorthWest
157999 24452 86781 11935 281167 1.96 3.02
4.05
North
226308 24269 71254 9810 331641 3.35 4.43
4.84
NorthEast
66823 7213 86237 22289 182562 0.79 1.94
4.65
East
115442 13141 79789 9942 218314 1.56 2.654.03
NewDelhi
198569 41017 30126 3500 273212 6.22 7.10
13.93
Central
395268 33057 139942 7999 576266 2.80 3.76
4.47
West
170673 29152 91935 13866 305626 1.88 2.87
4.04
SouthWest
46234 9496 38208 6063 100001 1.33 2.384.76
South
66681 14588 54659 9531 145459 1.37 2.46
5.61
Shahadr a
122245 11551 71167 12130 217093 1.84 2.98
NA
South-East
235032 39858 69621 8998 353509 3.59 4.62
NA
Total
1801274 247794 819719 116063 2984850 2.29 3.344.69
Source: Report on Sixth Economic Census 2013in Delhi (Provisional resultrs) - Dte. Of Economics & Statistics,
Delhi.

8/20/2019 Statistical+Abstract+of+Delhi+2014
http://slidepdf.com/reader/full/statisticalabstractofdelhi2014 150/190
131
NATIONAL EMPLOYMENT SERVICE
TABLE 10.4 EMPLOYMENT EXCHANGE STATISTICSYear No. of
EmploymentExchanges
Registration
(in ’000)
VacanciesNotified(in ’000)
Applicants onthe LiveRegister (in ’000)
1980 16 183 77 307
1985 23 205 67 569
1990 23 182 34 843
1995 23 167 22 1034
1996 25 164 27 1081
1997 25 158 22 1097
1998 25 161 25 1128
1999 20 193 12 966
2000 20 168 3 991
2001 20 93 3 1006
2002 20 114 4 1059
2003 20 79 2.5 1099
2004 20 85 2.1 636
2005 20 97 2.1 674
2006 20 78 2.7 557
2007 15 74 2.2 451
2008 15 65 5.7 507
2009 15 93 0.09 461
2010 12 127 28.351 588
2011 12 164 21.6 753
2012 12 138 7.293 891
2013 12 159 6.022 1050
Source: Directorate of Employment, GNCT of Delhi.

8/20/2019 Statistical+Abstract+of+Delhi+2014
http://slidepdf.com/reader/full/statisticalabstractofdelhi2014 151/190
132
TABLE 10.5 OCCUPATIONAL DISTRIBUTION OF REGISTERED APPLICANTS IN
EMPLOYMENT EXCHANGEYear Professional
& TechnicalAdminis-
trativeExecutive
&Managerial
Clerical Sales FarmersFisherman
HuntersLoggers
Production&
TransportEquipmentoperators
Service Unskilled Notclassifiedelsewhere
1980 49632 76 41707 244 1481 21324 1044 13753 177735
1985 67994 145 69914 516 327 49414 2044 24614 354244
1990 103249 144 111831 2115 3649 68387 2855 33432 517663
1995 151336 184 114947 2484 4243 63294 8885 41885 646562
1996 172638 182 91675 1613 4443 60711 8024 46189 695825
1997 173276 188 86495 1562 4535 59353 6535 44920 720589
1998 192325 233 89936 1630 4827 55464 6733 47601 726660
1999 211324 334 41937 267 1976 51575 6084 17138 635486
2000 200010 381 43868 204 1971 44797 8399 59496 631541
2001 196385 30 43176 136 2463 44595 7441 56381 655635
2002 194618 212 43520 134 2605 45112 7553 60941 704310
2003 196160 378 41744 96 2522 41661 6396 64172 745848
2004 124413 342 32650 123 2111 36579 6164 56869 376949
2005 120772 429 34873 110 2087 41661 7544 67306 399070
2006 111424 581 35799 85 1099 46663 5239 70485 285492
2007 83940 873 14775 75 1182 31489 5542 58341 255278
2008 97246 753 16034 37 2503 38401 5533 58695 287717
2009 54203 1117 6669 - 4480 13532 44929 13693 275906
2010 98567 1453 49535 16933 6346 21428 64253 17939 216930
2011165666 1897 104390 29651 11963 30892 124008 21536 153300
2012 226292 2656 171616 57247 14070 38389 169545 24450 70304
2013 276427 3429 231735 87043 26758 44895 214020 26782 1691
Source: Directorate of Employment, GNCT of Delhi

8/20/2019 Statistical+Abstract+of+Delhi+2014
http://slidepdf.com/reader/full/statisticalabstractofdelhi2014 152/190
133
TABLE 10.6 EDUCATIONAL CLASSIFICATIONS OF APPLICANTS REGISTEREDIN EMPLOYMENT EXCHANGE
Year Below
Matric
Matric,
Higher
Sec. &
Inter
Graduate
Arts Science Comm Engg. Medical Agri. Edu. Law Others Total
1980 52721 1 77620 26099 12680 8539 980 1977 508 15084 144 3176 69187
1985 138882 334296 21266 3230 13218 2207 2400 1810 26816 117 4095 75159
1990 211920 416239 53158 36680 39975 1752 1929 2474 36648 171 24387 197174
1995 243905 543996 61005 38797 43765 20099 1781 3081 50334 75 1615 220552
1996 255457 567306 61914 38873 43088 18149 1907 2680 60025 66 1601 228303
1997 251514 584506 62816 35796 42371 4273 2078 2342 64605 71 15625 229977
1998 273364 581346 62040 35539 41765 4423 2149 1625 75099 111 16963 239714
1999 253606 517604 28610 9068 13238 4130 2367 1258 81817 177 17003 157668
2000 238386 549200 24549 5475 11692 3719 2454 1359 97243 242 21895 168628
2001 230695 581606 26794 4408 12794 3902 2912 1553 94892 6 20202 167463
2002 233695 614762 30052 5673 14755 4099 2810 1646 94007 238 20624 173904
2003 226663 655397 32881 5940 17062 3880 2808 1676 93864 263 21211 179585
2004 160434 310951 33643 6123 16681 3450 1833 1500 48770 307 19923 132230
2005 186662 310653 39402 6463 20056 3588 1846 1392 45253 325 20998 139323
2006 171601 244900 22603 5117 11978 3610 1863 465 30558 334 21199 97727
2007 125302 199553 25296 5633 12506 1817 1374 - 28964 332 8543 84465
2008 145637 220563 28751 6255 13669 2007 1764 1797 31468 326 11460 97497
2009 51575 297757 36837 2256 4471 1242 11 - 3847 60 1667 50391
2010 73259 296047 55716 4861 9875 1983 31 - 10052 183 3693 86394
2011 91925 389742 69036 7077 14391 2663 365 - 14859 302 4555 113248
2012 106362 467479 81956 9028 18271 3537 448 - 18778 402 6263 138683
2013 128040 495423 92098 10492 21832 4478 510 - 21101 454 7763 158728
Source: Directorate of Employment, GNCT of Delhi.
contd…

8/20/2019 Statistical+Abstract+of+Delhi+2014
http://slidepdf.com/reader/full/statisticalabstractofdelhi2014 153/190
134
TABLE 10.6 EDUCATIONAL CLASSIFICATION OF APPLICANTS REGISTERED INEMPLOYMENT EXCHANGE
Year POST GRADUATES DiplomaHolders
Arts Science Comm. Engg. Medical Edu. Law Others Total
1980 2328 1099 345 52 1240 1440 19 816 7468
1985 2154 744 468 4 763 4193 39 559 8924 11789
1990 6214 2540 2169 29 1374 4465 123 667 17581 16717
1995 6989 3001 2908 93 1762 9531 62 500 24846 21705
1996 6977 3090 3109 119 1810 14098 54 456 29713 22085
1997 6780 2917 2928 110 1966 15761 45 442 30949 21873
1998 6274 2781 3088 151 1924 18642 78 523 33461 22280
1999 6044 2671 3010 144 2205 22923 26 217 37240 20689
2000 4087 2268 1610 123 2089 22660 15 1601 34453 20646
2001 412 171 143 114 2511 22154 25 948 26478 18825
2002 5152 2910 2146 229 2483 22459 20 1245 36644 19763
2003 5208 3123 2483 217 2491 22423 34 1343 37322 19774
2004 5367 3192 2635 51 664 19144 54 1478 32585 16023
2005 9183 5970 4532 53 674 14919 54 1829 37214 14126
2006 10561 7059 5655 56 685 16454 56 2113 42639 28006
2007 11277 7456 6096 12 497 14464 56 1917 41775 19076
2008 11838 7523 5295 23 500 15978 56 2009 43222 19297
2009 3102 748 566 34 36 143 1 1420 6050 8766
2010 7448 1532 1140 59 53 426 1 3664 14323 23361
2011 10248 2150 1679 86 69 597 2 4418 19249 29139
2012 12799 2763 2120 120 82 770 2 5835 24491 37554
2013 14456 3201 2438 165 93 852 8 6951 28167 44934
Source: Directorate of Employment, GNCT of Delhi.

8/20/2019 Statistical+Abstract+of+Delhi+2014
http://slidepdf.com/reader/full/statisticalabstractofdelhi2014 154/190
135
LABOUR WELFARE
TABLE 10.7 MINIMUM RATES OF WAGES IN SCHEDULED EMPLOYMENTS(in Rs. Per Day)
Year Unskilled Semi-skilled
Skilled Clerical & Non-Technical Supervisory Staff
Non-Matric Matric Graduates& above
1995 57.50 63.90 73.80 64.95 74.75 86.75
1996 64.50 70.90 80.80 71.90 81.75 93.75
1997 68.60 75.00 84.90 76.00 85.25 97.85
1998 74.50 80.90 90.80 81.90 91.75 103.75
1999 90.30 96.70 106.60 97.70 107.80 119.50
2000 93.00 99.40 109.35 100.50 110.25 122.25
2001 99.20 105.60 115.50 106.60 116.40 128.40
2002 102.60 109.00 118.90 110.00 119.80 131.80
2003 107.10 113.50 123.40 114.50 124.30 136.30
2004 110.10 116.50 126.40 117.50 127.30 139.30
2005 117.10 123.50 133.40 124.55 134.35 146.35
2006 125.80 132.20 142.10 133.25 143.00 155.00
2007 133.45 139.85 149.75 140.90 150.70 162.70
2008(Feb) 140.00 146.00 156.00 147.00 157.00 169.00
2009(Feb) 151.00 158.00 168.00 159.00 160.00 181.00
2010(Feb) 203.00 225.00 248.00 225.00 248.00 270.00
2011(April) 247 273 301 - 301 327
2011(Oct) 256 283 312 283 312 339
2012(April) 270 298 328 298 328 357
2012(Oct) 279 308 339 308 339 369
2013(April) 297 328 361 328 361 393
2013(oct) 311 344 377 343 377 411
Source: Labour Commissioner, GNCT of Delhi.

8/20/2019 Statistical+Abstract+of+Delhi+2014
http://slidepdf.com/reader/full/statisticalabstractofdelhi2014 155/190
136
TABLE 10.8 NO OF TRADE UNIONS & INDUSTRIAL DISPUTES
Year No. of Trade
Unions
TotalDispute(in no.)
No. of workers involved Total no. of Mandays lost
Directly Indirectly
1980 1059 37 8028 465 59737
1985 1276 27 2820 - 108514
1990 1440 11 17647 - 352208
1995 1658 12 2609 - 61833
1996 1656 12 872 16 32878
1997 1706 6 1486 63 5265
1998 1777 16 691 63 5924
1999 1790 10 1579 250 93024
2000 1625 4 627 - 13740
2001 1629 4 450 73 76470
2002 1584 - - - -
2003 1625 5 311 - 3700
2004 1574 1 304 - 14288
2005 1563 2 183 - 4032
2006 1600 - - - -
2007 1011 - - - -
2008 1053 1 196 - -
2009 1084 4 604 - 1961
2010 1118 3 772 - 21040
2011 1147 - - - -
2012 1198 1 150 40 3230
2013 1238 - - - -
Source: Labour Commissioner, GNCT of Delhi.
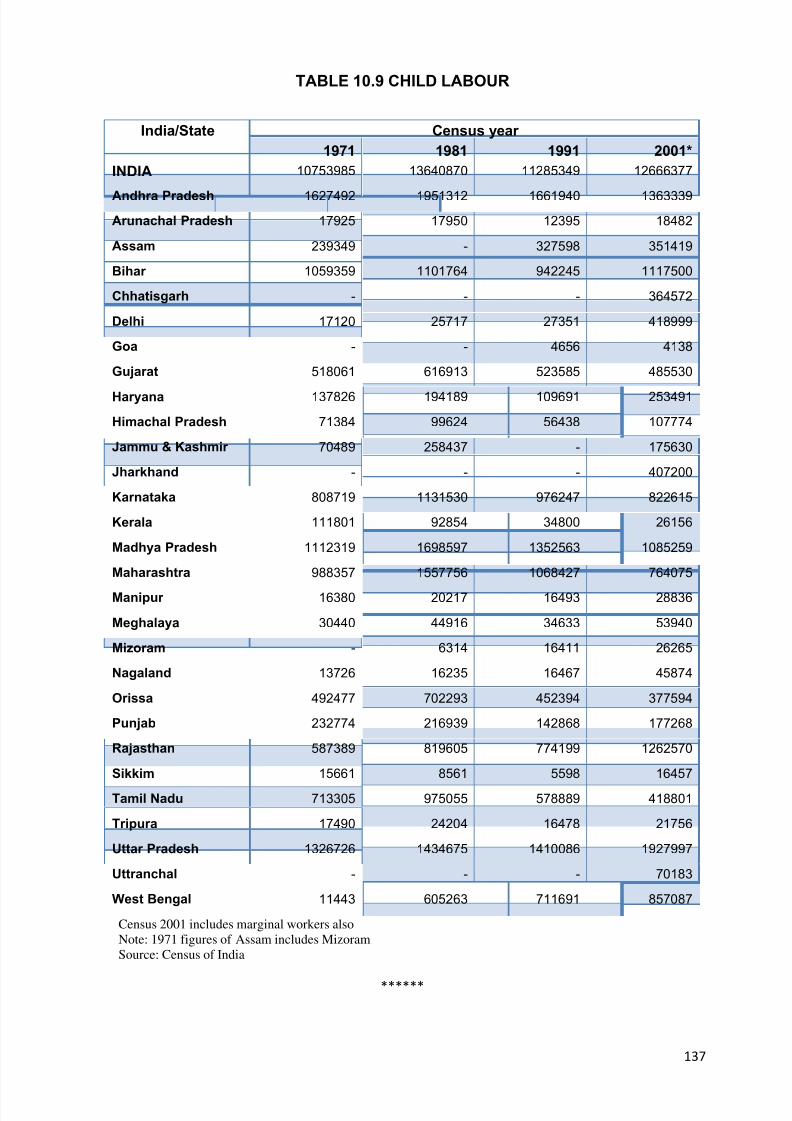
8/20/2019 Statistical+Abstract+of+Delhi+2014
http://slidepdf.com/reader/full/statisticalabstractofdelhi2014 156/190
137
TABLE 10.9 CHILD LABOUR
India/State Census year
1971 1981 1991 2001*
INDIA 10753985 13640870 11285349 12666377
Andhra Pradesh 1627492 1951312 1661940 1363339
Arunachal Pradesh 17925 17950 12395 18482
Assam 239349 - 327598 351419
Bihar 1059359 1101764 942245 1117500
Chhatisgarh - - - 364572
Delhi 17120 25717 27351 418999
Goa - - 4656 4138
Gujarat 518061 616913 523585 485530
Haryana 137826 194189 109691 253491
Himachal Pradesh 71384 99624 56438 107774
Jammu & Kashmir 70489 258437 - 175630
Jharkhand - - - 407200
Karnataka 808719 1131530 976247 822615
Kerala 111801 92854 34800 26156
Madhya Pradesh 1112319 1698597 1352563 1085259
Maharashtra 988357 1557756 1068427 764075
Manipur 16380 20217 16493 28836
Meghalaya 30440 44916 34633 53940
Mizoram - 6314 16411 26265
Nagaland 13726 16235 16467 45874
Orissa 492477 702293 452394 377594
Punjab 232774 216939 142868 177268
Rajasthan 587389 819605 774199 1262570
Sikkim 15661 8561 5598 16457
Tamil Nadu 713305 975055 578889 418801
Tripura 17490 24204 16478 21756
Uttar Pradesh 1326726 1434675 1410086 1927997
Uttranchal - - - 70183
West Bengal 11443 605263 711691 857087
Census 2001 includes marginal workers also
Note: 1971 figures of Assam includes Mizoram
Source: Census of India
******

8/20/2019 Statistical+Abstract+of+Delhi+2014
http://slidepdf.com/reader/full/statisticalabstractofdelhi2014 157/190
138
CHAPTER ELEVEN
HEALTH INDICATORS
• Distribution Of Health Institutions
•
Number Of Dispensaries• Selected Vital Rates Of Delhi
• Major Causes Of Deaths
• Family Welfare Programmes
• Immunization
• District Wise Disabled Population In Delhi-2011
• Aged Population In Delhi
• State/UT Wise Selected Vital Indicators
• Total Fertility Rate (15-49)
• State wise Proportion Of Aged Persons, Dependency Ratio

8/20/2019 Statistical+Abstract+of+Delhi+2014
http://slidepdf.com/reader/full/statisticalabstractofdelhi2014 158/190
139
In Delhi, health care facilities are being provided by both Government & Non-
Government Organizations. Among the Government Organizations,Directorate of
Health Services (DHS) of Government NCT of Delhi is the major agency related to
health care delivery. The DHS is also the largest department under Department of
Health and Family Welfare, Govt. of NCT of Delhi providing health care facilities at
primary and secondary level to the citizens of Delhi through various types of health
outlets, spread all over Delhi viz. Dispensaries and Health Centres, School Health
Clinics and Mobile Health Clinics.
Health Statistics of Delhi is presented in this section. Data regarding
number of Health Institutions and No. of Dispensaries is shown in table 11.1 &11.2
respectively. Besides this different health indicators in Delhi with comparison to other
states are presented in table no. 11.11. Information is received from Dte. Of Health
Services GNCT of Delhi and Office of Chief Registrar (Births and Deaths) Delhi.
CHAPTER 11: HEALTH INDICATORS

8/20/2019 Statistical+Abstract+of+Delhi+2014
http://slidepdf.com/reader/full/statisticalabstractofdelhi2014 159/190
140
TABLE 11.1 DISTRIBUTION OF HEALTH INSTITUTIONS
Year DelhiGovt.
MCD NDMC Delhi Cantt.Board
Govt. of India
PrivateRegd.
NursingHomes
No. Beds No. Beds No. Beds No. Beds No. Beds No. Beds
2002 25 5391 15 3565 2 200 3 1850 22 8281 496 10980
2003 25 5507 15 3436 4 220 3 1850 22 8281 509 11230
2004 32 6551 25 3625 2 200 3 1855 25 9970 564 12429
2005 32 6655 25 4064 4 220 3 1855 25 9970 611 12381
2006 32 6655 25 4064 4 220 3 1855 25 9970 629 14984
2007 32 6813 52 3988 2 200 3 1855 23 8299 611 15079
2008 37 7518 63 4046 4 220 3 1855 20 8336 581 15144
2009 38 7510 56 4091 4 220 3 1832 22 8550 590 15722
2010 38 9466 56 4091 4 220 3 1850 22 8778 676 17222
2011 38 9894 61* 4138 4 220 3 1850 25 9078 755 183242012 38 9680 245 3797 10 200 3 2128 15 4847 857 19636
2013 39 9102 245 3797 10 220 3 2128 15 4823 930 21425
*hospitals (13), TB Clinic (9), IPPvIII (6), Maternity Home (26), 2 (Ayurvedic/unani)
TABLE 11.2 NO. OF DISPENSARIESYear NO. OF DISPENSARIES Primary
HealthCentres
FamilyWelfareCentres/
Polyclinics /specialclinics
Maternity Homes
DelhiGovt.
MCD NDMC Govt. of India
No. Beds
2002 362 294 45 236 56 172 152 -
2003 369 294 47 217 56 172 - -
2004 403 307 48 235 56 174 - -
2005 366 371 48 228 56 174 135 20
2006 366 371 48 228 56 109 135 20
2007 383 219 37 239 8 109 12920
2008 423 218 35 241 8 75 185 20
2009 458 214 36 200 8 101 185 20
2010 489 214 36 203 8 99 185 20
2011 509* 236 36 238 8 NA 187 20
2012 584** 290 38 255 5 NA 227 490
2013 604*** 290 44 284 5 NA 225 440
* includes 370 dispensaries of DHS
**includes 442 dispensaries of DHS, ***includes 454 dispensaries of DHS
Source: Directorate of Health Services, GNCT of Delhi

8/20/2019 Statistical+Abstract+of+Delhi+2014
http://slidepdf.com/reader/full/statisticalabstractofdelhi2014 160/190
141
TABLE 11.3 SELECTED VITAL RATES OF DELHI
Year Birth Rate*(CRS)
Death*Rate(CRS)
Average no. of eventsper day
Infant Mortality Rate
Births Deaths NeonatalMortality
Rate
Post -natal
MortalityRate
InfantMortality
Rate
1980 27.18 6.63 - - 33 17 50
1990 29.00 6.26 - - 22 11 33
2000 23.58 5.93 870 219 14 10 24
2001 21.23 5.81 812 222 14 10 24
2002 21.18 6.05 824 236 10 6 16
2003 20.78 6.07 825 240 11 6 17
2004 20.72 5.76 838 234 9 4 13
2005 21.52 6.24 889 258 10 3 13
2006 21.05 6.45 884 271 12 6 18
2007 20.58 6.46 882 277 15 10 25
2008 20.94 6.77 915 295 13 5 18
2009 21.77 6.89 971 307 14 5 19
2010 21.66 7.48 985 341 15 7 22
2011 20.89 6.63 969 307 15 7 22
2012 20.90 6.10 988 287 14 10 24
2013 21.07 5.52 1014 266 18 7 22
*Revised w.e.f 2001 based on estimated midyear population as per Census 2011Source: Office of Chief Registrar, Births & Deaths, Delhi.
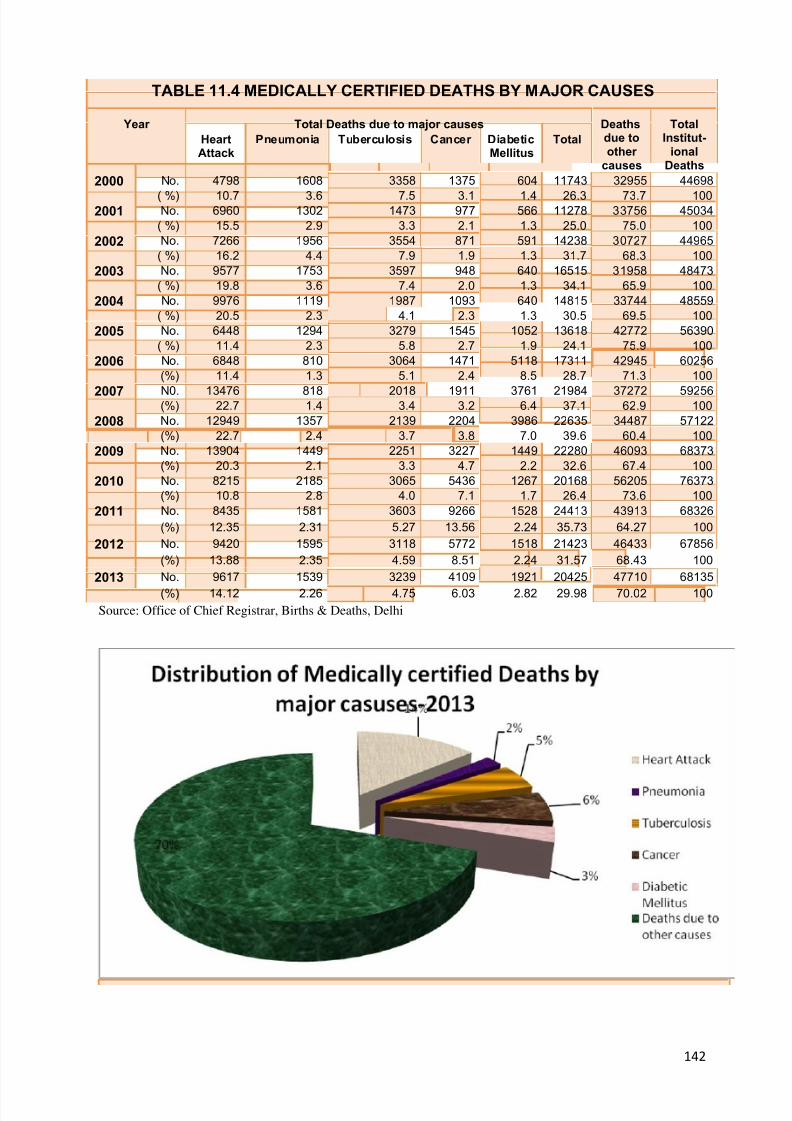
8/20/2019 Statistical+Abstract+of+Delhi+2014
http://slidepdf.com/reader/full/statisticalabstractofdelhi2014 161/190
142
Source: Office of Chief Registrar, Births & Deaths, Delhi
TABLE 11.4 MEDICALLY CERTIFIED DEATHS BY MAJOR CAUSES
Year Total Deaths due to major causes Deathsdue toother
causes
TotalInstitut-
ionalDeaths
HeartAttack
Pneumonia Tuberculosis Cancer DiabeticMellitus
Total
2000 No. 4798 1608 3358 1375 604 11743 32955 44698
( %) 10.7 3.6 7.5 3.1 1.4 26.3 73.7 1002001 No. 6960 1302 1473 977 566 11278 33756 45034
( %) 15.5 2.9 3.3 2.1 1.3 25.0 75.0 100
2002 No. 7266 1956 3554 871 591 14238 30727 44965
( %) 16.2 4.4 7.9 1.9 1.3 31.7 68.3 100
2003 No. 9577 1753 3597 948 640 16515 31958 48473
( %) 19.8 3.6 7.4 2.0 1.3 34.1 65.9 100
2004 No. 9976 1119 1987 1093 640 14815 33744 48559
( %) 20.5 2.3 4.1 2.3 1.3 30.5 69.5 100
2005 No. 6448 1294 3279 1545 1052 13618 42772 56390
( %) 11.4 2.3 5.8 2.7 1.9 24.1 75.9 100
2006 No. 6848 810 3064 1471 5118 17311 42945 60256
(%) 11.4 1.3 5.1 2.4 8.5 28.7 71.3 100
2007 N0. 13476 818 2018 1911 3761 21984 37272 59256(%) 22.7 1.4 3.4 3.2 6.4 37.1 62.9 100
2008 No. 12949 1357 2139 2204 3986 22635 34487 57122
(%) 22.7 2.4 3.7 3.8 7.0 39.6 60.4 100
2009 No. 13904 1449 2251 3227 1449 22280 46093 68373
(%) 20.3 2.1 3.3 4.7 2.2 32.6 67.4 100
2010 No. 8215 2185 3065 5436 1267 20168 56205 76373
(%) 10.8 2.8 4.0 7.1 1.7 26.4 73.6 100
2011 No. 8435 1581 3603 9266 1528 24413 43913 68326
(%) 12.35 2.31 5.27 13.56 2.24 35.73 64.27 100
2012 No. 9420 1595 3118 5772 1518 21423 46433 67856
(%) 13.88 2.35 4.59 8.51 2.24 31.57 68.43 100
2013 No. 9617 1539 3239 4109 1921 20425 47710 68135
(%) 14.12 2.26 4.75 6.03 2.82 29.98 70.02 100

8/20/2019 Statistical+Abstract+of+Delhi+2014
http://slidepdf.com/reader/full/statisticalabstractofdelhi2014 162/190
143
TABLE 11.5 FAMILY WELFARE PROGRAMMES
Year Family WelfareCenters
including postpartum units
Insertion of Contraceptive
Device
Sterilizations Total Oral Pills(Cycles)
Condoms(‘000)
Male Female
1990-91 126 71454 1749 31619 33368 5612 21394
1995-96 126 75480 1833 36000 37833 133349 23829
1996-97 126 65711 1529 31649 33178 110791 20109
1997-98 125 66871 1571 36128 37699 136120 16039
1998-99 125 60573 1464 33695 35159 153105 16740
1999-00 125 61807 1679 40562 42241 112421 13653
2000-01 125 64863 1951 34243 36194 179033 12572
2001-02 125 63421 1788 37277 39065 211891 13155
2002-03 125 65304 2011 37089 39100 222204 14142
2003-04 125 62528 1712 37557 39269 157247 13884
2004-05 109 58984 2060 37581 39641 137560 11612
2005-06 109 55810 1616 32552 34168 122594 10742
2006-07 109 53003 1320 27426 28746 119549 12377
2007-08 109 46020 5447 23791 29238 158613 12443
2008-09 75 39687 5282 24149 29431 181412 9476
2009-10* 101 35238 4386 18505 22891 297358 8255
2010-11 99 40759 2849 16377 19226 222068 7717
2011-12 99 42293 2634 16645 19279 195204 8954
2012-13 98 47164 1563 18544 20107 213992 9325
2013-14 92 58293 1401 17780 19181 207872 5373
*Including Health Posts
Source: Directorate of Health Services, GNCT of Delhi

8/20/2019 Statistical+Abstract+of+Delhi+2014
http://slidepdf.com/reader/full/statisticalabstractofdelhi2014 163/190
144
TABLE 11.6 IMMUNIZATION(In %)
India/State/ NFHS-1(1992-03) NFHS-2 (1998-99) NFHS-3 (2005-06)
INDIA 35.4 42.0 43.5
Andhra Pradesh 45.0 58.7 46.0
Arunachal Pradesh 22.5 20.5 28.4
Assam 19.4 17.0 31.4
Bihar 10.7 11.0 32.8
Chhatisgarh NA NA 48.7
DELHI 57.8 69.8 63.2
Goa 74.9 82.6 78.6
Gujarat 49.8 53.0 45.2
Haryana 53.5 62.7 65.3
Himachal Pradesh 62.9 83.4 74.2
Jammu & Kashmir 65.7 56.7 66.7
Jharkhand NA NA 34.2
Karnataka 52.2 60.0 55.0
Kerala 54.4 79.7 75.3
Madhya Pradesh 29.2 22.4 40.3
Maharashtra 64.1 78.4 58.8
Manipur 29.1 42.3 46.8
Meghalaya 9.7 14.3 32.9
Mizoram 56.4 59.6 46.5
Nagaland 3.8 14.1 21.0
Orissa 36.1 43.7 51.8
Punjab 61.9 72.1 60.1
Rajasthan 21.1 17.3 26.5
Sikkim NA 47.4 69.6
Tamil Nadu 64.9 88.8 80.9
Tripura 19.0 NA 49.7
Uttar Pradesh 19.8 21.2 23.0
Uttranchal NA NA 60.0
West Bengal 34.2 43.8 64.3
Source: NFHS-National Family Health Survey

8/20/2019 Statistical+Abstract+of+Delhi+2014
http://slidepdf.com/reader/full/statisticalabstractofdelhi2014 164/190
145
TABLE 11.7 DISTRICT WISE DISABLED POPULATION IN DELHI- 2011
Type of disability
Sex
Total Disabled Population Districts
Total Rural Urban NorthWest
North NorthEast
East NewDelhi
Central West SouthWest
South
Totaldisabled
T 234882 6116 228766 46870 12039 31939 23229 2559 11512 36184 32680 37870
M 138379 3668 134711 28055 7140 19202 13331 1544 6341 20978 19546 22242
F 96503 2448 94055 18815 4899 12737 9898 1015 5171 15206 13134 15628
InSeeing
T 30124 792 29332 5540 1634 3982 2746 444 1567 4282 4224 5705
M 16864 430 16434 3134 861 2170 1523 288 866 2392 2395 3235
F 13260 362 12898 2406 773 1812 1223 156 701 1890 1829 2470
InSpeech
T 15094 339 14755 2868 751 2039 1348 143 611 2263 2278 2793
M 8946 208 8738 1699 424 1227 790 81 389 1356 1343 1637
F 6148 131 6017 1169 327 812 558 62 222 907 935 1156
InHearing
T 34499 825 33674 5993 1645 3917 3463 521 1620 4934 5735 6671
M 19277 432 18845 3272 906 2095 1728 333 838 2714 3418 3973
F 15222 393 14829 2721 739 1822 1735 188 782 2220 2317 2698
InMovement T 67383 1885 65498 14693 3545 10052 7002 577 3311 10710 8263 9230M 40727 1198 39529 9203 2222 6262 4076 340 1755 6195 5167 5507
F 26656 687 25969 5490 1323 3790 2926 237 1556 4515 3096 3723
MentalRetardation
T 16338 350 15988 3871 842 2046 1749 125 722 2500 1904 2579
M 10385 245 10140 2473 544 1336 1124 78 430 1588 1239 1573
F 5953 105 5848 1398 298 710 625 47 292 912 665 1006
Mental
Illness
T 10046 247 9799 2151 690 1419 1103 73 505 1580 1188 1337
M 6292 172 6120 1304 425 882 700 41 322 1028 765 825
F 3754 75 3679 847 265 537 403 32 183 552 423 512
Any
Other
T 37013 1005 36008 6449 1708 5009 3298 457 1925 5980 6221 5966
M 21783 586 21197 3902 1032 3074 1911 264 1078 3461 3350 3511
F 15230 419 14811 2547 676 1935 1387 193 847 2519 2671 2455
Multiple
Disability
T 24385 673 23712 5305 1224 3475 2520 219 1251 3935 2867 3589
M 14105 397 13708 3068 726 2156 1479 119 663 2244 1669 1981
F 10280 276 10004 2237 498 1319 1041 100 588 1691 1198 1608
Source: Population Census 2011
TABLE 11.8 AGED POPULATION IN DELHI
Age Group Sex Sector Total State of Physical Mobility (%)
Male Female Urban Rural Confined
to Bed
Confined to
Home
Mobile
60-64 153538 158483 277112 34909 312021 0.57 2.29 97.14
64-69 119650 113417 210586 22481 233067 1.68 3.08 95.24
70-74 86654 56350 130607 12397 143004 4.49 0.94 94.57
75-79 31299 33078 59850 4527 64377 0.62 8.62 90.76
80 & above 51638 25810 70203 7245 77448 2.18 11.91 85.91
Total 442779 387138 748358 81559 829917 1.70 3.64 94.66
Source: National Sample Survey 60th Round (Jan - June 2004)

8/20/2019 Statistical+Abstract+of+Delhi+2014
http://slidepdf.com/reader/full/statisticalabstractofdelhi2014 165/190
146
TABLE 11.9 STATE /UT WISE SELECTED VITAL INDICATORS
India/State 2010 2011 2012 2013
BirthRate
DeathRate
IMR BirthRate
DeathRate
IMR BirthRate
DeathRate
IMR BirthRate
DeathRate
IMR
INDIA 22.1 7.2 47 21.8 7.1 44 21.6 7.0 42 21.4 7.0 40
AndhraPradesh
17.9 7.6 46 17.5 7.5 43 17.5 7.4 41 17.4 7.3 39
ArunachalPradesh 20.5 5.9 31 19.8 5.8 32 19.4 5.8 33 19.3 5.8 32
Assam 23.2 8.2 58 22.8 8.0 55 22.5 7.9 55 22.4 7.8 54
Bihar 28.1 6.8 48 27.7 6.7 44 27.7 6.6 43 27.6 6.6 42
Chhatisgarh 25.3 8.0 51 24.9 7.9 48 24.5 7.9 47 24.4 7.9 46
Delhi 17.8 4.2 30 17.5 4.3 28 17.3 4.2 25 17.2 4.1 24
Goa 13.2 6.6 10 13.3 6.7 11 13.1 6.6 10 13.0 6.6 09
Gujarat 21.8 6.7 44 21.3 6.7 41 21.1 6.6 38 20.8 6.5 36
Haryana 22.3 6.6 48 21.8 6.5 44 21.6 6.4 42 21.3 6.3 41
HimachalPradesh 16.9 6.9 40 16.5 6.7 38 16.2 6.7 36 16.0 6.7 35
Jammu &Kashmir
18.3 5.7 43 17.8 5.5 41 17.6 5.4 39 17.5 5.3 37
Jharkhand 25.3 7.0 42 25.0 6.9 39 24.7 6.8 38 24.6 6.8 37
Karnataka 19.2 7.1 38 18.8 7.1 35 18.5 7.1 32 18.3 7.0 31
Kerala 14.8 7.0 13 15.2 7.0 12 14.9 6.9 12 14.7 6.9 12
MadhyaPradesh
27.3 8.3 62 26.9 8.2 59 26.6 8.1 56 26.3 8.0 54
Maharashtra 17.1 6.5 28 16.7 6.3 25 16.6 6.3 25 16.5 6.2 24
Manipur
14.9 4.2 14
14.4 4.1 11 14.6 4.0 10 14.7 4.0 10
Meghalaya 24.5 7.9 55 24.1 7.8 52 24.1 7.6 49 23.9 7.6 47
Mizoram 17.1 4.5 37 16.6 4.4 34 16.3 4.4 35 16.1 4.3 35
Nagaland 16.8 3.6 23 16.1 3.3 21 15.6 3.2 18 15.4 3.1 18
Orissa 20.5 8.6 61 20.1 8.5 57 19.9 8.5 53 19.6 8.4 51
Punjab 16.6 7.0 34 16.2 6.8 30 15.9 6.8 28 15.7 6.7 26
Rajasthan 26.7 6.7 55 26.2 6.7 52 25.9 6.6 49 25.6 6.5 47
Sikkim 17.8 5.6 30 17.6 5.6 26 17.2 5.4 24 17.1 5.2 22
Tamil Nadu 15.9 7.6 24 15.9 7.4 22 15.7 7.4 21 15.6 7.3 21
Tripura 14.9 5.0 27 14.3 5.0 29 13.9 4.8 28 13.7 4.7 26
Uttar Pradesh
28.3 8.1 61 27.8 7.9 57 27.4 7.7 53 27.2 7.7 50
Uttarakhand 19.3 6.3 38 18.9 6.2 36 18.5 6.1 34 18.2 6.1 32
WestBengal
16.8 6.0 31 16.3 6.2 32 16.1 6.3 32 16.0 6.4 31
*Infant Morality Rate (IMR)
Source: SRS Bulletin, RGI

8/20/2019 Statistical+Abstract+of+Delhi+2014
http://slidepdf.com/reader/full/statisticalabstractofdelhi2014 166/190
147
TABLE 11.10 TOTAL FERTILITY RATE (15 - 49 YEARS)
INDIA/STATE/ NFHS-1(1992-03)
NFHS-2(1998-99)
NFHS-3(2005-06)
INDIA 3.39 2.85 2.68
Andhra Pradesh 2.59 2.25 1.79
Arunachal Pradesh 4.25 2.52 3.03
Assam 3.53 2.31 2.42
Bihar NA 3.70 4.00
Chhatisgarh NA 2.79 2.62
DELHI 3.02 2.40 2.13
Goa 1.90 1.77 1.79
Gujarat 2.99 2.72 2.42
Haryana 3.99 2.88 2.69
Himachal Pradesh 2.97 2.14 1.94
Jammu & Kashmir NA 2.71 2.38
Harahan NA 2.76 3.31
Karnataka 2.85 2.13 2.07
Kerala 2.00 1.96 1.93
Madhya Pradesh NA 3.43 3.12
Maharashtra 2.86 2.52 2.11
Manipur 2.76 3.04 2.83
Meghalaya 3.73 4.57 3.80
Mizoram 2.30 2.89 2.86
Nagaland 3.26 3.77 3.74
Orissa 2.92 2.46 2.37
Punjab 2.92 2.21 1.99
Rajasthan 3.63 3.78 3.21
Sikkim NA 2.75 2.02
Tamil Nadu 2.48 2.19 1.80
Tripura 2.67 1.87 2.22
Uttar Pradesh NA 4.06 3.82
Uttranchal NA 2.61 2.55
West Bengal 2.92 2.29 2.27
Source: NFHS-National Family Health Survey

8/20/2019 Statistical+Abstract+of+Delhi+2014
http://slidepdf.com/reader/full/statisticalabstractofdelhi2014 167/190
148
TABLE 11.11 STATE WISE PROPORTIONS OF AGED PERSONS,DEPENDENCYRATIO
India/State/ % Share inTotal
Population
DependencyRatio
Economic Independency Ratio
Rural Urban
Male Female Male Female Male Female Male Female
INDIA 7.10 7.83 12.45 13.77 51.30 13.90 55.50 170.00
Andhra Pradesh 7.16 8.04 11.88 13.36 48.60 14.80 56.70 24.60
Arunachal Pradesh 4.56 4.54 8.08 8.48 - - - -
Assam 5.81 5.90 10.18 10.51 44.30 8.10 56.30 22.80
Bihar 6.76 6.49 13.33 12.57 58.20 16.70 44.10 15.70
Chhatisgarh 6.58 7.86 11.76 14.18 - - - -
DELHI 4.82 5.66 7.59 9.32 67.37 36.59 59.51 7.77
Goa 7.23 9.48 10.71 14.45 - - - -
Gujarat 6.17 7.70 10.23 12.83 49.40 12.90 52.50 11.70
Haryana 7.00 8.06 12.42 14.36 37.60 12.70 48.70 17.40
Himachal Pradesh 8.77 9.25 14.82 15.35 57.80 18.30 72.30 30.20
Jammu & Kashmir 6.82 6.47 11.78 11.46 65.30 10.70 62.40 10.50
Jharkhand 5.67 6.06 10.40 11.21 - - - -
Karnataka 7.15 8.24 11.78 13.74 54.10 14.80 54.50 13.80
Kerala 9.59 11.31 15.24 17.73 36.10 10.20 46.80 18.90
Madhya Pradesh 6.65 7.57 12.20 14.11 57.60 15.20 63.70 18.00
Maharashtra 7.80 9.73 13.03 16.73 49.00 18.30 49.70 18.60Manipur 6.68 6.74 11.11 11.10 - - - -
Meghalaya 4.59 4.53 8.66 8.54 - - - -
Mizoram 5.40 5.64 9.04 9.66 - - - -
Nagaland 4.85 4.20 8.21 7.21 - - - -
Orissa 8.05 8.47 13.80 14.48 44.70 7.50 50.20 6.20
Punjab 8.56 9.50 14.53 15.88 45.50 10.00 49.60 12.10
Rajasthan 6.22 7.31 11.74 13.86 46.90 9.50 55.20 12.90
Sikkim 5.68 5.01 9.36 8.67 - - - -
Tamil Nadu 8.71 8.94 13.78 13.93 48.70 19.30 54.30 19.30
Tripura 6.86 7.70 11.52 13.20 - - - -
Uttar Pradesh 7.05 6.96 13.69 13.43 59.80 12.70 60.20 13.60
Uttranchal 7.55 7.87 13.72 13.95 - - - -
West Bengal 6.72 7.53 11.15 12.82 46.20 6.40 65.80 18.30
Source: NSS 60th round (January-June 2004) State sample report,
******

8/20/2019 Statistical+Abstract+of+Delhi+2014
http://slidepdf.com/reader/full/statisticalabstractofdelhi2014 168/190
149
CHAPTER TWELVE
WELFARE STATISTICS
• Women Welfare
• Social Defence Programme
• Child Welfare• Social Security/Others
• Scheme for Society
• Welfare Of Physically Handicapped(Ph)
• Slum & JJ Clusters Welfare
• Public Distribution System In Delhi
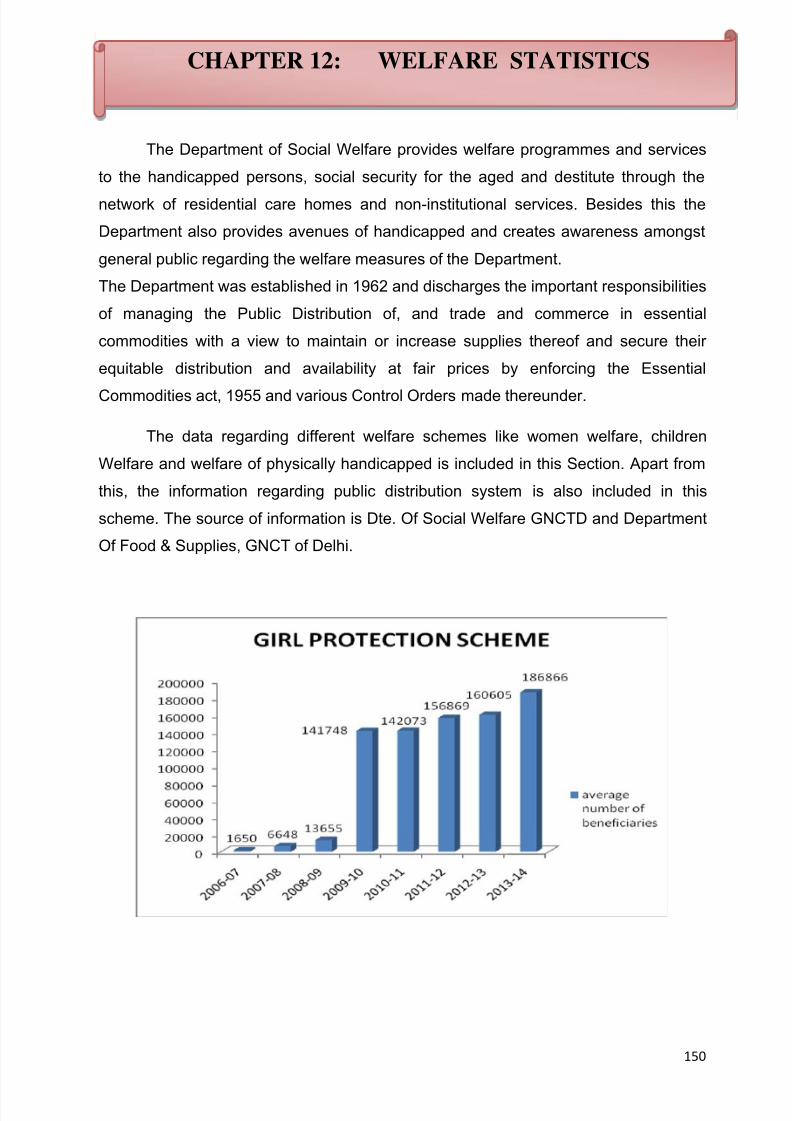
8/20/2019 Statistical+Abstract+of+Delhi+2014
http://slidepdf.com/reader/full/statisticalabstractofdelhi2014 169/190
150
The Department of Social Welfare provides welfare programmes and services
to the handicapped persons, social security for the aged and destitute through the
network of residential care homes and non-institutional services. Besides this the
Department also provides avenues of handicapped and creates awareness amongst
general public regarding the welfare measures of the Department.
The Department was established in 1962 and discharges the important responsibilities
of managing the Public Distribution of, and trade and commerce in essential
commodities with a view to maintain or increase supplies thereof and secure their
equitable distribution and availability at fair prices by enforcing the Essential
Commodities act, 1955 and various Control Orders made thereunder.
The data regarding different welfare schemes like women welfare, children
Welfare and welfare of physically handicapped is included in this Section. Apart from
this, the information regarding public distribution system is also included in this
scheme. The source of information is Dte. Of Social Welfare GNCTD and Department
Of Food & Supplies, GNCT of Delhi.
CHAPTER 12: WELFARE STATISTICS

8/20/2019 Statistical+Abstract+of+Delhi+2014
http://slidepdf.com/reader/full/statisticalabstractofdelhi2014 170/190
151
TABLE 12.1 WOMEN WELFARE
Year Residential Institutions for theWomen
Work Centres for Women
No. of Institutes/Services
Average No. of Beneficiaries
No. of Institutes/Services
Average No. of Beneficiaries
1985-86 4 191 20 1067
1990-91 4 170 25 1100
1995-96 4 176 25 1436
1996-97 4 196 25 1442
1997-98 4 199 25 1438
1998-99 4 192 25 1437
1999-00 4 187 25 1420
2000-01 4 184 25 1312
2001-02 4 194 25 1200
2002-03 4 208 25 1204
2003-04 4 149 25 1144
2004-05 4 150 25 1134
2005-06 4 163 25 1046
2006-07 4 149 25 1194
2007-08 4 135 25 947
2008-09 4 137 25 900
2009-10 4 150 25 782
2010-11 6 161 21 740
2011-12 6 328 21 446
2012-13 11 34 18 34
2013-14 3 146 18 40
Source: Dte. of Social Welfare, GNCT of Delhi

8/20/2019 Statistical+Abstract+of+Delhi+2014
http://slidepdf.com/reader/full/statisticalabstractofdelhi2014 171/190
152
TABLE 12.2 SOCIAL DEFENCE PROGRAMME
Year Residential Institutions for beggars
Probation Services Prison Welfare Services
No. of Institutes/Services
Average No. of Beneficiaries
No. of Institutes/Services
Average No.of
Beneficiaries
No. of Institutes/Services
Average No. of Beneficiaries
1985-86 12 1302 1 3851 1 1280
1990-91 12 489 5 3143 1 1501
1995-96 12 1349 5 4319 1 961
1996-97 12 1059 5 4466 1 1134
1997-98 12 2510 5 4326 1 1763
1998-99 12 1032 5 2771 1 2706
1999-00 12 2166 5 4164 1 2185
2000-01 12 1668 5 2027 1 2887
2001-02 12 1158 5 2857 1 2882
2002-03 12 966 5 2886 1 2565
2003-04 12 1100 5 3462 1 2139
2004-05 11 904 5 2569 1 2139
2005-06 11 920 5 2602 1 1326
2006-07 11 1318 5 3352 1 1306
2007-08 11 1338 5 3458 1 1206
2008-09 11 1277 5 3025 1 1023
2009-10 11 1480 5 2673 1 934
2010-11 11 670 2 2788 3 940
2011-12 11 623 2 2753 3 956
2012-13 11 615 2 2740 3 91
2013-14 11 1502 NA NA NA NA
Source: Dte. of Social Welfare, GNCT of Delhi

8/20/2019 Statistical+Abstract+of+Delhi+2014
http://slidepdf.com/reader/full/statisticalabstractofdelhi2014 172/190
153
TABLE 12.3 CHILDREN WELFARE
Year ObservationHomes
ChildrenHomes
Houses for Mentally retarded
Children WelfareServices
Integrated ChildrenDevelopment Programme
including NP)
N o . o f
I n s t i t u t e s /
S e r v i c e s
A v e r a g e N o .
o f
B e n e f i c i a r i e s
N o . o f
I n s t i t u t e s /
S e r v i c e s
A v e r a g e N o .
o f
B e n e f i c i a r i e s
N o . o f
I n s t i t u t e s /
S e r v i c e s
A v e r a g e N o .
o f
B e n e f i c i a r i e s
N o . o f
I n s t i t u t e s /
S e r v i c e s
A v e r a g e N o .
o f
B e n e f i c i a r i e s
N o . o f
I n s t i t u t e s /
S e r v i c e s
A v e r a g e N o .
o f
B e n e f i c i a r i e s
1 2 3 4 5 6 7 8 9 10 11
1985-86 3 209 6 934 3 116 19 751 2104 255618
1990-91 3 238 8 742 3 303 20 627 3030 327379
1995-96 3 244 8 779 3 358 20 629 3541 670000
1996-97 3 291 8 793 3 375 20 631 3618 490000
1997-98 3 258 8 778 3 362 20 567 3842* 504429
1998-99 3 242 8 649 3 341 20 751 3842* 474435
1999-00 3 244 8 609 3 335 20 299 3842* 513681
2000-01 3 265 8 683 3 367 20 224 3842* 437426
2001-02 3 496 8 674 3 385 2 210 3842* 472104
2002-03 3 539 8 863 3 379 3 233 3842* 499167
2003-04 3 323 8 1047 3 397 3 246 3842* 492445
2004-05 3 238 8 1115 3 420 3 251 3842* 482265
2005-06 3 289 9 945 3 446 3 285 3902 464740
2006-07 3 412 9 903 3 460 3 342 4428 515089
2007-08 3 215 9 775 3 515 3 396 6092 690000
2008-09 3 151 9 793 3 530 3 397 61066850367
2009-10 3 81 9 806 3 550 3 411 6606 749074
2010-11 5 89 12 857 3 558 6 560 6606 719266
2011-12 5 58 12 678 3 726 6 548 10577 1071931
2012-13 7 150 21 1360 3 428 47 3135 10874 1079062
2013-14 7# 188 16# 540 6 1055 10* 3919 10897 1081379
# including Statutory & Non Statutory *This includes 8 child wefare committees and 2 juvenile justice boards
Source: Dte. of Social Welfare, GNCT of Delhi

8/20/2019 Statistical+Abstract+of+Delhi+2014
http://slidepdf.com/reader/full/statisticalabstractofdelhi2014 173/190
154
TABLE 12.4 SOCIAL SECURITY / OTHERS
Year Average No. of Beneficiaries
FinancialAssistanceto Widow
etc. for self-employment
Old AgePension
Stipend toPH
students
Scholarshipsto PH
students
Assistantsto PH for purchaseof Aids(Petrol
Subsidy)
Homes for Aged and
InfirmPersons
1 2 3 4 5 6 7
1985-86 8 2792 357 510 12 27
1990-91 325 3675 147 471 7 1
1995-96 1725 44947 262 628 8 -
1996-97 1675 58912 240 504 9 -
1997-98 1624 66288 243 601 7 -
1998-99 1507 76513 237 593 8 -
1999-00 1854 96670 239 664 11 -
2000-01 2456 100000 236 788 20 -
2001-02 2985 104095 362 727 33 51
2002-03 2253 124970 350 763 31 46
2003-04 2842 139680 375 735 37 42
2004-05 2497 150000 394 807 26 39
2005-06 3589 150000 376 707 28 44
2006-07 5183167887
188 568 15 53
2007-08 9138 184176 412 658 36 60
2008-09 27380 230356 292 474 35 56
2009-10 43728 250000 - 510 36 -
2010-11 68265 338000 - - - 41
2011-12 91094 391000 - - - 59
2012-13 115407 386000 - - - 54
2013-14 126478 375668 - - - 54
Source: Dte. of Social Welfare, GNCT of Delhi
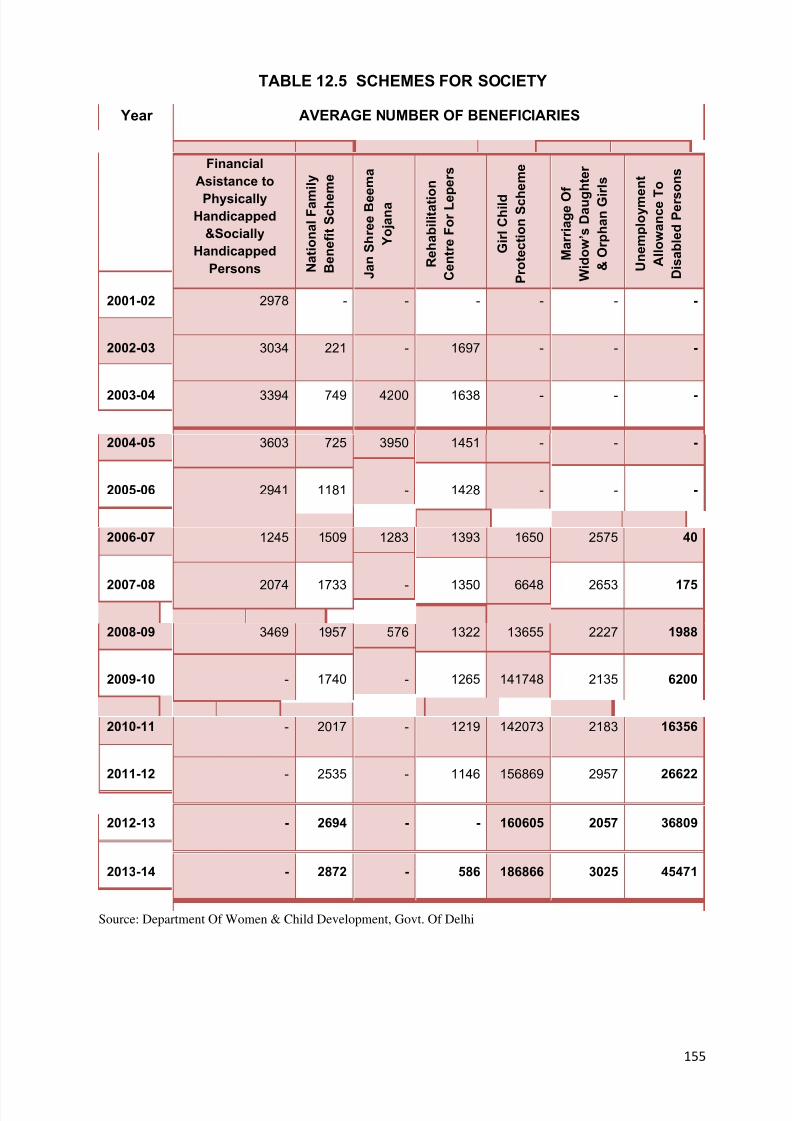
8/20/2019 Statistical+Abstract+of+Delhi+2014
http://slidepdf.com/reader/full/statisticalabstractofdelhi2014 174/190
155
TABLE 12.5 SCHEMES FOR SOCIETY
Year AVERAGE NUMBER OF BENEFICIARIES
Financial
Asistance to
PhysicallyHandicapped
&Socially
Handicapped
Persons N a t i o n a l F a m
i l y
B e n e f i t S c h e m e
J a n S h r e e B e e m a
Y o j a n a
R e h a b i l i t a t i o
n
C e n t r e F o r L e p e r s
G i r l C h i l d
P r o t e c t i o n S c h
e m e
M a r r i a g e O
f
W i d o w ’ s D a u g
h t e r
& O r p h a n G i r l s
U n e m p l o y m e
n t
A l l o w a n c e T
o
D i s a b l e d P e r s
o n s
2001-02 2978 - - - - - -
2002-03 3034 221 - 1697 - - -
2003-04 3394 749 4200 1638 - - -
2004-05 3603 725 3950 1451 - - -
2005-06 2941 1181 - 1428 - - -
2006-07 1245 1509 1283 1393 1650 2575 40
2007-08 2074 1733 - 1350 6648 2653 175
2008-09 3469 1957 576 1322 13655 2227 1988
2009-10 - 1740 - 1265 141748 2135 6200
2010-11 - 2017 - 1219 142073 2183 16356
2011-12 - 2535 - 1146 156869 2957 26622
2012-13 - 2694 - - 160605 2057 36809
2013-14 - 2872 - 586 186866 3025 45471
Source: Department Of Women & Child Development, Govt. Of Delhi

8/20/2019 Statistical+Abstract+of+Delhi+2014
http://slidepdf.com/reader/full/statisticalabstractofdelhi2014 175/190
156
TABLE12.6 WELFARE OF PHYSICALLY HANDICAPPED (PH)
Year Training cumProduction
Centres
ShelteredWorkshops
ResidentialHomes for PH
School for Deaf & Dumb
School for MentallyRetardedChildren
N o . o f
I n s t i t u t e s
/
S e r v i c e s
A v e r a g e N o
. o f
B e n e f i c i a r i e s
N o . o f
I n s t i t u t e s
/
S e r v i c e s
A v e r a g e N o
. o f
B e n e f i c i a r i e s
N o . o f
I n s t i t u t e s
/
S e r v i c e s
A v e r a g e N o
. o f
B e n e f i c i a r i e s
N o . o f
I n s t i t u t e s
/
S e r v i c e s
A v e r a g e N o
. o f
B e n e f i c i a r i e s
N o . o f
I n s t i t u t e s
/
A v e r a g e N o
. o f
B e n e f i c i a r i e s
1 2 3 4 5 6 7 8 9 1 0 11
1985-86 4 176 2 73 5 1301 2 650 1 40
1990-91 4 70 2 27 5 1748 4 764 1 38
1995-96 4 69 2 36 3 353 4 884 43
1996-97 4 66 2 51 3 350 4 894 1 28
1997-98 4 54 2 45 3 335 4 888 1 28
1998-99 4 56 2 48 3 330 4 870 1 35
1999-00 4 54 2 44 3 270 4 898 1 34
2000-01 4 58 2 36 3 343 4 906 1 36
2001-02 4 49 2 35 3 379 4 897 1 35
2002-03 3 45 2 32 3 318 4 933 1 40
2003-04 3 17 2 31 3 365 4 919 1 33
2004-05 3 19 2 34 3 352 4 876 1 34
2005-06 2 10 2 20 3 366 4 990 1 32
2006-07 2 16 2 29 3368
4 889 1 33
2007-08 2 35 2 40 3 381 4 880 1 35
2008-09 2 20 2 30 3 390 4 895 1 32
2009-10 2 21 2 28 3 399 4 892 1 31
2010-11 1 23 2 30 3 375 4 910 1 33
2011-12 1 24 2 32 3 326 4 1140 1 34
2012-13 1 27 2 33 3 318 4 1185 1 35
2013-14 1 30 2 NA NA NA 5 1140 1 47
Source: Dte. of Social Welfare, GNCT of Delhi

8/20/2019 Statistical+Abstract+of+Delhi+2014
http://slidepdf.com/reader/full/statisticalabstractofdelhi2014 176/190
157
TABLE 12.7 SLUM & J J CLUSTERS
SN ITEMS 2008-09 2009-10 2010-11 2011-12 2012-13
1 No. of basti vikaskendras
350+54
Addl. Floor
352+59
Addl. Floor
360+61
Addl. Floor
365+61
Addl. Floor
372+62
Addl. Floor
2 No. of shishu vatika 391+10 Parks+57 SVS
reconstructed
393+10 Parks
+58 SVS
reconstructe
d
396+10
Parks +66
SVS
reconstructe
d
400+10
Parks +67
SVS
reconstructe
d
406+10 Parks
+97 SVS
reconstructe
d
3 No. of jan suvidhacomplexes
(I) Pucca 443 448 457 458 460
(II)Prefab 184 184 184 184 184
(III)MobileToilet vans
220 220 220 220 220
Total 847 852 861 862 864
4 WC Seats of JSC
(I) Pucca 20004 20172 20392 20412 20466
(II)Prefab 4491 4491 4491 4491 4491
(III)MobileToilet vans
3080 3080 3080 3080 3080
Total 27575 27743 27963 27983 28037
5 No. of Night Shelters O & M of 12
NightShelters
O & M of 12
NightShelters
O & M of
12 NightShelters-52
Communirt
Halls
converted
into Night
Shelters
O & M of
12 NightShelters+
84
temporary
Night
Shelters
O & M of 67
NightShelters+
84
temporary
Night
Shelters
Sourse: -Socio-Economic Profile,Planning Department

8/20/2019 Statistical+Abstract+of+Delhi+2014
http://slidepdf.com/reader/full/statisticalabstractofdelhi2014 177/190
158
TABLE 12.8 PUBLIC DISTRIBUTION SYSTEM IN DELHI
Year No. of FoodCards
(in ’000)
No. of CerealUnits (in ’000)
No. of Sugar Units (in
’000)
No. of Fair Price Shops
No. of Licensedshop Kerosene
oil
1 2 3 4 5 6
1980-81 1376 12216 6775 2176-
1985-86 1722 15029 8521 3100-
1990-91 2362 20312 11866 35791840
1995-96 2970 25330 15222 3183-
1996-97 3063 26489 15836 31892314
1997-98 3116 28103 16444 32112319
1998-99 3353 30721 17793 3214
23421999-00 3599 33099 19345 3228
2372
2000-01 3689 33948 19934 31652501
2001-02 3759 34120 1642 31722541
2002-03 3838 38400 2000 31142521
2003-04 3974 40100 1900 31262499
2004-05 4067 39100 1900 31292476
2005-06 2601 14460 21400 27452443
2006-07 2814 28968 15873 27722423
2007-08 2803 - - 27722346
2008-09 3140 - - 25462234
2009-10
3093 - - 25462346
2010-11 3333* - - 25172363
2011-12 3339* - - 24982361
2012-13 3455 - - 24791828
2013-14 1779 - - 2396 NIL
*This includes stamped/unstamped, BPL, AAV, Annapurna cards
Source: Food & Supplies Department, GNCT of Delhi.

8/20/2019 Statistical+Abstract+of+Delhi+2014
http://slidepdf.com/reader/full/statisticalabstractofdelhi2014 178/190
159
******
CHAPTER THIRTEEN
POLICE, CRIME & ACCIDENTS
• Police Stations, Police Posts & Police Strength in Delhi
• Crimes in Delhi
• Properties Stolen & Recovered in Delhi
• Accidents in Delhi

8/20/2019 Statistical+Abstract+of+Delhi+2014
http://slidepdf.com/reader/full/statisticalabstractofdelhi2014 179/190
160
There are a variety of crimogenic factors which impact crime. These include
socio-economic factors such as unemployment, disparities in income and living
conditions, lack of basic civic amenities particularly in jhuggi-jhopries and unauthorized
colonies, adverse sex ratio, continual in-migration outpacing the development of
infrastructure and availability of working opportunities, a consumer culture with
umpteen TV channels continually selling a life style, particularly through
advertisements, which many want but cannot legitimately obtain etc. Delhi Police has
to deal with challenges resultant from the city being the national capital such as a
large number of VIP movements and protest programs which lead to a substantial
commitment in terms of manpower.
The data regarding Police Stations, Police Strength, Properties Stolen &
Recovered by police, crimes in Delhi and accidents in Delhi are included in this
Chapter. The source of information is Commissioner of Police, Delhi.
CHAPTER THIRTEEN: POLICE, CRIME &
ACCIDENTS
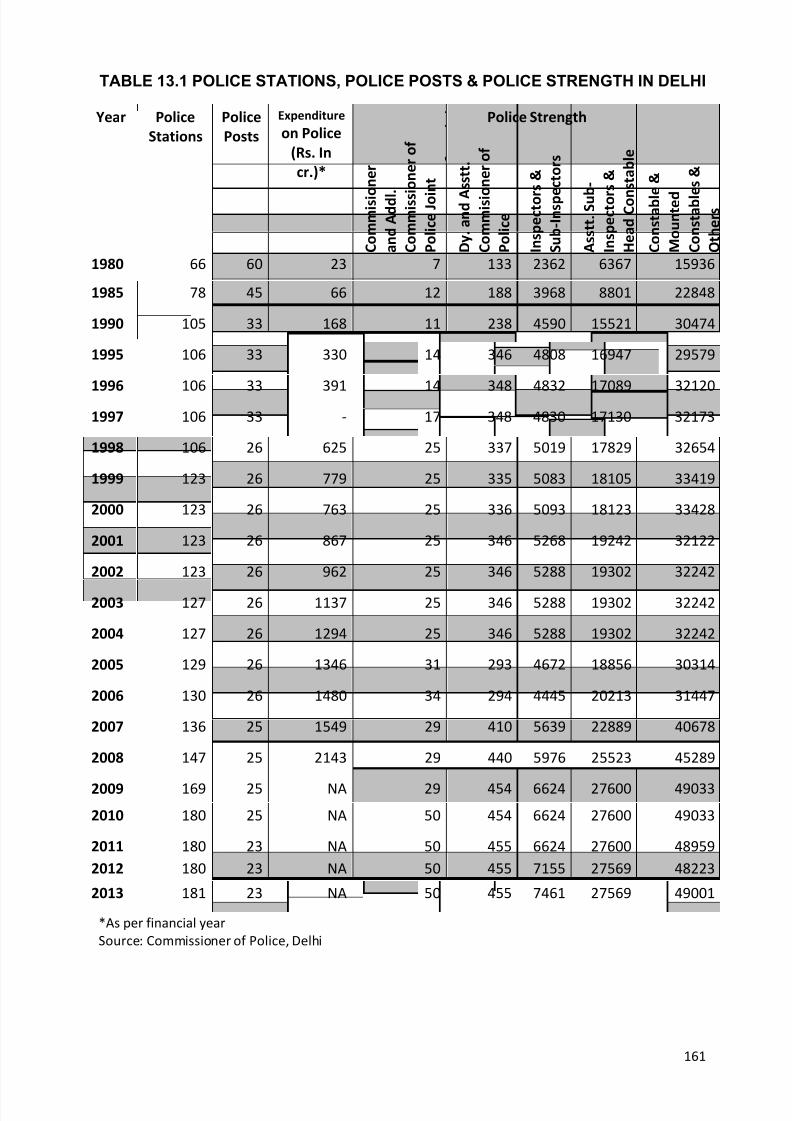
8/20/2019 Statistical+Abstract+of+Delhi+2014
http://slidepdf.com/reader/full/statisticalabstractofdelhi2014 180/190
161
TABLE 13.1 POLICE STATIONS, POLICE POSTS & POLICE STRENGTH IN DELHI
Year Police
Stations
Police
Posts
Expenditure
on Police
(Rs. In
cr.)*
Police Strength
C o m m i s i o n e r
a n d A d d l .
C o m m i s s i o n e r o f
P o l i c e J o i n t
D y . a n d A
s s t t .
C o m m i s i o n e r o f
P o l i c e
I n s p e c t o r
s &
S u b - I n s p e c t o r s
A s s t t . S u b -
I n s p e c t o r
s &
H e a d C o n
s t a b l e
C o n s t a b l e &
M o u n t e d
C o n s t a b l e s &
O t h e r s
1980 66 60 23 7 133 2362 6367 15936
1985 78 45 66 12 188 3968 8801 22848
1990 105 33 168 11 238 4590 15521 30474
1995 106 33 330 14 346 4808 16947 29579
1996 106 33 391 14 348 4832 17089 321201997 106 33 - 17 348 4830 17130 32173
1998 106 26 625 25 337 5019 17829 32654
1999 123 26 779 25 335 5083 18105 33419
2000 123 26 763 25 336 5093 18123 33428
2001 123 26 867 25 346 5268 19242 32122
2002 123 26 962 25 346 5288 19302 32242
2003 127 26 1137 25 346 5288 19302 32242
2004 127 26 1294 25 346 5288 19302 32242
2005 129 26 1346 31 293 4672 18856 30314
2006 130 26 1480 34 294 4445 20213 31447
2007 136 25 1549 29 410 5639 22889 40678
2008 147 25 2143 29 440 5976 25523 45289
2009 169 25 NA 29 454 6624 27600 49033
2010 180 25 NA 50 454 6624 27600 49033
2011 180 23 NA 50 455 6624 27600 48959
2012 180 23 NA 50 455 7155 27569 48223
2013 181 23 NA 50 455 7461 27569 49001
*As per financial year
Source: Commissioner of Police, Delhi

8/20/2019 Statistical+Abstract+of+Delhi+2014
http://slidepdf.com/reader/full/statisticalabstractofdelhi2014 181/190
162
TABLE 13.2 CRIMES IN DELHI
Year Murder Dacoity Robbery Burglary Theft AttempttoMurder
Arson Crimeunder Localand
SpecialLaws
1980 184 31 295 2425 22265 261 62 12738
1985 312 26 256 1788 13763 257 77 7797
1990 390 17 226 1552 12206 386 103 9397
1995 520 36 555 2039 17267 577 79 13927
1996 518 32 609 2425 20541 512 87 3668
1997 575 37 625 2722 22579 506 47 13783
1998 649 101 823 3764 26911 612 65 8893
1999 649 63 726 3429 24423 579 57 11373
2000 586 70 758 3453 21082 598 64 11826
2001 547 48 624 3029 19276 510 50 13749
2002 531 47 502 2360 9191 440 57 18272
2003 485 28 441 1898 8099 407 60 21910
2004 481 30 461 1875 10121 519 38 25136
2005 455 27 510 2093 9093 467 47 26573
2006 476 14 541 1950 8132 510 33 30372
2007 495 34 557 2055 8163 530 31 20994
2008 554 24 541 1926 7847 389 41 6754
2009 552 36 515 1733 21731 369 34 4053
2010 565 32 599 1502 23088 311 52 4667
2011 543 33 562 1419 22899 386 42 5896
2012 521 28 608 1715 22032 439 78 6080
2013 517 33 1245 2835 30124 585 97 6616
Contd…

8/20/2019 Statistical+Abstract+of+Delhi+2014
http://slidepdf.com/reader/full/statisticalabstractofdelhi2014 182/190
163
TABLE 13.2 CRIMES IN DELHI
Year Miscellaneous
I.P.C. Cases
Rape Dowry
Death
Eve
Teasing
Molestation
of Women
Snatch
Theft
Motor
Vehicle
Theft
1980 12062 - - - - - -
1985 13933 - - - - - -
1990 16968 - - - - - -
1995 26613 152 357 2730 502 - -
1996 45972 132 484 2059 694 - -
1997 32240 148 544 185 675 - -
1998 30568 438 126 172 653 - -
1999 27517 402 122 146 588 - -
2000 28406 435 125 123 549 - -
2001 29214 381 113 90 502 675 7894
2002 26010 403 135 976 446 605 7434
2003 26795 790 130 1599 489 532 7445
2004 29042 551 126 2132 601 775 8873
2005 30127 658 114 1714 762 1136 8862
2006 34036 623 137 556 718 1283 9366
2007 32065 598 138 414 868 1243 8874
2008 24097 466 129 328 611 1377 11020
200923881 469 141 238 552 NA NA
2010 23766 507 143 126 601 NA NA
2011 25877 568 142 229 653 NA NA
2012 27091 706 134 208 727 NA NA
2013 38537 1636 144 916 3515 NA NA
Year Missing Persons No. of Personss Traced
M F T M F T
2011 Below 18
Yrs.
2446 2665 5111 1879 1873 3752
Above 18Yrs.
4587 4214 8801 3137 2774 5911
2012 Below 18
Yrs.
2592 2692 5284 2065 1986 4051
Above 18
Yrs.
4995 4993 9988 3709 3591 7300
2013 Below 18
Yrs.
3316 3919 7235 2596 2862 5458
Above 18
Yrs.
6882 6683 13565 4958 4561 9519
Source: Commissioner of Police, Delhi

8/20/2019 Statistical+Abstract+of+Delhi+2014
http://slidepdf.com/reader/full/statisticalabstractofdelhi2014 183/190
164
TABLE 13.3 PROPERTIES STOLEN & RECOVERED IN DELHI
Year No. of
Cases
involving
theft of
Property
No. of
Cases in
which
Property
was
recovered
% Approximate
value of
property
stolen
(in Crore Rs.)
Approximate
value of
property
recovered
(in Crore Rs.)
%
1980 26584 2919 10.98 806 244 30.3
1985 16989 2187 12.9 1023 113 11.1
1990 14207 3285 23.12 1631 363 22.24
1995 20426 5976 29.26 5694 901 15.82
1996 20547 5975 29.07 5118 834 16.28
1997 22579 6301 27.90 6311 939 14.88
1998 32494 7244 22.29 6311 1159 12.65
1999 29553 9894 33.48 9165 1025 9.58
2000 26179 8864 33.86 10699 1087 9.26
2001 23652 8425 35.62 117408 1359 12.18
2002 20139 6834 33.93 11001 920 8.36
2003 18443 6509 35.29 10067 618 6.14
2004 22135 8086 36.53 17448 768 4.40
2005 21721 9070 41.76 12765 861 6.74
2006 21286 8558 40.20 13400 1064 7.94
2007 20926 8005 38.25 11995 860 7.17
2008 22535 7301 32.39 13941 937 6.72
2009 25360 7688 30.31 21584 1365 6.32
2010 26892 7093 26.37 20566 1516 7.37
2011 26389 8717 33.03 24119 2070 8.58
2012 25823 8117 31.43 21211 3472 16.37
2013 37875 9564 25.25 34594 2229 6.44
Source: Commissioner of Police, Delhi
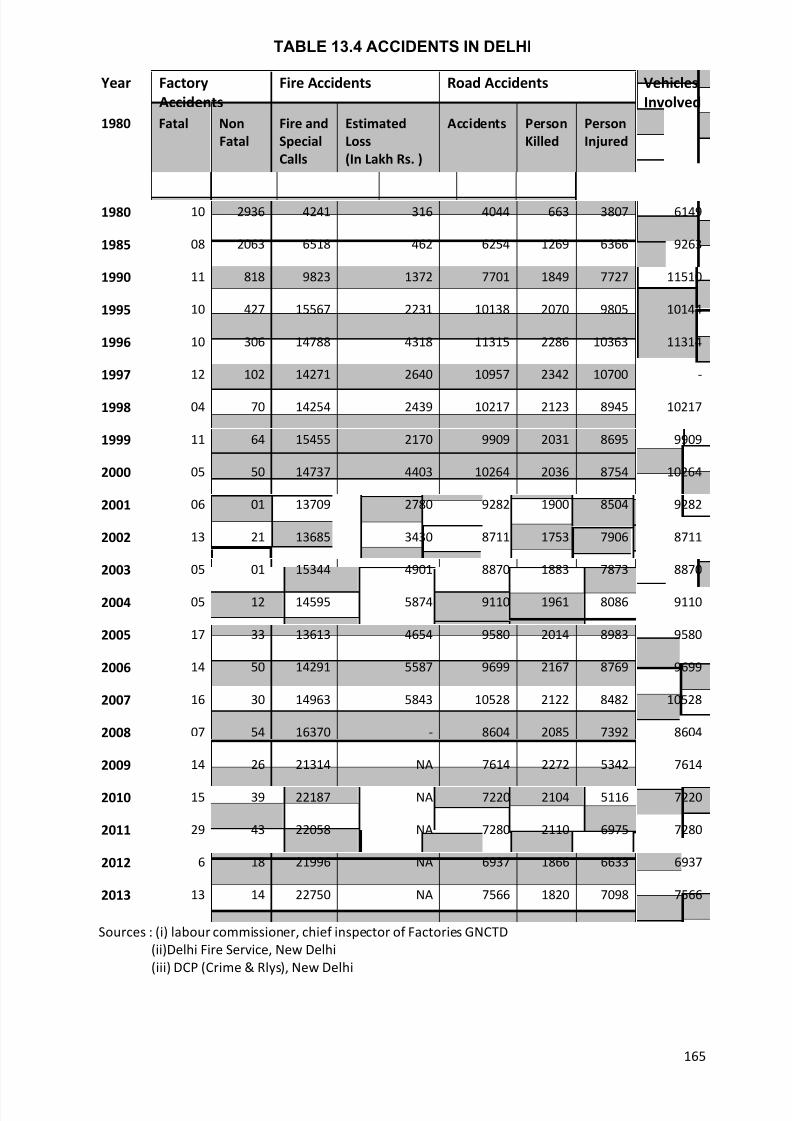
8/20/2019 Statistical+Abstract+of+Delhi+2014
http://slidepdf.com/reader/full/statisticalabstractofdelhi2014 184/190
165
TABLE 13.4 ACCIDENTS IN DELHI
Year Factory
Accidents
Fire Accidents Road Accidents Vehicles
Involved
1980 Fatal Non
Fatal
Fire and
Special
Calls
Estimated
Loss
(In Lakh Rs. )
Accidents Person
Killed
Person
Injured
1980 10 2936 4241 316 4044 663 3807 6149
1985 08 2063 6518 462 6254 1269 6366 9263
1990 11 818 9823 1372 7701 1849 7727 11510
1995 10 427 15567 2231 10138 2070 9805 10144
1996 10 306 14788 4318 11315 2286 10363 11314
1997 12 102 14271 2640 10957 2342 10700 -
1998 04 70 14254 2439 10217 2123 8945 10217
1999 11 64 15455 2170 9909 2031 8695 9909
2000 05 50 14737 4403 10264 2036 8754 10264
2001 06 01 13709 2780 9282 1900 8504 9282
2002 13 21 13685 3430 8711 1753 7906 8711
2003 05 01 15344 4901 8870 1883 7873 8870
2004 05 12 14595 5874 9110 1961 8086 9110
2005 17 33 13613 4654 9580 2014 8983 9580
2006 14 50 14291 5587 9699 2167 8769 9699
2007 16 30 14963 5843 10528 2122 8482 10528
2008 07 54 16370 - 8604 2085 7392 8604
2009 14 26 21314 NA 7614 2272 5342 7614
2010 15 39 22187 NA 7220 2104 5116 7220
2011 29 43 22058 NA 7280 2110 6975 7280
2012 6 18 21996 NA 6937 1866 6633 6937
2013 13 14 22750 NA 7566 1820 7098 7566
Sources : (i) labour commissioner, chief inspector of Factories GNCTD
(ii)Delhi Fire Service, New Delhi
(iii) DCP (Crime & Rlys), New Delhi

8/20/2019 Statistical+Abstract+of+Delhi+2014
http://slidepdf.com/reader/full/statisticalabstractofdelhi2014 185/190
166
******

8/20/2019 Statistical+Abstract+of+Delhi+2014
http://slidepdf.com/reader/full/statisticalabstractofdelhi2014 186/190
167
CONCEPTS AND DEFINITIONS
Some important concepts used in this publication are defined as follows:
1. Birth: “birth” means live-birth or still birth.
2. Live Birth: “live birth” means the complete expulsion or extraction from its mother of
a product of conception, irrespective of the duration of pregnancy, which after such
expulsion or extraction, breathers or shows any other evidence of life, and each
product of such birth is considered live-born.
3. Still-Birth:“still birth” means foetal death where a product of conception has attained
at least the prescribed period of gestation.
4. Birth Rate: Birth Rate acts as an index of the relative speed at which additions are
being made to the population through child-birth. It is only a live birth that signifies an
addition to the existing population, excluding still births.
The annual birth rate is defined as:
No. of Births in a year
Birth Rate = --------------------------- x 1000
Mid-year Population
5. Death Rate: The death rate for a given year tells us at what rate deaths have depleted
the population over the course of the year.
The death rate, which measures the decrease in a population due to deaths, is
perhaps the most widely used of any vital statistics rate because of its value as an
index in numerous demographic & public health problems.
The Annual Death Rate is defined as :
No. of Deaths in a Year
Death Rate = -------------------------------- x 1000Mid-year Population
6. Infant Mortality Rate: Infant mortality rate serves as one of the best indices to the
general “healthiness” of a society. It is similar to age-specific death rate for infants
under 1 year of age. The annual infant mortality rate is defined as :
No. of deaths under 1 year of age
which occurred among the population
Infant Mortality Rate = ------------------------------------------------------ x 1000
No. of live births which occurredamong the population

8/20/2019 Statistical+Abstract+of+Delhi+2014
http://slidepdf.com/reader/full/statisticalabstractofdelhi2014 187/190
168
7. Maternal Death Rate: Maternal death rate is defined as maternal deaths per thousand
live births.
No. of Maternal Deaths
Maternal Death Rate = ------------------------------------- x 1000
No. of live births
8. Employed and Unemployed: According to usual status approach, (with a reference
period of 365 days) adopted by National Sample Survey Organization (NSSO) a person
is considered as working or employed if he/she is engaged relatively for a longer time,
during the reference period of last 365 days in any one or more of the work activities.
He/she was considered as seeking or available for work or unemployed if he/she was
not working but was either seeking or available for work for a relatively longer period
of the specified reference period.
9. Own Account Establishment (OAE): OAE is an establishment having no hired worker
and is owned and operated with the help of household members only.
10. Labour force Participation Rate: Labour force comprises of employed and
unemployed and the number of such persons per 1000 persons in the population
constitutes its rate.
11. Unemployment Rate: Unemployment rate refers to number of persons unemployed
per 1000 persons in the Lobour Force.
12. Employment Rate: Employment rate refers to number of persons employed per 1000
persons in the Lobour Force.
13. Main worker: A person who has worked for a major part of the year preceding the
date of enumeration, i.e. one who was engaged in any economically productive
activity for 183 days or more, i.e. six months or more, in previous year.
14. Marginal worker: A person who has done some work in the year preceding the date of
enumeration but does not qualify to be called a ‘main worker’ i.e. period of work is
less than 183 days.
15. Non-worker: A person who has not worked at all in the year preceding the date of
enumeration.
16. Total fertility Rate: TFR measures average number of children born to a woman during
her entire reproductive period.
17. Gross State Domestic Product:GSDP is a measure in monetary terms of the volume of
all goods and services produced by an economy during a given period of time
accounted without duplication.

8/20/2019 Statistical+Abstract+of+Delhi+2014
http://slidepdf.com/reader/full/statisticalabstractofdelhi2014 188/190
169
18. Net State Domestic Product:
NSDP = GSDP- Consumption of fixed capital (depreciation)
19. Dependency Ratio: A measure showing the number of dependents (aged 0-14 and
over the age 65 ) to the total population (aged 15-65). Also referred to as the “total
dependency ratio”.
Calculated by:
No. of Dependents
Dependency Ratio = ------------------------ --------- X 100%
Population (ages 15-64)
20. Literacy and Education Literate: A person who can read and write in any language is
literate. A person who can merely read but cannot write is not literate. It is not
necessary that the person should have received any formal education or should have
passed any minimum educational standard. All children of age below seven years have
been treated as illiterate even though some of them may be attending schools and
may be able to read and write a few words.
21. Literacy rate: Literacy rate of the population is defined as the percentage of illiterates
in the age group of seven years and above. For different age groups the percentage of
illiterates in that age group gives the literacy rate.
22. Gross Enrolment Ratio: Gross Enrolment ratio measures what percentage of the total
population in the relevant age-group is being covered by the various educational
programmes being run in the country, i.e.
Enrolment at stage I
Gross Enrolment Ratio at stage I = -- --------------------------------------- * 100
Population in the age group corresponding to the Istage
Two stages are: primary (Classes I-V) and middle (Classes VI-VIII).
The corresponding age-group for these stages are 6-10 years and 11-13 years
respectively. Therefore, gross enrolment ratio for primary stage (I-V) is
Total Enrolment in Classes I-V
Gross Enrolment Ratio for primary stage (I-V) = -- ------------------------------------- * 100
Total Population in the age group 6-11 years
While interpreting these figures it should by noted that there may be many students
outside the age group 6-11 enrolled in classes’ I-V. Therefore, enrolment ratios in
some age groups can be more than 100.
23. Dropout rate: Dropout at primary stage during a given year is defined as the ratio of
the difference of enrolment in class I in the fourth year preceding and the enrolment
in class V during the year to the enrolment in the class I in the fourt year preceding. In
mathematical terms, these rates for primary (I-V), middle (I-VIII) and secondary (I-X)
stages are explained below:
Enrolment in class I preceding four year (i.e. 1987-88)

8/20/2019 Statistical+Abstract+of+Delhi+2014
http://slidepdf.com/reader/full/statisticalabstractofdelhi2014 189/190
170
Drop out rates at minus Enrolment in class V during the year (1991-92)
Primary stage = ------------------------------------------------------------ x 100
during 1991-92 Enrolment in class I preceding four year (i.e. 1987-88)
Enrolment in class I preceding 7 years (i.e. 1984-85)
Drop out rates at minus Enrolment in class VIII during the year (1991-92)
Elementary stage = ------------------------------------------------------------ x 100during 1991-92 Enrolment in class I preceding 7 year (i.e. 1984-85)
Enrolment in class I preceding 9 years (i.e. 1982-83)
Drop out rates at minus Enrolment in class X during the year (1991-92)
Secondary stage = ------------------------------------------------------------ x 100
during 1991-92 Enrolment in class I preceding 9 year (i.e. 1982-83)
24. Conversion Table For Metric Standards
STANDARD OF WEIGHT
1 Grain : 0.065 Gram
1 Ounce : 28.350 Grams
1 Tola : 11.664 Grams
1 Chhattak : 58.32 Grams
1 Pound : 0.4535924 Kilogram
1 Ton : 1016.05 Kilograms
1 Seer : 0.93310 Kilograms
1 Maund : 37.3242 Kilograms
1 Quintal : 100.00 Kilograms
10 Quintal : 1.00 Metric Ton
STANDARD OF LENGTH
1 Inch : 0.0254 Metre
1 Foot : 0.3048 Metre
1 Yard : 0.9144 Metre
1Mile : 1609.344 Metre
STANDARD OF AREA
1 Sq. Foot : 0.092903 Sq. Metre
1 Sq. Yard : 0.83613 Sq. Metre
1 Acre : 0.404686 Hectare
: 0.004047 Sq. Kilometre
1Sq. Mile : 2.58999 Sq. Kilometres
: 640.00 Acres
STANDARD OF CAPACITY
8/20/2019 Statistical+Abstract+of+Delhi+2014
http://slidepdf.com/reader/full/statisticalabstractofdelhi2014 190/190
1 Imperial Gallon : 4.54596 Litre
1U.S. Gallon : 3.78533 Litre
1 Litre : 1000.028Cubic Centi
metres
: 0.035316 Cubic Foot
1Cubic Foot : 0.02832 Cubic Metre
: 28.3168 Litres
1 Cubic Yard : 764.544 Litres
: 201.974 U.S. Gallon
----------XXX----------