Embed Size (px)
Citation preview
Statistical Abstract of North Carolina Taxes
2004
Tax Research Division
5.3%
5.4%
5.5%
5.6%
5.7%
5.8%
5.9%
6.0%
6.1%
6.2%
6.3%
1989 1990 1991 1992 1993 1994 1995 1996 1997 1998 1999 2000 2001 2002
Fiscal year ended
State Imposed Taxes as a Percentage of Gross State Product
Statistical Abstract of North Carolina Taxes
2004
INTRODUCTION
The Statistical Abstract of North Carolina Taxes provides statistics concerning taxes imposed under the Revenue Laws of North
Carolina. It is designed to give legislators, tax professionals, researchers, and other interested citizens of North Carolina information
about the amount of taxes collected, classifications of taxpayers, and the geographic distribution of taxes. The Statistical Abstract
includes both historical series of data and detailed reports for the most recent fiscal or tax year available. It was prepared by the
Department’s Division of Tax Research, based primarily on data recorded from individual and business tax forms in the Department
of Revenue’s data systems.
Questions regarding the Statistical Abstract may be directed to Karl Knapp, Director of the Tax Research Division, at (919) 733-7722.
150 copies of this report were printed at a cost of $819.80, or $5.47 per copy.
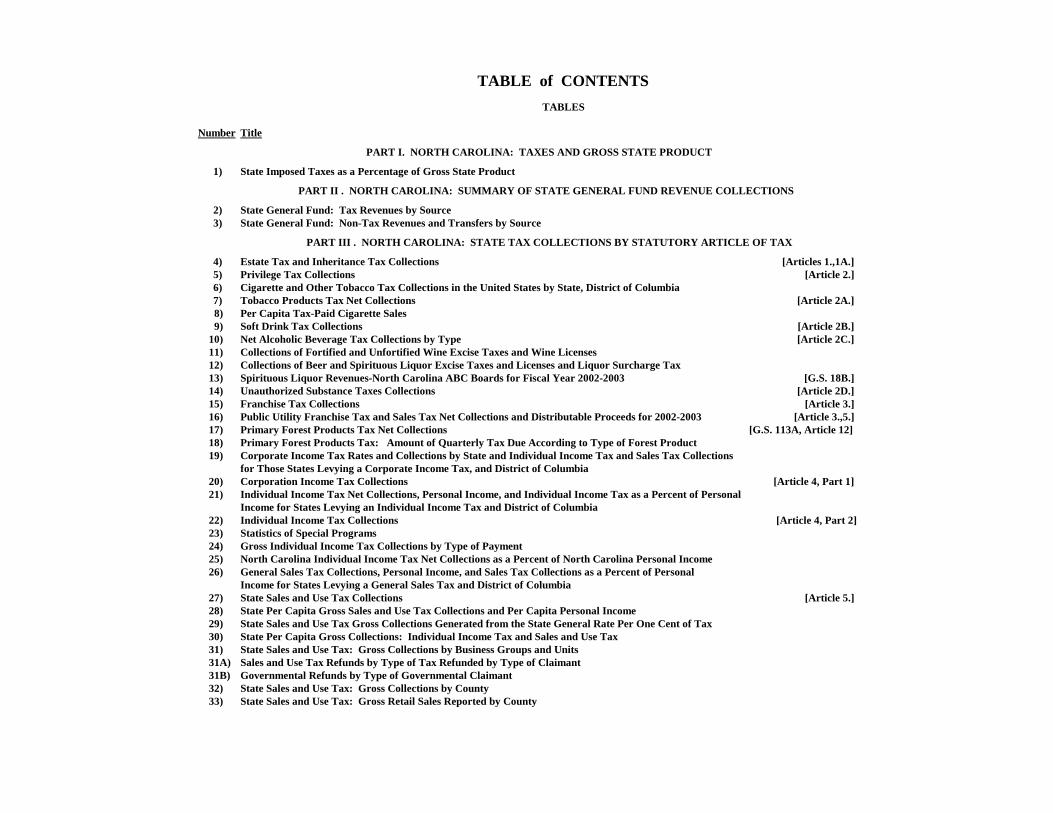
TABLE of CONTENTS
TABLES
Number Title
PART I. NORTH CAROLINA: TAXES AND GROSS STATE PRODUCT
1) State Imposed Taxes as a Percentage of Gross State Product
PART II . NORTH CAROLINA: SUMMARY OF STATE GENERAL FUND REVENUE COLLECTIONS
2) State General Fund: Tax Revenues by Source
3) State General Fund: Non-Tax Revenues and Transfers by Source
PART III . NORTH CAROLINA: STATE TAX COLLECTIONS BY STATUTORY ARTICLE OF TAX
4) Estate Tax and Inheritance Tax Collections [Articles 1.,1A.]
5) Privilege Tax Collections [Article 2.]
6) Cigarette and Other Tobacco Tax Collections in the United States by State, District of Columbia
7) Tobacco Products Tax Net Collections [Article 2A.]
8) Per Capita Tax-Paid Cigarette Sales
9) Soft Drink Tax Collections [Article 2B.]
10) Net Alcoholic Beverage Tax Collections by Type [Article 2C.]
11) Collections of Fortified and Unfortified Wine Excise Taxes and Wine Licenses
12) Collections of Beer and Spirituous Liquor Excise Taxes and Licenses and Liquor Surcharge Tax
13) Spirituous Liquor Revenues-North Carolina ABC Boards for Fiscal Year 2002-2003 [G.S. 18B.]
14) Unauthorized Substance Taxes Collections [Article 2D.]
15) Franchise Tax Collections [Article 3.]
16) Public Utility Franchise Tax and Sales Tax Net Collections and Distributable Proceeds for 2002-2003 [Article 3.,5.]
17) Primary Forest Products Tax Net Collections [G.S. 113A, Article 12]
18) Primary Forest Products Tax: Amount of Quarterly Tax Due According to Type of Forest Product
19) Corporate Income Tax Rates and Collections by State and Individual Income Tax and Sales Tax Collections
for Those States Levying a Corporate Income Tax, and District of Columbia
20) Corporation Income Tax Collections [Article 4, Part 1]
21) Individual Income Tax Net Collections, Personal Income, and Individual Income Tax as a Percent of Personal
Income for States Levying an Individual Income Tax and District of Columbia
22) Individual Income Tax Collections [Article 4, Part 2]
23) Statistics of Special Programs
24) Gross Individual Income Tax Collections by Type of Payment
25) North Carolina Individual Income Tax Net Collections as a Percent of North Carolina Personal Income
26) General Sales Tax Collections, Personal Income, and Sales Tax Collections as a Percent of Personal
Income for States Levying a General Sales Tax and District of Columbia
27) State Sales and Use Tax Collections [Article 5.]
28) State Per Capita Gross Sales and Use Tax Collections and Per Capita Personal Income
29) State Sales and Use Tax Gross Collections Generated from the State General Rate Per One Cent of Tax
30) State Per Capita Gross Collections: Individual Income Tax and Sales and Use Tax
31) State Sales and Use Tax: Gross Collections by Business Groups and Units
31A) Sales and Use Tax Refunds by Type of Tax Refunded by Type of Claimant
31B) Governmental Refunds by Type of Governmental Claimant
32) State Sales and Use Tax: Gross Collections by County
33) State Sales and Use Tax: Gross Retail Sales Reported by County
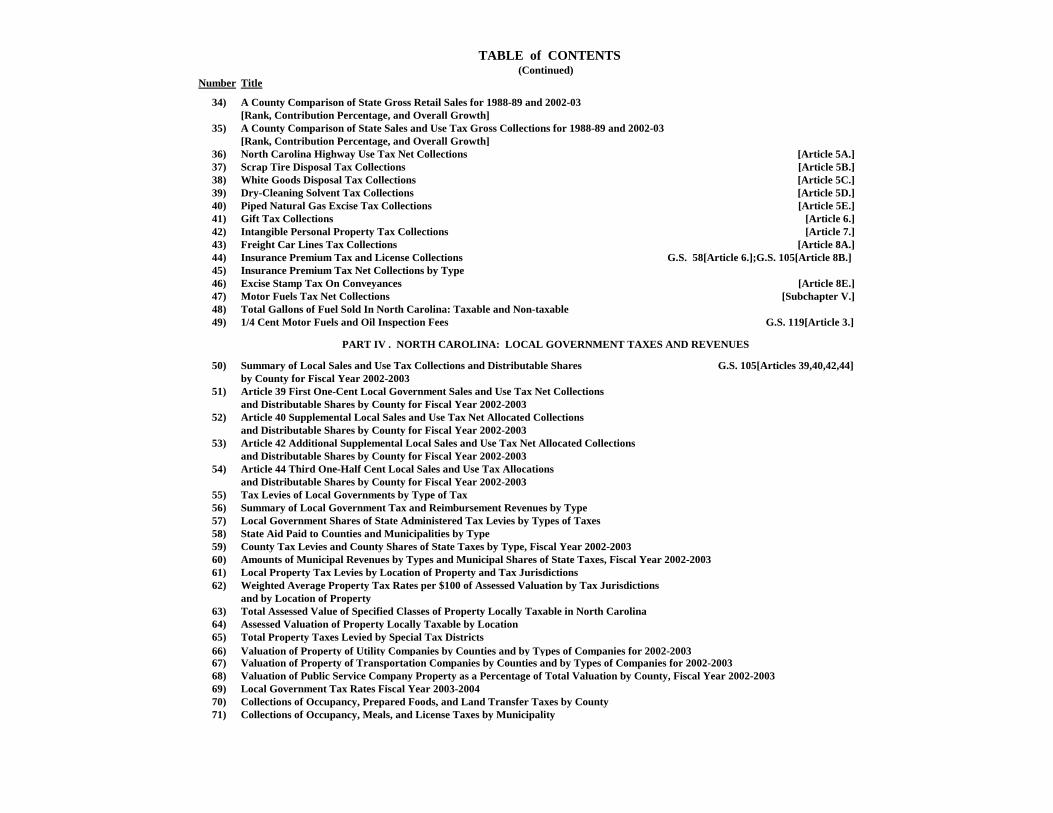
TABLE of CONTENTS (Continued)
Number Title
34) A County Comparison of State Gross Retail Sales for 1988-89 and 2002-03
[Rank, Contribution Percentage, and Overall Growth]
35) A County Comparison of State Sales and Use Tax Gross Collections for 1988-89 and 2002-03
[Rank, Contribution Percentage, and Overall Growth]
36) North Carolina Highway Use Tax Net Collections [Article 5A.]
37) Scrap Tire Disposal Tax Collections [Article 5B.]
38) White Goods Disposal Tax Collections [Article 5C.]
39) Dry-Cleaning Solvent Tax Collections [Article 5D.]
40) Piped Natural Gas Excise Tax Collections [Article 5E.]
41) Gift Tax Collections [Article 6.]
42) Intangible Personal Property Tax Collections [Article 7.]
43) Freight Car Lines Tax Collections [Article 8A.]
44) Insurance Premium Tax and License Collections G.S. 58[Article 6.];G.S. 105[Article 8B.]
45) Insurance Premium Tax Net Collections by Type
46) Excise Stamp Tax On Conveyances [Article 8E.]
47) Motor Fuels Tax Net Collections [Subchapter V.]
48) Total Gallons of Fuel Sold In North Carolina: Taxable and Non-taxable
49) 1/4 Cent Motor Fuels and Oil Inspection Fees G.S. 119[Article 3.]
PART IV . NORTH CAROLINA: LOCAL GOVERNMENT TAXES AND REVENUES
50) Summary of Local Sales and Use Tax Collections and Distributable Shares G.S. 105[Articles 39,40,42,44]
by County for Fiscal Year 2002-2003
51) Article 39 First One-Cent Local Government Sales and Use Tax Net Collections
and Distributable Shares by County for Fiscal Year 2002-2003
52) Article 40 Supplemental Local Sales and Use Tax Net Allocated Collections
and Distributable Shares by County for Fiscal Year 2002-2003
53) Article 42 Additional Supplemental Local Sales and Use Tax Net Allocated Collections
and Distributable Shares by County for Fiscal Year 2002-2003
54) Article 44 Third One-Half Cent Local Sales and Use Tax Allocations
and Distributable Shares by County for Fiscal Year 2002-2003
55) Tax Levies of Local Governments by Type of Tax
56) Summary of Local Government Tax and Reimbursement Revenues by Type
57) Local Government Shares of State Administered Tax Levies by Types of Taxes
58) State Aid Paid to Counties and Municipalities by Type
59) County Tax Levies and County Shares of State Taxes by Type, Fiscal Year 2002-2003
60) Amounts of Municipal Revenues by Types and Municipal Shares of State Taxes, Fiscal Year 2002-2003
61) Local Property Tax Levies by Location of Property and Tax Jurisdictions
62) Weighted Average Property Tax Rates per $100 of Assessed Valuation by Tax Jurisdictions
and by Location of Property
63) Total Assessed Value of Specified Classes of Property Locally Taxable in North Carolina
64) Assessed Valuation of Property Locally Taxable by Location
65) Total Property Taxes Levied by Special Tax Districts
66) Valuation of Property of Utility Companies by Counties and by Types of Companies for 2002-2003
67) Valuation of Property of Transportation Companies by Counties and by Types of Companies for 2002-2003
68) Valuation of Public Service Company Property as a Percentage of Total Valuation by County, Fiscal Year 2002-2003
69) Local Government Tax Rates Fiscal Year 2003-2004
70) Collections of Occupancy, Prepared Foods, and Land Transfer Taxes by County
71) Collections of Occupancy, Meals, and License Taxes by Municipality
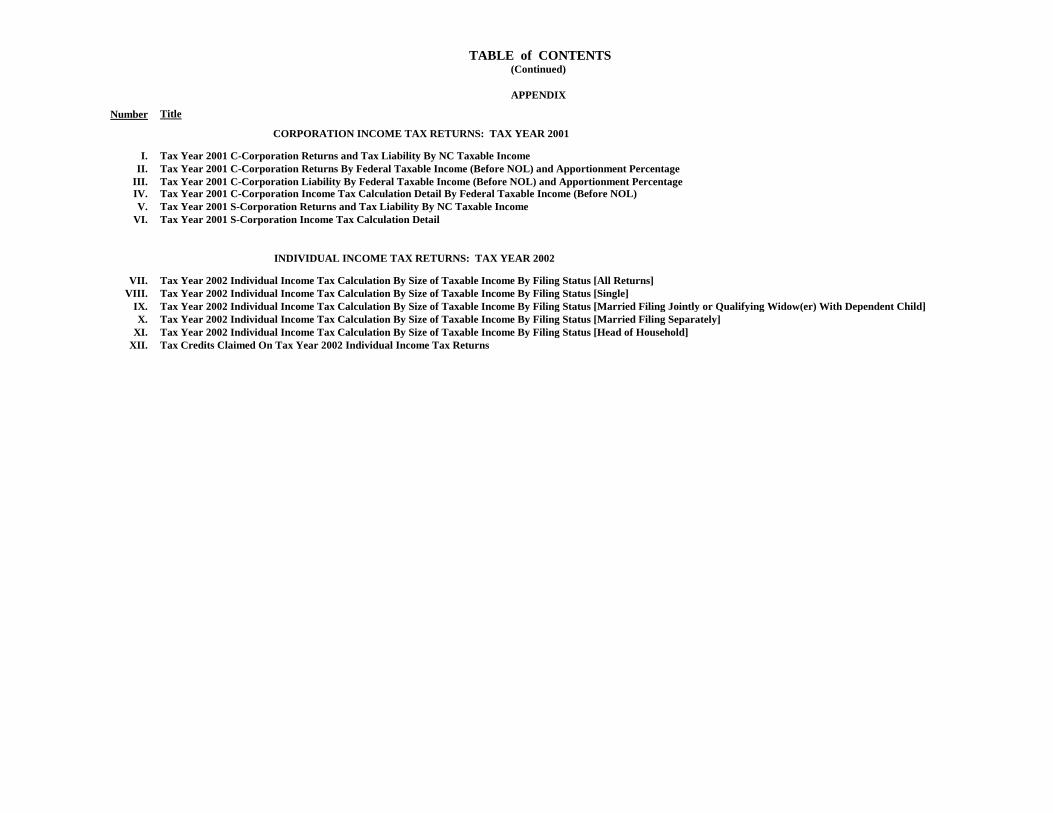
TABLE of CONTENTS (Continued)
APPENDIX
Number Title
CORPORATION INCOME TAX RETURNS: TAX YEAR 2001
I. Tax Year 2001 C-Corporation Returns and Tax Liability By NC Taxable Income
II. Tax Year 2001 C-Corporation Returns By Federal Taxable Income (Before NOL) and Apportionment Percentage
III. Tax Year 2001 C-Corporation Liability By Federal Taxable Income (Before NOL) and Apportionment Percentage
IV. Tax Year 2001 C-Corporation Income Tax Calculation Detail By Federal Taxable Income (Before NOL)
V. Tax Year 2001 S-Corporation Returns and Tax Liability By NC Taxable Income
VI. Tax Year 2001 S-Corporation Income Tax Calculation Detail
INDIVIDUAL INCOME TAX RETURNS: TAX YEAR 2002
VII. Tax Year 2002 Individual Income Tax Calculation By Size of Taxable Income By Filing Status [All Returns]
VIII. Tax Year 2002 Individual Income Tax Calculation By Size of Taxable Income By Filing Status [Single]
IX. Tax Year 2002 Individual Income Tax Calculation By Size of Taxable Income By Filing Status [Married Filing Jointly or Qualifying Widow(er) With Dependent Child]
X. Tax Year 2002 Individual Income Tax Calculation By Size of Taxable Income By Filing Status [Married Filing Separately]
XI. Tax Year 2002 Individual Income Tax Calculation By Size of Taxable Income By Filing Status [Head of Household]
XII. Tax Credits Claimed On Tax Year 2002 Individual Income Tax Returns
PART I. NORTH CAROLINA: TAXES AND GROSS STATE PRODUCT
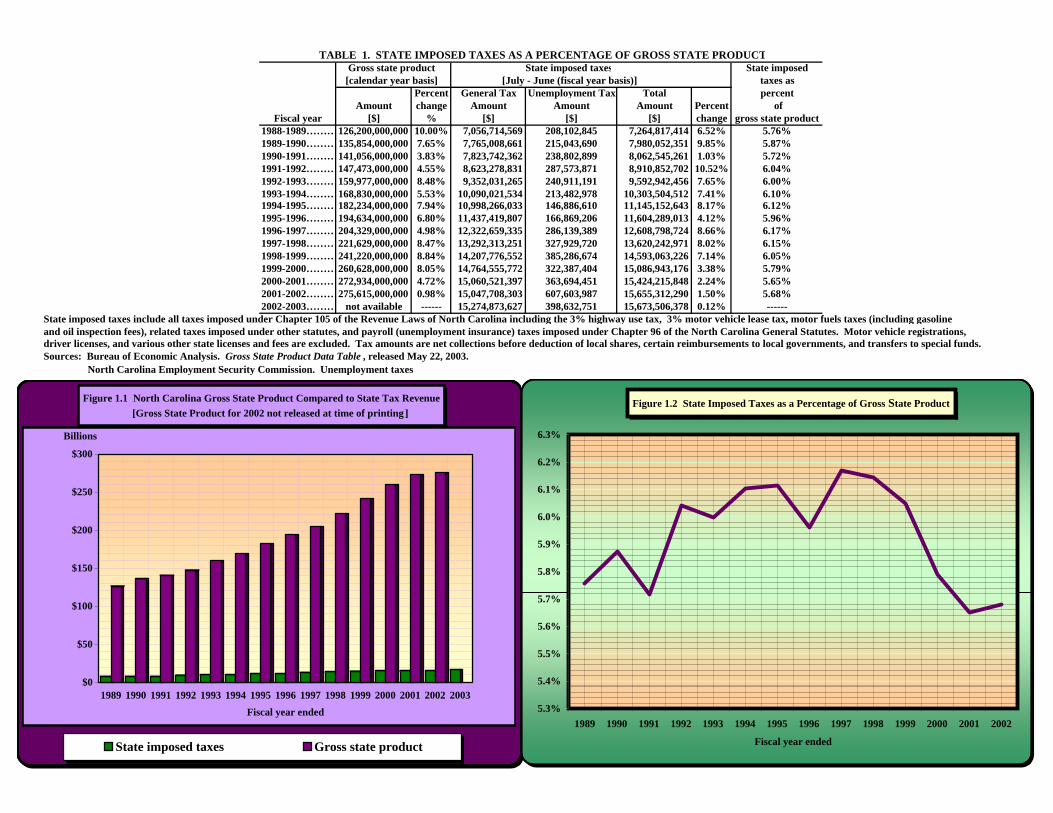
TABLE 1. STATE IMPOSED TAXES AS A PERCENTAGE OF GROSS STATE PRODUCT Gross state product State imposed taxes State imposed [calendar year basis] [July - June (fiscal year basis)] taxes as
Percent General Tax Unemployment Tax Total percentAmount change Amount Amount Amount Percent of
Fiscal year [$] % [$] [$] [$] change gross state product1988-1989………126,200,000,000 10.00% 7,056,714,569 208,102,845 7,264,817,414 6.52% 5.76%1989-1990………135,854,000,000 7.65% 7,765,008,661 215,043,690 7,980,052,351 9.85% 5.87%1990-1991………141,056,000,000 3.83% 7,823,742,362 238,802,899 8,062,545,261 1.03% 5.72%1991-1992………147,473,000,000 4.55% 8,623,278,831 287,573,871 8,910,852,702 10.52% 6.04%1992-1993………159,977,000,000 8.48% 9,352,031,265 240,911,191 9,592,942,456 7.65% 6.00%1993-1994………168,830,000,000 5.53% 10,090,021,534 213,482,978 10,303,504,512 7.41% 6.10%1994-1995………182,234,000,000 7.94% 10,998,266,033 146,886,610 11,145,152,643 8.17% 6.12%1995-1996………194,634,000,000 6.80% 11,437,419,807 166,869,206 11,604,289,013 4.12% 5.96%1996-1997………204,329,000,000 4.98% 12,322,659,335 286,139,389 12,608,798,724 8.66% 6.17%1997-1998………221,629,000,000 8.47% 13,292,313,251 327,929,720 13,620,242,971 8.02% 6.15%1998-1999………241,220,000,000 8.84% 14,207,776,552 385,286,674 14,593,063,226 7.14% 6.05%1999-2000………260,628,000,000 8.05% 14,764,555,772 322,387,404 15,086,943,176 3.38% 5.79%2000-2001………272,934,000,000 4.72% 15,060,521,397 363,694,451 15,424,215,848 2.24% 5.65%2001-2002………275,615,000,000 0.98% 15,047,708,303 607,603,987 15,655,312,290 1.50% 5.68%2002-2003……… not available ------ 15,274,873,627 398,632,751 15,673,506,378 0.12% ------
State imposed taxes include all taxes imposed under Chapter 105 of the Revenue Laws of North Carolina including the 3% highway use tax, 3% motor vehicle lease tax, motor fuels taxes (including gasolineand oil inspection fees), related taxes imposed under other statutes, and payroll (unemployment insurance) taxes imposed under Chapter 96 of the North Carolina General Statutes. Motor vehicle registrations, driver licenses, and various other state licenses and fees are excluded. Tax amounts are net collections before deduction of local shares, certain reimbursements to local governments, and transfers to special funds. Sources: Bureau of Economic Analysis. Gross State Product Data Table , released May 22, 2003. North Carolina Employment Security Commission. Unemployment taxes
1989 1990 1991 1992 1993 1994 1995 1996 1997 1998 1999 2000 2001 #Gros 126,200,000,000 135,854,000,000 141,056,000,000 147,473,000,000 ###### 168,830,000,000 182,234,000,000 194,634,000,000 ###### 221,629,000,000 241,220,000,000 260,628,000,000 ##### #State 7,264,817,414 7,980,052,351 8,062,545,261 8,910,852,702 ###### 10,303,504,512 11,145,152,643 11,604,289,013 ###### 13,620,242,971 14,593,063,226 15,086,943,176 ##### #
1989 5.76%1990 5.87%1991 5.72%1992 6.04%1993 6.00%1994 6.10%1995 6.12%1996 5.96%1997 6.17%1998 6.15%1999 6.05%2000 5.79%2001 5.65%2002 5.68%
$0
$50
$100
$150
$200
$250
$300
Billions
1989 1990 1991 1992 1993 1994 1995 1996 1997 1998 1999 2000 2001 2002 2003Fiscal year ended
Figure 1.1 North Carolina Gross State Product Compared to State Tax Revenue [Gross State Product for 2002 not released at time of printing]
State imposed taxes Gross state product
Figure 1.2 State Imposed Taxes as a Percentage of Gross State Product
5.3%
5.4%
5.5%
5.6%
5.7%
5.8%
5.9%
6.0%
6.1%
6.2%
6.3%
1989 1990 1991 1992 1993 1994 1995 1996 1997 1998 1999 2000 2001 2002
Fiscal year ended
PART II. NORTH CAROLINA: SUMMARY OF STATE GENERAL FUND REVENUE COLLECTIONS
1989 1990 1991 1992 1993 1994 1995 1996 1997 1998 1999 2000 2001 2002 2003
$0
$1
$2
$3
$4
$5
$6
$7
$8
(billions)
Fiscal year ended
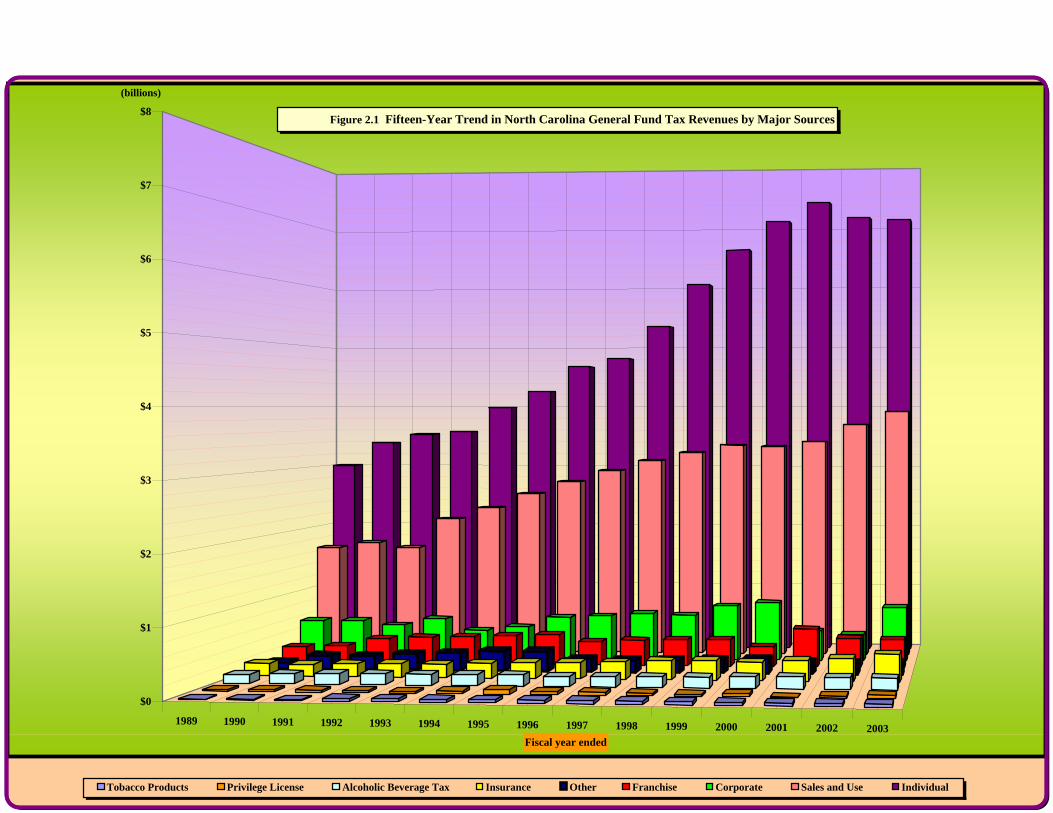
Figure 2.1 Fifteen-Year Trend in North Carolina General Fund Tax Revenues by Major Sources
Tobacco Products Privilege License Alcoholic Beverage Tax Insurance Other Franchise Corporate Sales and Use Individual
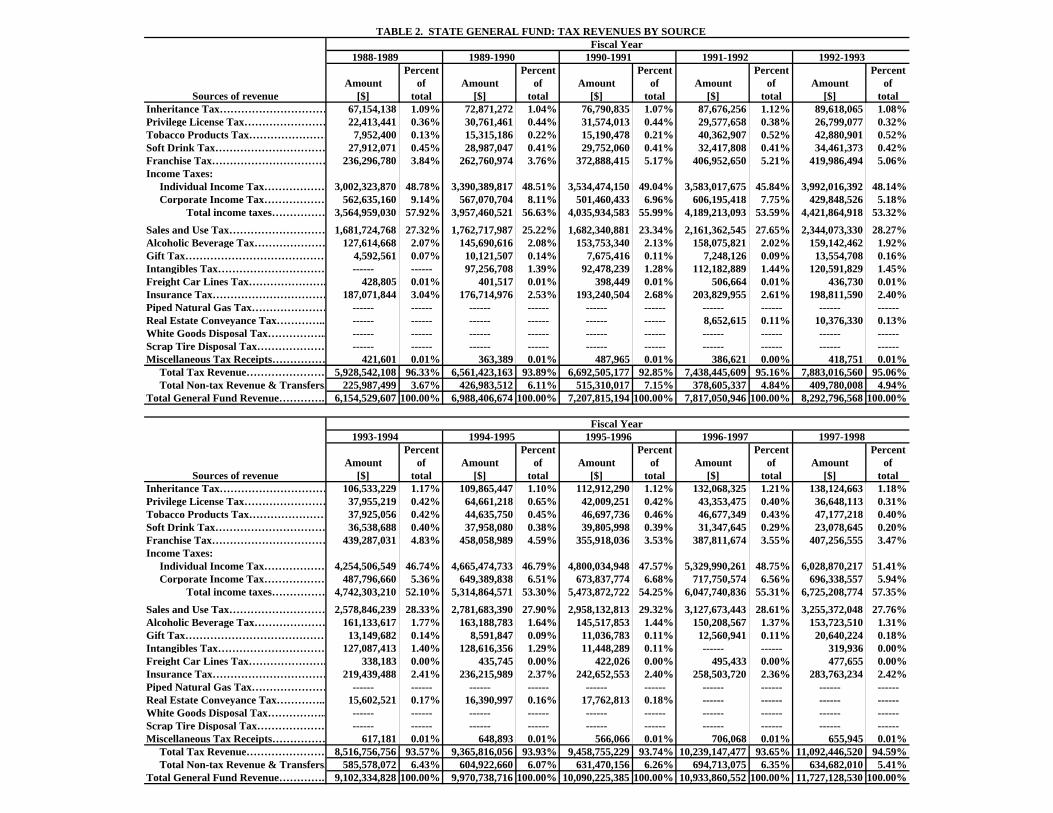
TABLE 2. STATE GENERAL FUND: TAX REVENUES BY SOURCE Fiscal Year
1988-1989 1989-1990 1990-1991 1991-1992 1992-1993Percent Percent Percent Percent Percent
Amount of Amount of Amount of Amount of Amount ofSources of revenue [$] total [$] total [$] total [$] total [$] total
Inheritance Tax………………………… 67,154,138 1.09% 72,871,272 1.04% 76,790,835 1.07% 87,676,256 1.12% 89,618,065 1.08%Privilege License Tax…………………… 22,413,441 0.36% 30,761,461 0.44% 31,574,013 0.44% 29,577,658 0.38% 26,799,077 0.32%Tobacco Products Tax…………………… 7,952,400 0.13% 15,315,186 0.22% 15,190,478 0.21% 40,362,907 0.52% 42,880,901 0.52%Soft Drink Tax…………………………… 27,912,071 0.45% 28,987,047 0.41% 29,752,060 0.41% 32,417,808 0.41% 34,461,373 0.42%Franchise Tax…………………………… 236,296,780 3.84% 262,760,974 3.76% 372,888,415 5.17% 406,952,650 5.21% 419,986,494 5.06%Income Taxes: Individual Income Tax……………… 3,002,323,870 48.78% 3,390,389,817 48.51% 3,534,474,150 49.04% 3,583,017,675 45.84% 3,992,016,392 48.14% Corporate Income Tax……………… 562,635,160 9.14% 567,070,704 8.11% 501,460,433 6.96% 606,195,418 7.75% 429,848,526 5.18% Total income taxes…………… 3,564,959,030 57.92% 3,957,460,521 56.63% 4,035,934,583 55.99% 4,189,213,093 53.59% 4,421,864,918 53.32%
Sales and Use Tax……………………… 1,681,724,768 27.32% 1,762,717,987 25.22% 1,682,340,881 23.34% 2,161,362,545 27.65% 2,344,073,330 28.27%Alcoholic Beverage Tax………………… 127,614,668 2.07% 145,690,616 2.08% 153,753,340 2.13% 158,075,821 2.02% 159,142,462 1.92%Gift Tax…………………………………… 4,592,561 0.07% 10,121,507 0.14% 7,675,416 0.11% 7,248,126 0.09% 13,554,708 0.16%Intangibles Tax…………………………. ------ ------ 97,256,708 1.39% 92,478,239 1.28% 112,182,889 1.44% 120,591,829 1.45%Freight Car Lines Tax…………………. 428,805 0.01% 401,517 0.01% 398,449 0.01% 506,664 0.01% 436,730 0.01%Insurance Tax…………………………… 187,071,844 3.04% 176,714,976 2.53% 193,240,504 2.68% 203,829,955 2.61% 198,811,590 2.40%Piped Natural Gas Tax………………… ------ ------ ------ ------ ------ ------ ------ ------ ------ ------Real Estate Conveyance Tax………….. ------ ------ ------ ------ ------ ------ 8,652,615 0.11% 10,376,330 0.13%White Goods Disposal Tax…………….. ------ ------ ------ ------ ------ ------ ------ ------ ------ ------Scrap Tire Disposal Tax………………… ------ ------ ------ ------ ------ ------ ------ ------ ------ ------Miscellaneous Tax Receipts…………… 421,601 0.01% 363,389 0.01% 487,965 0.01% 386,621 0.00% 418,751 0.01% Total Tax Revenue…………………… 5,928,542,108 96.33% 6,561,423,163 93.89% 6,692,505,177 92.85% 7,438,445,609 95.16% 7,883,016,560 95.06% Total Non-tax Revenue & Transfers. 225,987,499 3.67% 426,983,512 6.11% 515,310,017 7.15% 378,605,337 4.84% 409,780,008 4.94%Total General Fund Revenue…………. 6,154,529,607 100.00% 6,988,406,674 100.00% 7,207,815,194 100.00% 7,817,050,946 100.00% 8,292,796,568 100.00%
Fiscal Year 1993-1994 1994-1995 1995-1996 1996-1997 1997-1998
Percent Percent Percent Percent PercentAmount of Amount of Amount of Amount of Amount of
Sources of revenue [$] total [$] total [$] total [$] total [$] totalInheritance Tax………………………… 106,533,229 1.17% 109,865,447 1.10% 112,912,290 1.12% 132,068,325 1.21% 138,124,663 1.18%Privilege License Tax…………………… 37,955,219 0.42% 64,661,218 0.65% 42,009,251 0.42% 43,353,475 0.40% 36,648,113 0.31%Tobacco Products Tax…………………… 37,925,056 0.42% 44,635,750 0.45% 46,697,736 0.46% 46,677,349 0.43% 47,177,218 0.40%Soft Drink Tax…………………………… 36,538,688 0.40% 37,958,080 0.38% 39,805,998 0.39% 31,347,645 0.29% 23,078,645 0.20%Franchise Tax…………………………… 439,287,031 4.83% 458,058,989 4.59% 355,918,036 3.53% 387,811,674 3.55% 407,256,555 3.47%Income Taxes: Individual Income Tax……………… 4,254,506,549 46.74% 4,665,474,733 46.79% 4,800,034,948 47.57% 5,329,990,261 48.75% 6,028,870,217 51.41% Corporate Income Tax……………… 487,796,660 5.36% 649,389,838 6.51% 673,837,774 6.68% 717,750,574 6.56% 696,338,557 5.94% Total income taxes…………… 4,742,303,210 52.10% 5,314,864,571 53.30% 5,473,872,722 54.25% 6,047,740,836 55.31% 6,725,208,774 57.35%
Sales and Use Tax……………………… 2,578,846,239 28.33% 2,781,683,390 27.90% 2,958,132,813 29.32% 3,127,673,443 28.61% 3,255,372,048 27.76%Alcoholic Beverage Tax………………… 161,133,617 1.77% 163,188,783 1.64% 145,517,853 1.44% 150,208,567 1.37% 153,723,510 1.31%Gift Tax…………………………………… 13,149,682 0.14% 8,591,847 0.09% 11,036,783 0.11% 12,560,941 0.11% 20,640,224 0.18%Intangibles Tax…………………………. 127,087,413 1.40% 128,616,356 1.29% 11,448,289 0.11% ------ ------ 319,936 0.00%Freight Car Lines Tax…………………. 338,183 0.00% 435,745 0.00% 422,026 0.00% 495,433 0.00% 477,655 0.00%Insurance Tax…………………………… 219,439,488 2.41% 236,215,989 2.37% 242,652,553 2.40% 258,503,720 2.36% 283,763,234 2.42%Piped Natural Gas Tax………………… ------ ------ ------ ------ ------ ------ ------ ------ ------ ------Real Estate Conveyance Tax………….. 15,602,521 0.17% 16,390,997 0.16% 17,762,813 0.18% ------ ------ ------ ------White Goods Disposal Tax…………….. ------ ------ ------ ------ ------ ------ ------ ------ ------ ------Scrap Tire Disposal Tax………………… ------ ------ ------ ------ ------ ------ ------ ------ ------ ------Miscellaneous Tax Receipts…………… 617,181 0.01% 648,893 0.01% 566,066 0.01% 706,068 0.01% 655,945 0.01% Total Tax Revenue…………………… 8,516,756,756 93.57% 9,365,816,056 93.93% 9,458,755,229 93.74% 10,239,147,477 93.65% 11,092,446,520 94.59% Total Non-tax Revenue & Transfers. 585,578,072 6.43% 604,922,660 6.07% 631,470,156 6.26% 694,713,075 6.35% 634,682,010 5.41%Total General Fund Revenue…………. 9,102,334,828 100.00% 9,970,738,716 100.00% 10,090,225,385 100.00% 10,933,860,552 100.00% 11,727,128,530 100.00%
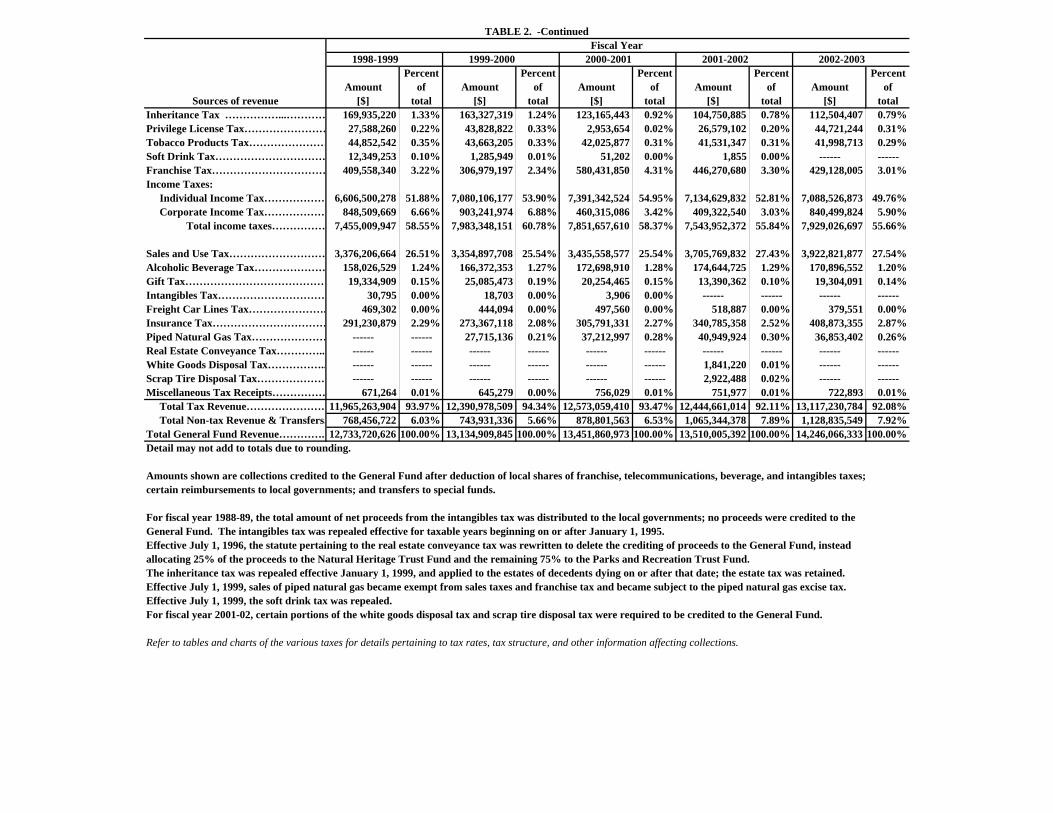
TABLE 2. -Continued Fiscal Year
1998-1999 1999-2000 2000-2001 2001-2002 2002-2003 Percent Percent Percent Percent Percent
Amount of Amount of Amount of Amount of Amount ofSources of revenue [$] total [$] total [$] total [$] total [$] total
Inheritance Tax ……………...………… 169,935,220 1.33% 163,327,319 1.24% 123,165,443 0.92% 104,750,885 0.78% 112,504,407 0.79%Privilege License Tax…………………… 27,588,260 0.22% 43,828,822 0.33% 2,953,654 0.02% 26,579,102 0.20% 44,721,244 0.31%Tobacco Products Tax…………………… 44,852,542 0.35% 43,663,205 0.33% 42,025,877 0.31% 41,531,347 0.31% 41,998,713 0.29%Soft Drink Tax…………………………… 12,349,253 0.10% 1,285,949 0.01% 51,202 0.00% 1,855 0.00% ------ ------Franchise Tax…………………………… 409,558,340 3.22% 306,979,197 2.34% 580,431,850 4.31% 446,270,680 3.30% 429,128,005 3.01%Income Taxes: Individual Income Tax……………… 6,606,500,278 51.88% 7,080,106,177 53.90% 7,391,342,524 54.95% 7,134,629,832 52.81% 7,088,526,873 49.76% Corporate Income Tax……………… 848,509,669 6.66% 903,241,974 6.88% 460,315,086 3.42% 409,322,540 3.03% 840,499,824 5.90% Total income taxes…………… 7,455,009,947 58.55% 7,983,348,151 60.78% 7,851,657,610 58.37% 7,543,952,372 55.84% 7,929,026,697 55.66%
Sales and Use Tax……………………… 3,376,206,664 26.51% 3,354,897,708 25.54% 3,435,558,577 25.54% 3,705,769,832 27.43% 3,922,821,877 27.54%Alcoholic Beverage Tax………………… 158,026,529 1.24% 166,372,353 1.27% 172,698,910 1.28% 174,644,725 1.29% 170,896,552 1.20%Gift Tax…………………………………… 19,334,909 0.15% 25,085,473 0.19% 20,254,465 0.15% 13,390,362 0.10% 19,304,091 0.14%Intangibles Tax…………………………. 30,795 0.00% 18,703 0.00% 3,906 0.00% ------ ------ ------ ------Freight Car Lines Tax…………………. 469,302 0.00% 444,094 0.00% 497,560 0.00% 518,887 0.00% 379,551 0.00%Insurance Tax…………………………… 291,230,879 2.29% 273,367,118 2.08% 305,791,331 2.27% 340,785,358 2.52% 408,873,355 2.87%Piped Natural Gas Tax………………… ------ ------ 27,715,136 0.21% 37,212,997 0.28% 40,949,924 0.30% 36,853,402 0.26%Real Estate Conveyance Tax………….. ------ ------ ------ ------ ------ ------ ------ ------ ------ ------White Goods Disposal Tax…………….. ------ ------ ------ ------ ------ ------ 1,841,220 0.01% ------ ------Scrap Tire Disposal Tax………………… ------ ------ ------ ------ ------ ------ 2,922,488 0.02% ------ ------Miscellaneous Tax Receipts…………… 671,264 0.01% 645,279 0.00% 756,029 0.01% 751,977 0.01% 722,893 0.01% Total Tax Revenue……………………11,965,263,904 93.97% 12,390,978,509 94.34% 12,573,059,410 93.47% 12,444,661,014 92.11% 13,117,230,784 92.08% Total Non-tax Revenue & Transfers. 768,456,722 6.03% 743,931,336 5.66% 878,801,563 6.53% 1,065,344,378 7.89% 1,128,835,549 7.92%Total General Fund Revenue…………. 12,733,720,626 100.00% 13,134,909,845 100.00% 13,451,860,973 100.00% 13,510,005,392 100.00% 14,246,066,333 100.00%Detail may not add to totals due to rounding.
Amounts shown are collections credited to the General Fund after deduction of local shares of franchise, telecommunications, beverage, and intangibles taxes; certain reimbursements to local governments; and transfers to special funds.
For fiscal year 1988-89, the total amount of net proceeds from the intangibles tax was distributed to the local governments; no proceeds were credited to the General Fund. The intangibles tax was repealed effective for taxable years beginning on or after January 1, 1995.Effective July 1, 1996, the statute pertaining to the real estate conveyance tax was rewritten to delete the crediting of proceeds to the General Fund, insteadallocating 25% of the proceeds to the Natural Heritage Trust Fund and the remaining 75% to the Parks and Recreation Trust Fund.The inheritance tax was repealed effective January 1, 1999, and applied to the estates of decedents dying on or after that date; the estate tax was retained. Effective July 1, 1999, sales of piped natural gas became exempt from sales taxes and franchise tax and became subject to the piped natural gas excise tax.Effective July 1, 1999, the soft drink tax was repealed.For fiscal year 2001-02, certain portions of the white goods disposal tax and scrap tire disposal tax were required to be credited to the General Fund.
Refer to tables and charts of the various taxes for details pertaining to tax rates, tax structure, and other information affecting collections.
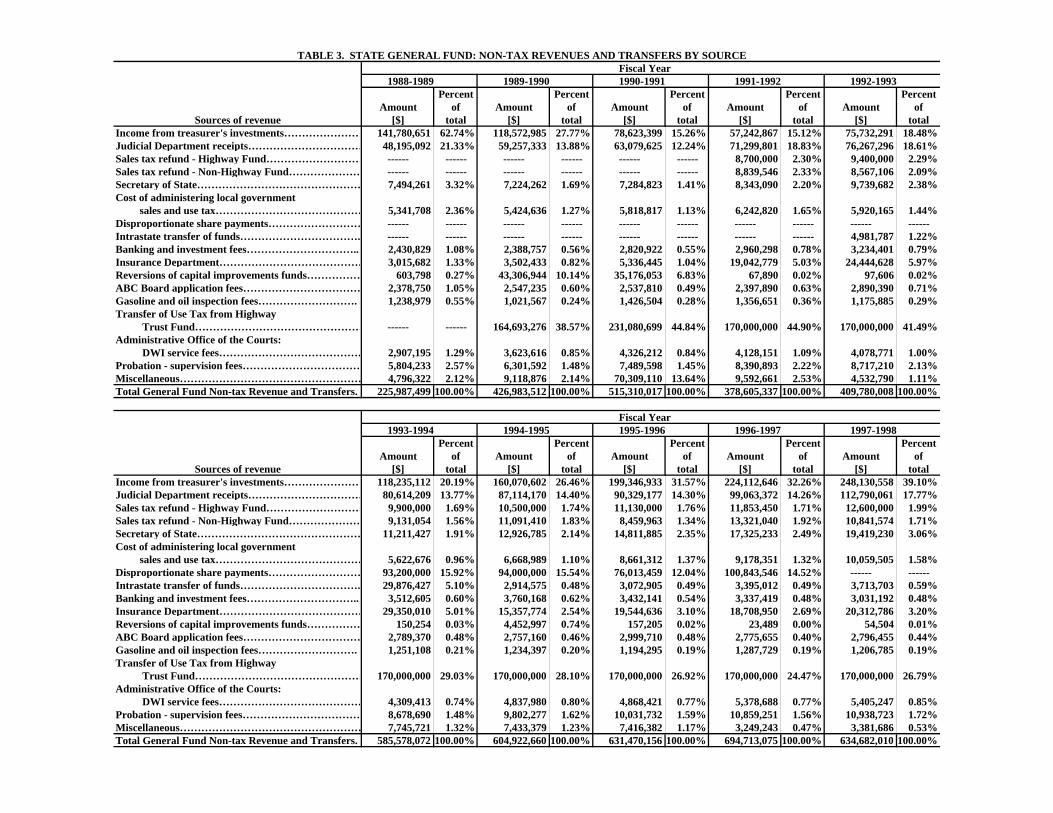
TABLE 3. STATE GENERAL FUND: NON-TAX REVENUES AND TRANSFERS BY SOURCE Fiscal Year
1988-1989 1989-1990 1990-1991 1991-1992 1992-1993Percent Percent Percent Percent Percent
Amount of Amount of Amount of Amount of Amount ofSources of revenue [$] total [$] total [$] total [$] total [$] total
Income from treasurer's investments………………… 141,780,651 62.74% 118,572,985 27.77% 78,623,399 15.26% 57,242,867 15.12% 75,732,291 18.48%Judicial Department receipts…………………………… 48,195,092 21.33% 59,257,333 13.88% 63,079,625 12.24% 71,299,801 18.83% 76,267,296 18.61%Sales tax refund - Highway Fund……………………… ------ ------ ------ ------ ------ ------ 8,700,000 2.30% 9,400,000 2.29%Sales tax refund - Non-Highway Fund………………… ------ ------ ------ ------ ------ ------ 8,839,546 2.33% 8,567,106 2.09%Secretary of State………………………………………… 7,494,261 3.32% 7,224,262 1.69% 7,284,823 1.41% 8,343,090 2.20% 9,739,682 2.38%Cost of administering local government sales and use tax…………………………………… 5,341,708 2.36% 5,424,636 1.27% 5,818,817 1.13% 6,242,820 1.65% 5,920,165 1.44%Disproportionate share payments……………………… ------ ------ ------ ------ ------ ------ ------ ------ ------ ------Intrastate transfer of funds……………………………. ------ ------ ------ ------ ------ ------ ------ ------ 4,981,787 1.22%Banking and investment fees………………………….. 2,430,829 1.08% 2,388,757 0.56% 2,820,922 0.55% 2,960,298 0.78% 3,234,401 0.79%Insurance Department…………………………………… 3,015,682 1.33% 3,502,433 0.82% 5,336,445 1.04% 19,042,779 5.03% 24,444,628 5.97%Reversions of capital improvements funds…………… 603,798 0.27% 43,306,944 10.14% 35,176,053 6.83% 67,890 0.02% 97,606 0.02%ABC Board application fees…………………………… 2,378,750 1.05% 2,547,235 0.60% 2,537,810 0.49% 2,397,890 0.63% 2,890,390 0.71%Gasoline and oil inspection fees………………………. 1,238,979 0.55% 1,021,567 0.24% 1,426,504 0.28% 1,356,651 0.36% 1,175,885 0.29%Transfer of Use Tax from Highway Trust Fund………………………………………… ------ ------ 164,693,276 38.57% 231,080,699 44.84% 170,000,000 44.90% 170,000,000 41.49%Administrative Office of the Courts: DWI service fees…………………………………… 2,907,195 1.29% 3,623,616 0.85% 4,326,212 0.84% 4,128,151 1.09% 4,078,771 1.00%Probation - supervision fees……………………………. 5,804,233 2.57% 6,301,592 1.48% 7,489,598 1.45% 8,390,893 2.22% 8,717,210 2.13%Miscellaneous…………………………………………… 4,796,322 2.12% 9,118,876 2.14% 70,309,110 13.64% 9,592,661 2.53% 4,532,790 1.11%Total General Fund Non-tax Revenue and Transfers. 225,987,499 100.00% 426,983,512 100.00% 515,310,017 100.00% 378,605,337 100.00% 409,780,008 100.00%
Fiscal Year 1993-1994 1994-1995 1995-1996 1996-1997 1997-1998
Percent Percent Percent Percent PercentAmount of Amount of Amount of Amount of Amount of
Sources of revenue [$] total [$] total [$] total [$] total [$] totalIncome from treasurer's investments………………… 118,235,112 20.19% 160,070,602 26.46% 199,346,933 31.57% 224,112,646 32.26% 248,130,558 39.10%Judicial Department receipts…………………………… 80,614,209 13.77% 87,114,170 14.40% 90,329,177 14.30% 99,063,372 14.26% 112,790,061 17.77%Sales tax refund - Highway Fund……………………… 9,900,000 1.69% 10,500,000 1.74% 11,130,000 1.76% 11,853,450 1.71% 12,600,000 1.99%Sales tax refund - Non-Highway Fund………………… 9,131,054 1.56% 11,091,410 1.83% 8,459,963 1.34% 13,321,040 1.92% 10,841,574 1.71%Secretary of State………………………………………… 11,211,427 1.91% 12,926,785 2.14% 14,811,885 2.35% 17,325,233 2.49% 19,419,230 3.06%Cost of administering local government sales and use tax…………………………………… 5,622,676 0.96% 6,668,989 1.10% 8,661,312 1.37% 9,178,351 1.32% 10,059,505 1.58%Disproportionate share payments……………………… 93,200,000 15.92% 94,000,000 15.54% 76,013,459 12.04% 100,843,546 14.52% ------ ------Intrastate transfer of funds……………………………. 29,876,427 5.10% 2,914,575 0.48% 3,072,905 0.49% 3,395,012 0.49% 3,713,703 0.59%Banking and investment fees………………………….. 3,512,605 0.60% 3,760,168 0.62% 3,432,141 0.54% 3,337,419 0.48% 3,031,192 0.48%Insurance Department…………………………………… 29,350,010 5.01% 15,357,774 2.54% 19,544,636 3.10% 18,708,950 2.69% 20,312,786 3.20%Reversions of capital improvements funds…………… 150,254 0.03% 4,452,997 0.74% 157,205 0.02% 23,489 0.00% 54,504 0.01%ABC Board application fees…………………………… 2,789,370 0.48% 2,757,160 0.46% 2,999,710 0.48% 2,775,655 0.40% 2,796,455 0.44%Gasoline and oil inspection fees………………………. 1,251,108 0.21% 1,234,397 0.20% 1,194,295 0.19% 1,287,729 0.19% 1,206,785 0.19%Transfer of Use Tax from Highway Trust Fund………………………………………… 170,000,000 29.03% 170,000,000 28.10% 170,000,000 26.92% 170,000,000 24.47% 170,000,000 26.79%Administrative Office of the Courts: DWI service fees…………………………………… 4,309,413 0.74% 4,837,980 0.80% 4,868,421 0.77% 5,378,688 0.77% 5,405,247 0.85%Probation - supervision fees……………………………. 8,678,690 1.48% 9,802,277 1.62% 10,031,732 1.59% 10,859,251 1.56% 10,938,723 1.72%Miscellaneous…………………………………………… 7,745,721 1.32% 7,433,379 1.23% 7,416,382 1.17% 3,249,243 0.47% 3,381,686 0.53%Total General Fund Non-tax Revenue and Transfers. 585,578,072 100.00% 604,922,660 100.00% 631,470,156 100.00% 694,713,075 100.00% 634,682,010 100.00%
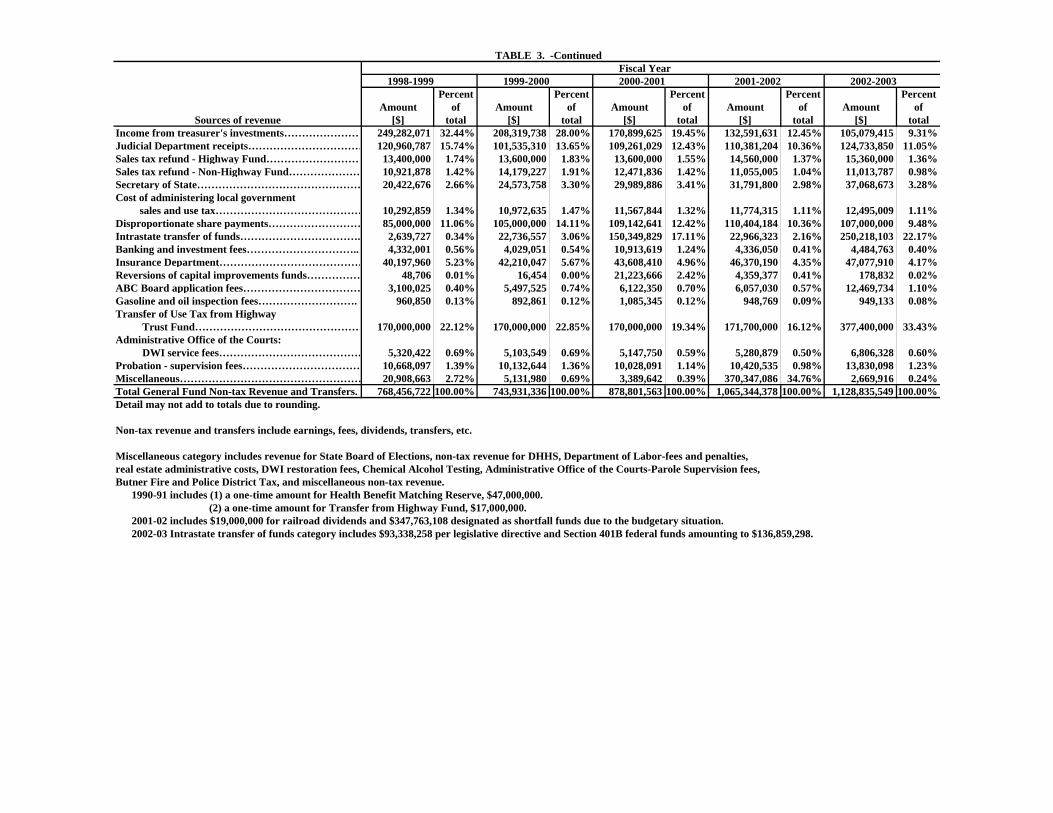
TABLE 3. -Continued Fiscal Year
1998-1999 1999-2000 2000-2001 2001-2002 2002-2003Percent Percent Percent Percent Percent
Amount of Amount of Amount of Amount of Amount ofSources of revenue [$] total [$] total [$] total [$] total [$] total
Income from treasurer's investments………………… 249,282,071 32.44% 208,319,738 28.00% 170,899,625 19.45% 132,591,631 12.45% 105,079,415 9.31%Judicial Department receipts…………………………… 120,960,787 15.74% 101,535,310 13.65% 109,261,029 12.43% 110,381,204 10.36% 124,733,850 11.05%Sales tax refund - Highway Fund……………………… 13,400,000 1.74% 13,600,000 1.83% 13,600,000 1.55% 14,560,000 1.37% 15,360,000 1.36%Sales tax refund - Non-Highway Fund………………… 10,921,878 1.42% 14,179,227 1.91% 12,471,836 1.42% 11,055,005 1.04% 11,013,787 0.98%Secretary of State………………………………………… 20,422,676 2.66% 24,573,758 3.30% 29,989,886 3.41% 31,791,800 2.98% 37,068,673 3.28%Cost of administering local government sales and use tax…………………………………… 10,292,859 1.34% 10,972,635 1.47% 11,567,844 1.32% 11,774,315 1.11% 12,495,009 1.11%Disproportionate share payments……………………… 85,000,000 11.06% 105,000,000 14.11% 109,142,641 12.42% 110,404,184 10.36% 107,000,000 9.48%Intrastate transfer of funds……………………………. 2,639,727 0.34% 22,736,557 3.06% 150,349,829 17.11% 22,966,323 2.16% 250,218,103 22.17%Banking and investment fees………………………….. 4,332,001 0.56% 4,029,051 0.54% 10,913,619 1.24% 4,336,050 0.41% 4,484,763 0.40%Insurance Department…………………………………… 40,197,960 5.23% 42,210,047 5.67% 43,608,410 4.96% 46,370,190 4.35% 47,077,910 4.17%Reversions of capital improvements funds…………… 48,706 0.01% 16,454 0.00% 21,223,666 2.42% 4,359,377 0.41% 178,832 0.02%ABC Board application fees…………………………… 3,100,025 0.40% 5,497,525 0.74% 6,122,350 0.70% 6,057,030 0.57% 12,469,734 1.10%Gasoline and oil inspection fees………………………. 960,850 0.13% 892,861 0.12% 1,085,345 0.12% 948,769 0.09% 949,133 0.08%Transfer of Use Tax from Highway Trust Fund………………………………………… 170,000,000 22.12% 170,000,000 22.85% 170,000,000 19.34% 171,700,000 16.12% 377,400,000 33.43%Administrative Office of the Courts: DWI service fees…………………………………… 5,320,422 0.69% 5,103,549 0.69% 5,147,750 0.59% 5,280,879 0.50% 6,806,328 0.60%Probation - supervision fees……………………………. 10,668,097 1.39% 10,132,644 1.36% 10,028,091 1.14% 10,420,535 0.98% 13,830,098 1.23%Miscellaneous…………………………………………… 20,908,663 2.72% 5,131,980 0.69% 3,389,642 0.39% 370,347,086 34.76% 2,669,916 0.24%Total General Fund Non-tax Revenue and Transfers. 768,456,722 100.00% 743,931,336 100.00% 878,801,563 100.00% 1,065,344,378 100.00% 1,128,835,549 100.00%Detail may not add to totals due to rounding.
Non-tax revenue and transfers include earnings, fees, dividends, transfers, etc.
Miscellaneous category includes revenue for State Board of Elections, non-tax revenue for DHHS, Department of Labor-fees and penalties, real estate administrative costs, DWI restoration fees, Chemical Alcohol Testing, Administrative Office of the Courts-Parole Supervision fees,Butner Fire and Police District Tax, and miscellaneous non-tax revenue. 1990-91 includes (1) a one-time amount for Health Benefit Matching Reserve, $47,000,000. (2) a one-time amount for Transfer from Highway Fund, $17,000,000. 2001-02 includes $19,000,000 for railroad dividends and $347,763,108 designated as shortfall funds due to the budgetary situation. 2002-03 Intrastate transfer of funds category includes $93,338,258 per legislative directive and Section 401B federal funds amounting to $136,859,298.
PART III. NORTH CAROLINA: STATE TAX COLLECTIONS BY STATUTORY ARTICLE OF TAX
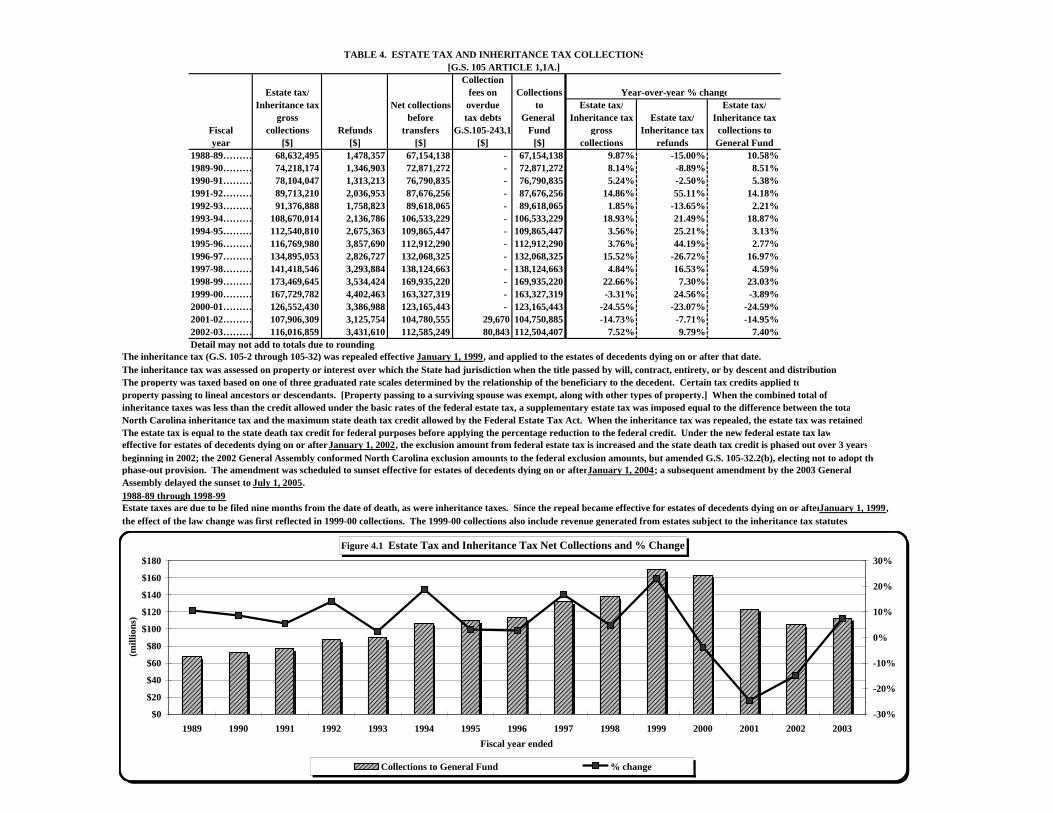
TABLE 4. ESTATE TAX AND INHERITANCE TAX COLLECTIONS [G.S. 105 ARTICLE 1,1A.]
CollectionEstate tax/ fees on Collections Year-over-year % change
Inheritance tax Net collections overdue to Estate tax/ Estate tax/gross before tax debts General Inheritance tax Estate tax/ Inheritance tax
Fiscal collections Refunds transfers [G.S.105-243.1 Fund gross Inheritance tax collections toyear [$] [$] [$] [$] [$] collections refunds General Fund
1988-89……… 68,632,495 1,478,357 67,154,138 - 67,154,138 9.87% -15.00% 10.58%1989-90……… 74,218,174 1,346,903 72,871,272 - 72,871,272 8.14% -8.89% 8.51%1990-91……… 78,104,047 1,313,213 76,790,835 - 76,790,835 5.24% -2.50% 5.38%1991-92……… 89,713,210 2,036,953 87,676,256 - 87,676,256 14.86% 55.11% 14.18%1992-93……… 91,376,888 1,758,823 89,618,065 - 89,618,065 1.85% -13.65% 2.21%1993-94……… 108,670,014 2,136,786 106,533,229 - 106,533,229 18.93% 21.49% 18.87%1994-95……… 112,540,810 2,675,363 109,865,447 - 109,865,447 3.56% 25.21% 3.13%1995-96……… 116,769,980 3,857,690 112,912,290 - 112,912,290 3.76% 44.19% 2.77%1996-97……… 134,895,053 2,826,727 132,068,325 - 132,068,325 15.52% -26.72% 16.97%1997-98……… 141,418,546 3,293,884 138,124,663 - 138,124,663 4.84% 16.53% 4.59%1998-99……… 173,469,645 3,534,424 169,935,220 - 169,935,220 22.66% 7.30% 23.03%1999-00……… 167,729,782 4,402,463 163,327,319 - 163,327,319 -3.31% 24.56% -3.89%2000-01……… 126,552,430 3,386,988 123,165,443 - 123,165,443 -24.55% -23.07% -24.59%2001-02……… 107,906,309 3,125,754 104,780,555 29,670 104,750,885 -14.73% -7.71% -14.95%2002-03……… 116,016,859 3,431,610 112,585,249 80,843 112,504,407 7.52% 9.79% 7.40%Detail may not add to totals due to rounding.
The inheritance tax (G.S. 105-2 through 105-32) was repealed effective January 1, 1999, and applied to the estates of decedents dying on or after that date. The inheritance tax was assessed on property or interest over which the State had jurisdiction when the title passed by will, contract, entirety, or by descent and distributionThe property was taxed based on one of three graduated rate scales determined by the relationship of the beneficiary to the decedent. Certain tax credits applied toproperty passing to lineal ancestors or descendants. [Property passing to a surviving spouse was exempt, along with other types of property.] When the combined total of inheritance taxes was less than the credit allowed under the basic rates of the federal estate tax, a supplementary estate tax was imposed equal to the difference between the totaNorth Carolina inheritance tax and the maximum state death tax credit allowed by the Federal Estate Tax Act. When the inheritance tax was repealed, the estate tax was retainedThe estate tax is equal to the state death tax credit for federal purposes before applying the percentage reduction to the federal credit. Under the new federal estate tax laweffective for estates of decedents dying on or after January 1, 2002, the exclusion amount from federal estate tax is increased and the state death tax credit is phased out over 3 yearsbeginning in 2002; the 2002 General Assembly conformed North Carolina exclusion amounts to the federal exclusion amounts, but amended G.S. 105-32.2(b), electing not to adopt thephase-out provision. The amendment was scheduled to sunset effective for estates of decedents dying on or afterJanuary 1, 2004; a subsequent amendment by the 2003 GeneralAssembly delayed the sunset to July 1, 2005.1988-89 through 1998-99Estate taxes are due to be filed nine months from the date of death, as were inheritance taxes. Since the repeal became effective for estates of decedents dying on or afterJanuary 1, 1999,the effect of the law change was first reflected in 1999-00 collections. The 1999-00 collections also include revenue generated from estates subject to the inheritance tax statutes.
Collections to G% change1989 67,154,138 10.58%1990 72,871,272 8.51%1991 76,790,835 5.38%1992 87,676,256 14.18%1993 89,618,065 2.21%1994 106,533,229 18.87%1995 109,865,447 3.13%1996 112,912,290 2.77%1997 132,068,325 16.97%1998 138,124,663 4.59%1999 169,935,220 23.03%2000 163,327,319 -3.89%2001 123,165,443 -24.59%2002 104,750,885 -14.95%2003 112,504,407 7.40%
Figure 4.1 Estate Tax and Inheritance Tax Net Collections and % Change
$0
$20
$40
$60
$80
$100
$120
$140
$160
$180
1989 1990 1991 1992 1993 1994 1995 1996 1997 1998 1999 2000 2001 2002 2003
(mill
ions
)
Fiscal year ended
-30%
-20%
-10%
0%
10%
20%
30%
Collections to General Fund % change
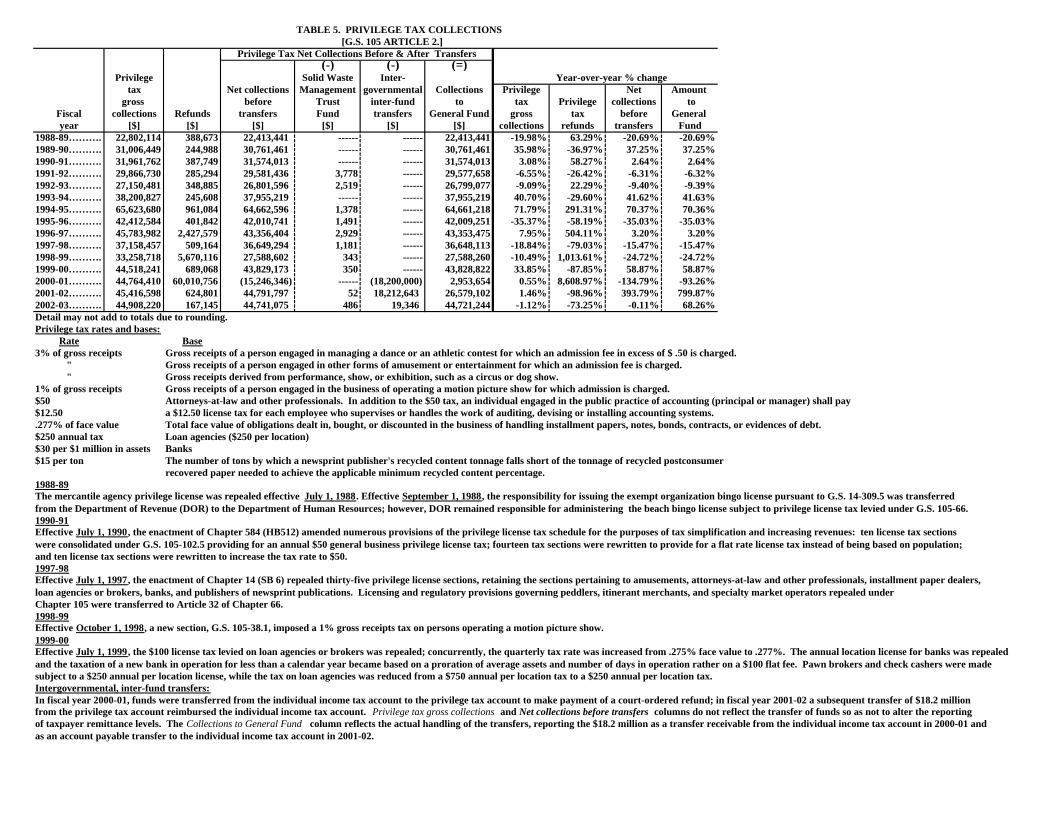
TABLE 5. PRIVILEGE TAX COLLECTIONS [G.S. 105 ARTICLE 2.]
Privilege Tax Net Collections Before & After Transfers (-) (-) (=)
Privilege Solid Waste Inter- Year-over-year % changetax Net collections Management governmental Collections Privilege Net Amount
gross before Trust inter-fund to tax Privilege collections toFiscal collections Refunds transfers Fund transfers General Fund gross tax before General year [$] [$] [$] [$] [$] [$] collections refunds transfers Fund
1988-89………. 22,802,114 388,673 22,413,441 ------ ------ 22,413,441 -19.98% 63.29% -20.69% -20.69%1989-90………. 31,006,449 244,988 30,761,461 ------ ------ 30,761,461 35.98% -36.97% 37.25% 37.25%1990-91………. 31,961,762 387,749 31,574,013 ------ ------ 31,574,013 3.08% 58.27% 2.64% 2.64%1991-92………. 29,866,730 285,294 29,581,436 3,778 ------ 29,577,658 -6.55% -26.42% -6.31% -6.32%1992-93………. 27,150,481 348,885 26,801,596 2,519 ------ 26,799,077 -9.09% 22.29% -9.40% -9.39%1993-94………. 38,200,827 245,608 37,955,219 ------ ------ 37,955,219 40.70% -29.60% 41.62% 41.63%1994-95………. 65,623,680 961,084 64,662,596 1,378 ------ 64,661,218 71.79% 291.31% 70.37% 70.36%1995-96………. 42,412,584 401,842 42,010,741 1,491 ------ 42,009,251 -35.37% -58.19% -35.03% -35.03%1996-97………. 45,783,982 2,427,579 43,356,404 2,929 ------ 43,353,475 7.95% 504.11% 3.20% 3.20%1997-98………. 37,158,457 509,164 36,649,294 1,181 ------ 36,648,113 -18.84% -79.03% -15.47% -15.47%1998-99………. 33,258,718 5,670,116 27,588,602 343 ------ 27,588,260 -10.49% 1,013.61% -24.72% -24.72%1999-00………. 44,518,241 689,068 43,829,173 350 ------ 43,828,822 33.85% -87.85% 58.87% 58.87%2000-01………. 44,764,410 60,010,756 (15,246,346) ------ (18,200,000) 2,953,654 0.55% 8,608.97% -134.79% -93.26%2001-02………. 45,416,598 624,801 44,791,797 52 18,212,643 26,579,102 1.46% -98.96% 393.79% 799.87%2002-03………. 44,908,220 167,145 44,741,075 486 19,346 44,721,244 -1.12% -73.25% -0.11% 68.26%Detail may not add to totals due to rounding.Privilege tax rates and bases:
Rate Base3% of gross receipts Gross receipts of a person engaged in managing a dance or an athletic contest for which an admission fee in excess of $ .50 is charged.
" Gross receipts of a person engaged in other forms of amusement or entertainment for which an admission fee is charged." Gross receipts derived from performance, show, or exhibition, such as a circus or dog show.
1% of gross receipts Gross receipts of a person engaged in the business of operating a motion picture show for which admission is charged.$50 Attorneys-at-law and other professionals. In addition to the $50 tax, an individual engaged in the public practice of accounting (principal or manager) shall pay $12.50 a $12.50 license tax for each employee who supervises or handles the work of auditing, devising or installing accounting systems..277% of face value Total face value of obligations dealt in, bought, or discounted in the business of handling installment papers, notes, bonds, contracts, or evidences of debt. $250 annual tax Loan agencies ($250 per location)$30 per $1 million in assets Banks$15 per ton The number of tons by which a newsprint publisher's recycled content tonnage falls short of the tonnage of recycled postconsumer
recovered paper needed to achieve the applicable minimum recycled content percentage. 1988-89The mercantile agency privilege license was repealed effective July 1, 1988. Effective September 1, 1988, the responsibility for issuing the exempt organization bingo license pursuant to G.S. 14-309.5 was transferredfrom the Department of Revenue (DOR) to the Department of Human Resources; however, DOR remained responsible for administering the beach bingo license subject to privilege license tax levied under G.S. 105-66. 1990-91Effective July 1, 1990, the enactment of Chapter 584 (HB512) amended numerous provisions of the privilege license tax schedule for the purposes of tax simplification and increasing revenues: ten license tax sectionswere consolidated under G.S. 105-102.5 providing for an annual $50 general business privilege license tax; fourteen tax sections were rewritten to provide for a flat rate license tax instead of being based on population;and ten license tax sections were rewritten to increase the tax rate to $50.1997-98Effective July 1, 1997, the enactment of Chapter 14 (SB 6) repealed thirty-five privilege license sections, retaining the sections pertaining to amusements, attorneys-at-law and other professionals, installment paper dealers,loan agencies or brokers, banks, and publishers of newsprint publications. Licensing and regulatory provisions governing peddlers, itinerant merchants, and specialty market operators repealed underChapter 105 were transferred to Article 32 of Chapter 66.1998-99Effective October 1, 1998, a new section, G.S. 105-38.1, imposed a 1% gross receipts tax on persons operating a motion picture show.1999-00Effective July 1, 1999, the $100 license tax levied on loan agencies or brokers was repealed; concurrently, the quarterly tax rate was increased from .275% face value to .277%. The annual location license for banks was repealedand the taxation of a new bank in operation for less than a calendar year became based on a proration of average assets and number of days in operation rather on a $100 flat fee. Pawn brokers and check cashers were made subject to a $250 annual per location license, while the tax on loan agencies was reduced from a $750 annual per location tax to a $250 annual per location tax.Intergovernmental, inter-fund transfers:In fiscal year 2000-01, funds were transferred from the individual income tax account to the privilege tax account to make payment of a court-ordered refund; in fiscal year 2001-02 a subsequent transfer of $18.2 million from the privilege tax account reimbursed the individual income tax account. Privilege tax gross collections and Net collections before transfers columns do not reflect the transfer of funds so as not to alter the reporting of taxpayer remittance levels. The Collections to General Fund column reflects the actual handling of the transfers, reporting the $18.2 million as a transfer receivable from the individual income tax account in 2000-01 and as an account payable transfer to the individual income tax account in 2001-02.
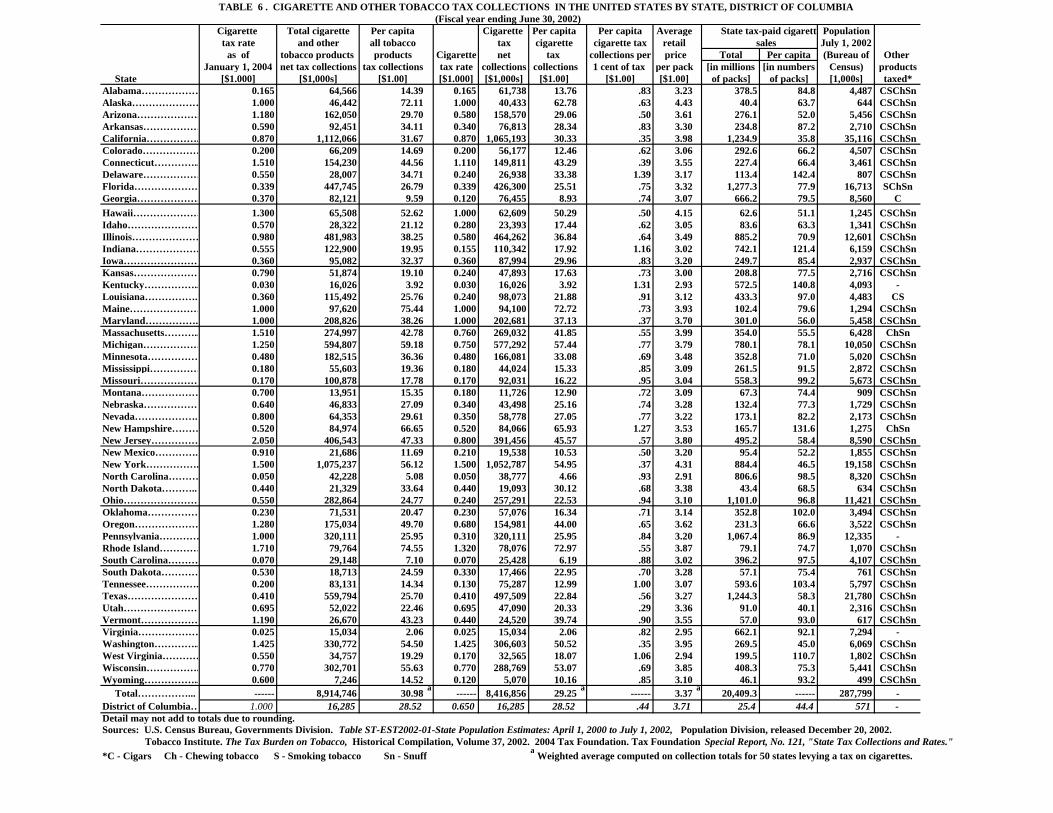
TABLE 6 . CIGARETTE AND OTHER TOBACCO TAX COLLECTIONS IN THE UNITED STATES BY STATE, DISTRICT OF COLUMBIA (Fiscal year ending June 30, 2002)
Cigarette Total cigarette Per capita Cigarette Per capita Per capita Average State tax-paid cigarett Populationtax rate and other all tobacco tax cigarette cigarette tax retail sales July 1, 2002
as of tobacco products products Cigarette net tax collections per price Total Per capita (Bureau of Other January 1, 2004 net tax collections tax collections tax rate collections collections 1 cent of tax per pack [in millions [in numbers Census) products
State [$1.000] [$1,000s] [$1.00] [$1.000] [$1,000s] [$1.00] [$1.00] [$1.00] of packs] of packs] [1,000s] taxed*Alabama……………… 0.165 64,566 14.39 0.165 61,738 13.76 .83 3.23 378.5 84.8 4,487 CSChSnAlaska………………… 1.000 46,442 72.11 1.000 40,433 62.78 .63 4.43 40.4 63.7 644 CSChSnArizona………………. 1.180 162,050 29.70 0.580 158,570 29.06 .50 3.61 276.1 52.0 5,456 CSChSnArkansas……………… 0.590 92,451 34.11 0.340 76,813 28.34 .83 3.30 234.8 87.2 2,710 CSChSnCalifornia……………. 0.870 1,112,066 31.67 0.870 1,065,193 30.33 .35 3.98 1,234.9 35.8 35,116 CSChSnColorado……………… 0.200 66,209 14.69 0.200 56,177 12.46 .62 3.06 292.6 66.2 4,507 CSChSnConnecticut………….. 1.510 154,230 44.56 1.110 149,811 43.29 .39 3.55 227.4 66.4 3,461 CSChSnDelaware……………… 0.550 28,007 34.71 0.240 26,938 33.38 1.39 3.17 113.4 142.4 807 CSChSnFlorida………………… 0.339 447,745 26.79 0.339 426,300 25.51 .75 3.32 1,277.3 77.9 16,713 SChSnGeorgia………………. 0.370 82,121 9.59 0.120 76,455 8.93 .74 3.07 666.2 79.5 8,560 CHawaii………………… 1.300 65,508 52.62 1.000 62,609 50.29 .50 4.15 62.6 51.1 1,245 CSChSnIdaho…………………. 0.570 28,322 21.12 0.280 23,393 17.44 .62 3.05 83.6 63.3 1,341 CSChSnIllinois………………… 0.980 481,983 38.25 0.580 464,262 36.84 .64 3.49 885.2 70.9 12,601 CSChSnIndiana………………… 0.555 122,900 19.95 0.155 110,342 17.92 1.16 3.02 742.1 121.4 6,159 CSChSnIowa…………………… 0.360 95,082 32.37 0.360 87,994 29.96 .83 3.20 249.7 85.4 2,937 CSChSnKansas………………… 0.790 51,874 19.10 0.240 47,893 17.63 .73 3.00 208.8 77.5 2,716 CSChSnKentucky…………….. 0.030 16,026 3.92 0.030 16,026 3.92 1.31 2.93 572.5 140.8 4,093 -Louisiana…………….. 0.360 115,492 25.76 0.240 98,073 21.88 .91 3.12 433.3 97.0 4,483 CSMaine………………… 1.000 97,620 75.44 1.000 94,100 72.72 .73 3.93 102.4 79.6 1,294 CSChSnMaryland…………….. 1.000 208,826 38.26 1.000 202,681 37.13 .37 3.70 301.0 56.0 5,458 CSChSnMassachusetts……….. 1.510 274,997 42.78 0.760 269,032 41.85 .55 3.99 354.0 55.5 6,428 ChSnMichigan……………… 1.250 594,807 59.18 0.750 577,292 57.44 .77 3.79 780.1 78.1 10,050 CSChSnMinnesota……………. 0.480 182,515 36.36 0.480 166,081 33.08 .69 3.48 352.8 71.0 5,020 CSChSnMississippi…………… 0.180 55,603 19.36 0.180 44,024 15.33 .85 3.09 261.5 91.5 2,872 CSChSnMissouri……………… 0.170 100,878 17.78 0.170 92,031 16.22 .95 3.04 558.3 99.2 5,673 CSChSnMontana……………… 0.700 13,951 15.35 0.180 11,726 12.90 .72 3.09 67.3 74.4 909 CSChSnNebraska……………… 0.640 46,833 27.09 0.340 43,498 25.16 .74 3.28 132.4 77.3 1,729 CSChSnNevada……………….. 0.800 64,353 29.61 0.350 58,778 27.05 .77 3.22 173.1 82.2 2,173 CSChSnNew Hampshire……… 0.520 84,974 66.65 0.520 84,066 65.93 1.27 3.53 165.7 131.6 1,275 ChSnNew Jersey…………… 2.050 406,543 47.33 0.800 391,456 45.57 .57 3.80 495.2 58.4 8,590 CSChSnNew Mexico…………. 0.910 21,686 11.69 0.210 19,538 10.53 .50 3.20 95.4 52.2 1,855 CSChSnNew York……………. 1.500 1,075,237 56.12 1.500 1,052,787 54.95 .37 4.31 884.4 46.5 19,158 CSChSnNorth Carolina……… 0.050 42,228 5.08 0.050 38,777 4.66 .93 2.91 806.6 98.5 8,320 CSChSnNorth Dakota……….. 0.440 21,329 33.64 0.440 19,093 30.12 .68 3.38 43.4 68.5 634 CSChSnOhio…………………… 0.550 282,864 24.77 0.240 257,291 22.53 .94 3.10 1,101.0 96.8 11,421 CSChSnOklahoma……………. 0.230 71,531 20.47 0.230 57,076 16.34 .71 3.14 352.8 102.0 3,494 CSChSnOregon………………… 1.280 175,034 49.70 0.680 154,981 44.00 .65 3.62 231.3 66.6 3,522 CSChSnPennsylvania………… 1.000 320,111 25.95 0.310 320,111 25.95 .84 3.20 1,067.4 86.9 12,335 -Rhode Island………… 1.710 79,764 74.55 1.320 78,076 72.97 .55 3.87 79.1 74.7 1,070 CSChSnSouth Carolina………. 0.070 29,148 7.10 0.070 25,428 6.19 .88 3.02 396.2 97.5 4,107 CSChSnSouth Dakota………… 0.530 18,713 24.59 0.330 17,466 22.95 .70 3.28 57.1 75.4 761 CSChSnTennessee……………. 0.200 83,131 14.34 0.130 75,287 12.99 1.00 3.07 593.6 103.4 5,797 CSChSnTexas…………………. 0.410 559,794 25.70 0.410 497,509 22.84 .56 3.27 1,244.3 58.3 21,780 CSChSnUtah…………………… 0.695 52,022 22.46 0.695 47,090 20.33 .29 3.36 91.0 40.1 2,316 CSChSnVermont……………… 1.190 26,670 43.23 0.440 24,520 39.74 .90 3.55 57.0 93.0 617 CSChSnVirginia……………… 0.025 15,034 2.06 0.025 15,034 2.06 .82 2.95 662.1 92.1 7,294 -Washington………….. 1.425 330,772 54.50 1.425 306,603 50.52 .35 3.95 269.5 45.0 6,069 CSChSnWest Virginia………… 0.550 34,757 19.29 0.170 32,565 18.07 1.06 2.94 199.5 110.7 1,802 CSChSnWisconsin……………. 0.770 302,701 55.63 0.770 288,769 53.07 .69 3.85 408.3 75.3 5,441 CSChSnWyoming…………….. 0.600 7,246 14.52 0.120 5,070 10.16 .85 3.10 46.1 93.2 499 CSChSn Total……………... ------ 8,914,746 30.98 a ------ 8,416,856 29.25 a ------ 3.37 a 20,409.3 ------ 287,799 -District of Columbia… 1.000 16,285 28.52 0.650 16,285 28.52 .44 3.71 25.4 44.4 571 -Detail may not add to totals due to rounding.Sources: U.S. Census Bureau, Governments Division. Table ST-EST2002-01-State Population Estimates: April 1, 2000 to July 1, 2002, Population Division, released December 20, 2002. Tobacco Institute. The Tax Burden on Tobacco, Historical Compilation, Volume 37, 2002. 2004 Tax Foundation. Tax Foundation Special Report, No. 121, "State Tax Collections and Rates." *C - Cigars Ch - Chewing tobacco S - Smoking tobacco Sn - Snuff a Weighted average computed on collection totals for 50 states levying a tax on cigarettes.
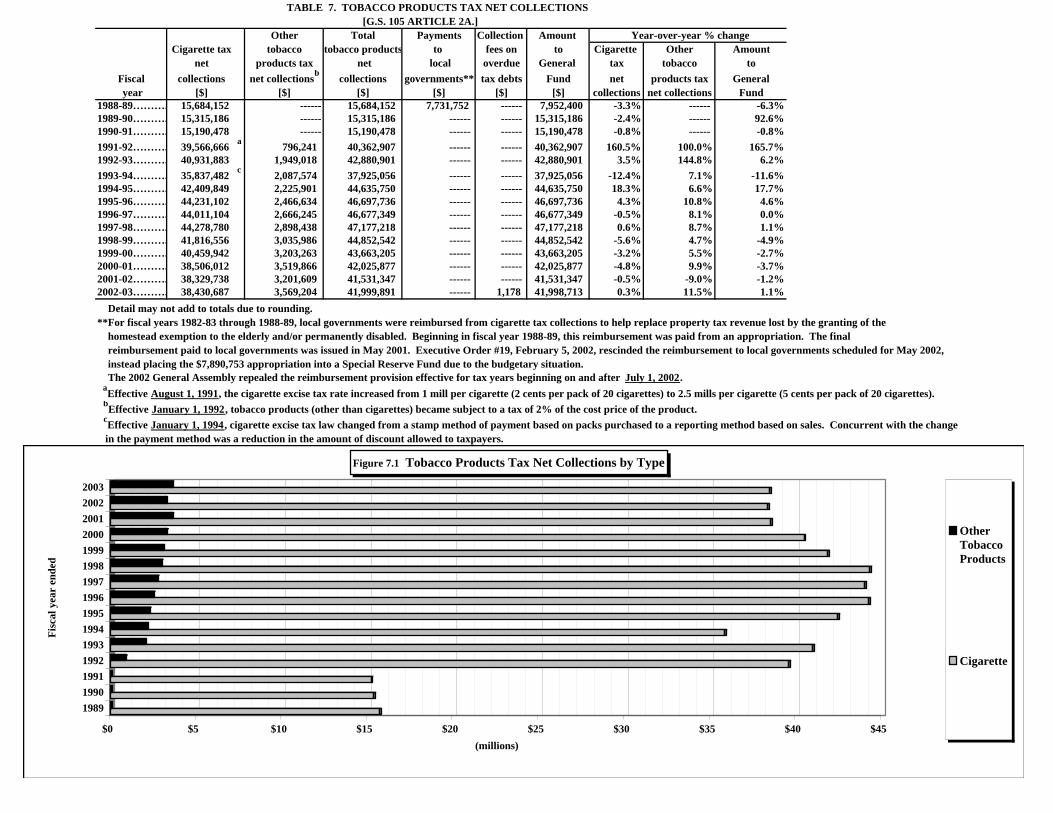
TABLE 7. TOBACCO PRODUCTS TAX NET COLLECTIONS [G.S. 105 ARTICLE 2A.]
Other Total Payments Collection Amount Year-over-year % changeCigarette tax tobacco tobacco products to fees on to Cigarette Other Amount
net products tax net local overdue General tax tobacco toFiscal collections net collectionsb collections governments** tax debts Fund net products tax General year [$] [$] [$] [$] [$] [$] collections net collections Fund
1988-89………. 15,684,152 ------ 15,684,152 7,731,752 ------ 7,952,400 -3.3% ------ -6.3%1989-90………. 15,315,186 ------ 15,315,186 ------ ------ 15,315,186 -2.4% ------ 92.6%1990-91………. 15,190,478 ------ 15,190,478 ------ ------ 15,190,478 -0.8% ------ -0.8%1991-92………. 39,566,666 a 796,241 40,362,907 ------ ------ 40,362,907 160.5% 100.0% 165.7%1992-93………. 40,931,883 1,949,018 42,880,901 ------ ------ 42,880,901 3.5% 144.8% 6.2%1993-94………. 35,837,482 c 2,087,574 37,925,056 ------ ------ 37,925,056 -12.4% 7.1% -11.6%1994-95………. 42,409,849 2,225,901 44,635,750 ------ ------ 44,635,750 18.3% 6.6% 17.7%1995-96………. 44,231,102 2,466,634 46,697,736 ------ ------ 46,697,736 4.3% 10.8% 4.6%1996-97………. 44,011,104 2,666,245 46,677,349 ------ ------ 46,677,349 -0.5% 8.1% 0.0%1997-98………. 44,278,780 2,898,438 47,177,218 ------ ------ 47,177,218 0.6% 8.7% 1.1%1998-99………. 41,816,556 3,035,986 44,852,542 ------ ------ 44,852,542 -5.6% 4.7% -4.9%1999-00………. 40,459,942 3,203,263 43,663,205 ------ ------ 43,663,205 -3.2% 5.5% -2.7%2000-01………. 38,506,012 3,519,866 42,025,877 ------ ------ 42,025,877 -4.8% 9.9% -3.7%2001-02………. 38,329,738 3,201,609 41,531,347 ------ ------ 41,531,347 -0.5% -9.0% -1.2%2002-03………. 38,430,687 3,569,204 41,999,891 ------ 1,178 41,998,713 0.3% 11.5% 1.1% Detail may not add to totals due to rounding.**For fiscal years 1982-83 through 1988-89, local governments were reimbursed from cigarette tax collections to help replace property tax revenue lost by the granting of the homestead exemption to the elderly and/or permanently disabled. Beginning in fiscal year 1988-89, this reimbursement was paid from an appropriation. The final reimbursement paid to local governments was issued in May 2001. Executive Order #19, February 5, 2002, rescinded the reimbursement to local governments scheduled for May 2002, instead placing the $7,890,753 appropriation into a Special Reserve Fund due to the budgetary situation. The 2002 General Assembly repealed the reimbursement provision effective for tax years beginning on and after July 1, 2002. aEffective August 1, 1991, the cigarette excise tax rate increased from 1 mill per cigarette (2 cents per pack of 20 cigarettes) to 2.5 mills per cigarette (5 cents per pack of 20 cigarettes). bEffective January 1, 1992, tobacco products (other than cigarettes) became subject to a tax of 2% of the cost price of the product. cEffective January 1, 1994, cigarette excise tax law changed from a stamp method of payment based on packs purchased to a reporting method based on sales. Concurrent with the change in the payment method was a reduction in the amount of discount allowed to taxpayers.
Cigarette er Tobacco Products1989 15,684,152 01990 15,315,186 01991 15,190,478 01992 39,566,666 796,2411993 40,931,883 1,949,0181994 35,837,482 2,087,5741995 42,409,849 2,225,9011996 44,231,102 2,466,6341997 44,011,104 2,666,2451998 44,278,780 2,898,4381999 41,816,556 3,035,9862000 40,459,942 3,203,2632001 38,506,012 3,519,8662002 38,329,738 3,201,6092003 38,429,509 3,569,204$0 $5 $10 $15 $20 $25 $30 $35 $40 $45
(millions)
198919901991199219931994199519961997199819992000200120022003
Fisc
al y
ear
ende
d
Figure 7.1 Tobacco Products Tax Net Collections by Type
OtherTobaccoProducts
Cigarette
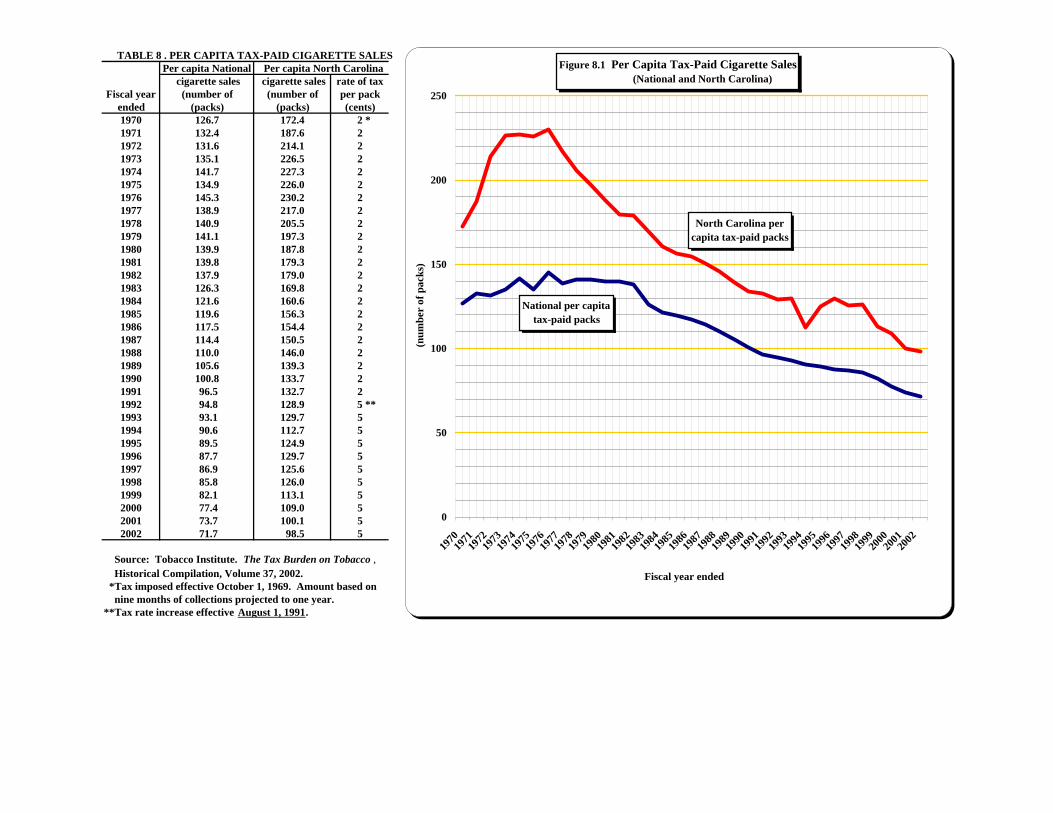
TABLE 8 . PER CAPITA TAX-PAID CIGARETTE SALESPer capita National Per capita North Carolina
cigarette sales cigarette sales rate of taxFiscal year (number of (number of per pack
ended (packs) (packs) (cents) National perNorth Carolina per capita tax-paid sales1970 126.7 172.4 2 * 1970 126.7 172.41971 132.4 187.6 2 1971 132.4 187.61972 131.6 214.1 2 1972 131.6 214.11973 135.1 226.5 2 1973 135.1 226.51974 141.7 227.3 2 1974 141.7 227.31975 134.9 226.0 2 1975 134.9 226.01976 145.3 230.2 2 1976 145.3 230.21977 138.9 217.0 2 1977 138.9 217.01978 140.9 205.5 2 1978 140.9 205.51979 141.1 197.3 2 1979 141.1 197.31980 139.9 187.8 2 1980 139.9 187.81981 139.8 179.3 2 1981 139.8 179.31982 137.9 179.0 2 1982 137.9 179.01983 126.3 169.8 2 1983 126.3 169.81984 121.6 160.6 2 1984 121.6 160.61985 119.6 156.3 2 1985 119.6 156.31986 117.5 154.4 2 1986 117.5 154.41987 114.4 150.5 2 1987 114.4 150.51988 110.0 146.0 2 1988 110.0 146.01989 105.6 139.3 2 1989 105.6 139.31990 100.8 133.7 2 1990 100.8 133.71991 96.5 132.7 2 1991 96.5 132.71992 94.8 128.9 5 ** 1992 94.8 128.91993 93.1 129.7 5 1993 93.1 129.71994 90.6 112.7 5 1994 90.6 112.71995 89.5 124.9 5 1995 89.5 124.91996 87.7 129.7 5 1996 87.7 129.71997 86.9 125.6 5 1997 86.9 125.61998 85.8 126.0 5 1998 85.8 126.01999 82.1 113.1 5 1999 82.1 113.12000 77.4 109.0 5 2000 77.4 109.02001 73.7 100.1 5 2001 73.7 100.12002 71.7 98.5 5 2002 71.7 98.5
Source: Tobacco Institute. The Tax Burden on Tobacco , Historical Compilation, Volume 37, 2002. *Tax imposed effective October 1, 1969. Amount based on nine months of collections projected to one year.**Tax rate increase effective August 1, 1991.
Figure 8.1 Per Capita Tax-Paid Cigarette Sales (National and North Carolina)
National per capita tax-paid packs
North Carolina per capita tax-paid packs
0
50
100
150
200
250
1970
1971
1972
1973
1974
1975
1976
1977
1978
1979
1980
1981
1982
1983
1984
1985
1986
1987
1988
1989
1990
1991
1992
1993
1994
1995
1996
1997
1998
1999
2000
2001
2002
Fiscal year ended
(num
ber
of p
acks
)
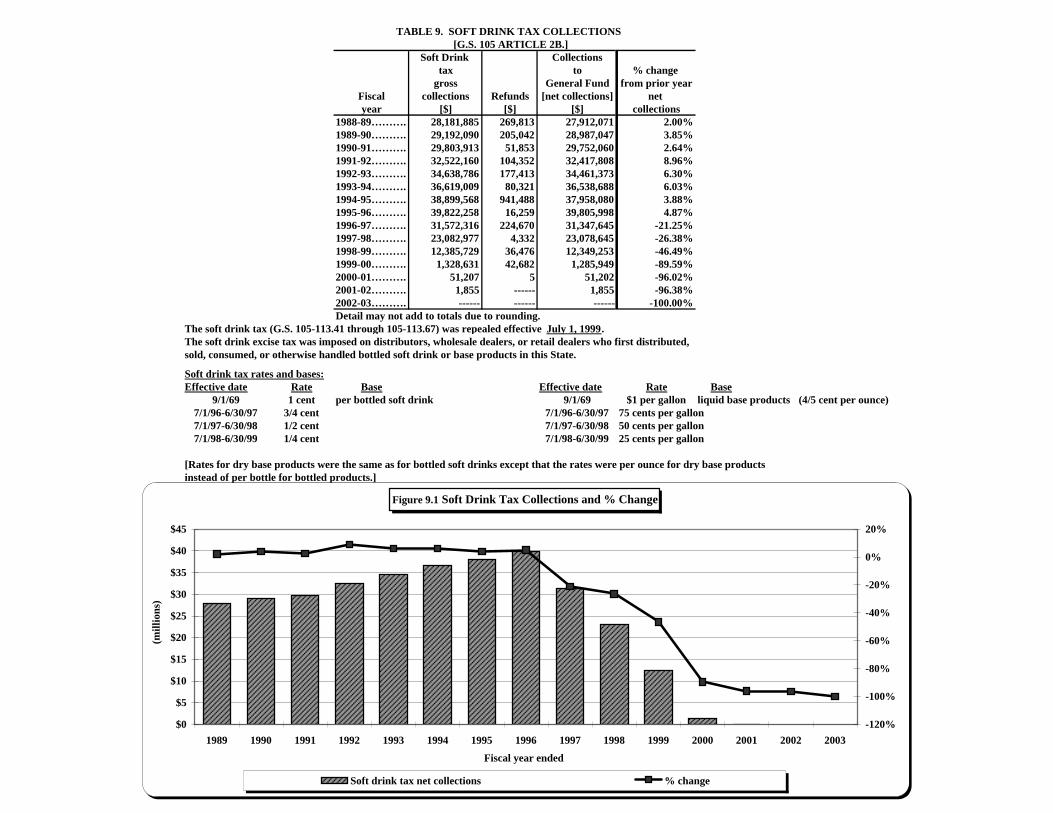
TABLE 9. SOFT DRINK TAX COLLECTIONS [G.S. 105 ARTICLE 2B.]
Soft Drink Collectionstax to % change
gross General Fund from prior yearFiscal collections Refunds [net collections] net year [$] [$] [$] collections
1988-89………. 28,181,885 269,813 27,912,071 2.00%1989-90………. 29,192,090 205,042 28,987,047 3.85%1990-91………. 29,803,913 51,853 29,752,060 2.64%1991-92………. 32,522,160 104,352 32,417,808 8.96%1992-93………. 34,638,786 177,413 34,461,373 6.30%1993-94………. 36,619,009 80,321 36,538,688 6.03%1994-95………. 38,899,568 941,488 37,958,080 3.88%1995-96………. 39,822,258 16,259 39,805,998 4.87%1996-97………. 31,572,316 224,670 31,347,645 -21.25%1997-98………. 23,082,977 4,332 23,078,645 -26.38%1998-99………. 12,385,729 36,476 12,349,253 -46.49%1999-00………. 1,328,631 42,682 1,285,949 -89.59%2000-01………. 51,207 5 51,202 -96.02%2001-02………. 1,855 ------ 1,855 -96.38%2002-03………. ------ ------ ------ -100.00%Detail may not add to totals due to rounding.
The soft drink tax (G.S. 105-113.41 through 105-113.67) was repealed effective July 1, 1999.The soft drink excise tax was imposed on distributors, wholesale dealers, or retail dealers who first distributed,sold, consumed, or otherwise handled bottled soft drink or base products in this State.
Soft drink tax rates and bases:Effective date Rate Base Effective date Rate Base
9/1/69 1 cent per bottled soft drink 9/1/69 $1 per gallon liquid base products (4/5 cent per ounce)7/1/96-6/30/97 3/4 cent 7/1/96-6/30/97 75 cents per gallon7/1/97-6/30/98 1/2 cent 7/1/97-6/30/98 50 cents per gallon7/1/98-6/30/99 1/4 cent 7/1/98-6/30/99 25 cents per gallon
[Rates for dry base products were the same as for bottled soft drinks except that the rates were per ounce for dry base productsinstead of per bottle for bottled products.]
Soft drink tax % change1989 27,912,071 2.00%1990 28,987,047 3.85%1991 29,752,060 2.64%1992 32,417,808 8.96%1993 34,461,373 6.30%1994 36,538,688 6.03%1995 37,958,080 3.88%1996 39,805,998 4.87%1997 31,347,645 -21.25%1998 23,078,645 -26.38%1999 12,349,253 -46.49%2000 1,285,949 -89.59%2001 51,202 -96.02%2002 1,855 -96.38%2003 ------ -100.00%
Figure 9.1 Soft Drink Tax Collections and % Change
$0
$5
$10
$15
$20
$25
$30
$35
$40
$45
1989 1990 1991 1992 1993 1994 1995 1996 1997 1998 1999 2000 2001 2002 2003
(mill
ions
)
Fiscal year ended
-120%
-100%
-80%
-60%
-40%
-20%
0%
20%
Soft drink tax net collections % change
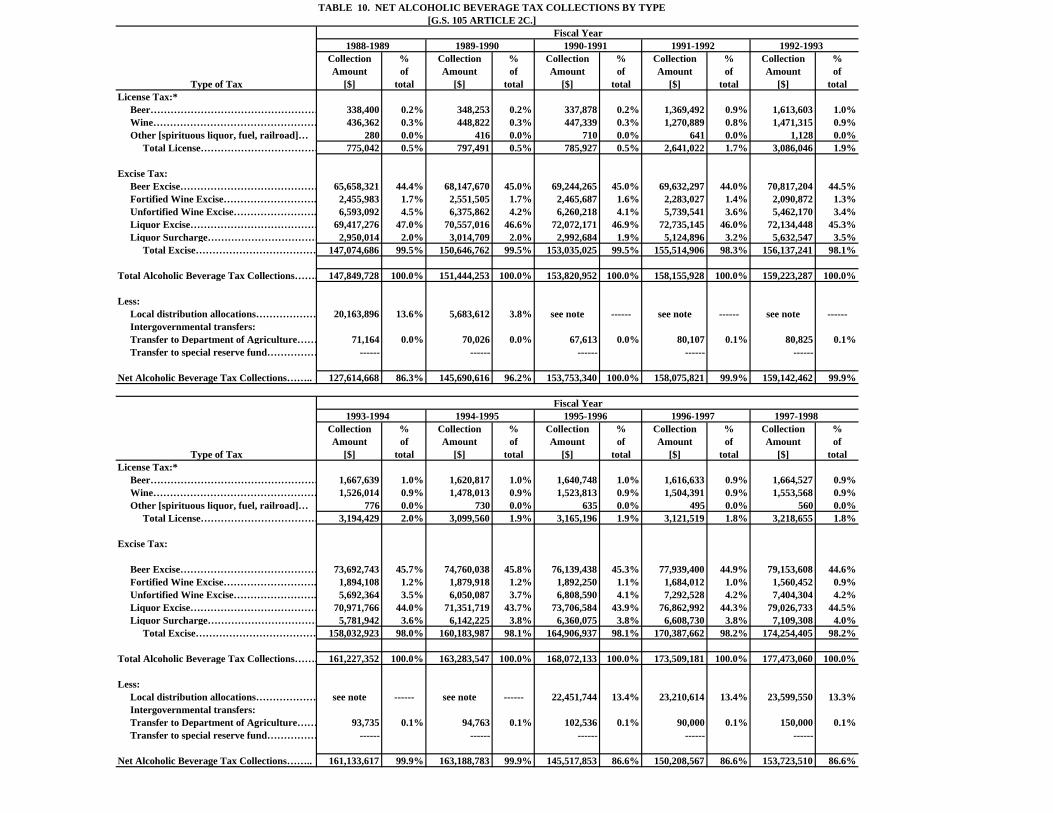
TABLE 10. NET ALCOHOLIC BEVERAGE TAX COLLECTIONS BY TYPE[G.S. 105 ARTICLE 2C.]
Fiscal Year 1988-1989 1989-1990 1990-1991 1991-1992 1992-1993
Collection % Collection % Collection % Collection % Collection %Amount of Amount of Amount of Amount of Amount of
Type of Tax [$] total [$] total [$] total [$] total [$] totalLicense Tax:* Beer…………………………………………… 338,400 0.2% 348,253 0.2% 337,878 0.2% 1,369,492 0.9% 1,613,603 1.0% Wine…………………………………………… 436,362 0.3% 448,822 0.3% 447,339 0.3% 1,270,889 0.8% 1,471,315 0.9% Other [spirituous liquor, fuel, railroad]… 280 0.0% 416 0.0% 710 0.0% 641 0.0% 1,128 0.0% Total License……………………………… 775,042 0.5% 797,491 0.5% 785,927 0.5% 2,641,022 1.7% 3,086,046 1.9%
Excise Tax: Beer Excise…………………………………… 65,658,321 44.4% 68,147,670 45.0% 69,244,265 45.0% 69,632,297 44.0% 70,817,204 44.5% Fortified Wine Excise………………………. 2,455,983 1.7% 2,551,505 1.7% 2,465,687 1.6% 2,283,027 1.4% 2,090,872 1.3% Unfortified Wine Excise……………………. 6,593,092 4.5% 6,375,862 4.2% 6,260,218 4.1% 5,739,541 3.6% 5,462,170 3.4% Liquor Excise………………………………… 69,417,276 47.0% 70,557,016 46.6% 72,072,171 46.9% 72,735,145 46.0% 72,134,448 45.3% Liquor Surcharge…………………………… 2,950,014 2.0% 3,014,709 2.0% 2,992,684 1.9% 5,124,896 3.2% 5,632,547 3.5% Total Excise……………………………… 147,074,686 99.5% 150,646,762 99.5% 153,035,025 99.5% 155,514,906 98.3% 156,137,241 98.1%
Total Alcoholic Beverage Tax Collections……. 147,849,728 100.0% 151,444,253 100.0% 153,820,952 100.0% 158,155,928 100.0% 159,223,287 100.0%
Less: Local distribution allocations……………… 20,163,896 13.6% 5,683,612 3.8% see note ------ see note ------ see note ------ Intergovernmental transfers: Transfer to Department of Agriculture…… 71,164 0.0% 70,026 0.0% 67,613 0.0% 80,107 0.1% 80,825 0.1% Transfer to special reserve fund…………… ------ ------ ------ ------ ------
Net Alcoholic Beverage Tax Collections…….. 127,614,668 86.3% 145,690,616 96.2% 153,753,340 100.0% 158,075,821 99.9% 159,142,462 99.9%
Fiscal Year 1993-1994 1994-1995 1995-1996 1996-1997 1997-1998
Collection % Collection % Collection % Collection % Collection %Amount of Amount of Amount of Amount of Amount of
Type of Tax [$] total [$] total [$] total [$] total [$] totalLicense Tax:* Beer…………………………………………… 1,667,639 1.0% 1,620,817 1.0% 1,640,748 1.0% 1,616,633 0.9% 1,664,527 0.9% Wine…………………………………………… 1,526,014 0.9% 1,478,013 0.9% 1,523,813 0.9% 1,504,391 0.9% 1,553,568 0.9% Other [spirituous liquor, fuel, railroad]… 776 0.0% 730 0.0% 635 0.0% 495 0.0% 560 0.0% Total License……………………………… 3,194,429 2.0% 3,099,560 1.9% 3,165,196 1.9% 3,121,519 1.8% 3,218,655 1.8%
Excise Tax:
Beer Excise…………………………………… 73,692,743 45.7% 74,760,038 45.8% 76,139,438 45.3% 77,939,400 44.9% 79,153,608 44.6% Fortified Wine Excise………………………. 1,894,108 1.2% 1,879,918 1.2% 1,892,250 1.1% 1,684,012 1.0% 1,560,452 0.9% Unfortified Wine Excise……………………. 5,692,364 3.5% 6,050,087 3.7% 6,808,590 4.1% 7,292,528 4.2% 7,404,304 4.2% Liquor Excise………………………………… 70,971,766 44.0% 71,351,719 43.7% 73,706,584 43.9% 76,862,992 44.3% 79,026,733 44.5% Liquor Surcharge…………………………… 5,781,942 3.6% 6,142,225 3.8% 6,360,075 3.8% 6,608,730 3.8% 7,109,308 4.0% Total Excise……………………………… 158,032,923 98.0% 160,183,987 98.1% 164,906,937 98.1% 170,387,662 98.2% 174,254,405 98.2%
Total Alcoholic Beverage Tax Collections……. 161,227,352 100.0% 163,283,547 100.0% 168,072,133 100.0% 173,509,181 100.0% 177,473,060 100.0%
Less: Local distribution allocations……………… see note ------ see note ------ 22,451,744 13.4% 23,210,614 13.4% 23,599,550 13.3% Intergovernmental transfers: Transfer to Department of Agriculture…… 93,735 0.1% 94,763 0.1% 102,536 0.1% 90,000 0.1% 150,000 0.1% Transfer to special reserve fund…………… ------ ------ ------ ------ ------
Net Alcoholic Beverage Tax Collections…….. 161,133,617 99.9% 163,188,783 99.9% 145,517,853 86.6% 150,208,567 86.6% 153,723,510 86.6%
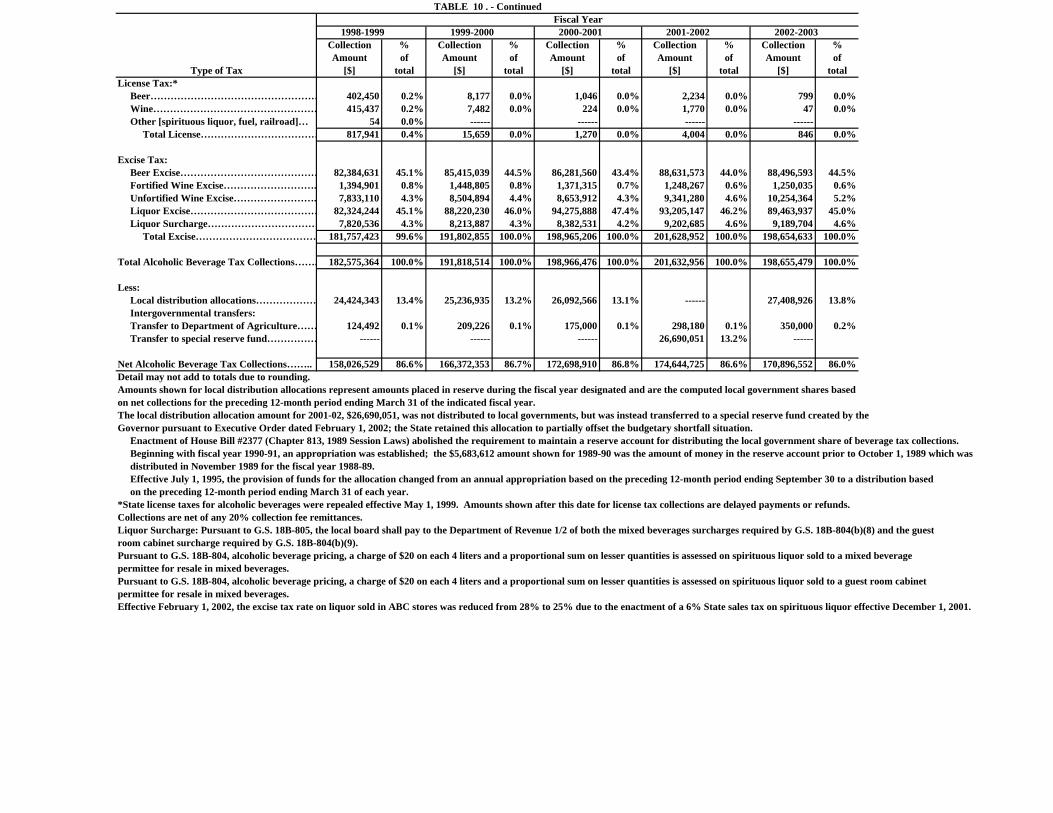
TABLE 10 . - Continued Fiscal Year
1998-1999 1999-2000 2000-2001 2001-2002 2002-2003Collection % Collection % Collection % Collection % Collection %Amount of Amount of Amount of Amount of Amount of
Type of Tax [$] total [$] total [$] total [$] total [$] totalLicense Tax:* Beer…………………………………………… 402,450 0.2% 8,177 0.0% 1,046 0.0% 2,234 0.0% 799 0.0% Wine…………………………………………… 415,437 0.2% 7,482 0.0% 224 0.0% 1,770 0.0% 47 0.0% Other [spirituous liquor, fuel, railroad]… 54 0.0% ------ ------ ------ ------ Total License……………………………… 817,941 0.4% 15,659 0.0% 1,270 0.0% 4,004 0.0% 846 0.0%
Excise Tax: Beer Excise…………………………………… 82,384,631 45.1% 85,415,039 44.5% 86,281,560 43.4% 88,631,573 44.0% 88,496,593 44.5% Fortified Wine Excise………………………. 1,394,901 0.8% 1,448,805 0.8% 1,371,315 0.7% 1,248,267 0.6% 1,250,035 0.6% Unfortified Wine Excise……………………. 7,833,110 4.3% 8,504,894 4.4% 8,653,912 4.3% 9,341,280 4.6% 10,254,364 5.2% Liquor Excise………………………………… 82,324,244 45.1% 88,220,230 46.0% 94,275,888 47.4% 93,205,147 46.2% 89,463,937 45.0% Liquor Surcharge…………………………… 7,820,536 4.3% 8,213,887 4.3% 8,382,531 4.2% 9,202,685 4.6% 9,189,704 4.6% Total Excise……………………………… 181,757,423 99.6% 191,802,855 100.0% 198,965,206 100.0% 201,628,952 100.0% 198,654,633 100.0%
Total Alcoholic Beverage Tax Collections……. 182,575,364 100.0% 191,818,514 100.0% 198,966,476 100.0% 201,632,956 100.0% 198,655,479 100.0%
Less: Local distribution allocations……………… 24,424,343 13.4% 25,236,935 13.2% 26,092,566 13.1% ------ 27,408,926 13.8% Intergovernmental transfers: Transfer to Department of Agriculture…… 124,492 0.1% 209,226 0.1% 175,000 0.1% 298,180 0.1% 350,000 0.2% Transfer to special reserve fund…………… ------ ------ ------ 26,690,051 13.2% ------
Net Alcoholic Beverage Tax Collections…….. 158,026,529 86.6% 166,372,353 86.7% 172,698,910 86.8% 174,644,725 86.6% 170,896,552 86.0%Detail may not add to totals due to rounding.Amounts shown for local distribution allocations represent amounts placed in reserve during the fiscal year designated and are the computed local government shares based on net collections for the preceding 12-month period ending March 31 of the indicated fiscal year. The local distribution allocation amount for 2001-02, $26,690,051, was not distributed to local governments, but was instead transferred to a special reserve fund created by the Governor pursuant to Executive Order dated February 1, 2002; the State retained this allocation to partially offset the budgetary shortfall situation. Enactment of House Bill #2377 (Chapter 813, 1989 Session Laws) abolished the requirement to maintain a reserve account for distributing the local government share of beverage tax collections. Beginning with fiscal year 1990-91, an appropriation was established; the $5,683,612 amount shown for 1989-90 was the amount of money in the reserve account prior to October 1, 1989 which was distributed in November 1989 for the fiscal year 1988-89. Effective July 1, 1995, the provision of funds for the allocation changed from an annual appropriation based on the preceding 12-month period ending September 30 to a distribution based on the preceding 12-month period ending March 31 of each year.*State license taxes for alcoholic beverages were repealed effective May 1, 1999. Amounts shown after this date for license tax collections are delayed payments or refunds.Collections are net of any 20% collection fee remittances.Liquor Surcharge: Pursuant to G.S. 18B-805, the local board shall pay to the Department of Revenue 1/2 of both the mixed beverages surcharges required by G.S. 18B-804(b)(8) and the guest room cabinet surcharge required by G.S. 18B-804(b)(9).Pursuant to G.S. 18B-804, alcoholic beverage pricing, a charge of $20 on each 4 liters and a proportional sum on lesser quantities is assessed on spirituous liquor sold to a mixed beverage permittee for resale in mixed beverages.Pursuant to G.S. 18B-804, alcoholic beverage pricing, a charge of $20 on each 4 liters and a proportional sum on lesser quantities is assessed on spirituous liquor sold to a guest room cabinet permittee for resale in mixed beverages.Effective February 1, 2002, the excise tax rate on liquor sold in ABC stores was reduced from 28% to 25% due to the enactment of a 6% State sales tax on spirituous liquor effective December 1, 2001.
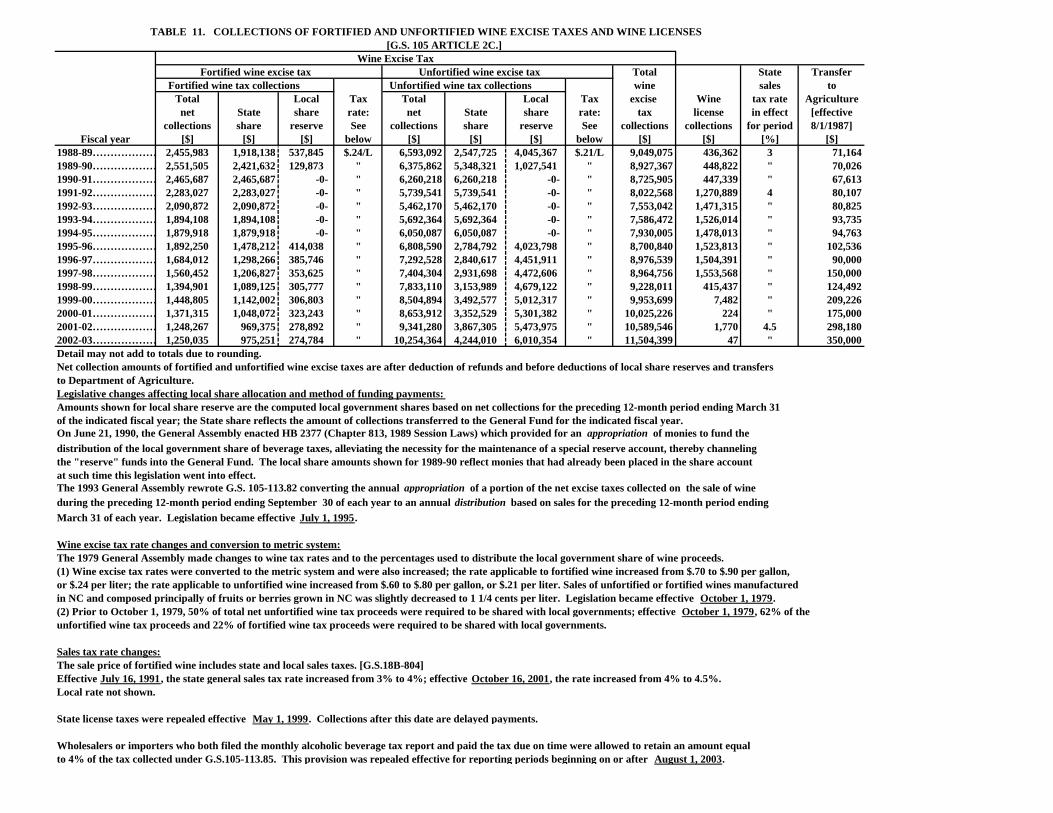
TABLE 11. COLLECTIONS OF FORTIFIED AND UNFORTIFIED WINE EXCISE TAXES AND WINE LICENSES [G.S. 105 ARTICLE 2C.] Wine Excise Tax
Fortified wine excise tax Unfortified wine excise tax Total State Transfer Fortified wine tax collections Unfortified wine tax collections wine sales to
Total Local Tax Total Local Tax excise Wine tax rate Agriculturenet State share rate: net State share rate: tax license in effect [effective
collections share reserve See collections share reserve See collections collections for period 8/1/1987]Fiscal year [$] [$] [$] below [$] [$] [$] below [$] [$] [%] [$]
1988-89……………… 2,455,983 1,918,138 537,845 $.24/L 6,593,092 2,547,725 4,045,367 $.21/L 9,049,075 436,362 3 71,1641989-90……………… 2,551,505 2,421,632 129,873 " 6,375,862 5,348,321 1,027,541 " 8,927,367 448,822 " 70,0261990-91……………… 2,465,687 2,465,687 -0- " 6,260,218 6,260,218 -0- " 8,725,905 447,339 " 67,6131991-92……………… 2,283,027 2,283,027 -0- " 5,739,541 5,739,541 -0- " 8,022,568 1,270,889 4 80,1071992-93……………… 2,090,872 2,090,872 -0- " 5,462,170 5,462,170 -0- " 7,553,042 1,471,315 " 80,8251993-94……………… 1,894,108 1,894,108 -0- " 5,692,364 5,692,364 -0- " 7,586,472 1,526,014 " 93,7351994-95……………… 1,879,918 1,879,918 -0- " 6,050,087 6,050,087 -0- " 7,930,005 1,478,013 " 94,7631995-96……………… 1,892,250 1,478,212 414,038 " 6,808,590 2,784,792 4,023,798 " 8,700,840 1,523,813 " 102,5361996-97……………… 1,684,012 1,298,266 385,746 " 7,292,528 2,840,617 4,451,911 " 8,976,539 1,504,391 " 90,0001997-98……………… 1,560,452 1,206,827 353,625 " 7,404,304 2,931,698 4,472,606 " 8,964,756 1,553,568 " 150,0001998-99……………… 1,394,901 1,089,125 305,777 " 7,833,110 3,153,989 4,679,122 " 9,228,011 415,437 " 124,4921999-00……………… 1,448,805 1,142,002 306,803 " 8,504,894 3,492,577 5,012,317 " 9,953,699 7,482 " 209,2262000-01……………… 1,371,315 1,048,072 323,243 " 8,653,912 3,352,529 5,301,382 " 10,025,226 224 " 175,0002001-02……………… 1,248,267 969,375 278,892 " 9,341,280 3,867,305 5,473,975 " 10,589,546 1,770 4.5 298,1802002-03……………… 1,250,035 975,251 274,784 " 10,254,364 4,244,010 6,010,354 " 11,504,399 47 " 350,000Detail may not add to totals due to rounding.Net collection amounts of fortified and unfortified wine excise taxes are after deduction of refunds and before deductions of local share reserves and transfers to Department of Agriculture.Legislative changes affecting local share allocation and method of funding payments:Amounts shown for local share reserve are the computed local government shares based on net collections for the preceding 12-month period ending March 31of the indicated fiscal year; the State share reflects the amount of collections transferred to the General Fund for the indicated fiscal year.On June 21, 1990, the General Assembly enacted HB 2377 (Chapter 813, 1989 Session Laws) which provided for an appropriation of monies to fund thedistribution of the local government share of beverage taxes, alleviating the necessity for the maintenance of a special reserve account, thereby channeling the "reserve" funds into the General Fund. The local share amounts shown for 1989-90 reflect monies that had already been placed in the share account at such time this legislation went into effect.The 1993 General Assembly rewrote G.S. 105-113.82 converting the annual appropriation of a portion of the net excise taxes collected on the sale of wineduring the preceding 12-month period ending September 30 of each year to an annual distribution based on sales for the preceding 12-month period endingMarch 31 of each year. Legislation became effective July 1, 1995.
Wine excise tax rate changes and conversion to metric system:The 1979 General Assembly made changes to wine tax rates and to the percentages used to distribute the local government share of wine proceeds. (1) Wine excise tax rates were converted to the metric system and were also increased; the rate applicable to fortified wine increased from $.70 to $.90 per gallon,or $.24 per liter; the rate applicable to unfortified wine increased from $.60 to $.80 per gallon, or $.21 per liter. Sales of unfortified or fortified wines manufactured in NC and composed principally of fruits or berries grown in NC was slightly decreased to 1 1/4 cents per liter. Legislation became effective October 1, 1979.(2) Prior to October 1, 1979, 50% of total net unfortified wine tax proceeds were required to be shared with local governments; effective October 1, 1979, 62% of theunfortified wine tax proceeds and 22% of fortified wine tax proceeds were required to be shared with local governments.
Sales tax rate changes:The sale price of fortified wine includes state and local sales taxes. [G.S.18B-804]Effective July 16, 1991, the state general sales tax rate increased from 3% to 4%; effective October 16, 2001, the rate increased from 4% to 4.5%.Local rate not shown.
State license taxes were repealed effective May 1, 1999. Collections after this date are delayed payments.
Wholesalers or importers who both filed the monthly alcoholic beverage tax report and paid the tax due on time were allowed to retain an amount equalto 4% of the tax collected under G.S.105-113.85. This provision was repealed effective for reporting periods beginning on or after August 1, 2003.
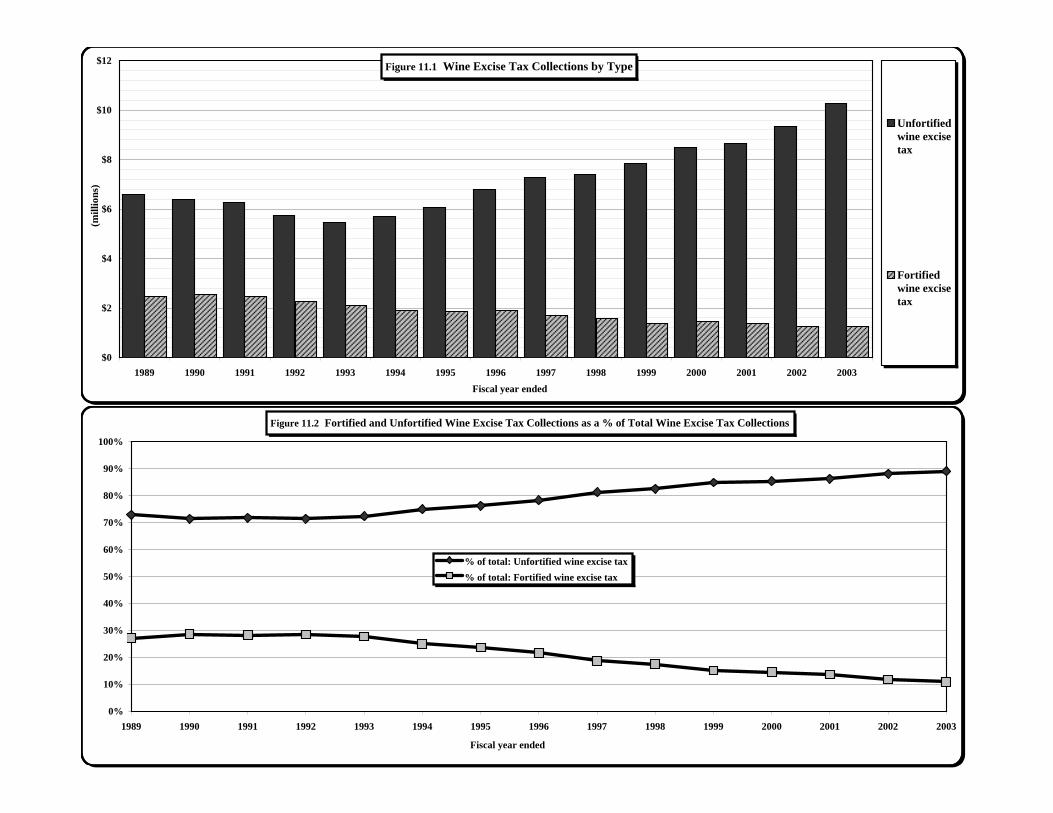
Unfortified wine excFortified wine excise tax1989 $6,593,092 $2,455,9831990 $6,375,862 $2,551,5051991 $6,260,218 $2,465,6871992 $5,739,541 $2,283,0271993 $5,462,170 $2,090,8721994 $5,692,364 $1,894,1081995 $6,050,087 $1,879,9181996 $6,808,590 $1,892,2501997 $7,292,528 $1,684,0121998 $7,404,304 $1,560,4521999 $7,833,110 $1,394,9012000 $8,504,894 $1,448,8052001 $8,653,912 $1,371,3152002 $9,341,280 $1,248,2672003 $10,254,364 $1,250,035
% of total: % of total:Unfortified winFortified wine excise tax
1989 72.86% 27.14%1990 71.42% 28.58%1991 71.74% 28.26%1992 71.54% 28.46%1993 72.32% 27.68%1994 75.03% 24.97%1995 76.29% 23.71%1996 78.25% 21.75%1997 81.24% 18.76%1998 82.59% 17.41%1999 84.88% 15.12%2000 85.44% 14.56%2001 86.32% 13.68%2002 88.21% 11.79%2003 89.13% 10.87%
Figure 11.1 Wine Excise Tax Collections by Type
$0
$2
$4
$6
$8
$10
$12
1989 1990 1991 1992 1993 1994 1995 1996 1997 1998 1999 2000 2001 2002 2003
(mill
ions
)
Fiscal year ended
Unfortifiedwine excisetax
Fortifiedwine excisetax
Figure 11.2 Fortified and Unfortified Wine Excise Tax Collections as a % of Total Wine Excise Tax Collections
0%
10%
20%
30%
40%
50%
60%
70%
80%
90%
100%
1989 1990 1991 1992 1993 1994 1995 1996 1997 1998 1999 2000 2001 2002 2003
Fiscal year ended
% of total: Unfortified wine excise tax% of total: Fortified wine excise tax
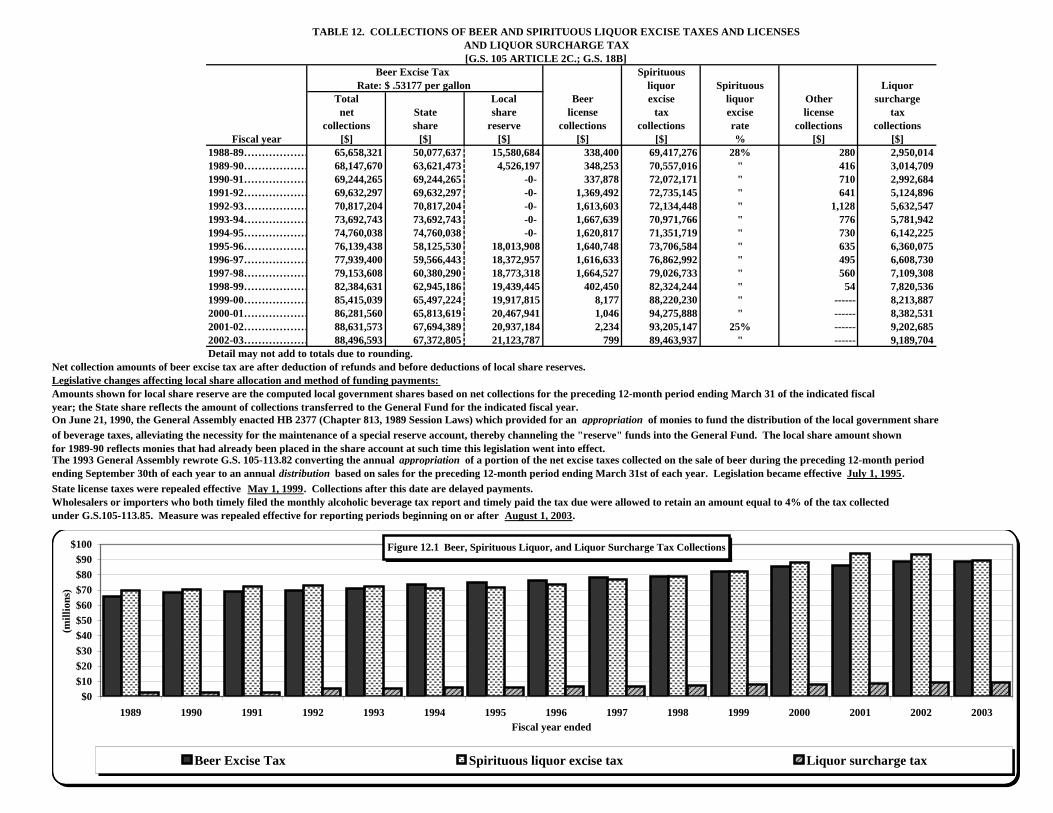
TABLE 12. COLLECTIONS OF BEER AND SPIRITUOUS LIQUOR EXCISE TAXES AND LICENSES AND LIQUOR SURCHARGE TAX
[G.S. 105 ARTICLE 2C.; G.S. 18B] Beer Excise Tax Spirituous Rate: $ .53177 per gallon liquor Spirituous Liquor
Total Local Beer excise liquor Other surchargenet State share license tax excise license tax
collections share reserve collections collections rate collections collectionsFiscal year [$] [$] [$] [$] [$] % [$] [$]
1988-89……………… 65,658,321 50,077,637 15,580,684 338,400 69,417,276 28% 280 2,950,0141989-90……………… 68,147,670 63,621,473 4,526,197 348,253 70,557,016 " 416 3,014,7091990-91……………… 69,244,265 69,244,265 -0- 337,878 72,072,171 " 710 2,992,6841991-92……………… 69,632,297 69,632,297 -0- 1,369,492 72,735,145 " 641 5,124,8961992-93……………… 70,817,204 70,817,204 -0- 1,613,603 72,134,448 " 1,128 5,632,5471993-94……………… 73,692,743 73,692,743 -0- 1,667,639 70,971,766 " 776 5,781,9421994-95……………… 74,760,038 74,760,038 -0- 1,620,817 71,351,719 " 730 6,142,2251995-96……………… 76,139,438 58,125,530 18,013,908 1,640,748 73,706,584 " 635 6,360,0751996-97……………… 77,939,400 59,566,443 18,372,957 1,616,633 76,862,992 " 495 6,608,7301997-98……………… 79,153,608 60,380,290 18,773,318 1,664,527 79,026,733 " 560 7,109,3081998-99……………… 82,384,631 62,945,186 19,439,445 402,450 82,324,244 " 54 7,820,5361999-00……………… 85,415,039 65,497,224 19,917,815 8,177 88,220,230 " ------ 8,213,8872000-01……………… 86,281,560 65,813,619 20,467,941 1,046 94,275,888 " ------ 8,382,5312001-02……………… 88,631,573 67,694,389 20,937,184 2,234 93,205,147 25% ------ 9,202,6852002-03……………… 88,496,593 67,372,805 21,123,787 799 89,463,937 " ------ 9,189,704Detail may not add to totals due to rounding.
Net collection amounts of beer excise tax are after deduction of refunds and before deductions of local share reserves. Legislative changes affecting local share allocation and method of funding payments:Amounts shown for local share reserve are the computed local government shares based on net collections for the preceding 12-month period ending March 31 of the indicated fiscalyear; the State share reflects the amount of collections transferred to the General Fund for the indicated fiscal year.On June 21, 1990, the General Assembly enacted HB 2377 (Chapter 813, 1989 Session Laws) which provided for an appropriation of monies to fund the distribution of the local government share of beverage taxes, alleviating the necessity for the maintenance of a special reserve account, thereby channeling the "reserve" funds into the General Fund. The local share amount shown for 1989-90 reflects monies that had already been placed in the share account at such time this legislation went into effect. The 1993 General Assembly rewrote G.S. 105-113.82 converting the annual appropriation of a portion of the net excise taxes collected on the sale of beer during the preceding 12-month periodending September 30th of each year to an annual distribution based on sales for the preceding 12-month period ending March 31st of each year. Legislation became effective July 1, 1995.State license taxes were repealed effective May 1, 1999. Collections after this date are delayed payments.Wholesalers or importers who both timely filed the monthly alcoholic beverage tax report and timely paid the tax due were allowed to retain an amount equal to 4% of the tax collectedunder G.S.105-113.85. Measure was repealed effective for reporting periods beginning on or after August 1, 2003.
Beer Excise Tax Spirituous liquorLiquor surcharge tax1989 $65,658,321 $69,417,276 $2,950,0141990 $68,147,670 $70,557,016 $3,014,7091991 $69,244,265 $72,072,171 $2,992,6841992 $69,632,297 $72,735,145 $5,124,8961993 $70,817,204 $72,134,448 $5,632,5471994 $73,692,743 $70,971,766 $5,781,9421995 $74,760,038 $71,351,719 $6,142,2251996 $76,139,438 $73,706,584 $6,360,0751997 $77,939,400 $76,862,992 $6,608,7301998 $79,153,608 $79,026,733 $7,109,3081999 $82,384,631 $82,324,244 $7,820,5362000 $85,415,039 $88,220,230 $8,213,8872001 $86,281,560 $94,275,888 $8,382,5312002 $88,631,573 $93,205,147 $9,202,6852003 $88,496,593 $89,463,937 $9,189,704
Figure 12.1 Beer, Spirituous Liquor, and Liquor Surcharge Tax Collections
$0$10$20$30$40$50$60$70$80$90
$100
1989 1990 1991 1992 1993 1994 1995 1996 1997 1998 1999 2000 2001 2002 2003
(mill
ions
)
Fiscal year ended
Beer Excise Tax Spirituous liquor excise tax Liquor surcharge tax
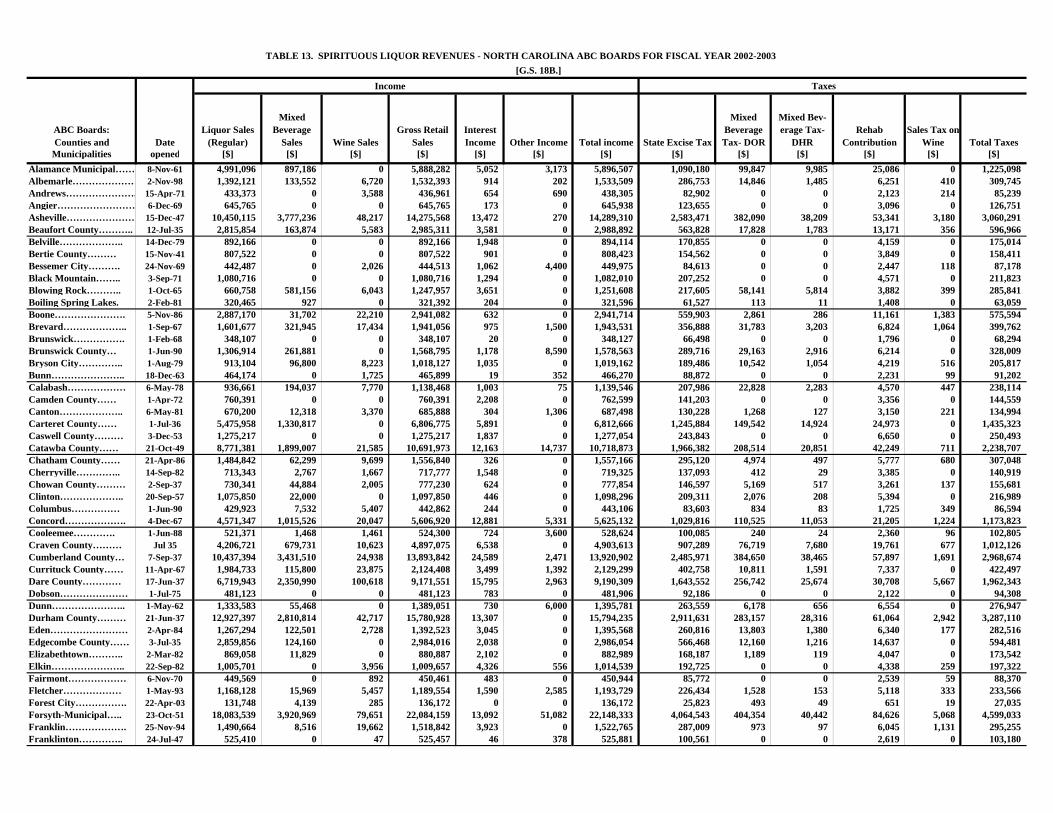
TABLE 13. SPIRITUOUS LIQUOR REVENUES - NORTH CAROLINA ABC BOARDS FOR FISCAL YEAR 2002-2003 [G.S. 18B.]
Income Taxes
ABC Boards: Counties and Date
Liquor Sales (Regular)
Mixed Beverage
Sales Wine SalesGross Retail
SalesInterest Income Other Income Total income State Excise Tax
Mixed Beverage Tax- DOR
Mixed Bev-erage Tax-
DHRRehab
ContributionSales Tax on
Wine Total TaxesMunicipalities opened [$] [$] [$] [$] [$] [$] [$] [$] [$] [$] [$] [$] [$]
Alamance Municipal…… 8-Nov-61 4,991,096 897,186 0 5,888,282 5,052 3,173 5,896,507 1,090,180 99,847 9,985 25,086 0 1,225,098Albemarle………………… 2-Nov-98 1,392,121 133,552 6,720 1,532,393 914 202 1,533,509 286,753 14,846 1,485 6,251 410 309,745Andrews…………………. 15-Apr-71 433,373 0 3,588 436,961 654 690 438,305 82,902 0 0 2,123 214 85,239Angier…………………… 6-Dec-69 645,765 0 0 645,765 173 0 645,938 123,655 0 0 3,096 0 126,751Asheville………………… 15-Dec-47 10,450,115 3,777,236 48,217 14,275,568 13,472 270 14,289,310 2,583,471 382,090 38,209 53,341 3,180 3,060,291Beaufort County……….. 12-Jul-35 2,815,854 163,874 5,583 2,985,311 3,581 0 2,988,892 563,828 17,828 1,783 13,171 356 596,966Belville……………….. 14-Dec-79 892,166 0 0 892,166 1,948 0 894,114 170,855 0 0 4,159 0 175,014Bertie County……… 15-Nov-41 807,522 0 0 807,522 901 0 808,423 154,562 0 0 3,849 0 158,411Bessemer City………. 24-Nov-69 442,487 0 2,026 444,513 1,062 4,400 449,975 84,613 0 0 2,447 118 87,178Black Mountain…….. 3-Sep-71 1,080,716 0 0 1,080,716 1,294 0 1,082,010 207,252 0 0 4,571 0 211,823Blowing Rock……….. 1-Oct-65 660,758 581,156 6,043 1,247,957 3,651 0 1,251,608 217,605 58,141 5,814 3,882 399 285,841Boiling Spring Lakes. 2-Feb-81 320,465 927 0 321,392 204 0 321,596 61,527 113 11 1,408 0 63,059Boone…………………. 5-Nov-86 2,887,170 31,702 22,210 2,941,082 632 0 2,941,714 559,903 2,861 286 11,161 1,383 575,594Brevard……………….. 1-Sep-67 1,601,677 321,945 17,434 1,941,056 975 1,500 1,943,531 356,888 31,783 3,203 6,824 1,064 399,762Brunswick……………. 1-Feb-68 348,107 0 0 348,107 20 0 348,127 66,498 0 0 1,796 0 68,294Brunswick County… 1-Jun-90 1,306,914 261,881 0 1,568,795 1,178 8,590 1,578,563 289,716 29,163 2,916 6,214 0 328,009Bryson City………….. 1-Aug-79 913,104 96,800 8,223 1,018,127 1,035 0 1,019,162 189,486 10,542 1,054 4,219 516 205,817Bunn………………….. 18-Dec-63 464,174 0 1,725 465,899 19 352 466,270 88,872 0 0 2,231 99 91,202Calabash……………… 6-May-78 936,661 194,037 7,770 1,138,468 1,003 75 1,139,546 207,986 22,828 2,283 4,570 447 238,114Camden County…… 1-Apr-72 760,391 0 0 760,391 2,208 0 762,599 141,203 0 0 3,356 0 144,559Canton……………….. 6-May-81 670,200 12,318 3,370 685,888 304 1,306 687,498 130,228 1,268 127 3,150 221 134,994Carteret County…… 1-Jul-36 5,475,958 1,330,817 0 6,806,775 5,891 0 6,812,666 1,245,884 149,542 14,924 24,973 0 1,435,323Caswell County……… 3-Dec-53 1,275,217 0 0 1,275,217 1,837 0 1,277,054 243,843 0 0 6,650 0 250,493Catawba County…… 21-Oct-49 8,771,381 1,899,007 21,585 10,691,973 12,163 14,737 10,718,873 1,966,382 208,514 20,851 42,249 711 2,238,707Chatham County…… 21-Apr-86 1,484,842 62,299 9,699 1,556,840 326 0 1,557,166 295,120 4,974 497 5,777 680 307,048Cherryville………….. 14-Sep-82 713,343 2,767 1,667 717,777 1,548 0 719,325 137,093 412 29 3,385 0 140,919Chowan County……… 2-Sep-37 730,341 44,884 2,005 777,230 624 0 777,854 146,597 5,169 517 3,261 137 155,681Clinton……………….. 20-Sep-57 1,075,850 22,000 0 1,097,850 446 0 1,098,296 209,311 2,076 208 5,394 0 216,989Columbus…………… 1-Jun-90 429,923 7,532 5,407 442,862 244 0 443,106 83,603 834 83 1,725 349 86,594Concord………………. 4-Dec-67 4,571,347 1,015,526 20,047 5,606,920 12,881 5,331 5,625,132 1,029,816 110,525 11,053 21,205 1,224 1,173,823Cooleemee…………. 1-Jun-88 521,371 1,468 1,461 524,300 724 3,600 528,624 100,085 240 24 2,360 96 102,805Craven County……… Jul 35 4,206,721 679,731 10,623 4,897,075 6,538 0 4,903,613 907,289 76,719 7,680 19,761 677 1,012,126Cumberland County… 7-Sep-37 10,437,394 3,431,510 24,938 13,893,842 24,589 2,471 13,920,902 2,485,971 384,650 38,465 57,897 1,691 2,968,674Currituck County…… 11-Apr-67 1,984,733 115,800 23,875 2,124,408 3,499 1,392 2,129,299 402,758 10,811 1,591 7,337 0 422,497Dare County………… 17-Jun-37 6,719,943 2,350,990 100,618 9,171,551 15,795 2,963 9,190,309 1,643,552 256,742 25,674 30,708 5,667 1,962,343Dobson………………… 1-Jul-75 481,123 0 0 481,123 783 0 481,906 92,186 0 0 2,122 0 94,308Dunn………………….. 1-May-62 1,333,583 55,468 0 1,389,051 730 6,000 1,395,781 263,559 6,178 656 6,554 0 276,947Durham County……… 21-Jun-37 12,927,397 2,810,814 42,717 15,780,928 13,307 0 15,794,235 2,911,631 283,157 28,316 61,064 2,942 3,287,110Eden…………………… 2-Apr-84 1,267,294 122,501 2,728 1,392,523 3,045 0 1,395,568 260,816 13,803 1,380 6,340 177 282,516Edgecombe County…… 3-Jul-35 2,859,856 124,160 0 2,984,016 2,038 0 2,986,054 566,468 12,160 1,216 14,637 0 594,481Elizabethtown……….. 2-Mar-82 869,058 11,829 0 880,887 2,102 0 882,989 168,187 1,189 119 4,047 0 173,542Elkin………………….. 22-Sep-82 1,005,701 0 3,956 1,009,657 4,326 556 1,014,539 192,725 0 0 4,338 259 197,322Fairmont……………… 6-Nov-70 449,569 0 892 450,461 483 0 450,944 85,772 0 0 2,539 59 88,370Fletcher……………… 1-May-93 1,168,128 15,969 5,457 1,189,554 1,590 2,585 1,193,729 226,434 1,528 153 5,118 333 233,566Forest City……………. 22-Apr-03 131,748 4,139 285 136,172 0 0 136,172 25,823 493 49 651 19 27,035Forsyth-Municipal….. 23-Oct-51 18,083,539 3,920,969 79,651 22,084,159 13,092 51,082 22,148,333 4,064,543 404,354 40,442 84,626 5,068 4,599,033Franklin………………. 25-Nov-94 1,490,664 8,516 19,662 1,518,842 3,923 0 1,522,765 287,009 973 97 6,045 1,131 295,255Franklinton………….. 24-Jul-47 525,410 0 47 525,457 46 378 525,881 100,561 0 0 2,619 0 103,180
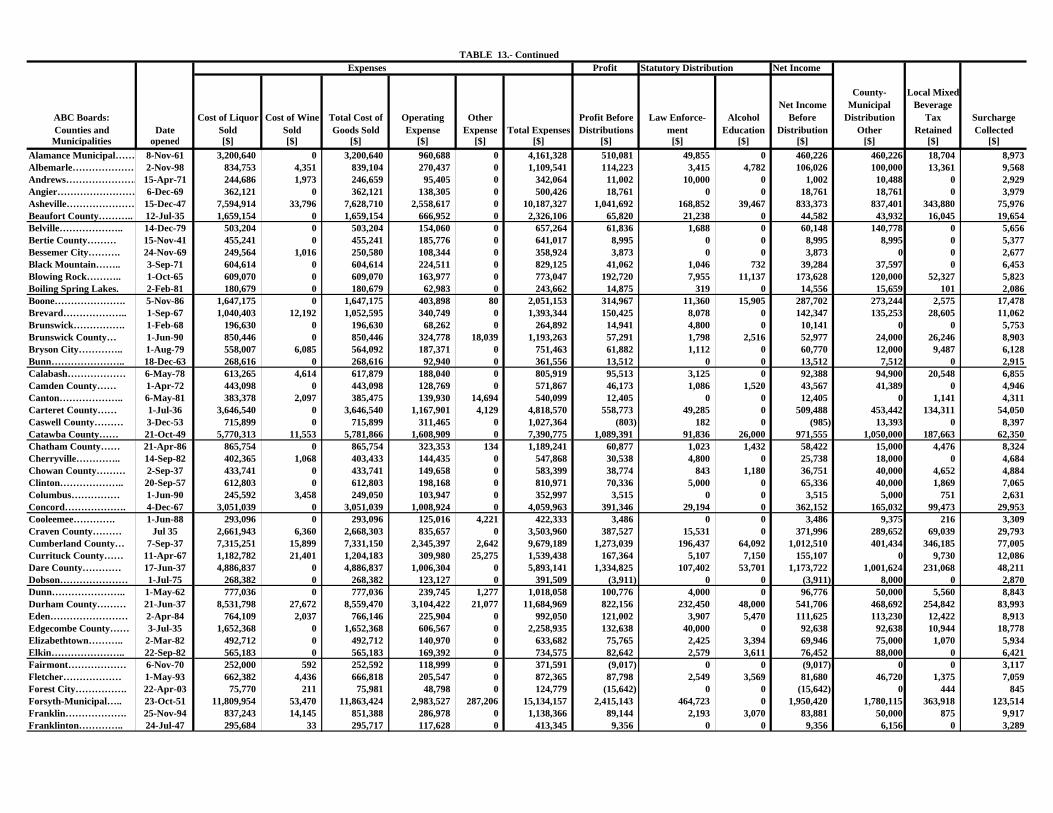
TABLE 13.- Continued Expenses Profit Statutory Distribution Net Income
ABC Boards: Counties and Date
Cost of Liquor Sold
Cost of Wine Sold
Total Cost of Goods Sold
Operating Expense
Other Expense Total Expenses
Profit Before Distributions
Law Enforce-ment
Alcohol Education
Net Income Before
Distribution
County-Municipal
Distribution Other
Local Mixed Beverage
Tax Retained
Surcharge Collected
Municipalities opened [$] [$] [$] [$] [$] [$] [$] [$] [$] [$] [$] [$] [$]Alamance Municipal…… 8-Nov-61 3,200,640 0 3,200,640 960,688 0 4,161,328 510,081 49,855 0 460,226 460,226 18,704 8,973Albemarle………………… 2-Nov-98 834,753 4,351 839,104 270,437 0 1,109,541 114,223 3,415 4,782 106,026 100,000 13,361 9,568Andrews…………………. 15-Apr-71 244,686 1,973 246,659 95,405 0 342,064 11,002 10,000 0 1,002 10,488 0 2,929Angier…………………… 6-Dec-69 362,121 0 362,121 138,305 0 500,426 18,761 0 0 18,761 18,761 0 3,979Asheville………………… 15-Dec-47 7,594,914 33,796 7,628,710 2,558,617 0 10,187,327 1,041,692 168,852 39,467 833,373 837,401 343,880 75,976Beaufort County……….. 12-Jul-35 1,659,154 0 1,659,154 666,952 0 2,326,106 65,820 21,238 0 44,582 43,932 16,045 19,654Belville……………….. 14-Dec-79 503,204 0 503,204 154,060 0 657,264 61,836 1,688 0 60,148 140,778 0 5,656Bertie County……… 15-Nov-41 455,241 0 455,241 185,776 0 641,017 8,995 0 0 8,995 8,995 0 5,377Bessemer City………. 24-Nov-69 249,564 1,016 250,580 108,344 0 358,924 3,873 0 0 3,873 0 0 2,677Black Mountain…….. 3-Sep-71 604,614 0 604,614 224,511 0 829,125 41,062 1,046 732 39,284 37,597 0 6,453Blowing Rock……….. 1-Oct-65 609,070 0 609,070 163,977 0 773,047 192,720 7,955 11,137 173,628 120,000 52,327 5,823Boiling Spring Lakes. 2-Feb-81 180,679 0 180,679 62,983 0 243,662 14,875 319 0 14,556 15,659 101 2,086Boone…………………. 5-Nov-86 1,647,175 0 1,647,175 403,898 80 2,051,153 314,967 11,360 15,905 287,702 273,244 2,575 17,478Brevard……………….. 1-Sep-67 1,040,403 12,192 1,052,595 340,749 0 1,393,344 150,425 8,078 0 142,347 135,253 28,605 11,062Brunswick……………. 1-Feb-68 196,630 0 196,630 68,262 0 264,892 14,941 4,800 0 10,141 0 0 5,753Brunswick County… 1-Jun-90 850,446 0 850,446 324,778 18,039 1,193,263 57,291 1,798 2,516 52,977 24,000 26,246 8,903Bryson City………….. 1-Aug-79 558,007 6,085 564,092 187,371 0 751,463 61,882 1,112 0 60,770 12,000 9,487 6,128Bunn………………….. 18-Dec-63 268,616 0 268,616 92,940 0 361,556 13,512 0 0 13,512 7,512 0 2,915Calabash……………… 6-May-78 613,265 4,614 617,879 188,040 0 805,919 95,513 3,125 0 92,388 94,900 20,548 6,855Camden County…… 1-Apr-72 443,098 0 443,098 128,769 0 571,867 46,173 1,086 1,520 43,567 41,389 0 4,946Canton……………….. 6-May-81 383,378 2,097 385,475 139,930 14,694 540,099 12,405 0 0 12,405 0 1,141 4,311Carteret County…… 1-Jul-36 3,646,540 0 3,646,540 1,167,901 4,129 4,818,570 558,773 49,285 0 509,488 453,442 134,311 54,050Caswell County……… 3-Dec-53 715,899 0 715,899 311,465 0 1,027,364 (803) 182 0 (985) 13,393 0 8,397Catawba County…… 21-Oct-49 5,770,313 11,553 5,781,866 1,608,909 0 7,390,775 1,089,391 91,836 26,000 971,555 1,050,000 187,663 62,350Chatham County…… 21-Apr-86 865,754 0 865,754 323,353 134 1,189,241 60,877 1,023 1,432 58,422 15,000 4,476 8,324Cherryville………….. 14-Sep-82 402,365 1,068 403,433 144,435 0 547,868 30,538 4,800 0 25,738 18,000 0 4,684Chowan County……… 2-Sep-37 433,741 0 433,741 149,658 0 583,399 38,774 843 1,180 36,751 40,000 4,652 4,884Clinton……………….. 20-Sep-57 612,803 0 612,803 198,168 0 810,971 70,336 5,000 0 65,336 40,000 1,869 7,065Columbus…………… 1-Jun-90 245,592 3,458 249,050 103,947 0 352,997 3,515 0 0 3,515 5,000 751 2,631Concord………………. 4-Dec-67 3,051,039 0 3,051,039 1,008,924 0 4,059,963 391,346 29,194 0 362,152 165,032 99,473 29,953Cooleemee…………. 1-Jun-88 293,096 0 293,096 125,016 4,221 422,333 3,486 0 0 3,486 9,375 216 3,309Craven County……… Jul 35 2,661,943 6,360 2,668,303 835,657 0 3,503,960 387,527 15,531 0 371,996 289,652 69,039 29,793Cumberland County… 7-Sep-37 7,315,251 15,899 7,331,150 2,345,397 2,642 9,679,189 1,273,039 196,437 64,092 1,012,510 401,434 346,185 77,005Currituck County…… 11-Apr-67 1,182,782 21,401 1,204,183 309,980 25,275 1,539,438 167,364 5,107 7,150 155,107 0 9,730 12,086Dare County………… 17-Jun-37 4,886,837 0 4,886,837 1,006,304 0 5,893,141 1,334,825 107,402 53,701 1,173,722 1,001,624 231,068 48,211Dobson………………… 1-Jul-75 268,382 0 268,382 123,127 0 391,509 (3,911) 0 0 (3,911) 8,000 0 2,870Dunn………………….. 1-May-62 777,036 0 777,036 239,745 1,277 1,018,058 100,776 4,000 0 96,776 50,000 5,560 8,843Durham County……… 21-Jun-37 8,531,798 27,672 8,559,470 3,104,422 21,077 11,684,969 822,156 232,450 48,000 541,706 468,692 254,842 83,993Eden…………………… 2-Apr-84 764,109 2,037 766,146 225,904 0 992,050 121,002 3,907 5,470 111,625 113,230 12,422 8,913Edgecombe County…… 3-Jul-35 1,652,368 0 1,652,368 606,567 0 2,258,935 132,638 40,000 0 92,638 92,638 10,944 18,778Elizabethtown……….. 2-Mar-82 492,712 0 492,712 140,970 0 633,682 75,765 2,425 3,394 69,946 75,000 1,070 5,934Elkin………………….. 22-Sep-82 565,183 0 565,183 169,392 0 734,575 82,642 2,579 3,611 76,452 88,000 0 6,421Fairmont……………… 6-Nov-70 252,000 592 252,592 118,999 0 371,591 (9,017) 0 0 (9,017) 0 0 3,117Fletcher……………… 1-May-93 662,382 4,436 666,818 205,547 0 872,365 87,798 2,549 3,569 81,680 46,720 1,375 7,059Forest City……………. 22-Apr-03 75,770 211 75,981 48,798 0 124,779 (15,642) 0 0 (15,642) 0 444 845Forsyth-Municipal….. 23-Oct-51 11,809,954 53,470 11,863,424 2,983,527 287,206 15,134,157 2,415,143 464,723 0 1,950,420 1,780,115 363,918 123,514Franklin………………. 25-Nov-94 837,243 14,145 851,388 286,978 0 1,138,366 89,144 2,193 3,070 83,881 50,000 875 9,917Franklinton………….. 24-Jul-47 295,684 33 295,717 117,628 0 413,345 9,356 0 0 9,356 6,156 0 3,289
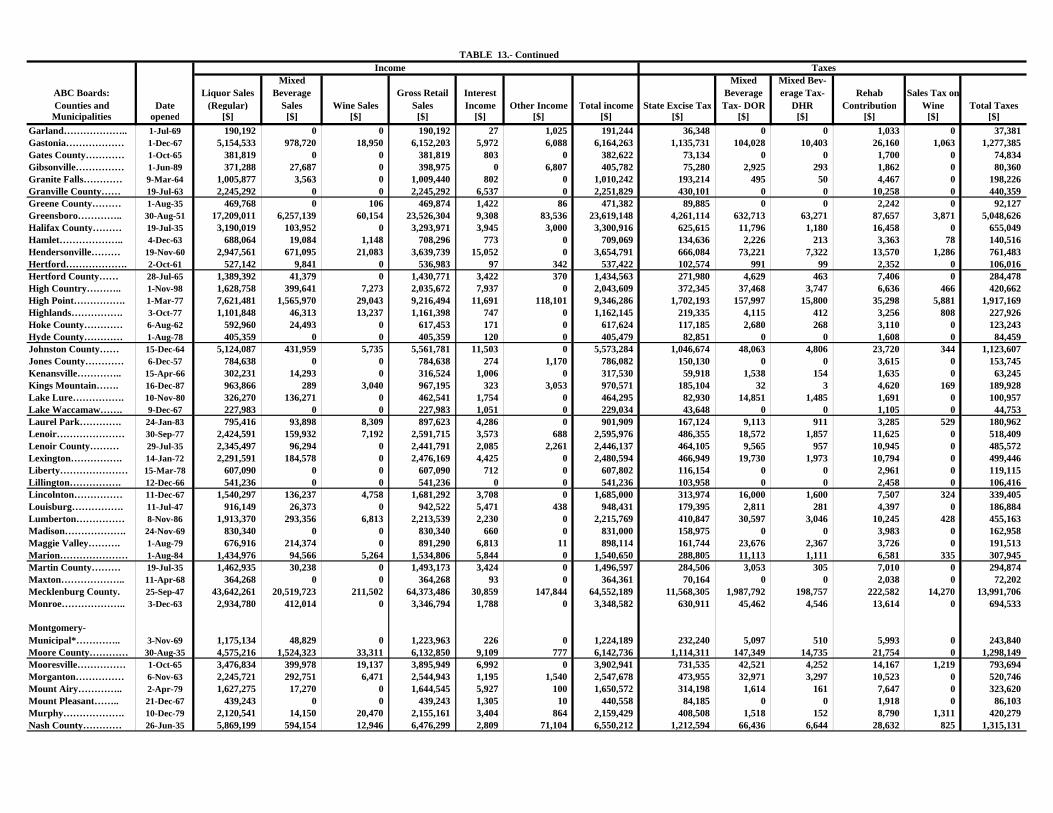
TABLE 13.- Continued Income Taxes
ABC Boards: Counties and Date
Liquor Sales (Regular)
Mixed Beverage
Sales Wine SalesGross Retail
SalesInterest Income Other Income Total income State Excise Tax
Mixed Beverage Tax- DOR
Mixed Bev-erage Tax-
DHRRehab
ContributionSales Tax on
Wine Total TaxesMunicipalities opened [$] [$] [$] [$] [$] [$] [$] [$] [$] [$] [$] [$] [$]
Garland……………….. 1-Jul-69 190,192 0 0 190,192 27 1,025 191,244 36,348 0 0 1,033 0 37,381Gastonia……………… 1-Dec-67 5,154,533 978,720 18,950 6,152,203 5,972 6,088 6,164,263 1,135,731 104,028 10,403 26,160 1,063 1,277,385Gates County………… 1-Oct-65 381,819 0 0 381,819 803 0 382,622 73,134 0 0 1,700 0 74,834Gibsonville…………… 1-Jun-89 371,288 27,687 0 398,975 0 6,807 405,782 75,280 2,925 293 1,862 0 80,360Granite Falls………… 9-Mar-64 1,005,877 3,563 0 1,009,440 802 0 1,010,242 193,214 495 50 4,467 0 198,226Granville County…… 19-Jul-63 2,245,292 0 0 2,245,292 6,537 0 2,251,829 430,101 0 0 10,258 0 440,359Greene County……… 1-Aug-35 469,768 0 106 469,874 1,422 86 471,382 89,885 0 0 2,242 0 92,127Greensboro………….. 30-Aug-51 17,209,011 6,257,139 60,154 23,526,304 9,308 83,536 23,619,148 4,261,114 632,713 63,271 87,657 3,871 5,048,626Halifax County……… 19-Jul-35 3,190,019 103,952 0 3,293,971 3,945 3,000 3,300,916 625,615 11,796 1,180 16,458 0 655,049Hamlet……………….. 4-Dec-63 688,064 19,084 1,148 708,296 773 0 709,069 134,636 2,226 213 3,363 78 140,516Hendersonville……… 19-Nov-60 2,947,561 671,095 21,083 3,639,739 15,052 0 3,654,791 666,084 73,221 7,322 13,570 1,286 761,483Hertford………………. 2-Oct-61 527,142 9,841 0 536,983 97 342 537,422 102,574 991 99 2,352 0 106,016Hertford County…… 28-Jul-65 1,389,392 41,379 0 1,430,771 3,422 370 1,434,563 271,980 4,629 463 7,406 0 284,478High Country……….. 1-Nov-98 1,628,758 399,641 7,273 2,035,672 7,937 0 2,043,609 372,345 37,468 3,747 6,636 466 420,662High Point……………. 1-Mar-77 7,621,481 1,565,970 29,043 9,216,494 11,691 118,101 9,346,286 1,702,193 157,997 15,800 35,298 5,881 1,917,169Highlands……………. 3-Oct-77 1,101,848 46,313 13,237 1,161,398 747 0 1,162,145 219,335 4,115 412 3,256 808 227,926Hoke County………… 6-Aug-62 592,960 24,493 0 617,453 171 0 617,624 117,185 2,680 268 3,110 0 123,243Hyde County………… 1-Aug-78 405,359 0 0 405,359 120 0 405,479 82,851 0 0 1,608 0 84,459Johnston County…… 15-Dec-64 5,124,087 431,959 5,735 5,561,781 11,503 0 5,573,284 1,046,674 48,063 4,806 23,720 344 1,123,607Jones County………… 6-Dec-57 784,638 0 0 784,638 274 1,170 786,082 150,130 0 0 3,615 0 153,745Kenansville………….. 15-Apr-66 302,231 14,293 0 316,524 1,006 0 317,530 59,918 1,538 154 1,635 0 63,245Kings Mountain……. 16-Dec-87 963,866 289 3,040 967,195 323 3,053 970,571 185,104 32 3 4,620 169 189,928Lake Lure……………. 10-Nov-80 326,270 136,271 0 462,541 1,754 0 464,295 82,930 14,851 1,485 1,691 0 100,957Lake Waccamaw……. 9-Dec-67 227,983 0 0 227,983 1,051 0 229,034 43,648 0 0 1,105 0 44,753Laurel Park…………. 24-Jan-83 795,416 93,898 8,309 897,623 4,286 0 901,909 167,124 9,113 911 3,285 529 180,962Lenoir………………… 30-Sep-77 2,424,591 159,932 7,192 2,591,715 3,573 688 2,595,976 486,355 18,572 1,857 11,625 0 518,409Lenoir County……… 29-Jul-35 2,345,497 96,294 0 2,441,791 2,085 2,261 2,446,137 464,105 9,565 957 10,945 0 485,572Lexington……………. 14-Jan-72 2,291,591 184,578 0 2,476,169 4,425 0 2,480,594 466,949 19,730 1,973 10,794 0 499,446Liberty………………… 15-Mar-78 607,090 0 0 607,090 712 0 607,802 116,154 0 0 2,961 0 119,115Lillington……………. 12-Dec-66 541,236 0 0 541,236 0 0 541,236 103,958 0 0 2,458 0 106,416Lincolnton…………… 11-Dec-67 1,540,297 136,237 4,758 1,681,292 3,708 0 1,685,000 313,974 16,000 1,600 7,507 324 339,405Louisburg……………. 11-Jul-47 916,149 26,373 0 942,522 5,471 438 948,431 179,395 2,811 281 4,397 0 186,884Lumberton…………… 8-Nov-86 1,913,370 293,356 6,813 2,213,539 2,230 0 2,215,769 410,847 30,597 3,046 10,245 428 455,163Madison………………. 24-Nov-69 830,340 0 0 830,340 660 0 831,000 158,975 0 0 3,983 0 162,958Maggie Valley………. 1-Aug-79 676,916 214,374 0 891,290 6,813 11 898,114 161,744 23,676 2,367 3,726 0 191,513Marion………………… 1-Aug-84 1,434,976 94,566 5,264 1,534,806 5,844 0 1,540,650 288,805 11,113 1,111 6,581 335 307,945Martin County……… 19-Jul-35 1,462,935 30,238 0 1,493,173 3,424 0 1,496,597 284,506 3,053 305 7,010 0 294,874Maxton……………….. 11-Apr-68 364,268 0 0 364,268 93 0 364,361 70,164 0 0 2,038 0 72,202Mecklenburg County. 25-Sep-47 43,642,261 20,519,723 211,502 64,373,486 30,859 147,844 64,552,189 11,568,305 1,987,792 198,757 222,582 14,270 13,991,706Monroe……………….. 3-Dec-63 2,934,780 412,014 0 3,346,794 1,788 0 3,348,582 630,911 45,462 4,546 13,614 0 694,533
Montgomery-Municipal*………….. 3-Nov-69 1,175,134 48,829 0 1,223,963 226 0 1,224,189 232,240 5,097 510 5,993 0 243,840Moore County………… 30-Aug-35 4,575,216 1,524,323 33,311 6,132,850 9,109 777 6,142,736 1,114,311 147,349 14,735 21,754 0 1,298,149Mooresville…………… 1-Oct-65 3,476,834 399,978 19,137 3,895,949 6,992 0 3,902,941 731,535 42,521 4,252 14,167 1,219 793,694Morganton…………… 6-Nov-63 2,245,721 292,751 6,471 2,544,943 1,195 1,540 2,547,678 473,955 32,971 3,297 10,523 0 520,746Mount Airy………….. 2-Apr-79 1,627,275 17,270 0 1,644,545 5,927 100 1,650,572 314,198 1,614 161 7,647 0 323,620Mount Pleasant…….. 21-Dec-67 439,243 0 0 439,243 1,305 10 440,558 84,185 0 0 1,918 0 86,103Murphy………………. 10-Dec-79 2,120,541 14,150 20,470 2,155,161 3,404 864 2,159,429 408,508 1,518 152 8,790 1,311 420,279Nash County………… 26-Jun-35 5,869,199 594,154 12,946 6,476,299 2,809 71,104 6,550,212 1,212,594 66,436 6,644 28,632 825 1,315,131
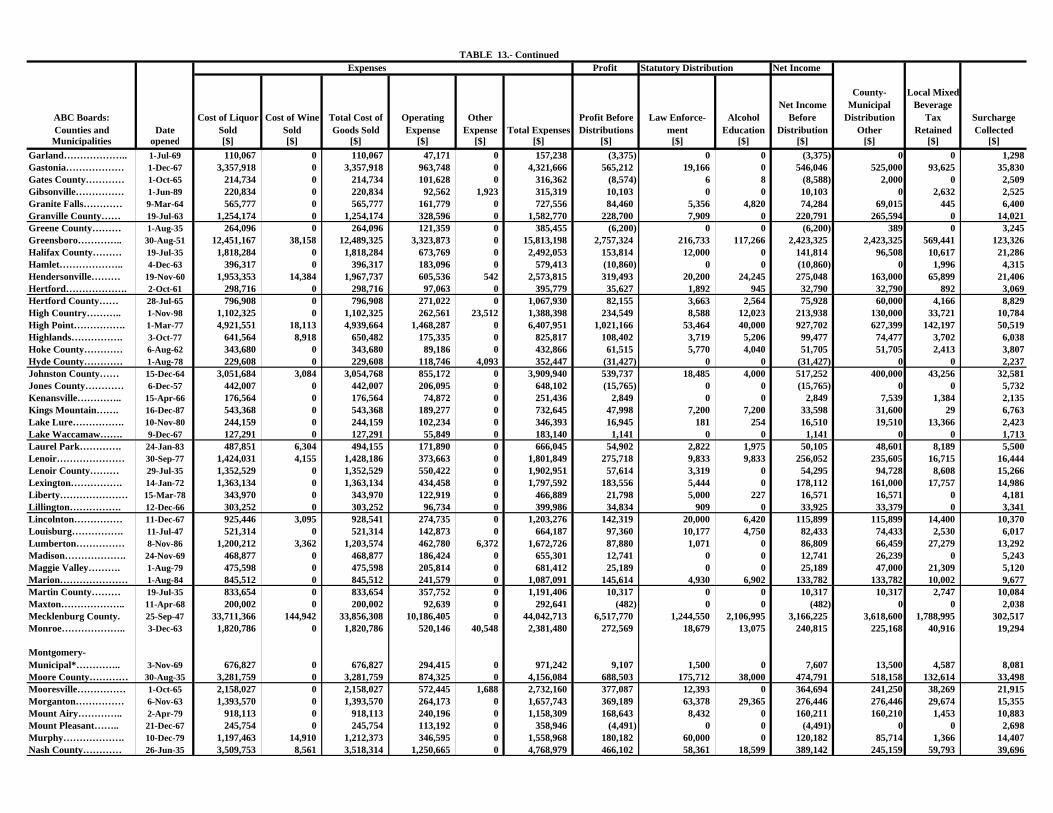
TABLE 13.- Continued Expenses Profit Statutory Distribution Net Income
ABC Boards: Counties and Date
Cost of Liquor Sold
Cost of Wine Sold
Total Cost of Goods Sold
Operating Expense
Other Expense Total Expenses
Profit Before Distributions
Law Enforce-ment
Alcohol Education
Net Income Before
Distribution
County-Municipal
Distribution Other
Local Mixed Beverage
Tax Retained
Surcharge Collected
Municipalities opened [$] [$] [$] [$] [$] [$] [$] [$] [$] [$] [$] [$] [$]Garland……………….. 1-Jul-69 110,067 0 110,067 47,171 0 157,238 (3,375) 0 0 (3,375) 0 0 1,298Gastonia……………… 1-Dec-67 3,357,918 0 3,357,918 963,748 0 4,321,666 565,212 19,166 0 546,046 525,000 93,625 35,830Gates County………… 1-Oct-65 214,734 0 214,734 101,628 0 316,362 (8,574) 6 8 (8,588) 2,000 0 2,509Gibsonville…………… 1-Jun-89 220,834 0 220,834 92,562 1,923 315,319 10,103 0 0 10,103 0 2,632 2,525Granite Falls………… 9-Mar-64 565,777 0 565,777 161,779 0 727,556 84,460 5,356 4,820 74,284 69,015 445 6,400Granville County…… 19-Jul-63 1,254,174 0 1,254,174 328,596 0 1,582,770 228,700 7,909 0 220,791 265,594 0 14,021Greene County……… 1-Aug-35 264,096 0 264,096 121,359 0 385,455 (6,200) 0 0 (6,200) 389 0 3,245Greensboro………….. 30-Aug-51 12,451,167 38,158 12,489,325 3,323,873 0 15,813,198 2,757,324 216,733 117,266 2,423,325 2,423,325 569,441 123,326Halifax County……… 19-Jul-35 1,818,284 0 1,818,284 673,769 0 2,492,053 153,814 12,000 0 141,814 96,508 10,617 21,286Hamlet……………….. 4-Dec-63 396,317 0 396,317 183,096 0 579,413 (10,860) 0 0 (10,860) 0 1,996 4,315Hendersonville……… 19-Nov-60 1,953,353 14,384 1,967,737 605,536 542 2,573,815 319,493 20,200 24,245 275,048 163,000 65,899 21,406Hertford………………. 2-Oct-61 298,716 0 298,716 97,063 0 395,779 35,627 1,892 945 32,790 32,790 892 3,069Hertford County…… 28-Jul-65 796,908 0 796,908 271,022 0 1,067,930 82,155 3,663 2,564 75,928 60,000 4,166 8,829High Country……….. 1-Nov-98 1,102,325 0 1,102,325 262,561 23,512 1,388,398 234,549 8,588 12,023 213,938 130,000 33,721 10,784High Point……………. 1-Mar-77 4,921,551 18,113 4,939,664 1,468,287 0 6,407,951 1,021,166 53,464 40,000 927,702 627,399 142,197 50,519Highlands……………. 3-Oct-77 641,564 8,918 650,482 175,335 0 825,817 108,402 3,719 5,206 99,477 74,477 3,702 6,038Hoke County………… 6-Aug-62 343,680 0 343,680 89,186 0 432,866 61,515 5,770 4,040 51,705 51,705 2,413 3,807Hyde County………… 1-Aug-78 229,608 0 229,608 118,746 4,093 352,447 (31,427) 0 0 (31,427) 0 0 2,237Johnston County…… 15-Dec-64 3,051,684 3,084 3,054,768 855,172 0 3,909,940 539,737 18,485 4,000 517,252 400,000 43,256 32,581Jones County………… 6-Dec-57 442,007 0 442,007 206,095 0 648,102 (15,765) 0 0 (15,765) 0 0 5,732Kenansville………….. 15-Apr-66 176,564 0 176,564 74,872 0 251,436 2,849 0 0 2,849 7,539 1,384 2,135Kings Mountain……. 16-Dec-87 543,368 0 543,368 189,277 0 732,645 47,998 7,200 7,200 33,598 31,600 29 6,763Lake Lure……………. 10-Nov-80 244,159 0 244,159 102,234 0 346,393 16,945 181 254 16,510 19,510 13,366 2,423Lake Waccamaw……. 9-Dec-67 127,291 0 127,291 55,849 0 183,140 1,141 0 0 1,141 0 0 1,713Laurel Park…………. 24-Jan-83 487,851 6,304 494,155 171,890 0 666,045 54,902 2,822 1,975 50,105 48,601 8,189 5,500Lenoir………………… 30-Sep-77 1,424,031 4,155 1,428,186 373,663 0 1,801,849 275,718 9,833 9,833 256,052 235,605 16,715 16,444Lenoir County……… 29-Jul-35 1,352,529 0 1,352,529 550,422 0 1,902,951 57,614 3,319 0 54,295 94,728 8,608 15,266Lexington……………. 14-Jan-72 1,363,134 0 1,363,134 434,458 0 1,797,592 183,556 5,444 0 178,112 161,000 17,757 14,986Liberty………………… 15-Mar-78 343,970 0 343,970 122,919 0 466,889 21,798 5,000 227 16,571 16,571 0 4,181Lillington……………. 12-Dec-66 303,252 0 303,252 96,734 0 399,986 34,834 909 0 33,925 33,379 0 3,341Lincolnton…………… 11-Dec-67 925,446 3,095 928,541 274,735 0 1,203,276 142,319 20,000 6,420 115,899 115,899 14,400 10,370Louisburg……………. 11-Jul-47 521,314 0 521,314 142,873 0 664,187 97,360 10,177 4,750 82,433 74,433 2,530 6,017Lumberton…………… 8-Nov-86 1,200,212 3,362 1,203,574 462,780 6,372 1,672,726 87,880 1,071 0 86,809 66,459 27,279 13,292Madison………………. 24-Nov-69 468,877 0 468,877 186,424 0 655,301 12,741 0 0 12,741 26,239 0 5,243Maggie Valley………. 1-Aug-79 475,598 0 475,598 205,814 0 681,412 25,189 0 0 25,189 47,000 21,309 5,120Marion………………… 1-Aug-84 845,512 0 845,512 241,579 0 1,087,091 145,614 4,930 6,902 133,782 133,782 10,002 9,677Martin County……… 19-Jul-35 833,654 0 833,654 357,752 0 1,191,406 10,317 0 0 10,317 10,317 2,747 10,084Maxton……………….. 11-Apr-68 200,002 0 200,002 92,639 0 292,641 (482) 0 0 (482) 0 0 2,038Mecklenburg County. 25-Sep-47 33,711,366 144,942 33,856,308 10,186,405 0 44,042,713 6,517,770 1,244,550 2,106,995 3,166,225 3,618,600 1,788,995 302,517Monroe……………….. 3-Dec-63 1,820,786 0 1,820,786 520,146 40,548 2,381,480 272,569 18,679 13,075 240,815 225,168 40,916 19,294
Montgomery-Municipal*………….. 3-Nov-69 676,827 0 676,827 294,415 0 971,242 9,107 1,500 0 7,607 13,500 4,587 8,081Moore County………… 30-Aug-35 3,281,759 0 3,281,759 874,325 0 4,156,084 688,503 175,712 38,000 474,791 518,158 132,614 33,498Mooresville…………… 1-Oct-65 2,158,027 0 2,158,027 572,445 1,688 2,732,160 377,087 12,393 0 364,694 241,250 38,269 21,915Morganton…………… 6-Nov-63 1,393,570 0 1,393,570 264,173 0 1,657,743 369,189 63,378 29,365 276,446 276,446 29,674 15,355Mount Airy………….. 2-Apr-79 918,113 0 918,113 240,196 0 1,158,309 168,643 8,432 0 160,211 160,210 1,453 10,883Mount Pleasant…….. 21-Dec-67 245,754 0 245,754 113,192 0 358,946 (4,491) 0 0 (4,491) 0 0 2,698Murphy………………. 10-Dec-79 1,197,463 14,910 1,212,373 346,595 0 1,558,968 180,182 60,000 0 120,182 85,714 1,366 14,407Nash County………… 26-Jun-35 3,509,753 8,561 3,518,314 1,250,665 0 4,768,979 466,102 58,361 18,599 389,142 245,159 59,793 39,696
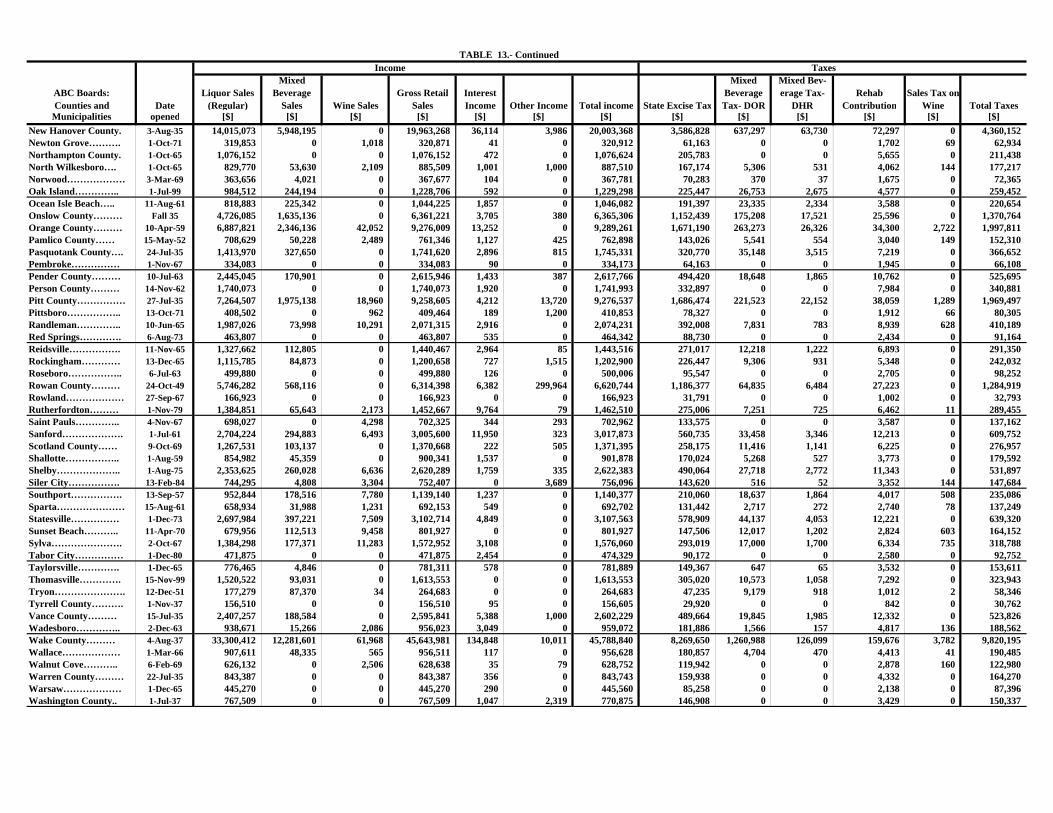
TABLE 13.- Continued Income Taxes
ABC Boards: Counties and Date
Liquor Sales (Regular)
Mixed Beverage
Sales Wine SalesGross Retail
SalesInterest Income Other Income Total income State Excise Tax
Mixed Beverage Tax- DOR
Mixed Bev-erage Tax-
DHRRehab
ContributionSales Tax on
Wine Total TaxesMunicipalities opened [$] [$] [$] [$] [$] [$] [$] [$] [$] [$] [$] [$] [$]
New Hanover County. 3-Aug-35 14,015,073 5,948,195 0 19,963,268 36,114 3,986 20,003,368 3,586,828 637,297 63,730 72,297 0 4,360,152Newton Grove………. 1-Oct-71 319,853 0 1,018 320,871 41 0 320,912 61,163 0 0 1,702 69 62,934Northampton County. 1-Oct-65 1,076,152 0 0 1,076,152 472 0 1,076,624 205,783 0 0 5,655 0 211,438North Wilkesboro…. 1-Oct-65 829,770 53,630 2,109 885,509 1,001 1,000 887,510 167,174 5,306 531 4,062 144 177,217Norwood……………… 3-Mar-69 363,656 4,021 0 367,677 104 0 367,781 70,283 370 37 1,675 0 72,365Oak Island………….. 1-Jul-99 984,512 244,194 0 1,228,706 592 0 1,229,298 225,447 26,753 2,675 4,577 0 259,452Ocean Isle Beach….. 11-Aug-61 818,883 225,342 0 1,044,225 1,857 0 1,046,082 191,397 23,335 2,334 3,588 0 220,654Onslow County……… Fall 35 4,726,085 1,635,136 0 6,361,221 3,705 380 6,365,306 1,152,439 175,208 17,521 25,596 0 1,370,764Orange County……… 10-Apr-59 6,887,821 2,346,136 42,052 9,276,009 13,252 0 9,289,261 1,671,190 263,273 26,326 34,300 2,722 1,997,811Pamlico County…… 15-May-52 708,629 50,228 2,489 761,346 1,127 425 762,898 143,026 5,541 554 3,040 149 152,310Pasquotank County…. 24-Jul-35 1,413,970 327,650 0 1,741,620 2,896 815 1,745,331 320,770 35,148 3,515 7,219 0 366,652Pembroke…………… 1-Nov-67 334,083 0 0 334,083 90 0 334,173 64,163 0 0 1,945 0 66,108Pender County……… 10-Jul-63 2,445,045 170,901 0 2,615,946 1,433 387 2,617,766 494,420 18,648 1,865 10,762 0 525,695Person County……… 14-Nov-62 1,740,073 0 0 1,740,073 1,920 0 1,741,993 332,897 0 0 7,984 0 340,881Pitt County…………… 27-Jul-35 7,264,507 1,975,138 18,960 9,258,605 4,212 13,720 9,276,537 1,686,474 221,523 22,152 38,059 1,289 1,969,497Pittsboro…………….. 13-Oct-71 408,502 0 962 409,464 189 1,200 410,853 78,327 0 0 1,912 66 80,305Randleman………….. 10-Jun-65 1,987,026 73,998 10,291 2,071,315 2,916 0 2,074,231 392,008 7,831 783 8,939 628 410,189Red Springs…………. 6-Aug-73 463,807 0 0 463,807 535 0 464,342 88,730 0 0 2,434 0 91,164Reidsville……………. 11-Nov-65 1,327,662 112,805 0 1,440,467 2,964 85 1,443,516 271,017 12,218 1,222 6,893 0 291,350Rockingham………… 13-Dec-65 1,115,785 84,873 0 1,200,658 727 1,515 1,202,900 226,447 9,306 931 5,348 0 242,032Roseboro…………….. 6-Jul-63 499,880 0 0 499,880 126 0 500,006 95,547 0 0 2,705 0 98,252Rowan County……… 24-Oct-49 5,746,282 568,116 0 6,314,398 6,382 299,964 6,620,744 1,186,377 64,835 6,484 27,223 0 1,284,919Rowland……………… 27-Sep-67 166,923 0 0 166,923 0 0 166,923 31,791 0 0 1,002 0 32,793Rutherfordton……… 1-Nov-79 1,384,851 65,643 2,173 1,452,667 9,764 79 1,462,510 275,006 7,251 725 6,462 11 289,455Saint Pauls………….. 4-Nov-67 698,027 0 4,298 702,325 344 293 702,962 133,575 0 0 3,587 0 137,162Sanford………………. 1-Jul-61 2,704,224 294,883 6,493 3,005,600 11,950 323 3,017,873 560,735 33,458 3,346 12,213 0 609,752Scotland County…… 9-Oct-69 1,267,531 103,137 0 1,370,668 222 505 1,371,395 258,175 11,416 1,141 6,225 0 276,957Shallotte…………….. 1-Aug-59 854,982 45,359 0 900,341 1,537 0 901,878 170,024 5,268 527 3,773 0 179,592Shelby……………….. 1-Aug-75 2,353,625 260,028 6,636 2,620,289 1,759 335 2,622,383 490,064 27,718 2,772 11,343 0 531,897Siler City……………. 13-Feb-84 744,295 4,808 3,304 752,407 0 3,689 756,096 143,620 516 52 3,352 144 147,684Southport……………. 13-Sep-57 952,844 178,516 7,780 1,139,140 1,237 0 1,140,377 210,060 18,637 1,864 4,017 508 235,086Sparta………………… 15-Aug-61 658,934 31,988 1,231 692,153 549 0 692,702 131,442 2,717 272 2,740 78 137,249Statesville…………… 1-Dec-73 2,697,984 397,221 7,509 3,102,714 4,849 0 3,107,563 578,909 44,137 4,053 12,221 0 639,320Sunset Beach……….. 11-Apr-70 679,956 112,513 9,458 801,927 0 0 801,927 147,506 12,017 1,202 2,824 603 164,152Sylva…………………. 2-Oct-67 1,384,298 177,371 11,283 1,572,952 3,108 0 1,576,060 293,019 17,000 1,700 6,334 735 318,788Tabor City…………… 1-Dec-80 471,875 0 0 471,875 2,454 0 474,329 90,172 0 0 2,580 0 92,752Taylorsville…………. 1-Dec-65 776,465 4,846 0 781,311 578 0 781,889 149,367 647 65 3,532 0 153,611Thomasville…………. 15-Nov-99 1,520,522 93,031 0 1,613,553 0 0 1,613,553 305,020 10,573 1,058 7,292 0 323,943Tryon…………………. 12-Dec-51 177,279 87,370 34 264,683 0 0 264,683 47,235 9,179 918 1,012 2 58,346Tyrrell County………. 1-Nov-37 156,510 0 0 156,510 95 0 156,605 29,920 0 0 842 0 30,762Vance County……… 15-Jul-35 2,407,257 188,584 0 2,595,841 5,388 1,000 2,602,229 489,664 19,845 1,985 12,332 0 523,826Wadesboro………….. 2-Dec-63 938,671 15,266 2,086 956,023 3,049 0 959,072 181,886 1,566 157 4,817 136 188,562Wake County……… 4-Aug-37 33,300,412 12,281,601 61,968 45,643,981 134,848 10,011 45,788,840 8,269,650 1,260,988 126,099 159,676 3,782 9,820,195Wallace……………… 1-Mar-66 907,611 48,335 565 956,511 117 0 956,628 180,857 4,704 470 4,413 41 190,485Walnut Cove……….. 6-Feb-69 626,132 0 2,506 628,638 35 79 628,752 119,942 0 0 2,878 160 122,980Warren County……… 22-Jul-35 843,387 0 0 843,387 356 0 843,743 159,938 0 0 4,332 0 164,270Warsaw……………… 1-Dec-65 445,270 0 0 445,270 290 0 445,560 85,258 0 0 2,138 0 87,396Washington County.. 1-Jul-37 767,509 0 0 767,509 1,047 2,319 770,875 146,908 0 0 3,429 0 150,337
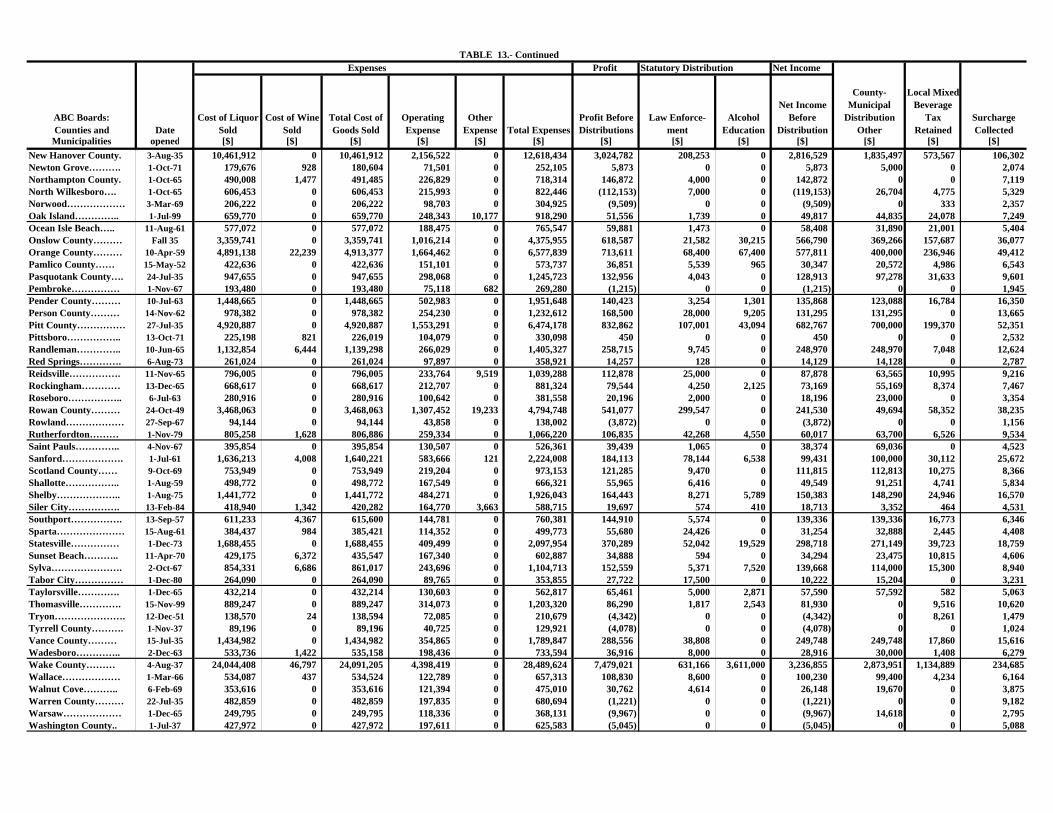
TABLE 13.- Continued Expenses Profit Statutory Distribution Net Income
ABC Boards: Counties and Date
Cost of Liquor Sold
Cost of Wine Sold
Total Cost of Goods Sold
Operating Expense
Other Expense Total Expenses
Profit Before Distributions
Law Enforce-ment
Alcohol Education
Net Income Before
Distribution
County-Municipal
Distribution Other
Local Mixed Beverage
Tax Retained
Surcharge Collected
Municipalities opened [$] [$] [$] [$] [$] [$] [$] [$] [$] [$] [$] [$] [$]New Hanover County. 3-Aug-35 10,461,912 0 10,461,912 2,156,522 0 12,618,434 3,024,782 208,253 0 2,816,529 1,835,497 573,567 106,302Newton Grove………. 1-Oct-71 179,676 928 180,604 71,501 0 252,105 5,873 0 0 5,873 5,000 0 2,074Northampton County. 1-Oct-65 490,008 1,477 491,485 226,829 0 718,314 146,872 4,000 0 142,872 0 0 7,119North Wilkesboro…. 1-Oct-65 606,453 0 606,453 215,993 0 822,446 (112,153) 7,000 0 (119,153) 26,704 4,775 5,329Norwood……………… 3-Mar-69 206,222 0 206,222 98,703 0 304,925 (9,509) 0 0 (9,509) 0 333 2,357Oak Island………….. 1-Jul-99 659,770 0 659,770 248,343 10,177 918,290 51,556 1,739 0 49,817 44,835 24,078 7,249Ocean Isle Beach….. 11-Aug-61 577,072 0 577,072 188,475 0 765,547 59,881 1,473 0 58,408 31,890 21,001 5,404Onslow County……… Fall 35 3,359,741 0 3,359,741 1,016,214 0 4,375,955 618,587 21,582 30,215 566,790 369,266 157,687 36,077Orange County……… 10-Apr-59 4,891,138 22,239 4,913,377 1,664,462 0 6,577,839 713,611 68,400 67,400 577,811 400,000 236,946 49,412Pamlico County…… 15-May-52 422,636 0 422,636 151,101 0 573,737 36,851 5,539 965 30,347 20,572 4,986 6,543Pasquotank County…. 24-Jul-35 947,655 0 947,655 298,068 0 1,245,723 132,956 4,043 0 128,913 97,278 31,633 9,601Pembroke…………… 1-Nov-67 193,480 0 193,480 75,118 682 269,280 (1,215) 0 0 (1,215) 0 0 1,945Pender County……… 10-Jul-63 1,448,665 0 1,448,665 502,983 0 1,951,648 140,423 3,254 1,301 135,868 123,088 16,784 16,350Person County……… 14-Nov-62 978,382 0 978,382 254,230 0 1,232,612 168,500 28,000 9,205 131,295 131,295 0 13,665Pitt County…………… 27-Jul-35 4,920,887 0 4,920,887 1,553,291 0 6,474,178 832,862 107,001 43,094 682,767 700,000 199,370 52,351Pittsboro…………….. 13-Oct-71 225,198 821 226,019 104,079 0 330,098 450 0 0 450 0 0 2,532Randleman………….. 10-Jun-65 1,132,854 6,444 1,139,298 266,029 0 1,405,327 258,715 9,745 0 248,970 248,970 7,048 12,624Red Springs…………. 6-Aug-73 261,024 0 261,024 97,897 0 358,921 14,257 128 0 14,129 14,128 0 2,787Reidsville……………. 11-Nov-65 796,005 0 796,005 233,764 9,519 1,039,288 112,878 25,000 0 87,878 63,565 10,995 9,216Rockingham………… 13-Dec-65 668,617 0 668,617 212,707 0 881,324 79,544 4,250 2,125 73,169 55,169 8,374 7,467Roseboro…………….. 6-Jul-63 280,916 0 280,916 100,642 0 381,558 20,196 2,000 0 18,196 23,000 0 3,354Rowan County……… 24-Oct-49 3,468,063 0 3,468,063 1,307,452 19,233 4,794,748 541,077 299,547 0 241,530 49,694 58,352 38,235Rowland……………… 27-Sep-67 94,144 0 94,144 43,858 0 138,002 (3,872) 0 0 (3,872) 0 0 1,156Rutherfordton……… 1-Nov-79 805,258 1,628 806,886 259,334 0 1,066,220 106,835 42,268 4,550 60,017 63,700 6,526 9,534Saint Pauls………….. 4-Nov-67 395,854 0 395,854 130,507 0 526,361 39,439 1,065 0 38,374 69,036 0 4,523Sanford………………. 1-Jul-61 1,636,213 4,008 1,640,221 583,666 121 2,224,008 184,113 78,144 6,538 99,431 100,000 30,112 25,672Scotland County…… 9-Oct-69 753,949 0 753,949 219,204 0 973,153 121,285 9,470 0 111,815 112,813 10,275 8,366Shallotte…………….. 1-Aug-59 498,772 0 498,772 167,549 0 666,321 55,965 6,416 0 49,549 91,251 4,741 5,834Shelby……………….. 1-Aug-75 1,441,772 0 1,441,772 484,271 0 1,926,043 164,443 8,271 5,789 150,383 148,290 24,946 16,570Siler City……………. 13-Feb-84 418,940 1,342 420,282 164,770 3,663 588,715 19,697 574 410 18,713 3,352 464 4,531Southport……………. 13-Sep-57 611,233 4,367 615,600 144,781 0 760,381 144,910 5,574 0 139,336 139,336 16,773 6,346Sparta………………… 15-Aug-61 384,437 984 385,421 114,352 0 499,773 55,680 24,426 0 31,254 32,888 2,445 4,408Statesville…………… 1-Dec-73 1,688,455 0 1,688,455 409,499 0 2,097,954 370,289 52,042 19,529 298,718 271,149 39,723 18,759Sunset Beach……….. 11-Apr-70 429,175 6,372 435,547 167,340 0 602,887 34,888 594 0 34,294 23,475 10,815 4,606Sylva…………………. 2-Oct-67 854,331 6,686 861,017 243,696 0 1,104,713 152,559 5,371 7,520 139,668 114,000 15,300 8,940Tabor City…………… 1-Dec-80 264,090 0 264,090 89,765 0 353,855 27,722 17,500 0 10,222 15,204 0 3,231Taylorsville…………. 1-Dec-65 432,214 0 432,214 130,603 0 562,817 65,461 5,000 2,871 57,590 57,592 582 5,063Thomasville…………. 15-Nov-99 889,247 0 889,247 314,073 0 1,203,320 86,290 1,817 2,543 81,930 0 9,516 10,620Tryon…………………. 12-Dec-51 138,570 24 138,594 72,085 0 210,679 (4,342) 0 0 (4,342) 0 8,261 1,479Tyrrell County………. 1-Nov-37 89,196 0 89,196 40,725 0 129,921 (4,078) 0 0 (4,078) 0 0 1,024Vance County……… 15-Jul-35 1,434,982 0 1,434,982 354,865 0 1,789,847 288,556 38,808 0 249,748 249,748 17,860 15,616Wadesboro………….. 2-Dec-63 533,736 1,422 535,158 198,436 0 733,594 36,916 8,000 0 28,916 30,000 1,408 6,279Wake County……… 4-Aug-37 24,044,408 46,797 24,091,205 4,398,419 0 28,489,624 7,479,021 631,166 3,611,000 3,236,855 2,873,951 1,134,889 234,685Wallace……………… 1-Mar-66 534,087 437 534,524 122,789 0 657,313 108,830 8,600 0 100,230 99,400 4,234 6,164Walnut Cove……….. 6-Feb-69 353,616 0 353,616 121,394 0 475,010 30,762 4,614 0 26,148 19,670 0 3,875Warren County……… 22-Jul-35 482,859 0 482,859 197,835 0 680,694 (1,221) 0 0 (1,221) 0 0 9,182Warsaw……………… 1-Dec-65 249,795 0 249,795 118,336 0 368,131 (9,967) 0 0 (9,967) 14,618 0 2,795Washington County.. 1-Jul-37 427,972 0 427,972 197,611 0 625,583 (5,045) 0 0 (5,045) 0 0 5,088
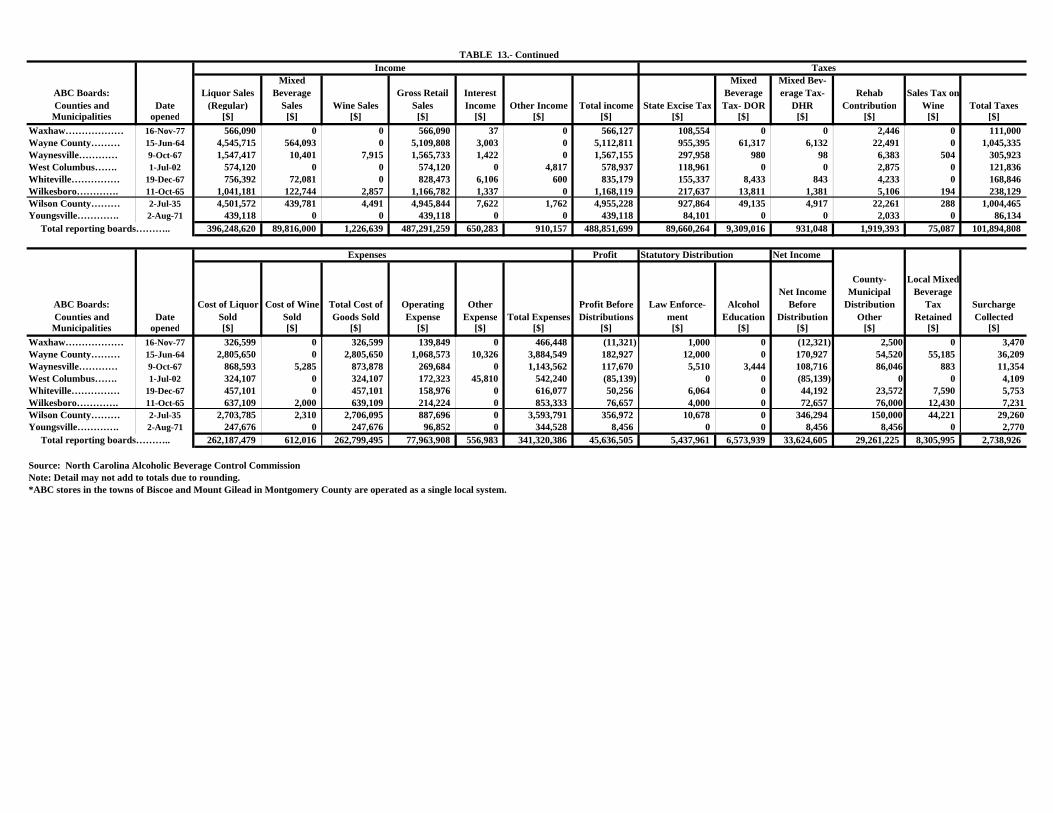
TABLE 13.- Continued Income Taxes
ABC Boards: Counties and Date
Liquor Sales (Regular)
Mixed Beverage
Sales Wine SalesGross Retail
SalesInterest Income Other Income Total income State Excise Tax
Mixed Beverage Tax- DOR
Mixed Bev-erage Tax-
DHRRehab
ContributionSales Tax on
Wine Total TaxesMunicipalities opened [$] [$] [$] [$] [$] [$] [$] [$] [$] [$] [$] [$] [$]
Waxhaw……………… 16-Nov-77 566,090 0 0 566,090 37 0 566,127 108,554 0 0 2,446 0 111,000Wayne County……… 15-Jun-64 4,545,715 564,093 0 5,109,808 3,003 0 5,112,811 955,395 61,317 6,132 22,491 0 1,045,335Waynesville………… 9-Oct-67 1,547,417 10,401 7,915 1,565,733 1,422 0 1,567,155 297,958 980 98 6,383 504 305,923West Columbus……. 1-Jul-02 574,120 0 0 574,120 0 4,817 578,937 118,961 0 0 2,875 0 121,836Whiteville…………… 19-Dec-67 756,392 72,081 0 828,473 6,106 600 835,179 155,337 8,433 843 4,233 0 168,846Wilkesboro…………. 11-Oct-65 1,041,181 122,744 2,857 1,166,782 1,337 0 1,168,119 217,637 13,811 1,381 5,106 194 238,129Wilson County……… 2-Jul-35 4,501,572 439,781 4,491 4,945,844 7,622 1,762 4,955,228 927,864 49,135 4,917 22,261 288 1,004,465Youngsville…………. 2-Aug-71 439,118 0 0 439,118 0 0 439,118 84,101 0 0 2,033 0 86,134 Total reporting boards……….. 396,248,620 89,816,000 1,226,639 487,291,259 650,283 910,157 488,851,699 89,660,264 9,309,016 931,048 1,919,393 75,087 101,894,808
Expenses Profit Statutory Distribution Net Income
ABC Boards: Counties and Date
Cost of Liquor Sold
Cost of Wine Sold
Total Cost of Goods Sold
Operating Expense
Other Expense Total Expenses
Profit Before Distributions
Law Enforce-ment
Alcohol Education
Net Income Before
Distribution
County-Municipal
Distribution Other
Local Mixed Beverage
Tax Retained
Surcharge Collected
Municipalities opened [$] [$] [$] [$] [$] [$] [$] [$] [$] [$] [$] [$] [$]Waxhaw……………… 16-Nov-77 326,599 0 326,599 139,849 0 466,448 (11,321) 1,000 0 (12,321) 2,500 0 3,470Wayne County……… 15-Jun-64 2,805,650 0 2,805,650 1,068,573 10,326 3,884,549 182,927 12,000 0 170,927 54,520 55,185 36,209Waynesville………… 9-Oct-67 868,593 5,285 873,878 269,684 0 1,143,562 117,670 5,510 3,444 108,716 86,046 883 11,354West Columbus……. 1-Jul-02 324,107 0 324,107 172,323 45,810 542,240 (85,139) 0 0 (85,139) 0 0 4,109Whiteville…………… 19-Dec-67 457,101 0 457,101 158,976 0 616,077 50,256 6,064 0 44,192 23,572 7,590 5,753Wilkesboro…………. 11-Oct-65 637,109 2,000 639,109 214,224 0 853,333 76,657 4,000 0 72,657 76,000 12,430 7,231Wilson County……… 2-Jul-35 2,703,785 2,310 2,706,095 887,696 0 3,593,791 356,972 10,678 0 346,294 150,000 44,221 29,260Youngsville…………. 2-Aug-71 247,676 0 247,676 96,852 0 344,528 8,456 0 0 8,456 8,456 0 2,770 Total reporting boards……….. 262,187,479 612,016 262,799,495 77,963,908 556,983 341,320,386 45,636,505 5,437,961 6,573,939 33,624,605 29,261,225 8,305,995 2,738,926
Source: North Carolina Alcoholic Beverage Control CommissionNote: Detail may not add to totals due to rounding.*ABC stores in the towns of Biscoe and Mount Gilead in Montgomery County are operated as a single local system.
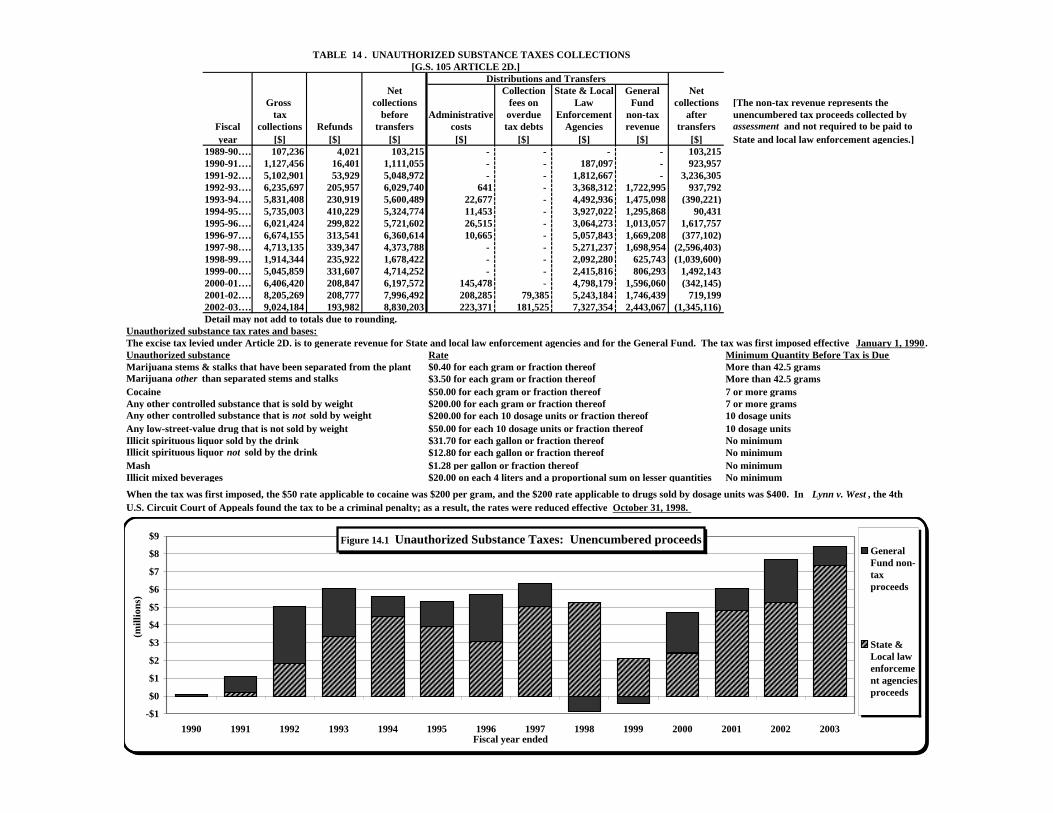
TABLE 14 . UNAUTHORIZED SUBSTANCE TAXES COLLECTIONS [G.S. 105 ARTICLE 2D.]
Distributions and TransfersNet Collection State & Local General Net
Gross collections fees on Law Fund collections [The non-tax revenue represents thetax before Administrative overdue Enforcement non-tax after unencumbered tax proceeds collected by
Fiscal collections Refunds transfers costs tax debts Agencies revenue transfers assessment and not required to be paid toyear [$] [$] [$] [$] [$] [$] [$] [$] State and local law enforcement agencies.]
1989-90…… 107,236 4,021 103,215 - - - - 103,2151990-91…… 1,127,456 16,401 1,111,055 - - 187,097 - 923,9571991-92…… 5,102,901 53,929 5,048,972 - - 1,812,667 - 3,236,3051992-93…… 6,235,697 205,957 6,029,740 641 - 3,368,312 1,722,995 937,7921993-94…… 5,831,408 230,919 5,600,489 22,677 - 4,492,936 1,475,098 (390,221)1994-95…… 5,735,003 410,229 5,324,774 11,453 - 3,927,022 1,295,868 90,4311995-96…… 6,021,424 299,822 5,721,602 26,515 - 3,064,273 1,013,057 1,617,7571996-97…… 6,674,155 313,541 6,360,614 10,665 - 5,057,843 1,669,208 (377,102)1997-98…… 4,713,135 339,347 4,373,788 - - 5,271,237 1,698,954 (2,596,403)1998-99…… 1,914,344 235,922 1,678,422 - - 2,092,280 625,743 (1,039,600)1999-00…… 5,045,859 331,607 4,714,252 - - 2,415,816 806,293 1,492,1432000-01…… 6,406,420 208,847 6,197,572 145,478 - 4,798,179 1,596,060 (342,145)2001-02…… 8,205,269 208,777 7,996,492 208,285 79,385 5,243,184 1,746,439 719,1992002-03…… 9,024,184 193,982 8,830,203 223,371 181,525 7,327,354 2,443,067 (1,345,116)Detail may not add to totals due to rounding.
Unauthorized substance tax rates and bases:The excise tax levied under Article 2D. is to generate revenue for State and local law enforcement agencies and for the General Fund. The tax was first imposed effective January 1, 1990. Unauthorized substance Rate Minimum Quantity Before Tax is DueMarijuana stems & stalks that have been separated from the plant $0.40 for each gram or fraction thereof More than 42.5 gramsMarijuana other than separated stems and stalks $3.50 for each gram or fraction thereof More than 42.5 gramsCocaine $50.00 for each gram or fraction thereof 7 or more gramsAny other controlled substance that is sold by weight $200.00 for each gram or fraction thereof 7 or more gramsAny other controlled substance that is not sold by weight $200.00 for each 10 dosage units or fraction thereof 10 dosage unitsAny low-street-value drug that is not sold by weight $50.00 for each 10 dosage units or fraction thereof 10 dosage unitsIllicit spirituous liquor sold by the drink $31.70 for each gallon or fraction thereof No minimumIllicit spirituous liquor not sold by the drink $12.80 for each gallon or fraction thereof No minimumMash $1.28 per gallon or fraction thereof No minimumIllicit mixed beverages $20.00 on each 4 liters and a proportional sum on lesser quantities No minimum
When the tax was first imposed, the $50 rate applicable to cocaine was $200 per gram, and the $200 rate applicable to drugs sold by dosage units was $400. In Lynn v. West , the 4th U.S. Circuit Court of Appeals found the tax to be a criminal penalty; as a result, the rates were reduced effective October 31, 1998.
1990 ------ 103,2151991 187,097 923,957 State & LocaGeneral Fund non-tax proceeds 1992 1,812,667 3,236,3051993 3,368,312 2,660,7881994 4,492,936 1,084,8771995 3,927,022 1,386,2991996 3,064,273 2,630,8141997 5,057,843 1,292,1061998 5,271,237 (897,449)1999 2,092,280 (413,858)2000 2,415,816 2,298,4362001 4,798,179 1,253,9152002 5,243,184 2,465,6382003 7,327,354 1,097,952
49,058,200 19,122,995
Figure 14.1 Unauthorized Substance Taxes: Unencumbered proceeds
-$1
$0
$1
$2
$3
$4
$5
$6
$7
$8
$9
1990 1991 1992 1993 1994 1995 1996 1997 1998 1999 2000 2001 2002 2003
(mill
ions
)
Fiscal year ended
GeneralFund non-taxproceeds
State &Local lawenforcement agenciesproceeds
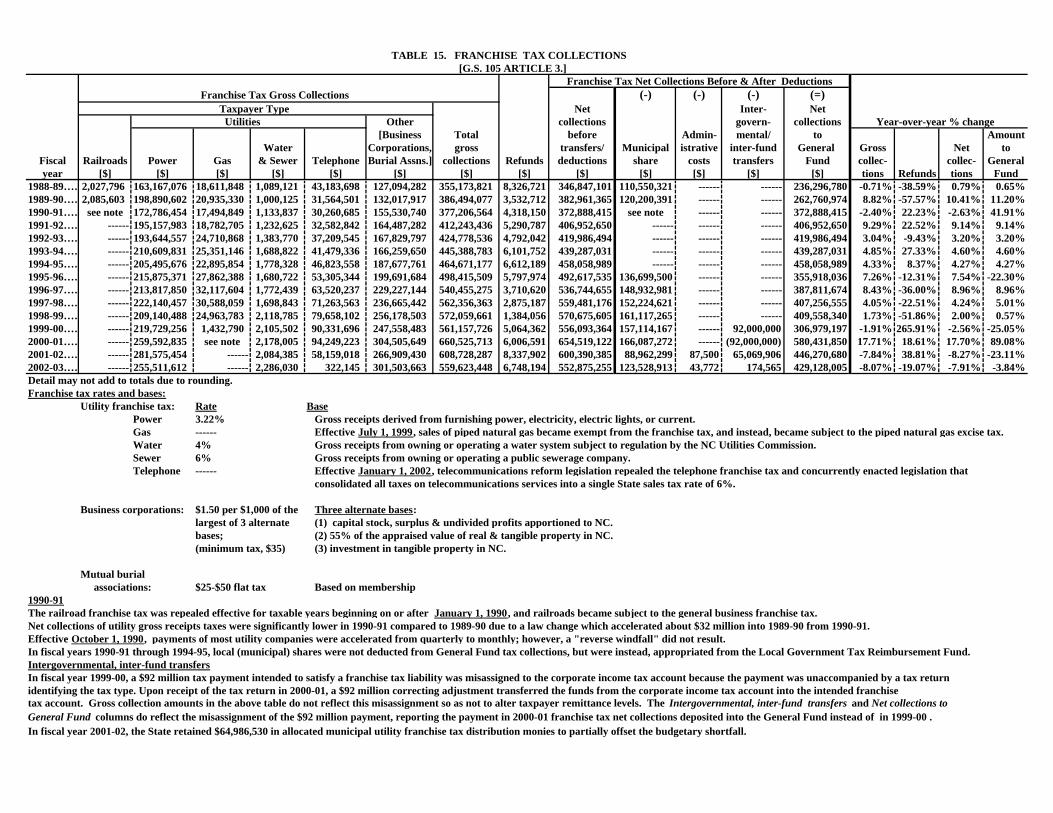
TABLE 15. FRANCHISE TAX COLLECTIONS [G.S. 105 ARTICLE 3.]
Franchise Tax Net Collections Before & After Deductions Franchise Tax Gross Collections (-) (-) (-) (=)
Taxpayer Type Net Inter- Net Utilities Other collections govern- collections Year-over-year % change
[Business Total before Admin- mental/ to AmountWater Corporations, gross transfers/ Municipal istrative inter-fund General Gross Net to
Fiscal Railroads Power Gas & Sewer Telephone Burial Assns.] collections Refunds deductions share costs transfers Fund collec- collec- Generalyear [$] [$] [$] [$] [$] [$] [$] [$] [$] [$] [$] [$] [$] tions Refunds tions Fund
1988-89……2,027,796 163,167,076 18,611,848 1,089,121 43,183,698 127,094,282 355,173,821 8,326,721 346,847,101 110,550,321 ------ ------ 236,296,780 -0.71% -38.59% 0.79% 0.65%1989-90……2,085,603 198,890,602 20,935,330 1,000,125 31,564,501 132,017,917 386,494,077 3,532,712 382,961,365 120,200,391 ------ ------ 262,760,974 8.82% -57.57% 10.41% 11.20%1990-91…… see note 172,786,454 17,494,849 1,133,837 30,260,685 155,530,740 377,206,564 4,318,150 372,888,415 see note ------ ------ 372,888,415 -2.40% 22.23% -2.63% 41.91%1991-92…… ------ 195,157,983 18,782,705 1,232,625 32,582,842 164,487,282 412,243,436 5,290,787 406,952,650 ------ ------ ------ 406,952,650 9.29% 22.52% 9.14% 9.14%1992-93…… ------ 193,644,557 24,710,868 1,383,770 37,209,545 167,829,797 424,778,536 4,792,042 419,986,494 ------ ------ ------ 419,986,494 3.04% -9.43% 3.20% 3.20%1993-94…… ------ 210,609,831 25,351,146 1,688,822 41,479,336 166,259,650 445,388,783 6,101,752 439,287,031 ------ ------ ------ 439,287,031 4.85% 27.33% 4.60% 4.60%1994-95…… ------ 205,495,676 22,895,854 1,778,328 46,823,558 187,677,761 464,671,177 6,612,189 458,058,989 ------ ------ ------ 458,058,989 4.33% 8.37% 4.27% 4.27%1995-96…… ------ 215,875,371 27,862,388 1,680,722 53,305,344 199,691,684 498,415,509 5,797,974 492,617,535 136,699,500 ------ ------ 355,918,036 7.26% -12.31% 7.54% -22.30%1996-97…… ------ 213,817,850 32,117,604 1,772,439 63,520,237 229,227,144 540,455,275 3,710,620 536,744,655 148,932,981 ------ ------ 387,811,674 8.43% -36.00% 8.96% 8.96%1997-98…… ------ 222,140,457 30,588,059 1,698,843 71,263,563 236,665,442 562,356,363 2,875,187 559,481,176 152,224,621 ------ ------ 407,256,555 4.05% -22.51% 4.24% 5.01%1998-99…… ------ 209,140,488 24,963,783 2,118,785 79,658,102 256,178,503 572,059,661 1,384,056 570,675,605 161,117,265 ------ ------ 409,558,340 1.73% -51.86% 2.00% 0.57%1999-00…… ------ 219,729,256 1,432,790 2,105,502 90,331,696 247,558,483 561,157,726 5,064,362 556,093,364 157,114,167 ------ 92,000,000 306,979,197 -1.91% 265.91% -2.56% -25.05%2000-01…… ------ 259,592,835 see note 2,178,005 94,249,223 304,505,649 660,525,713 6,006,591 654,519,122 166,087,272 ------ (92,000,000) 580,431,850 17.71% 18.61% 17.70% 89.08%2001-02…… ------ 281,575,454 ------ 2,084,385 58,159,018 266,909,430 608,728,287 8,337,902 600,390,385 88,962,299 87,500 65,069,906 446,270,680 -7.84% 38.81% -8.27% -23.11%2002-03…… ------ 255,511,612 ------ 2,286,030 322,145 301,503,663 559,623,448 6,748,194 552,875,255 123,528,913 43,772 174,565 429,128,005 -8.07% -19.07% -7.91% -3.84%Detail may not add to totals due to rounding.Franchise tax rates and bases:
Utility franchise tax: Rate BasePower 3.22% Gross receipts derived from furnishing power, electricity, electric lights, or current.Gas ------ Effective July 1, 1999, sales of piped natural gas became exempt from the franchise tax, and instead, became subject to the piped natural gas excise tax.Water 4% Gross receipts from owning or operating a water system subject to regulation by the NC Utilities Commission.Sewer 6% Gross receipts from owning or operating a public sewerage company.Telephone ------ Effective January 1, 2002, telecommunications reform legislation repealed the telephone franchise tax and concurrently enacted legislation that
consolidated all taxes on telecommunications services into a single State sales tax rate of 6%.
Business corporations: $1.50 per $1,000 of the Three alternate bases:largest of 3 alternate (1) capital stock, surplus & undivided profits apportioned to NC.bases; (2) 55% of the appraised value of real & tangible property in NC.(minimum tax, $35) (3) investment in tangible property in NC.
Mutual burial associations: $25-$50 flat tax Based on membership
1990-91The railroad franchise tax was repealed effective for taxable years beginning on or after January 1, 1990, and railroads became subject to the general business franchise tax.Net collections of utility gross receipts taxes were significantly lower in 1990-91 compared to 1989-90 due to a law change which accelerated about $32 million into 1989-90 from 1990-91.Effective October 1, 1990, payments of most utility companies were accelerated from quarterly to monthly; however, a "reverse windfall" did not result.In fiscal years 1990-91 through 1994-95, local (municipal) shares were not deducted from General Fund tax collections, but were instead, appropriated from the Local Government Tax Reimbursement Fund. Intergovernmental, inter-fund transfersIn fiscal year 1999-00, a $92 million tax payment intended to satisfy a franchise tax liability was misassigned to the corporate income tax account because the payment was unaccompanied by a tax return identifying the tax type. Upon receipt of the tax return in 2000-01, a $92 million correcting adjustment transferred the funds from the corporate income tax account into the intended franchise tax account. Gross collection amounts in the above table do not reflect this misassignment so as not to alter taxpayer remittance levels. The Intergovernmental, inter-fund transfers and Net collections to General Fund columns do reflect the misassignment of the $92 million payment, reporting the payment in 2000-01 franchise tax net collections deposited into the General Fund instead of in 1999-00 .In fiscal year 2001-02, the State retained $64,986,530 in allocated municipal utility franchise tax distribution monies to partially offset the budgetary shortfall.
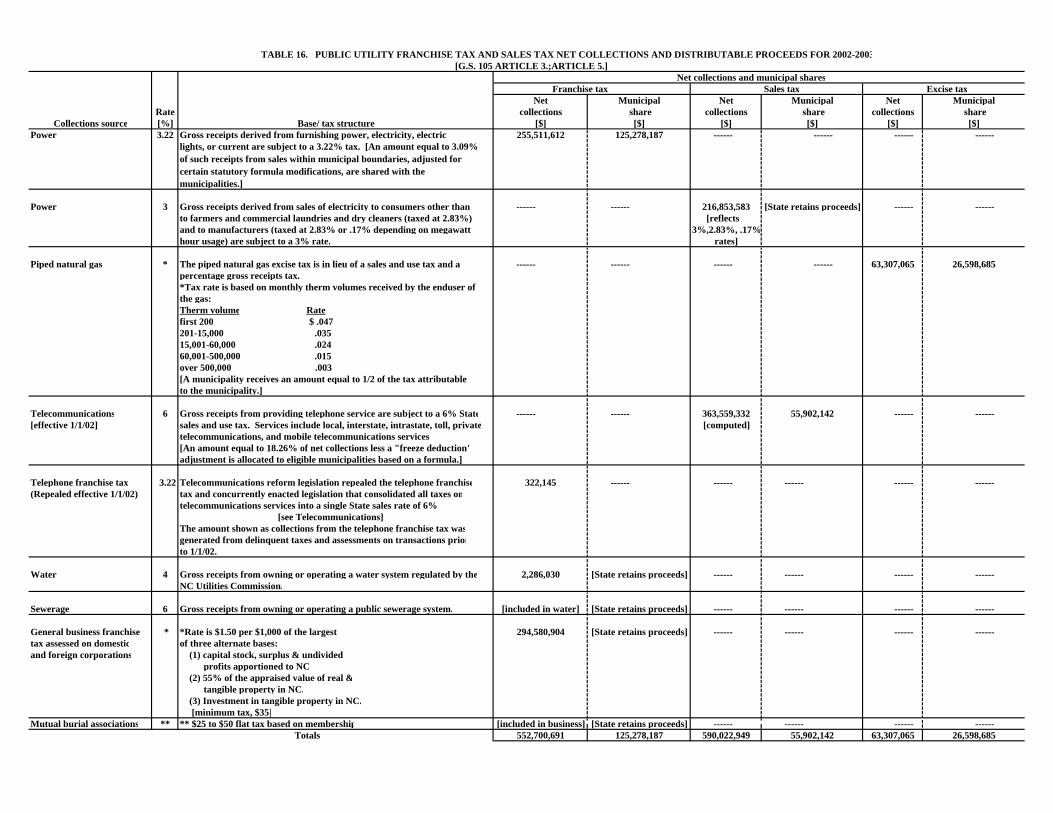
TABLE 16. PUBLIC UTILITY FRANCHISE TAX AND SALES TAX NET COLLECTIONS AND DISTRIBUTABLE PROCEEDS FOR 2002-2003 [G.S. 105 ARTICLE 3.;ARTICLE 5.]
Net collections and municipal shares Franchise tax Sales tax Excise tax
Net Municipal Net Municipal Net MunicipalRate collections share collections share collections share
Collections source [%] Base/ tax structure [$] [$] [$] [$] [$] [$]Power 3.22 Gross receipts derived from furnishing power, electricity, electric 255,511,612 125,278,187 ------ ------ ------ ------
lights, or current are subject to a 3.22% tax. [An amount equal to 3.09%of such receipts from sales within municipal boundaries, adjusted for certain statutory formula modifications, are shared with the municipalities.]
Power 3 Gross receipts derived from sales of electricity to consumers other than ------ ------ 216,853,583 [State retains proceeds] ------ ------to farmers and commercial laundries and dry cleaners (taxed at 2.83%) [reflectsand to manufacturers (taxed at 2.83% or .17% depending on megawatt- 3%,2.83%, .17%hour usage) are subject to a 3% rate. rates]
Piped natural gas * The piped natural gas excise tax is in lieu of a sales and use tax and a ------ ------ ------ ------ 63,307,065 26,598,685percentage gross receipts tax.*Tax rate is based on monthly therm volumes received by the enduser of the gas:Therm volume Ratefirst 200 $ .047201-15,000 .03515,001-60,000 .02460,001-500,000 .015over 500,000 .003[A municipality receives an amount equal to 1/2 of the tax attributable to the municipality.]
Telecommunications 6 Gross receipts from providing telephone service are subject to a 6% State ------ ------ 363,559,332 55,902,142 ------ ------[effective 1/1/02] sales and use tax. Services include local, interstate, intrastate, toll, private [computed]
telecommunications, and mobile telecommunications services[An amount equal to 18.26% of net collections less a "freeze deduction"adjustment is allocated to eligible municipalities based on a formula.]
Telephone franchise tax 3.22 Telecommunications reform legislation repealed the telephone franchise 322,145 ------ ------ ------ ------ ------(Repealed effective 1/1/02) tax and concurrently enacted legislation that consolidated all taxes on
telecommunications services into a single State sales rate of 6%. [see Telecommunications]The amount shown as collections from the telephone franchise tax wasgenerated from delinquent taxes and assessments on transactions priorto 1/1/02.
Water 4 Gross receipts from owning or operating a water system regulated by the 2,286,030 [State retains proceeds] ------ ------ ------ ------NC Utilities Commission.
Sewerage 6 Gross receipts from owning or operating a public sewerage system. [included in water] [State retains proceeds] ------ ------ ------ ------
General business franchise * *Rate is $1.50 per $1,000 of the largest 294,580,904 [State retains proceeds] ------ ------ ------ ------tax assessed on domestic of three alternate bases:and foreign corporations (1) capital stock, surplus & undivided
profits apportioned to NC. (2) 55% of the appraised value of real & tangible property in NC. (3) Investment in tangible property in NC. [minimum tax, $35]
Mutual burial associations ** ** $25 to $50 flat tax based on membership [included in business] [State retains proceeds] ------ ------ ------ ------ Totals 552,700,691 125,278,187 590,022,949 55,902,142 63,307,065 26,598,685
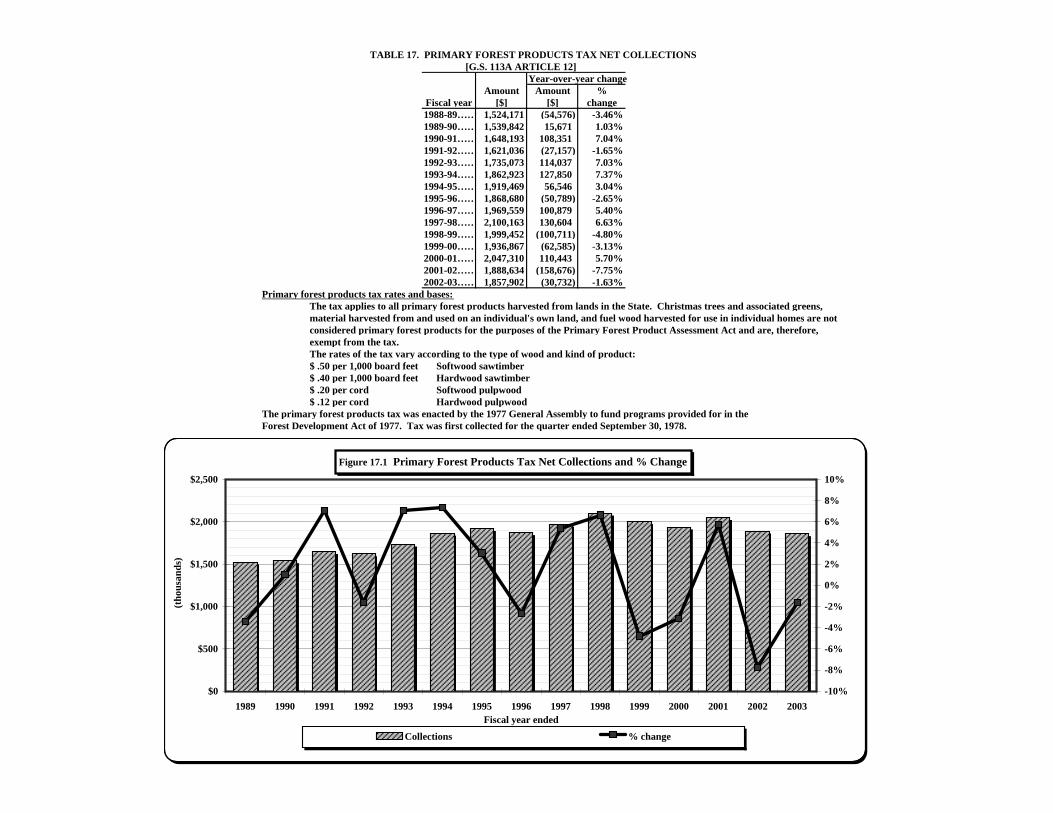
TABLE 17. PRIMARY FOREST PRODUCTS TAX NET COLLECTIONS [G.S. 113A ARTICLE 12]
Year-over-year changeAmount Amount %
Fiscal year [$] [$] change1988-89…… 1,524,171 (54,576) -3.46%1989-90…… 1,539,842 15,671 1.03%1990-91…… 1,648,193 108,351 7.04%1991-92…… 1,621,036 (27,157) -1.65%1992-93…… 1,735,073 114,037 7.03%1993-94…… 1,862,923 127,850 7.37%1994-95…… 1,919,469 56,546 3.04%1995-96…… 1,868,680 (50,789) -2.65%1996-97…… 1,969,559 100,879 5.40%1997-98…… 2,100,163 130,604 6.63%1998-99…… 1,999,452 (100,711) -4.80%1999-00…… 1,936,867 (62,585) -3.13%2000-01…… 2,047,310 110,443 5.70%2001-02…… 1,888,634 (158,676) -7.75%2002-03…… 1,857,902 (30,732) -1.63%
Primary forest products tax rates and bases:The tax applies to all primary forest products harvested from lands in the State. Christmas trees and associated greens, material harvested from and used on an individual's own land, and fuel wood harvested for use in individual homes are notconsidered primary forest products for the purposes of the Primary Forest Product Assessment Act and are, therefore,exempt from the tax.The rates of the tax vary according to the type of wood and kind of product:$ .50 per 1,000 board feet Softwood sawtimber$ .40 per 1,000 board feet Hardwood sawtimber$ .20 per cord Softwood pulpwood$ .12 per cord Hardwood pulpwood
The primary forest products tax was enacted by the 1977 General Assembly to fund programs provided for in theForest Development Act of 1977. Tax was first collected for the quarter ended September 30, 1978.
Collections % change1989 $1,524,171 -3.46%1990 1,539,842 1.03%1991 1,648,193 7.04%1992 1,621,036 -1.65%1993 1,735,073 7.03%1994 1,862,923 7.37%1995 1,919,469 3.04%1996 1,868,680 -2.65%1997 1,969,559 5.40%1998 2,100,163 6.63%1999 1,999,452 -4.80%2000 1,936,867 -3.13%2001 2,047,310 5.70%2002 1,888,634 -7.75%2003 1,857,902 -1.63%
Figure 17.1 Primary Forest Products Tax Net Collections and % Change
$0
$500
$1,000
$1,500
$2,000
$2,500
1989 1990 1991 1992 1993 1994 1995 1996 1997 1998 1999 2000 2001 2002 2003
(tho
usan
ds)
Fiscal year ended
-10%
-8%
-6%
-4%
-2%
0%
2%
4%
6%
8%
10%
Collections % change
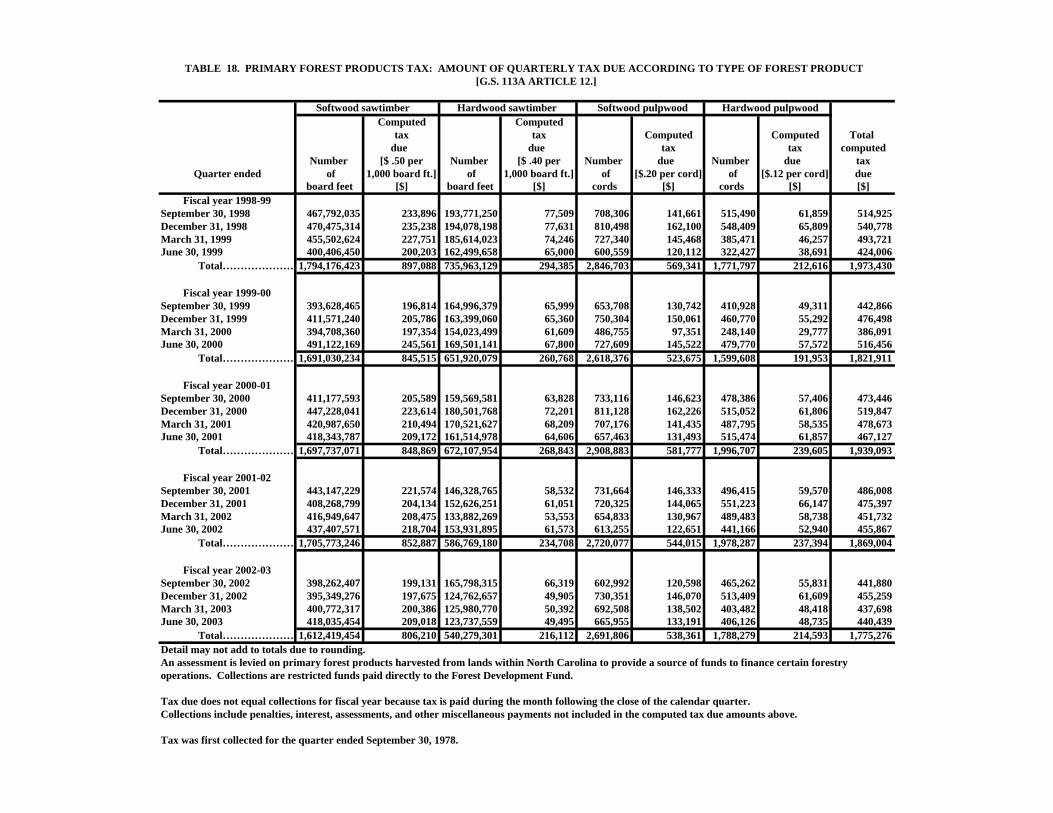
TABLE 18. PRIMARY FOREST PRODUCTS TAX: AMOUNT OF QUARTERLY TAX DUE ACCORDING TO TYPE OF FOREST PRODUCT [G.S. 113A ARTICLE 12.]
Softwood sawtimber Hardwood sawtimber Softwood pulpwood Hardwood pulpwoodComputed Computed
tax tax Computed Computed Total due due tax tax computed
Number [$ .50 per Number [$ .40 per Number due Number due taxQuarter ended of 1,000 board ft.] of 1,000 board ft.] of [$.20 per cord] of [$.12 per cord] due
board feet [$] board feet [$] cords [$] cords [$] [$]Fiscal year 1998-99
September 30, 1998 467,792,035 233,896 193,771,250 77,509 708,306 141,661 515,490 61,859 514,925December 31, 1998 470,475,314 235,238 194,078,198 77,631 810,498 162,100 548,409 65,809 540,778March 31, 1999 455,502,624 227,751 185,614,023 74,246 727,340 145,468 385,471 46,257 493,721June 30, 1999 400,406,450 200,203 162,499,658 65,000 600,559 120,112 322,427 38,691 424,006 Total…………………1,794,176,423 897,088 735,963,129 294,385 2,846,703 569,341 1,771,797 212,616 1,973,430
Fiscal year 1999-00September 30, 1999 393,628,465 196,814 164,996,379 65,999 653,708 130,742 410,928 49,311 442,866December 31, 1999 411,571,240 205,786 163,399,060 65,360 750,304 150,061 460,770 55,292 476,498March 31, 2000 394,708,360 197,354 154,023,499 61,609 486,755 97,351 248,140 29,777 386,091June 30, 2000 491,122,169 245,561 169,501,141 67,800 727,609 145,522 479,770 57,572 516,456 Total…………………1,691,030,234 845,515 651,920,079 260,768 2,618,376 523,675 1,599,608 191,953 1,821,911
Fiscal year 2000-01September 30, 2000 411,177,593 205,589 159,569,581 63,828 733,116 146,623 478,386 57,406 473,446December 31, 2000 447,228,041 223,614 180,501,768 72,201 811,128 162,226 515,052 61,806 519,847March 31, 2001 420,987,650 210,494 170,521,627 68,209 707,176 141,435 487,795 58,535 478,673June 30, 2001 418,343,787 209,172 161,514,978 64,606 657,463 131,493 515,474 61,857 467,127 Total…………………1,697,737,071 848,869 672,107,954 268,843 2,908,883 581,777 1,996,707 239,605 1,939,093
Fiscal year 2001-02September 30, 2001 443,147,229 221,574 146,328,765 58,532 731,664 146,333 496,415 59,570 486,008December 31, 2001 408,268,799 204,134 152,626,251 61,051 720,325 144,065 551,223 66,147 475,397March 31, 2002 416,949,647 208,475 133,882,269 53,553 654,833 130,967 489,483 58,738 451,732June 30, 2002 437,407,571 218,704 153,931,895 61,573 613,255 122,651 441,166 52,940 455,867 Total…………………1,705,773,246 852,887 586,769,180 234,708 2,720,077 544,015 1,978,287 237,394 1,869,004
Fiscal year 2002-03September 30, 2002 398,262,407 199,131 165,798,315 66,319 602,992 120,598 465,262 55,831 441,880December 31, 2002 395,349,276 197,675 124,762,657 49,905 730,351 146,070 513,409 61,609 455,259March 31, 2003 400,772,317 200,386 125,980,770 50,392 692,508 138,502 403,482 48,418 437,698June 30, 2003 418,035,454 209,018 123,737,559 49,495 665,955 133,191 406,126 48,735 440,439 Total…………………1,612,419,454 806,210 540,279,301 216,112 2,691,806 538,361 1,788,279 214,593 1,775,276Detail may not add to totals due to rounding.An assessment is levied on primary forest products harvested from lands within North Carolina to provide a source of funds to finance certain forestryoperations. Collections are restricted funds paid directly to the Forest Development Fund.
Tax due does not equal collections for fiscal year because tax is paid during the month following the close of the calendar quarter.Collections include penalties, interest, assessments, and other miscellaneous payments not included in the computed tax due amounts above.
Tax was first collected for the quarter ended September 30, 1978.
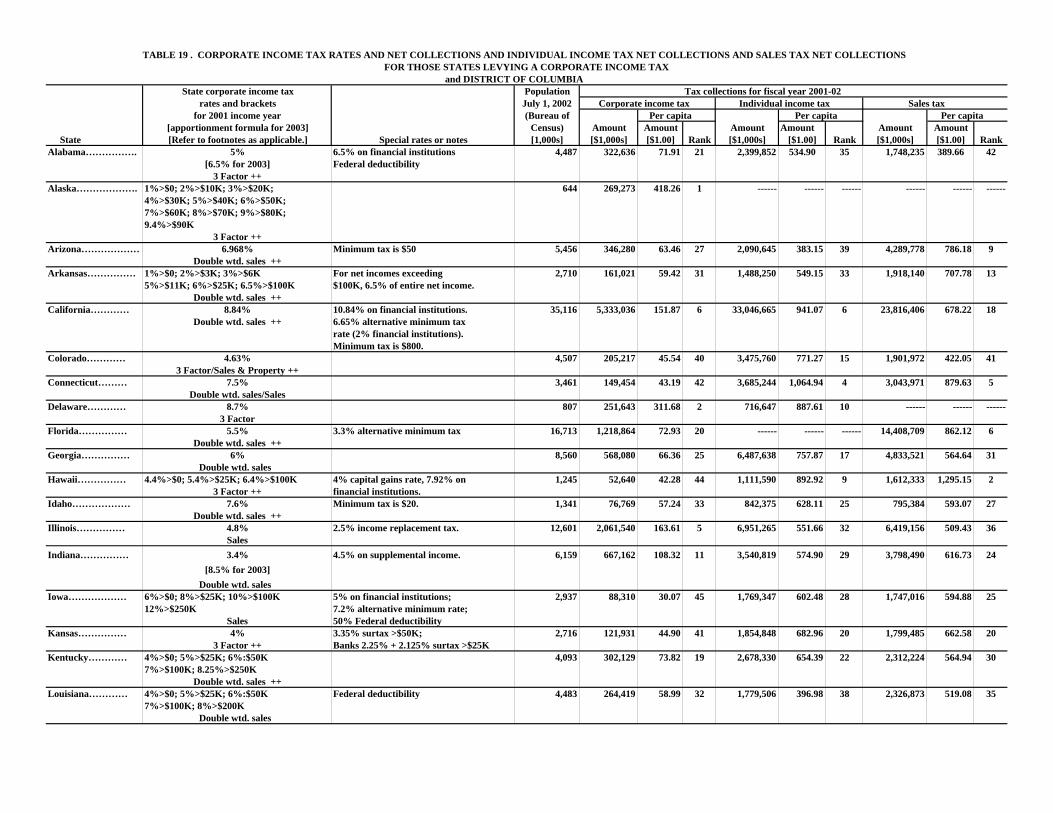
TABLE 19 . CORPORATE INCOME TAX RATES AND NET COLLECTIONS AND INDIVIDUAL INCOME TAX NET COLLECTIONS AND SALES TAX NET COLLECTIONS FOR THOSE STATES LEVYING A CORPORATE INCOME TAX and DISTRICT OF COLUMBIA
State corporate income tax Population Tax collections for fiscal year 2001-02rates and brackets July 1, 2002 Corporate income tax Individual income tax Sales tax
for 2001 income year (Bureau of Per capita Per capita Per capita[apportionment formula for 2003] Census) Amount Amount Amount Amount Amount Amount
State [Refer to footnotes as applicable.] Special rates or notes [1,000s] [$1,000s] [$1.00] Rank [$1,000s] [$1.00] Rank [$1,000s] [$1.00] RankAlabama……………. 5% 6.5% on financial institutions 4,487 322,636 71.91 21 2,399,852 534.90 35 1,748,235 389.66 42
[6.5% for 2003] Federal deductibility3 Factor ++
Alaska………………. 1%>$0; 2%>$10K; 3%>$20K; 644 269,273 418.26 1 ------ ------ ------ ------ ------ ------4%>$30K; 5%>$40K; 6%>$50K;7%>$60K; 8%>$70K; 9%>$80K;9.4%>$90K
3 Factor ++Arizona……………… 6.968% Minimum tax is $50 5,456 346,280 63.46 27 2,090,645 383.15 39 4,289,778 786.18 9
Double wtd. sales ++Arkansas…………… 1%>$0; 2%>$3K; 3%>$6K For net incomes exceeding 2,710 161,021 59.42 31 1,488,250 549.15 33 1,918,140 707.78 13
5%>$11K; 6%>$25K; 6.5%>$100K $100K, 6.5% of entire net income.Double wtd. sales ++
California………… 8.84% 10.84% on financial institutions. 35,116 5,333,036 151.87 6 33,046,665 941.07 6 23,816,406 678.22 18Double wtd. sales ++ 6.65% alternative minimum tax
rate (2% financial institutions).Minimum tax is $800.
Colorado………… 4.63% 4,507 205,217 45.54 40 3,475,760 771.27 15 1,901,972 422.05 413 Factor/Sales & Property ++
Connecticut……… 7.5% 3,461 149,454 43.19 42 3,685,244 1,064.94 4 3,043,971 879.63 5Double wtd. sales/Sales
Delaware………… 8.7% 807 251,643 311.68 2 716,647 887.61 10 ------ ------ ------3 Factor
Florida…………… 5.5% 3.3% alternative minimum tax 16,713 1,218,864 72.93 20 ------ ------ ------ 14,408,709 862.12 6Double wtd. sales ++
Georgia…………… 6% 8,560 568,080 66.36 25 6,487,638 757.87 17 4,833,521 564.64 31Double wtd. sales
Hawaii…………… 4.4%>$0; 5.4%>$25K; 6.4%>$100K 4% capital gains rate, 7.92% on 1,245 52,640 42.28 44 1,111,590 892.92 9 1,612,333 1,295.15 23 Factor ++ financial institutions.
Idaho……………… 7.6% Minimum tax is $20. 1,341 76,769 57.24 33 842,375 628.11 25 795,384 593.07 27Double wtd. sales ++
Illinois…………… 4.8% 2.5% income replacement tax. 12,601 2,061,540 163.61 5 6,951,265 551.66 32 6,419,156 509.43 36Sales
Indiana…………… 3.4% 4.5% on supplemental income. 6,159 667,162 108.32 11 3,540,819 574.90 29 3,798,490 616.73 24[8.5% for 2003]
Double wtd. sales Iowa……………… 6%>$0; 8%>$25K; 10%>$100K 5% on financial institutions; 2,937 88,310 30.07 45 1,769,347 602.48 28 1,747,016 594.88 25
12%>$250K 7.2% alternative minimum rate;Sales 50% Federal deductibility
Kansas…………… 4% 3.35% surtax >$50K; 2,716 121,931 44.90 41 1,854,848 682.96 20 1,799,485 662.58 203 Factor ++ Banks 2.25% + 2.125% surtax >$25K
Kentucky………… 4%>$0; 5%>$25K; 6%:$50K 4,093 302,129 73.82 19 2,678,330 654.39 22 2,312,224 564.94 307%>$100K; 8.25%>$250K
Double wtd. sales ++Louisiana………… 4%>$0; 5%>$25K; 6%:$50K Federal deductibility 4,483 264,419 58.99 32 1,779,506 396.98 38 2,326,873 519.08 35
7%>$100K; 8%>$200KDouble wtd. sales
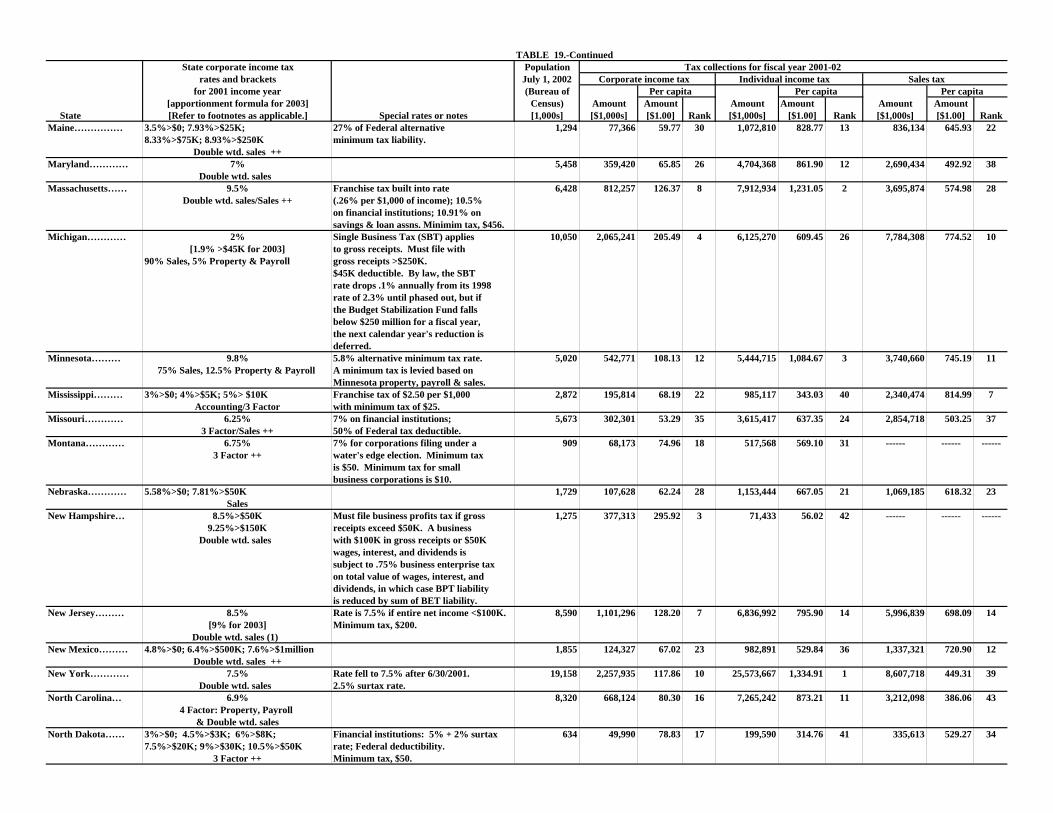
TABLE 19.-ContinuedState corporate income tax Population Tax collections for fiscal year 2001-02
rates and brackets July 1, 2002 Corporate income tax Individual income tax Sales tax for 2001 income year (Bureau of Per capita Per capita Per capita
[apportionment formula for 2003] Census) Amount Amount Amount Amount Amount Amount State [Refer to footnotes as applicable.] Special rates or notes [1,000s] [$1,000s] [$1.00] Rank [$1,000s] [$1.00] Rank [$1,000s] [$1.00] RankMaine…………… 3.5%>$0; 7.93%>$25K; 27% of Federal alternative 1,294 77,366 59.77 30 1,072,810 828.77 13 836,134 645.93 22
8.33%>$75K; 8.93%>$250K minimum tax liability.Double wtd. sales ++
Maryland………… 7% 5,458 359,420 65.85 26 4,704,368 861.90 12 2,690,434 492.92 38Double wtd. sales
Massachusetts…… 9.5% Franchise tax built into rate 6,428 812,257 126.37 8 7,912,934 1,231.05 2 3,695,874 574.98 28Double wtd. sales/Sales ++ (.26% per $1,000 of income); 10.5%
on financial institutions; 10.91% onsavings & loan assns. Minimim tax, $456.
Michigan………… 2% Single Business Tax (SBT) applies 10,050 2,065,241 205.49 4 6,125,270 609.45 26 7,784,308 774.52 10[1.9% >$45K for 2003] to gross receipts. Must file with
90% Sales, 5% Property & Payroll gross receipts >$250K. $45K deductible. By law, the SBTrate drops .1% annually from its 1998rate of 2.3% until phased out, but ifthe Budget Stabilization Fund fallsbelow $250 million for a fiscal year,the next calendar year's reduction isdeferred.
Minnesota……… 9.8% 5.8% alternative minimum tax rate. 5,020 542,771 108.13 12 5,444,715 1,084.67 3 3,740,660 745.19 1175% Sales, 12.5% Property & Payroll A minimum tax is levied based on
Minnesota property, payroll & sales.Mississippi……… 3%>$0; 4%>$5K; 5%> $10K Franchise tax of $2.50 per $1,000 2,872 195,814 68.19 22 985,117 343.03 40 2,340,474 814.99 7
Accounting/3 Factor with minimum tax of $25.Missouri………… 6.25% 7% on financial institutions; 5,673 302,301 53.29 35 3,615,417 637.35 24 2,854,718 503.25 37
3 Factor/Sales ++ 50% of Federal tax deductible.Montana………… 6.75% 7% for corporations filing under a 909 68,173 74.96 18 517,568 569.10 31 ------ ------ ------
3 Factor ++ water's edge election. Minimum taxis $50. Minimum tax for smallbusiness corporations is $10.
Nebraska………… 5.58%>$0; 7.81%>$50K 1,729 107,628 62.24 28 1,153,444 667.05 21 1,069,185 618.32 23Sales
New Hampshire… 8.5%>$50K Must file business profits tax if gross 1,275 377,313 295.92 3 71,433 56.02 42 ------ ------ ------9.25%>$150K receipts exceed $50K. A business
Double wtd. sales with $100K in gross receipts or $50Kwages, interest, and dividends issubject to .75% business enterprise taxon total value of wages, interest, anddividends, in which case BPT liabilityis reduced by sum of BET liability.
New Jersey……… 8.5% Rate is 7.5% if entire net income <$100K. 8,590 1,101,296 128.20 7 6,836,992 795.90 14 5,996,839 698.09 14[9% for 2003] Minimum tax, $200.
Double wtd. sales (1) New Mexico……… 4.8%>$0; 6.4%>$500K; 7.6%>$1million 1,855 124,327 67.02 23 982,891 529.84 36 1,337,321 720.90 12
Double wtd. sales ++New York………… 7.5% Rate fell to 7.5% after 6/30/2001. 19,158 2,257,935 117.86 10 25,573,667 1,334.91 1 8,607,718 449.31 39
Double wtd. sales 2.5% surtax rate.North Carolina… 6.9% 8,320 668,124 80.30 16 7,265,242 873.21 11 3,212,098 386.06 43
4 Factor: Property, Payroll & Double wtd. sales
North Dakota…… 3%>$0; 4.5%>$3K; 6%>$8K; Financial institutions: 5% + 2% surtax 634 49,990 78.83 17 199,590 314.76 41 335,613 529.27 347.5%>$20K; 9%>$30K; 10.5%>$50K rate; Federal deductibility.
3 Factor ++ Minimum tax, $50.
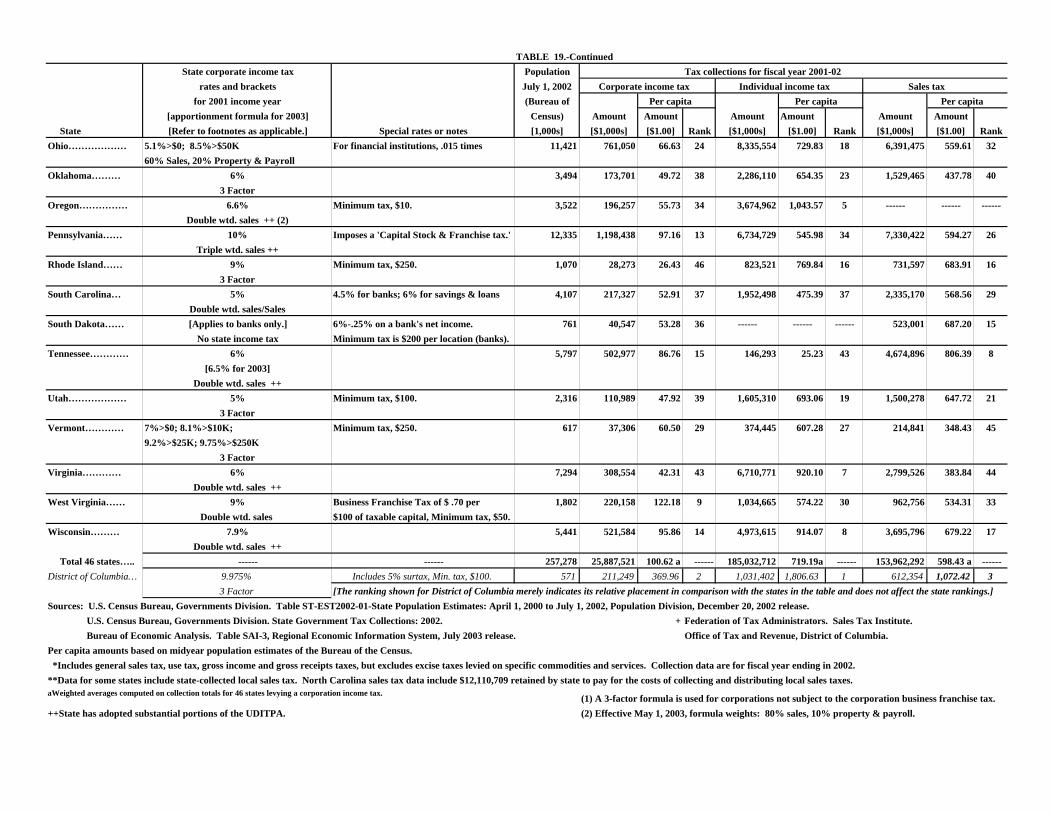
TABLE 19.-ContinuedState corporate income tax Population Tax collections for fiscal year 2001-02
rates and brackets July 1, 2002 Corporate income tax Individual income tax Sales tax for 2001 income year (Bureau of Per capita Per capita Per capita
[apportionment formula for 2003] Census) Amount Amount Amount Amount Amount Amount State [Refer to footnotes as applicable.] Special rates or notes [1,000s] [$1,000s] [$1.00] Rank [$1,000s] [$1.00] Rank [$1,000s] [$1.00] RankOhio……………… 5.1%>$0; 8.5%>$50K For financial institutions, .015 times 11,421 761,050 66.63 24 8,335,554 729.83 18 6,391,475 559.61 32
60% Sales, 20% Property & PayrollOklahoma……… 6% 3,494 173,701 49.72 38 2,286,110 654.35 23 1,529,465 437.78 40
3 FactorOregon…………… 6.6% Minimum tax, $10. 3,522 196,257 55.73 34 3,674,962 1,043.57 5 ------ ------ ------
Double wtd. sales ++ (2)Pennsylvania…… 10% Imposes a 'Capital Stock & Franchise tax.' 12,335 1,198,438 97.16 13 6,734,729 545.98 34 7,330,422 594.27 26
Triple wtd. sales ++Rhode Island…… 9% Minimum tax, $250. 1,070 28,273 26.43 46 823,521 769.84 16 731,597 683.91 16
3 FactorSouth Carolina… 5% 4.5% for banks; 6% for savings & loans 4,107 217,327 52.91 37 1,952,498 475.39 37 2,335,170 568.56 29
Double wtd. sales/SalesSouth Dakota…… [Applies to banks only.] 6%-.25% on a bank's net income. 761 40,547 53.28 36 ------ ------ ------ 523,001 687.20 15
No state income tax Minimum tax is $200 per location (banks).Tennessee………… 6% 5,797 502,977 86.76 15 146,293 25.23 43 4,674,896 806.39 8
[6.5% for 2003]Double wtd. sales ++
Utah……………… 5% Minimum tax, $100. 2,316 110,989 47.92 39 1,605,310 693.06 19 1,500,278 647.72 213 Factor
Vermont………… 7%>$0; 8.1%>$10K; Minimum tax, $250. 617 37,306 60.50 29 374,445 607.28 27 214,841 348.43 459.2%>$25K; 9.75%>$250K
3 FactorVirginia………… 6% 7,294 308,554 42.31 43 6,710,771 920.10 7 2,799,526 383.84 44
Double wtd. sales ++West Virginia…… 9% Business Franchise Tax of $ .70 per 1,802 220,158 122.18 9 1,034,665 574.22 30 962,756 534.31 33
Double wtd. sales $100 of taxable capital, Minimum tax, $50.Wisconsin……… 7.9% 5,441 521,584 95.86 14 4,973,615 914.07 8 3,695,796 679.22 17
Double wtd. sales ++ Total 46 states….. ------ ------ 257,278 25,887,521 100.62 a ------ 185,032,712 719.19a ------ 153,962,292 598.43 a ------District of Columbia… 9.975% Includes 5% surtax, Min. tax, $100. 571 211,249 369.96 2 1,031,402 1,806.63 1 612,354 1,072.42 3
3 Factor [The ranking shown for District of Columbia merely indicates its relative placement in comparison with the states in the table and does not affect the state rankings.]Sources: U.S. Census Bureau, Governments Division. Table ST-EST2002-01-State Population Estimates: April 1, 2000 to July 1, 2002, Population Division, December 20, 2002 release. U.S. Census Bureau, Governments Division. State Government Tax Collections: 2002. + Federation of Tax Administrators. Sales Tax Institute. Bureau of Economic Analysis. Table SAI-3, Regional Economic Information System, July 2003 release. Office of Tax and Revenue, District of Columbia.Per capita amounts based on midyear population estimates of the Bureau of the Census. *Includes general sales tax, use tax, gross income and gross receipts taxes, but excludes excise taxes levied on specific commodities and services. Collection data are for fiscal year ending in 2002.**Data for some states include state-collected local sales tax. North Carolina sales tax data include $12,110,709 retained by state to pay for the costs of collecting and distributing local sales taxes. aWeighted averages computed on collection totals for 46 states levying a corporation income tax. (1) A 3-factor formula is used for corporations not subject to the corporation business franchise tax.++State has adopted substantial portions of the UDITPA. (2) Effective May 1, 2003, formula weights: 80% sales, 10% property & payroll.
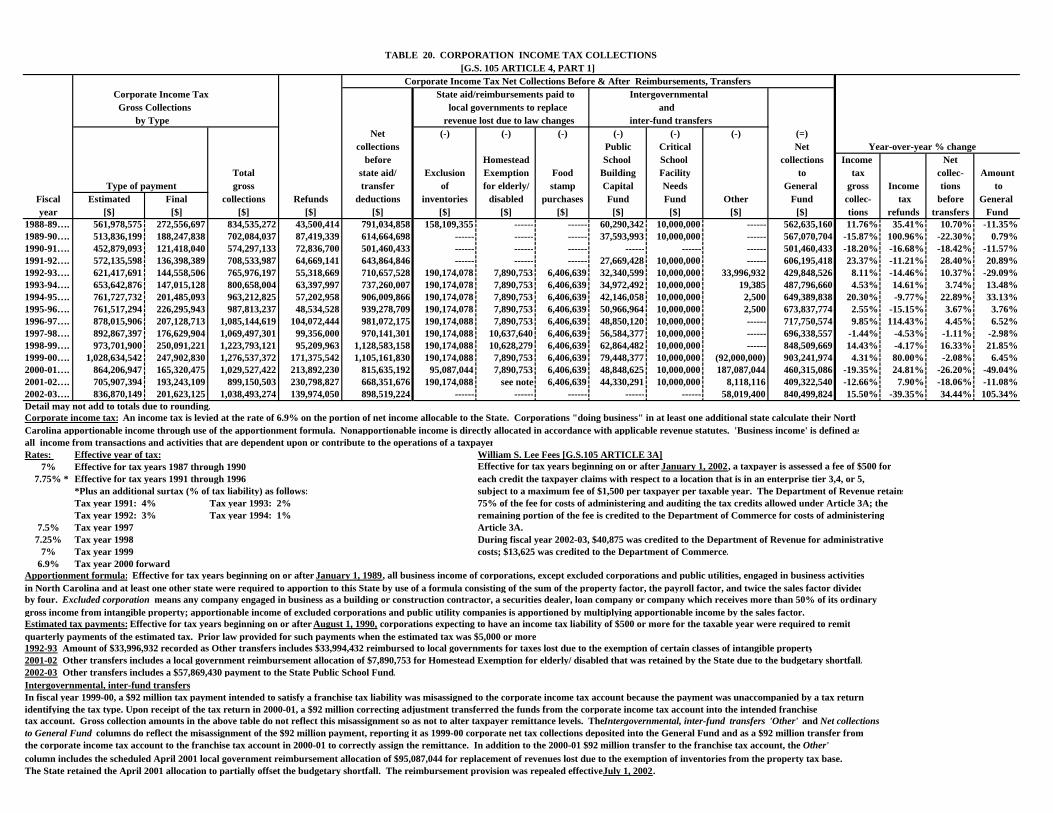
TABLE 20. CORPORATION INCOME TAX COLLECTIONS [G.S. 105 ARTICLE 4, PART 1]
Corporate Income Tax Net Collections Before & After Reimbursements, Transfers Corporate Income Tax State aid/reimbursements paid to Intergovernmental Gross Collections local governments to replace and by Type revenue lost due to law changes inter-fund transfers
Net (-) (-) (-) (-) (-) (-) (=)collections Public Critical Net Year-over-year % change
before Homestead School School collections Income NetTotal state aid/ Exclusion Exemption Food Building Facility to tax collec- Amount
Type of payment gross transfer of for elderly/ stamp Capital Needs General gross Income tions toFiscal Estimated Final collections Refunds deductions inventories disabled purchases Fund Fund Other Fund collec- tax before General year [$] [$] [$] [$] [$] [$] [$] [$] [$] [$] [$] [$] tions refunds transfers Fund
1988-89…. 561,978,575 272,556,697 834,535,272 43,500,414 791,034,858 158,109,355 ------ ------ 60,290,342 10,000,000 ------ 562,635,160 11.76% 35.41% 10.70% -11.35%1989-90…. 513,836,199 188,247,838 702,084,037 87,419,339 614,664,698 ------ ------ ------ 37,593,993 10,000,000 ------ 567,070,704 -15.87% 100.96% -22.30% 0.79%1990-91…. 452,879,093 121,418,040 574,297,133 72,836,700 501,460,433 ------ ------ ------ ------ ------ ------ 501,460,433 -18.20% -16.68% -18.42% -11.57%1991-92…. 572,135,598 136,398,389 708,533,987 64,669,141 643,864,846 ------ ------ ------ 27,669,428 10,000,000 ------ 606,195,418 23.37% -11.21% 28.40% 20.89%1992-93…. 621,417,691 144,558,506 765,976,197 55,318,669 710,657,528 190,174,078 7,890,753 6,406,639 32,340,599 10,000,000 33,996,932 429,848,526 8.11% -14.46% 10.37% -29.09%1993-94…. 653,642,876 147,015,128 800,658,004 63,397,997 737,260,007 190,174,078 7,890,753 6,406,639 34,972,492 10,000,000 19,385 487,796,660 4.53% 14.61% 3.74% 13.48%1994-95…. 761,727,732 201,485,093 963,212,825 57,202,958 906,009,866 190,174,078 7,890,753 6,406,639 42,146,058 10,000,000 2,500 649,389,838 20.30% -9.77% 22.89% 33.13%1995-96…. 761,517,294 226,295,943 987,813,237 48,534,528 939,278,709 190,174,078 7,890,753 6,406,639 50,966,964 10,000,000 2,500 673,837,774 2.55% -15.15% 3.67% 3.76%1996-97…. 878,015,906 207,128,713 1,085,144,619 104,072,444 981,072,175 190,174,088 7,890,753 6,406,639 48,850,120 10,000,000 ------ 717,750,574 9.85% 114.43% 4.45% 6.52%1997-98…. 892,867,397 176,629,904 1,069,497,301 99,356,000 970,141,301 190,174,088 10,637,640 6,406,639 56,584,377 10,000,000 ------ 696,338,557 -1.44% -4.53% -1.11% -2.98%1998-99…. 973,701,900 250,091,221 1,223,793,121 95,209,963 1,128,583,158 190,174,088 10,628,279 6,406,639 62,864,482 10,000,000 ------ 848,509,669 14.43% -4.17% 16.33% 21.85%1999-00…. 1,028,634,542 247,902,830 1,276,537,372 171,375,542 1,105,161,830 190,174,088 7,890,753 6,406,639 79,448,377 10,000,000 (92,000,000) 903,241,974 4.31% 80.00% -2.08% 6.45%2000-01…. 864,206,947 165,320,475 1,029,527,422 213,892,230 815,635,192 95,087,044 7,890,753 6,406,639 48,848,625 10,000,000 187,087,044 460,315,086 -19.35% 24.81% -26.20% -49.04%2001-02…. 705,907,394 193,243,109 899,150,503 230,798,827 668,351,676 190,174,088 see note 6,406,639 44,330,291 10,000,000 8,118,116 409,322,540 -12.66% 7.90% -18.06% -11.08%2002-03…. 836,870,149 201,623,125 1,038,493,274 139,974,050 898,519,224 ------ ------ ------ ------ ------ 58,019,400 840,499,824 15.50% -39.35% 34.44% 105.34%Detail may not add to totals due to rounding.Corporate income tax: An income tax is levied at the rate of 6.9% on the portion of net income allocable to the State. Corporations "doing business" in at least one additional state calculate their NorthCarolina apportionable income through use of the apportionment formula. Nonapportionable income is directly allocated in accordance with applicable revenue statutes. 'Business income' is defined asall income from transactions and activities that are dependent upon or contribute to the operations of a taxpayerRates: Effective year of tax: William S. Lee Fees [G.S.105 ARTICLE 3A]
7% Effective for tax years 1987 through 1990 Effective for tax years beginning on or after January 1, 2002, a taxpayer is assessed a fee of $500 for 7.75% * Effective for tax years 1991 through 1996 each credit the taxpayer claims with respect to a location that is in an enterprise tier 3,4, or 5,
*Plus an additional surtax (% of tax liability) as follows: subject to a maximum fee of $1,500 per taxpayer per taxable year. The Department of Revenue retainsTax year 1991: 4% Tax year 1993: 2% 75% of the fee for costs of administering and auditing the tax credits allowed under Article 3A; the Tax year 1992: 3% Tax year 1994: 1% remaining portion of the fee is credited to the Department of Commerce for costs of administering
7.5% Tax year 1997 Article 3A. 7.25% Tax year 1998 During fiscal year 2002-03, $40,875 was credited to the Department of Revenue for administrative
7% Tax year 1999 costs; $13,625 was credited to the Department of Commerce.6.9% Tax year 2000 forward
Apportionment formula: Effective for tax years beginning on or after January 1, 1989, all business income of corporations, except excluded corporations and public utilities, engaged in business activitiesin North Carolina and at least one other state were required to apportion to this State by use of a formula consisting of the sum of the property factor, the payroll factor, and twice the sales factor dividedby four. Excluded corporation means any company engaged in business as a building or construction contractor, a securities dealer, loan company or company which receives more than 50% of its ordinarygross income from intangible property; apportionable income of excluded corporations and public utility companies is apportioned by multiplying apportionable income by the sales factor. Estimated tax payments: Effective for tax years beginning on or after August 1, 1990, corporations expecting to have an income tax liability of $500 or more for the taxable year were required to remitquarterly payments of the estimated tax. Prior law provided for such payments when the estimated tax was $5,000 or more1992-93 Amount of $33,996,932 recorded as Other transfers includes $33,994,432 reimbursed to local governments for taxes lost due to the exemption of certain classes of intangible property2001-02 Other transfers includes a local government reimbursement allocation of $7,890,753 for Homestead Exemption for elderly/ disabled that was retained by the State due to the budgetary shortfall.2002-03 Other transfers includes a $57,869,430 payment to the State Public School Fund.Intergovernmental, inter-fund transfersIn fiscal year 1999-00, a $92 million tax payment intended to satisfy a franchise tax liability was misassigned to the corporate income tax account because the payment was unaccompanied by a tax return identifying the tax type. Upon receipt of the tax return in 2000-01, a $92 million correcting adjustment transferred the funds from the corporate income tax account into the intended franchise tax account. Gross collection amounts in the above table do not reflect this misassignment so as not to alter taxpayer remittance levels. TheIntergovernmental, inter-fund transfers 'Other' and Net collections to General Fund columns do reflect the misassignment of the $92 million payment, reporting it as 1999-00 corporate net tax collections deposited into the General Fund and as a $92 million transfer fromthe corporate income tax account to the franchise tax account in 2000-01 to correctly assign the remittance. In addition to the 2000-01 $92 million transfer to the franchise tax account, the Other' column includes the scheduled April 2001 local government reimbursement allocation of $95,087,044 for replacement of revenues lost due to the exemption of inventories from the property tax base. The State retained the April 2001 allocation to partially offset the budgetary shortfall. The reimbursement provision was repealed effective July 1, 2002.
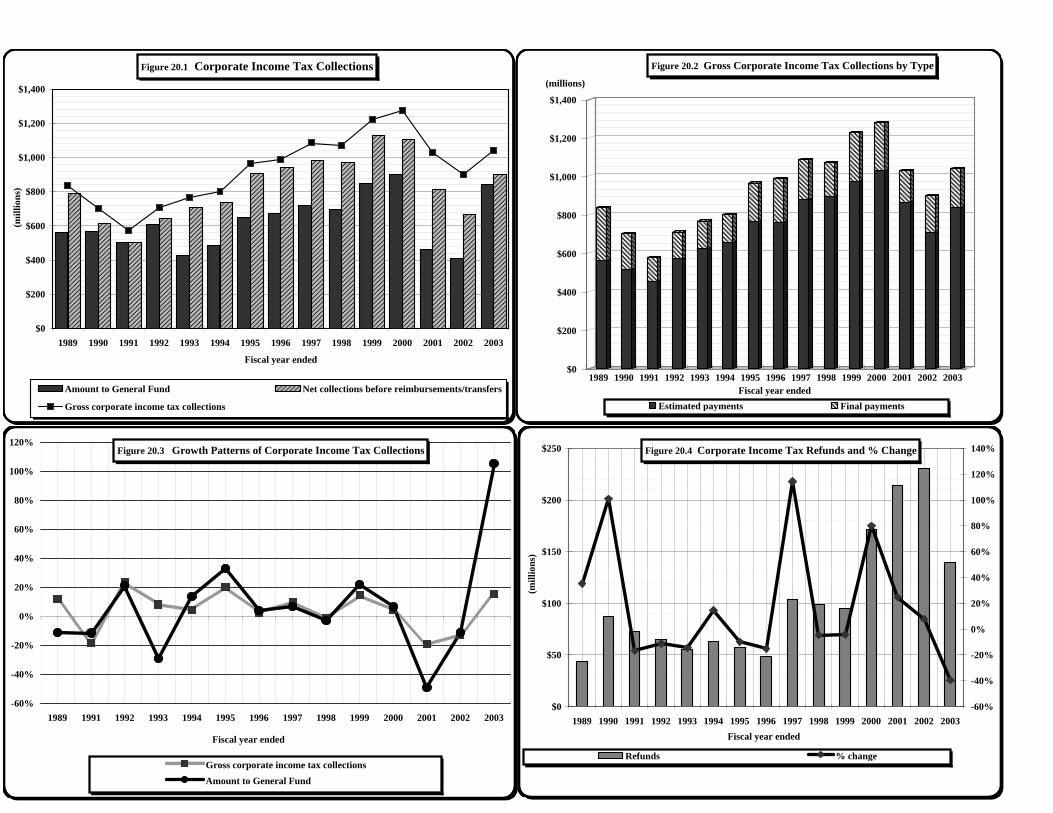
Gross corporate Net collections Amount to General Fund1989 $834,535,272 $791,034,858 $562,635,1601990 $702,084,037 $614,664,698 $567,070,704 Estimated paymenFinal payments1991 $574,297,133 $501,460,433 $501,460,433 1989 $561,978,575 $272,556,6971992 $708,533,987 $643,864,846 $606,195,418 1990 $513,836,199 $188,247,8381993 $765,976,197 $710,657,528 $429,848,526 1991 $452,879,093 $121,418,0401994 $800,658,004 $737,260,007 $487,796,660 1992 $572,135,598 $136,398,3891995 $963,212,825 $906,009,866 $649,389,838 1993 $621,417,691 $144,558,5061996 $987,813,237 $939,278,709 $673,837,774 1994 $653,642,876 $147,015,1281997 $1,085,144,619 $981,072,175 $717,750,574 1995 $761,727,732 $201,485,0931998 $1,069,497,301 $970,141,301 $696,338,557 1996 $761,517,294 $226,295,9431999 $1,223,793,121 ############ $848,509,669 1997 $878,015,906 $207,128,7132000 $1,276,537,372 ############ $903,241,974 1998 $892,867,397 $176,629,9042001 $1,029,527,422 $815,635,192 $460,315,086 1999 $973,701,900 $250,091,2212002 $899,150,503 $668,351,676 $409,322,540 2000 ############ $247,902,8302003 $1,038,493,274 $898,519,224 $840,499,824 2001 $864,206,947 $165,320,475
2002 $705,907,394 $193,243,1092003 $836,870,149 $201,623,125
Refunds % changeGross corporate Net collections Amount to General Fund 1989 $43,500,414 35.41% 43,500,414
1989 11.76% 10.70% -11.35% 1990 $87,419,339 100.96% 87,419,3391991 -18.20% -18.42% -11.57% 1991 $72,836,700 -16.68% 72,836,7001992 23.37% 28.40% 20.89% 1992 $64,669,141 -11.21% 64,669,1411993 8.11% 10.37% -29.09% 1993 $55,318,669 -14.46% 55,318,6691994 4.53% 3.74% 13.48% 1994 $63,397,997 14.61% 63,397,9971995 20.30% 22.89% 33.13% 1995 $57,202,958 -9.77% 57,202,9581996 2.55% 3.67% 3.76% 1996 $48,534,528 -15.15% 48,534,5281997 9.85% 4.45% 6.52% 1997 ########## 114.43% 104,072,4441998 -1.44% -1.11% -2.98% 1998 $99,356,000 -4.53% 99,356,0001999 14.43% 16.33% 21.85% 1999 $95,209,963 -4.17% 95,209,9632000 4.31% -2.08% 6.45% 2000 ########## 80.00% 171,375,5422001 -19.35% -26.20% -49.04% 2001 ########## 24.81% 213,892,2302002 -12.66% -18.06% -11.08% 2002 ########## 7.90% 230,798,8272003 15.50% 34.44% 105.34% 2003 ########## -39.35% 139,974,050
Figure 20.1 Corporate Income Tax Collections
$0
$200
$400
$600
$800
$1,000
$1,200
$1,400
1989 1990 1991 1992 1993 1994 1995 1996 1997 1998 1999 2000 2001 2002 2003
(mill
ions
)
Fiscal year ended
Amount to General Fund Net collections before reimbursements/transfers
Gross corporate income tax collections
$0
$200
$400
$600
$800
$1,000
$1,200
$1,400
(millions)
1989 1990 1991 1992 1993 1994 1995 1996 1997 1998 1999 2000 2001 2002 2003Fiscal year ended
Figure 20.2 Gross Corporate Income Tax Collections by Type
Estimated payments Final payments
Figure 20.3 Growth Patterns of Corporate Income Tax Collections
-60%
-40%
-20%
0%
20%
40%
60%
80%
100%
120%
1989 1991 1992 1993 1994 1995 1996 1997 1998 1999 2000 2001 2002 2003
Fiscal year ended
Gross corporate income tax collectionsAmount to General Fund
Figure 20.4 Corporate Income Tax Refunds and % Change
$0
$50
$100
$150
$200
$250
1989 1990 1991 1992 1993 1994 1995 1996 1997 1998 1999 2000 2001 2002 2003
(mill
ions
)
Fiscal year ended
-60%
-40%
-20%
0%
20%
40%
60%
80%
100%
120%
140%
Refunds % change
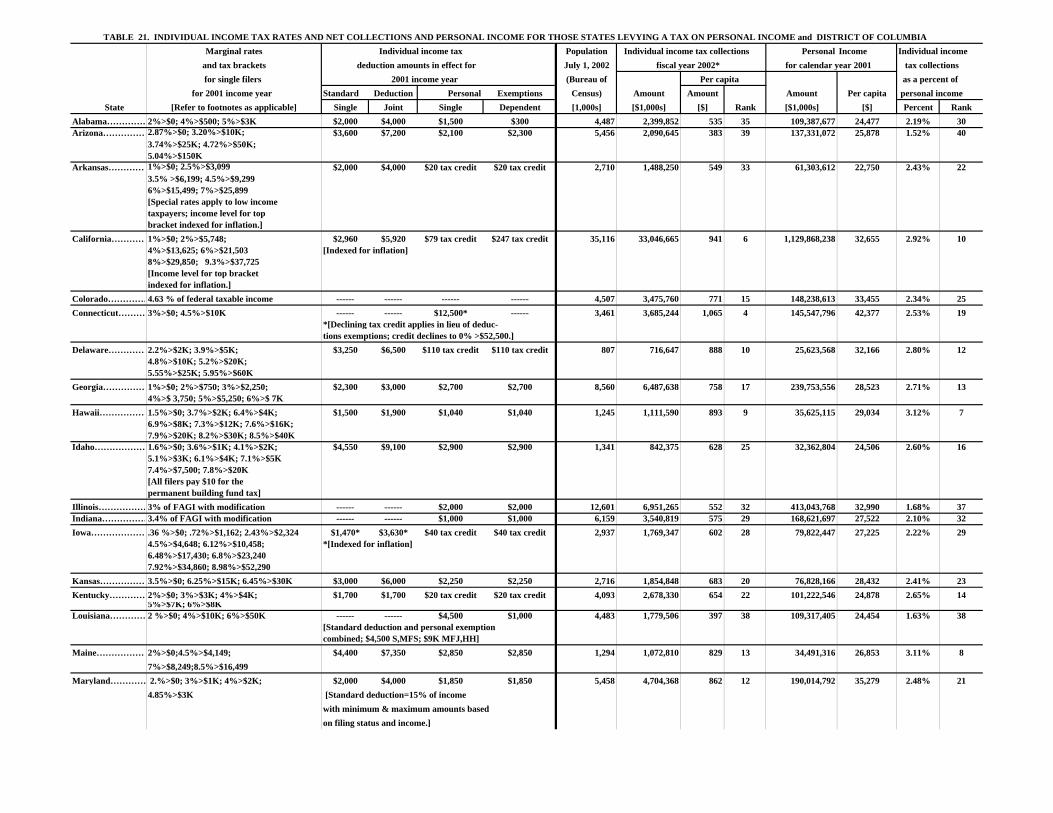
TABLE 21. INDIVIDUAL INCOME TAX RATES AND NET COLLECTIONS AND PERSONAL INCOME FOR THOSE STATES LEVYING A TAX ON PERSONAL INCOME and DISTRICT OF COLUMBIA Marginal rates Individual income tax Population Individual income tax collections Personal Income Individual income
and tax brackets deduction amounts in effect for July 1, 2002 fiscal year 2002* for calendar year 2001 tax collectionsfor single filers 2001 income year (Bureau of Per capita as a percent of
for 2001 income year Standard Deduction Personal Exemptions Census) Amount Amount Amount Per capita personal income State [Refer to footnotes as applicable] Single Joint Single Dependent [1,000s] [$1,000s] [$] Rank [$1,000s] [$] Percent Rank
Alabama……………2%>$0; 4%>$500; 5%>$3K $2,000 $4,000 $1,500 $300 4,487 2,399,852 535 35 109,387,677 24,477 2.19% 30Arizona……………2.87%>$0; 3.20%>$10K; $3,600 $7,200 $2,100 $2,300 5,456 2,090,645 383 39 137,331,072 25,878 1.52% 40
3.74%>$25K; 4.72%>$50K; 5.04%>$150K
Arkansas………… 1%>$0; 2.5%>$3,099 $2,000 $4,000 $20 tax credit $20 tax credit 2,710 1,488,250 549 33 61,303,612 22,750 2.43% 223.5% >$6,199; 4.5%>$9,2996%>$15,499; 7%>$25,899 [Special rates apply to low income taxpayers; income level for topbracket indexed for inflation.]
California…………1%>$0; 2%>$5,748; $2,960 $5,920 $79 tax credit $247 tax credit 35,116 33,046,665 941 6 1,129,868,238 32,655 2.92% 104%>$13,625; 6%>$21,503 [Indexed for inflation]8%>$29,850; 9.3%>$37,725[Income level for top bracket indexed for inflation.]
Colorado……………4.63 % of federal taxable income ------ ------ ------ ------ 4,507 3,475,760 771 15 148,238,613 33,455 2.34% 25Connecticut……… 3%>$0; 4.5%>$10K ------ ------ $12,500* ------ 3,461 3,685,244 1,065 4 145,547,796 42,377 2.53% 19
*[Declining tax credit applies in lieu of deduc- tions exemptions; credit declines to 0% >$52,500.]
Delaware……………2.2%>$2K; 3.9%>$5K; $3,250 $6,500 $110 tax credit $110 tax credit 807 716,647 888 10 25,623,568 32,166 2.80% 124.8%>$10K; 5.2%>$20K;5.55%>$25K; 5.95%>$60K
Georgia……………1%>$0; 2%>$750; 3%>$2,250; $2,300 $3,000 $2,700 $2,700 8,560 6,487,638 758 17 239,753,556 28,523 2.71% 134%>$ 3,750; 5%>$5,250; 6%>$ 7K
Hawaii………………1.5%>$0; 3.7%>$2K; 6.4%>$4K; $1,500 $1,900 $1,040 $1,040 1,245 1,111,590 893 9 35,625,115 29,034 3.12% 76.9%>$8K; 7.3%>$12K; 7.6%>$16K;7.9%>$20K; 8.2%>$30K; 8.5%>$40K
Idaho………………1.6%>$0; 3.6%>$1K; 4.1%>$2K; $4,550 $9,100 $2,900 $2,900 1,341 842,375 628 25 32,362,804 24,506 2.60% 165.1%>$3K; 6.1%>$4K; 7.1%>$5K7.4%>$7,500; 7.8%>$20K[All filers pay $10 for the permanent building fund tax]
Illinois………………3% of FAGI with modification ------ ------ $2,000 $2,000 12,601 6,951,265 552 32 413,043,768 32,990 1.68% 37Indiana…………… 3.4% of FAGI with modification ------ ------ $1,000 $1,000 6,159 3,540,819 575 29 168,621,697 27,522 2.10% 32Iowa………………….36 %>$0; .72%>$1,162; 2.43%>$2,324 $1,470* $3,630* $40 tax credit $40 tax credit 2,937 1,769,347 602 28 79,822,447 27,225 2.22% 29
4.5%>$4,648; 6.12%>$10,458; *[Indexed for inflation]6.48%>$17,430; 6.8%>$23,2407.92%>$34,860; 8.98%>$52,290
Kansas………………3.5%>$0; 6.25%>$15K; 6.45%>$30K $3,000 $6,000 $2,250 $2,250 2,716 1,854,848 683 20 76,828,166 28,432 2.41% 23Kentucky………… 2%>$0; 3%>$3K; 4%>$4K; $1,700 $1,700 $20 tax credit $20 tax credit 4,093 2,678,330 654 22 101,222,546 24,878 2.65% 14
5%>$7K; 6%>$8KLouisiana………… 2 %>$0; 4%>$10K; 6%>$50K ------ ------ $4,500 $1,000 4,483 1,779,506 397 38 109,317,405 24,454 1.63% 38
[Standard deduction and personal exemption combined; $4,500 S,MFS; $9K MFJ,HH]
Maine………………2%>$0;4.5%>$4,149; $4,400 $7,350 $2,850 $2,850 1,294 1,072,810 829 13 34,491,316 26,853 3.11% 87%>$8,249;8.5%>$16,499
Maryland………… 2.%>$0; 3%>$1K; 4%>$2K; $2,000 $4,000 $1,850 $1,850 5,458 4,704,368 862 12 190,014,792 35,279 2.48% 214.85%>$3K [Standard deduction=15% of income
with minimum & maximum amounts based on filing status and income.]
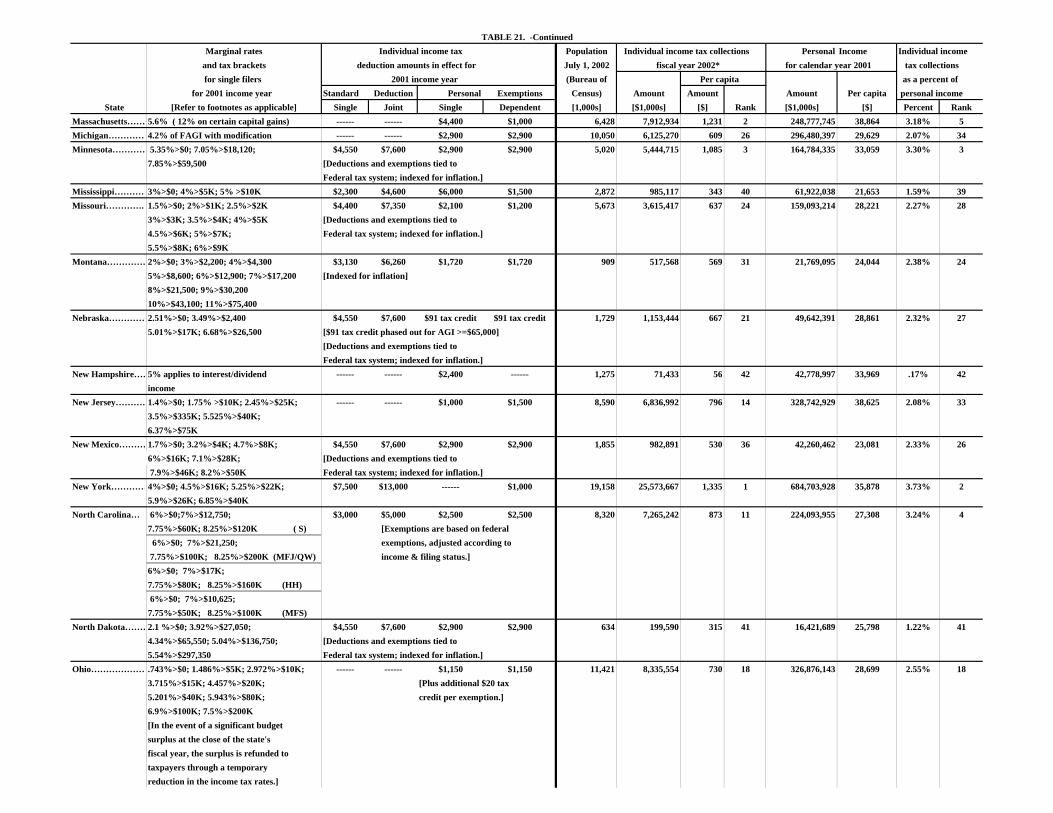
TABLE 21. -ContinuedMarginal rates Individual income tax Population Individual income tax collections Personal Income Individual income
and tax brackets deduction amounts in effect for July 1, 2002 fiscal year 2002* for calendar year 2001 tax collectionsfor single filers 2001 income year (Bureau of Per capita as a percent of
for 2001 income year Standard Deduction Personal Exemptions Census) Amount Amount Amount Per capita personal income State [Refer to footnotes as applicable] Single Joint Single Dependent [1,000s] [$1,000s] [$] Rank [$1,000s] [$] Percent Rank
Massachusetts…… 5.6% ( 12% on certain capital gains) ------ ------ $4,400 $1,000 6,428 7,912,934 1,231 2 248,777,745 38,864 3.18% 5Michigan……………4.2% of FAGI with modification ------ ------ $2,900 $2,900 10,050 6,125,270 609 26 296,480,397 29,629 2.07% 34Minnesota………… 5.35%>$0; 7.05%>$18,120; $4,550 $7,600 $2,900 $2,900 5,020 5,444,715 1,085 3 164,784,335 33,059 3.30% 3
7.85%>$59,500 [Deductions and exemptions tied to Federal tax system; indexed for inflation.]
Mississippi…………3%>$0; 4%>$5K; 5% >$10K $2,300 $4,600 $6,000 $1,500 2,872 985,117 343 40 61,922,038 21,653 1.59% 39Missouri…………. 1.5%>$0; 2%>$1K; 2.5%>$2K $4,400 $7,350 $2,100 $1,200 5,673 3,615,417 637 24 159,093,214 28,221 2.27% 28
3%>$3K; 3.5%>$4K; 4%>$5K [Deductions and exemptions tied to 4.5%>$6K; 5%>$7K; Federal tax system; indexed for inflation.]5.5%>$8K; 6%>$9K
Montana……………2%>$0; 3%>$2,200; 4%>$4,300 $3,130 $6,260 $1,720 $1,720 909 517,568 569 31 21,769,095 24,044 2.38% 245%>$8,600; 6%>$12,900; 7%>$17,200 [Indexed for inflation]8%>$21,500; 9%>$30,20010%>$43,100; 11%>$75,400
Nebraska………… 2.51%>$0; 3.49%>$2,400 $4,550 $7,600 $91 tax credit $91 tax credit 1,729 1,153,444 667 21 49,642,391 28,861 2.32% 275.01%>$17K; 6.68%>$26,500 [$91 tax credit phased out for AGI >=$65,000]
[Deductions and exemptions tied to Federal tax system; indexed for inflation.]
New Hampshire……5% applies to interest/dividend ------ ------ $2,400 ------ 1,275 71,433 56 42 42,778,997 33,969 .17% 42income
New Jersey…………1.4%>$0; 1.75% >$10K; 2.45%>$25K; ------ ------ $1,000 $1,500 8,590 6,836,992 796 14 328,742,929 38,625 2.08% 333.5%>$335K; 5.525%>$40K; 6.37%>$75K
New Mexico……… 1.7%>$0; 3.2%>$4K; 4.7%>$8K; $4,550 $7,600 $2,900 $2,900 1,855 982,891 530 36 42,260,462 23,081 2.33% 266%>$16K; 7.1%>$28K; [Deductions and exemptions tied to 7.9%>$46K; 8.2%>$50K Federal tax system; indexed for inflation.]
New York…………4%>$0; 4.5%>$16K; 5.25%>$22K; $7,500 $13,000 ------ $1,000 19,158 25,573,667 1,335 1 684,703,928 35,878 3.73% 25.9%>$26K; 6.85%>$40K
North Carolina… 6%>$0;7%>$12,750; $3,000 $5,000 $2,500 $2,500 8,320 7,265,242 873 11 224,093,955 27,308 3.24% 47.75%>$60K; 8.25%>$120K ( S) [Exemptions are based on federal 6%>$0; 7%>$21,250; exemptions, adjusted according to 7.75%>$100K; 8.25%>$200K (MFJ/QW) income & filing status.]6%>$0; 7%>$17K;7.75%>$80K; 8.25%>$160K (HH) 6%>$0; 7%>$10,625;7.75%>$50K; 8.25%>$100K (MFS)
North Dakota………2.1 %>$0; 3.92%>$27,050; $4,550 $7,600 $2,900 $2,900 634 199,590 315 41 16,421,689 25,798 1.22% 414.34%>$65,550; 5.04%>$136,750; [Deductions and exemptions tied to 5.54%>$297,350 Federal tax system; indexed for inflation.]
Ohio………………….743%>$0; 1.486%>$5K; 2.972%>$10K; ------ ------ $1,150 $1,150 11,421 8,335,554 730 18 326,876,143 28,699 2.55% 183.715%>$15K; 4.457%>$20K; [Plus additional $20 tax5.201%>$40K; 5.943%>$80K; credit per exemption.]6.9%>$100K; 7.5%>$200K[In the event of a significant budget surplus at the close of the state's fiscal year, the surplus is refunded totaxpayers through a temporaryreduction in the income tax rates.]
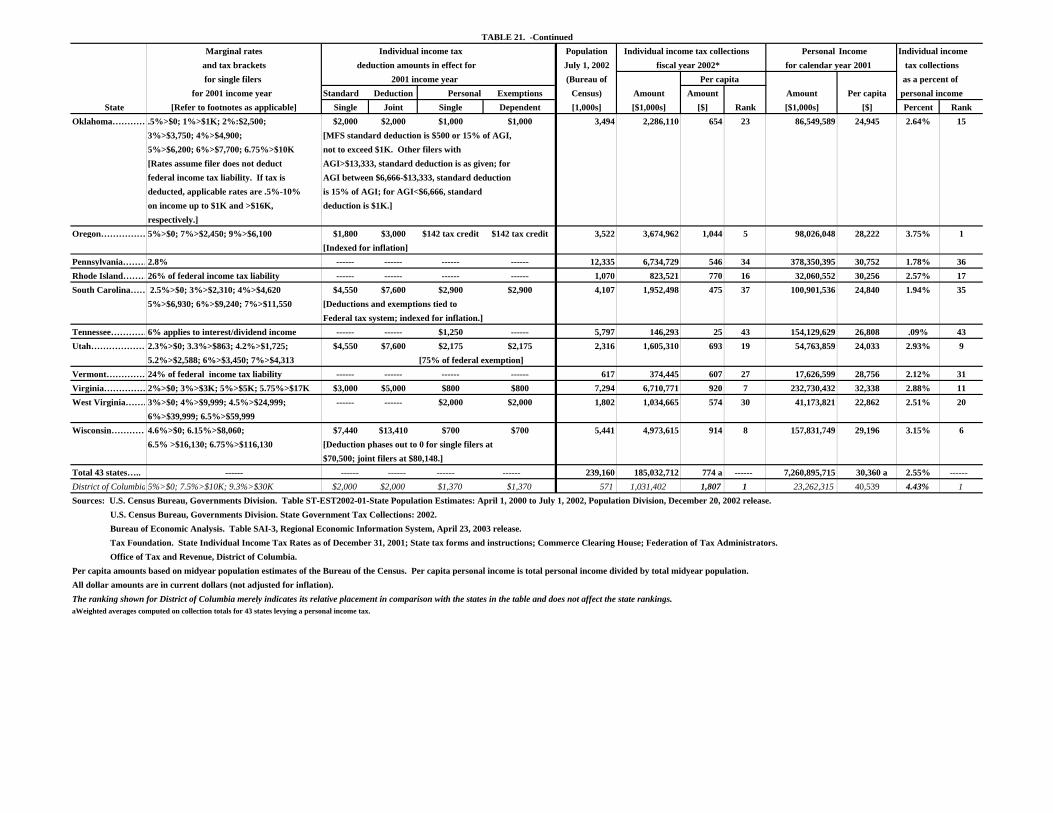
TABLE 21. -ContinuedMarginal rates Individual income tax Population Individual income tax collections Personal Income Individual income
and tax brackets deduction amounts in effect for July 1, 2002 fiscal year 2002* for calendar year 2001 tax collectionsfor single filers 2001 income year (Bureau of Per capita as a percent of
for 2001 income year Standard Deduction Personal Exemptions Census) Amount Amount Amount Per capita personal income State [Refer to footnotes as applicable] Single Joint Single Dependent [1,000s] [$1,000s] [$] Rank [$1,000s] [$] Percent Rank
Oklahoma………….5%>$0; 1%>$1K; 2%:$2,500; $2,000 $2,000 $1,000 $1,000 3,494 2,286,110 654 23 86,549,589 24,945 2.64% 153%>$3,750; 4%>$4,900; [MFS standard deduction is $500 or 15% of AGI,5%>$6,200; 6%>$7,700; 6.75%>$10K not to exceed $1K. Other filers with [Rates assume filer does not deduct AGI>$13,333, standard deduction is as given; for federal income tax liability. If tax is AGI between $6,666-$13,333, standard deductiondeducted, applicable rates are .5%-10% is 15% of AGI; for AGI<$6,666, standard on income up to $1K and >$16K, deduction is $1K.]respectively.]
Oregon…………… 5%>$0; 7%>$2,450; 9%>$6,100 $1,800 $3,000 $142 tax credit $142 tax credit 3,522 3,674,962 1,044 5 98,026,048 28,222 3.75% 1[Indexed for inflation]
Pennsylvania………2.8% ------ ------ ------ ------ 12,335 6,734,729 546 34 378,350,395 30,752 1.78% 36Rhode Island………26% of federal income tax liability ------ ------ ------ ------ 1,070 823,521 770 16 32,060,552 30,256 2.57% 17South Carolina…… 2.5%>$0; 3%>$2,310; 4%>$4,620 $4,550 $7,600 $2,900 $2,900 4,107 1,952,498 475 37 100,901,536 24,840 1.94% 35
5%>$6,930; 6%>$9,240; 7%>$11,550 [Deductions and exemptions tied to Federal tax system; indexed for inflation.]
Tennessee………… 6% applies to interest/dividend income ------ ------ $1,250 ------ 5,797 146,293 25 43 154,129,629 26,808 .09% 43Utah…………………2.3%>$0; 3.3%>$863; 4.2%>$1,725; $4,550 $7,600 $2,175 $2,175 2,316 1,605,310 693 19 54,763,859 24,033 2.93% 9
5.2%>$2,588; 6%>$3,450; 7%>$4,313 [75% of federal exemption]Vermont……………24% of federal income tax liability ------ ------ ------ ------ 617 374,445 607 27 17,626,599 28,756 2.12% 31Virginia……………2%>$0; 3%>$3K; 5%>$5K; 5.75%>$17K $3,000 $5,000 $800 $800 7,294 6,710,771 920 7 232,730,432 32,338 2.88% 11West Virginia………3%>$0; 4%>$9,999; 4.5%>$24,999; ------ ------ $2,000 $2,000 1,802 1,034,665 574 30 41,173,821 22,862 2.51% 20
6%>$39,999; 6.5%>$59,999Wisconsin…………4.6%>$0; 6.15%>$8,060; $7,440 $13,410 $700 $700 5,441 4,973,615 914 8 157,831,749 29,196 3.15% 6
6.5% >$16,130; 6.75%>$116,130 [Deduction phases out to 0 for single filers at $70,500; joint filers at $80,148.]
Total 43 states….. ------ ------ ------ ------ ------ 239,160 185,032,712 774 a ------ 7,260,895,715 30,360 a 2.55% ------District of Columbia 5%>$0; 7.5%>$10K; 9.3%>$30K $2,000 $2,000 $1,370 $1,370 571 1,031,402 1,807 1 23,262,315 40,539 4.43% 1Sources: U.S. Census Bureau, Governments Division. Table ST-EST2002-01-State Population Estimates: April 1, 2000 to July 1, 2002, Population Division, December 20, 2002 release. U.S. Census Bureau, Governments Division. State Government Tax Collections: 2002. Bureau of Economic Analysis. Table SAI-3, Regional Economic Information System, April 23, 2003 release. Tax Foundation. State Individual Income Tax Rates as of December 31, 2001; State tax forms and instructions; Commerce Clearing House; Federation of Tax Administrators. Office of Tax and Revenue, District of Columbia.Per capita amounts based on midyear population estimates of the Bureau of the Census. Per capita personal income is total personal income divided by total midyear population.All dollar amounts are in current dollars (not adjusted for inflation).The ranking shown for District of Columbia merely indicates its relative placement in comparison with the states in the table and does not affect the state rankings.aWeighted averages computed on collection totals for 43 states levying a personal income tax.
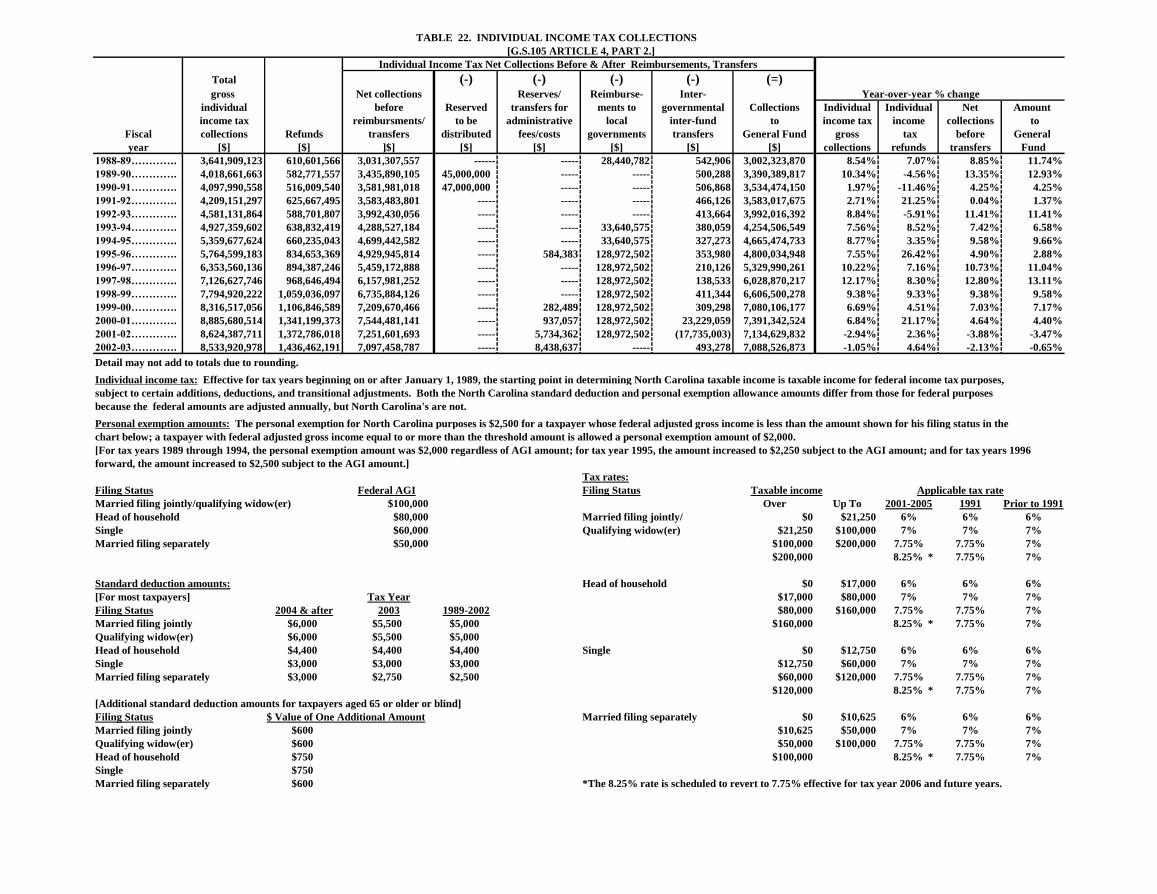
TABLE 22. INDIVIDUAL INCOME TAX COLLECTIONS
[G.S.105 ARTICLE 4, PART 2.]
Individual Income Tax Net Collections Before & After Reimbursements, Transfers
Total (-) (-) (-) (-) (=)gross Net collections Reserves/ Reimburse- Inter- Year-over-year % change
individual before Reserved transfers for ments to governmental Collections Individual Individual Net Amount
income tax reimbursments/ to be administrative local inter-fund to income tax income collections to
Fiscal collections Refunds transfers distributed fees/costs governments transfers General Fund gross tax before General
year [$] [$] ]$] [$] [$] [$] [$] [$] collections refunds transfers Fund
1988-89…………. 3,641,909,123 610,601,566 3,031,307,557 ------ ----- 28,440,782 542,906 3,002,323,870 8.54% 7.07% 8.85% 11.74%
1989-90…………. 4,018,661,663 582,771,557 3,435,890,105 45,000,000 ----- ----- 500,288 3,390,389,817 10.34% -4.56% 13.35% 12.93%
1990-91…………. 4,097,990,558 516,009,540 3,581,981,018 47,000,000 ----- ----- 506,868 3,534,474,150 1.97% -11.46% 4.25% 4.25%
1991-92…………. 4,209,151,297 625,667,495 3,583,483,801 ----- ----- ----- 466,126 3,583,017,675 2.71% 21.25% 0.04% 1.37%
1992-93…………. 4,581,131,864 588,701,807 3,992,430,056 ----- ----- ----- 413,664 3,992,016,392 8.84% -5.91% 11.41% 11.41%
1993-94…………. 4,927,359,602 638,832,419 4,288,527,184 ----- ----- 33,640,575 380,059 4,254,506,549 7.56% 8.52% 7.42% 6.58%
1994-95…………. 5,359,677,624 660,235,043 4,699,442,582 ----- ----- 33,640,575 327,273 4,665,474,733 8.77% 3.35% 9.58% 9.66%
1995-96…………. 5,764,599,183 834,653,369 4,929,945,814 ----- 584,383 128,972,502 353,980 4,800,034,948 7.55% 26.42% 4.90% 2.88%
1996-97…………. 6,353,560,136 894,387,246 5,459,172,888 ----- ----- 128,972,502 210,126 5,329,990,261 10.22% 7.16% 10.73% 11.04%
1997-98…………. 7,126,627,746 968,646,494 6,157,981,252 ----- ----- 128,972,502 138,533 6,028,870,217 12.17% 8.30% 12.80% 13.11%
1998-99…………. 7,794,920,222 1,059,036,097 6,735,884,126 ----- ----- 128,972,502 411,344 6,606,500,278 9.38% 9.33% 9.38% 9.58%
1999-00…………. 8,316,517,056 1,106,846,589 7,209,670,466 ----- 282,489 128,972,502 309,298 7,080,106,177 6.69% 4.51% 7.03% 7.17%
2000-01…………. 8,885,680,514 1,341,199,373 7,544,481,141 ----- 937,057 128,972,502 23,229,059 7,391,342,524 6.84% 21.17% 4.64% 4.40%
2001-02…………. 8,624,387,711 1,372,786,018 7,251,601,693 ----- 5,734,362 128,972,502 (17,735,003) 7,134,629,832 -2.94% 2.36% -3.88% -3.47%
2002-03…………. 8,533,920,978 1,436,462,191 7,097,458,787 ----- 8,438,637 ----- 493,278 7,088,526,873 -1.05% 4.64% -2.13% -0.65%
Detail may not add to totals due to rounding.
Individual income tax: Effective for tax years beginning on or after January 1, 1989, the starting point in determining North Carolina taxable income is taxable income for federal income tax purposes,
subject to certain additions, deductions, and transitional adjustments. Both the North Carolina standard deduction and personal exemption allowance amounts differ from those for federal purposes
because the federal amounts are adjusted annually, but North Carolina's are not.
Personal exemption amounts: The personal exemption for North Carolina purposes is $2,500 for a taxpayer whose federal adjusted gross income is less than the amount shown for his filing status in the
chart below; a taxpayer with federal adjusted gross income equal to or more than the threshold amount is allowed a personal exemption amount of $2,000.
[For tax years 1989 through 1994, the personal exemption amount was $2,000 regardless of AGI amount; for tax year 1995, the amount increased to $2,250 subject to the AGI amount; and for tax years 1996
forward, the amount increased to $2,500 subject to the AGI amount.]
Tax rates:
Filing Status Federal AGI Filing Status Taxable income Applicable tax rate
Married filing jointly/qualifying widow(er) $100,000 Over Up To 2001-2005 1991 Prior to 1991
Head of household $80,000 Married filing jointly/ $0 $21,250 6% 6% 6%
Single $60,000 Qualifying widow(er) $21,250 $100,000 7% 7% 7%
Married filing separately $50,000 $100,000 $200,000 7.75% 7.75% 7%
$200,000 8.25% * 7.75% 7%
Standard deduction amounts: Head of household $0 $17,000 6% 6% 6%
[For most taxpayers] Tax Year $17,000 $80,000 7% 7% 7%
Filing Status 2004 & after 2003 1989-2002 $80,000 $160,000 7.75% 7.75% 7%
Married filing jointly $6,000 $5,500 $5,000 $160,000 8.25% * 7.75% 7%
Qualifying widow(er) $6,000 $5,500 $5,000
Head of household $4,400 $4,400 $4,400 Single $0 $12,750 6% 6% 6%
Single $3,000 $3,000 $3,000 $12,750 $60,000 7% 7% 7%
Married filing separately $3,000 $2,750 $2,500 $60,000 $120,000 7.75% 7.75% 7%
$120,000 8.25% * 7.75% 7%
[Additional standard deduction amounts for taxpayers aged 65 or older or blind]
Filing Status $ Value of One Additional Amount Married filing separately $0 $10,625 6% 6% 6%
Married filing jointly $600 $10,625 $50,000 7% 7% 7%
Qualifying widow(er) $600 $50,000 $100,000 7.75% 7.75% 7%
Head of household $750 $100,000 8.25% * 7.75% 7%
Single $750
Married filing separately $600 *The 8.25% rate is scheduled to revert to 7.75% effective for tax year 2006 and future years.
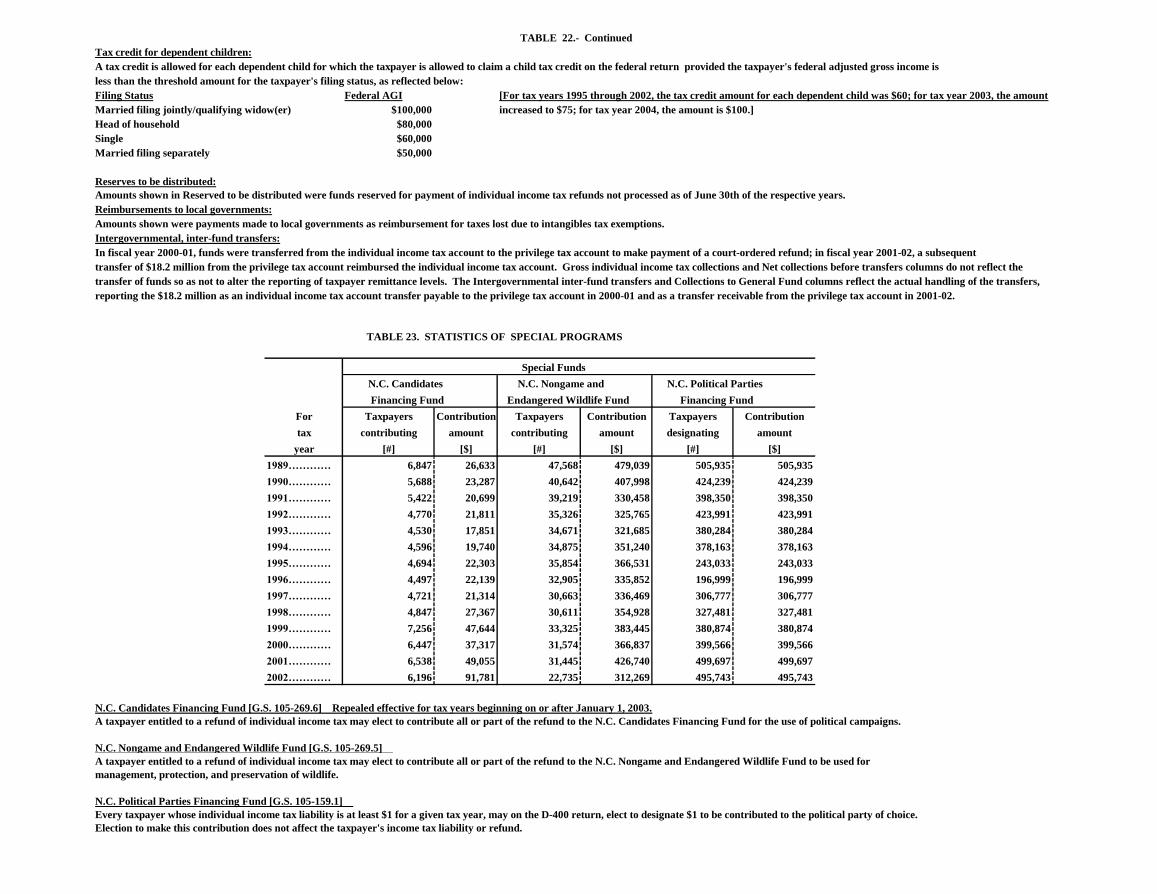
TABLE 22.- Continued
Tax credit for dependent children:
A tax credit is allowed for each dependent child for which the taxpayer is allowed to claim a child tax credit on the federal return provided the taxpayer's federal adjusted gross income is
less than the threshold amount for the taxpayer's filing status, as reflected below:
Filing Status Federal AGI [For tax years 1995 through 2002, the tax credit amount for each dependent child was $60; for tax year 2003, the amount
Married filing jointly/qualifying widow(er) $100,000 increased to $75; for tax year 2004, the amount is $100.]
Head of household $80,000
Single $60,000
Married filing separately $50,000
Reserves to be distributed:
Amounts shown in Reserved to be distributed were funds reserved for payment of individual income tax refunds not processed as of June 30th of the respective years.
Reimbursements to local governments:
Amounts shown were payments made to local governments as reimbursement for taxes lost due to intangibles tax exemptions.
Intergovernmental, inter-fund transfers:
In fiscal year 2000-01, funds were transferred from the individual income tax account to the privilege tax account to make payment of a court-ordered refund; in fiscal year 2001-02, a subsequent
transfer of $18.2 million from the privilege tax account reimbursed the individual income tax account. Gross individual income tax collections and Net collections before transfers columns do not reflect the
transfer of funds so as not to alter the reporting of taxpayer remittance levels. The Intergovernmental inter-fund transfers and Collections to General Fund columns reflect the actual handling of the transfers,
reporting the $18.2 million as an individual income tax account transfer payable to the privilege tax account in 2000-01 and as a transfer receivable from the privilege tax account in 2001-02.
TABLE 23. STATISTICS OF SPECIAL PROGRAMS
Special Funds
N.C. Candidates N.C. Nongame and N.C. Political Parties
Financing Fund Endangered Wildlife Fund Financing Fund
For Taxpayers Contribution Taxpayers Contribution Taxpayers Contribution
tax contributing amount contributing amount designating amount
year [#] [$] [#] [$] [#] [$]
1989………… 6,847 26,633 47,568 479,039 505,935 505,935
1990………… 5,688 23,287 40,642 407,998 424,239 424,239
1991………… 5,422 20,699 39,219 330,458 398,350 398,350
1992………… 4,770 21,811 35,326 325,765 423,991 423,991
1993………… 4,530 17,851 34,671 321,685 380,284 380,284
1994………… 4,596 19,740 34,875 351,240 378,163 378,163
1995………… 4,694 22,303 35,854 366,531 243,033 243,033
1996………… 4,497 22,139 32,905 335,852 196,999 196,999
1997………… 4,721 21,314 30,663 336,469 306,777 306,777
1998………… 4,847 27,367 30,611 354,928 327,481 327,481
1999………… 7,256 47,644 33,325 383,445 380,874 380,874
2000………… 6,447 37,317 31,574 366,837 399,566 399,566
2001………… 6,538 49,055 31,445 426,740 499,697 499,697
2002………… 6,196 91,781 22,735 312,269 495,743 495,743
N.C. Candidates Financing Fund [G.S. 105-269.6] Repealed effective for tax years beginning on or after January 1, 2003.
A taxpayer entitled to a refund of individual income tax may elect to contribute all or part of the refund to the N.C. Candidates Financing Fund for the use of political campaigns.
N.C. Nongame and Endangered Wildlife Fund [G.S. 105-269.5]
A taxpayer entitled to a refund of individual income tax may elect to contribute all or part of the refund to the N.C. Nongame and Endangered Wildlife Fund to be used for
management, protection, and preservation of wildlife.
N.C. Political Parties Financing Fund [G.S. 105-159.1]
Every taxpayer whose individual income tax liability is at least $1 for a given tax year, may on the D-400 return, elect to designate $1 to be contributed to the political party of choice.
Election to make this contribution does not affect the taxpayer's income tax liability or refund.
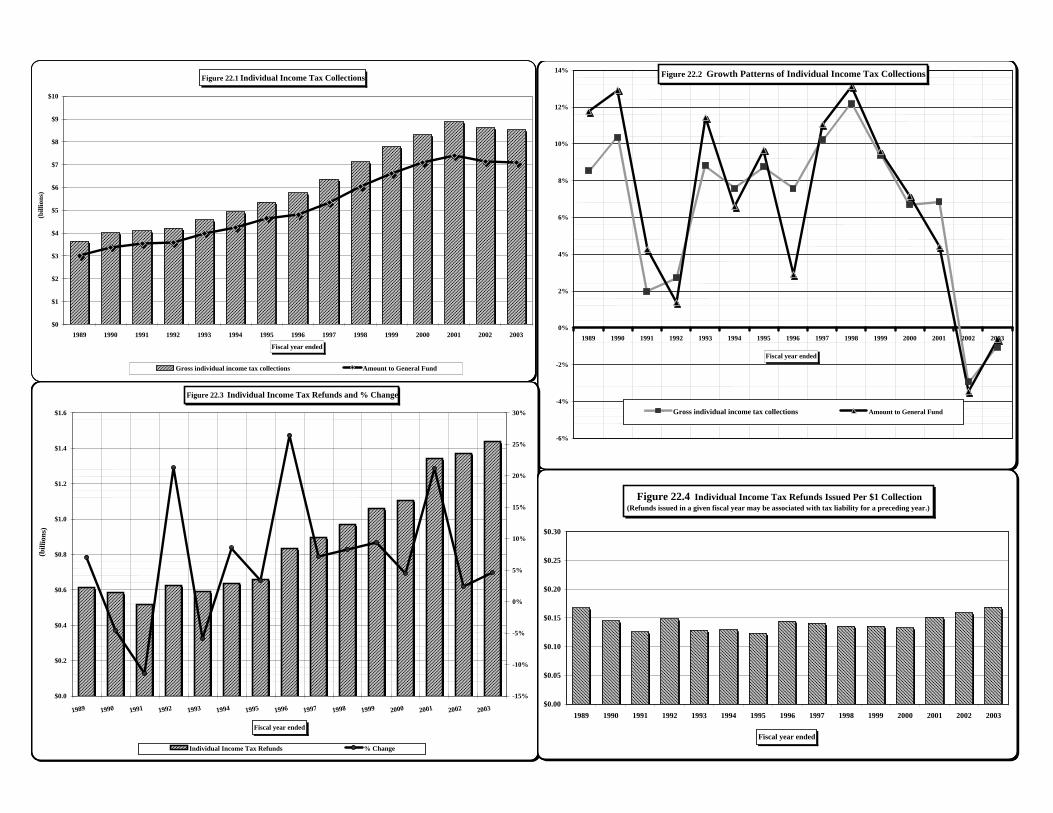
Gross individual income Amount to General Fund1989 $3,641,909,123 $3,002,323,870
1990 $4,018,661,663 $3,390,389,817
1991 $4,097,990,558 $3,534,474,150
1992 $4,209,151,297 $3,583,017,675
1993 $4,581,131,864 $3,992,016,392
1994 $4,927,359,602 $4,254,506,549
1995 $5,359,677,624 $4,665,474,733
1996 $5,764,599,183 $4,800,034,948
1997 $6,353,560,136 $5,329,990,261
1998 $7,126,627,746 $6,028,870,217
1999 $7,794,920,222 $6,606,500,278
2000 $8,316,517,056 $7,080,106,177 Gross individual income ta Amount to General Fund2001 $8,885,680,514 $7,391,342,524 1989 8.54% 11.74%
2002 $8,624,387,711 $7,134,629,832 1990 10.34% 12.93%
2003 $8,533,920,978 $7,088,526,873 1991 1.97% 4.25%
1992 2.71% 1.37%
1993 8.84% 11.41%
1994 7.56% 6.58%
1995 8.77% 9.66%
1996 7.55% 2.88%
1997 10.22% 11.04%
1998 12.17% 13.11%
1999 9.38% 9.58%
2000 6.69% 7.17%
2001 6.84% 4.40%
2002 -2.94% -3.47%
2003 -1.05% -0.65%
Individual Income Tax Refu % Change1989 $610,601,566 7.07%
1990 $582,771,557 -4.56%
1991 $516,009,540 -11.46% Individual Income Tax Refunds Gross individual income tax colle Individual Income Tax Refunds1992 $625,667,495 21.25% 1989 $0.17 $3,641,909,123 $610,601,566
1993 $588,701,807 -5.91% 1990 $0.15 $4,018,661,663 $582,771,557
1994 $638,832,419 8.52% 1991 $0.13 $4,097,990,558 $516,009,540
1995 $660,235,043 3.35% 1992 $0.15 $4,209,151,297 $625,667,495
1996 $834,653,369 26.42% 1993 $0.13 $4,581,131,864 $588,701,807
1997 $894,387,246 7.16% 1994 $0.13 $4,927,359,602 $638,832,419
1998 $968,646,494 8.30% 1995 $0.121999 $1,059,036,097 9.33% 1996 $0.14 $5,359,677,624 $660,235,043
2000 $1,106,846,589 4.51% 1997 $0.14 $5,764,599,183 $834,653,369
2001 $1,341,199,373 21.17% 1998 $0.14 $6,353,560,136 $894,387,246
2002 $1,372,786,018 2.36% 1999 $0.14 $7,126,627,746 $968,646,494
2003 $1,436,462,191 4.64% 2000 $0.13 $7,794,920,222 $1,059,036,097
2001 $0.15 $8,316,517,056 $1,106,846,589
2002 $0.16 $8,885,680,514 $1,341,199,373
2003 $0.17 $8,624,387,711 $1,372,786,018
$8,533,920,978 $1,436,462,191
Figure 22.1 Individual Income Tax Collections
$0
$1
$2
$3
$4
$5
$6
$7
$8
$9
$10
1989 1990 1991 1992 1993 1994 1995 1996 1997 1998 1999 2000 2001 2002 2003
(bill
ions
)
Fiscal year ended
Gross individual income tax collections Amount to General Fund
Figure 22.2 Growth Patterns of Individual Income Tax Collections
-6%
-4%
-2%
0%
2%
4%
6%
8%
10%
12%
14%
1989 1990 1991 1992 1993 1994 1995 1996 1997 1998 1999 2000 2001 2002 2003
Fiscal year ended
Gross individual income tax collections Amount to General Fund
Figure 22.3 Individual Income Tax Refunds and % Change
$0.0
$0.2
$0.4
$0.6
$0.8
$1.0
$1.2
$1.4
$1.6
1989 1990 1991 1992 1993 1994 1995 1996 1997 1998 1999 2000 2001 2002 2003
(bill
ions
)
Fiscal year ended
-15%
-10%
-5%
0%
5%
10%
15%
20%
25%
30%
Individual Income Tax Refunds % Change
Figure 22.4 Individual Income Tax Refunds Issued Per $1 Collection(Refunds issued in a given fiscal year may be associated with tax liability for a preceding year.)
$0.00
$0.05
$0.10
$0.15
$0.20
$0.25
$0.30
1989 1990 1991 1992 1993 1994 1995 1996 1997 1998 1999 2000 2001 2002 2003
Fiscal year ended
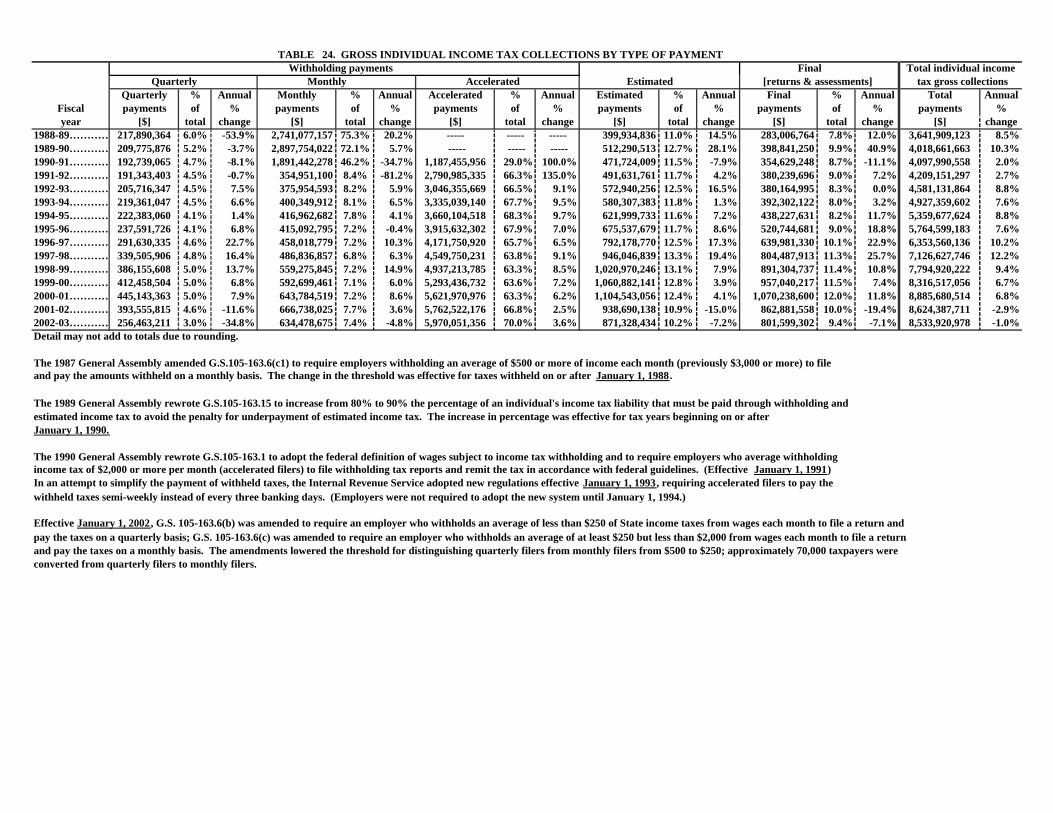
TABLE 24. GROSS INDIVIDUAL INCOME TAX COLLECTIONS BY TYPE OF PAYMENT Withholding payments Final Total individual income
Quarterly Monthly Accelerated Estimated [returns & assessments] tax gross collectionsQuarterly % Annual Monthly % Annual Accelerated % Annual Estimated % Annual Final % Annual Total Annual
Fiscal payments of % payments of % payments of % payments of % payments of % payments %year [$] total change [$] total change [$] total change [$] total change [$] total change [$] change
1988-89………… 217,890,364 6.0% -53.9% 2,741,077,157 75.3% 20.2% ----- ----- ----- 399,934,836 11.0% 14.5% 283,006,764 7.8% 12.0% 3,641,909,123 8.5%1989-90………… 209,775,876 5.2% -3.7% 2,897,754,022 72.1% 5.7% ----- ----- ----- 512,290,513 12.7% 28.1% 398,841,250 9.9% 40.9% 4,018,661,663 10.3%1990-91………… 192,739,065 4.7% -8.1% 1,891,442,278 46.2% -34.7% 1,187,455,956 29.0% 100.0% 471,724,009 11.5% -7.9% 354,629,248 8.7% -11.1% 4,097,990,558 2.0%1991-92………… 191,343,403 4.5% -0.7% 354,951,100 8.4% -81.2% 2,790,985,335 66.3% 135.0% 491,631,761 11.7% 4.2% 380,239,696 9.0% 7.2% 4,209,151,297 2.7%1992-93………… 205,716,347 4.5% 7.5% 375,954,593 8.2% 5.9% 3,046,355,669 66.5% 9.1% 572,940,256 12.5% 16.5% 380,164,995 8.3% 0.0% 4,581,131,864 8.8%1993-94………… 219,361,047 4.5% 6.6% 400,349,912 8.1% 6.5% 3,335,039,140 67.7% 9.5% 580,307,383 11.8% 1.3% 392,302,122 8.0% 3.2% 4,927,359,602 7.6%1994-95………… 222,383,060 4.1% 1.4% 416,962,682 7.8% 4.1% 3,660,104,518 68.3% 9.7% 621,999,733 11.6% 7.2% 438,227,631 8.2% 11.7% 5,359,677,624 8.8%1995-96………… 237,591,726 4.1% 6.8% 415,092,795 7.2% -0.4% 3,915,632,302 67.9% 7.0% 675,537,679 11.7% 8.6% 520,744,681 9.0% 18.8% 5,764,599,183 7.6%1996-97………… 291,630,335 4.6% 22.7% 458,018,779 7.2% 10.3% 4,171,750,920 65.7% 6.5% 792,178,770 12.5% 17.3% 639,981,330 10.1% 22.9% 6,353,560,136 10.2%1997-98………… 339,505,906 4.8% 16.4% 486,836,857 6.8% 6.3% 4,549,750,231 63.8% 9.1% 946,046,839 13.3% 19.4% 804,487,913 11.3% 25.7% 7,126,627,746 12.2%1998-99………… 386,155,608 5.0% 13.7% 559,275,845 7.2% 14.9% 4,937,213,785 63.3% 8.5% 1,020,970,246 13.1% 7.9% 891,304,737 11.4% 10.8% 7,794,920,222 9.4%1999-00………… 412,458,504 5.0% 6.8% 592,699,461 7.1% 6.0% 5,293,436,732 63.6% 7.2% 1,060,882,141 12.8% 3.9% 957,040,217 11.5% 7.4% 8,316,517,056 6.7%2000-01………… 445,143,363 5.0% 7.9% 643,784,519 7.2% 8.6% 5,621,970,976 63.3% 6.2% 1,104,543,056 12.4% 4.1% 1,070,238,600 12.0% 11.8% 8,885,680,514 6.8%2001-02………… 393,555,815 4.6% -11.6% 666,738,025 7.7% 3.6% 5,762,522,176 66.8% 2.5% 938,690,138 10.9% -15.0% 862,881,558 10.0% -19.4% 8,624,387,711 -2.9%2002-03………… 256,463,211 3.0% -34.8% 634,478,675 7.4% -4.8% 5,970,051,356 70.0% 3.6% 871,328,434 10.2% -7.2% 801,599,302 9.4% -7.1% 8,533,920,978 -1.0%Detail may not add to totals due to rounding.
The 1987 General Assembly amended G.S.105-163.6(c1) to require employers withholding an average of $500 or more of income each month (previously $3,000 or more) to fileand pay the amounts withheld on a monthly basis. The change in the threshold was effective for taxes withheld on or after January 1, 1988.
The 1989 General Assembly rewrote G.S.105-163.15 to increase from 80% to 90% the percentage of an individual's income tax liability that must be paid through withholding and estimated income tax to avoid the penalty for underpayment of estimated income tax. The increase in percentage was effective for tax years beginning on or after January 1, 1990.
The 1990 General Assembly rewrote G.S.105-163.1 to adopt the federal definition of wages subject to income tax withholding and to require employers who average withholding income tax of $2,000 or more per month (accelerated filers) to file withholding tax reports and remit the tax in accordance with federal guidelines. (Effective January 1, 1991)In an attempt to simplify the payment of withheld taxes, the Internal Revenue Service adopted new regulations effective January 1, 1993, requiring accelerated filers to pay thewithheld taxes semi-weekly instead of every three banking days. (Employers were not required to adopt the new system until January 1, 1994.)
Effective January 1, 2002, G.S. 105-163.6(b) was amended to require an employer who withholds an average of less than $250 of State income taxes from wages each month to file a return and pay the taxes on a quarterly basis; G.S. 105-163.6(c) was amended to require an employer who withholds an average of at least $250 but less than $2,000 from wages each month to file a return and pay the taxes on a monthly basis. The amendments lowered the threshold for distinguishing quarterly filers from monthly filers from $500 to $250; approximately 70,000 taxpayers were converted from quarterly filers to monthly filers.
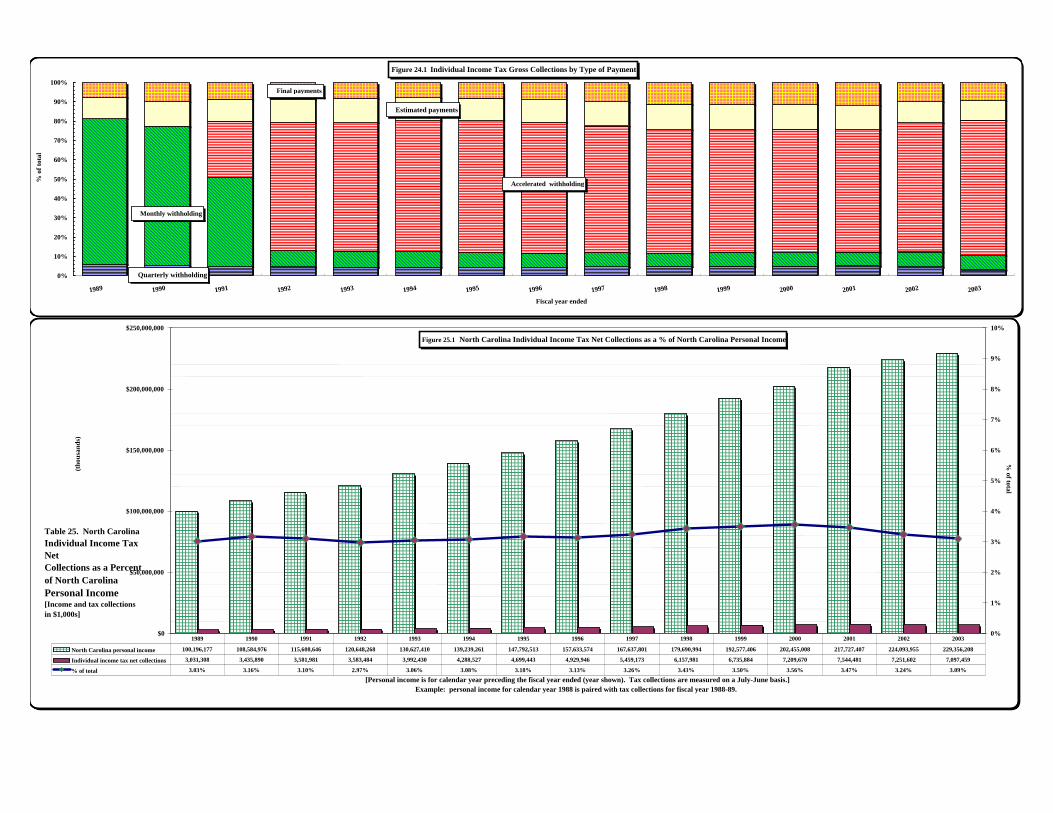
Fiscal Quarterly Monthly Accelerated Estimated Finalyear withholding withholding withholding payments payments1989 217,890,364 2,741,077,157 0 399,934,836 283,006,7641990 209,775,876 2,897,754,022 0 512,290,513 398,841,2501991 192,739,065 1,891,442,278 1,187,455,956 471,724,009 354,629,2481992 191,343,403 354,951,100 2,790,985,335 491,631,761 380,239,6961993 205,716,347 375,954,593 3,046,355,669 572,940,256 380,164,9951994 219,361,047 400,349,912 3,335,039,140 580,307,383 392,302,1221995 222,383,060 416,962,682 3,660,104,518 621,999,733 438,227,6311996 237,591,726 415,092,795 3,915,632,302 675,537,679 520,744,6811997 291,630,335 458,018,779 4,171,750,920 792,178,770 639,981,3301998 339,505,906 486,836,857 4,549,750,231 946,046,839 804,487,9131999 386,155,608 559,275,845 4,937,213,785 1,020,970,246 891,304,7372000 412,458,504 592,699,461 5,293,436,732 1,060,882,141 957,040,2172001 445,143,363 643,784,519 5,621,970,976 1,104,543,056 1,070,238,6002002 393,555,815 666,738,025 5,762,522,176 938,690,138 862,881,5582003 256,463,211 634,478,675 5,970,051,356 871,328,434 801,599,302
1989 1990 1991 1992 1993 1994 1995 1996 1997 1998 1999 2000 2001 2002 2003North Carolina 100,196,177 108,584,976 115,608,646 120,648,268 130,627,410 139,239,261 147,792,513 157,633,574 167,637,801 179,690,994 192,577,406 202,455,008 217,727,407 224,093,955 229,356,208Individual inco 3,031,308 3,435,890 3,581,981 3,583,484 3,992,430 4,288,527 4,699,443 4,929,946 5,459,173 6,157,981 6,735,884 7,209,670 7,544,481 7,251,602 7,097,459% of total 3.03% 3.16% 3.10% 2.97% 3.06% 3.08% 3.18% 3.13% 3.26% 3.43% 3.50% 3.56% 3.47% 3.24% 3.09%
Figure 24.1 Individual Income Tax Gross Collections by Type of Payment
Quarterly withholding
Monthly withholding
Accelerated withholding
Estimated payments
Final payments
0%
10%
20%
30%
40%
50%
60%
70%
80%
90%
100%
1989 1990 1991 1992 1993 1994 1995 1996 1997 1998 1999 2000 2001 2002 2003
Fiscal year ended
% o
f tot
al
Figure 25.1 North Carolina Individual Income Tax Net Collections as a % of North Carolina Personal Income
$0
$50,000,000
$100,000,000
$150,000,000
$200,000,000
$250,000,000
[Personal income is for calendar year preceding the fiscal year ended (year shown). Tax collections are measured on a July-June basis.]Example: personal income for calendar year 1988 is paired with tax collections for fiscal year 1988-89.
(thou
sand
s)
0%
1%
2%
3%
4%
5%
6%
7%
8%
9%
10%
% of total
North Carolina personal income 100,196,177 108,584,976 115,608,646 120,648,268 130,627,410 139,239,261 147,792,513 157,633,574 167,637,801 179,690,994 192,577,406 202,455,008 217,727,407 224,093,955 229,356,208
Individual income tax net collections 3,031,308 3,435,890 3,581,981 3,583,484 3,992,430 4,288,527 4,699,443 4,929,946 5,459,173 6,157,981 6,735,884 7,209,670 7,544,481 7,251,602 7,097,459
% of total 3.03% 3.16% 3.10% 2.97% 3.06% 3.08% 3.18% 3.13% 3.26% 3.43% 3.50% 3.56% 3.47% 3.24% 3.09%
1989 1990 1991 1992 1993 1994 1995 1996 1997 1998 1999 2000 2001 2002 2003
Table 25. North CarolinaIndividual Income Tax NetCollections as a Percent of North Carolina Personal Income[Income and tax collections in $1,000s]
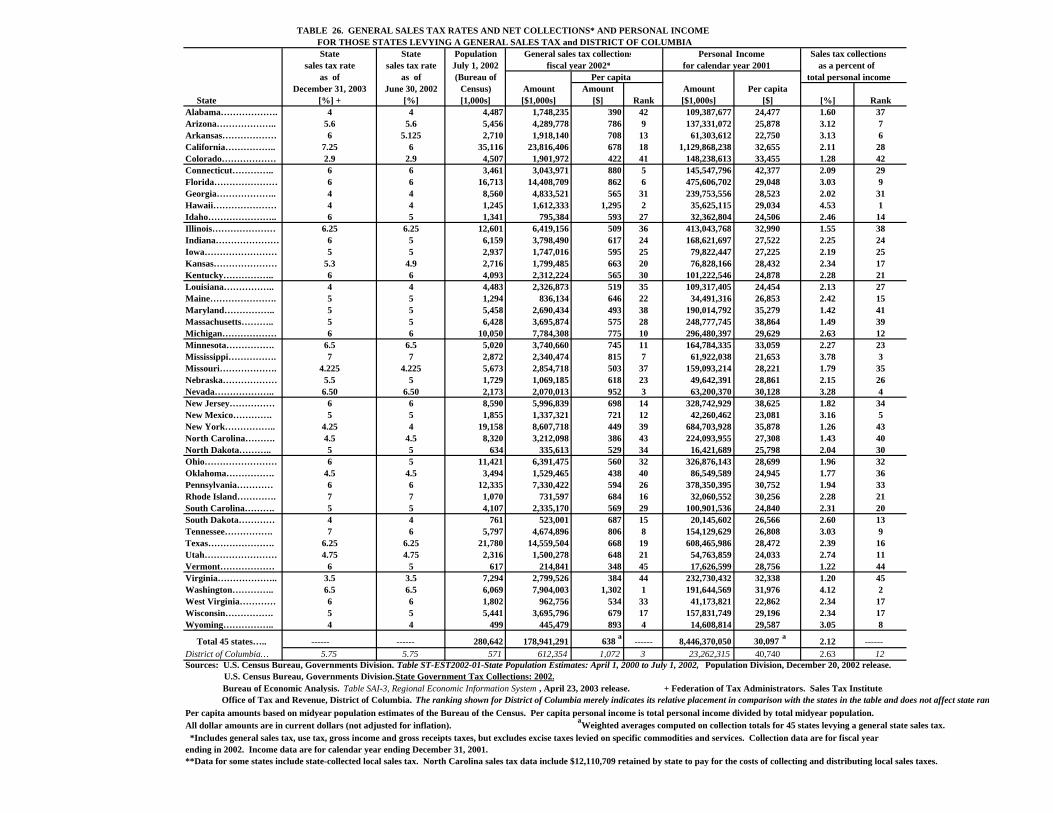
TABLE 26. GENERAL SALES TAX RATES AND NET COLLECTIONS* AND PERSONAL INCOME FOR THOSE STATES LEVYING A GENERAL SALES TAX and DISTRICT OF COLUMBIA
State State Population General sales tax collections Personal Income Sales tax collectionssales tax rate sales tax rate July 1, 2002 fiscal year 2002* for calendar year 2001 as a percent of
as of as of (Bureau of Per capita total personal income December 31, 2003 June 30, 2002 Census) Amount Amount Amount Per capita
State [%] + [%] [1,000s] [$1,000s] [$] Rank [$1,000s] [$] [%] RankAlabama………………. 4 4 4,487 1,748,235 390 42 109,387,677 24,477 1.60 37Arizona……………….. 5.6 5.6 5,456 4,289,778 786 9 137,331,072 25,878 3.12 7Arkansas……………… 6 5.125 2,710 1,918,140 708 13 61,303,612 22,750 3.13 6California…………….. 7.25 6 35,116 23,816,406 678 18 1,129,868,238 32,655 2.11 28Colorado……………… 2.9 2.9 4,507 1,901,972 422 41 148,238,613 33,455 1.28 42Connecticut………….. 6 6 3,461 3,043,971 880 5 145,547,796 42,377 2.09 29Florida………………… 6 6 16,713 14,408,709 862 6 475,606,702 29,048 3.03 9Georgia……………….. 4 4 8,560 4,833,521 565 31 239,753,556 28,523 2.02 31Hawaii………………… 4 4 1,245 1,612,333 1,295 2 35,625,115 29,034 4.53 1Idaho………………….. 6 5 1,341 795,384 593 27 32,362,804 24,506 2.46 14Illinois………………… 6.25 6.25 12,601 6,419,156 509 36 413,043,768 32,990 1.55 38Indiana………………… 6 5 6,159 3,798,490 617 24 168,621,697 27,522 2.25 24Iowa…………………… 5 5 2,937 1,747,016 595 25 79,822,447 27,225 2.19 25Kansas………………… 5.3 4.9 2,716 1,799,485 663 20 76,828,166 28,432 2.34 17Kentucky…………….. 6 6 4,093 2,312,224 565 30 101,222,546 24,878 2.28 21Louisiana…………….. 4 4 4,483 2,326,873 519 35 109,317,405 24,454 2.13 27Maine…………………. 5 5 1,294 836,134 646 22 34,491,316 26,853 2.42 15Maryland…………….. 5 5 5,458 2,690,434 493 38 190,014,792 35,279 1.42 41Massachusetts……….. 5 5 6,428 3,695,874 575 28 248,777,745 38,864 1.49 39Michigan……………… 6 6 10,050 7,784,308 775 10 296,480,397 29,629 2.63 12Minnesota……………. 6.5 6.5 5,020 3,740,660 745 11 164,784,335 33,059 2.27 23Mississippi……………. 7 7 2,872 2,340,474 815 7 61,922,038 21,653 3.78 3Missouri………………. 4.225 4.225 5,673 2,854,718 503 37 159,093,214 28,221 1.79 35Nebraska……………… 5.5 5 1,729 1,069,185 618 23 49,642,391 28,861 2.15 26Nevada……………….. 6.50 6.50 2,173 2,070,013 952 3 63,200,370 30,128 3.28 4New Jersey…………… 6 6 8,590 5,996,839 698 14 328,742,929 38,625 1.82 34New Mexico…………. 5 5 1,855 1,337,321 721 12 42,260,462 23,081 3.16 5New York…………….. 4.25 4 19,158 8,607,718 449 39 684,703,928 35,878 1.26 43North Carolina………. 4.5 4.5 8,320 3,212,098 386 43 224,093,955 27,308 1.43 40North Dakota……….. 5 5 634 335,613 529 34 16,421,689 25,798 2.04 30Ohio…………………… 6 5 11,421 6,391,475 560 32 326,876,143 28,699 1.96 32Oklahoma……………. 4.5 4.5 3,494 1,529,465 438 40 86,549,589 24,945 1.77 36Pennsylvania………… 6 6 12,335 7,330,422 594 26 378,350,395 30,752 1.94 33Rhode Island…………. 7 7 1,070 731,597 684 16 32,060,552 30,256 2.28 21South Carolina………. 5 5 4,107 2,335,170 569 29 100,901,536 24,840 2.31 20South Dakota………… 4 4 761 523,001 687 15 20,145,602 26,566 2.60 13Tennessee……………. 7 6 5,797 4,674,896 806 8 154,129,629 26,808 3.03 9Texas…………………. 6.25 6.25 21,780 14,559,504 668 19 608,465,986 28,472 2.39 16Utah…………………… 4.75 4.75 2,316 1,500,278 648 21 54,763,859 24,033 2.74 11Vermont……………… 6 5 617 214,841 348 45 17,626,599 28,756 1.22 44Virginia……………….. 3.5 3.5 7,294 2,799,526 384 44 232,730,432 32,338 1.20 45Washington………….. 6.5 6.5 6,069 7,904,003 1,302 1 191,644,569 31,976 4.12 2West Virginia………… 6 6 1,802 962,756 534 33 41,173,821 22,862 2.34 17Wisconsin……………. 5 5 5,441 3,695,796 679 17 157,831,749 29,196 2.34 17Wyoming…………….. 4 4 499 445,479 893 4 14,608,814 29,587 3.05 8
Total 45 states….. ------ ------ 280,642 178,941,291 638 a ------ 8,446,370,050 30,097 a 2.12 ------District of Columbia… 5.75 5.75 571 612,354 1,072 3 23,262,315 40,740 2.63 12Sources: U.S. Census Bureau, Governments Division. Table ST-EST2002-01-State Population Estimates: April 1, 2000 to July 1, 2002, Population Division, December 20, 2002 release. U.S. Census Bureau, Governments Division. State Government Tax Collections: 2002. Bureau of Economic Analysis. Table SAI-3, Regional Economic Information System , April 23, 2003 release. + Federation of Tax Administrators. Sales Tax Institute. Office of Tax and Revenue, District of Columbia. The ranking shown for District of Columbia merely indicates its relative placement in comparison with the states in the table and does not affect state ranPer capita amounts based on midyear population estimates of the Bureau of the Census. Per capita personal income is total personal income divided by total midyear population.All dollar amounts are in current dollars (not adjusted for inflation). aWeighted averages computed on collection totals for 45 states levying a general state sales tax. *Includes general sales tax, use tax, gross income and gross receipts taxes, but excludes excise taxes levied on specific commodities and services. Collection data are for fiscal yearending in 2002. Income data are for calendar year ending December 31, 2001.**Data for some states include state-collected local sales tax. North Carolina sales tax data include $12,110,709 retained by state to pay for the costs of collecting and distributing local sales taxes.
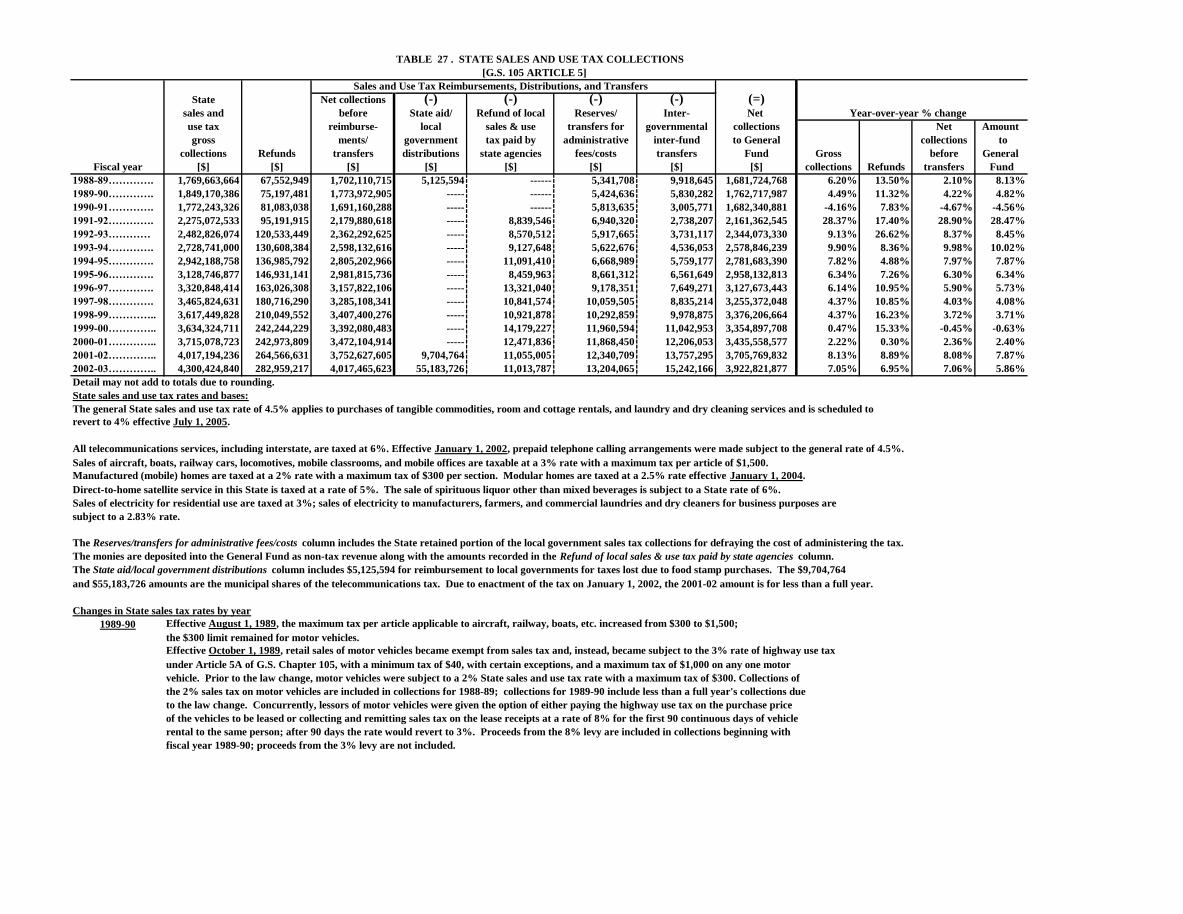
TABLE 27 . STATE SALES AND USE TAX COLLECTIONS
[G.S. 105 ARTICLE 5]
Sales and Use Tax Reimbursements, Distributions, and Transfers
State Net collections (-) (-) (-) (-) (=)sales and before State aid/ Refund of local Reserves/ Inter- Net Year-over-year % change
use tax reimburse- local sales & use transfers for governmental collections Net Amount
gross ments/ government tax paid by administrative inter-fund to General collections to
collections Refunds transfers distributions state agencies fees/costs transfers Fund Gross before General
Fiscal year [$] [$] [$] [$] [$] [$] [$] [$] collections Refunds transfers Fund
1988-89…………. 1,769,663,664 67,552,949 1,702,110,715 5,125,594 ------ 5,341,708 9,918,645 1,681,724,768 6.20% 13.50% 2.10% 8.13%
1989-90…………. 1,849,170,386 75,197,481 1,773,972,905 ----- ------ 5,424,636 5,830,282 1,762,717,987 4.49% 11.32% 4.22% 4.82%
1990-91…………. 1,772,243,326 81,083,038 1,691,160,288 ----- ------ 5,813,635 3,005,771 1,682,340,881 -4.16% 7.83% -4.67% -4.56%
1991-92…………. 2,275,072,533 95,191,915 2,179,880,618 ----- 8,839,546 6,940,320 2,738,207 2,161,362,545 28.37% 17.40% 28.90% 28.47%
1992-93………… 2,482,826,074 120,533,449 2,362,292,625 ----- 8,570,512 5,917,665 3,731,117 2,344,073,330 9.13% 26.62% 8.37% 8.45%
1993-94…………. 2,728,741,000 130,608,384 2,598,132,616 ----- 9,127,648 5,622,676 4,536,053 2,578,846,239 9.90% 8.36% 9.98% 10.02%
1994-95…………. 2,942,188,758 136,985,792 2,805,202,966 ----- 11,091,410 6,668,989 5,759,177 2,781,683,390 7.82% 4.88% 7.97% 7.87%
1995-96…………. 3,128,746,877 146,931,141 2,981,815,736 ----- 8,459,963 8,661,312 6,561,649 2,958,132,813 6.34% 7.26% 6.30% 6.34%
1996-97…………. 3,320,848,414 163,026,308 3,157,822,106 ----- 13,321,040 9,178,351 7,649,271 3,127,673,443 6.14% 10.95% 5.90% 5.73%
1997-98…………. 3,465,824,631 180,716,290 3,285,108,341 ----- 10,841,574 10,059,505 8,835,214 3,255,372,048 4.37% 10.85% 4.03% 4.08%
1998-99………….. 3,617,449,828 210,049,552 3,407,400,276 ----- 10,921,878 10,292,859 9,978,875 3,376,206,664 4.37% 16.23% 3.72% 3.71%
1999-00………….. 3,634,324,711 242,244,229 3,392,080,483 ----- 14,179,227 11,960,594 11,042,953 3,354,897,708 0.47% 15.33% -0.45% -0.63%
2000-01………….. 3,715,078,723 242,973,809 3,472,104,914 ----- 12,471,836 11,868,450 12,206,053 3,435,558,577 2.22% 0.30% 2.36% 2.40%
2001-02………….. 4,017,194,236 264,566,631 3,752,627,605 9,704,764 11,055,005 12,340,709 13,757,295 3,705,769,832 8.13% 8.89% 8.08% 7.87%
2002-03………….. 4,300,424,840 282,959,217 4,017,465,623 55,183,726 11,013,787 13,204,065 15,242,166 3,922,821,877 7.05% 6.95% 7.06% 5.86%
Detail may not add to totals due to rounding.
State sales and use tax rates and bases:
The general State sales and use tax rate of 4.5% applies to purchases of tangible commodities, room and cottage rentals, and laundry and dry cleaning services and is scheduled to
revert to 4% effective July 1, 2005.
All telecommunications services, including interstate, are taxed at 6%. Effective January 1, 2002, prepaid telephone calling arrangements were made subject to the general rate of 4.5%.
Sales of aircraft, boats, railway cars, locomotives, mobile classrooms, and mobile offices are taxable at a 3% rate with a maximum tax per article of $1,500.
Manufactured (mobile) homes are taxed at a 2% rate with a maximum tax of $300 per section. Modular homes are taxed at a 2.5% rate effective January 1, 2004.
Direct-to-home satellite service in this State is taxed at a rate of 5%. The sale of spirituous liquor other than mixed beverages is subject to a State rate of 6%.
Sales of electricity for residential use are taxed at 3%; sales of electricity to manufacturers, farmers, and commercial laundries and dry cleaners for business purposes are
subject to a 2.83% rate.
The Reserves/transfers for administrative fees/costs column includes the State retained portion of the local government sales tax collections for defraying the cost of administering the tax.
The monies are deposited into the General Fund as non-tax revenue along with the amounts recorded in the Refund of local sales & use tax paid by state agencies column.
The State aid/local government distributions column includes $5,125,594 for reimbursement to local governments for taxes lost due to food stamp purchases. The $9,704,764
and $55,183,726 amounts are the municipal shares of the telecommunications tax. Due to enactment of the tax on January 1, 2002, the 2001-02 amount is for less than a full year.
Changes in State sales tax rates by year
1989-90 Effective August 1, 1989, the maximum tax per article applicable to aircraft, railway, boats, etc. increased from $300 to $1,500;
the $300 limit remained for motor vehicles.
Effective October 1, 1989, retail sales of motor vehicles became exempt from sales tax and, instead, became subject to the 3% rate of highway use tax
under Article 5A of G.S. Chapter 105, with a minimum tax of $40, with certain exceptions, and a maximum tax of $1,000 on any one motor
vehicle. Prior to the law change, motor vehicles were subject to a 2% State sales and use tax rate with a maximum tax of $300. Collections of
the 2% sales tax on motor vehicles are included in collections for 1988-89; collections for 1989-90 include less than a full year's collections due
to the law change. Concurrently, lessors of motor vehicles were given the option of either paying the highway use tax on the purchase price
of the vehicles to be leased or collecting and remitting sales tax on the lease receipts at a rate of 8% for the first 90 continuous days of vehicle
rental to the same person; after 90 days the rate would revert to 3%. Proceeds from the 8% levy are included in collections beginning with
fiscal year 1989-90; proceeds from the 3% levy are not included.
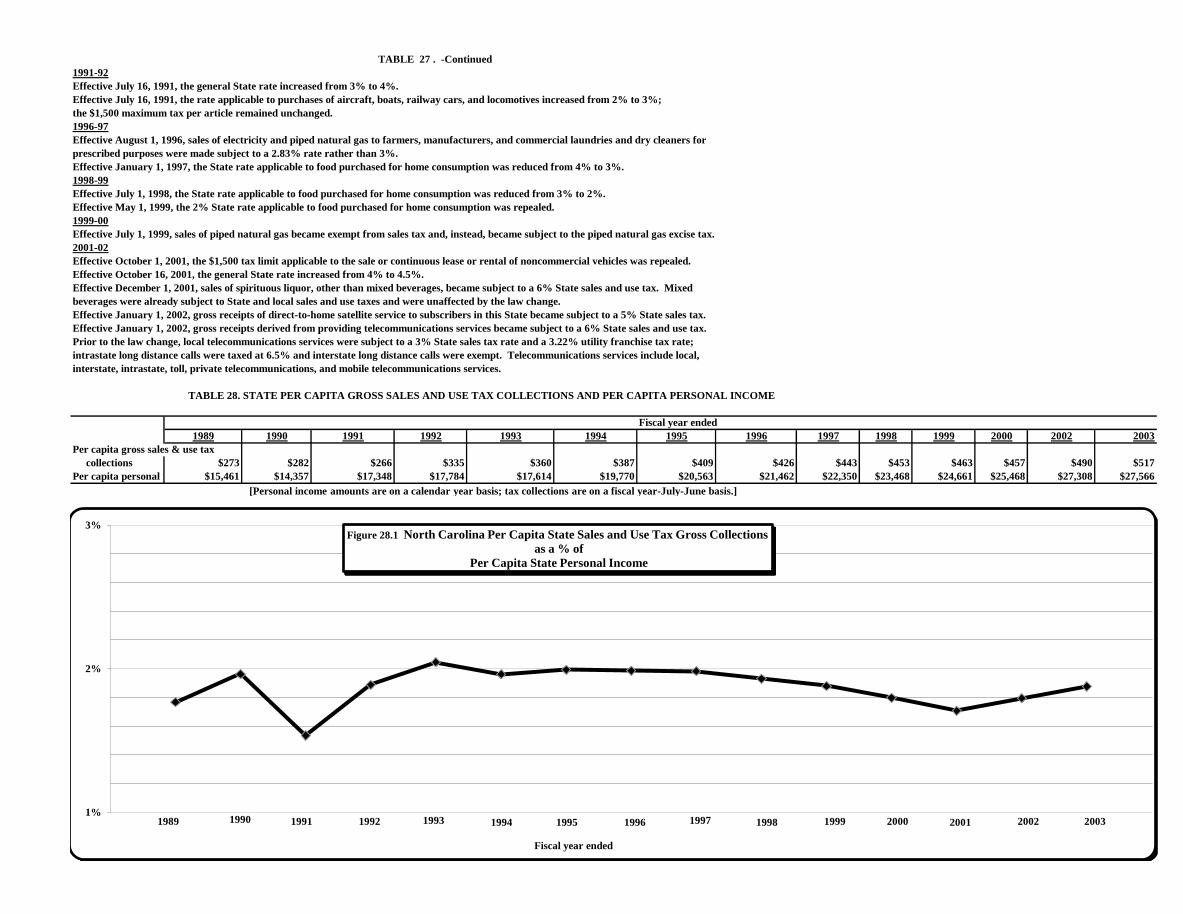
TABLE 27 . -Continued
1991-92
Effective July 16, 1991, the general State rate increased from 3% to 4%.
Effective July 16, 1991, the rate applicable to purchases of aircraft, boats, railway cars, and locomotives increased from 2% to 3%;
the $1,500 maximum tax per article remained unchanged.
1996-97
Effective August 1, 1996, sales of electricity and piped natural gas to farmers, manufacturers, and commercial laundries and dry cleaners for
prescribed purposes were made subject to a 2.83% rate rather than 3%.
Effective January 1, 1997, the State rate applicable to food purchased for home consumption was reduced from 4% to 3%.
1998-99
Effective July 1, 1998, the State rate applicable to food purchased for home consumption was reduced from 3% to 2%.
Effective May 1, 1999, the 2% State rate applicable to food purchased for home consumption was repealed.
1999-00
Effective July 1, 1999, sales of piped natural gas became exempt from sales tax and, instead, became subject to the piped natural gas excise tax.
2001-02
Effective October 1, 2001, the $1,500 tax limit applicable to the sale or continuous lease or rental of noncommercial vehicles was repealed.
Effective October 16, 2001, the general State rate increased from 4% to 4.5%.
Effective December 1, 2001, sales of spirituous liquor, other than mixed beverages, became subject to a 6% State sales and use tax. Mixed
beverages were already subject to State and local sales and use taxes and were unaffected by the law change.
Effective January 1, 2002, gross receipts of direct-to-home satellite service to subscribers in this State became subject to a 5% State sales tax.
Effective January 1, 2002, gross receipts derived from providing telecommunications services became subject to a 6% State sales and use tax.
Prior to the law change, local telecommunications services were subject to a 3% State sales tax rate and a 3.22% utility franchise tax rate;
intrastate long distance calls were taxed at 6.5% and interstate long distance calls were exempt. Telecommunications services include local,
interstate, intrastate, toll, private telecommunications, and mobile telecommunications services.
TABLE 28. STATE PER CAPITA GROSS SALES AND USE TAX COLLECTIONS AND PER CAPITA PERSONAL INCOME
Fiscal year ended
1989 1990 1991 1992 1993 1994 1995 1996 1997 1998 1999 2000 2002 2003
Per capita gross sales & use tax
collections $273 $282 $266 $335 $360 $387 $409 $426 $443 $453 $463 $457 $490 $517
Per capita personal income $15,461 $14,357 $17,348 $17,784 $17,614 $19,770 $20,563 $21,462 $22,350 $23,468 $24,661 $25,468 $27,308 $27,566
1989 1990 1991 1992 1993 1994 1995 1996 1997 1998 1999 2000 2002 2003
Per capita gross sales & use tax collections as % or pcpi1.77% 1.96% 1.53% 1.89% 2.04% 1.96% 1.99% 1.98% 1.98% 1.93% 1.88% 1.80% 1.79% 1.88%
[Personal income amounts are on a calendar year basis; tax collections are on a fiscal year-July-June basis.]
1989 1990 1991 1992 1993 1994 1995 1996 1997 1998 1999 2000 2001 2002 2003 1%
2%
3%
Fiscal year ended
Figure 28.1 North Carolina Per Capita State Sales and Use Tax Gross Collections
as a % of
Per Capita State Personal Income
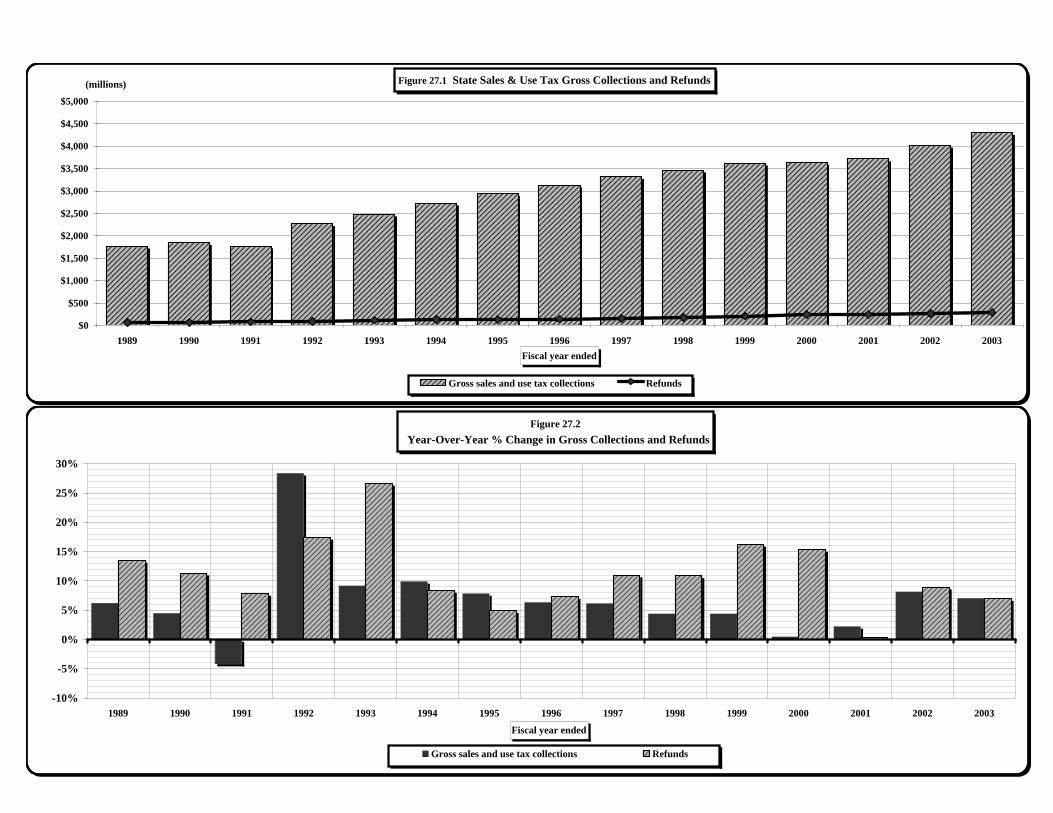
1989 1990 1991 1992 1993 1994 1995 1996 1997 1998 1999 2000 2001 2002 2003Gross sales and1,769,663,664 1,849,170,386 1,772,243,326 2,275,072,533 2,482,826,074 2,728,741,000 2,942,188,758 3,128,746,877 3,320,848,414 3,465,851,486 3,617,449,828 3,634,324,711 3,715,078,723 4,017,194,236 4,300,424,840Refunds 67,552,949 75,197,481 81,083,038 95,191,915 120,533,449 130,608,384 136,985,792 146,931,141 163,026,308 180,716,290 210,049,552 242,244,229 242,973,809 264,566,631 282,959,217
1989 1990 1991 1992 1993 1994 1995 1996 1997 1998 1999 2000 2001 2002 2003Gross sales and 6.20% 4.49% -4.16% 28.37% 9.13% 9.90% 7.82% 6.34% 6.14% 4.37% 4.37% 0.47% 2.22% 8.13% 7.05%Refunds 13.50% 11.32% 7.83% 17.40% 26.62% 8.36% 4.88% 7.26% 10.95% 10.85% 16.23% 15.33% 0.30% 8.89% 6.95%
Figure 27.2 Year-Over-Year % Change in Gross Collections and Refunds
-10%
-5%
0%
5%
10%
15%
20%
25%
30%
1989 1990 1991 1992 1993 1994 1995 1996 1997 1998 1999 2000 2001 2002 2003
Fiscal year ended
Gross sales and use tax collections Refunds
Figure 27.1 State Sales & Use Tax Gross Collections and Refunds
$0
$500
$1,000
$1,500
$2,000
$2,500
$3,000
$3,500
$4,000
$4,500
$5,000
1989 1990 1991 1992 1993 1994 1995 1996 1997 1998 1999 2000 2001 2002 2003Fiscal year ended
(millions)
Gross sales and use tax collections Refunds
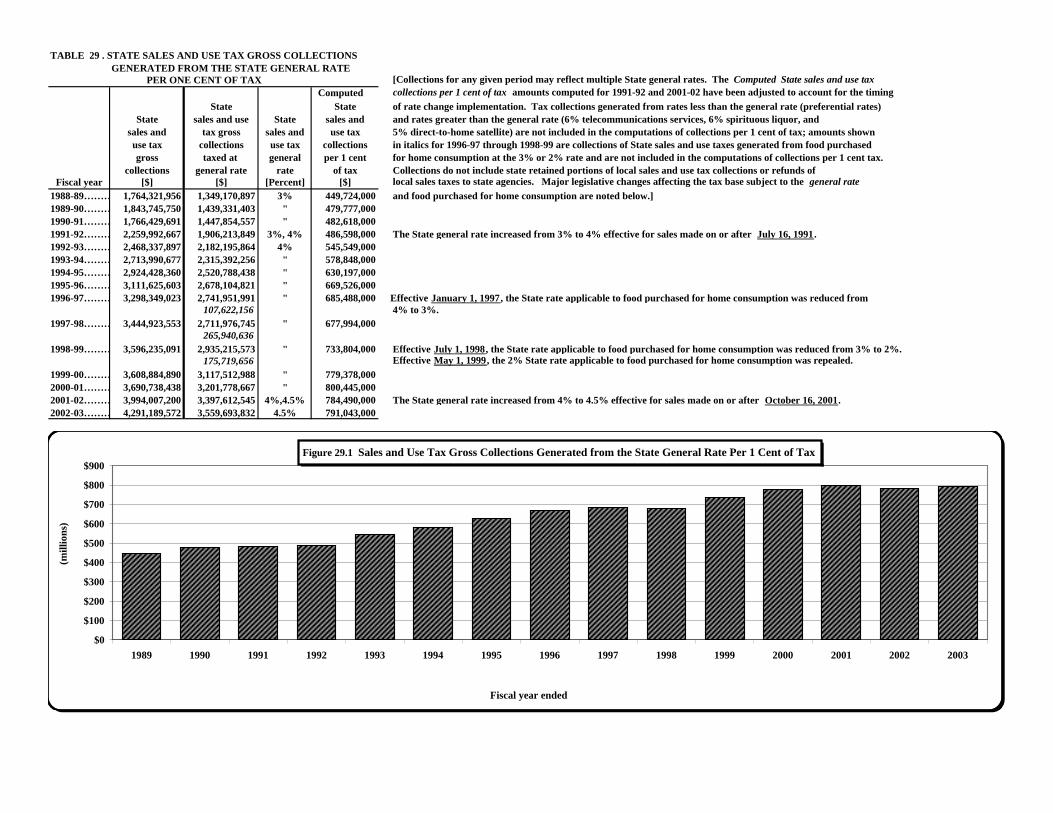
TABLE 29 . STATE SALES AND USE TAX GROSS COLLECTIONS GENERATED FROM THE STATE GENERAL RATE PER ONE CENT OF TAX [Collections for any given period may reflect multiple State general rates. The Computed State sales and use tax
Computed collections per 1 cent of tax amounts computed for 1991-92 and 2001-02 have been adjusted to account for the timingState State of rate change implementation. Tax collections generated from rates less than the general rate (preferential rates)
State sales and use State sales and and rates greater than the general rate (6% telecommunications services, 6% spirituous liquor, and sales and tax gross sales and use tax 5% direct-to-home satellite) are not included in the computations of collections per 1 cent of tax; amounts shown use tax collections use tax collections in italics for 1996-97 through 1998-99 are collections of State sales and use taxes generated from food purchased gross taxed at general per 1 cent for home consumption at the 3% or 2% rate and are not included in the computations of collections per 1 cent tax.
collections general rate rate of tax Collections do not include state retained portions of local sales and use tax collections or refunds of Fiscal year [$] [$] [Percent] [$] local sales taxes to state agencies. Major legislative changes affecting the tax base subject to the general rate
1988-89……… 1,764,321,956 1,349,170,897 3% 449,724,000 and food purchased for home consumption are noted below.] 1989-90……… 1,843,745,750 1,439,331,403 " 479,777,0001990-91……… 1,766,429,691 1,447,854,557 " 482,618,0001991-92……… 2,259,992,667 1,906,213,849 3%, 4% 486,598,000 The State general rate increased from 3% to 4% effective for sales made on or after July 16, 1991. 1992-93……… 2,468,337,897 2,182,195,864 4% 545,549,0001993-94……… 2,713,990,677 2,315,392,256 " 578,848,0001994-95……… 2,924,428,360 2,520,788,438 " 630,197,000 1995-96……… 3,111,625,603 2,678,104,821 " 669,526,0001996-97……… 3,298,349,023 2,741,951,991 " 685,488,000 Effective January 1, 1997, the State rate applicable to food purchased for home consumption was reduced from
107,622,156 4% to 3%.1997-98……… 3,444,923,553 2,711,976,745 " 677,994,000
265,940,6361998-99……… 3,596,235,091 2,935,215,573 " 733,804,000 Effective July 1, 1998, the State rate applicable to food purchased for home consumption was reduced from 3% to 2%.
175,719,656 Effective May 1, 1999, the 2% State rate applicable to food purchased for home consumption was repealed.1999-00……… 3,608,884,890 3,117,512,988 " 779,378,000 2000-01……… 3,690,738,438 3,201,778,667 " 800,445,0002001-02……… 3,994,007,200 3,397,612,545 4%,4.5% 784,490,000 The State general rate increased from 4% to 4.5% effective for sales made on or after October 16, 2001. 2002-03……… 4,291,189,572 3,559,693,832 4.5% 791,043,000
1989 449,724,0001990 479,777,000 `1991 482,618,0001992 486,598,0001993 545,549,0001994 578,848,0001995 630,197,0001996 669,526,0001997 685,488,0001998 677,994,0001999 733,804,0002000 779,378,0002001 800,445,0002002 784,490,0002003 791,043,000
Figure 29.1 Sales and Use Tax Gross Collections Generated from the State General Rate Per 1 Cent of Tax
$0
$100
$200
$300
$400
$500
$600
$700
$800
$900
1989 1990 1991 1992 1993 1994 1995 1996 1997 1998 1999 2000 2001 2002 2003
(mill
ions
)
Fiscal year ended
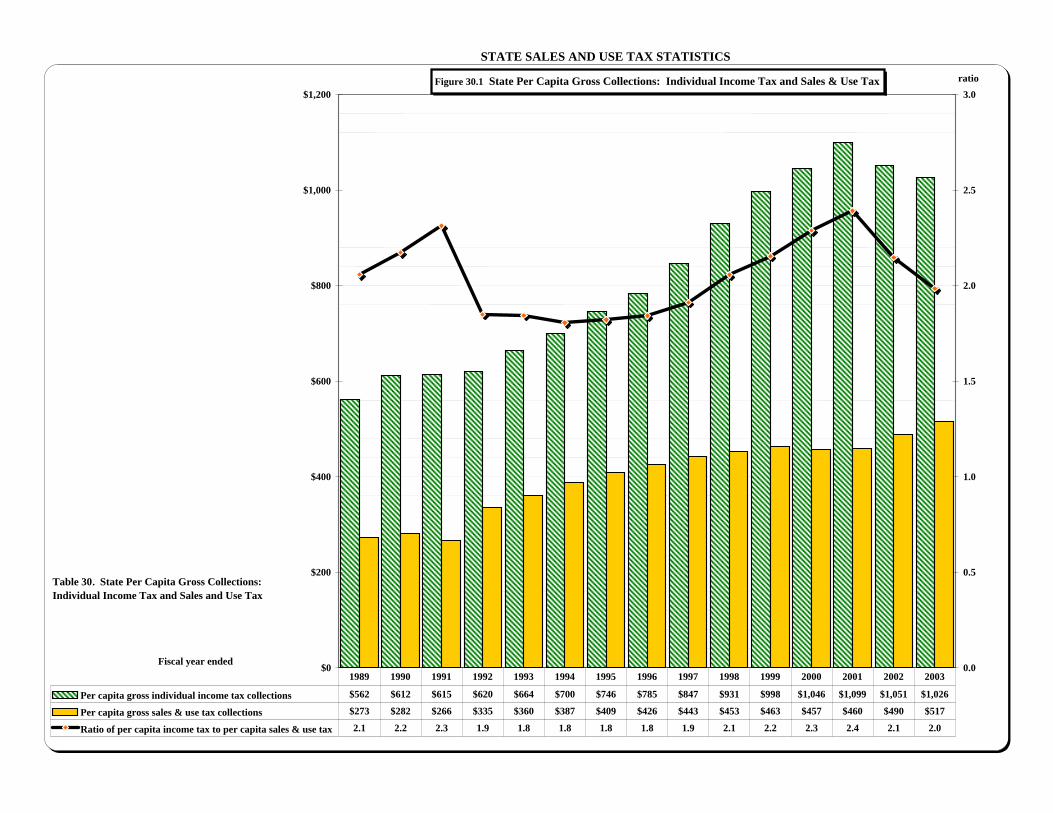
STATE SALES AND USE TAX STATISTICS
1989 1990 1991 1992 1993 1994 1995 1996 1997 1998 1999 2000 2001 2002Per capita gros $562 $612 $615 $620 $664 $700 $746 $785 $847 $931 $998 $1,046 $1,099 $1,051Per capita gros $273 $282 $266 $335 $360 $387 $409 $426 $443 $453 $463 $457 $460 $490Ratio of per ca 2.1 2.2 2.3 1.9 1.8 1.8 1.8 1.8 1.9 2.1 2.2 2.3 2.4 2.1
Table 30. State Per Capita Gross Collections:Individual Income Tax and Sales and Use Tax
Fiscal year ended
Figure 30.1 State Per Capita Gross Collections: Individual Income Tax and Sales & Use Tax
$0
$200
$400
$600
$800
$1,000
$1,200
0.0
0.5
1.0
1.5
2.0
2.5
3.0ratio
Per capita gross individual income tax collections $562 $612 $615 $620 $664 $700 $746 $785 $847 $931 $998 $1,046 $1,099 $1,051 $1,026
Per capita gross sales & use tax collections $273 $282 $266 $335 $360 $387 $409 $426 $443 $453 $463 $457 $460 $490 $517
Ratio of per capita income tax to per capita sales & use tax 2.1 2.2 2.3 1.9 1.8 1.8 1.8 1.8 1.9 2.1 2.2 2.3 2.4 2.1 2.0
1989 1990 1991 1992 1993 1994 1995 1996 1997 1998 1999 2000 2001 2002 2003
Table 30. State Per Capita Gross Collections:Individual Income Tax and Sales and Use Tax
Fiscal year ended
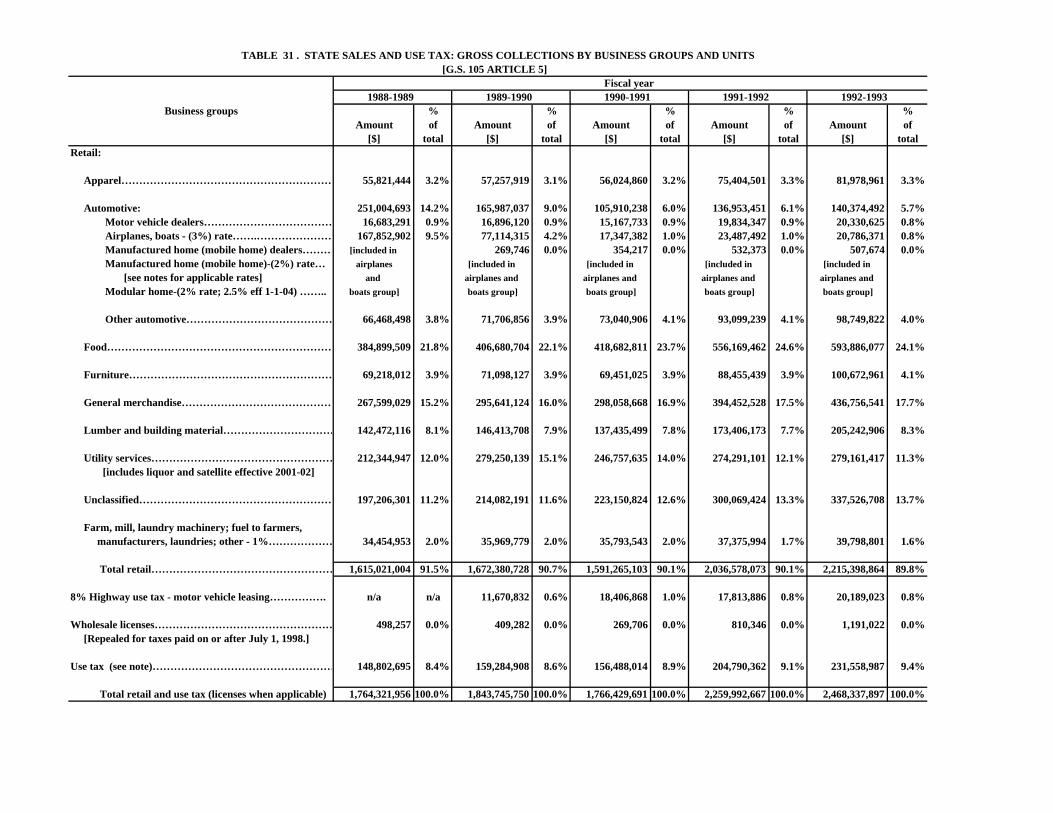
TABLE 31 . STATE SALES AND USE TAX: GROSS COLLECTIONS BY BUSINESS GROUPS AND UNITS [G.S. 105 ARTICLE 5]
Fiscal year 1988-1989 1989-1990 1990-1991 1991-1992 1992-1993
Business groups % % % % %Amount of Amount of Amount of Amount of Amount of
[$] total [$] total [$] total [$] total [$] totalRetail:
Apparel…………………………………………………… 55,821,444 3.2% 57,257,919 3.1% 56,024,860 3.2% 75,404,501 3.3% 81,978,961 3.3%
Automotive: 251,004,693 14.2% 165,987,037 9.0% 105,910,238 6.0% 136,953,451 6.1% 140,374,492 5.7% Motor vehicle dealers……………………………… 16,683,291 0.9% 16,896,120 0.9% 15,167,733 0.9% 19,834,347 0.9% 20,330,625 0.8% Airplanes, boats - (3%) rate…….…………………… 167,852,902 9.5% 77,114,315 4.2% 17,347,382 1.0% 23,487,492 1.0% 20,786,371 0.8% Manufactured home (mobile home) dealers……… [included in 269,746 0.0% 354,217 0.0% 532,373 0.0% 507,674 0.0% Manufactured home (mobile home)-(2%) rate… airplanes [included in [included in [included in [included in [see notes for applicable rates] and airplanes and airplanes and airplanes and airplanes and Modular home-(2% rate; 2.5% eff 1-1-04) …….. boats group] boats group] boats group] boats group] boats group]
Other automotive…………………………………… 66,468,498 3.8% 71,706,856 3.9% 73,040,906 4.1% 93,099,239 4.1% 98,749,822 4.0%
Food………………………………………………………… 384,899,509 21.8% 406,680,704 22.1% 418,682,811 23.7% 556,169,462 24.6% 593,886,077 24.1%
Furniture………………………………………………… 69,218,012 3.9% 71,098,127 3.9% 69,451,025 3.9% 88,455,439 3.9% 100,672,961 4.1%
General merchandise……………………………………… 267,599,029 15.2% 295,641,124 16.0% 298,058,668 16.9% 394,452,528 17.5% 436,756,541 17.7%
Lumber and building material…………………………… 142,472,116 8.1% 146,413,708 7.9% 137,435,499 7.8% 173,406,173 7.7% 205,242,906 8.3%
Utility services…………………………………………… 212,344,947 12.0% 279,250,139 15.1% 246,757,635 14.0% 274,291,101 12.1% 279,161,417 11.3% [includes liquor and satellite effective 2001-02]
Unclassified………………………………………………… 197,206,301 11.2% 214,082,191 11.6% 223,150,824 12.6% 300,069,424 13.3% 337,526,708 13.7%
Farm, mill, laundry machinery; fuel to farmers, manufacturers, laundries; other - 1%……………… 34,454,953 2.0% 35,969,779 2.0% 35,793,543 2.0% 37,375,994 1.7% 39,798,801 1.6%
Total retail…………………………………………… 1,615,021,004 91.5% 1,672,380,728 90.7% 1,591,265,103 90.1% 2,036,578,073 90.1% 2,215,398,864 89.8%
8% Highway use tax - motor vehicle leasing……………. n/a n/a 11,670,832 0.6% 18,406,868 1.0% 17,813,886 0.8% 20,189,023 0.8%
Wholesale licenses…………………………………………… 498,257 0.0% 409,282 0.0% 269,706 0.0% 810,346 0.0% 1,191,022 0.0% [Repealed for taxes paid on or after July 1, 1998.]
Use tax (see note)…………………………………………… 148,802,695 8.4% 159,284,908 8.6% 156,488,014 8.9% 204,790,362 9.1% 231,558,987 9.4%
Total retail and use tax (licenses when applicable) 1,764,321,956 100.0% 1,843,745,750 100.0% 1,766,429,691 100.0% 2,259,992,667 100.0% 2,468,337,897 100.0%
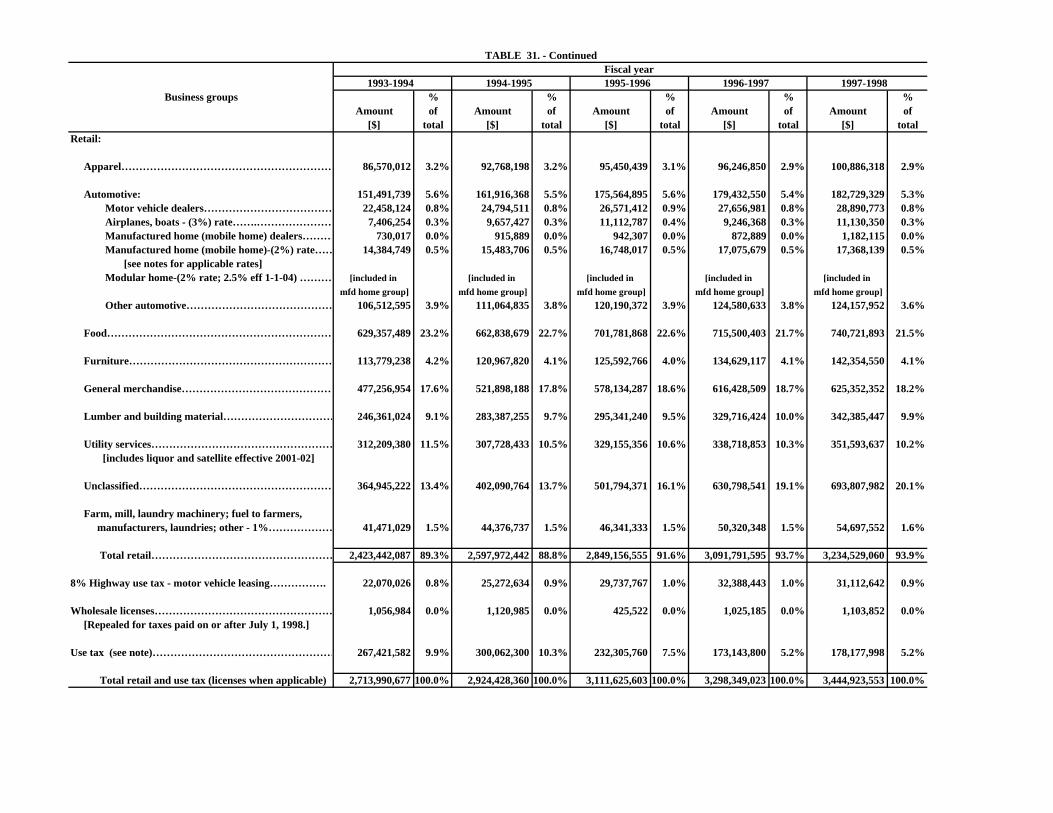
TABLE 31. - Continued Fiscal year
1993-1994 1994-1995 1995-1996 1996-1997 1997-1998Business groups % % % % %
Amount of Amount of Amount of Amount of Amount of[$] total [$] total [$] total [$] total [$] total
Retail:
Apparel…………………………………………………… 86,570,012 3.2% 92,768,198 3.2% 95,450,439 3.1% 96,246,850 2.9% 100,886,318 2.9%
Automotive: 151,491,739 5.6% 161,916,368 5.5% 175,564,895 5.6% 179,432,550 5.4% 182,729,329 5.3% Motor vehicle dealers……………………………… 22,458,124 0.8% 24,794,511 0.8% 26,571,412 0.9% 27,656,981 0.8% 28,890,773 0.8% Airplanes, boats - (3%) rate…….…………………… 7,406,254 0.3% 9,657,427 0.3% 11,112,787 0.4% 9,246,368 0.3% 11,130,350 0.3% Manufactured home (mobile home) dealers……… 730,017 0.0% 915,889 0.0% 942,307 0.0% 872,889 0.0% 1,182,115 0.0% Manufactured home (mobile home)-(2%) rate…… 14,384,749 0.5% 15,483,706 0.5% 16,748,017 0.5% 17,075,679 0.5% 17,368,139 0.5% [see notes for applicable rates] Modular home-(2% rate; 2.5% eff 1-1-04) ……… [included in [included in [included in [included in [included in
mfd home group] mfd home group] mfd home group] mfd home group] mfd home group] Other automotive…………………………………… 106,512,595 3.9% 111,064,835 3.8% 120,190,372 3.9% 124,580,633 3.8% 124,157,952 3.6%
Food………………………………………………………… 629,357,489 23.2% 662,838,679 22.7% 701,781,868 22.6% 715,500,403 21.7% 740,721,893 21.5%
Furniture………………………………………………… 113,779,238 4.2% 120,967,820 4.1% 125,592,766 4.0% 134,629,117 4.1% 142,354,550 4.1%
General merchandise……………………………………… 477,256,954 17.6% 521,898,188 17.8% 578,134,287 18.6% 616,428,509 18.7% 625,352,352 18.2%
Lumber and building material…………………………… 246,361,024 9.1% 283,387,255 9.7% 295,341,240 9.5% 329,716,424 10.0% 342,385,447 9.9%
Utility services…………………………………………… 312,209,380 11.5% 307,728,433 10.5% 329,155,356 10.6% 338,718,853 10.3% 351,593,637 10.2% [includes liquor and satellite effective 2001-02]
Unclassified………………………………………………… 364,945,222 13.4% 402,090,764 13.7% 501,794,371 16.1% 630,798,541 19.1% 693,807,982 20.1%
Farm, mill, laundry machinery; fuel to farmers, manufacturers, laundries; other - 1%……………… 41,471,029 1.5% 44,376,737 1.5% 46,341,333 1.5% 50,320,348 1.5% 54,697,552 1.6%
Total retail…………………………………………… 2,423,442,087 89.3% 2,597,972,442 88.8% 2,849,156,555 91.6% 3,091,791,595 93.7% 3,234,529,060 93.9%
8% Highway use tax - motor vehicle leasing……………. 22,070,026 0.8% 25,272,634 0.9% 29,737,767 1.0% 32,388,443 1.0% 31,112,642 0.9%
Wholesale licenses…………………………………………… 1,056,984 0.0% 1,120,985 0.0% 425,522 0.0% 1,025,185 0.0% 1,103,852 0.0% [Repealed for taxes paid on or after July 1, 1998.]
Use tax (see note)…………………………………………… 267,421,582 9.9% 300,062,300 10.3% 232,305,760 7.5% 173,143,800 5.2% 178,177,998 5.2%
Total retail and use tax (licenses when applicable) 2,713,990,677 100.0% 2,924,428,360 100.0% 3,111,625,603 100.0% 3,298,349,023 100.0% 3,444,923,553 100.0%
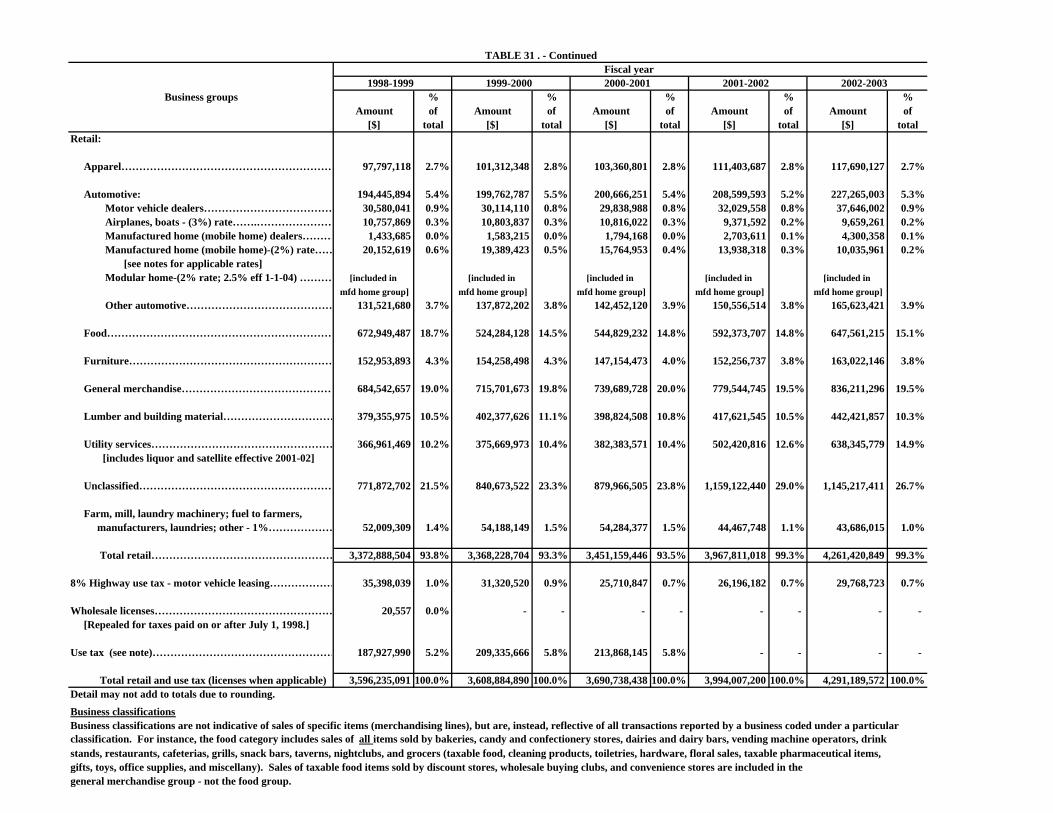
TABLE 31 . - Continued Fiscal year
1998-1999 1999-2000 2000-2001 2001-2002 2002-2003Business groups % % % % %
Amount of Amount of Amount of Amount of Amount of[$] total [$] total [$] total [$] total [$] total
Retail:
Apparel…………………………………………………… 97,797,118 2.7% 101,312,348 2.8% 103,360,801 2.8% 111,403,687 2.8% 117,690,127 2.7%
Automotive: 194,445,894 5.4% 199,762,787 5.5% 200,666,251 5.4% 208,599,593 5.2% 227,265,003 5.3% Motor vehicle dealers……………………………… 30,580,041 0.9% 30,114,110 0.8% 29,838,988 0.8% 32,029,558 0.8% 37,646,002 0.9% Airplanes, boats - (3%) rate…….…………………… 10,757,869 0.3% 10,803,837 0.3% 10,816,022 0.3% 9,371,592 0.2% 9,659,261 0.2% Manufactured home (mobile home) dealers……… 1,433,685 0.0% 1,583,215 0.0% 1,794,168 0.0% 2,703,611 0.1% 4,300,358 0.1% Manufactured home (mobile home)-(2%) rate…… 20,152,619 0.6% 19,389,423 0.5% 15,764,953 0.4% 13,938,318 0.3% 10,035,961 0.2% [see notes for applicable rates] Modular home-(2% rate; 2.5% eff 1-1-04) ……… [included in [included in [included in [included in [included in
mfd home group] mfd home group] mfd home group] mfd home group] mfd home group] Other automotive…………………………………… 131,521,680 3.7% 137,872,202 3.8% 142,452,120 3.9% 150,556,514 3.8% 165,623,421 3.9%
Food………………………………………………………… 672,949,487 18.7% 524,284,128 14.5% 544,829,232 14.8% 592,373,707 14.8% 647,561,215 15.1%
Furniture………………………………………………… 152,953,893 4.3% 154,258,498 4.3% 147,154,473 4.0% 152,256,737 3.8% 163,022,146 3.8%
General merchandise……………………………………… 684,542,657 19.0% 715,701,673 19.8% 739,689,728 20.0% 779,544,745 19.5% 836,211,296 19.5%
Lumber and building material…………………………… 379,355,975 10.5% 402,377,626 11.1% 398,824,508 10.8% 417,621,545 10.5% 442,421,857 10.3%
Utility services…………………………………………… 366,961,469 10.2% 375,669,973 10.4% 382,383,571 10.4% 502,420,816 12.6% 638,345,779 14.9% [includes liquor and satellite effective 2001-02]
Unclassified………………………………………………… 771,872,702 21.5% 840,673,522 23.3% 879,966,505 23.8% 1,159,122,440 29.0% 1,145,217,411 26.7%
Farm, mill, laundry machinery; fuel to farmers, manufacturers, laundries; other - 1%……………… 52,009,309 1.4% 54,188,149 1.5% 54,284,377 1.5% 44,467,748 1.1% 43,686,015 1.0%
Total retail…………………………………………… 3,372,888,504 93.8% 3,368,228,704 93.3% 3,451,159,446 93.5% 3,967,811,018 99.3% 4,261,420,849 99.3%
8% Highway use tax - motor vehicle leasing……………… 35,398,039 1.0% 31,320,520 0.9% 25,710,847 0.7% 26,196,182 0.7% 29,768,723 0.7%
Wholesale licenses…………………………………………… 20,557 0.0% - - - - - - - - [Repealed for taxes paid on or after July 1, 1998.]
Use tax (see note)…………………………………………… 187,927,990 5.2% 209,335,666 5.8% 213,868,145 5.8% - - - -
Total retail and use tax (licenses when applicable) 3,596,235,091 100.0% 3,608,884,890 100.0% 3,690,738,438 100.0% 3,994,007,200 100.0% 4,291,189,572 100.0%Detail may not add to totals due to rounding.
Business classificationsBusiness classifications are not indicative of sales of specific items (merchandising lines), but are, instead, reflective of all transactions reported by a business coded under a particularclassification. For instance, the food category includes sales of all items sold by bakeries, candy and confectionery stores, dairies and dairy bars, vending machine operators, drinkstands, restaurants, cafeterias, grills, snack bars, taverns, nightclubs, and grocers (taxable food, cleaning products, toiletries, hardware, floral sales, taxable pharmaceutical items, gifts, toys, office supplies, and miscellany). Sales of taxable food items sold by discount stores, wholesale buying clubs, and convenience stores are included in the general merchandise group - not the food group.
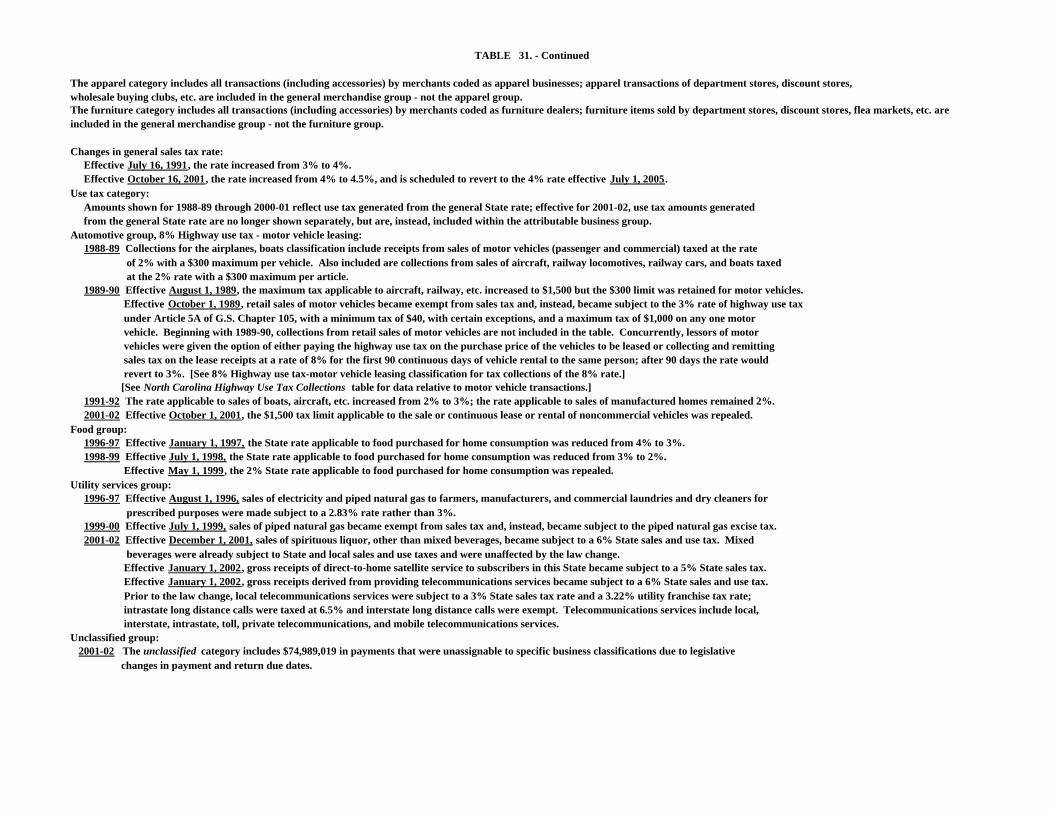
TABLE 31. - Continued
The apparel category includes all transactions (including accessories) by merchants coded as apparel businesses; apparel transactions of department stores, discount stores, wholesale buying clubs, etc. are included in the general merchandise group - not the apparel group. The furniture category includes all transactions (including accessories) by merchants coded as furniture dealers; furniture items sold by department stores, discount stores, flea markets, etc. areincluded in the general merchandise group - not the furniture group.
Changes in general sales tax rate: Effective July 16, 1991, the rate increased from 3% to 4%. Effective October 16, 2001, the rate increased from 4% to 4.5%, and is scheduled to revert to the 4% rate effective July 1, 2005.Use tax category: Amounts shown for 1988-89 through 2000-01 reflect use tax generated from the general State rate; effective for 2001-02, use tax amounts generated from the general State rate are no longer shown separately, but are, instead, included within the attributable business group.Automotive group, 8% Highway use tax - motor vehicle leasing: 1988-89 Collections for the airplanes, boats classification include receipts from sales of motor vehicles (passenger and commercial) taxed at the rate of 2% with a $300 maximum per vehicle. Also included are collections from sales of aircraft, railway locomotives, railway cars, and boats taxed at the 2% rate with a $300 maximum per article. 1989-90 Effective August 1, 1989, the maximum tax applicable to aircraft, railway, etc. increased to $1,500 but the $300 limit was retained for motor vehicles. Effective October 1, 1989, retail sales of motor vehicles became exempt from sales tax and, instead, became subject to the 3% rate of highway use tax under Article 5A of G.S. Chapter 105, with a minimum tax of $40, with certain exceptions, and a maximum tax of $1,000 on any one motor vehicle. Beginning with 1989-90, collections from retail sales of motor vehicles are not included in the table. Concurrently, lessors of motor vehicles were given the option of either paying the highway use tax on the purchase price of the vehicles to be leased or collecting and remitting sales tax on the lease receipts at a rate of 8% for the first 90 continuous days of vehicle rental to the same person; after 90 days the rate would revert to 3%. [See 8% Highway use tax-motor vehicle leasing classification for tax collections of the 8% rate.] [See North Carolina Highway Use Tax Collections table for data relative to motor vehicle transactions.] 1991-92 The rate applicable to sales of boats, aircraft, etc. increased from 2% to 3%; the rate applicable to sales of manufactured homes remained 2%. 2001-02 Effective October 1, 2001, the $1,500 tax limit applicable to the sale or continuous lease or rental of noncommercial vehicles was repealed.Food group: 1996-97 Effective January 1, 1997, the State rate applicable to food purchased for home consumption was reduced from 4% to 3%. 1998-99 Effective July 1, 1998, the State rate applicable to food purchased for home consumption was reduced from 3% to 2%. Effective May 1, 1999, the 2% State rate applicable to food purchased for home consumption was repealed.Utility services group: 1996-97 Effective August 1, 1996, sales of electricity and piped natural gas to farmers, manufacturers, and commercial laundries and dry cleaners for prescribed purposes were made subject to a 2.83% rate rather than 3%. 1999-00 Effective July 1, 1999, sales of piped natural gas became exempt from sales tax and, instead, became subject to the piped natural gas excise tax. 2001-02 Effective December 1, 2001, sales of spirituous liquor, other than mixed beverages, became subject to a 6% State sales and use tax. Mixed beverages were already subject to State and local sales and use taxes and were unaffected by the law change. Effective January 1, 2002, gross receipts of direct-to-home satellite service to subscribers in this State became subject to a 5% State sales tax. Effective January 1, 2002, gross receipts derived from providing telecommunications services became subject to a 6% State sales and use tax. Prior to the law change, local telecommunications services were subject to a 3% State sales tax rate and a 3.22% utility franchise tax rate; intrastate long distance calls were taxed at 6.5% and interstate long distance calls were exempt. Telecommunications services include local, interstate, intrastate, toll, private telecommunications, and mobile telecommunications services.Unclassified group: 2001-02 The unclassified category includes $74,989,019 in payments that were unassignable to specific business classifications due to legislative changes in payment and return due dates.
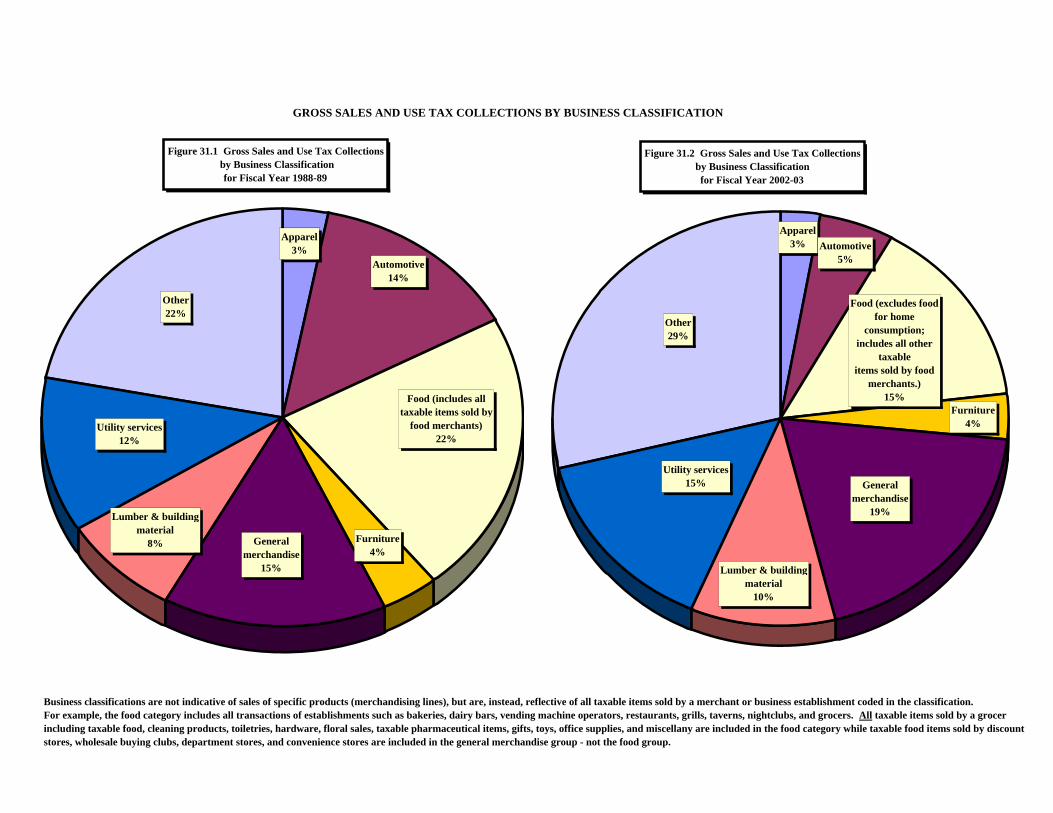
GROSS SALES AND USE TAX COLLECTIONS BY BUSINESS CLASSIFICATION
1988-89Apparel 55,821,444 2002-03Automotiv 251,004,693 Apparel 117,690,127Food 384,899,509 Automotiv 227,265,003Furniture 69,218,012 Food 647,561,215General m 267,599,029 Furniture 163,022,146Lumber & 142,472,116 General m 836,211,296Utility serv 212,344,947 Lumber & 442,421,857Other 386,303,914 Utility serv 638,345,779
Other 1,242,615,001
Business classifications are not indicative of sales of specific products (merchandising lines), but are, instead, reflective of all taxable items sold by a merchant or business establishment coded in the classification.For example, the food category includes all transactions of establishments such as bakeries, dairy bars, vending machine operators, restaurants, grills, taverns, nightclubs, and grocers. All taxable items sold by a grocer including taxable food, cleaning products, toiletries, hardware, floral sales, taxable pharmaceutical items, gifts, toys, office supplies, and miscellany are included in the food category while taxable food items sold by discount stores, wholesale buying clubs, department stores, and convenience stores are included in the general merchandise group - not the food group.
Figure 31.2 Gross Sales and Use Tax Collections by Business Classification for Fiscal Year 2002-03
Lumber & building material
10%
General merchandise
19%
Furniture4%
Food (excludes food for home
consumption; includes all other
taxable items sold by food
merchants.)15%
Apparel3%
Other29%
Utility services15%
Automotive5%
Figure 31.1 Gross Sales and Use Tax Collections by Business Classification
for Fiscal Year 1988-89
Automotive14%
Food (includes all taxable items sold by
food merchants)22%
Furniture4%
General merchandise
15%
Lumber & building material
8%
Utility services12%
Other22%
Apparel3%
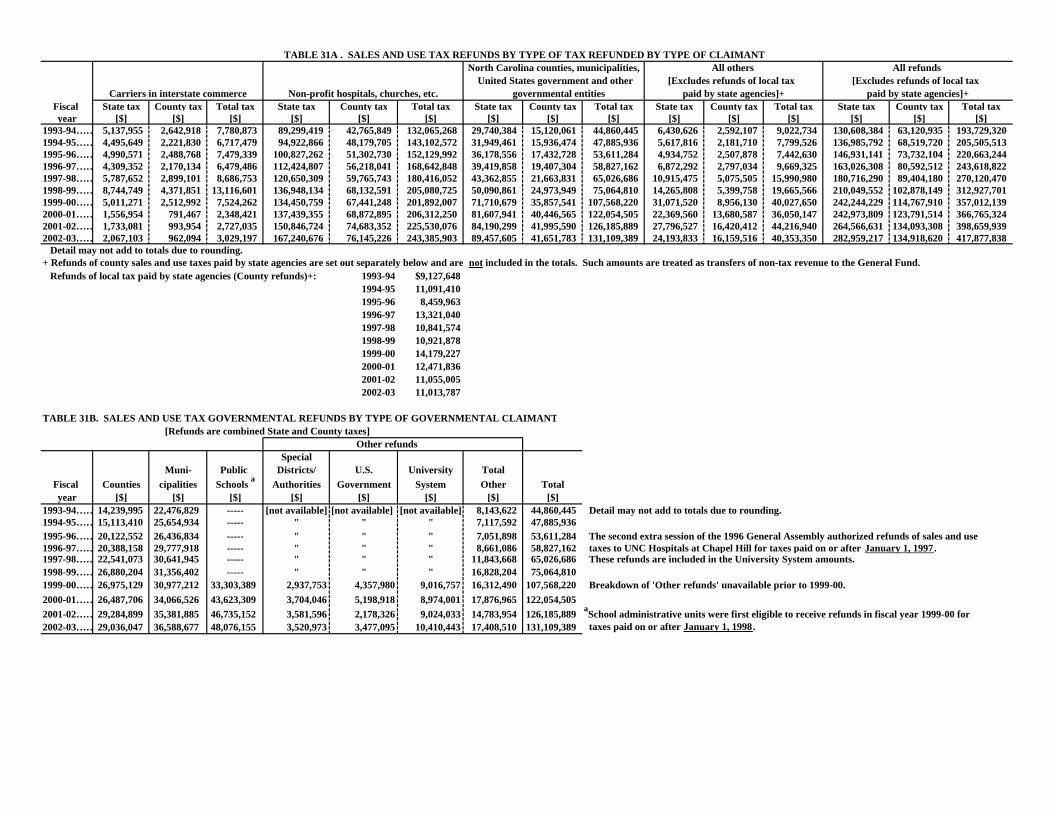
TABLE 31A . SALES AND USE TAX REFUNDS BY TYPE OF TAX REFUNDED BY TYPE OF CLAIMANT
Fiscal State tax County tax Total tax State tax County tax Total tax State tax County tax Total tax State tax County tax Total tax State tax County tax Total taxyear [$] [$] [$] [$] [$] [$] [$] [$] [$] [$] [$] [$] [$] [$] [$]
1993-94…… 5,137,955 2,642,918 7,780,873 89,299,419 42,765,849 132,065,268 29,740,384 15,120,061 44,860,445 6,430,626 2,592,107 9,022,734 130,608,384 63,120,935 193,729,3201994-95…… 4,495,649 2,221,830 6,717,479 94,922,866 48,179,705 143,102,572 31,949,461 15,936,474 47,885,936 5,617,816 2,181,710 7,799,526 136,985,792 68,519,720 205,505,5131995-96…… 4,990,571 2,488,768 7,479,339 100,827,262 51,302,730 152,129,992 36,178,556 17,432,728 53,611,284 4,934,752 2,507,878 7,442,630 146,931,141 73,732,104 220,663,2441996-97…… 4,309,352 2,170,134 6,479,486 112,424,807 56,218,041 168,642,848 39,419,858 19,407,304 58,827,162 6,872,292 2,797,034 9,669,325 163,026,308 80,592,512 243,618,8221997-98…… 5,787,652 2,899,101 8,686,753 120,650,309 59,765,743 180,416,052 43,362,855 21,663,831 65,026,686 10,915,475 5,075,505 15,990,980 180,716,290 89,404,180 270,120,4701998-99…… 8,744,749 4,371,851 13,116,601 136,948,134 68,132,591 205,080,725 50,090,861 24,973,949 75,064,810 14,265,808 5,399,758 19,665,566 210,049,552 102,878,149 312,927,7011999-00…… 5,011,271 2,512,992 7,524,262 134,450,759 67,441,248 201,892,007 71,710,679 35,857,541 107,568,220 31,071,520 8,956,130 40,027,650 242,244,229 114,767,910 357,012,1392000-01…… 1,556,954 791,467 2,348,421 137,439,355 68,872,895 206,312,250 81,607,941 40,446,565 122,054,505 22,369,560 13,680,587 36,050,147 242,973,809 123,791,514 366,765,3242001-02…… 1,733,081 993,954 2,727,035 150,846,724 74,683,352 225,530,076 84,190,299 41,995,590 126,185,889 27,796,527 16,420,412 44,216,940 264,566,631 134,093,308 398,659,9392002-03…… 2,067,103 962,094 3,029,197 167,240,676 76,145,226 243,385,903 89,457,605 41,651,783 131,109,389 24,193,833 16,159,516 40,353,350 282,959,217 134,918,620 417,877,838 Detail may not add to totals due to rounding.+ Refunds of county sales and use taxes paid by state agencies are set out separately below and are not included in the totals. Such amounts are treated as transfers of non-tax revenue to the General Fund. Refunds of local tax paid by state agencies (County refunds)+: 1993-94 $9,127,648
1994-95 11,091,4101995-96 8,459,9631996-97 13,321,0401997-98 10,841,5741998-99 10,921,8781999-00 14,179,2272000-01 12,471,8362001-02 11,055,0052002-03 11,013,787
TABLE 31B. SALES AND USE TAX GOVERNMENTAL REFUNDS BY TYPE OF GOVERNMENTAL CLAIMANT [Refunds are combined State and County taxes]
Other refundsSpecial
Muni- Public Districts/ U.S. University TotalFiscal Counties cipalities Schools a Authorities Government System Other Totalyear [$] [$] [$] [$] [$] [$] [$] [$]
1993-94…… 14,239,995 22,476,829 ----- [not available] [not available] [not available] 8,143,622 44,860,445 Detail may not add to totals due to rounding.1994-95…… 15,113,410 25,654,934 ----- " " " 7,117,592 47,885,9361995-96…… 20,122,552 26,436,834 ----- " " " 7,051,898 53,611,284 The second extra session of the 1996 General Assembly authorized refunds of sales and use 1996-97…… 20,388,158 29,777,918 ----- " " " 8,661,086 58,827,162 taxes to UNC Hospitals at Chapel Hill for taxes paid on or after January 1, 1997.1997-98…… 22,541,073 30,641,945 ----- " " " 11,843,668 65,026,686 These refunds are included in the University System amounts.1998-99…… 26,880,204 31,356,402 ----- " " " 16,828,204 75,064,8101999-00…… 26,975,129 30,977,212 33,303,389 2,937,753 4,357,980 9,016,757 16,312,490 107,568,220 Breakdown of 'Other refunds' unavailable prior to 1999-00.2000-01…… 26,487,706 34,066,526 43,623,309 3,704,046 5,198,918 8,974,001 17,876,965 122,054,5052001-02…… 29,284,899 35,381,885 46,735,152 3,581,596 2,178,326 9,024,033 14,783,954 126,185,889 aSchool administrative units were first eligible to receive refunds in fiscal year 1999-00 for 2002-03…… 29,036,047 36,588,677 48,076,155 3,520,973 3,477,095 10,410,443 17,408,510 131,109,389 taxes paid on or after January 1, 1998.
paid by state agencies]+Carriers in interstate commerce Non-profit hospitals, churches, etc. governmental entities paid by state agencies]+
North Carolina counties, municipalities, All others All refunds United States government and other [Excludes refunds of local tax [Excludes refunds of local tax
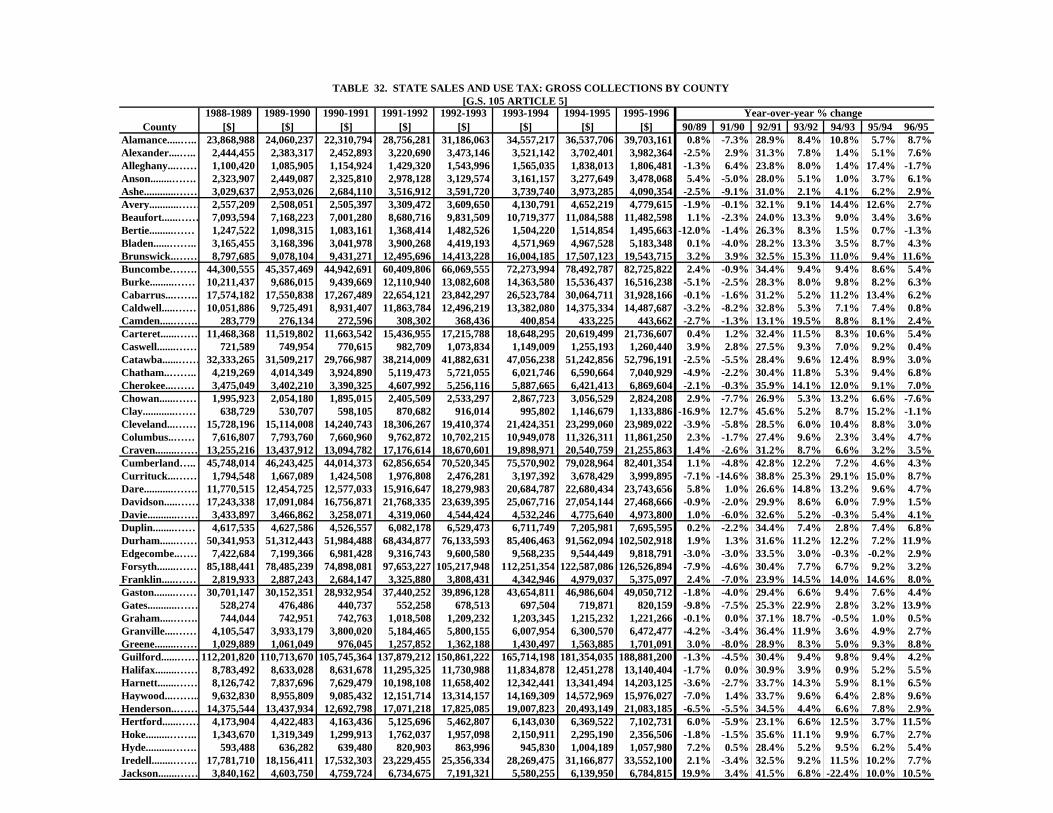
TABLE 32. STATE SALES AND USE TAX: GROSS COLLECTIONS BY COUNTY [G.S. 105 ARTICLE 5]
1988-1989 1989-1990 1990-1991 1991-1992 1992-1993 1993-1994 1994-1995 1995-1996 Year-over-year % change County [$] [$] [$] [$] [$] [$] [$] [$] 90/89 91/90 92/91 93/92 94/93 95/94 96/95
Alamance.....….. 23,868,988 24,060,237 22,310,794 28,756,281 31,186,063 34,557,217 36,537,706 39,703,161 0.8% -7.3% 28.9% 8.4% 10.8% 5.7% 8.7%Alexander....….. 2,444,455 2,383,317 2,452,893 3,220,690 3,473,146 3,521,142 3,702,401 3,982,364 -2.5% 2.9% 31.3% 7.8% 1.4% 5.1% 7.6%Alleghany...…… 1,100,420 1,085,905 1,154,924 1,429,320 1,543,996 1,565,035 1,838,013 1,806,481 -1.3% 6.4% 23.8% 8.0% 1.4% 17.4% -1.7%Anson........……. 2,323,907 2,449,087 2,325,810 2,978,128 3,129,574 3,161,157 3,277,649 3,478,068 5.4% -5.0% 28.0% 5.1% 1.0% 3.7% 6.1%Ashe............…… 3,029,637 2,953,026 2,684,110 3,516,912 3,591,720 3,739,740 3,973,285 4,090,354 -2.5% -9.1% 31.0% 2.1% 4.1% 6.2% 2.9%Avery...........…… 2,557,209 2,508,051 2,505,397 3,309,472 3,609,650 4,130,791 4,652,219 4,779,615 -1.9% -0.1% 32.1% 9.1% 14.4% 12.6% 2.7%Beaufort......…… 7,093,594 7,168,223 7,001,280 8,680,716 9,831,509 10,719,377 11,084,588 11,482,598 1.1% -2.3% 24.0% 13.3% 9.0% 3.4% 3.6%Bertie.........…… 1,247,522 1,098,315 1,083,161 1,368,414 1,482,526 1,504,220 1,514,854 1,495,663 -12.0% -1.4% 26.3% 8.3% 1.5% 0.7% -1.3%Bladen......…….. 3,165,455 3,168,396 3,041,978 3,900,268 4,419,193 4,571,969 4,967,528 5,183,348 0.1% -4.0% 28.2% 13.3% 3.5% 8.7% 4.3%Brunswick..…… 8,797,685 9,078,104 9,431,271 12,495,696 14,413,228 16,004,185 17,507,123 19,543,715 3.2% 3.9% 32.5% 15.3% 11.0% 9.4% 11.6%Buncombe.……. 44,300,555 45,357,469 44,942,691 60,409,806 66,069,555 72,273,994 78,492,787 82,725,822 2.4% -0.9% 34.4% 9.4% 9.4% 8.6% 5.4%Burke.........…… 10,211,437 9,686,015 9,439,669 12,110,940 13,082,608 14,363,580 15,536,437 16,516,238 -5.1% -2.5% 28.3% 8.0% 9.8% 8.2% 6.3%Cabarrus...……. 17,574,182 17,550,838 17,267,489 22,654,121 23,842,297 26,523,784 30,064,711 31,928,166 -0.1% -1.6% 31.2% 5.2% 11.2% 13.4% 6.2%Caldwell.....…… 10,051,886 9,725,491 8,931,407 11,863,784 12,496,219 13,382,080 14,375,334 14,487,687 -3.2% -8.2% 32.8% 5.3% 7.1% 7.4% 0.8%Camden.....……. 283,779 276,134 272,596 308,302 368,436 400,854 433,225 443,662 -2.7% -1.3% 13.1% 19.5% 8.8% 8.1% 2.4%Carteret......…… 11,468,368 11,519,802 11,663,542 15,436,955 17,215,788 18,648,295 20,619,499 21,736,607 0.4% 1.2% 32.4% 11.5% 8.3% 10.6% 5.4%Caswell.......…… 721,589 749,954 770,615 982,709 1,073,834 1,149,009 1,255,193 1,260,440 3.9% 2.8% 27.5% 9.3% 7.0% 9.2% 0.4%Catawba......…… 32,333,265 31,509,217 29,766,987 38,214,009 41,882,631 47,056,238 51,242,856 52,796,191 -2.5% -5.5% 28.4% 9.6% 12.4% 8.9% 3.0%Chatham..…….. 4,219,269 4,014,349 3,924,890 5,119,473 5,721,055 6,021,746 6,590,664 7,040,929 -4.9% -2.2% 30.4% 11.8% 5.3% 9.4% 6.8%Cherokee...…… 3,475,049 3,402,210 3,390,325 4,607,992 5,256,116 5,887,665 6,421,413 6,869,604 -2.1% -0.3% 35.9% 14.1% 12.0% 9.1% 7.0%Chowan......…… 1,995,923 2,054,180 1,895,015 2,405,509 2,533,297 2,867,723 3,056,529 2,824,208 2.9% -7.7% 26.9% 5.3% 13.2% 6.6% -7.6%Clay............…… 638,729 530,707 598,105 870,682 916,014 995,802 1,146,679 1,133,886 -16.9% 12.7% 45.6% 5.2% 8.7% 15.2% -1.1%Cleveland...…… 15,728,196 15,114,008 14,240,743 18,306,267 19,410,374 21,424,351 23,299,060 23,989,022 -3.9% -5.8% 28.5% 6.0% 10.4% 8.8% 3.0%Columbus..…… 7,616,807 7,793,760 7,660,960 9,762,872 10,702,215 10,949,078 11,326,311 11,861,250 2.3% -1.7% 27.4% 9.6% 2.3% 3.4% 4.7%Craven........…… 13,255,216 13,437,912 13,094,782 17,176,614 18,670,601 19,898,971 20,540,759 21,255,863 1.4% -2.6% 31.2% 8.7% 6.6% 3.2% 3.5%Cumberland….. 45,748,014 46,243,425 44,014,373 62,856,654 70,520,345 75,570,902 79,028,964 82,401,354 1.1% -4.8% 42.8% 12.2% 7.2% 4.6% 4.3%Currituck...…… 1,794,548 1,667,089 1,424,508 1,976,808 2,476,281 3,197,392 3,678,429 3,999,895 -7.1% -14.6% 38.8% 25.3% 29.1% 15.0% 8.7%Dare...........……. 11,770,515 12,454,725 12,577,033 15,916,647 18,279,983 20,684,787 22,680,434 23,743,656 5.8% 1.0% 26.6% 14.8% 13.2% 9.6% 4.7%Davidson.....…… 17,243,338 17,091,084 16,756,871 21,768,335 23,639,395 25,067,716 27,054,144 27,468,666 -0.9% -2.0% 29.9% 8.6% 6.0% 7.9% 1.5%Davie...........…… 3,433,897 3,466,862 3,258,071 4,319,060 4,544,424 4,532,246 4,775,640 4,973,800 1.0% -6.0% 32.6% 5.2% -0.3% 5.4% 4.1%Duplin........…… 4,617,535 4,627,586 4,526,557 6,082,178 6,529,473 6,711,749 7,205,981 7,695,595 0.2% -2.2% 34.4% 7.4% 2.8% 7.4% 6.8%Durham......…… 50,341,953 51,312,443 51,984,488 68,434,877 76,133,593 85,406,463 91,562,094 102,502,918 1.9% 1.3% 31.6% 11.2% 12.2% 7.2% 11.9%Edgecombe..…… 7,422,684 7,199,366 6,981,428 9,316,743 9,600,580 9,568,235 9,544,449 9,818,791 -3.0% -3.0% 33.5% 3.0% -0.3% -0.2% 2.9%Forsyth.......…… 85,188,441 78,485,239 74,898,081 97,653,227 105,217,948 112,251,354 122,587,086 126,526,894 -7.9% -4.6% 30.4% 7.7% 6.7% 9.2% 3.2%Franklin.....…… 2,819,933 2,887,243 2,684,147 3,325,880 3,808,431 4,342,946 4,979,037 5,375,097 2.4% -7.0% 23.9% 14.5% 14.0% 14.6% 8.0%Gaston........…… 30,701,147 30,152,351 28,932,954 37,440,252 39,896,128 43,654,811 46,986,604 49,050,712 -1.8% -4.0% 29.4% 6.6% 9.4% 7.6% 4.4%Gates...........…… 528,274 476,486 440,737 552,258 678,513 697,504 719,871 820,159 -9.8% -7.5% 25.3% 22.9% 2.8% 3.2% 13.9%Graham.....……. 744,044 742,951 742,763 1,018,508 1,209,232 1,203,345 1,215,232 1,221,266 -0.1% 0.0% 37.1% 18.7% -0.5% 1.0% 0.5%Granville....…… 4,105,547 3,933,179 3,800,020 5,184,465 5,800,155 6,007,954 6,300,570 6,472,477 -4.2% -3.4% 36.4% 11.9% 3.6% 4.9% 2.7%Greene........…… 1,029,889 1,061,049 976,045 1,257,852 1,362,188 1,430,497 1,563,885 1,701,091 3.0% -8.0% 28.9% 8.3% 5.0% 9.3% 8.8%Guilford......…… 112,201,820 110,713,670 105,745,364 137,879,212 150,861,222 165,714,198 181,354,035 188,881,200 -1.3% -4.5% 30.4% 9.4% 9.8% 9.4% 4.2%Halifax........…… 8,783,492 8,633,028 8,631,678 11,295,325 11,730,988 11,834,878 12,451,278 13,140,404 -1.7% 0.0% 30.9% 3.9% 0.9% 5.2% 5.5%Harnett.......…… 8,126,742 7,837,696 7,629,479 10,198,108 11,658,402 12,342,441 13,341,494 14,203,125 -3.6% -2.7% 33.7% 14.3% 5.9% 8.1% 6.5%Haywood...…….. 9,632,830 8,955,809 9,085,432 12,151,714 13,314,157 14,169,309 14,572,969 15,976,027 -7.0% 1.4% 33.7% 9.6% 6.4% 2.8% 9.6%Henderson..…… 14,375,544 13,437,934 12,692,798 17,071,218 17,825,085 19,007,823 20,493,149 21,083,185 -6.5% -5.5% 34.5% 4.4% 6.6% 7.8% 2.9%Hertford......…… 4,173,904 4,422,483 4,163,436 5,125,696 5,462,807 6,143,030 6,369,522 7,102,731 6.0% -5.9% 23.1% 6.6% 12.5% 3.7% 11.5%Hoke.........…….. 1,343,670 1,319,349 1,299,913 1,762,037 1,957,098 2,150,911 2,295,190 2,356,506 -1.8% -1.5% 35.6% 11.1% 9.9% 6.7% 2.7%Hyde..........……. 593,488 636,282 639,480 820,903 863,996 945,830 1,004,189 1,057,980 7.2% 0.5% 28.4% 5.2% 9.5% 6.2% 5.4%Iredell........……. 17,781,710 18,156,411 17,532,303 23,229,455 25,356,334 28,269,475 31,166,877 33,552,100 2.1% -3.4% 32.5% 9.2% 11.5% 10.2% 7.7%Jackson.......…… 3,840,162 4,603,750 4,759,724 6,734,675 7,191,321 5,580,255 6,139,950 6,784,815 19.9% 3.4% 41.5% 6.8% -22.4% 10.0% 10.5%
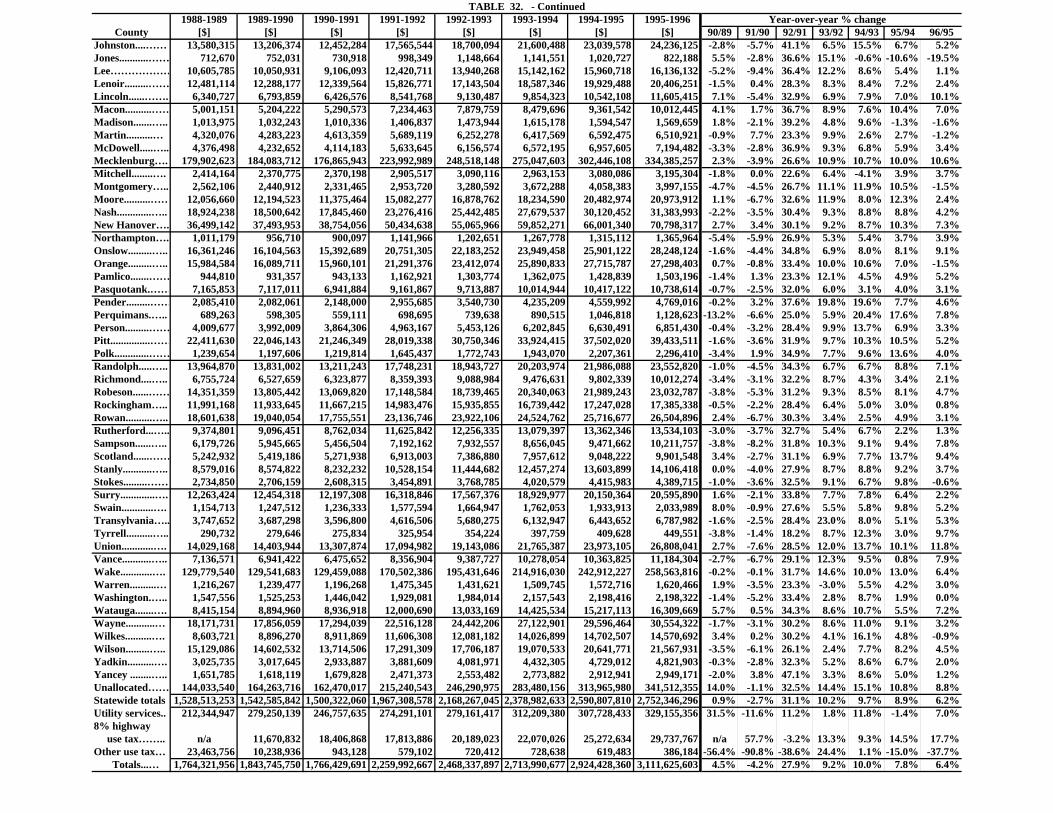
TABLE 32. - Continued1988-1989 1989-1990 1990-1991 1991-1992 1992-1993 1993-1994 1994-1995 1995-1996 Year-over-year % change
County [$] [$] [$] [$] [$] [$] [$] [$] 90/89 91/90 92/91 93/92 94/93 95/94 96/95Johnston....…… 13,580,315 13,206,374 12,452,284 17,565,544 18,700,094 21,600,488 23,039,578 24,236,125 -2.8% -5.7% 41.1% 6.5% 15.5% 6.7% 5.2%Jones...........…… 712,670 752,031 730,918 998,349 1,148,664 1,141,551 1,020,727 822,188 5.5% -2.8% 36.6% 15.1% -0.6% -10.6% -19.5%Lee……………… 10,605,785 10,050,931 9,106,093 12,420,711 13,940,268 15,142,162 15,960,718 16,136,132 -5.2% -9.4% 36.4% 12.2% 8.6% 5.4% 1.1%Lenoir.........…… 12,481,114 12,288,177 12,339,564 15,826,771 17,143,504 18,587,346 19,929,488 20,406,251 -1.5% 0.4% 28.3% 8.3% 8.4% 7.2% 2.4%Lincoln......……. 6,340,727 6,793,859 6,426,576 8,541,768 9,130,487 9,854,323 10,542,108 11,605,415 7.1% -5.4% 32.9% 6.9% 7.9% 7.0% 10.1%Macon..........…… 5,001,151 5,204,222 5,290,573 7,234,463 7,879,759 8,479,696 9,361,542 10,012,445 4.1% 1.7% 36.7% 8.9% 7.6% 10.4% 7.0%Madison.......….. 1,013,975 1,032,243 1,010,336 1,406,837 1,473,944 1,615,178 1,594,547 1,569,659 1.8% -2.1% 39.2% 4.8% 9.6% -1.3% -1.6%Martin..........… 4,320,076 4,283,223 4,613,359 5,689,119 6,252,278 6,417,569 6,592,475 6,510,921 -0.9% 7.7% 23.3% 9.9% 2.6% 2.7% -1.2%McDowell.....….. 4,376,498 4,232,652 4,114,183 5,633,645 6,156,574 6,572,195 6,957,605 7,194,482 -3.3% -2.8% 36.9% 9.3% 6.8% 5.9% 3.4%Mecklenburg…. 179,902,623 184,083,712 176,865,943 223,992,989 248,518,148 275,047,603 302,446,108 334,385,257 2.3% -3.9% 26.6% 10.9% 10.7% 10.0% 10.6%Mitchell........…. 2,414,164 2,370,775 2,370,198 2,905,517 3,090,116 2,963,153 3,080,086 3,195,304 -1.8% 0.0% 22.6% 6.4% -4.1% 3.9% 3.7%Montgomery….. 2,562,106 2,440,912 2,331,465 2,953,720 3,280,592 3,672,288 4,058,383 3,997,155 -4.7% -4.5% 26.7% 11.1% 11.9% 10.5% -1.5%Moore..........…… 12,056,660 12,194,523 11,375,464 15,082,277 16,878,762 18,234,590 20,482,974 20,973,912 1.1% -6.7% 32.6% 11.9% 8.0% 12.3% 2.4%Nash.............….. 18,924,238 18,500,642 17,845,460 23,276,416 25,442,485 27,679,537 30,120,452 31,383,993 -2.2% -3.5% 30.4% 9.3% 8.8% 8.8% 4.2%New Hanover…. 36,499,142 37,493,953 38,754,056 50,434,638 55,065,966 59,852,271 66,001,340 70,798,317 2.7% 3.4% 30.1% 9.2% 8.7% 10.3% 7.3%Northampton…. 1,011,179 956,710 900,097 1,141,966 1,202,651 1,267,778 1,315,112 1,365,964 -5.4% -5.9% 26.9% 5.3% 5.4% 3.7% 3.9%Onslow.........….. 16,361,246 16,104,563 15,392,689 20,751,305 22,183,252 23,949,458 25,901,122 28,248,124 -1.6% -4.4% 34.8% 6.9% 8.0% 8.1% 9.1%Orange.........….. 15,984,584 16,089,711 15,960,101 21,291,376 23,412,074 25,890,833 27,715,787 27,298,403 0.7% -0.8% 33.4% 10.0% 10.6% 7.0% -1.5%Pamlico.......…… 944,810 931,357 943,133 1,162,921 1,303,774 1,362,075 1,428,839 1,503,196 -1.4% 1.3% 23.3% 12.1% 4.5% 4.9% 5.2%Pasquotank.…… 7,165,853 7,117,011 6,941,884 9,161,867 9,713,887 10,014,944 10,417,122 10,738,614 -0.7% -2.5% 32.0% 6.0% 3.1% 4.0% 3.1%Pender.........…… 2,085,410 2,082,061 2,148,000 2,955,685 3,540,730 4,235,209 4,559,992 4,769,016 -0.2% 3.2% 37.6% 19.8% 19.6% 7.7% 4.6%Perquimans.….. 689,263 598,305 559,111 698,695 739,638 890,515 1,046,818 1,128,623 -13.2% -6.6% 25.0% 5.9% 20.4% 17.6% 7.8%Person.........…… 4,009,677 3,992,009 3,864,306 4,963,167 5,453,126 6,202,845 6,630,491 6,851,430 -0.4% -3.2% 28.4% 9.9% 13.7% 6.9% 3.3%Pitt...............…… 22,411,630 22,046,143 21,246,349 28,019,338 30,750,346 33,924,415 37,502,020 39,433,511 -1.6% -3.6% 31.9% 9.7% 10.3% 10.5% 5.2%Polk.............…… 1,239,654 1,197,606 1,219,814 1,645,437 1,772,743 1,943,070 2,207,361 2,296,410 -3.4% 1.9% 34.9% 7.7% 9.6% 13.6% 4.0%Randolph.....….. 13,964,870 13,831,002 13,211,243 17,748,231 18,943,727 20,203,974 21,986,088 23,552,820 -1.0% -4.5% 34.3% 6.7% 6.7% 8.8% 7.1%Richmond....….. 6,755,724 6,527,659 6,323,877 8,359,393 9,088,984 9,476,631 9,802,339 10,012,274 -3.4% -3.1% 32.2% 8.7% 4.3% 3.4% 2.1%Robeson......…… 14,351,359 13,805,442 13,069,820 17,148,584 18,739,465 20,340,063 21,989,243 23,032,787 -3.8% -5.3% 31.2% 9.3% 8.5% 8.1% 4.7%Rockingham….. 11,991,168 11,933,645 11,667,215 14,983,476 15,935,855 16,739,442 17,247,028 17,385,338 -0.5% -2.2% 28.4% 6.4% 5.0% 3.0% 0.8%Rowan..........….. 18,601,638 19,040,054 17,755,551 23,136,746 23,922,106 24,524,762 25,716,677 26,504,896 2.4% -6.7% 30.3% 3.4% 2.5% 4.9% 3.1%Rutherford...….. 9,374,801 9,096,451 8,762,034 11,625,842 12,256,335 13,079,397 13,362,346 13,534,103 -3.0% -3.7% 32.7% 5.4% 6.7% 2.2% 1.3%Sampson......….. 6,179,726 5,945,665 5,456,504 7,192,162 7,932,557 8,656,045 9,471,662 10,211,757 -3.8% -8.2% 31.8% 10.3% 9.1% 9.4% 7.8%Scotland......…… 5,242,932 5,419,186 5,271,938 6,913,003 7,386,880 7,957,612 9,048,222 9,901,548 3.4% -2.7% 31.1% 6.9% 7.7% 13.7% 9.4%Stanly...........….. 8,579,016 8,574,822 8,232,232 10,528,154 11,444,682 12,457,274 13,603,899 14,106,418 0.0% -4.0% 27.9% 8.7% 8.8% 9.2% 3.7%Stokes.........…… 2,734,850 2,706,159 2,608,315 3,454,891 3,768,785 4,020,579 4,415,983 4,389,715 -1.0% -3.6% 32.5% 9.1% 6.7% 9.8% -0.6%Surry.............…. 12,263,424 12,454,318 12,197,308 16,318,846 17,567,376 18,929,977 20,150,364 20,595,890 1.6% -2.1% 33.8% 7.7% 7.8% 6.4% 2.2%Swain............…. 1,154,713 1,247,512 1,236,333 1,577,594 1,664,947 1,762,053 1,933,913 2,033,989 8.0% -0.9% 27.6% 5.5% 5.8% 9.8% 5.2%Transylvania….. 3,747,652 3,687,298 3,596,800 4,616,506 5,680,275 6,132,947 6,443,652 6,787,982 -1.6% -2.5% 28.4% 23.0% 8.0% 5.1% 5.3%Tyrrell..........….. 290,732 279,646 275,834 325,954 354,224 397,759 409,628 449,551 -3.8% -1.4% 18.2% 8.7% 12.3% 3.0% 9.7%Union............…. 14,029,168 14,403,944 13,307,874 17,094,982 19,143,086 21,765,387 23,973,105 26,808,041 2.7% -7.6% 28.5% 12.0% 13.7% 10.1% 11.8%Vance...........….. 7,136,571 6,941,422 6,475,652 8,356,904 9,387,727 10,278,054 10,363,825 11,184,304 -2.7% -6.7% 29.1% 12.3% 9.5% 0.8% 7.9%Wake............…. 129,779,540 129,541,683 129,459,088 170,502,386 195,431,646 214,916,030 242,912,227 258,563,816 -0.2% -0.1% 31.7% 14.6% 10.0% 13.0% 6.4%Warren..........… 1,216,267 1,239,477 1,196,268 1,475,345 1,431,621 1,509,745 1,572,716 1,620,466 1.9% -3.5% 23.3% -3.0% 5.5% 4.2% 3.0%Washington.….. 1,547,556 1,525,253 1,446,042 1,929,081 1,984,014 2,157,543 2,198,416 2,198,322 -1.4% -5.2% 33.4% 2.8% 8.7% 1.9% 0.0%Watauga.......…. 8,415,154 8,894,960 8,936,918 12,000,690 13,033,169 14,425,534 15,217,113 16,309,669 5.7% 0.5% 34.3% 8.6% 10.7% 5.5% 7.2%Wayne...........… 18,171,731 17,856,059 17,294,039 22,516,128 24,442,206 27,122,901 29,596,464 30,554,322 -1.7% -3.1% 30.2% 8.6% 11.0% 9.1% 3.2%Wilkes..........…. 8,603,721 8,896,270 8,911,869 11,606,308 12,081,182 14,026,899 14,702,507 14,570,692 3.4% 0.2% 30.2% 4.1% 16.1% 4.8% -0.9%Wilson.........….. 15,129,086 14,602,532 13,714,506 17,291,309 17,706,187 19,070,533 20,641,771 21,567,931 -3.5% -6.1% 26.1% 2.4% 7.7% 8.2% 4.5%Yadkin..........…. 3,025,735 3,017,645 2,933,887 3,881,609 4,081,971 4,432,305 4,729,012 4,821,903 -0.3% -2.8% 32.3% 5.2% 8.6% 6.7% 2.0%Yancey ........….. 1,651,785 1,618,119 1,679,828 2,471,373 2,553,482 2,773,882 2,912,941 2,949,171 -2.0% 3.8% 47.1% 3.3% 8.6% 5.0% 1.2%Unallocated…… 144,033,540 164,263,716 162,470,017 215,240,543 246,290,975 283,480,156 313,965,980 341,512,355 14.0% -1.1% 32.5% 14.4% 15.1% 10.8% 8.8%Statewide totals 1,528,513,253 1,542,585,842 1,500,322,060 1,967,308,578 2,168,267,045 2,378,982,633 2,590,807,810 2,752,346,296 0.9% -2.7% 31.1% 10.2% 9.7% 8.9% 6.2%Utility services.. 212,344,947 279,250,139 246,757,635 274,291,101 279,161,417 312,209,380 307,728,433 329,155,356 31.5% -11.6% 11.2% 1.8% 11.8% -1.4% 7.0%8% highway use tax…….. n/a 11,670,832 18,406,868 17,813,886 20,189,023 22,070,026 25,272,634 29,737,767 n/a 57.7% -3.2% 13.3% 9.3% 14.5% 17.7%Other use tax… 23,463,756 10,238,936 943,128 579,102 720,412 728,638 619,483 386,184 -56.4% -90.8% -38.6% 24.4% 1.1% -15.0% -37.7% Totals...… 1,764,321,956 1,843,745,750 1,766,429,691 2,259,992,667 2,468,337,897 2,713,990,677 2,924,428,360 3,111,625,603 4.5% -4.2% 27.9% 9.2% 10.0% 7.8% 6.4%
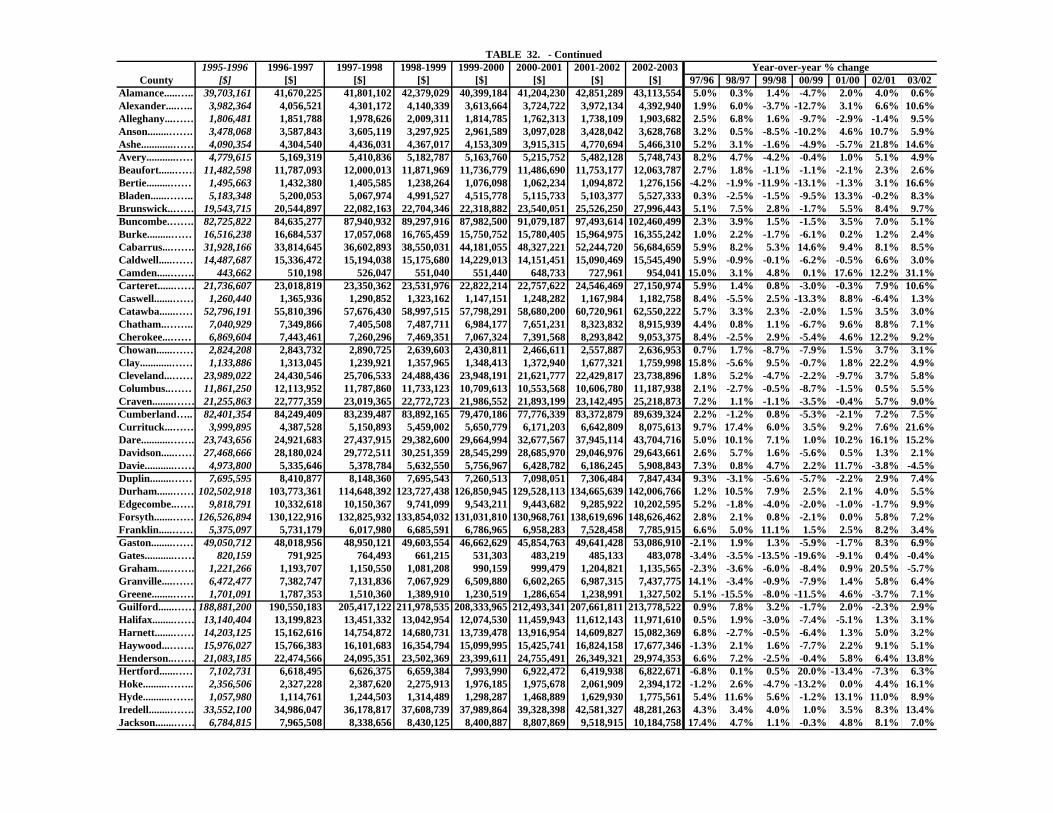
TABLE 32. - Continued1995-1996 1996-1997 1997-1998 1998-1999 1999-2000 2000-2001 2001-2002 2002-2003 Year-over-year % change
County [$] [$] [$] [$] [$] [$] [$] [$] 97/96 98/97 99/98 00/99 01/00 02/01 03/02Alamance.....….. 39,703,161 41,670,225 41,801,102 42,379,029 40,399,184 41,204,230 42,851,289 43,113,554 5.0% 0.3% 1.4% -4.7% 2.0% 4.0% 0.6%Alexander....….. 3,982,364 4,056,521 4,301,172 4,140,339 3,613,664 3,724,722 3,972,134 4,392,940 1.9% 6.0% -3.7% -12.7% 3.1% 6.6% 10.6%Alleghany...…… 1,806,481 1,851,788 1,978,626 2,009,311 1,814,785 1,762,313 1,738,109 1,903,682 2.5% 6.8% 1.6% -9.7% -2.9% -1.4% 9.5%Anson........……. 3,478,068 3,587,843 3,605,119 3,297,925 2,961,589 3,097,028 3,428,042 3,628,768 3.2% 0.5% -8.5% -10.2% 4.6% 10.7% 5.9%Ashe............…… 4,090,354 4,304,540 4,436,031 4,367,017 4,153,309 3,915,315 4,770,694 5,466,310 5.2% 3.1% -1.6% -4.9% -5.7% 21.8% 14.6%Avery...........…… 4,779,615 5,169,319 5,410,836 5,182,787 5,163,760 5,215,752 5,482,128 5,748,743 8.2% 4.7% -4.2% -0.4% 1.0% 5.1% 4.9%Beaufort......…… 11,482,598 11,787,093 12,000,013 11,871,969 11,736,779 11,486,690 11,753,177 12,063,787 2.7% 1.8% -1.1% -1.1% -2.1% 2.3% 2.6%Bertie.........…… 1,495,663 1,432,380 1,405,585 1,238,264 1,076,098 1,062,234 1,094,872 1,276,156 -4.2% -1.9% -11.9% -13.1% -1.3% 3.1% 16.6%Bladen......…….. 5,183,348 5,200,053 5,067,974 4,991,527 4,515,778 5,115,733 5,103,377 5,527,333 0.3% -2.5% -1.5% -9.5% 13.3% -0.2% 8.3%Brunswick..…… 19,543,715 20,544,897 22,082,163 22,704,346 22,318,882 23,540,051 25,526,250 27,996,443 5.1% 7.5% 2.8% -1.7% 5.5% 8.4% 9.7%Buncombe.……. 82,725,822 84,635,277 87,940,932 89,297,916 87,982,500 91,079,187 97,493,614 102,460,499 2.3% 3.9% 1.5% -1.5% 3.5% 7.0% 5.1%Burke.........…… 16,516,238 16,684,537 17,057,068 16,765,459 15,750,752 15,780,405 15,964,975 16,355,242 1.0% 2.2% -1.7% -6.1% 0.2% 1.2% 2.4%Cabarrus...……. 31,928,166 33,814,645 36,602,893 38,550,031 44,181,055 48,327,221 52,244,720 56,684,659 5.9% 8.2% 5.3% 14.6% 9.4% 8.1% 8.5%Caldwell.....…… 14,487,687 15,336,472 15,194,038 15,175,680 14,229,013 14,151,451 15,090,469 15,545,490 5.9% -0.9% -0.1% -6.2% -0.5% 6.6% 3.0%Camden.....……. 443,662 510,198 526,047 551,040 551,440 648,733 727,961 954,041 15.0% 3.1% 4.8% 0.1% 17.6% 12.2% 31.1%Carteret......…… 21,736,607 23,018,819 23,350,362 23,531,976 22,822,214 22,757,622 24,546,469 27,150,974 5.9% 1.4% 0.8% -3.0% -0.3% 7.9% 10.6%Caswell.......…… 1,260,440 1,365,936 1,290,852 1,323,162 1,147,151 1,248,282 1,167,984 1,182,758 8.4% -5.5% 2.5% -13.3% 8.8% -6.4% 1.3%Catawba......…… 52,796,191 55,810,396 57,676,430 58,997,515 57,798,291 58,680,200 60,720,961 62,550,222 5.7% 3.3% 2.3% -2.0% 1.5% 3.5% 3.0%Chatham..…….. 7,040,929 7,349,866 7,405,508 7,487,711 6,984,177 7,651,231 8,323,832 8,915,939 4.4% 0.8% 1.1% -6.7% 9.6% 8.8% 7.1%Cherokee...…… 6,869,604 7,443,461 7,260,296 7,469,351 7,067,324 7,391,568 8,293,842 9,053,375 8.4% -2.5% 2.9% -5.4% 4.6% 12.2% 9.2%Chowan......…… 2,824,208 2,843,732 2,890,725 2,639,603 2,430,811 2,466,611 2,557,887 2,636,953 0.7% 1.7% -8.7% -7.9% 1.5% 3.7% 3.1%Clay............…… 1,133,886 1,313,045 1,239,921 1,357,965 1,348,413 1,372,940 1,677,321 1,759,998 15.8% -5.6% 9.5% -0.7% 1.8% 22.2% 4.9%Cleveland...…… 23,989,022 24,430,546 25,706,533 24,488,436 23,948,191 21,621,777 22,429,817 23,738,896 1.8% 5.2% -4.7% -2.2% -9.7% 3.7% 5.8%Columbus..…… 11,861,250 12,113,952 11,787,860 11,733,123 10,709,613 10,553,568 10,606,780 11,187,938 2.1% -2.7% -0.5% -8.7% -1.5% 0.5% 5.5%Craven........…… 21,255,863 22,777,359 23,019,365 22,772,723 21,986,552 21,893,199 23,142,495 25,218,873 7.2% 1.1% -1.1% -3.5% -0.4% 5.7% 9.0%Cumberland….. 82,401,354 84,249,409 83,239,487 83,892,165 79,470,186 77,776,339 83,372,879 89,639,324 2.2% -1.2% 0.8% -5.3% -2.1% 7.2% 7.5%Currituck...…… 3,999,895 4,387,528 5,150,893 5,459,002 5,650,779 6,171,203 6,642,809 8,075,613 9.7% 17.4% 6.0% 3.5% 9.2% 7.6% 21.6%Dare...........……. 23,743,656 24,921,683 27,437,915 29,382,600 29,664,994 32,677,567 37,945,114 43,704,716 5.0% 10.1% 7.1% 1.0% 10.2% 16.1% 15.2%Davidson.....…… 27,468,666 28,180,024 29,772,511 30,251,359 28,545,299 28,685,970 29,046,976 29,643,661 2.6% 5.7% 1.6% -5.6% 0.5% 1.3% 2.1%Davie...........…… 4,973,800 5,335,646 5,378,784 5,632,550 5,756,967 6,428,782 6,186,245 5,908,843 7.3% 0.8% 4.7% 2.2% 11.7% -3.8% -4.5%Duplin........…… 7,695,595 8,410,877 8,148,360 7,695,543 7,260,513 7,098,051 7,306,484 7,847,434 9.3% -3.1% -5.6% -5.7% -2.2% 2.9% 7.4%Durham......…… 102,502,918 103,773,361 114,648,392 123,727,438 126,850,945 129,528,113 134,665,639 142,006,766 1.2% 10.5% 7.9% 2.5% 2.1% 4.0% 5.5%Edgecombe..…… 9,818,791 10,332,618 10,150,367 9,741,099 9,543,211 9,443,682 9,285,922 10,202,595 5.2% -1.8% -4.0% -2.0% -1.0% -1.7% 9.9%Forsyth.......…… 126,526,894 130,122,916 132,825,932 133,854,032 131,031,810 130,968,761 138,619,696 148,626,462 2.8% 2.1% 0.8% -2.1% 0.0% 5.8% 7.2%Franklin.....…… 5,375,097 5,731,179 6,017,980 6,685,591 6,786,965 6,958,283 7,528,458 7,785,915 6.6% 5.0% 11.1% 1.5% 2.5% 8.2% 3.4%Gaston........…… 49,050,712 48,018,956 48,950,121 49,603,554 46,662,629 45,854,763 49,641,428 53,086,910 -2.1% 1.9% 1.3% -5.9% -1.7% 8.3% 6.9%Gates...........…… 820,159 791,925 764,493 661,215 531,303 483,219 485,133 483,078 -3.4% -3.5% -13.5% -19.6% -9.1% 0.4% -0.4%Graham.....……. 1,221,266 1,193,707 1,150,550 1,081,208 990,159 999,479 1,204,821 1,135,565 -2.3% -3.6% -6.0% -8.4% 0.9% 20.5% -5.7%Granville....…… 6,472,477 7,382,747 7,131,836 7,067,929 6,509,880 6,602,265 6,987,315 7,437,775 14.1% -3.4% -0.9% -7.9% 1.4% 5.8% 6.4%Greene........…… 1,701,091 1,787,353 1,510,360 1,389,910 1,230,519 1,286,654 1,238,991 1,327,502 5.1% -15.5% -8.0% -11.5% 4.6% -3.7% 7.1%Guilford......…… 188,881,200 190,550,183 205,417,122 211,978,535 208,333,965 212,493,341 207,661,811 213,778,522 0.9% 7.8% 3.2% -1.7% 2.0% -2.3% 2.9%Halifax........…… 13,140,404 13,199,823 13,451,332 13,042,954 12,074,530 11,459,943 11,612,143 11,971,610 0.5% 1.9% -3.0% -7.4% -5.1% 1.3% 3.1%Harnett.......…… 14,203,125 15,162,616 14,754,872 14,680,731 13,739,478 13,916,954 14,609,827 15,082,369 6.8% -2.7% -0.5% -6.4% 1.3% 5.0% 3.2%Haywood...…….. 15,976,027 15,766,383 16,101,683 16,354,794 15,099,995 15,425,741 16,824,158 17,677,346 -1.3% 2.1% 1.6% -7.7% 2.2% 9.1% 5.1%Henderson..…… 21,083,185 22,474,566 24,095,351 23,502,369 23,399,611 24,755,491 26,349,321 29,974,353 6.6% 7.2% -2.5% -0.4% 5.8% 6.4% 13.8%Hertford......…… 7,102,731 6,618,495 6,626,375 6,659,384 7,993,990 6,922,472 6,419,938 6,822,671 -6.8% 0.1% 0.5% 20.0% -13.4% -7.3% 6.3%Hoke.........…….. 2,356,506 2,327,228 2,387,620 2,275,913 1,976,185 1,975,678 2,061,909 2,394,172 -1.2% 2.6% -4.7% -13.2% 0.0% 4.4% 16.1%Hyde..........……. 1,057,980 1,114,761 1,244,503 1,314,489 1,298,287 1,468,889 1,629,930 1,775,561 5.4% 11.6% 5.6% -1.2% 13.1% 11.0% 8.9%Iredell........……. 33,552,100 34,986,047 36,178,817 37,608,739 37,989,864 39,328,398 42,581,327 48,281,263 4.3% 3.4% 4.0% 1.0% 3.5% 8.3% 13.4%Jackson.......…… 6,784,815 7,965,508 8,338,656 8,430,125 8,400,887 8,807,869 9,518,915 10,184,758 17.4% 4.7% 1.1% -0.3% 4.8% 8.1% 7.0%
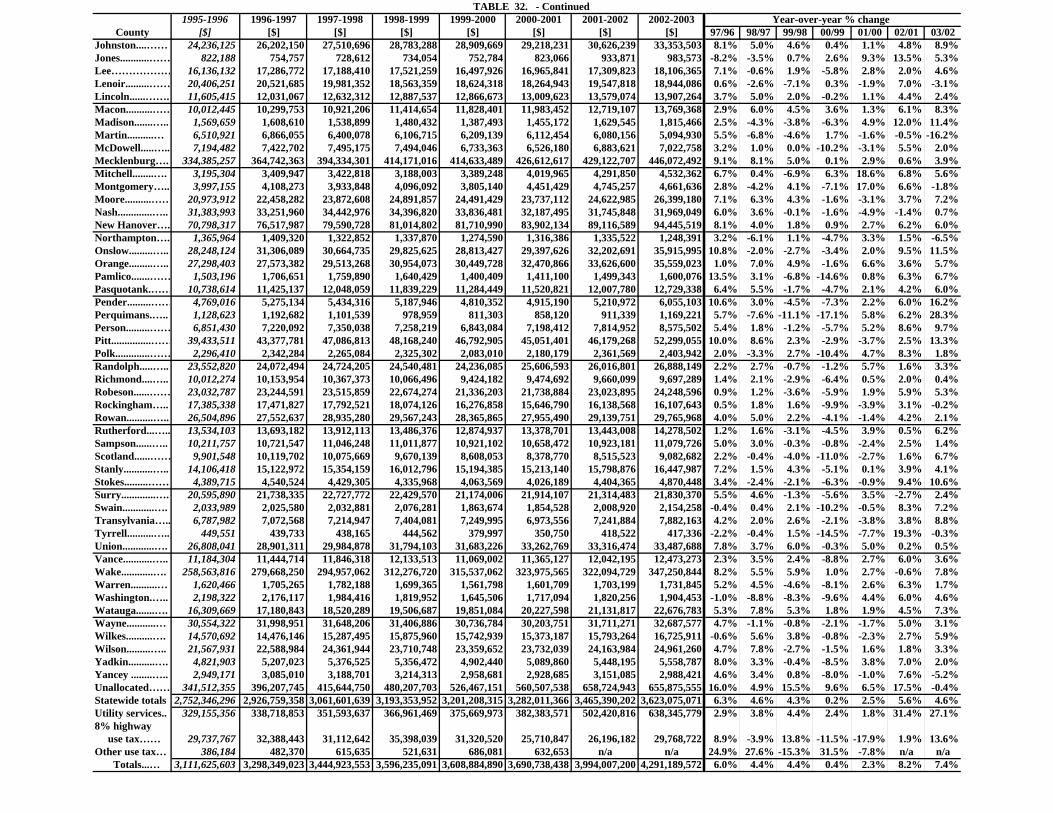
TABLE 32. - Continued1995-1996 1996-1997 1997-1998 1998-1999 1999-2000 2000-2001 2001-2002 2002-2003 Year-over-year % change
County [$] [$] [$] [$] [$] [$] [$] [$] 97/96 98/97 99/98 00/99 01/00 02/01 03/02Johnston....…… 24,236,125 26,202,150 27,510,696 28,783,288 28,909,669 29,218,231 30,626,239 33,353,503 8.1% 5.0% 4.6% 0.4% 1.1% 4.8% 8.9%Jones...........…… 822,188 754,757 728,612 734,054 752,784 823,066 933,871 983,573 -8.2% -3.5% 0.7% 2.6% 9.3% 13.5% 5.3%Lee……………… 16,136,132 17,286,772 17,188,410 17,521,259 16,497,926 16,965,841 17,309,823 18,106,365 7.1% -0.6% 1.9% -5.8% 2.8% 2.0% 4.6%Lenoir.........…… 20,406,251 20,521,685 19,981,352 18,563,359 18,624,318 18,264,943 19,547,818 18,944,086 0.6% -2.6% -7.1% 0.3% -1.9% 7.0% -3.1%Lincoln......……. 11,605,415 12,031,067 12,632,312 12,887,537 12,866,673 13,009,623 13,579,074 13,907,264 3.7% 5.0% 2.0% -0.2% 1.1% 4.4% 2.4%Macon..........…… 10,012,445 10,299,753 10,921,206 11,414,654 11,828,401 11,983,452 12,719,107 13,769,368 2.9% 6.0% 4.5% 3.6% 1.3% 6.1% 8.3%Madison.......….. 1,569,659 1,608,610 1,538,899 1,480,432 1,387,493 1,455,172 1,629,545 1,815,466 2.5% -4.3% -3.8% -6.3% 4.9% 12.0% 11.4%Martin..........… 6,510,921 6,866,055 6,400,078 6,106,715 6,209,139 6,112,454 6,080,156 5,094,930 5.5% -6.8% -4.6% 1.7% -1.6% -0.5% -16.2%McDowell.....….. 7,194,482 7,422,702 7,495,175 7,494,046 6,733,363 6,526,180 6,883,621 7,022,758 3.2% 1.0% 0.0% -10.2% -3.1% 5.5% 2.0%Mecklenburg…. 334,385,257 364,742,363 394,334,301 414,171,016 414,633,489 426,612,617 429,122,707 446,072,492 9.1% 8.1% 5.0% 0.1% 2.9% 0.6% 3.9%Mitchell........…. 3,195,304 3,409,947 3,422,818 3,188,003 3,389,248 4,019,965 4,291,850 4,532,362 6.7% 0.4% -6.9% 6.3% 18.6% 6.8% 5.6%Montgomery….. 3,997,155 4,108,273 3,933,848 4,096,092 3,805,140 4,451,429 4,745,257 4,661,636 2.8% -4.2% 4.1% -7.1% 17.0% 6.6% -1.8%Moore..........…… 20,973,912 22,458,282 23,872,608 24,891,857 24,491,429 23,737,112 24,622,985 26,399,180 7.1% 6.3% 4.3% -1.6% -3.1% 3.7% 7.2%Nash.............….. 31,383,993 33,251,960 34,442,976 34,396,820 33,836,481 32,187,495 31,745,848 31,969,049 6.0% 3.6% -0.1% -1.6% -4.9% -1.4% 0.7%New Hanover…. 70,798,317 76,517,987 79,590,728 81,014,802 81,710,990 83,902,134 89,116,589 94,445,519 8.1% 4.0% 1.8% 0.9% 2.7% 6.2% 6.0%Northampton…. 1,365,964 1,409,320 1,322,852 1,337,870 1,274,590 1,316,386 1,335,522 1,248,391 3.2% -6.1% 1.1% -4.7% 3.3% 1.5% -6.5%Onslow.........….. 28,248,124 31,306,089 30,664,735 29,825,625 28,813,427 29,397,626 32,202,691 35,915,995 10.8% -2.0% -2.7% -3.4% 2.0% 9.5% 11.5%Orange.........….. 27,298,403 27,573,382 29,513,268 30,954,073 30,449,728 32,470,866 33,626,600 35,559,023 1.0% 7.0% 4.9% -1.6% 6.6% 3.6% 5.7%Pamlico.......…… 1,503,196 1,706,651 1,759,890 1,640,429 1,400,409 1,411,100 1,499,343 1,600,076 13.5% 3.1% -6.8% -14.6% 0.8% 6.3% 6.7%Pasquotank.…… 10,738,614 11,425,137 12,048,059 11,839,229 11,284,449 11,520,821 12,007,780 12,729,338 6.4% 5.5% -1.7% -4.7% 2.1% 4.2% 6.0%Pender.........…… 4,769,016 5,275,134 5,434,316 5,187,946 4,810,352 4,915,190 5,210,972 6,055,103 10.6% 3.0% -4.5% -7.3% 2.2% 6.0% 16.2%Perquimans.….. 1,128,623 1,192,682 1,101,539 978,959 811,303 858,120 911,339 1,169,221 5.7% -7.6% -11.1% -17.1% 5.8% 6.2% 28.3%Person.........…… 6,851,430 7,220,092 7,350,038 7,258,219 6,843,084 7,198,412 7,814,952 8,575,502 5.4% 1.8% -1.2% -5.7% 5.2% 8.6% 9.7%Pitt...............…… 39,433,511 43,377,781 47,086,813 48,168,240 46,792,905 45,051,401 46,179,268 52,299,055 10.0% 8.6% 2.3% -2.9% -3.7% 2.5% 13.3%Polk.............…… 2,296,410 2,342,284 2,265,084 2,325,302 2,083,010 2,180,179 2,361,569 2,403,942 2.0% -3.3% 2.7% -10.4% 4.7% 8.3% 1.8%Randolph.....….. 23,552,820 24,072,494 24,724,205 24,540,481 24,236,085 25,606,593 26,016,801 26,888,149 2.2% 2.7% -0.7% -1.2% 5.7% 1.6% 3.3%Richmond....….. 10,012,274 10,153,954 10,367,373 10,066,496 9,424,182 9,474,692 9,660,099 9,697,289 1.4% 2.1% -2.9% -6.4% 0.5% 2.0% 0.4%Robeson......…… 23,032,787 23,244,591 23,515,859 22,674,274 21,336,203 21,738,884 23,023,895 24,248,596 0.9% 1.2% -3.6% -5.9% 1.9% 5.9% 5.3%Rockingham….. 17,385,338 17,471,827 17,792,521 18,074,126 16,276,858 15,646,790 16,138,568 16,107,643 0.5% 1.8% 1.6% -9.9% -3.9% 3.1% -0.2%Rowan..........….. 26,504,896 27,552,637 28,935,280 29,567,243 28,365,865 27,955,490 29,139,751 29,765,968 4.0% 5.0% 2.2% -4.1% -1.4% 4.2% 2.1%Rutherford...….. 13,534,103 13,693,182 13,912,113 13,486,376 12,874,937 13,378,701 13,443,008 14,278,502 1.2% 1.6% -3.1% -4.5% 3.9% 0.5% 6.2%Sampson......….. 10,211,757 10,721,547 11,046,248 11,011,877 10,921,102 10,658,472 10,923,181 11,079,726 5.0% 3.0% -0.3% -0.8% -2.4% 2.5% 1.4%Scotland......…… 9,901,548 10,119,702 10,075,669 9,670,139 8,608,053 8,378,770 8,515,523 9,082,682 2.2% -0.4% -4.0% -11.0% -2.7% 1.6% 6.7%Stanly...........….. 14,106,418 15,122,972 15,354,159 16,012,796 15,194,385 15,213,140 15,798,876 16,447,987 7.2% 1.5% 4.3% -5.1% 0.1% 3.9% 4.1%Stokes.........…… 4,389,715 4,540,524 4,429,305 4,335,968 4,063,569 4,026,189 4,404,365 4,870,448 3.4% -2.4% -2.1% -6.3% -0.9% 9.4% 10.6%Surry.............…. 20,595,890 21,738,335 22,727,772 22,429,570 21,174,006 21,914,107 21,314,483 21,830,370 5.5% 4.6% -1.3% -5.6% 3.5% -2.7% 2.4%Swain............…. 2,033,989 2,025,580 2,032,881 2,076,281 1,863,674 1,854,528 2,008,920 2,154,258 -0.4% 0.4% 2.1% -10.2% -0.5% 8.3% 7.2%Transylvania….. 6,787,982 7,072,568 7,214,947 7,404,081 7,249,995 6,973,556 7,241,884 7,882,163 4.2% 2.0% 2.6% -2.1% -3.8% 3.8% 8.8%Tyrrell..........….. 449,551 439,733 438,165 444,562 379,997 350,750 418,522 417,336 -2.2% -0.4% 1.5% -14.5% -7.7% 19.3% -0.3%Union............…. 26,808,041 28,901,311 29,984,878 31,794,103 31,683,226 33,262,769 33,316,474 33,487,688 7.8% 3.7% 6.0% -0.3% 5.0% 0.2% 0.5%Vance...........….. 11,184,304 11,444,714 11,846,318 12,133,513 11,069,002 11,365,127 12,042,195 12,473,273 2.3% 3.5% 2.4% -8.8% 2.7% 6.0% 3.6%Wake............…. 258,563,816 279,668,250 294,957,062 312,276,720 315,537,062 323,975,565 322,094,729 347,250,844 8.2% 5.5% 5.9% 1.0% 2.7% -0.6% 7.8%Warren..........… 1,620,466 1,705,265 1,782,188 1,699,365 1,561,798 1,601,709 1,703,199 1,731,845 5.2% 4.5% -4.6% -8.1% 2.6% 6.3% 1.7%Washington.….. 2,198,322 2,176,117 1,984,416 1,819,952 1,645,506 1,717,094 1,820,256 1,904,453 -1.0% -8.8% -8.3% -9.6% 4.4% 6.0% 4.6%Watauga.......…. 16,309,669 17,180,843 18,520,289 19,506,687 19,851,084 20,227,598 21,131,817 22,676,783 5.3% 7.8% 5.3% 1.8% 1.9% 4.5% 7.3%Wayne...........… 30,554,322 31,998,951 31,648,206 31,406,886 30,736,784 30,203,751 31,711,271 32,687,577 4.7% -1.1% -0.8% -2.1% -1.7% 5.0% 3.1%Wilkes..........…. 14,570,692 14,476,146 15,287,495 15,875,960 15,742,939 15,373,187 15,793,264 16,725,911 -0.6% 5.6% 3.8% -0.8% -2.3% 2.7% 5.9%Wilson.........….. 21,567,931 22,588,984 24,361,944 23,710,748 23,359,652 23,732,039 24,163,984 24,961,260 4.7% 7.8% -2.7% -1.5% 1.6% 1.8% 3.3%Yadkin..........…. 4,821,903 5,207,023 5,376,525 5,356,472 4,902,440 5,089,860 5,448,195 5,558,787 8.0% 3.3% -0.4% -8.5% 3.8% 7.0% 2.0%Yancey ........….. 2,949,171 3,085,010 3,188,701 3,214,313 2,958,681 2,928,685 3,151,085 2,988,421 4.6% 3.4% 0.8% -8.0% -1.0% 7.6% -5.2%Unallocated…… 341,512,355 396,207,745 415,644,750 480,207,703 526,467,151 560,507,538 658,724,943 655,875,555 16.0% 4.9% 15.5% 9.6% 6.5% 17.5% -0.4%Statewide totals 2,752,346,296 2,926,759,358 3,061,601,639 3,193,353,952 3,201,208,315 3,282,011,366 3,465,390,202 3,623,075,071 6.3% 4.6% 4.3% 0.2% 2.5% 5.6% 4.6%Utility services.. 329,155,356 338,718,853 351,593,637 366,961,469 375,669,973 382,383,571 502,420,816 638,345,779 2.9% 3.8% 4.4% 2.4% 1.8% 31.4% 27.1%8% highway use tax…… 29,737,767 32,388,443 31,112,642 35,398,039 31,320,520 25,710,847 26,196,182 29,768,722 8.9% -3.9% 13.8% -11.5% -17.9% 1.9% 13.6%Other use tax… 386,184 482,370 615,635 521,631 686,081 632,653 n/a n/a 24.9% 27.6% -15.3% 31.5% -7.8% n/a n/a Totals...… 3,111,625,603 3,298,349,023 3,444,923,553 3,596,235,091 3,608,884,890 3,690,738,438 3,994,007,200 4,291,189,572 6.0% 4.4% 4.4% 0.4% 2.3% 8.2% 7.4%
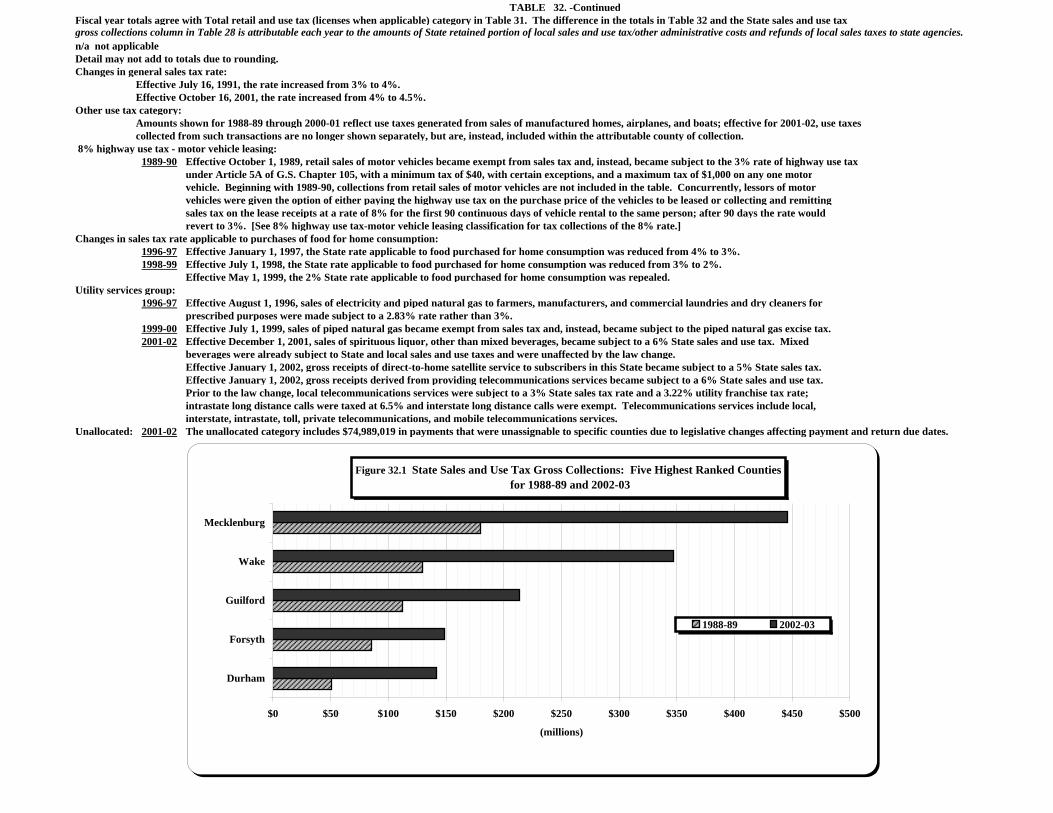
TABLE 32. -ContinuedFiscal year totals agree with Total retail and use tax (licenses when applicable) category in Table 31. The difference in the totals in Table 32 and the State sales and use taxgross collections column in Table 28 is attributable each year to the amounts of State retained portion of local sales and use tax/other administrative costs and refunds of local sales taxes to state agencies.n/a not applicableDetail may not add to totals due to rounding.Changes in general sales tax rate:
Effective July 16, 1991, the rate increased from 3% to 4%.Effective October 16, 2001, the rate increased from 4% to 4.5%.
Other use tax category: Amounts shown for 1988-89 through 2000-01 reflect use taxes generated from sales of manufactured homes, airplanes, and boats; effective for 2001-02, use taxes collected from such transactions are no longer shown separately, but are, instead, included within the attributable county of collection.
8% highway use tax - motor vehicle leasing:1989-90 Effective October 1, 1989, retail sales of motor vehicles became exempt from sales tax and, instead, became subject to the 3% rate of highway use tax
under Article 5A of G.S. Chapter 105, with a minimum tax of $40, with certain exceptions, and a maximum tax of $1,000 on any one motorvehicle. Beginning with 1989-90, collections from retail sales of motor vehicles are not included in the table. Concurrently, lessors of motorvehicles were given the option of either paying the highway use tax on the purchase price of the vehicles to be leased or collecting and remittingsales tax on the lease receipts at a rate of 8% for the first 90 continuous days of vehicle rental to the same person; after 90 days the rate wouldrevert to 3%. [See 8% highway use tax-motor vehicle leasing classification for tax collections of the 8% rate.]
Changes in sales tax rate applicable to purchases of food for home consumption:1996-97 Effective January 1, 1997, the State rate applicable to food purchased for home consumption was reduced from 4% to 3%.1998-99 Effective July 1, 1998, the State rate applicable to food purchased for home consumption was reduced from 3% to 2%.
Effective May 1, 1999, the 2% State rate applicable to food purchased for home consumption was repealed.Utility services group:
1996-97 Effective August 1, 1996, sales of electricity and piped natural gas to farmers, manufacturers, and commercial laundries and dry cleaners forprescribed purposes were made subject to a 2.83% rate rather than 3%.
1999-00 Effective July 1, 1999, sales of piped natural gas became exempt from sales tax and, instead, became subject to the piped natural gas excise tax.2001-02 Effective December 1, 2001, sales of spirituous liquor, other than mixed beverages, became subject to a 6% State sales and use tax. Mixed
beverages were already subject to State and local sales and use taxes and were unaffected by the law change.Effective January 1, 2002, gross receipts of direct-to-home satellite service to subscribers in this State became subject to a 5% State sales tax.Effective January 1, 2002, gross receipts derived from providing telecommunications services became subject to a 6% State sales and use tax.Prior to the law change, local telecommunications services were subject to a 3% State sales tax rate and a 3.22% utility franchise tax rate; intrastate long distance calls were taxed at 6.5% and interstate long distance calls were exempt. Telecommunications services include local,interstate, intrastate, toll, private telecommunications, and mobile telecommunications services.
Unallocated: 2001-02 The unallocated category includes $74,989,019 in payments that were unassignable to specific counties due to legislative changes affecting payment and return due dates.
1988-89 2002-03Durham 50,341,953 142,006,766Forsyth 85,188,441 148,626,462Guilford 112,201,820 213,778,522Wake 129,779,540 347,250,844Mecklenbu 179,902,623 446,072,492
Figure 32.1 State Sales and Use Tax Gross Collections: Five Highest Ranked Counties for 1988-89 and 2002-03
$0 $50 $100 $150 $200 $250 $300 $350 $400 $450 $500
Durham
Forsyth
Guilford
Wake
Mecklenburg
(millions)
1988-89 2002-03
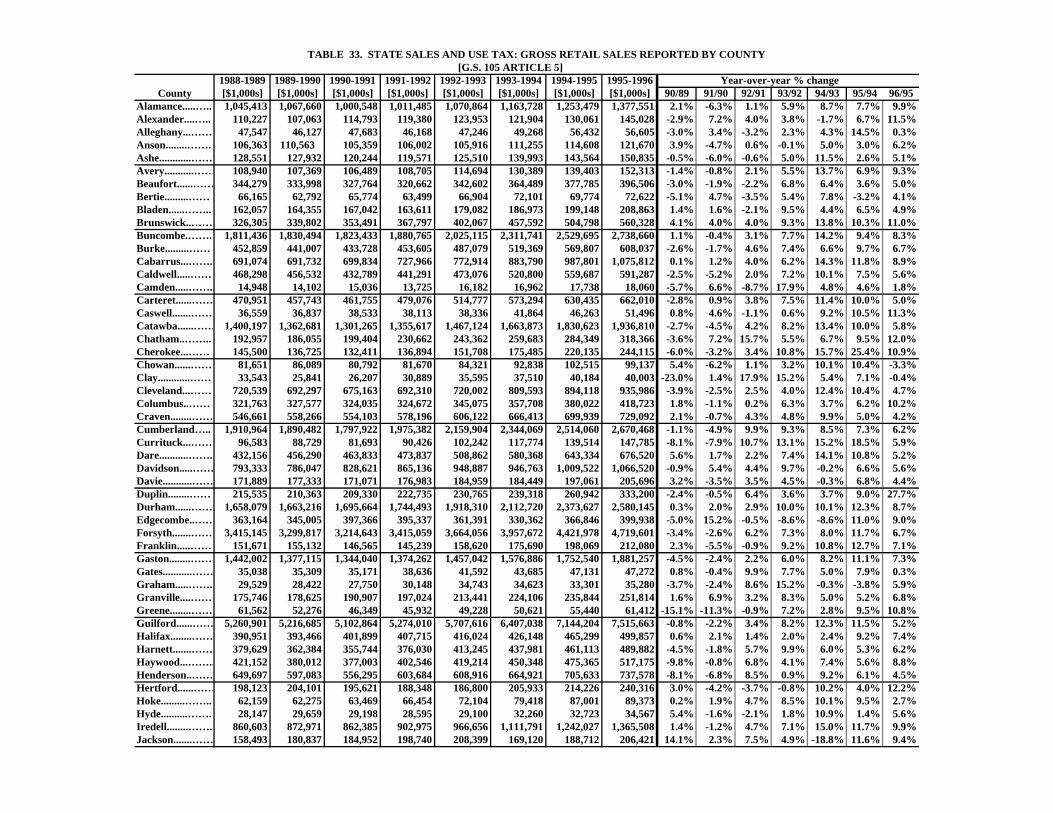
TABLE 33. STATE SALES AND USE TAX: GROSS RETAIL SALES REPORTED BY COUNTY [G.S. 105 ARTICLE 5]
1988-1989 1989-1990 1990-1991 1991-1992 1992-1993 1993-1994 1994-1995 1995-1996 Year-over-year % change County [$1,000s] [$1,000s] [$1,000s] [$1,000s] [$1,000s] [$1,000s] [$1,000s] [$1,000s] 90/89 91/90 92/91 93/92 94/93 95/94 96/95
Alamance.....….. 1,045,413 1,067,660 1,000,548 1,011,485 1,070,864 1,163,728 1,253,479 1,377,551 2.1% -6.3% 1.1% 5.9% 8.7% 7.7% 9.9%Alexander....….. 110,227 107,063 114,793 119,380 123,953 121,904 130,061 145,028 -2.9% 7.2% 4.0% 3.8% -1.7% 6.7% 11.5%Alleghany...…… 47,547 46,127 47,683 46,168 47,246 49,268 56,432 56,605 -3.0% 3.4% -3.2% 2.3% 4.3% 14.5% 0.3%Anson........……. 106,363 110,563 105,359 106,002 105,916 111,255 114,608 121,670 3.9% -4.7% 0.6% -0.1% 5.0% 3.0% 6.2%Ashe............…… 128,551 127,932 120,244 119,571 125,510 139,993 143,564 150,835 -0.5% -6.0% -0.6% 5.0% 11.5% 2.6% 5.1%Avery...........…… 108,940 107,369 106,489 108,705 114,694 130,389 139,403 152,313 -1.4% -0.8% 2.1% 5.5% 13.7% 6.9% 9.3%Beaufort......…… 344,279 333,998 327,764 320,662 342,602 364,489 377,785 396,506 -3.0% -1.9% -2.2% 6.8% 6.4% 3.6% 5.0%Bertie.........…… 66,165 62,792 65,774 63,499 66,904 72,101 69,774 72,622 -5.1% 4.7% -3.5% 5.4% 7.8% -3.2% 4.1%Bladen......…….. 162,057 164,355 167,042 163,611 179,082 186,973 199,148 208,863 1.4% 1.6% -2.1% 9.5% 4.4% 6.5% 4.9%Brunswick..…… 326,305 339,802 353,491 367,797 402,067 457,592 504,798 560,328 4.1% 4.0% 4.0% 9.3% 13.8% 10.3% 11.0%Buncombe.……. 1,811,436 1,830,494 1,823,433 1,880,765 2,025,115 2,311,741 2,529,695 2,738,660 1.1% -0.4% 3.1% 7.7% 14.2% 9.4% 8.3%Burke.........…… 452,859 441,007 433,728 453,605 487,079 519,369 569,807 608,037 -2.6% -1.7% 4.6% 7.4% 6.6% 9.7% 6.7%Cabarrus...……. 691,074 691,732 699,834 727,966 772,914 883,790 987,801 1,075,812 0.1% 1.2% 4.0% 6.2% 14.3% 11.8% 8.9%Caldwell.....…… 468,298 456,532 432,789 441,291 473,076 520,800 559,687 591,287 -2.5% -5.2% 2.0% 7.2% 10.1% 7.5% 5.6%Camden.....……. 14,948 14,102 15,036 13,725 16,182 16,962 17,738 18,060 -5.7% 6.6% -8.7% 17.9% 4.8% 4.6% 1.8%Carteret......…… 470,951 457,743 461,755 479,076 514,777 573,294 630,435 662,010 -2.8% 0.9% 3.8% 7.5% 11.4% 10.0% 5.0%Caswell.......…… 36,559 36,837 38,533 38,113 38,336 41,864 46,263 51,496 0.8% 4.6% -1.1% 0.6% 9.2% 10.5% 11.3%Catawba......…… 1,400,197 1,362,681 1,301,265 1,355,617 1,467,124 1,663,873 1,830,623 1,936,810 -2.7% -4.5% 4.2% 8.2% 13.4% 10.0% 5.8%Chatham..…….. 192,957 186,055 199,404 230,662 243,362 259,683 284,349 318,366 -3.6% 7.2% 15.7% 5.5% 6.7% 9.5% 12.0%Cherokee...…… 145,500 136,725 132,411 136,894 151,708 175,485 220,135 244,115 -6.0% -3.2% 3.4% 10.8% 15.7% 25.4% 10.9%Chowan......…… 81,651 86,089 80,792 81,670 84,321 92,838 102,515 99,137 5.4% -6.2% 1.1% 3.2% 10.1% 10.4% -3.3%Clay............…… 33,543 25,841 26,207 30,889 35,595 37,510 40,184 40,003 -23.0% 1.4% 17.9% 15.2% 5.4% 7.1% -0.4%Cleveland...…… 720,539 692,297 675,163 692,310 720,002 809,593 894,118 935,986 -3.9% -2.5% 2.5% 4.0% 12.4% 10.4% 4.7%Columbus..…… 321,763 327,577 324,035 324,672 345,075 357,708 380,022 418,723 1.8% -1.1% 0.2% 6.3% 3.7% 6.2% 10.2%Craven........…… 546,661 558,266 554,103 578,196 606,122 666,413 699,939 729,092 2.1% -0.7% 4.3% 4.8% 9.9% 5.0% 4.2%Cumberland….. 1,910,964 1,890,482 1,797,922 1,975,382 2,159,904 2,344,069 2,514,060 2,670,468 -1.1% -4.9% 9.9% 9.3% 8.5% 7.3% 6.2%Currituck...…… 96,583 88,729 81,693 90,426 102,242 117,774 139,514 147,785 -8.1% -7.9% 10.7% 13.1% 15.2% 18.5% 5.9%Dare...........……. 432,156 456,290 463,833 473,837 508,862 580,368 643,334 676,520 5.6% 1.7% 2.2% 7.4% 14.1% 10.8% 5.2%Davidson.....…… 793,333 786,047 828,621 865,136 948,887 946,763 1,009,522 1,066,520 -0.9% 5.4% 4.4% 9.7% -0.2% 6.6% 5.6%Davie...........…… 171,889 177,333 171,071 176,983 184,959 184,449 197,061 205,696 3.2% -3.5% 3.5% 4.5% -0.3% 6.8% 4.4%Duplin........…… 215,535 210,363 209,330 222,735 230,765 239,318 260,942 333,200 -2.4% -0.5% 6.4% 3.6% 3.7% 9.0% 27.7%Durham......…… 1,658,079 1,663,216 1,695,664 1,744,493 1,918,310 2,112,720 2,373,627 2,580,145 0.3% 2.0% 2.9% 10.0% 10.1% 12.3% 8.7%Edgecombe..…… 363,164 345,005 397,366 395,337 361,391 330,362 366,846 399,938 -5.0% 15.2% -0.5% -8.6% -8.6% 11.0% 9.0%Forsyth.......…… 3,415,145 3,299,817 3,214,643 3,415,059 3,664,056 3,957,672 4,421,978 4,719,601 -3.4% -2.6% 6.2% 7.3% 8.0% 11.7% 6.7%Franklin.....…… 151,671 155,132 146,565 145,239 158,620 175,690 198,069 212,080 2.3% -5.5% -0.9% 9.2% 10.8% 12.7% 7.1%Gaston........…… 1,442,002 1,377,115 1,344,040 1,374,262 1,457,042 1,576,886 1,752,540 1,881,257 -4.5% -2.4% 2.2% 6.0% 8.2% 11.1% 7.3%Gates...........…… 35,038 35,309 35,171 38,636 41,592 43,685 47,131 47,272 0.8% -0.4% 9.9% 7.7% 5.0% 7.9% 0.3%Graham.....……. 29,529 28,422 27,750 30,148 34,743 34,623 33,301 35,280 -3.7% -2.4% 8.6% 15.2% -0.3% -3.8% 5.9%Granville....…… 175,746 178,625 190,907 197,024 213,441 224,106 235,844 251,814 1.6% 6.9% 3.2% 8.3% 5.0% 5.2% 6.8%Greene........…… 61,562 52,276 46,349 45,932 49,228 50,621 55,440 61,412 -15.1% -11.3% -0.9% 7.2% 2.8% 9.5% 10.8%Guilford......…… 5,260,901 5,216,685 5,102,864 5,274,010 5,707,616 6,407,038 7,144,204 7,515,663 -0.8% -2.2% 3.4% 8.2% 12.3% 11.5% 5.2%Halifax........…… 390,951 393,466 401,899 407,715 416,024 426,148 465,299 499,857 0.6% 2.1% 1.4% 2.0% 2.4% 9.2% 7.4%Harnett.......…… 379,629 362,384 355,744 376,030 413,245 437,981 461,113 489,882 -4.5% -1.8% 5.7% 9.9% 6.0% 5.3% 6.2%Haywood...…….. 421,152 380,012 377,003 402,546 419,214 450,348 475,365 517,175 -9.8% -0.8% 6.8% 4.1% 7.4% 5.6% 8.8%Henderson..…… 649,697 597,083 556,295 603,684 608,916 664,921 705,633 737,578 -8.1% -6.8% 8.5% 0.9% 9.2% 6.1% 4.5%Hertford......…… 198,123 204,101 195,621 188,348 186,800 205,933 214,226 240,316 3.0% -4.2% -3.7% -0.8% 10.2% 4.0% 12.2%Hoke.........…….. 62,159 62,275 63,469 66,454 72,104 79,418 87,001 89,373 0.2% 1.9% 4.7% 8.5% 10.1% 9.5% 2.7%Hyde..........……. 28,147 29,659 29,198 28,595 29,100 32,260 32,723 34,567 5.4% -1.6% -2.1% 1.8% 10.9% 1.4% 5.6%Iredell........……. 860,603 872,971 862,385 902,975 966,656 1,111,791 1,242,027 1,365,508 1.4% -1.2% 4.7% 7.1% 15.0% 11.7% 9.9%Jackson.......…… 158,493 180,837 184,952 198,740 208,399 169,120 188,712 206,421 14.1% 2.3% 7.5% 4.9% -18.8% 11.6% 9.4%
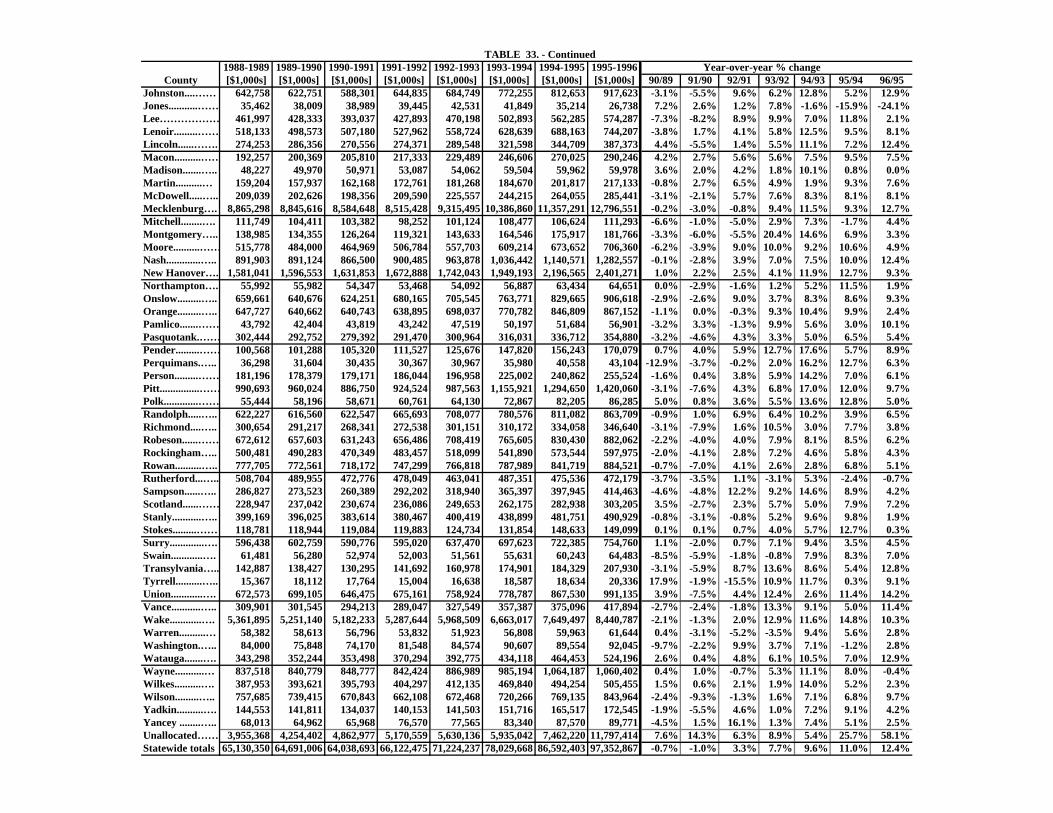
TABLE 33. - Continued1988-1989 1989-1990 1990-1991 1991-1992 1992-1993 1993-1994 1994-1995 1995-1996 Year-over-year % change
County [$1,000s] [$1,000s] [$1,000s] [$1,000s] [$1,000s] [$1,000s] [$1,000s] [$1,000s] 90/89 91/90 92/91 93/92 94/93 95/94 96/95Johnston....…… 642,758 622,751 588,301 644,835 684,749 772,255 812,653 917,623 -3.1% -5.5% 9.6% 6.2% 12.8% 5.2% 12.9%Jones...........…… 35,462 38,009 38,989 39,445 42,531 41,849 35,214 26,738 7.2% 2.6% 1.2% 7.8% -1.6% -15.9% -24.1%Lee……………… 461,997 428,333 393,037 427,893 470,198 502,893 562,285 574,287 -7.3% -8.2% 8.9% 9.9% 7.0% 11.8% 2.1%Lenoir.........…… 518,133 498,573 507,180 527,962 558,724 628,639 688,163 744,207 -3.8% 1.7% 4.1% 5.8% 12.5% 9.5% 8.1%Lincoln......……. 274,253 286,356 270,556 274,371 289,548 321,598 344,709 387,373 4.4% -5.5% 1.4% 5.5% 11.1% 7.2% 12.4%Macon..........…… 192,257 200,369 205,810 217,333 229,489 246,606 270,025 290,246 4.2% 2.7% 5.6% 5.6% 7.5% 9.5% 7.5%Madison.......….. 48,227 49,970 50,971 53,087 54,062 59,504 59,962 59,978 3.6% 2.0% 4.2% 1.8% 10.1% 0.8% 0.0%Martin..........… 159,204 157,937 162,168 172,761 181,268 184,670 201,817 217,133 -0.8% 2.7% 6.5% 4.9% 1.9% 9.3% 7.6%McDowell.....….. 209,039 202,626 198,356 209,590 225,557 244,215 264,055 285,441 -3.1% -2.1% 5.7% 7.6% 8.3% 8.1% 8.1%Mecklenburg…. 8,865,298 8,845,616 8,584,648 8,515,428 9,315,495 10,386,860 11,357,291 12,796,551 -0.2% -3.0% -0.8% 9.4% 11.5% 9.3% 12.7%Mitchell........…. 111,749 104,411 103,382 98,252 101,124 108,477 106,624 111,293 -6.6% -1.0% -5.0% 2.9% 7.3% -1.7% 4.4%Montgomery….. 138,985 134,355 126,264 119,321 143,633 164,546 175,917 181,766 -3.3% -6.0% -5.5% 20.4% 14.6% 6.9% 3.3%Moore..........…… 515,778 484,000 464,969 506,784 557,703 609,214 673,652 706,360 -6.2% -3.9% 9.0% 10.0% 9.2% 10.6% 4.9%Nash.............….. 891,903 891,124 866,500 900,485 963,878 1,036,442 1,140,571 1,282,557 -0.1% -2.8% 3.9% 7.0% 7.5% 10.0% 12.4%New Hanover…. 1,581,041 1,596,553 1,631,853 1,672,888 1,742,043 1,949,193 2,196,565 2,401,271 1.0% 2.2% 2.5% 4.1% 11.9% 12.7% 9.3%Northampton…. 55,992 55,982 54,347 53,468 54,092 56,887 63,434 64,651 0.0% -2.9% -1.6% 1.2% 5.2% 11.5% 1.9%Onslow.........….. 659,661 640,676 624,251 680,165 705,545 763,771 829,665 906,618 -2.9% -2.6% 9.0% 3.7% 8.3% 8.6% 9.3%Orange.........….. 647,727 640,662 640,743 638,895 698,037 770,782 846,809 867,152 -1.1% 0.0% -0.3% 9.3% 10.4% 9.9% 2.4%Pamlico.......…… 43,792 42,404 43,819 43,242 47,519 50,197 51,684 56,901 -3.2% 3.3% -1.3% 9.9% 5.6% 3.0% 10.1%Pasquotank.…… 302,444 292,752 279,392 291,470 300,964 316,031 336,712 354,880 -3.2% -4.6% 4.3% 3.3% 5.0% 6.5% 5.4%Pender.........…… 100,568 101,288 105,320 111,527 125,676 147,820 156,243 170,079 0.7% 4.0% 5.9% 12.7% 17.6% 5.7% 8.9%Perquimans.….. 36,298 31,604 30,435 30,367 30,967 35,980 40,558 43,104 -12.9% -3.7% -0.2% 2.0% 16.2% 12.7% 6.3%Person.........…… 181,196 178,379 179,171 186,044 196,958 225,002 240,862 255,524 -1.6% 0.4% 3.8% 5.9% 14.2% 7.0% 6.1%Pitt...............…… 990,693 960,024 886,750 924,524 987,563 1,155,921 1,294,650 1,420,060 -3.1% -7.6% 4.3% 6.8% 17.0% 12.0% 9.7%Polk.............…… 55,444 58,196 58,671 60,761 64,130 72,867 82,205 86,285 5.0% 0.8% 3.6% 5.5% 13.6% 12.8% 5.0%Randolph.....….. 622,227 616,560 622,547 665,693 708,077 780,576 811,082 863,709 -0.9% 1.0% 6.9% 6.4% 10.2% 3.9% 6.5%Richmond....….. 300,654 291,217 268,341 272,538 301,151 310,172 334,058 346,640 -3.1% -7.9% 1.6% 10.5% 3.0% 7.7% 3.8%Robeson......…… 672,612 657,603 631,243 656,486 708,419 765,605 830,430 882,062 -2.2% -4.0% 4.0% 7.9% 8.1% 8.5% 6.2%Rockingham….. 500,481 490,283 470,349 483,457 518,099 541,890 573,544 597,975 -2.0% -4.1% 2.8% 7.2% 4.6% 5.8% 4.3%Rowan..........….. 777,705 772,561 718,172 747,299 766,818 787,989 841,719 884,521 -0.7% -7.0% 4.1% 2.6% 2.8% 6.8% 5.1%Rutherford...….. 508,704 489,955 472,776 478,049 463,041 487,351 475,536 472,179 -3.7% -3.5% 1.1% -3.1% 5.3% -2.4% -0.7%Sampson......….. 286,827 273,523 260,389 292,202 318,940 365,397 397,945 414,463 -4.6% -4.8% 12.2% 9.2% 14.6% 8.9% 4.2%Scotland......…… 228,947 237,042 230,674 236,086 249,653 262,175 282,938 303,205 3.5% -2.7% 2.3% 5.7% 5.0% 7.9% 7.2%Stanly...........….. 399,169 396,025 383,614 380,467 400,419 438,899 481,751 490,929 -0.8% -3.1% -0.8% 5.2% 9.6% 9.8% 1.9%Stokes.........…… 118,781 118,944 119,084 119,883 124,734 131,854 148,633 149,099 0.1% 0.1% 0.7% 4.0% 5.7% 12.7% 0.3%Surry.............…. 596,438 602,759 590,776 595,020 637,470 697,623 722,385 754,760 1.1% -2.0% 0.7% 7.1% 9.4% 3.5% 4.5%Swain............…. 61,481 56,280 52,974 52,003 51,561 55,631 60,243 64,483 -8.5% -5.9% -1.8% -0.8% 7.9% 8.3% 7.0%Transylvania….. 142,887 138,427 130,295 141,692 160,978 174,901 184,329 207,930 -3.1% -5.9% 8.7% 13.6% 8.6% 5.4% 12.8%Tyrrell..........….. 15,367 18,112 17,764 15,004 16,638 18,587 18,634 20,336 17.9% -1.9% -15.5% 10.9% 11.7% 0.3% 9.1%Union............…. 672,573 699,105 646,475 675,161 758,924 778,787 867,530 991,135 3.9% -7.5% 4.4% 12.4% 2.6% 11.4% 14.2%Vance...........….. 309,901 301,545 294,213 289,047 327,549 357,387 375,096 417,894 -2.7% -2.4% -1.8% 13.3% 9.1% 5.0% 11.4%Wake............…. 5,361,895 5,251,140 5,182,233 5,287,644 5,968,509 6,663,017 7,649,497 8,440,787 -2.1% -1.3% 2.0% 12.9% 11.6% 14.8% 10.3%Warren..........… 58,382 58,613 56,796 53,832 51,923 56,808 59,963 61,644 0.4% -3.1% -5.2% -3.5% 9.4% 5.6% 2.8%Washington.….. 84,000 75,848 74,170 81,548 84,574 90,607 89,554 92,045 -9.7% -2.2% 9.9% 3.7% 7.1% -1.2% 2.8%Watauga.......…. 343,298 352,244 353,498 370,294 392,775 434,118 464,453 524,196 2.6% 0.4% 4.8% 6.1% 10.5% 7.0% 12.9%Wayne...........… 837,518 840,779 848,777 842,424 886,989 985,194 1,064,187 1,060,402 0.4% 1.0% -0.7% 5.3% 11.1% 8.0% -0.4%Wilkes..........…. 387,953 393,621 395,793 404,297 412,135 469,840 494,254 505,455 1.5% 0.6% 2.1% 1.9% 14.0% 5.2% 2.3%Wilson.........….. 757,685 739,415 670,843 662,108 672,468 720,266 769,135 843,964 -2.4% -9.3% -1.3% 1.6% 7.1% 6.8% 9.7%Yadkin..........…. 144,553 141,811 134,037 140,153 141,503 151,716 165,517 172,545 -1.9% -5.5% 4.6% 1.0% 7.2% 9.1% 4.2%Yancey ........….. 68,013 64,962 65,968 76,570 77,565 83,340 87,570 89,771 -4.5% 1.5% 16.1% 1.3% 7.4% 5.1% 2.5%Unallocated…… 3,955,368 4,254,402 4,862,977 5,170,559 5,630,136 5,935,042 7,462,220 11,797,414 7.6% 14.3% 6.3% 8.9% 5.4% 25.7% 58.1%Statewide totals 65,130,350 64,691,006 64,038,693 66,122,475 71,224,237 78,029,668 86,592,403 97,352,867 -0.7% -1.0% 3.3% 7.7% 9.6% 11.0% 12.4%
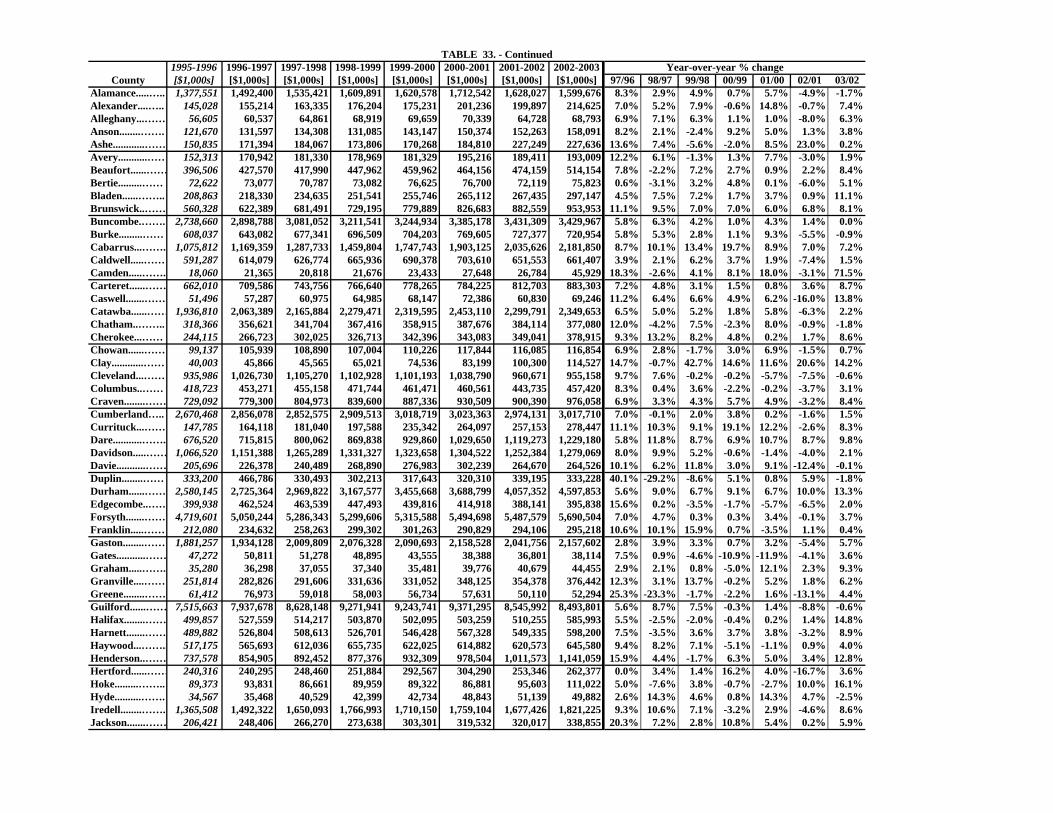
TABLE 33. - Continued1995-1996 1996-1997 1997-1998 1998-1999 1999-2000 2000-2001 2001-2002 2002-2003 Year-over-year % change
County [$1,000s] [$1,000s] [$1,000s] [$1,000s] [$1,000s] [$1,000s] [$1,000s] [$1,000s] 97/96 98/97 99/98 00/99 01/00 02/01 03/02Alamance.....….. 1,377,551 1,492,400 1,535,421 1,609,891 1,620,578 1,712,542 1,628,027 1,599,676 8.3% 2.9% 4.9% 0.7% 5.7% -4.9% -1.7%Alexander....….. 145,028 155,214 163,335 176,204 175,231 201,236 199,897 214,625 7.0% 5.2% 7.9% -0.6% 14.8% -0.7% 7.4%Alleghany...…… 56,605 60,537 64,861 68,919 69,659 70,339 64,728 68,793 6.9% 7.1% 6.3% 1.1% 1.0% -8.0% 6.3%Anson........……. 121,670 131,597 134,308 131,085 143,147 150,374 152,263 158,091 8.2% 2.1% -2.4% 9.2% 5.0% 1.3% 3.8%Ashe............…… 150,835 171,394 184,067 173,806 170,268 184,810 227,249 227,636 13.6% 7.4% -5.6% -2.0% 8.5% 23.0% 0.2%Avery...........…… 152,313 170,942 181,330 178,969 181,329 195,216 189,411 193,009 12.2% 6.1% -1.3% 1.3% 7.7% -3.0% 1.9%Beaufort......…… 396,506 427,570 417,990 447,962 459,962 464,156 474,159 514,154 7.8% -2.2% 7.2% 2.7% 0.9% 2.2% 8.4%Bertie.........…… 72,622 73,077 70,787 73,082 76,625 76,700 72,119 75,823 0.6% -3.1% 3.2% 4.8% 0.1% -6.0% 5.1%Bladen......…….. 208,863 218,330 234,635 251,541 255,746 265,112 267,435 297,147 4.5% 7.5% 7.2% 1.7% 3.7% 0.9% 11.1%Brunswick..…… 560,328 622,389 681,491 729,195 779,889 826,683 882,559 953,953 11.1% 9.5% 7.0% 7.0% 6.0% 6.8% 8.1%Buncombe.……. 2,738,660 2,898,788 3,081,052 3,211,541 3,244,934 3,385,178 3,431,309 3,429,967 5.8% 6.3% 4.2% 1.0% 4.3% 1.4% 0.0%Burke.........…… 608,037 643,082 677,341 696,509 704,203 769,605 727,377 720,954 5.8% 5.3% 2.8% 1.1% 9.3% -5.5% -0.9%Cabarrus...……. 1,075,812 1,169,359 1,287,733 1,459,804 1,747,743 1,903,125 2,035,626 2,181,850 8.7% 10.1% 13.4% 19.7% 8.9% 7.0% 7.2%Caldwell.....…… 591,287 614,079 626,774 665,936 690,378 703,610 651,553 661,407 3.9% 2.1% 6.2% 3.7% 1.9% -7.4% 1.5%Camden.....……. 18,060 21,365 20,818 21,676 23,433 27,648 26,784 45,929 18.3% -2.6% 4.1% 8.1% 18.0% -3.1% 71.5%Carteret......…… 662,010 709,586 743,756 766,640 778,265 784,225 812,703 883,303 7.2% 4.8% 3.1% 1.5% 0.8% 3.6% 8.7%Caswell.......…… 51,496 57,287 60,975 64,985 68,147 72,386 60,830 69,246 11.2% 6.4% 6.6% 4.9% 6.2% -16.0% 13.8%Catawba......…… 1,936,810 2,063,389 2,165,884 2,279,471 2,319,595 2,453,110 2,299,791 2,349,653 6.5% 5.0% 5.2% 1.8% 5.8% -6.3% 2.2%Chatham..…….. 318,366 356,621 341,704 367,416 358,915 387,676 384,114 377,080 12.0% -4.2% 7.5% -2.3% 8.0% -0.9% -1.8%Cherokee...…… 244,115 266,723 302,025 326,713 342,396 343,083 349,041 378,915 9.3% 13.2% 8.2% 4.8% 0.2% 1.7% 8.6%Chowan......…… 99,137 105,939 108,890 107,004 110,226 117,844 116,085 116,854 6.9% 2.8% -1.7% 3.0% 6.9% -1.5% 0.7%Clay............…… 40,003 45,866 45,565 65,021 74,536 83,199 100,300 114,527 14.7% -0.7% 42.7% 14.6% 11.6% 20.6% 14.2%Cleveland...…… 935,986 1,026,730 1,105,270 1,102,928 1,101,193 1,038,790 960,671 955,158 9.7% 7.6% -0.2% -0.2% -5.7% -7.5% -0.6%Columbus..…… 418,723 453,271 455,158 471,744 461,471 460,561 443,735 457,420 8.3% 0.4% 3.6% -2.2% -0.2% -3.7% 3.1%Craven........…… 729,092 779,300 804,973 839,600 887,336 930,509 900,390 976,058 6.9% 3.3% 4.3% 5.7% 4.9% -3.2% 8.4%Cumberland….. 2,670,468 2,856,078 2,852,575 2,909,513 3,018,719 3,023,363 2,974,131 3,017,710 7.0% -0.1% 2.0% 3.8% 0.2% -1.6% 1.5%Currituck...…… 147,785 164,118 181,040 197,588 235,342 264,097 257,153 278,447 11.1% 10.3% 9.1% 19.1% 12.2% -2.6% 8.3%Dare...........……. 676,520 715,815 800,062 869,838 929,860 1,029,650 1,119,273 1,229,180 5.8% 11.8% 8.7% 6.9% 10.7% 8.7% 9.8%Davidson.....…… 1,066,520 1,151,388 1,265,289 1,331,327 1,323,658 1,304,522 1,252,384 1,279,069 8.0% 9.9% 5.2% -0.6% -1.4% -4.0% 2.1%Davie...........…… 205,696 226,378 240,489 268,890 276,983 302,239 264,670 264,526 10.1% 6.2% 11.8% 3.0% 9.1% -12.4% -0.1%Duplin........…… 333,200 466,786 330,493 302,213 317,643 320,310 339,195 333,228 40.1% -29.2% -8.6% 5.1% 0.8% 5.9% -1.8%Durham......…… 2,580,145 2,725,364 2,969,822 3,167,577 3,455,668 3,688,799 4,057,352 4,597,853 5.6% 9.0% 6.7% 9.1% 6.7% 10.0% 13.3%Edgecombe..…… 399,938 462,524 463,539 447,493 439,816 414,918 388,141 395,838 15.6% 0.2% -3.5% -1.7% -5.7% -6.5% 2.0%Forsyth.......…… 4,719,601 5,050,244 5,286,343 5,299,606 5,315,588 5,494,698 5,487,579 5,690,504 7.0% 4.7% 0.3% 0.3% 3.4% -0.1% 3.7%Franklin.....…… 212,080 234,632 258,263 299,302 301,263 290,829 294,106 295,218 10.6% 10.1% 15.9% 0.7% -3.5% 1.1% 0.4%Gaston........…… 1,881,257 1,934,128 2,009,809 2,076,328 2,090,693 2,158,528 2,041,756 2,157,602 2.8% 3.9% 3.3% 0.7% 3.2% -5.4% 5.7%Gates...........…… 47,272 50,811 51,278 48,895 43,555 38,388 36,801 38,114 7.5% 0.9% -4.6% -10.9% -11.9% -4.1% 3.6%Graham.....……. 35,280 36,298 37,055 37,340 35,481 39,776 40,679 44,455 2.9% 2.1% 0.8% -5.0% 12.1% 2.3% 9.3%Granville....…… 251,814 282,826 291,606 331,636 331,052 348,125 354,378 376,442 12.3% 3.1% 13.7% -0.2% 5.2% 1.8% 6.2%Greene........…… 61,412 76,973 59,018 58,003 56,734 57,631 50,110 52,294 25.3% -23.3% -1.7% -2.2% 1.6% -13.1% 4.4%Guilford......…… 7,515,663 7,937,678 8,628,148 9,271,941 9,243,741 9,371,295 8,545,992 8,493,801 5.6% 8.7% 7.5% -0.3% 1.4% -8.8% -0.6%Halifax........…… 499,857 527,559 514,217 503,870 502,095 503,259 510,255 585,993 5.5% -2.5% -2.0% -0.4% 0.2% 1.4% 14.8%Harnett.......…… 489,882 526,804 508,613 526,701 546,428 567,328 549,335 598,200 7.5% -3.5% 3.6% 3.7% 3.8% -3.2% 8.9%Haywood...…….. 517,175 565,693 612,036 655,735 622,025 614,882 620,573 645,580 9.4% 8.2% 7.1% -5.1% -1.1% 0.9% 4.0%Henderson..…… 737,578 854,905 892,452 877,376 932,309 978,504 1,011,573 1,141,059 15.9% 4.4% -1.7% 6.3% 5.0% 3.4% 12.8%Hertford......…… 240,316 240,295 248,460 251,884 292,567 304,290 253,346 262,377 0.0% 3.4% 1.4% 16.2% 4.0% -16.7% 3.6%Hoke.........…….. 89,373 93,831 86,661 89,959 89,322 86,881 95,603 111,022 5.0% -7.6% 3.8% -0.7% -2.7% 10.0% 16.1%Hyde..........……. 34,567 35,468 40,529 42,399 42,734 48,843 51,139 49,882 2.6% 14.3% 4.6% 0.8% 14.3% 4.7% -2.5%Iredell........……. 1,365,508 1,492,322 1,650,093 1,766,993 1,710,150 1,759,104 1,677,426 1,821,225 9.3% 10.6% 7.1% -3.2% 2.9% -4.6% 8.6%Jackson.......…… 206,421 248,406 266,270 273,638 303,301 319,532 320,017 338,855 20.3% 7.2% 2.8% 10.8% 5.4% 0.2% 5.9%
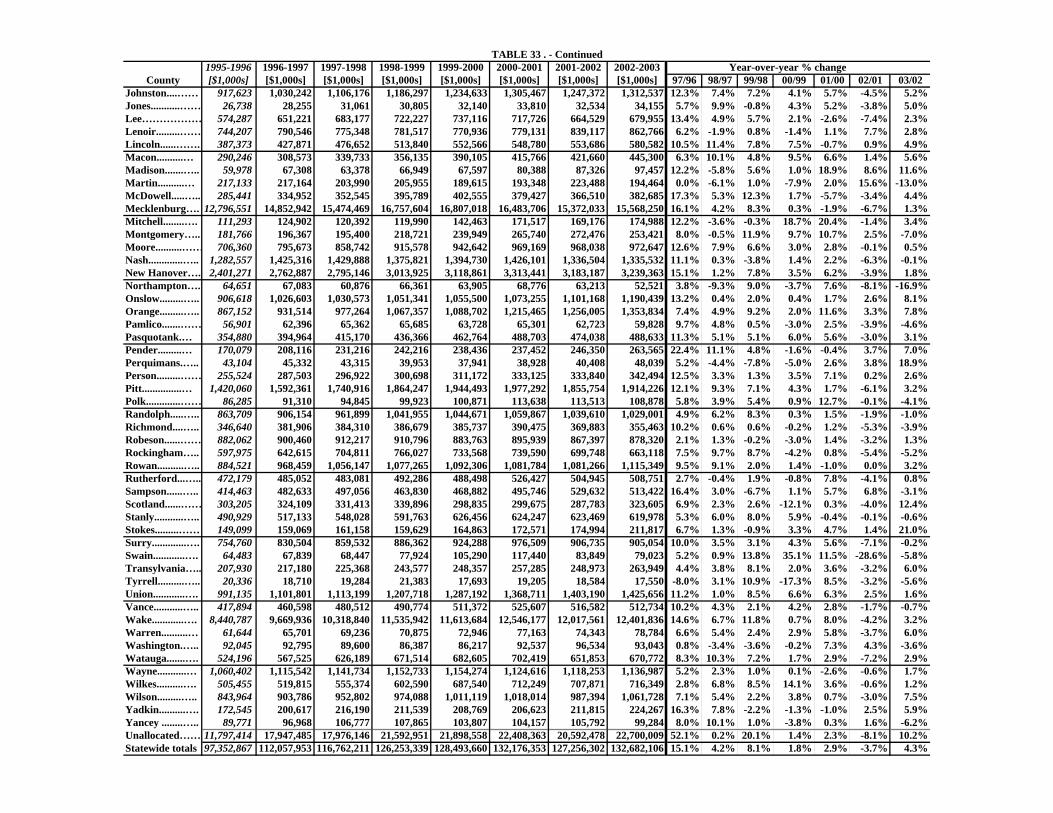
TABLE 33 . - Continued1995-1996 1996-1997 1997-1998 1998-1999 1999-2000 2000-2001 2001-2002 2002-2003 Year-over-year % change
County [$1,000s] [$1,000s] [$1,000s] [$1,000s] [$1,000s] [$1,000s] [$1,000s] [$1,000s] 97/96 98/97 99/98 00/99 01/00 02/01 03/02Johnston....…… 917,623 1,030,242 1,106,176 1,186,297 1,234,633 1,305,467 1,247,372 1,312,537 12.3% 7.4% 7.2% 4.1% 5.7% -4.5% 5.2%Jones...........…… 26,738 28,255 31,061 30,805 32,140 33,810 32,534 34,155 5.7% 9.9% -0.8% 4.3% 5.2% -3.8% 5.0%Lee……………… 574,287 651,221 683,177 722,227 737,116 717,726 664,529 679,955 13.4% 4.9% 5.7% 2.1% -2.6% -7.4% 2.3%Lenoir.........…… 744,207 790,546 775,348 781,517 770,936 779,131 839,117 862,766 6.2% -1.9% 0.8% -1.4% 1.1% 7.7% 2.8%Lincoln......……. 387,373 427,871 476,652 513,840 552,566 548,780 553,686 580,582 10.5% 11.4% 7.8% 7.5% -0.7% 0.9% 4.9%Macon..........… 290,246 308,573 339,733 356,135 390,105 415,766 421,660 445,300 6.3% 10.1% 4.8% 9.5% 6.6% 1.4% 5.6%Madison.......….. 59,978 67,308 63,378 66,949 67,597 80,388 87,326 97,457 12.2% -5.8% 5.6% 1.0% 18.9% 8.6% 11.6%Martin..........… 217,133 217,164 203,990 205,955 189,615 193,348 223,488 194,464 0.0% -6.1% 1.0% -7.9% 2.0% 15.6% -13.0%McDowell.....….. 285,441 334,952 352,545 395,789 402,555 379,427 366,510 382,685 17.3% 5.3% 12.3% 1.7% -5.7% -3.4% 4.4%Mecklenburg…. 12,796,551 14,852,942 15,474,469 16,757,604 16,807,018 16,483,706 15,372,033 15,568,250 16.1% 4.2% 8.3% 0.3% -1.9% -6.7% 1.3%Mitchell........…. 111,293 124,902 120,392 119,990 142,463 171,517 169,176 174,988 12.2% -3.6% -0.3% 18.7% 20.4% -1.4% 3.4%Montgomery….. 181,766 196,367 195,400 218,721 239,949 265,740 272,476 253,421 8.0% -0.5% 11.9% 9.7% 10.7% 2.5% -7.0%Moore..........…… 706,360 795,673 858,742 915,578 942,642 969,169 968,038 972,647 12.6% 7.9% 6.6% 3.0% 2.8% -0.1% 0.5%Nash.............….. 1,282,557 1,425,316 1,429,888 1,375,821 1,394,730 1,426,101 1,336,504 1,335,532 11.1% 0.3% -3.8% 1.4% 2.2% -6.3% -0.1%New Hanover…. 2,401,271 2,762,887 2,795,146 3,013,925 3,118,861 3,313,441 3,183,187 3,239,363 15.1% 1.2% 7.8% 3.5% 6.2% -3.9% 1.8%Northampton…. 64,651 67,083 60,876 66,361 63,905 68,776 63,213 52,521 3.8% -9.3% 9.0% -3.7% 7.6% -8.1% -16.9%Onslow.........….. 906,618 1,026,603 1,030,573 1,051,341 1,055,500 1,073,255 1,101,168 1,190,439 13.2% 0.4% 2.0% 0.4% 1.7% 2.6% 8.1%Orange.........….. 867,152 931,514 977,264 1,067,357 1,088,702 1,215,465 1,256,005 1,353,834 7.4% 4.9% 9.2% 2.0% 11.6% 3.3% 7.8%Pamlico.......…… 56,901 62,396 65,362 65,685 63,728 65,301 62,723 59,828 9.7% 4.8% 0.5% -3.0% 2.5% -3.9% -4.6%Pasquotank.… 354,880 394,964 415,170 436,366 462,764 488,703 474,038 488,633 11.3% 5.1% 5.1% 6.0% 5.6% -3.0% 3.1%Pender.........… 170,079 208,116 231,216 242,216 238,436 237,452 246,350 263,565 22.4% 11.1% 4.8% -1.6% -0.4% 3.7% 7.0%Perquimans.….. 43,104 45,332 43,315 39,953 37,941 38,928 40,408 48,039 5.2% -4.4% -7.8% -5.0% 2.6% 3.8% 18.9%Person.........…… 255,524 287,503 296,922 300,698 311,172 333,125 333,840 342,494 12.5% 3.3% 1.3% 3.5% 7.1% 0.2% 2.6%Pitt...............… 1,420,060 1,592,361 1,740,916 1,864,247 1,944,493 1,977,292 1,855,754 1,914,226 12.1% 9.3% 7.1% 4.3% 1.7% -6.1% 3.2%Polk.............…… 86,285 91,310 94,845 99,923 100,871 113,638 113,513 108,878 5.8% 3.9% 5.4% 0.9% 12.7% -0.1% -4.1%Randolph.....….. 863,709 906,154 961,899 1,041,955 1,044,671 1,059,867 1,039,610 1,029,001 4.9% 6.2% 8.3% 0.3% 1.5% -1.9% -1.0%Richmond....….. 346,640 381,906 384,310 386,679 385,737 390,475 369,883 355,463 10.2% 0.6% 0.6% -0.2% 1.2% -5.3% -3.9%Robeson......…… 882,062 900,460 912,217 910,796 883,763 895,939 867,397 878,320 2.1% 1.3% -0.2% -3.0% 1.4% -3.2% 1.3%Rockingham….. 597,975 642,615 704,811 766,027 733,568 739,590 699,748 663,118 7.5% 9.7% 8.7% -4.2% 0.8% -5.4% -5.2%Rowan..........….. 884,521 968,459 1,056,147 1,077,265 1,092,306 1,081,784 1,081,266 1,115,349 9.5% 9.1% 2.0% 1.4% -1.0% 0.0% 3.2%Rutherford...….. 472,179 485,052 483,081 492,286 488,498 526,427 504,945 508,751 2.7% -0.4% 1.9% -0.8% 7.8% -4.1% 0.8%Sampson......….. 414,463 482,633 497,056 463,830 468,882 495,746 529,632 513,422 16.4% 3.0% -6.7% 1.1% 5.7% 6.8% -3.1%Scotland......…… 303,205 324,109 331,413 339,896 298,835 299,675 287,783 323,605 6.9% 2.3% 2.6% -12.1% 0.3% -4.0% 12.4%Stanly...........….. 490,929 517,133 548,028 591,763 626,456 624,247 623,469 619,978 5.3% 6.0% 8.0% 5.9% -0.4% -0.1% -0.6%Stokes.........…… 149,099 159,069 161,158 159,629 164,863 172,571 174,994 211,817 6.7% 1.3% -0.9% 3.3% 4.7% 1.4% 21.0%Surry.............…. 754,760 830,504 859,532 886,362 924,288 976,509 906,735 905,054 10.0% 3.5% 3.1% 4.3% 5.6% -7.1% -0.2%Swain............…. 64,483 67,839 68,447 77,924 105,290 117,440 83,849 79,023 5.2% 0.9% 13.8% 35.1% 11.5% -28.6% -5.8%Transylvania….. 207,930 217,180 225,368 243,577 248,357 257,285 248,973 263,949 4.4% 3.8% 8.1% 2.0% 3.6% -3.2% 6.0%Tyrrell..........….. 20,336 18,710 19,284 21,383 17,693 19,205 18,584 17,550 -8.0% 3.1% 10.9% -17.3% 8.5% -3.2% -5.6%Union............…. 991,135 1,101,801 1,113,199 1,207,718 1,287,192 1,368,711 1,403,190 1,425,656 11.2% 1.0% 8.5% 6.6% 6.3% 2.5% 1.6%Vance...........….. 417,894 460,598 480,512 490,774 511,372 525,607 516,582 512,734 10.2% 4.3% 2.1% 4.2% 2.8% -1.7% -0.7%Wake............…. 8,440,787 9,669,936 10,318,840 11,535,942 11,613,684 12,546,177 12,017,561 12,401,836 14.6% 6.7% 11.8% 0.7% 8.0% -4.2% 3.2%Warren..........… 61,644 65,701 69,236 70,875 72,946 77,163 74,343 78,784 6.6% 5.4% 2.4% 2.9% 5.8% -3.7% 6.0%Washington.….. 92,045 92,795 89,600 86,387 86,217 92,537 96,534 93,043 0.8% -3.4% -3.6% -0.2% 7.3% 4.3% -3.6%Watauga.......…. 524,196 567,525 626,189 671,514 682,605 702,419 651,853 670,772 8.3% 10.3% 7.2% 1.7% 2.9% -7.2% 2.9%Wayne...........… 1,060,402 1,115,542 1,141,734 1,152,733 1,154,274 1,124,616 1,118,253 1,136,987 5.2% 2.3% 1.0% 0.1% -2.6% -0.6% 1.7%Wilkes..........…. 505,455 519,815 555,374 602,590 687,540 712,249 707,871 716,349 2.8% 6.8% 8.5% 14.1% 3.6% -0.6% 1.2%Wilson.........….. 843,964 903,786 952,802 974,088 1,011,119 1,018,014 987,394 1,061,728 7.1% 5.4% 2.2% 3.8% 0.7% -3.0% 7.5%Yadkin..........…. 172,545 200,617 216,190 211,539 208,769 206,623 211,815 224,267 16.3% 7.8% -2.2% -1.3% -1.0% 2.5% 5.9%Yancey ........….. 89,771 96,968 106,777 107,865 103,807 104,157 105,792 99,284 8.0% 10.1% 1.0% -3.8% 0.3% 1.6% -6.2%Unallocated…… 11,797,414 17,947,485 17,976,146 21,592,951 21,898,558 22,408,363 20,592,478 22,700,009 52.1% 0.2% 20.1% 1.4% 2.3% -8.1% 10.2%Statewide totals 97,352,867 112,057,953 116,762,211 126,253,339 128,493,660 132,176,353 127,256,302 132,682,106 15.1% 4.2% 8.1% 1.8% 2.9% -3.7% 4.3%
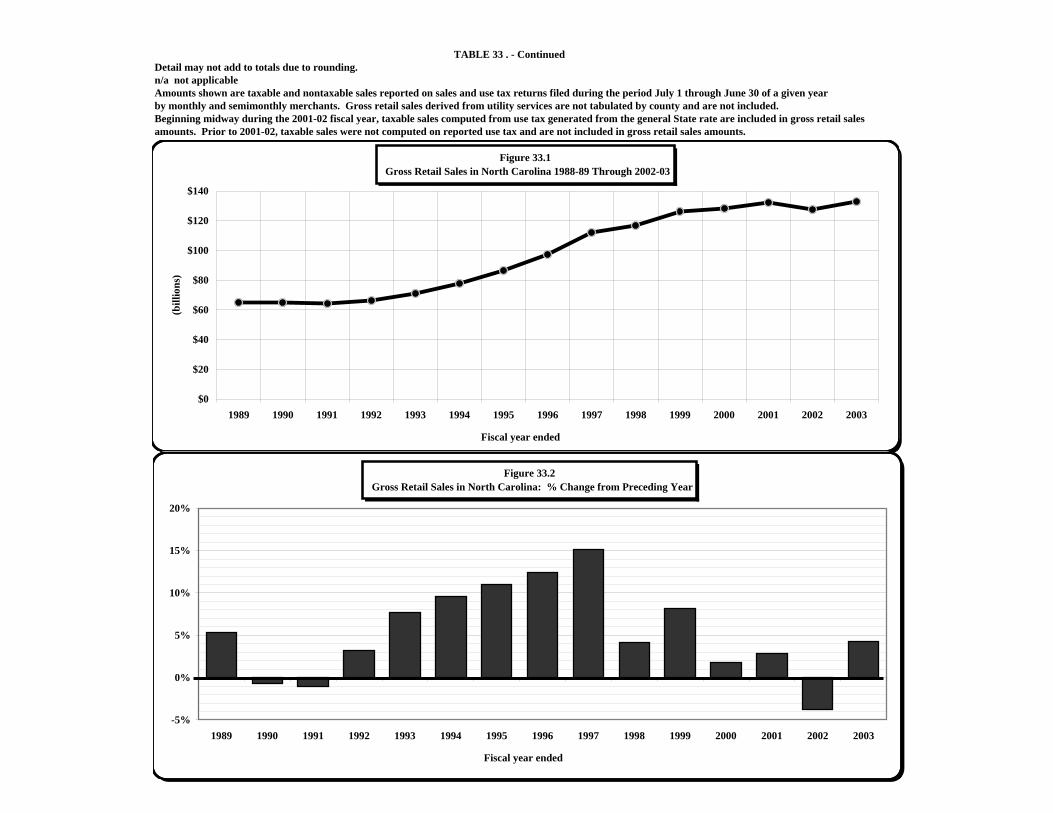
TABLE 33 . - ContinuedDetail may not add to totals due to rounding.n/a not applicableAmounts shown are taxable and nontaxable sales reported on sales and use tax returns filed during the period July 1 through June 30 of a given yearby monthly and semimonthly merchants. Gross retail sales derived from utility services are not tabulated by county and are not included.Beginning midway during the 2001-02 fiscal year, taxable sales computed from use tax generated from the general State rate are included in gross retail sales amounts. Prior to 2001-02, taxable sales were not computed on reported use tax and are not included in gross retail sales amounts.
1989 1990 1991 1992 1993 1994 1995 1996 1997 1998 1999 2000 2001 2002 2003######## ######## ######## ######## ######## ######## ######## ######## ######## ######## ######## ######## ######## ######## ########
1989 1990 1991 1992 1993 1994 1995 1996 1997 1998 1999 2000 2001 2002 20035.37% -0.67% -1.01% 3.25% 7.72% 9.55% 10.97% 12.43% 15.10% 4.20% 8.13% 1.77% 2.87% -3.72% 4.26%
Figure 33.1 Gross Retail Sales in North Carolina 1988-89 Through 2002-03
$0
$20
$40
$60
$80
$100
$120
$140
1989 1990 1991 1992 1993 1994 1995 1996 1997 1998 1999 2000 2001 2002 2003
Fiscal year ended
(bill
ions
)
Figure 33.2 Gross Retail Sales in North Carolina: % Change from Preceding Year
-5%
0%
5%
10%
15%
20%
1989 1990 1991 1992 1993 1994 1995 1996 1997 1998 1999 2000 2001 2002 2003
Fiscal year ended
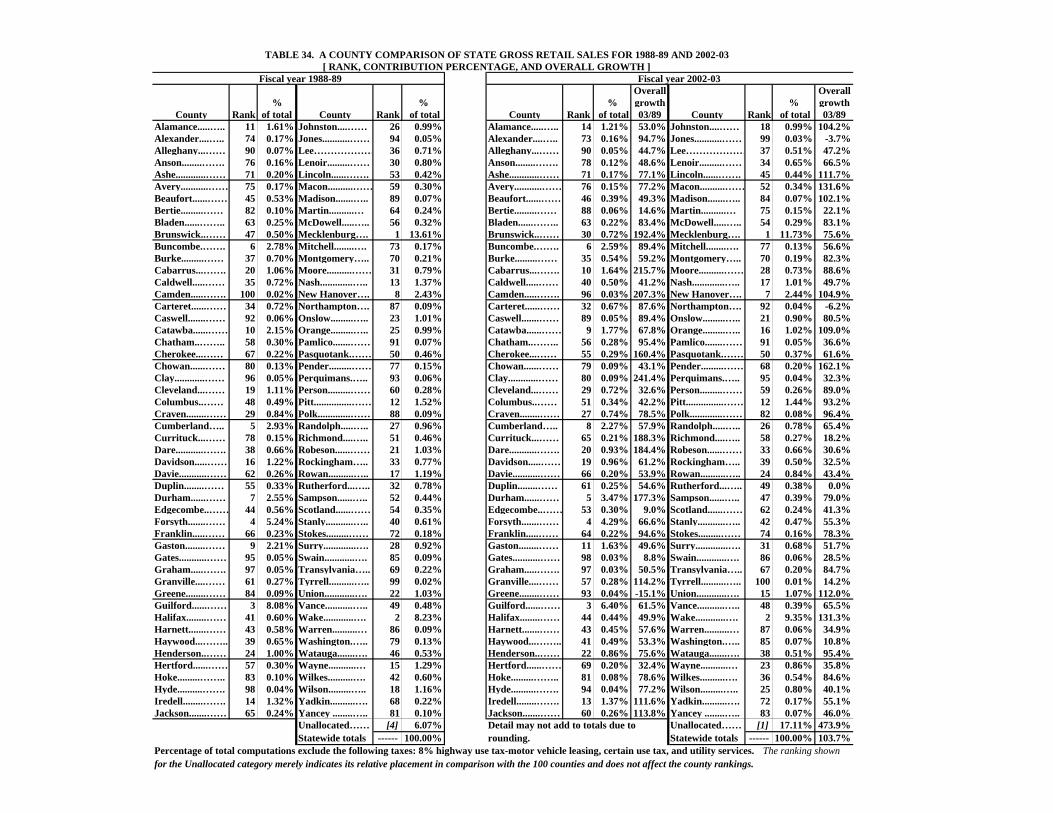
TABLE 34. A COUNTY COMPARISON OF STATE GROSS RETAIL SALES FOR 1988-89 AND 2002-03 [ RANK, CONTRIBUTION PERCENTAGE, AND OVERALL GROWTH ]
Fiscal year 1988-89 Fiscal year 2002-03Overall Overall
% % % growth % growthCounty Rank of total County Rank of total County Rank of total 03/89 County Rank of total 03/89
Alamance.....….. 11 1.61% Johnston....…… 26 0.99% Alamance.....….. 14 1.21% 53.0% Johnston....…… 18 0.99% 104.2%Alexander....….. 74 0.17% Jones...........…… 94 0.05% Alexander....….. 73 0.16% 94.7% Jones...........…… 99 0.03% -3.7%Alleghany...…… 90 0.07% Lee……………… 36 0.71% Alleghany...…… 90 0.05% 44.7% Lee……………… 37 0.51% 47.2%Anson........……. 76 0.16% Lenoir.........…… 30 0.80% Anson........……. 78 0.12% 48.6% Lenoir.........…… 34 0.65% 66.5%Ashe............…… 71 0.20% Lincoln......……. 53 0.42% Ashe............…… 71 0.17% 77.1% Lincoln......……. 45 0.44% 111.7%Avery...........…… 75 0.17% Macon..........…… 59 0.30% Avery...........…… 76 0.15% 77.2% Macon..........…… 52 0.34% 131.6%Beaufort......…… 45 0.53% Madison.......….. 89 0.07% Beaufort......…… 46 0.39% 49.3% Madison.......….. 84 0.07% 102.1%Bertie.........…… 82 0.10% Martin..........… 64 0.24% Bertie.........…… 88 0.06% 14.6% Martin..........… 75 0.15% 22.1%Bladen......…….. 63 0.25% McDowell.....….. 56 0.32% Bladen......…….. 63 0.22% 83.4% McDowell.....….. 54 0.29% 83.1%Brunswick..…… 47 0.50% Mecklenburg…. 1 13.61% Brunswick..…… 30 0.72% 192.4% Mecklenburg…. 1 11.73% 75.6%Buncombe.……. 6 2.78% Mitchell........…. 73 0.17% Buncombe.……. 6 2.59% 89.4% Mitchell........…. 77 0.13% 56.6%Burke.........…… 37 0.70% Montgomery….. 70 0.21% Burke.........…… 35 0.54% 59.2% Montgomery….. 70 0.19% 82.3%Cabarrus...……. 20 1.06% Moore..........…… 31 0.79% Cabarrus...……. 10 1.64% 215.7% Moore..........…… 28 0.73% 88.6%Caldwell.....…… 35 0.72% Nash.............….. 13 1.37% Caldwell.....…… 40 0.50% 41.2% Nash.............….. 17 1.01% 49.7%Camden.....……. 100 0.02% New Hanover…. 8 2.43% Camden.....……. 96 0.03% 207.3% New Hanover…. 7 2.44% 104.9%Carteret......…… 34 0.72% Northampton…. 87 0.09% Carteret......…… 32 0.67% 87.6% Northampton…. 92 0.04% -6.2%Caswell.......…… 92 0.06% Onslow.........….. 23 1.01% Caswell.......…… 89 0.05% 89.4% Onslow.........….. 21 0.90% 80.5%Catawba......…… 10 2.15% Orange.........….. 25 0.99% Catawba......…… 9 1.77% 67.8% Orange.........….. 16 1.02% 109.0%Chatham..…….. 58 0.30% Pamlico.......…… 91 0.07% Chatham..…….. 56 0.28% 95.4% Pamlico.......…… 91 0.05% 36.6%Cherokee...…… 67 0.22% Pasquotank.…… 50 0.46% Cherokee...…… 55 0.29% 160.4% Pasquotank.…… 50 0.37% 61.6%Chowan......…… 80 0.13% Pender.........…… 77 0.15% Chowan......…… 79 0.09% 43.1% Pender.........…… 68 0.20% 162.1%Clay............…… 96 0.05% Perquimans.….. 93 0.06% Clay............…… 80 0.09% 241.4% Perquimans.….. 95 0.04% 32.3%Cleveland...…… 19 1.11% Person.........…… 60 0.28% Cleveland...…… 29 0.72% 32.6% Person.........…… 59 0.26% 89.0%Columbus..…… 48 0.49% Pitt...............…… 12 1.52% Columbus..…… 51 0.34% 42.2% Pitt...............…… 12 1.44% 93.2%Craven........…… 29 0.84% Polk.............…… 88 0.09% Craven........…… 27 0.74% 78.5% Polk.............…… 82 0.08% 96.4%Cumberland….. 5 2.93% Randolph.....….. 27 0.96% Cumberland….. 8 2.27% 57.9% Randolph.....….. 26 0.78% 65.4%Currituck...…… 78 0.15% Richmond....….. 51 0.46% Currituck...…… 65 0.21% 188.3% Richmond....….. 58 0.27% 18.2%Dare...........……. 38 0.66% Robeson......…… 21 1.03% Dare...........……. 20 0.93% 184.4% Robeson......…… 33 0.66% 30.6%Davidson.....…… 16 1.22% Rockingham….. 33 0.77% Davidson.....…… 19 0.96% 61.2% Rockingham….. 39 0.50% 32.5%Davie...........…… 62 0.26% Rowan..........….. 17 1.19% Davie...........…… 66 0.20% 53.9% Rowan..........….. 24 0.84% 43.4%Duplin........…… 55 0.33% Rutherford...….. 32 0.78% Duplin........…… 61 0.25% 54.6% Rutherford...….. 49 0.38% 0.0%Durham......…… 7 2.55% Sampson......….. 52 0.44% Durham......…… 5 3.47% 177.3% Sampson......….. 47 0.39% 79.0%Edgecombe..…… 44 0.56% Scotland......…… 54 0.35% Edgecombe..…… 53 0.30% 9.0% Scotland......…… 62 0.24% 41.3%Forsyth.......…… 4 5.24% Stanly...........….. 40 0.61% Forsyth.......…… 4 4.29% 66.6% Stanly...........….. 42 0.47% 55.3%Franklin.....…… 66 0.23% Stokes.........…… 72 0.18% Franklin.....…… 64 0.22% 94.6% Stokes.........…… 74 0.16% 78.3%Gaston........…… 9 2.21% Surry.............…. 28 0.92% Gaston........…… 11 1.63% 49.6% Surry.............…. 31 0.68% 51.7%Gates...........…… 95 0.05% Swain............…. 85 0.09% Gates...........…… 98 0.03% 8.8% Swain............…. 86 0.06% 28.5%Graham.....……. 97 0.05% Transylvania….. 69 0.22% Graham.....……. 97 0.03% 50.5% Transylvania….. 67 0.20% 84.7%Granville....…… 61 0.27% Tyrrell..........….. 99 0.02% Granville....…… 57 0.28% 114.2% Tyrrell..........….. 100 0.01% 14.2%Greene........…… 84 0.09% Union............…. 22 1.03% Greene........…… 93 0.04% -15.1% Union............…. 15 1.07% 112.0%Guilford......…… 3 8.08% Vance...........….. 49 0.48% Guilford......…… 3 6.40% 61.5% Vance...........….. 48 0.39% 65.5%Halifax........…… 41 0.60% Wake............…. 2 8.23% Halifax........…… 44 0.44% 49.9% Wake............…. 2 9.35% 131.3%Harnett.......…… 43 0.58% Warren..........… 86 0.09% Harnett.......…… 43 0.45% 57.6% Warren..........… 87 0.06% 34.9%Haywood...…….. 39 0.65% Washington.….. 79 0.13% Haywood...…….. 41 0.49% 53.3% Washington.….. 85 0.07% 10.8%Henderson..…… 24 1.00% Watauga.......…. 46 0.53% Henderson..…… 22 0.86% 75.6% Watauga.......…. 38 0.51% 95.4%Hertford......…… 57 0.30% Wayne...........… 15 1.29% Hertford......…… 69 0.20% 32.4% Wayne...........… 23 0.86% 35.8%Hoke.........…….. 83 0.10% Wilkes..........…. 42 0.60% Hoke.........…….. 81 0.08% 78.6% Wilkes..........…. 36 0.54% 84.6%Hyde..........……. 98 0.04% Wilson.........….. 18 1.16% Hyde..........……. 94 0.04% 77.2% Wilson.........….. 25 0.80% 40.1%Iredell........……. 14 1.32% Yadkin..........…. 68 0.22% Iredell........……. 13 1.37% 111.6% Yadkin..........…. 72 0.17% 55.1%Jackson.......…… 65 0.24% Yancey ........….. 81 0.10% Jackson.......…… 60 0.26% 113.8% Yancey ........….. 83 0.07% 46.0%
Unallocated…… [4] 6.07% Detail may not add to totals due to Unallocated…… [1] 17.11% 473.9%Statewide totals ------ 100.00% rounding. Statewide totals ------ 100.00% 103.7%
Percentage of total computations exclude the following taxes: 8% highway use tax-motor vehicle leasing, certain use tax, and utility services. The ranking shown for the Unallocated category merely indicates its relative placement in comparison with the 100 counties and does not affect the county rankings.
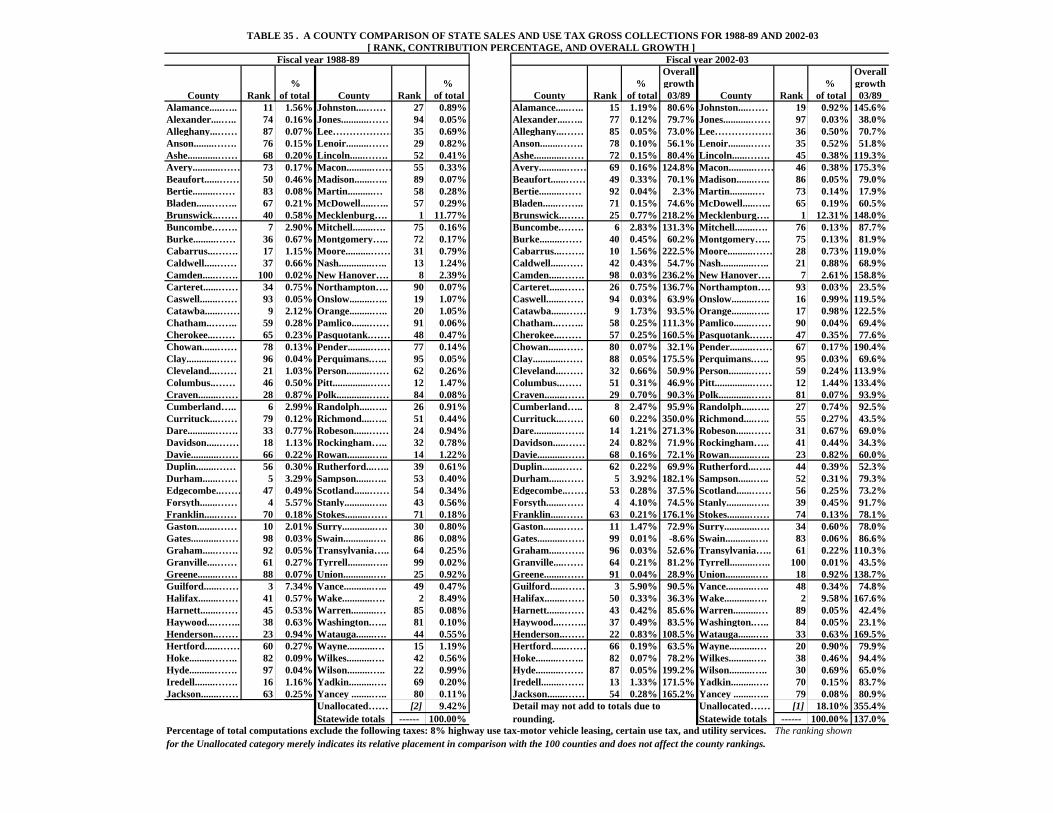
TABLE 35 . A COUNTY COMPARISON OF STATE SALES AND USE TAX GROSS COLLECTIONS FOR 1988-89 AND 2002-03 [ RANK, CONTRIBUTION PERCENTAGE, AND OVERALL GROWTH ]
Fiscal year 1988-89 Fiscal year 2002-03Overall Overall
% % % growth % growthCounty Rank of total County Rank of total County Rank of total 03/89 County Rank of total 03/89
Alamance.....….. 11 1.56% Johnston....…… 27 0.89% Alamance.....….. 15 1.19% 80.6% Johnston....…… 19 0.92% 145.6%Alexander....….. 74 0.16% Jones...........…… 94 0.05% Alexander....….. 77 0.12% 79.7% Jones...........…… 97 0.03% 38.0%Alleghany...…… 87 0.07% Lee……………… 35 0.69% Alleghany...…… 85 0.05% 73.0% Lee……………… 36 0.50% 70.7%Anson........……. 76 0.15% Lenoir.........…… 29 0.82% Anson........……. 78 0.10% 56.1% Lenoir.........…… 35 0.52% 51.8%Ashe............…… 68 0.20% Lincoln......……. 52 0.41% Ashe............…… 72 0.15% 80.4% Lincoln......……. 45 0.38% 119.3%Avery...........…… 73 0.17% Macon..........…… 55 0.33% Avery...........…… 69 0.16% 124.8% Macon..........…… 46 0.38% 175.3%Beaufort......…… 50 0.46% Madison.......….. 89 0.07% Beaufort......…… 49 0.33% 70.1% Madison.......….. 86 0.05% 79.0%Bertie.........…… 83 0.08% Martin..........… 58 0.28% Bertie.........…… 92 0.04% 2.3% Martin..........… 73 0.14% 17.9%Bladen......…….. 67 0.21% McDowell.....….. 57 0.29% Bladen......…….. 71 0.15% 74.6% McDowell.....….. 65 0.19% 60.5%Brunswick..…… 40 0.58% Mecklenburg…. 1 11.77% Brunswick..…… 25 0.77% 218.2% Mecklenburg…. 1 12.31% 148.0%Buncombe.……. 7 2.90% Mitchell........…. 75 0.16% Buncombe.……. 6 2.83% 131.3% Mitchell........…. 76 0.13% 87.7%Burke.........…… 36 0.67% Montgomery….. 72 0.17% Burke.........…… 40 0.45% 60.2% Montgomery….. 75 0.13% 81.9%Cabarrus...……. 17 1.15% Moore..........…… 31 0.79% Cabarrus...……. 10 1.56% 222.5% Moore..........…… 28 0.73% 119.0%Caldwell.....…… 37 0.66% Nash.............….. 13 1.24% Caldwell.....…… 42 0.43% 54.7% Nash.............….. 21 0.88% 68.9%Camden.....……. 100 0.02% New Hanover…. 8 2.39% Camden.....……. 98 0.03% 236.2% New Hanover…. 7 2.61% 158.8%Carteret......…… 34 0.75% Northampton…. 90 0.07% Carteret......…… 26 0.75% 136.7% Northampton…. 93 0.03% 23.5%Caswell.......…… 93 0.05% Onslow.........….. 19 1.07% Caswell.......…… 94 0.03% 63.9% Onslow.........….. 16 0.99% 119.5%Catawba......…… 9 2.12% Orange.........….. 20 1.05% Catawba......…… 9 1.73% 93.5% Orange.........….. 17 0.98% 122.5%Chatham..…….. 59 0.28% Pamlico.......…… 91 0.06% Chatham..…….. 58 0.25% 111.3% Pamlico.......…… 90 0.04% 69.4%Cherokee...…… 65 0.23% Pasquotank.…… 48 0.47% Cherokee...…… 57 0.25% 160.5% Pasquotank.…… 47 0.35% 77.6%Chowan......…… 78 0.13% Pender.........…… 77 0.14% Chowan......…… 80 0.07% 32.1% Pender.........…… 67 0.17% 190.4%Clay............…… 96 0.04% Perquimans.….. 95 0.05% Clay............…… 88 0.05% 175.5% Perquimans.….. 95 0.03% 69.6%Cleveland...…… 21 1.03% Person.........…… 62 0.26% Cleveland...…… 32 0.66% 50.9% Person.........…… 59 0.24% 113.9%Columbus..…… 46 0.50% Pitt...............…… 12 1.47% Columbus..…… 51 0.31% 46.9% Pitt...............…… 12 1.44% 133.4%Craven........…… 28 0.87% Polk.............…… 84 0.08% Craven........…… 29 0.70% 90.3% Polk.............…… 81 0.07% 93.9%Cumberland….. 6 2.99% Randolph.....….. 26 0.91% Cumberland….. 8 2.47% 95.9% Randolph.....….. 27 0.74% 92.5%Currituck...…… 79 0.12% Richmond....….. 51 0.44% Currituck...…… 60 0.22% 350.0% Richmond....….. 55 0.27% 43.5%Dare...........……. 33 0.77% Robeson......…… 24 0.94% Dare...........……. 14 1.21% 271.3% Robeson......…… 31 0.67% 69.0%Davidson.....…… 18 1.13% Rockingham….. 32 0.78% Davidson.....…… 24 0.82% 71.9% Rockingham….. 41 0.44% 34.3%Davie...........…… 66 0.22% Rowan..........….. 14 1.22% Davie...........…… 68 0.16% 72.1% Rowan..........….. 23 0.82% 60.0%Duplin........…… 56 0.30% Rutherford...….. 39 0.61% Duplin........…… 62 0.22% 69.9% Rutherford...….. 44 0.39% 52.3%Durham......…… 5 3.29% Sampson......….. 53 0.40% Durham......…… 5 3.92% 182.1% Sampson......….. 52 0.31% 79.3%Edgecombe..…… 47 0.49% Scotland......…… 54 0.34% Edgecombe..…… 53 0.28% 37.5% Scotland......…… 56 0.25% 73.2%Forsyth.......…… 4 5.57% Stanly...........….. 43 0.56% Forsyth.......…… 4 4.10% 74.5% Stanly...........….. 39 0.45% 91.7%Franklin.....…… 70 0.18% Stokes.........…… 71 0.18% Franklin.....…… 63 0.21% 176.1% Stokes.........…… 74 0.13% 78.1%Gaston........…… 10 2.01% Surry.............…. 30 0.80% Gaston........…… 11 1.47% 72.9% Surry.............…. 34 0.60% 78.0%Gates...........…… 98 0.03% Swain............…. 86 0.08% Gates...........…… 99 0.01% -8.6% Swain............…. 83 0.06% 86.6%Graham.....……. 92 0.05% Transylvania….. 64 0.25% Graham.....……. 96 0.03% 52.6% Transylvania….. 61 0.22% 110.3%Granville....…… 61 0.27% Tyrrell..........….. 99 0.02% Granville....…… 64 0.21% 81.2% Tyrrell..........….. 100 0.01% 43.5%Greene........…… 88 0.07% Union............…. 25 0.92% Greene........…… 91 0.04% 28.9% Union............…. 18 0.92% 138.7%Guilford......…… 3 7.34% Vance...........….. 49 0.47% Guilford......…… 3 5.90% 90.5% Vance...........….. 48 0.34% 74.8%Halifax........…… 41 0.57% Wake............…. 2 8.49% Halifax........…… 50 0.33% 36.3% Wake............…. 2 9.58% 167.6%Harnett.......…… 45 0.53% Warren..........… 85 0.08% Harnett.......…… 43 0.42% 85.6% Warren..........… 89 0.05% 42.4%Haywood...…….. 38 0.63% Washington.….. 81 0.10% Haywood...…….. 37 0.49% 83.5% Washington.….. 84 0.05% 23.1%Henderson..…… 23 0.94% Watauga.......…. 44 0.55% Henderson..…… 22 0.83% 108.5% Watauga.......…. 33 0.63% 169.5%Hertford......…… 60 0.27% Wayne...........… 15 1.19% Hertford......…… 66 0.19% 63.5% Wayne...........… 20 0.90% 79.9%Hoke.........…….. 82 0.09% Wilkes..........…. 42 0.56% Hoke.........…….. 82 0.07% 78.2% Wilkes..........…. 38 0.46% 94.4%Hyde..........……. 97 0.04% Wilson.........….. 22 0.99% Hyde..........……. 87 0.05% 199.2% Wilson.........….. 30 0.69% 65.0%Iredell........……. 16 1.16% Yadkin..........…. 69 0.20% Iredell........……. 13 1.33% 171.5% Yadkin..........…. 70 0.15% 83.7%Jackson.......…… 63 0.25% Yancey ........….. 80 0.11% Jackson.......…… 54 0.28% 165.2% Yancey ........….. 79 0.08% 80.9%
Unallocated…… [2] 9.42% Detail may not add to totals due to Unallocated…… [1] 18.10% 355.4%Statewide totals ------ 100.00% rounding. Statewide totals ------ 100.00% 137.0%
Percentage of total computations exclude the following taxes: 8% highway use tax-motor vehicle leasing, certain use tax, and utility services. The ranking shown for the Unallocated category merely indicates its relative placement in comparison with the 100 counties and does not affect the county rankings.
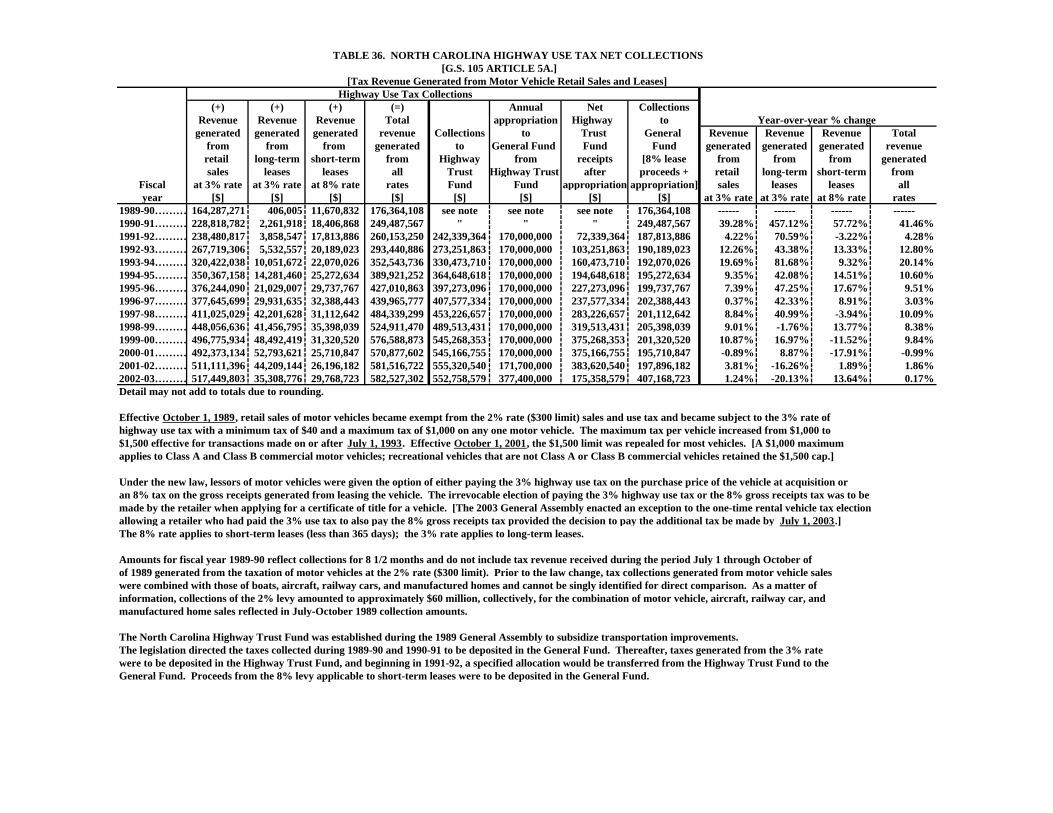
TABLE 36. NORTH CAROLINA HIGHWAY USE TAX NET COLLECTIONS [G.S. 105 ARTICLE 5A.]
[Tax Revenue Generated from Motor Vehicle Retail Sales and Leases] Highway Use Tax Collections
(+) (+) (+) (=) Annual Net CollectionsRevenue Revenue Revenue Total appropriation Highway to Year-over-year % change
generated generated generated revenue Collections to Trust General Revenue Revenue Revenue Totalfrom from from generated to General Fund Fund Fund generated generated generated revenueretail long-term short-term from Highway from receipts [8% lease from from from generatedsales leases leases all Trust Highway Trust after proceeds + retail long-term short-term from
Fiscal at 3% rate at 3% rate at 8% rate rates Fund Fund appropriation appropriation] sales leases leases allyear [$] [$] [$] [$] [$] [$] [$] [$] at 3% rate at 3% rate at 8% rate rates
1989-90……… 164,287,271 406,005 11,670,832 176,364,108 see note see note see note 176,364,108 ------ ------ ------ ------1990-91……… 228,818,782 2,261,918 18,406,868 249,487,567 " " " 249,487,567 39.28% 457.12% 57.72% 41.46%1991-92……… 238,480,817 3,858,547 17,813,886 260,153,250 242,339,364 170,000,000 72,339,364 187,813,886 4.22% 70.59% -3.22% 4.28%1992-93……… 267,719,306 5,532,557 20,189,023 293,440,886 273,251,863 170,000,000 103,251,863 190,189,023 12.26% 43.38% 13.33% 12.80%1993-94……… 320,422,038 10,051,672 22,070,026 352,543,736 330,473,710 170,000,000 160,473,710 192,070,026 19.69% 81.68% 9.32% 20.14%1994-95……… 350,367,158 14,281,460 25,272,634 389,921,252 364,648,618 170,000,000 194,648,618 195,272,634 9.35% 42.08% 14.51% 10.60%1995-96……… 376,244,090 21,029,007 29,737,767 427,010,863 397,273,096 170,000,000 227,273,096 199,737,767 7.39% 47.25% 17.67% 9.51%1996-97……… 377,645,699 29,931,635 32,388,443 439,965,777 407,577,334 170,000,000 237,577,334 202,388,443 0.37% 42.33% 8.91% 3.03%1997-98……… 411,025,029 42,201,628 31,112,642 484,339,299 453,226,657 170,000,000 283,226,657 201,112,642 8.84% 40.99% -3.94% 10.09%1998-99……… 448,056,636 41,456,795 35,398,039 524,911,470 489,513,431 170,000,000 319,513,431 205,398,039 9.01% -1.76% 13.77% 8.38%1999-00……… 496,775,934 48,492,419 31,320,520 576,588,873 545,268,353 170,000,000 375,268,353 201,320,520 10.87% 16.97% -11.52% 9.84%2000-01……… 492,373,134 52,793,621 25,710,847 570,877,602 545,166,755 170,000,000 375,166,755 195,710,847 -0.89% 8.87% -17.91% -0.99%2001-02……… 511,111,396 44,209,144 26,196,182 581,516,722 555,320,540 171,700,000 383,620,540 197,896,182 3.81% -16.26% 1.89% 1.86%2002-03……… 517,449,803 35,308,776 29,768,723 582,527,302 552,758,579 377,400,000 175,358,579 407,168,723 1.24% -20.13% 13.64% 0.17%Detail may not add to totals due to rounding.
Effective October 1, 1989, retail sales of motor vehicles became exempt from the 2% rate ($300 limit) sales and use tax and became subject to the 3% rate ofhighway use tax with a minimum tax of $40 and a maximum tax of $1,000 on any one motor vehicle. The maximum tax per vehicle increased from $1,000 to$1,500 effective for transactions made on or after July 1, 1993. Effective October 1, 2001, the $1,500 limit was repealed for most vehicles. [A $1,000 maximumapplies to Class A and Class B commercial motor vehicles; recreational vehicles that are not Class A or Class B commercial vehicles retained the $1,500 cap.]
Under the new law, lessors of motor vehicles were given the option of either paying the 3% highway use tax on the purchase price of the vehicle at acquisition or an 8% tax on the gross receipts generated from leasing the vehicle. The irrevocable election of paying the 3% highway use tax or the 8% gross receipts tax was to bemade by the retailer when applying for a certificate of title for a vehicle. [The 2003 General Assembly enacted an exception to the one-time rental vehicle tax electionallowing a retailer who had paid the 3% use tax to also pay the 8% gross receipts tax provided the decision to pay the additional tax be made by July 1, 2003.]The 8% rate applies to short-term leases (less than 365 days); the 3% rate applies to long-term leases.
Amounts for fiscal year 1989-90 reflect collections for 8 1/2 months and do not include tax revenue received during the period July 1 through October of of 1989 generated from the taxation of motor vehicles at the 2% rate ($300 limit). Prior to the law change, tax collections generated from motor vehicle saleswere combined with those of boats, aircraft, railway cars, and manufactured homes and cannot be singly identified for direct comparison. As a matter of information, collections of the 2% levy amounted to approximately $60 million, collectively, for the combination of motor vehicle, aircraft, railway car, andmanufactured home sales reflected in July-October 1989 collection amounts.
The North Carolina Highway Trust Fund was established during the 1989 General Assembly to subsidize transportation improvements.The legislation directed the taxes collected during 1989-90 and 1990-91 to be deposited in the General Fund. Thereafter, taxes generated from the 3% ratewere to be deposited in the Highway Trust Fund, and beginning in 1991-92, a specified allocation would be transferred from the Highway Trust Fund to theGeneral Fund. Proceeds from the 8% levy applicable to short-term leases were to be deposited in the General Fund.
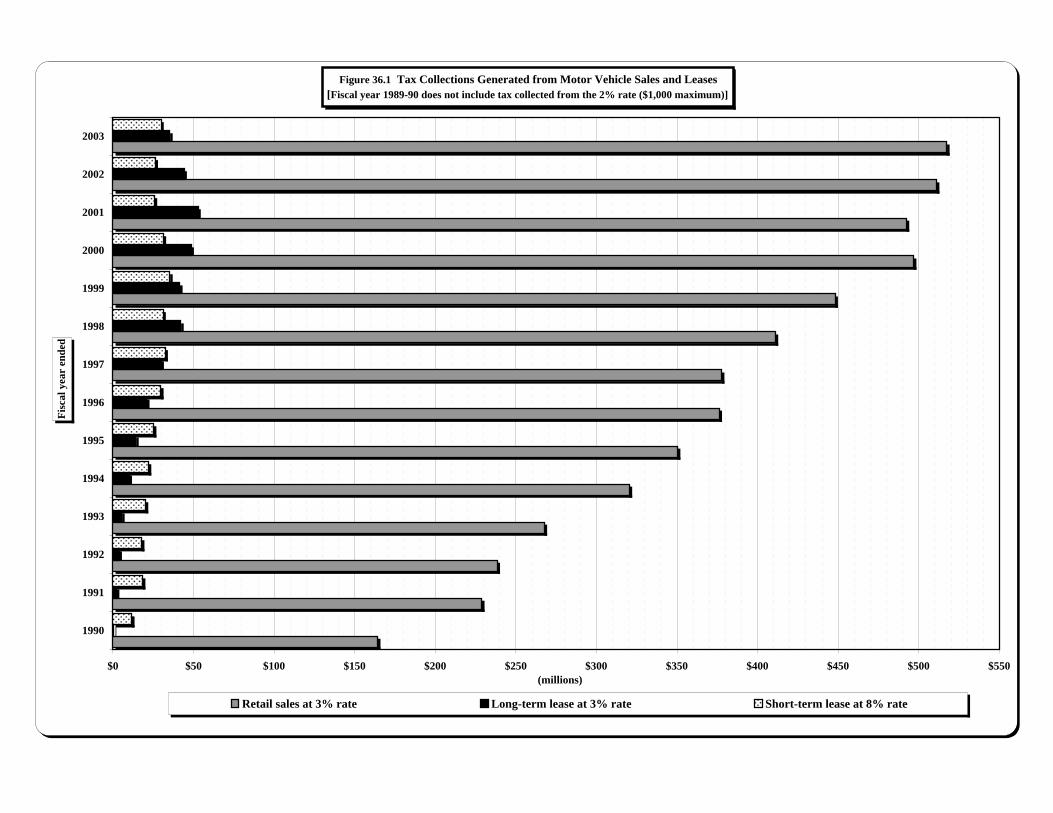
Retail sales at 3%Long-term leas Short-term lease at 8% rate1990 164,287,271 406,005 11,670,8321991 228,818,782 2,261,918 18,406,8681992 238,480,817 3,858,547 17,813,8861993 267,719,306 5,532,557 20,189,0231994 320,422,038 10,051,672 22,070,0261995 350,367,158 14,281,460 25,272,6341996 376,244,090 21,029,007 29,737,7671997 377,645,699 29,931,635 32,388,4431998 411,025,029 42,201,628 31,112,6421999 448,056,636 41,456,795 35,398,0392000 496,775,934 48,492,419 31,320,5202001 492,373,134 52,793,621 25,710,8472002 511,111,396 44,209,144 26,196,1822003 517,449,803 35,308,776 29,768,723
Figure 36.1 Tax Collections Generated from Motor Vehicle Sales and Leases [Fiscal year 1989-90 does not include tax collected from the 2% rate ($1,000 maximum)]
$0 $50 $100 $150 $200 $250 $300 $350 $400 $450 $500 $550
1990
1991
1992
1993
1994
1995
1996
1997
1998
1999
2000
2001
2002
2003
(millions)
Fisc
al y
ear
ende
d
Retail sales at 3% rate Long-term lease at 3% rate Short-term lease at 8% rate
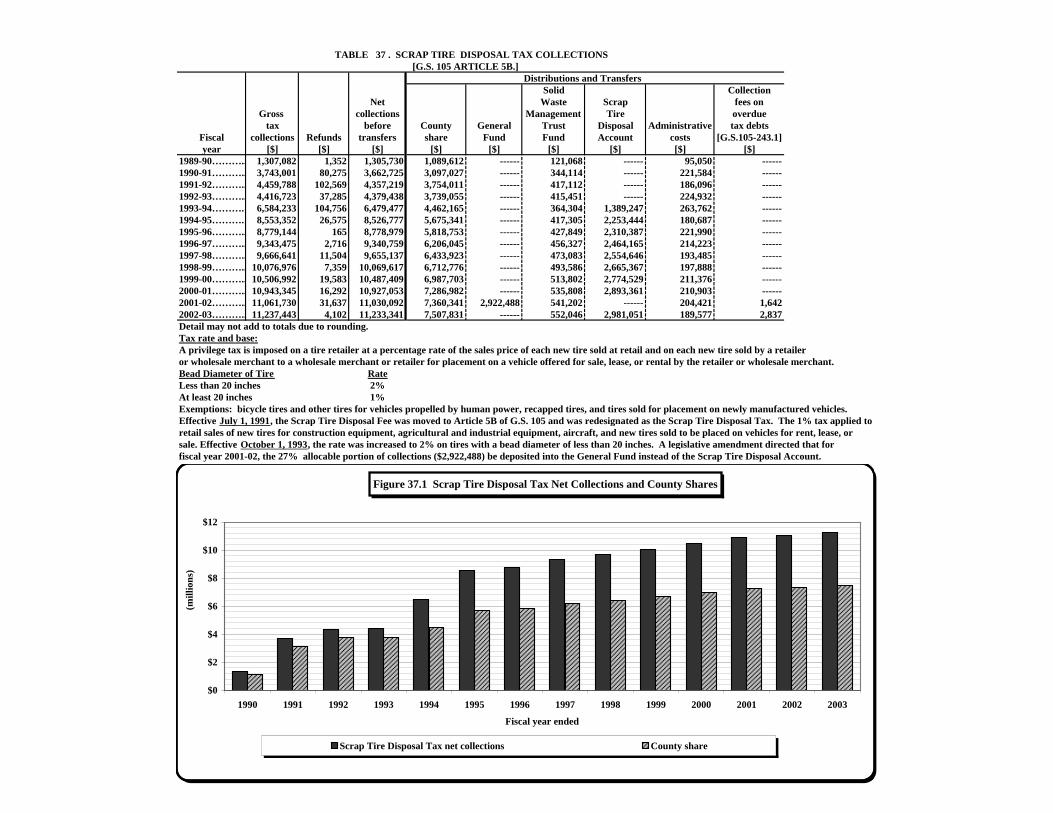
TABLE 37 . SCRAP TIRE DISPOSAL TAX COLLECTIONS [G.S. 105 ARTICLE 5B.] Distributions and Transfers
Solid CollectionNet Waste Scrap fees on
Gross collections Management Tire overduetax before County General Trust Disposal Administrative tax debts
Fiscal collections Refunds transfers share Fund Fund Account costs [G.S.105-243.1]year [$] [$] [$] [$] [$] [$] [$] [$] [$]
1989-90……….. 1,307,082 1,352 1,305,730 1,089,612 ------ 121,068 ------ 95,050 ------1990-91……….. 3,743,001 80,275 3,662,725 3,097,027 ------ 344,114 ------ 221,584 ------1991-92……….. 4,459,788 102,569 4,357,219 3,754,011 ------ 417,112 ------ 186,096 ------1992-93……….. 4,416,723 37,285 4,379,438 3,739,055 ------ 415,451 ------ 224,932 ------1993-94………. 6,584,233 104,756 6,479,477 4,462,165 ------ 364,304 1,389,247 263,762 ------1994-95………. 8,553,352 26,575 8,526,777 5,675,341 ------ 417,305 2,253,444 180,687 ------1995-96……….. 8,779,144 165 8,778,979 5,818,753 ------ 427,849 2,310,387 221,990 ------1996-97……….. 9,343,475 2,716 9,340,759 6,206,045 ------ 456,327 2,464,165 214,223 ------1997-98……….. 9,666,641 11,504 9,655,137 6,433,923 ------ 473,083 2,554,646 193,485 ------1998-99……….. 10,076,976 7,359 10,069,617 6,712,776 ------ 493,586 2,665,367 197,888 ------1999-00……….. 10,506,992 19,583 10,487,409 6,987,703 ------ 513,802 2,774,529 211,376 ------2000-01……….. 10,943,345 16,292 10,927,053 7,286,982 ------ 535,808 2,893,361 210,903 ------2001-02……….. 11,061,730 31,637 11,030,092 7,360,341 2,922,488 541,202 ------ 204,421 1,6422002-03……….. 11,237,443 4,102 11,233,341 7,507,831 ------ 552,046 2,981,051 189,577 2,837Detail may not add to totals due to rounding.Tax rate and base:A privilege tax is imposed on a tire retailer at a percentage rate of the sales price of each new tire sold at retail and on each new tire sold by a retailer or wholesale merchant to a wholesale merchant or retailer for placement on a vehicle offered for sale, lease, or rental by the retailer or wholesale merchant. Bead Diameter of Tire RateLess than 20 inches 2%At least 20 inches 1%Exemptions: bicycle tires and other tires for vehicles propelled by human power, recapped tires, and tires sold for placement on newly manufactured vehicles.Effective July 1, 1991, the Scrap Tire Disposal Fee was moved to Article 5B of G.S. 105 and was redesignated as the Scrap Tire Disposal Tax. The 1% tax applied to retail sales of new tires for construction equipment, agricultural and industrial equipment, aircraft, and new tires sold to be placed on vehicles for rent, lease, or sale. Effective October 1, 1993, the rate was increased to 2% on tires with a bead diameter of less than 20 inches. A legislative amendment directed that for fiscal year 2001-02, the 27% allocable portion of collections ($2,922,488) be deposited into the General Fund instead of the Scrap Tire Disposal Account.
Scrap Tire D County share 1990 1,305,730 1,089,612
1991 3,662,725 3,097,0271992 4,357,219 3,754,0111993 4,379,438 3,739,0551994 6,479,477 4,462,1651995 8,526,777 5,675,3411996 8,778,979 5,818,7531997 9,340,759 6,206,0451998 9,655,137 6,433,9231999 10,069,617 6,712,7762000 10,487,409 6,987,7032001 10,927,053 7,286,9822002 11,030,092 7,360,3412003 11,233,341 7,507,831
Figure 37.1 Scrap Tire Disposal Tax Net Collections and County Shares
$0
$2
$4
$6
$8
$10
$12
1990 1991 1992 1993 1994 1995 1996 1997 1998 1999 2000 2001 2002 2003
(mill
ions
)
Fiscal year ended
Scrap Tire Disposal Tax net collections County share
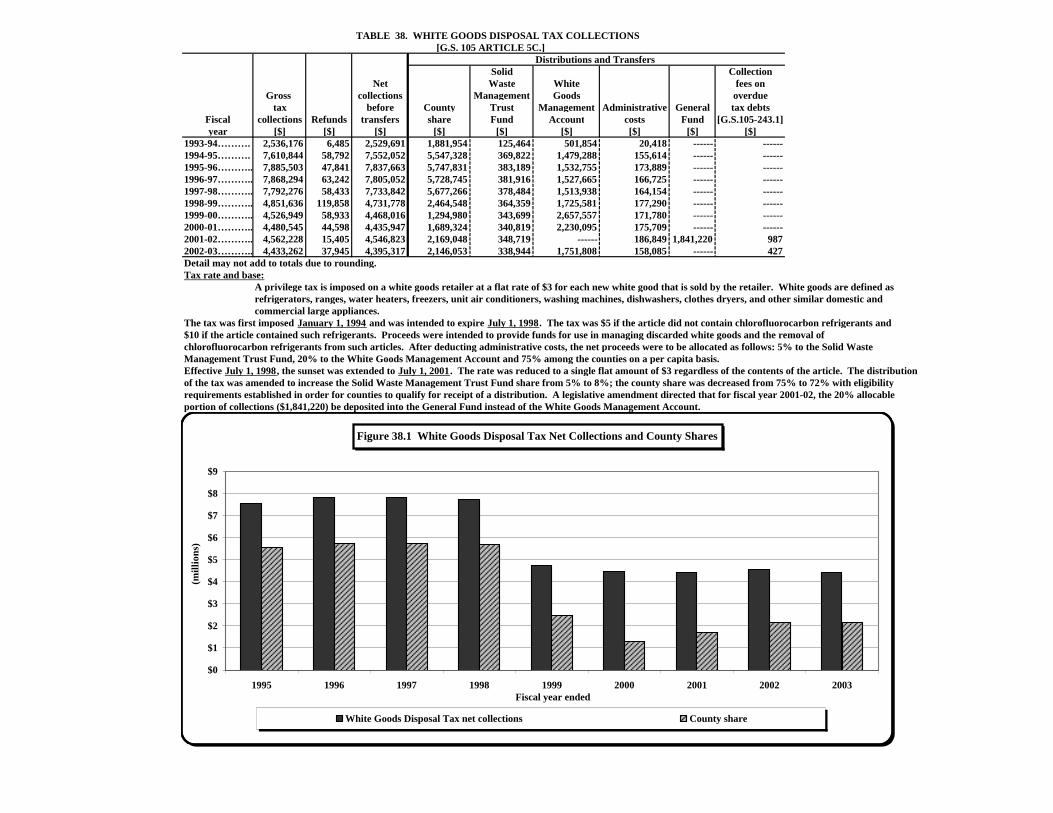
TABLE 38. WHITE GOODS DISPOSAL TAX COLLECTIONS [G.S. 105 ARTICLE 5C.]
Distributions and TransfersSolid Collection
Net Waste White fees onGross collections Management Goods overdue
tax before County Trust Management Administrative General tax debtsFiscal collections Refunds transfers share Fund Account costs Fund [G.S.105-243.1]year [$] [$] [$] [$] [$] [$] [$] [$] [$]
1993-94………. 2,536,176 6,485 2,529,691 1,881,954 125,464 501,854 20,418 ------ ------1994-95………. 7,610,844 58,792 7,552,052 5,547,328 369,822 1,479,288 155,614 ------ ------1995-96……….. 7,885,503 47,841 7,837,663 5,747,831 383,189 1,532,755 173,889 ------ ------1996-97……….. 7,868,294 63,242 7,805,052 5,728,745 381,916 1,527,665 166,725 ------ ------1997-98……….. 7,792,276 58,433 7,733,842 5,677,266 378,484 1,513,938 164,154 ------ ------1998-99……….. 4,851,636 119,858 4,731,778 2,464,548 364,359 1,725,581 177,290 ------ ------1999-00……….. 4,526,949 58,933 4,468,016 1,294,980 343,699 2,657,557 171,780 ------ ------2000-01……….. 4,480,545 44,598 4,435,947 1,689,324 340,819 2,230,095 175,709 ------ ------2001-02……….. 4,562,228 15,405 4,546,823 2,169,048 348,719 ------ 186,849 1,841,220 9872002-03……….. 4,433,262 37,945 4,395,317 2,146,053 338,944 1,751,808 158,085 ------ 427Detail may not add to totals due to rounding.Tax rate and base:
A privilege tax is imposed on a white goods retailer at a flat rate of $3 for each new white good that is sold by the retailer. White goods are defined asrefrigerators, ranges, water heaters, freezers, unit air conditioners, washing machines, dishwashers, clothes dryers, and other similar domestic andcommercial large appliances.
The tax was first imposed January 1, 1994 and was intended to expire July 1, 1998. The tax was $5 if the article did not contain chlorofluorocarbon refrigerants and $10 if the article contained such refrigerants. Proceeds were intended to provide funds for use in managing discarded white goods and the removal of chlorofluorocarbon refrigerants from such articles. After deducting administrative costs, the net proceeds were to be allocated as follows: 5% to the Solid WasteManagement Trust Fund, 20% to the White Goods Management Account and 75% among the counties on a per capita basis. Effective July 1, 1998, the sunset was extended to July 1, 2001. The rate was reduced to a single flat amount of $3 regardless of the contents of the article. The distribution of the tax was amended to increase the Solid Waste Management Trust Fund share from 5% to 8%; the county share was decreased from 75% to 72% with eligibilityrequirements established in order for counties to qualify for receipt of a distribution. A legislative amendment directed that for fiscal year 2001-02, the 20% allocable portion of collections ($1,841,220) be deposited into the General Fund instead of the White Goods Management Account.
White GooCounty share1995 7,552,052 5,547,3281996 7,837,663 5,747,8311997 7,805,052 5,728,7451998 7,733,842 5,677,2661999 4,731,778 2,464,5482000 4,468,016 1,294,9802001 4,435,947 1,689,3242002 4,546,823 2,169,0482003 4,395,317 2,146,053
Figure 38.1 White Goods Disposal Tax Net Collections and County Shares
$0
$1
$2
$3
$4
$5
$6
$7
$8
$9
1995 1996 1997 1998 1999 2000 2001 2002 2003
(mill
ions
)
Fiscal year ended
White Goods Disposal Tax net collections County share
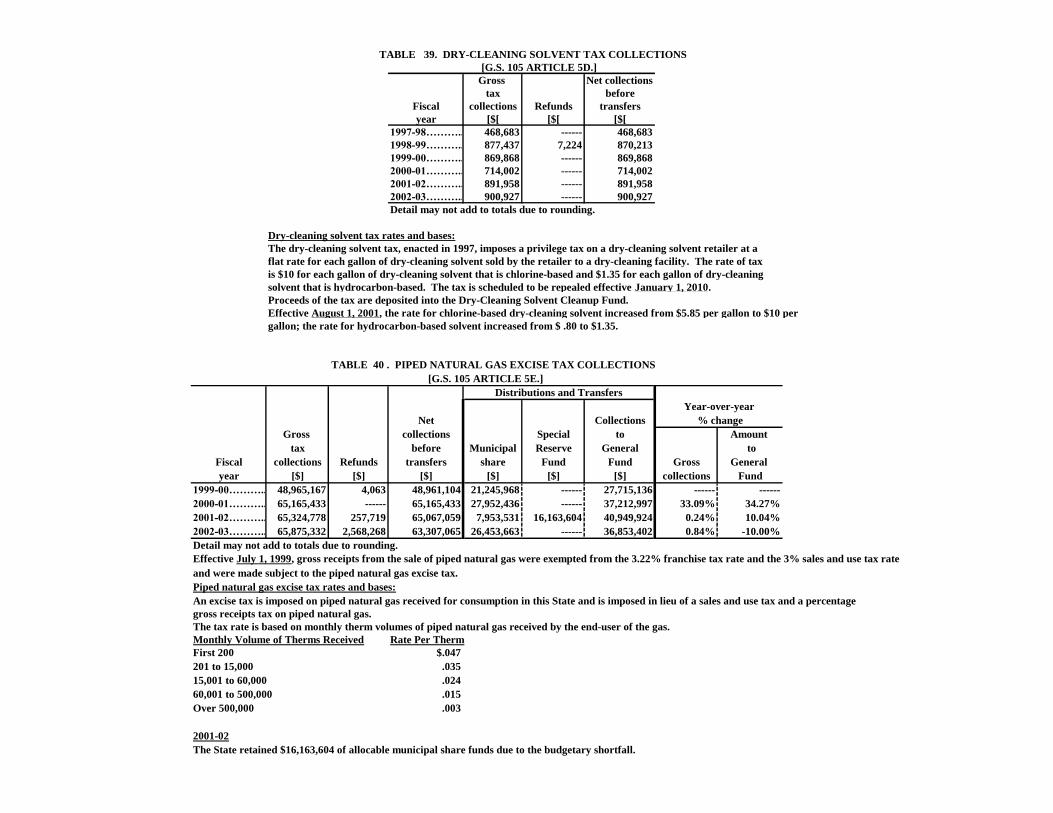
TABLE 39. DRY-CLEANING SOLVENT TAX COLLECTIONS
[G.S. 105 ARTICLE 5D.]
Gross Net collections
tax before
Fiscal collections Refunds transfers
year [$[ [$[ [$[
1997-98……….. 468,683 ------ 468,683
1998-99……….. 877,437 7,224 870,213
1999-00……….. 869,868 ------ 869,868
2000-01……….. 714,002 ------ 714,002
2001-02……….. 891,958 ------ 891,958
2002-03……….. 900,927 ------ 900,927
Detail may not add to totals due to rounding.
Dry-cleaning solvent tax rates and bases:
The dry-cleaning solvent tax, enacted in 1997, imposes a privilege tax on a dry-cleaning solvent retailer at a
flat rate for each gallon of dry-cleaning solvent sold by the retailer to a dry-cleaning facility. The rate of tax
is $10 for each gallon of dry-cleaning solvent that is chlorine-based and $1.35 for each gallon of dry-cleaning
solvent that is hydrocarbon-based. The tax is scheduled to be repealed effective January 1, 2010.
Proceeds of the tax are deposited into the Dry-Cleaning Solvent Cleanup Fund.
Effective August 1, 2001, the rate for chlorine-based dry-cleaning solvent increased from $5.85 per gallon to $10 per
gallon; the rate for hydrocarbon-based solvent increased from $ .80 to $1.35.
TABLE 40 . PIPED NATURAL GAS EXCISE TAX COLLECTIONS
[G.S. 105 ARTICLE 5E.]
Distributions and Transfers
Year-over-year
Net Collections % change
Gross collections Special to Amount
tax before Municipal Reserve General to
Fiscal collections Refunds transfers share Fund Fund Gross General
year [$] [$] [$] [$] [$] [$] collections Fund
1999-00……….. 48,965,167 4,063 48,961,104 21,245,968 ------ 27,715,136 ------ ------
2000-01……….. 65,165,433 ------ 65,165,433 27,952,436 ------ 37,212,997 33.09% 34.27%
2001-02……….. 65,324,778 257,719 65,067,059 7,953,531 16,163,604 40,949,924 0.24% 10.04%
2002-03……….. 65,875,332 2,568,268 63,307,065 26,453,663 ------ 36,853,402 0.84% -10.00%
Detail may not add to totals due to rounding.
Effective July 1, 1999, gross receipts from the sale of piped natural gas were exempted from the 3.22% franchise tax rate and the 3% sales and use tax rate
and were made subject to the piped natural gas excise tax.
Piped natural gas excise tax rates and bases:
An excise tax is imposed on piped natural gas received for consumption in this State and is imposed in lieu of a sales and use tax and a percentage
gross receipts tax on piped natural gas.
The tax rate is based on monthly therm volumes of piped natural gas received by the end-user of the gas.
Monthly Volume of Therms Received Rate Per Therm
First 200 $.047
201 to 15,000 .035
15,001 to 60,000 .024
60,001 to 500,000 .015
Over 500,000 .003
2001-02
The State retained $16,163,604 of allocable municipal share funds due to the budgetary shortfall.
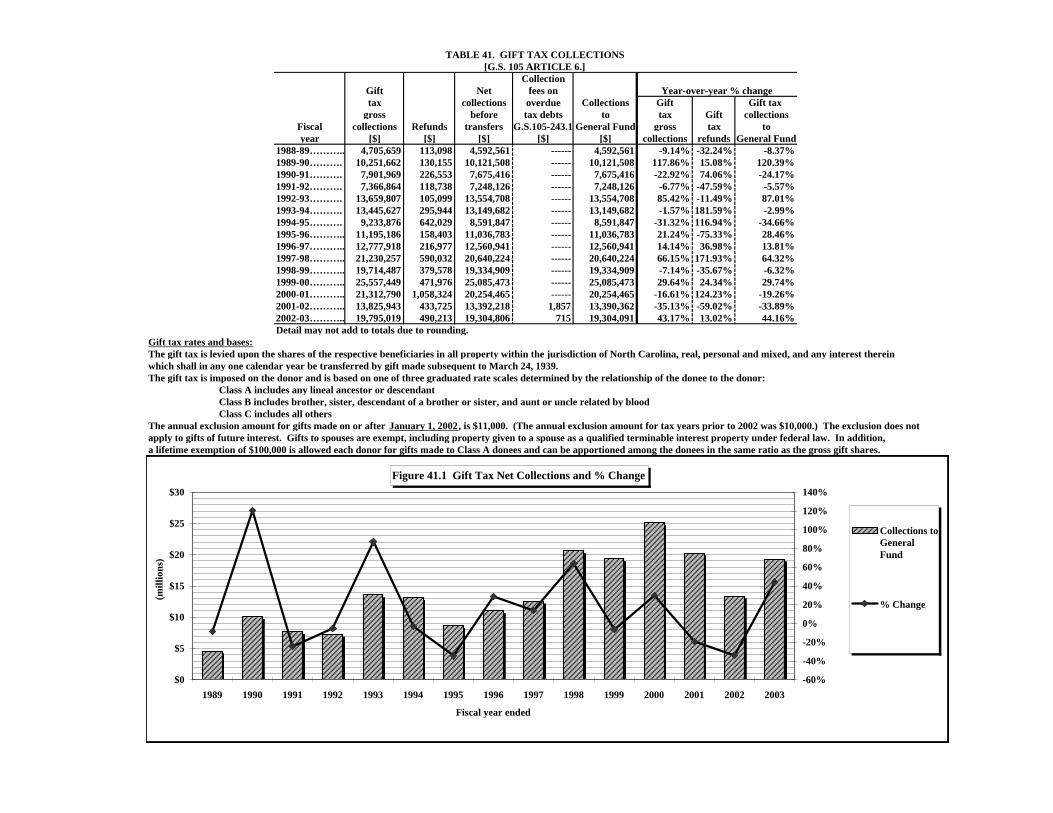
TABLE 41. GIFT TAX COLLECTIONS [G.S. 105 ARTICLE 6.]
CollectionGift Net fees on Year-over-year % changetax collections overdue Collections Gift Gift tax
gross before tax debts to tax Gift collectionsFiscal collections Refunds transfers G.S.105-243.1 General Fund gross tax toyear [$] [$] [$] [$] [$] collections refunds General Fund
1988-89……….. 4,705,659 113,098 4,592,561 ------ 4,592,561 -9.14% -32.24% -8.37%1989-90………. 10,251,662 130,155 10,121,508 ------ 10,121,508 117.86% 15.08% 120.39%1990-91………. 7,901,969 226,553 7,675,416 ------ 7,675,416 -22.92% 74.06% -24.17%1991-92………. 7,366,864 118,738 7,248,126 ------ 7,248,126 -6.77% -47.59% -5.57%1992-93………. 13,659,807 105,099 13,554,708 ------ 13,554,708 85.42% -11.49% 87.01%1993-94………. 13,445,627 295,944 13,149,682 ------ 13,149,682 -1.57% 181.59% -2.99%1994-95………. 9,233,876 642,029 8,591,847 ------ 8,591,847 -31.32% 116.94% -34.66%1995-96……….. 11,195,186 158,403 11,036,783 ------ 11,036,783 21.24% -75.33% 28.46%1996-97……….. 12,777,918 216,977 12,560,941 ------ 12,560,941 14.14% 36.98% 13.81%1997-98……….. 21,230,257 590,032 20,640,224 ------ 20,640,224 66.15% 171.93% 64.32%1998-99……….. 19,714,487 379,578 19,334,909 ------ 19,334,909 -7.14% -35.67% -6.32%1999-00……….. 25,557,449 471,976 25,085,473 ------ 25,085,473 29.64% 24.34% 29.74%2000-01……….. 21,312,790 1,058,324 20,254,465 ------ 20,254,465 -16.61% 124.23% -19.26%2001-02……….. 13,825,943 433,725 13,392,218 1,857 13,390,362 -35.13% -59.02% -33.89%2002-03……….. 19,795,019 490,213 19,304,806 715 19,304,091 43.17% 13.02% 44.16%Detail may not add to totals due to rounding.
Gift tax rates and bases:The gift tax is levied upon the shares of the respective beneficiaries in all property within the jurisdiction of North Carolina, real, personal and mixed, and any interest thereinwhich shall in any one calendar year be transferred by gift made subsequent to March 24, 1939.The gift tax is imposed on the donor and is based on one of three graduated rate scales determined by the relationship of the donee to the donor:
Class A includes any lineal ancestor or descendantClass B includes brother, sister, descendant of a brother or sister, and aunt or uncle related by bloodClass C includes all others
The annual exclusion amount for gifts made on or after January 1, 2002, is $11,000. (The annual exclusion amount for tax years prior to 2002 was $10,000.) The exclusion does notapply to gifts of future interest. Gifts to spouses are exempt, including property given to a spouse as a qualified terminable interest property under federal law. In addition, a lifetime exemption of $100,000 is allowed each donor for gifts made to Class A donees and can be apportioned among the donees in the same ratio as the gross gift shares.
Collections to% Change1989 4,592,561 -8.37%1990 10,121,508 120.39%1991 7,675,416 -24.17%1992 7,248,126 -5.57%1993 13,554,708 87.01%1994 13,149,682 -2.99%1995 8,591,847 -34.66%1996 11,036,783 28.46%1997 12,560,941 13.81%1998 20,640,224 64.32%1999 19,334,909 -6.32%2000 25,085,473 29.74%2001 20,254,465 -19.26%2002 13,390,362 -33.89%2003 19,304,091 44.16%
Figure 41.1 Gift Tax Net Collections and % Change
$0
$5
$10
$15
$20
$25
$30
1989 1990 1991 1992 1993 1994 1995 1996 1997 1998 1999 2000 2001 2002 2003
(mill
ions
)
Fiscal year ended
-60%
-40%
-20%
0%
20%
40%
60%
80%
100%
120%
140%
Collections toGeneralFund
% Change
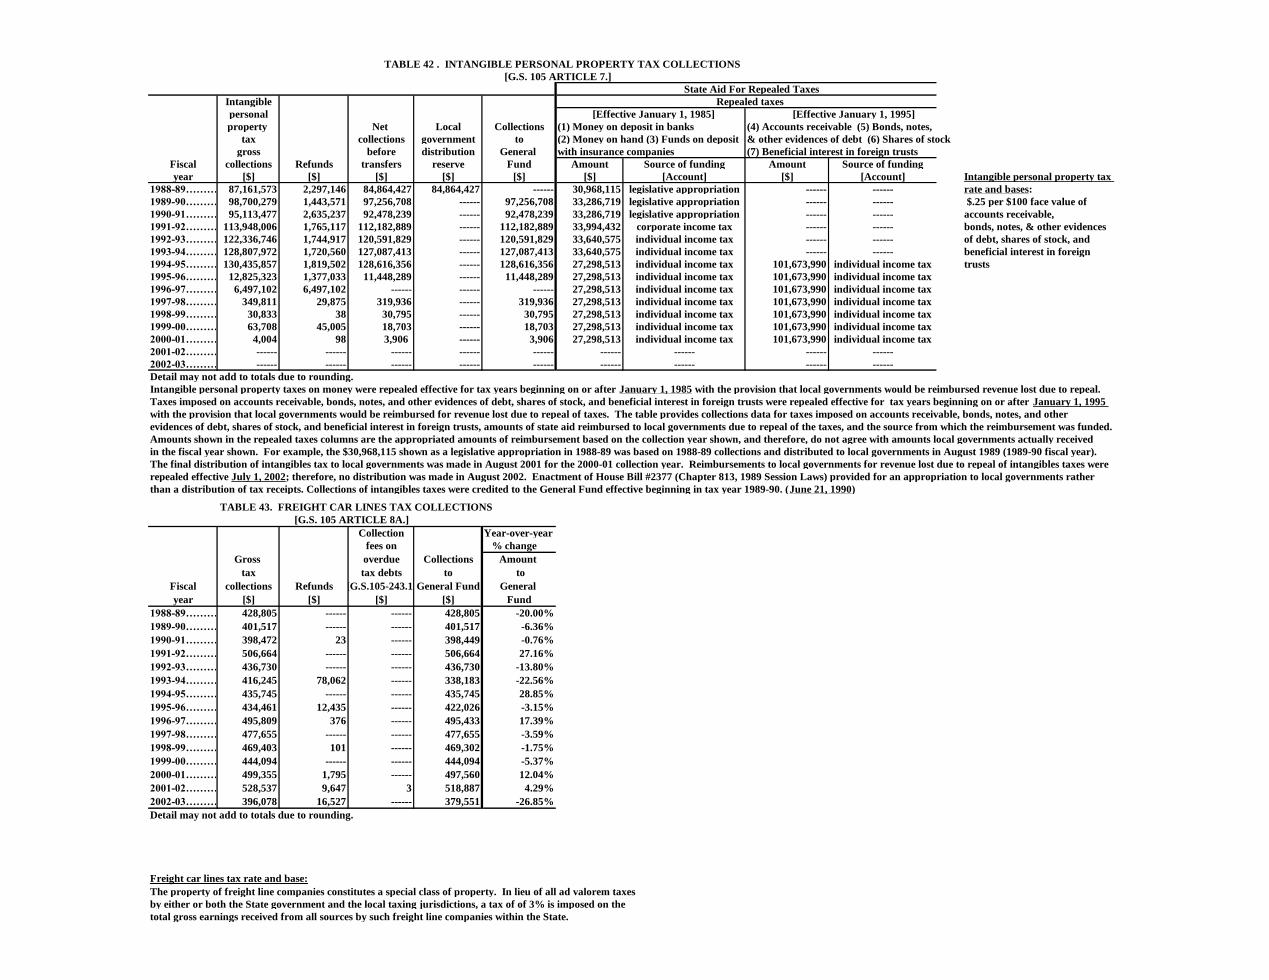
TABLE 42 . INTANGIBLE PERSONAL PROPERTY TAX COLLECTIONS
[G.S. 105 ARTICLE 7.]
State Aid For Repealed Taxes
Intangible Repealed taxes
personal [Effective January 1, 1985] [Effective January 1, 1995]
property Net Local Collections (1) Money on deposit in banks (4) Accounts receivable (5) Bonds, notes,
tax collections government to (2) Money on hand (3) Funds on deposit & other evidences of debt (6) Shares of stock
gross before distribution General with insurance companies (7) Beneficial interest in foreign trusts
Fiscal collections Refunds transfers reserve Fund Amount Source of funding Amount Source of funding
year [$] [$] [$] [$] [$] [$] [Account] [$] [Account] Intangible personal property tax
1988-89……… 87,161,573 2,297,146 84,864,427 84,864,427 ------ 30,968,115 legislative appropriation ------ ------ rate and bases:
1989-90……… 98,700,279 1,443,571 97,256,708 ------ 97,256,708 33,286,719 legislative appropriation ------ ------ $.25 per $100 face value of
1990-91……… 95,113,477 2,635,237 92,478,239 ------ 92,478,239 33,286,719 legislative appropriation ------ ------ accounts receivable,
1991-92……… 113,948,006 1,765,117 112,182,889 ------ 112,182,889 33,994,432 corporate income tax ------ ------ bonds, notes, & other evidences
1992-93……… 122,336,746 1,744,917 120,591,829 ------ 120,591,829 33,640,575 individual income tax ------ ------ of debt, shares of stock, and
1993-94……… 128,807,972 1,720,560 127,087,413 ------ 127,087,413 33,640,575 individual income tax ------ ------ beneficial interest in foreign
1994-95……… 130,435,857 1,819,502 128,616,356 ------ 128,616,356 27,298,513 individual income tax 101,673,990 individual income tax trusts
1995-96……… 12,825,323 1,377,033 11,448,289 ------ 11,448,289 27,298,513 individual income tax 101,673,990 individual income tax
1996-97……… 6,497,102 6,497,102 ------ ------ ------ 27,298,513 individual income tax 101,673,990 individual income tax
1997-98……… 349,811 29,875 319,936 ------ 319,936 27,298,513 individual income tax 101,673,990 individual income tax
1998-99……… 30,833 38 30,795 ------ 30,795 27,298,513 individual income tax 101,673,990 individual income tax
1999-00……… 63,708 45,005 18,703 ------ 18,703 27,298,513 individual income tax 101,673,990 individual income tax
2000-01……… 4,004 98 3,906 ------ 3,906 27,298,513 individual income tax 101,673,990 individual income tax
2001-02……… ------ ------ ------ ------ ------ ------ ------ ------ ------
2002-03……… ------ ------ ------ ------ ------ ------ ------ ------ ------
Detail may not add to totals due to rounding.
Intangible personal property taxes on money were repealed effective for tax years beginning on or after January 1, 1985 with the provision that local governments would be reimbursed revenue lost due to repeal.
Taxes imposed on accounts receivable, bonds, notes, and other evidences of debt, shares of stock, and beneficial interest in foreign trusts were repealed effective for tax years beginning on or after January 1, 1995
with the provision that local governments would be reimbursed for revenue lost due to repeal of taxes. The table provides collections data for taxes imposed on accounts receivable, bonds, notes, and other
evidences of debt, shares of stock, and beneficial interest in foreign trusts, amounts of state aid reimbursed to local governments due to repeal of the taxes, and the source from which the reimbursement was funded.
Amounts shown in the repealed taxes columns are the appropriated amounts of reimbursement based on the collection year shown, and therefore, do not agree with amounts local governments actually received
in the fiscal year shown. For example, the $30,968,115 shown as a legislative appropriation in 1988-89 was based on 1988-89 collections and distributed to local governments in August 1989 (1989-90 fiscal year).
The final distribution of intangibles tax to local governments was made in August 2001 for the 2000-01 collection year. Reimbursements to local governments for revenue lost due to repeal of intangibles taxes were
repealed effective July 1, 2002; therefore, no distribution was made in August 2002. Enactment of House Bill #2377 (Chapter 813, 1989 Session Laws) provided for an appropriation to local governments rather
than a distribution of tax receipts. Collections of intangibles taxes were credited to the General Fund effective beginning in tax year 1989-90. (June 21, 1990)
TABLE 43. FREIGHT CAR LINES TAX COLLECTIONS
[G.S. 105 ARTICLE 8A.]
Collection Year-over-year
fees on % change
Gross overdue Collections Amount
tax tax debts to to
Fiscal collections Refunds [G.S.105-243.1]General Fund General
year [$] [$] [$] [$] Fund
1988-89……… 428,805 ------ ------ 428,805 -20.00%
1989-90……… 401,517 ------ ------ 401,517 -6.36%
1990-91……… 398,472 23 ------ 398,449 -0.76%
1991-92……… 506,664 ------ ------ 506,664 27.16%
1992-93……… 436,730 ------ ------ 436,730 -13.80%
1993-94……… 416,245 78,062 ------ 338,183 -22.56%
1994-95……… 435,745 ------ ------ 435,745 28.85%
1995-96……… 434,461 12,435 ------ 422,026 -3.15%
1996-97……… 495,809 376 ------ 495,433 17.39%
1997-98……… 477,655 ------ ------ 477,655 -3.59%
1998-99……… 469,403 101 ------ 469,302 -1.75%
1999-00……… 444,094 ------ ------ 444,094 -5.37%
2000-01……… 499,355 1,795 ------ 497,560 12.04%
2001-02……… 528,537 9,647 3 518,887 4.29%
2002-03……… 396,078 16,527 ------ 379,551 -26.85%
Detail may not add to totals due to rounding.
Freight car lines tax rate and base:
The property of freight line companies constitutes a special class of property. In lieu of all ad valorem taxes
by either or both the State government and the local taxing jurisdictions, a tax of of 3% is imposed on the
total gross earnings received from all sources by such freight line companies within the State.
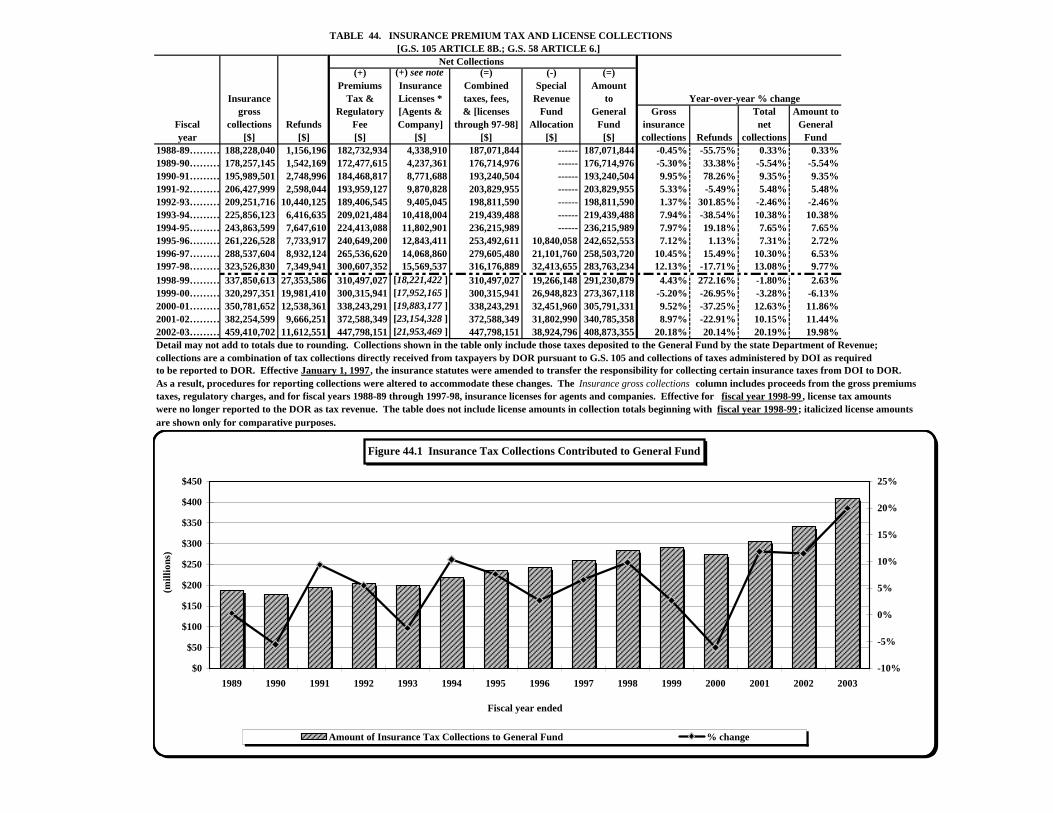
TABLE 44. INSURANCE PREMIUM TAX AND LICENSE COLLECTIONS [G.S. 105 ARTICLE 8B.; G.S. 58 ARTICLE 6.] Net Collections
(+) (+) see note (=) (-) (=)Premiums Insurance Combined Special Amount
Insurance Tax & Licenses * taxes, fees, Revenue to Year-over-year % changegross Regulatory [Agents & & [licenses Fund General Gross Total Amount to
Fiscal collections Refunds Fee Company] through 97-98] Allocation Fund insurance net Generalyear [$] [$] [$] [$] [$] [$] [$] collections Refunds collections Fund
1988-89……… 188,228,040 1,156,196 182,732,934 4,338,910 187,071,844 ------ 187,071,844 -0.45% -55.75% 0.33% 0.33%1989-90……… 178,257,145 1,542,169 172,477,615 4,237,361 176,714,976 ------ 176,714,976 -5.30% 33.38% -5.54% -5.54%1990-91……… 195,989,501 2,748,996 184,468,817 8,771,688 193,240,504 ------ 193,240,504 9.95% 78.26% 9.35% 9.35%1991-92……… 206,427,999 2,598,044 193,959,127 9,870,828 203,829,955 ------ 203,829,955 5.33% -5.49% 5.48% 5.48%1992-93……… 209,251,716 10,440,125 189,406,545 9,405,045 198,811,590 ------ 198,811,590 1.37% 301.85% -2.46% -2.46%1993-94……… 225,856,123 6,416,635 209,021,484 10,418,004 219,439,488 ------ 219,439,488 7.94% -38.54% 10.38% 10.38%1994-95……… 243,863,599 7,647,610 224,413,088 11,802,901 236,215,989 ------ 236,215,989 7.97% 19.18% 7.65% 7.65%1995-96……… 261,226,528 7,733,917 240,649,200 12,843,411 253,492,611 10,840,058 242,652,553 7.12% 1.13% 7.31% 2.72%1996-97……… 288,537,604 8,932,124 265,536,620 14,068,860 279,605,480 21,101,760 258,503,720 10.45% 15.49% 10.30% 6.53%1997-98……… 323,526,830 7,349,941 300,607,352 15,569,537 316,176,889 32,413,655 283,763,234 12.13% -17.71% 13.08% 9.77%1998-99……… 337,850,613 27,353,586 310,497,027 [18,221,422 ] 310,497,027 19,266,148 291,230,879 4.43% 272.16% -1.80% 2.63%1999-00……… 320,297,351 19,981,410 300,315,941 [17,952,165 ] 300,315,941 26,948,823 273,367,118 -5.20% -26.95% -3.28% -6.13%2000-01……… 350,781,652 12,538,361 338,243,291 [19,883,177 ] 338,243,291 32,451,960 305,791,331 9.52% -37.25% 12.63% 11.86%2001-02……… 382,254,599 9,666,251 372,588,349 [23,154,328 ] 372,588,349 31,802,990 340,785,358 8.97% -22.91% 10.15% 11.44%2002-03……… 459,410,702 11,612,551 447,798,151 [21,953,469 ] 447,798,151 38,924,796 408,873,355 20.18% 20.14% 20.19% 19.98%Detail may not add to totals due to rounding. Collections shown in the table only include those taxes deposited to the General Fund by the state Department of Revenue; collections are a combination of tax collections directly received from taxpayers by DOR pursuant to G.S. 105 and collections of taxes administered by DOI as requiredto be reported to DOR. Effective January 1, 1997, the insurance statutes were amended to transfer the responsibility for collecting certain insurance taxes from DOI to DOR.As a result, procedures for reporting collections were altered to accommodate these changes. The Insurance gross collections column includes proceeds from the gross premiums taxes, regulatory charges, and for fiscal years 1988-89 through 1997-98, insurance licenses for agents and companies. Effective for fiscal year 1998-99 , license tax amounts were no longer reported to the DOR as tax revenue. The table does not include license amounts in collection totals beginning with fiscal year 1998-99; italicized license amountsare shown only for comparative purposes.
Amount of Insu% change1989 187,071,844 0.33%1990 176,714,976 -5.54%1991 193,240,504 9.35%1992 203,829,955 5.48%1993 198,811,590 -2.46%1994 219,439,488 10.38%1995 236,215,989 7.65%1996 242,652,553 2.72%1997 258,503,720 6.53%1998 283,763,234 9.77%1999 291,230,879 2.63%2000 273,367,118 -6.13%2001 305,791,331 11.86%2002 340,785,358 11.44%2003 408,873,355 19.98%
Figure 44.1 Insurance Tax Collections Contributed to General Fund
$0
$50
$100
$150
$200
$250
$300
$350
$400
$450
1989 1990 1991 1992 1993 1994 1995 1996 1997 1998 1999 2000 2001 2002 2003
(mill
ions
)
Fiscal year ended
-10%
-5%
0%
5%
10%
15%
20%
25%
Amount of Insurance Tax Collections to General Fund % change
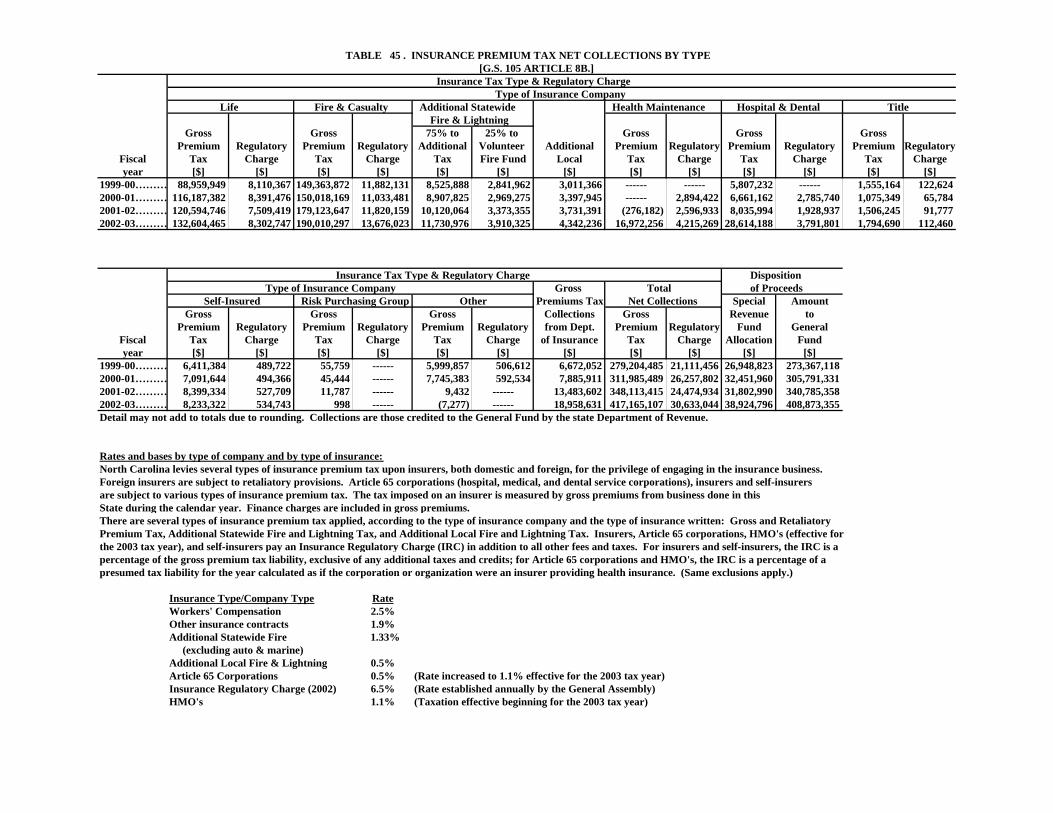
TABLE 45 . INSURANCE PREMIUM TAX NET COLLECTIONS BY TYPE [G.S. 105 ARTICLE 8B.]
Insurance Tax Type & Regulatory Charge Type of Insurance Company
Life Fire & Casualty Additional Statewide Health Maintenance Hospital & Dental Title Fire & Lightning
Gross Gross 75% to 25% to Gross Gross GrossPremium Regulatory Premium Regulatory Additional Volunteer Additional Premium Regulatory Premium Regulatory Premium Regulatory
Fiscal Tax Charge Tax Charge Tax Fire Fund Local Tax Charge Tax Charge Tax Chargeyear [$] [$] [$] [$] [$] [$] [$] [$] [$] [$] [$] [$] [$]
1999-00……… 88,959,949 8,110,367 149,363,872 11,882,131 8,525,888 2,841,962 3,011,366 ------ ------ 5,807,232 ------ 1,555,164 122,6242000-01……… 116,187,382 8,391,476 150,018,169 11,033,481 8,907,825 2,969,275 3,397,945 ------ 2,894,422 6,661,162 2,785,740 1,075,349 65,7842001-02……… 120,594,746 7,509,419 179,123,647 11,820,159 10,120,064 3,373,355 3,731,391 (276,182) 2,596,933 8,035,994 1,928,937 1,506,245 91,7772002-03……… 132,604,465 8,302,747 190,010,297 13,676,023 11,730,976 3,910,325 4,342,236 16,972,256 4,215,269 28,614,188 3,791,801 1,794,690 112,460
Insurance Tax Type & Regulatory Charge Disposition Type of Insurance Company Gross Total of Proceeds
Self-Insured Risk Purchasing Group Other Premiums Tax Net Collections Special AmountGross Gross Gross Collections Gross Revenue to
Premium Regulatory Premium Regulatory Premium Regulatory from Dept. Premium Regulatory Fund GeneralFiscal Tax Charge Tax Charge Tax Charge of Insurance Tax Charge Allocation Fundyear [$] [$] [$] [$] [$] [$] [$] [$] [$] [$] [$]
1999-00……… 6,411,384 489,722 55,759 ------ 5,999,857 506,612 6,672,052 279,204,485 21,111,456 26,948,823 273,367,1182000-01……… 7,091,644 494,366 45,444 ------ 7,745,383 592,534 7,885,911 311,985,489 26,257,802 32,451,960 305,791,3312001-02……… 8,399,334 527,709 11,787 ------ 9,432 ------ 13,483,602 348,113,415 24,474,934 31,802,990 340,785,3582002-03……… 8,233,322 534,743 998 ------ (7,277) ------ 18,958,631 417,165,107 30,633,044 38,924,796 408,873,355Detail may not add to totals due to rounding. Collections are those credited to the General Fund by the state Department of Revenue.
Rates and bases by type of company and by type of insurance:North Carolina levies several types of insurance premium tax upon insurers, both domestic and foreign, for the privilege of engaging in the insurance business.Foreign insurers are subject to retaliatory provisions. Article 65 corporations (hospital, medical, and dental service corporations), insurers and self-insurersare subject to various types of insurance premium tax. The tax imposed on an insurer is measured by gross premiums from business done in thisState during the calendar year. Finance charges are included in gross premiums.There are several types of insurance premium tax applied, according to the type of insurance company and the type of insurance written: Gross and Retaliatory Premium Tax, Additional Statewide Fire and Lightning Tax, and Additional Local Fire and Lightning Tax. Insurers, Article 65 corporations, HMO's (effective forthe 2003 tax year), and self-insurers pay an Insurance Regulatory Charge (IRC) in addition to all other fees and taxes. For insurers and self-insurers, the IRC is apercentage of the gross premium tax liability, exclusive of any additional taxes and credits; for Article 65 corporations and HMO's, the IRC is a percentage of apresumed tax liability for the year calculated as if the corporation or organization were an insurer providing health insurance. (Same exclusions apply.)
Insurance Type/Company Type RateWorkers' Compensation 2.5%Other insurance contracts 1.9%Additional Statewide Fire 1.33% (excluding auto & marine)Additional Local Fire & Lightning 0.5%Article 65 Corporations 0.5% (Rate increased to 1.1% effective for the 2003 tax year)Insurance Regulatory Charge (2002) 6.5% (Rate established annually by the General Assembly)HMO's 1.1% (Taxation effective beginning for the 2003 tax year)
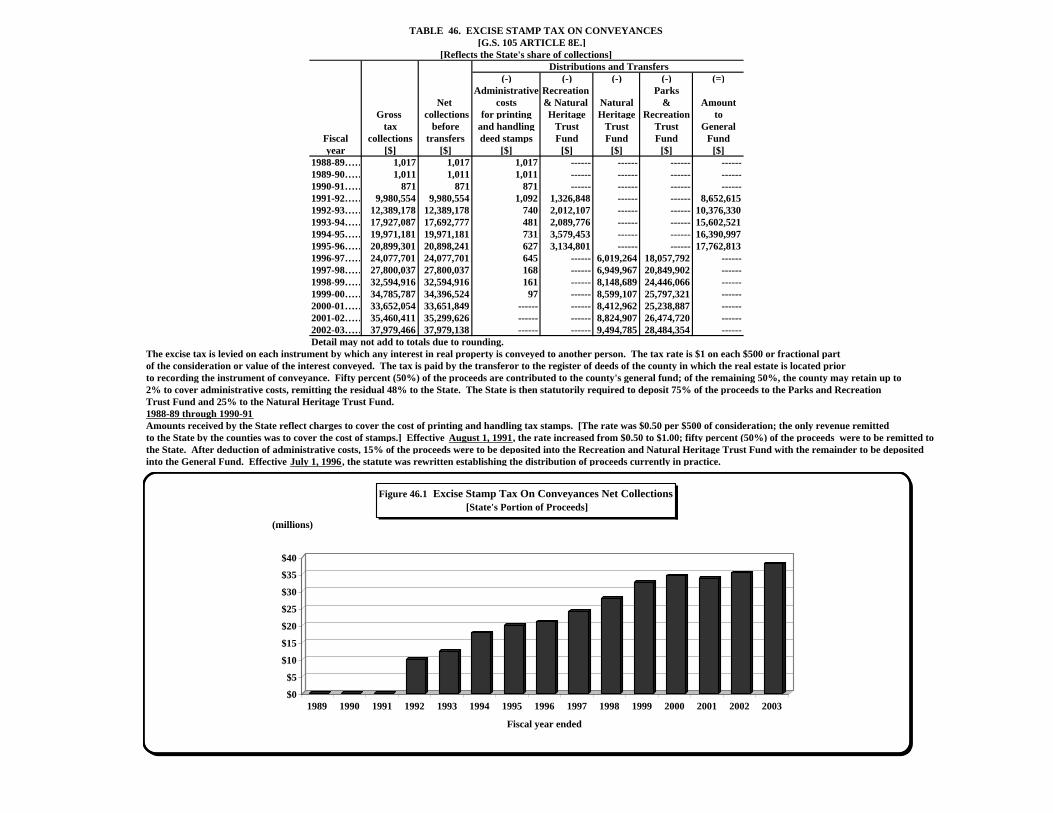
TABLE 46. EXCISE STAMP TAX ON CONVEYANCES [G.S. 105 ARTICLE 8E.] [Reflects the State's share of collections]
Distributions and Transfers(-) (-) (-) (-) (=)
Administrative Recreation ParksNet costs & Natural Natural & Amount
Gross collections for printing Heritage Heritage Recreation totax before and handling Trust Trust Trust General
Fiscal collections transfers deed stamps Fund Fund Fund Fundyear [$] [$] [$] [$] [$] [$] [$]
1988-89…… 1,017 1,017 1,017 ------ ------ ------ ------1989-90…… 1,011 1,011 1,011 ------ ------ ------ ------1990-91…… 871 871 871 ------ ------ ------ ------1991-92…… 9,980,554 9,980,554 1,092 1,326,848 ------ ------ 8,652,6151992-93…… 12,389,178 12,389,178 740 2,012,107 ------ ------ 10,376,3301993-94…… 17,927,087 17,692,777 481 2,089,776 ------ ------ 15,602,5211994-95…… 19,971,181 19,971,181 731 3,579,453 ------ ------ 16,390,9971995-96…… 20,899,301 20,898,241 627 3,134,801 ------ ------ 17,762,8131996-97…… 24,077,701 24,077,701 645 ------ 6,019,264 18,057,792 ------1997-98…… 27,800,037 27,800,037 168 ------ 6,949,967 20,849,902 ------1998-99…… 32,594,916 32,594,916 161 ------ 8,148,689 24,446,066 ------1999-00…… 34,785,787 34,396,524 97 ------ 8,599,107 25,797,321 ------2000-01…… 33,652,054 33,651,849 ------ ------ 8,412,962 25,238,887 ------2001-02…… 35,460,411 35,299,626 ------ ------ 8,824,907 26,474,720 ------2002-03…… 37,979,466 37,979,138 ------ ------ 9,494,785 28,484,354 ------Detail may not add to totals due to rounding.
The excise tax is levied on each instrument by which any interest in real property is conveyed to another person. The tax rate is $1 on each $500 or fractional part of the consideration or value of the interest conveyed. The tax is paid by the transferor to the register of deeds of the county in which the real estate is located priorto recording the instrument of conveyance. Fifty percent (50%) of the proceeds are contributed to the county's general fund; of the remaining 50%, the county may retain up to2% to cover administrative costs, remitting the residual 48% to the State. The State is then statutorily required to deposit 75% of the proceeds to the Parks and Recreation Trust Fund and 25% to the Natural Heritage Trust Fund.1988-89 through 1990-91Amounts received by the State reflect charges to cover the cost of printing and handling tax stamps. [The rate was $0.50 per $500 of consideration; the only revenue remittedto the State by the counties was to cover the cost of stamps.] Effective August 1, 1991, the rate increased from $0.50 to $1.00; fifty percent (50%) of the proceeds were to be remitted to the State. After deduction of administrative costs, 15% of the proceeds were to be deposited into the Recreation and Natural Heritage Trust Fund with the remainder to be deposited into the General Fund. Effective July 1, 1996, the statute was rewritten establishing the distribution of proceeds currently in practice.
1989 1,0171990 1,0111991 8711992 9,980,5541993 12,389,1781994 17,692,7771995 19,971,1811996 20,898,2411997 24,077,7011998 27,800,0371999 32,594,9162000 34,396,5242001 33,651,8492002 35,299,6262003 37,979,138
$0
$5
$10
$15
$20
$25
$30
$35
$40
(millions)
1989 1990 1991 1992 1993 1994 1995 1996 1997 1998 1999 2000 2001 2002 2003
Fiscal year ended
Figure 46.1 Excise Stamp Tax On Conveyances Net Collections [State's Portion of Proceeds]
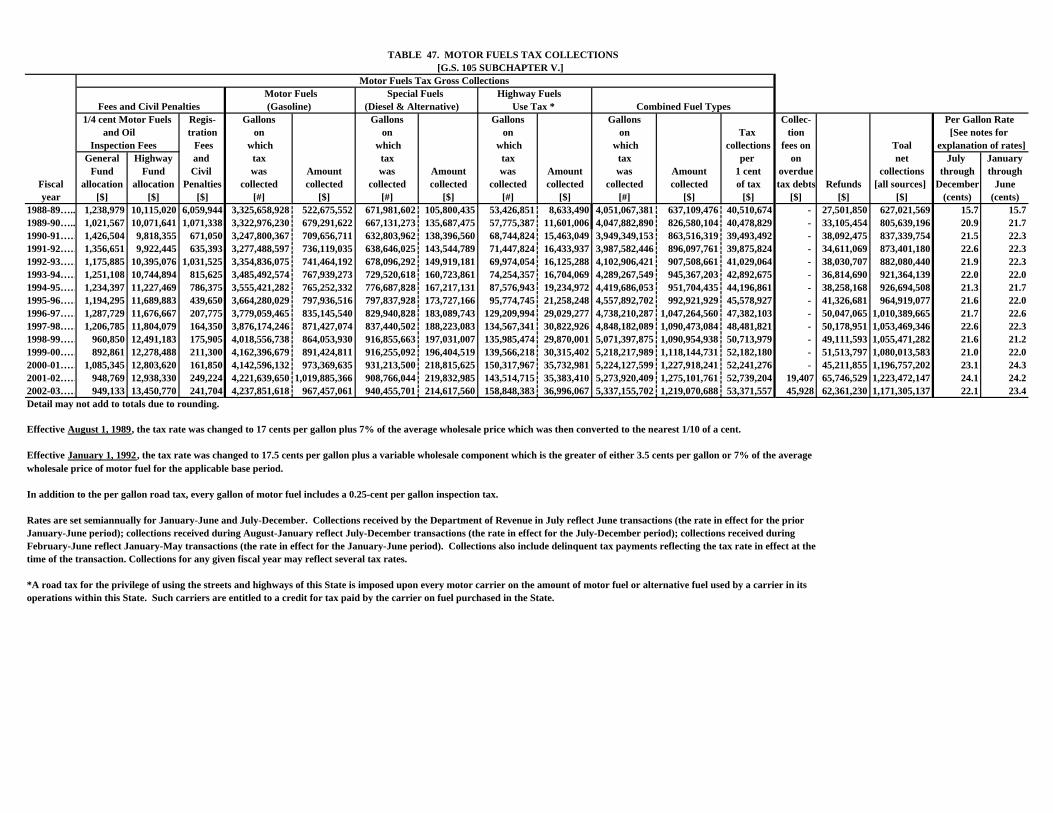
TABLE 47. MOTOR FUELS TAX COLLECTIONS [G.S. 105 SUBCHAPTER V.]
Motor Fuels Tax Gross Collections Motor Fuels Special Fuels Highway Fuels
Fees and Civil Penalties (Gasoline) (Diesel & Alternative) Use Tax * Combined Fuel Types 1/4 cent Motor Fuels Regis- Gallons Gallons Gallons Gallons Collec- Per Gallon Rate and Oil tration on on on on Tax tion [See notes for Inspection Fees Fees which which which which collections fees on Toal explanation of rates]
General Highway and tax tax tax tax per on net July JanuaryFund Fund Civil was Amount was Amount was Amount was Amount 1 cent overdue collections through through
Fiscal allocation allocation Penalties collected collected collected collected collected collected collected collected of tax tax debts Refunds [all sources] December Juneyear [$] [$] [$] [#] [$] [#] [$] [#] [$] [#] [$] [$] [$] [$] [$] (cents) (cents)
1988-89….. 1,238,979 10,115,020 6,059,944 3,325,658,928 522,675,552 671,981,602 105,800,435 53,426,851 8,633,490 4,051,067,381 637,109,476 40,510,674 - 27,501,850 627,021,569 15.7 15.71989-90….. 1,021,567 10,071,641 1,071,338 3,322,976,230 679,291,622 667,131,273 135,687,475 57,775,387 11,601,006 4,047,882,890 826,580,104 40,478,829 - 33,105,454 805,639,196 20.9 21.71990-91…… 1,426,504 9,818,355 671,050 3,247,800,367 709,656,711 632,803,962 138,396,560 68,744,824 15,463,049 3,949,349,153 863,516,319 39,493,492 - 38,092,475 837,339,754 21.5 22.31991-92…… 1,356,651 9,922,445 635,393 3,277,488,597 736,119,035 638,646,025 143,544,789 71,447,824 16,433,937 3,987,582,446 896,097,761 39,875,824 - 34,611,069 873,401,180 22.6 22.31992-93…… 1,175,885 10,395,076 1,031,525 3,354,836,075 741,464,192 678,096,292 149,919,181 69,974,054 16,125,288 4,102,906,421 907,508,661 41,029,064 - 38,030,707 882,080,440 21.9 22.31993-94…… 1,251,108 10,744,894 815,625 3,485,492,574 767,939,273 729,520,618 160,723,861 74,254,357 16,704,069 4,289,267,549 945,367,203 42,892,675 - 36,814,690 921,364,139 22.0 22.01994-95…… 1,234,397 11,227,469 786,375 3,555,421,282 765,252,332 776,687,828 167,217,131 87,576,943 19,234,972 4,419,686,053 951,704,435 44,196,861 - 38,258,168 926,694,508 21.3 21.71995-96…… 1,194,295 11,689,883 439,650 3,664,280,029 797,936,516 797,837,928 173,727,166 95,774,745 21,258,248 4,557,892,702 992,921,929 45,578,927 - 41,326,681 964,919,077 21.6 22.01996-97…… 1,287,729 11,676,667 207,775 3,779,059,465 835,145,540 829,940,828 183,089,743 129,209,994 29,029,277 4,738,210,287 1,047,264,560 47,382,103 - 50,047,065 1,010,389,665 21.7 22.61997-98…… 1,206,785 11,804,079 164,350 3,876,174,246 871,427,074 837,440,502 188,223,083 134,567,341 30,822,926 4,848,182,089 1,090,473,084 48,481,821 - 50,178,951 1,053,469,346 22.6 22.31998-99…… 960,850 12,491,183 175,905 4,018,556,738 864,053,930 916,855,663 197,031,007 135,985,474 29,870,001 5,071,397,875 1,090,954,938 50,713,979 - 49,111,593 1,055,471,282 21.6 21.21999-00…… 892,861 12,278,488 211,300 4,162,396,679 891,424,811 916,255,092 196,404,519 139,566,218 30,315,402 5,218,217,989 1,118,144,731 52,182,180 - 51,513,797 1,080,013,583 21.0 22.02000-01…… 1,085,345 12,803,620 161,850 4,142,596,132 973,369,635 931,213,500 218,815,625 150,317,967 35,732,981 5,224,127,599 1,227,918,241 52,241,276 - 45,211,855 1,196,757,202 23.1 24.32001-02…… 948,769 12,938,330 249,224 4,221,639,650 1,019,885,366 908,766,044 219,832,985 143,514,715 35,383,410 5,273,920,409 1,275,101,761 52,739,204 19,407 65,746,529 1,223,472,147 24.1 24.22002-03…… 949,133 13,450,770 241,704 4,237,851,618 967,457,061 940,455,701 214,617,560 158,848,383 36,996,067 5,337,155,702 1,219,070,688 53,371,557 45,928 62,361,230 1,171,305,137 22.1 23.4Detail may not add to totals due to rounding.
Effective August 1, 1989, the tax rate was changed to 17 cents per gallon plus 7% of the average wholesale price which was then converted to the nearest 1/10 of a cent.
Effective January 1, 1992, the tax rate was changed to 17.5 cents per gallon plus a variable wholesale component which is the greater of either 3.5 cents per gallon or 7% of the average wholesale price of motor fuel for the applicable base period.
In addition to the per gallon road tax, every gallon of motor fuel includes a 0.25-cent per gallon inspection tax.
Rates are set semiannually for January-June and July-December. Collections received by the Department of Revenue in July reflect June transactions (the rate in effect for the prior January-June period); collections received during August-January reflect July-December transactions (the rate in effect for the July-December period); collections received during February-June reflect January-May transactions (the rate in effect for the January-June period). Collections also include delinquent tax payments reflecting the tax rate in effect at the time of the transaction. Collections for any given fiscal year may reflect several tax rates.
*A road tax for the privilege of using the streets and highways of this State is imposed upon every motor carrier on the amount of motor fuel or alternative fuel used by a carrier in itsoperations within this State. Such carriers are entitled to a credit for tax paid by the carrier on fuel purchased in the State.
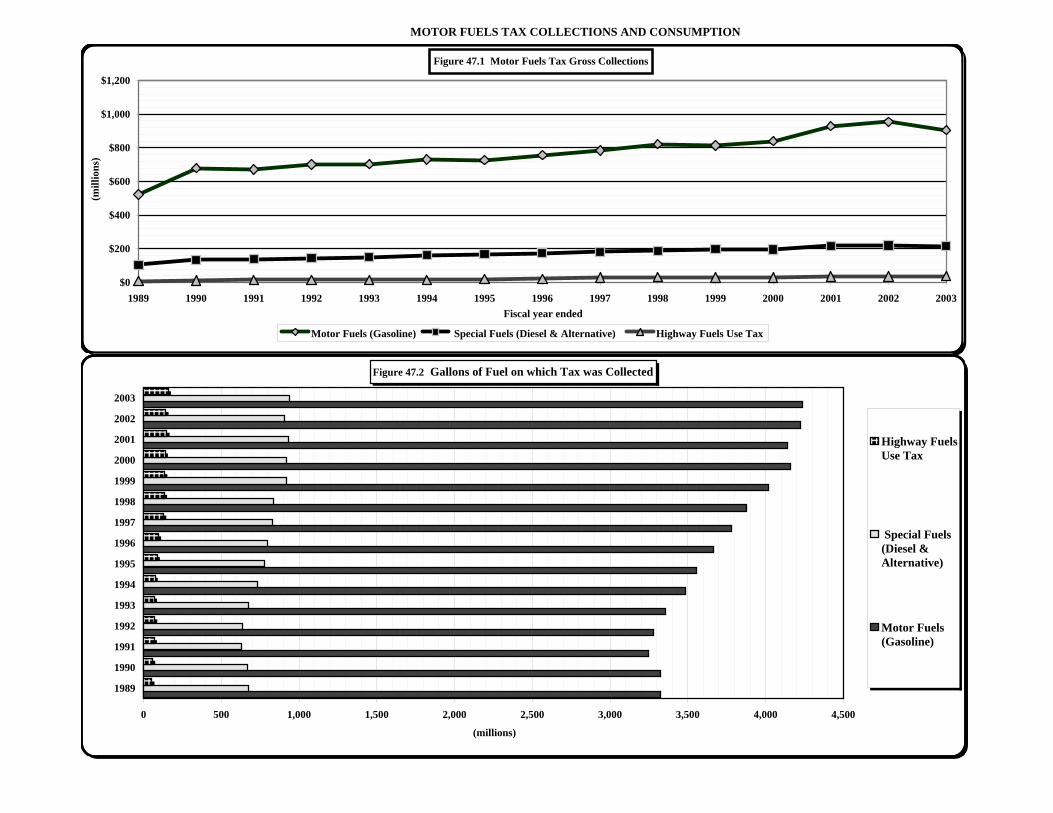
MOTOR FUELS TAX COLLECTIONS AND CONSUMPTION
Motor Fuels (G Special Fuels (DieHighway Fuels Use Tax1989 522,675,552 105,800,435 8,633,4901990 679,291,622 135,687,475 11,601,0061991 671,561,030 138,396,560 15,463,0491992 701,507,966 143,544,789 16,433,9371993 703,433,485 149,919,181 16,125,2881994 731,124,583 160,723,861 16,704,0691995 726,994,164 167,217,131 19,234,9721996 756,609,835 173,727,166 21,258,2481997 785,098,475 183,089,743 29,029,2771998 821,248,123 188,223,083 30,822,9261999 814,942,337 197,031,007 29,870,0012000 839,911,014 196,404,519 30,315,4022001 928,157,783 218,815,625 35,732,9812002 954,402,967 219,549,448 35,383,4102003 905,079,739 214,587,724 36,996,067
Motor Fuels (GasoSpecial Fuels (DHighway Fuels Use Tax1989 3,325,658,928 671,981,602 53,426,8511990 3,322,976,230 667,131,273 57,775,3871991 3,247,800,367 632,803,962 68,744,8241992 3,277,488,597 638,646,025 71,447,8241993 3,354,836,075 678,096,292 69,974,0541994 3,485,492,574 729,520,618 74,254,3571995 3,555,421,282 776,687,828 87,576,9431996 3,664,280,029 797,837,928 95,774,7451997 3,779,059,465 829,940,828 129,209,9941998 3,876,174,246 837,440,502 134,567,3411999 4,018,556,738 916,855,663 135,985,4742000 4,162,396,679 916,255,092 139,566,2182001 4,142,596,132 931,213,500 150,317,9672002 4,221,639,650 908,766,044 143,514,7152003 4,237,851,618 940,455,701 158,848,383
Figure 47.2 Gallons of Fuel on which Tax was Collected
0 500 1,000 1,500 2,000 2,500 3,000 3,500 4,000 4,500
1989
1990
1991
1992
1993
1994
1995
1996
1997
1998
1999
2000
2001
2002
2003
(millions)
Highway FuelsUse Tax
Special Fuels(Diesel &Alternative)
Motor Fuels(Gasoline)
Figure 47.1 Motor Fuels Tax Gross Collections
$0
$200
$400
$600
$800
$1,000
$1,200
1989 1990 1991 1992 1993 1994 1995 1996 1997 1998 1999 2000 2001 2002 2003
(mill
ions
)
Fiscal year ended
Motor Fuels (Gasoline) Special Fuels (Diesel & Alternative) Highway Fuels Use Tax
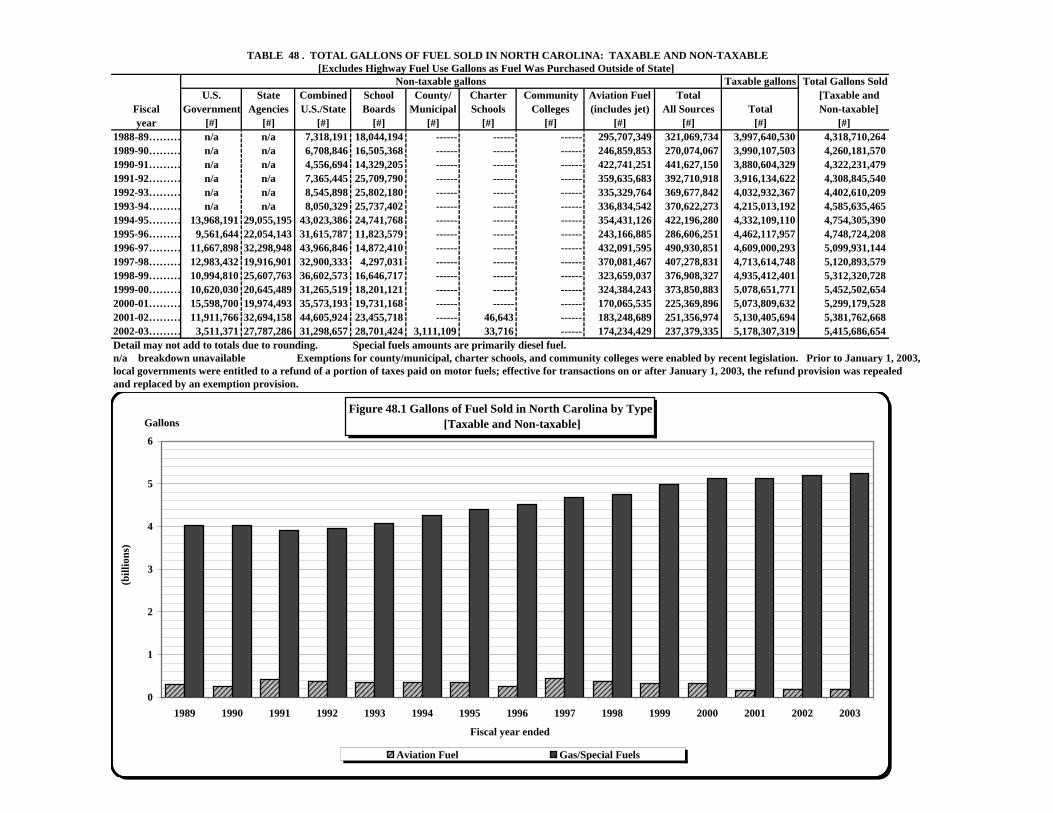
TABLE 48 . TOTAL GALLONS OF FUEL SOLD IN NORTH CAROLINA: TAXABLE AND NON-TAXABLE [Excludes Highway Fuel Use Gallons as Fuel Was Purchased Outside of State]
Non-taxable gallons Taxable gallons Total Gallons SoldU.S. State Combined School County/ Charter Community Aviation Fuel Total [Taxable and
Fiscal Government Agencies U.S./State Boards Municipal Schools Colleges (includes jet) All Sources Total Non-taxable]year [#] [#] [#] [#] [#] [#] [#] [#] [#] [#] [#]
1988-89……… n/a n/a 7,318,191 18,044,194 ------ ------ ------ 295,707,349 321,069,734 3,997,640,530 4,318,710,2641989-90……… n/a n/a 6,708,846 16,505,368 ------ ------ ------ 246,859,853 270,074,067 3,990,107,503 4,260,181,5701990-91……… n/a n/a 4,556,694 14,329,205 ------ ------ ------ 422,741,251 441,627,150 3,880,604,329 4,322,231,4791991-92……… n/a n/a 7,365,445 25,709,790 ------ ------ ------ 359,635,683 392,710,918 3,916,134,622 4,308,845,5401992-93……… n/a n/a 8,545,898 25,802,180 ------ ------ ------ 335,329,764 369,677,842 4,032,932,367 4,402,610,2091993-94……… n/a n/a 8,050,329 25,737,402 ------ ------ ------ 336,834,542 370,622,273 4,215,013,192 4,585,635,4651994-95……… 13,968,191 29,055,195 43,023,386 24,741,768 ------ ------ ------ 354,431,126 422,196,280 4,332,109,110 4,754,305,3901995-96……… 9,561,644 22,054,143 31,615,787 11,823,579 ------ ------ ------ 243,166,885 286,606,251 4,462,117,957 4,748,724,2081996-97……… 11,667,898 32,298,948 43,966,846 14,872,410 ------ ------ ------ 432,091,595 490,930,851 4,609,000,293 5,099,931,1441997-98……… 12,983,432 19,916,901 32,900,333 4,297,031 ------ ------ ------ 370,081,467 407,278,831 4,713,614,748 5,120,893,5791998-99……… 10,994,810 25,607,763 36,602,573 16,646,717 ------ ------ ------ 323,659,037 376,908,327 4,935,412,401 5,312,320,7281999-00……… 10,620,030 20,645,489 31,265,519 18,201,121 ------ ------ ------ 324,384,243 373,850,883 5,078,651,771 5,452,502,6542000-01……… 15,598,700 19,974,493 35,573,193 19,731,168 ------ ------ ------ 170,065,535 225,369,896 5,073,809,632 5,299,179,5282001-02……… 11,911,766 32,694,158 44,605,924 23,455,718 ------ 46,643 ------ 183,248,689 251,356,974 5,130,405,694 5,381,762,6682002-03……… 3,511,371 27,787,286 31,298,657 28,701,424 3,111,109 33,716 ------ 174,234,429 237,379,335 5,178,307,319 5,415,686,654Detail may not add to totals due to rounding. Special fuels amounts are primarily diesel fuel. n/a breakdown unavailable Exemptions for county/municipal, charter schools, and community colleges were enabled by recent legislation. Prior to January 1, 2003,local governments were entitled to a refund of a portion of taxes paid on motor fuels; effective for transactions on or after January 1, 2003, the refund provision was repealedand replaced by an exemption provision.
Gas/Special Fue Aviation Fuel1989 4,023,002,915 295,707,3491990 4,013,321,717 246,859,8531991 3,899,490,228 422,741,2511992 3,949,209,857 359,635,6831993 4,067,280,445 335,329,7641994 4,248,800,923 336,834,5421995 4,399,874,264 354,431,1261996 4,505,557,323 243,166,8851997 4,667,839,549 432,091,5951998 4,750,812,112 370,081,4671999 4,988,661,691 323,659,0372000 5,128,118,411 324,384,2432001 5,129,113,993 170,065,5352002 5,198,513,979 183,248,6892003 5,241,452,225 174,234,429
Figure 48.1 Gallons of Fuel Sold in North Carolina by Type [Taxable and Non-taxable]
0
1
2
3
4
5
6
1989 1990 1991 1992 1993 1994 1995 1996 1997 1998 1999 2000 2001 2002 2003
(bill
ions
)
Fiscal year ended
Gallons
Aviation Fuel Gas/Special Fuels
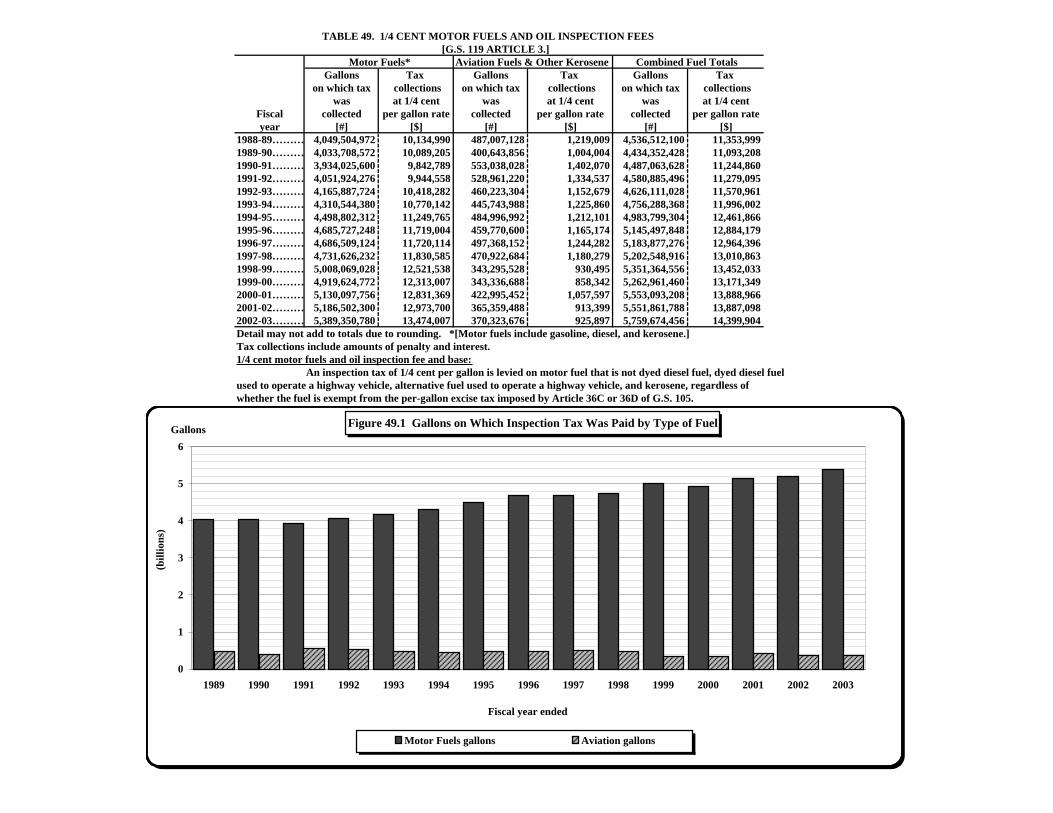
TABLE 49. 1/4 CENT MOTOR FUELS AND OIL INSPECTION FEES [G.S. 119 ARTICLE 3.]
Motor Fuels* Aviation Fuels & Other Kerosene Combined Fuel TotalsGallons Tax Gallons Tax Gallons Tax
on which tax collections on which tax collections on which tax collectionswas at 1/4 cent was at 1/4 cent was at 1/4 cent
Fiscal collected per gallon rate collected per gallon rate collected per gallon rateyear [#] [$] [#] [$] [#] [$]
1988-89……… 4,049,504,972 10,134,990 487,007,128 1,219,009 4,536,512,100 11,353,9991989-90……… 4,033,708,572 10,089,205 400,643,856 1,004,004 4,434,352,428 11,093,2081990-91……… 3,934,025,600 9,842,789 553,038,028 1,402,070 4,487,063,628 11,244,8601991-92……… 4,051,924,276 9,944,558 528,961,220 1,334,537 4,580,885,496 11,279,0951992-93……… 4,165,887,724 10,418,282 460,223,304 1,152,679 4,626,111,028 11,570,9611993-94……… 4,310,544,380 10,770,142 445,743,988 1,225,860 4,756,288,368 11,996,0021994-95……… 4,498,802,312 11,249,765 484,996,992 1,212,101 4,983,799,304 12,461,8661995-96……… 4,685,727,248 11,719,004 459,770,600 1,165,174 5,145,497,848 12,884,1791996-97……… 4,686,509,124 11,720,114 497,368,152 1,244,282 5,183,877,276 12,964,3961997-98……… 4,731,626,232 11,830,585 470,922,684 1,180,279 5,202,548,916 13,010,8631998-99……… 5,008,069,028 12,521,538 343,295,528 930,495 5,351,364,556 13,452,0331999-00……… 4,919,624,772 12,313,007 343,336,688 858,342 5,262,961,460 13,171,3492000-01……… 5,130,097,756 12,831,369 422,995,452 1,057,597 5,553,093,208 13,888,9662001-02……… 5,186,502,300 12,973,700 365,359,488 913,399 5,551,861,788 13,887,0982002-03……… 5,389,350,780 13,474,007 370,323,676 925,897 5,759,674,456 14,399,904Detail may not add to totals due to rounding. *[Motor fuels include gasoline, diesel, and kerosene.]Tax collections include amounts of penalty and interest.1/4 cent motor fuels and oil inspection fee and base: An inspection tax of 1/4 cent per gallon is levied on motor fuel that is not dyed diesel fuel, dyed diesel fuelused to operate a highway vehicle, alternative fuel used to operate a highway vehicle, and kerosene, regardless ofwhether the fuel is exempt from the per-gallon excise tax imposed by Article 36C or 36D of G.S. 105.
Motor Fuels gal Aviation gallons1989 4,049,504,972 487,007,1281990 4,033,708,572 400,643,8561991 3,934,025,600 553,038,0281992 4,051,924,276 528,961,2201993 4,165,887,724 460,223,3041994 4,310,544,380 445,743,9881995 4,498,802,312 484,996,9921996 4,685,727,248 459,770,6001997 4,686,509,124 497,368,1521998 4,731,626,232 470,922,6841999 5,008,069,028 343,295,5282000 4,919,624,772 343,336,6882001 5,130,097,756 422,995,4522002 5,186,502,300 365,359,4882003 5,389,350,780 370,323,676
Figure 49.1 Gallons on Which Inspection Tax Was Paid by Type of Fuel
0
1
2
3
4
5
6
1989 1990 1991 1992 1993 1994 1995 1996 1997 1998 1999 2000 2001 2002 2003
(bill
ions
)
Fiscal year ended
Gallons
Motor Fuels gallons Aviation gallons
PART IV. NORTH CAROLINA: LOCAL GOVERNMENT TAXES AND REVENUES
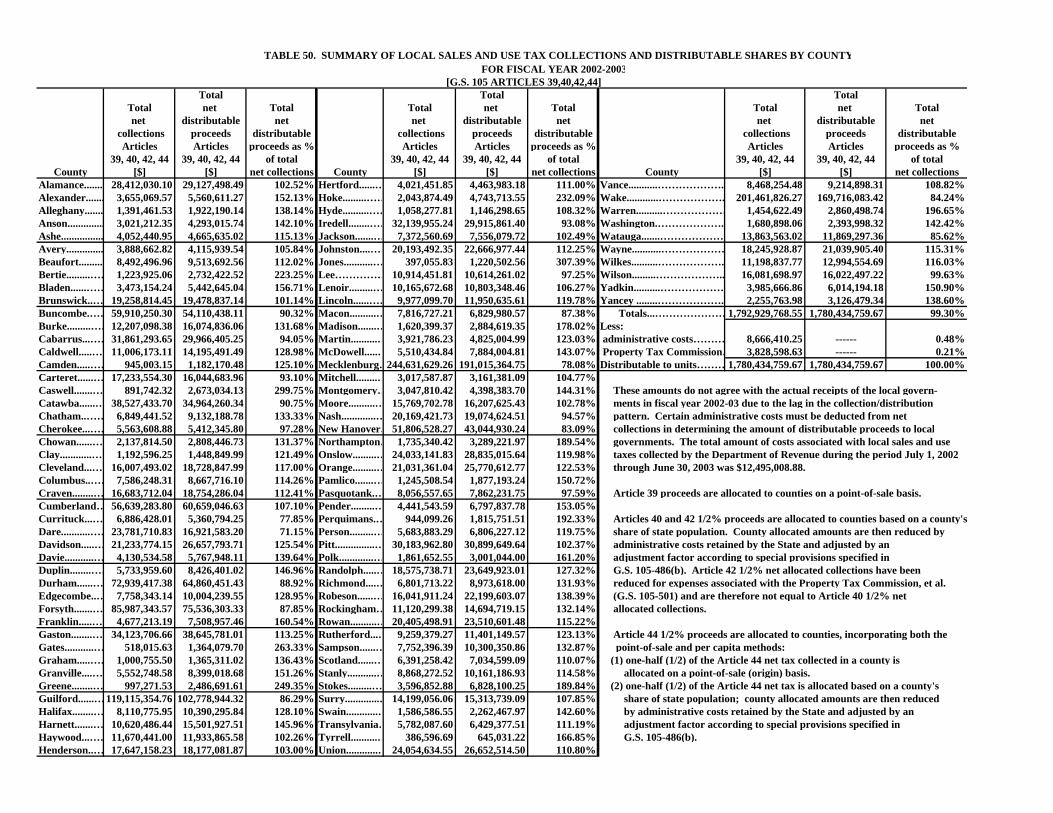
TABLE 50. SUMMARY OF LOCAL SALES AND USE TAX COLLECTIONS AND DISTRIBUTABLE SHARES BY COUNTY FOR FISCAL YEAR 2002-2003
[G.S. 105 ARTICLES 39,40,42,44]Total Total Total
Total net Total Total net Total Total net Totalnet distributable net net distributable net net distributable net
collections proceeds distributable collections proceeds distributable collections proceeds distributableArticles Articles proceeds as % Articles Articles proceeds as % Articles Articles proceeds as %
39, 40, 42, 44 39, 40, 42, 44 of total 39, 40, 42, 44 39, 40, 42, 44 of total 39, 40, 42, 44 39, 40, 42, 44 of totalCounty [$] [$] net collections County [$] [$] net collections County [$] [$] net collections
Alamance....... 28,412,030.10 29,127,498.49 102.52% Hertford......… 4,021,451.85 4,463,983.18 111.00% Vance...........………………. 8,468,254.48 9,214,898.31 108.82%Alexander....... 3,655,069.57 5,560,611.27 152.13% Hoke.........…… 2,043,874.49 4,743,713.55 232.09% Wake............………………. 201,461,826.27 169,716,083.42 84.24%Alleghany....... 1,391,461.53 1,922,190.14 138.14% Hyde..........…… 1,058,277.81 1,146,298.65 108.32% Warren..........……………… 1,454,622.49 2,860,498.74 196.65%Anson.............. 3,021,212.35 4,293,015.74 142.10% Iredell........……32,139,955.24 29,915,861.40 93.08% Washington.………………. 1,680,898.06 2,393,998.32 142.42%Ashe................ 4,052,440.95 4,665,635.02 115.13% Jackson.......… 7,372,560.69 7,556,079.72 102.49% Watauga.......……………… 13,863,563.02 11,869,297.36 85.62%Avery.............. 3,888,662.82 4,115,939.54 105.84% Johnston....……20,193,492.35 22,666,977.44 112.25% Wayne...........……………… 18,245,928.87 21,039,905.40 115.31%Beaufort......... 8,492,496.96 9,513,692.56 112.02% Jones...........… 397,055.83 1,220,502.56 307.39% Wilkes..........………………. 11,198,837.77 12,994,554.69 116.03%Bertie.........…… 1,223,925.06 2,732,422.52 223.25% Lee…………… 10,914,451.81 10,614,261.02 97.25% Wilson.........……………….. 16,081,698.97 16,022,497.22 99.63%Bladen......…… 3,473,154.24 5,442,645.04 156.71% Lenoir.........… 10,165,672.68 10,803,348.46 106.27% Yadkin..........……………… 3,985,666.86 6,014,194.18 150.90%Brunswick..… 19,258,814.45 19,478,837.14 101.14% Lincoln......…… 9,977,099.70 11,950,635.61 119.78% Yancey ........………………. 2,255,763.98 3,126,479.34 138.60%Buncombe.……59,910,250.30 54,110,438.11 90.32% Macon..........… 7,816,727.21 6,829,980.57 87.38% Totals...…………………1,792,929,768.55 1,780,434,759.67 99.30%Burke.........……12,207,098.38 16,074,836.06 131.68% Madison.......… 1,620,399.37 2,884,619.35 178.02% Less:Cabarrus...……31,861,293.65 29,966,405.25 94.05% Martin..........… 3,921,786.23 4,825,004.99 123.03% administrative costs……… 8,666,410.25 ------ 0.48%Caldwell.....… 11,006,173.11 14,195,491.49 128.98% McDowell.....… 5,510,434.84 7,884,004.81 143.07% Property Tax Commission… 3,828,598.63 ------ 0.21%Camden.....…… 945,003.15 1,182,170.48 125.10% Mecklenburg…244,631,629.26 191,015,364.75 78.08% Distributable to units………1,780,434,759.67 1,780,434,759.67 100.00%Carteret......… 17,233,554.30 16,044,683.96 93.10% Mitchell........… 3,017,587.87 3,161,381.09 104.77%Caswell.......… 891,742.32 2,673,034.13 299.75% Montgomery… 3,047,810.42 4,398,383.70 144.31% These amounts do not agree with the actual receipts of the local govern- Catawba......… 38,527,433.70 34,964,260.34 90.75% Moore..........… 15,769,702.78 16,207,625.43 102.78% ments in fiscal year 2002-03 due to the lag in the collection/distribution Chatham..…… 6,849,441.52 9,132,188.78 133.33% Nash.............… 20,169,421.73 19,074,624.51 94.57% pattern. Certain administrative costs must be deducted from net Cherokee...…… 5,563,608.88 5,412,345.80 97.28% New Hanover…51,806,528.27 43,044,930.24 83.09% collections in determining the amount of distributable proceeds to localChowan......… 2,137,814.50 2,808,446.73 131.37% Northampton… 1,735,340.42 3,289,221.97 189.54% governments. The total amount of costs associated with local sales and useClay............… 1,192,596.25 1,448,849.99 121.49% Onslow.........… 24,033,141.83 28,835,015.64 119.98% taxes collected by the Department of Revenue during the period July 1, 2002Cleveland...… 16,007,493.02 18,728,847.99 117.00% Orange.........… 21,031,361.04 25,770,612.77 122.53% through June 30, 2003 was $12,495,008.88. Columbus..…… 7,586,248.31 8,667,716.10 114.26% Pamlico.......… 1,245,508.54 1,877,193.24 150.72%Craven........… 16,683,712.04 18,754,286.04 112.41% Pasquotank.… 8,056,557.65 7,862,231.75 97.59% Article 39 proceeds are allocated to counties on a point-of-sale basis.Cumberland… 56,639,283.80 60,659,046.63 107.10% Pender.........… 4,441,543.59 6,797,837.78 153.05%Currituck...… 6,886,428.01 5,360,794.25 77.85% Perquimans.… 944,099.26 1,815,751.51 192.33% Articles 40 and 42 1/2% proceeds are allocated to counties based on a county's Dare...........……23,781,710.83 16,921,583.20 71.15% Person.........… 5,683,883.29 6,806,227.12 119.75% share of state population. County allocated amounts are then reduced by Davidson.....… 21,233,774.15 26,657,793.71 125.54% Pitt...............… 30,183,962.80 30,899,649.64 102.37% administrative costs retained by the State and adjusted by an Davie...........… 4,130,534.58 5,767,948.11 139.64% Polk.............… 1,861,652.55 3,001,044.00 161.20% adjustment factor according to special provisions specified in Duplin........…… 5,733,959.60 8,426,401.02 146.96% Randolph.....… 18,575,738.71 23,649,923.01 127.32% G.S. 105-486(b). Article 42 1/2% net allocated collections have beenDurham......… 72,939,417.38 64,860,451.43 88.92% Richmond....… 6,801,713.22 8,973,618.00 131.93% reduced for expenses associated with the Property Tax Commission, et al.Edgecombe..… 7,758,343.14 10,004,239.55 128.95% Robeson......… 16,041,911.24 22,199,603.07 138.39% (G.S. 105-501) and are therefore not equal to Article 40 1/2% net Forsyth.......… 85,987,343.57 75,536,303.33 87.85% Rockingham… 11,120,299.38 14,694,719.15 132.14% allocated collections.Franklin.....… 4,677,213.19 7,508,957.46 160.54% Rowan..........… 20,405,498.91 23,510,601.48 115.22%Gaston........… 34,123,706.66 38,645,781.01 113.25% Rutherford...… 9,259,379.27 11,401,149.57 123.13% Article 44 1/2% proceeds are allocated to counties, incorporating both the Gates...........… 518,015.63 1,364,079.70 263.33% Sampson......… 7,752,396.39 10,300,350.86 132.87% point-of-sale and per capita methods:Graham.....…… 1,000,755.50 1,365,311.02 136.43% Scotland......… 6,391,258.42 7,034,599.09 110.07% (1) one-half (1/2) of the Article 44 net tax collected in a county is Granville....… 5,552,748.58 8,399,018.68 151.26% Stanly...........… 8,868,272.52 10,161,186.93 114.58% allocated on a point-of-sale (origin) basis. Greene........… 997,271.53 2,486,691.61 249.35% Stokes.........… 3,596,852.88 6,828,100.25 189.84% (2) one-half (1/2) of the Article 44 net tax is allocated based on a county's Guilford......… 119,115,354.76 102,778,944.32 86.29% Surry.............… 14,199,056.06 15,313,739.09 107.85% share of state population; county allocated amounts are then reduced Halifax........… 8,110,775.95 10,390,295.84 128.10% Swain............… 1,586,586.55 2,262,467.97 142.60% by administrative costs retained by the State and adjusted by an Harnett.......… 10,620,486.44 15,501,927.51 145.96% Transylvania… 5,782,087.60 6,429,377.51 111.19% adjustment factor according to special provisions specified in Haywood...……11,670,441.00 11,933,865.58 102.26% Tyrrell..........… 386,596.69 645,031.22 166.85% G.S. 105-486(b). Henderson..… 17,647,158.23 18,177,081.87 103.00% Union............… 24,054,634.55 26,652,514.50 110.80%
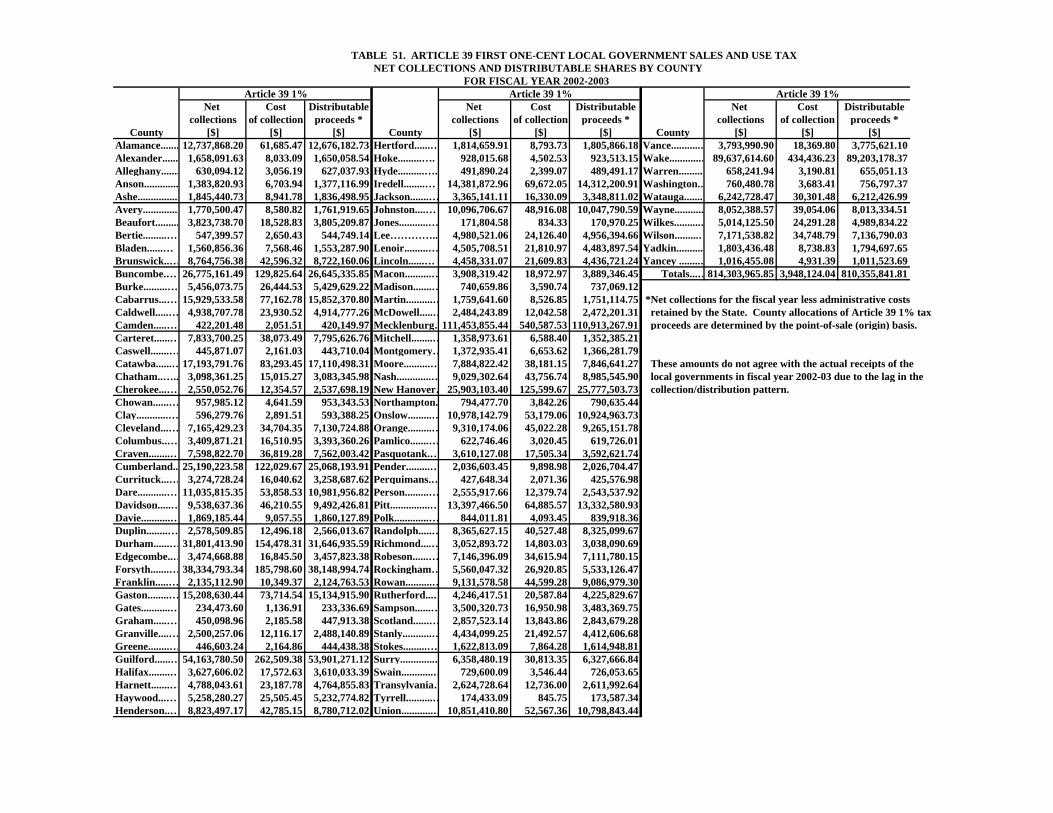
TABLE 51. ARTICLE 39 FIRST ONE-CENT LOCAL GOVERNMENT SALES AND USE TAX NET COLLECTIONS AND DISTRIBUTABLE SHARES BY COUNTY
FOR FISCAL YEAR 2002-2003Article 39 1% Article 39 1% Article 39 1%
Net Cost Distributable Net Cost Distributable Net Cost Distributablecollections of collection proceeds * collections of collection proceeds * collections of collection proceeds *
County [$] [$] [$] County [$] [$] [$] County [$] [$] [$]Alamance....... 12,737,868.20 61,685.47 12,676,182.73 Hertford......… 1,814,659.91 8,793.73 1,805,866.18 Vance...........… 3,793,990.90 18,369.80 3,775,621.10Alexander...... 1,658,091.63 8,033.09 1,650,058.54 Hoke.........…. 928,015.68 4,502.53 923,513.15 Wake............…89,637,614.60 434,436.23 89,203,178.37Alleghany....... 630,094.12 3,056.19 627,037.93 Hyde..........…. 491,890.24 2,399.07 489,491.17 Warren.......... 658,241.94 3,190.81 655,051.13Anson............. 1,383,820.93 6,703.94 1,377,116.99 Iredell........… 14,381,872.96 69,672.05 14,312,200.91 Washington.… 760,480.78 3,683.41 756,797.37Ashe................ 1,845,440.73 8,941.78 1,836,498.95 Jackson.......… 3,365,141.11 16,330.09 3,348,811.02 Watauga....... 6,242,728.47 30,301.48 6,212,426.99Avery.............. 1,770,500.47 8,580.82 1,761,919.65 Johnston....… 10,096,706.67 48,916.08 10,047,790.59 Wayne........... 8,052,388.57 39,054.06 8,013,334.51Beaufort......... 3,823,738.70 18,528.83 3,805,209.87 Jones...........… 171,804.58 834.33 170,970.25 Wilkes..........… 5,014,125.50 24,291.28 4,989,834.22Bertie.........… 547,399.57 2,650.43 544,749.14 Lee………….. 4,980,521.06 24,126.40 4,956,394.66 Wilson.........… 7,171,538.82 34,748.79 7,136,790.03Bladen......… 1,560,856.36 7,568.46 1,553,287.90 Lenoir.........… 4,505,708.51 21,810.97 4,483,897.54 Yadkin.......... 1,803,436.48 8,738.83 1,794,697.65Brunswick..… 8,764,756.38 42,596.32 8,722,160.06 Lincoln......… 4,458,331.07 21,609.83 4,436,721.24 Yancey ........… 1,016,455.08 4,931.39 1,011,523.69Buncombe.… 26,775,161.49 129,825.64 26,645,335.85 Macon..........… 3,908,319.42 18,972.97 3,889,346.45 Totals...…814,303,965.85 3,948,124.04 810,355,841.81Burke.........… 5,456,073.75 26,444.53 5,429,629.22 Madison.......… 740,659.86 3,590.74 737,069.12Cabarrus...… 15,929,533.58 77,162.78 15,852,370.80 Martin..........… 1,759,641.60 8,526.85 1,751,114.75 *Net collections for the fiscal year less administrative costs Caldwell.....… 4,938,707.78 23,930.52 4,914,777.26 McDowell.....… 2,484,243.89 12,042.58 2,472,201.31 retained by the State. County allocations of Article 39 1% tax Camden.....… 422,201.48 2,051.51 420,149.97 Mecklenburg…111,453,855.44 540,587.53 110,913,267.91 proceeds are determined by the point-of-sale (origin) basis. Carteret......… 7,833,700.25 38,073.49 7,795,626.76 Mitchell........… 1,358,973.61 6,588.40 1,352,385.21 Caswell.......… 445,871.07 2,161.03 443,710.04 Montgomery… 1,372,935.41 6,653.62 1,366,281.79 Catawba......…17,193,791.76 83,293.45 17,110,498.31 Moore..........… 7,884,822.42 38,181.15 7,846,641.27 These amounts do not agree with the actual receipts of theChatham..….. 3,098,361.25 15,015.27 3,083,345.98 Nash.............… 9,029,302.64 43,756.74 8,985,545.90 local governments in fiscal year 2002-03 due to the lag in theCherokee...… 2,550,052.76 12,354.57 2,537,698.19 New Hanover…25,903,103.40 125,599.67 25,777,503.73 collection/distribution pattern. Chowan......… 957,985.12 4,641.59 953,343.53 Northampton. 794,477.70 3,842.26 790,635.44Clay............… 596,279.76 2,891.51 593,388.25 Onslow.........… 10,978,142.79 53,179.06 10,924,963.73Cleveland...… 7,165,429.23 34,704.35 7,130,724.88 Orange.........… 9,310,174.06 45,022.28 9,265,151.78Columbus..… 3,409,871.21 16,510.95 3,393,360.26 Pamlico.......… 622,746.46 3,020.45 619,726.01Craven........… 7,598,822.70 36,819.28 7,562,003.42 Pasquotank.… 3,610,127.08 17,505.34 3,592,621.74Cumberland.. 25,190,223.58 122,029.67 25,068,193.91 Pender.........… 2,036,603.45 9,898.98 2,026,704.47Currituck...… 3,274,728.24 16,040.62 3,258,687.62 Perquimans.… 427,648.34 2,071.36 425,576.98Dare...........… 11,035,815.35 53,858.53 10,981,956.82 Person.........… 2,555,917.66 12,379.74 2,543,537.92Davidson.....… 9,538,637.36 46,210.55 9,492,426.81 Pitt...............… 13,397,466.50 64,885.57 13,332,580.93Davie...........… 1,869,185.44 9,057.55 1,860,127.89 Polk.............… 844,011.81 4,093.45 839,918.36Duplin........… 2,578,509.85 12,496.18 2,566,013.67 Randolph.....… 8,365,627.15 40,527.48 8,325,099.67Durham......… 31,801,413.90 154,478.31 31,646,935.59 Richmond....… 3,052,893.72 14,803.03 3,038,090.69Edgecombe..… 3,474,668.88 16,845.50 3,457,823.38 Robeson......… 7,146,396.09 34,615.94 7,111,780.15Forsyth.......… 38,334,793.34 185,798.60 38,148,994.74 Rockingham… 5,560,047.32 26,920.85 5,533,126.47Franklin.....… 2,135,112.90 10,349.37 2,124,763.53 Rowan..........… 9,131,578.58 44,599.28 9,086,979.30Gaston........… 15,208,630.44 73,714.54 15,134,915.90 Rutherford...… 4,246,417.51 20,587.84 4,225,829.67Gates...........… 234,473.60 1,136.91 233,336.69 Sampson......… 3,500,320.73 16,950.98 3,483,369.75Graham.....… 450,098.96 2,185.58 447,913.38 Scotland......… 2,857,523.14 13,843.86 2,843,679.28Granville....… 2,500,257.06 12,116.17 2,488,140.89 Stanly...........… 4,434,099.25 21,492.57 4,412,606.68Greene........… 446,603.24 2,164.86 444,438.38 Stokes.........… 1,622,813.09 7,864.28 1,614,948.81Guilford......… 54,163,780.50 262,509.38 53,901,271.12 Surry.............… 6,358,480.19 30,813.35 6,327,666.84Halifax........… 3,627,606.02 17,572.63 3,610,033.39 Swain............… 729,600.09 3,546.44 726,053.65Harnett.......… 4,788,043.61 23,187.78 4,764,855.83 Transylvania… 2,624,728.64 12,736.00 2,611,992.64Haywood...… 5,258,280.27 25,505.45 5,232,774.82 Tyrrell..........… 174,433.09 845.75 173,587.34Henderson..… 8,823,497.17 42,785.15 8,780,712.02 Union............… 10,851,410.80 52,567.36 10,798,843.44
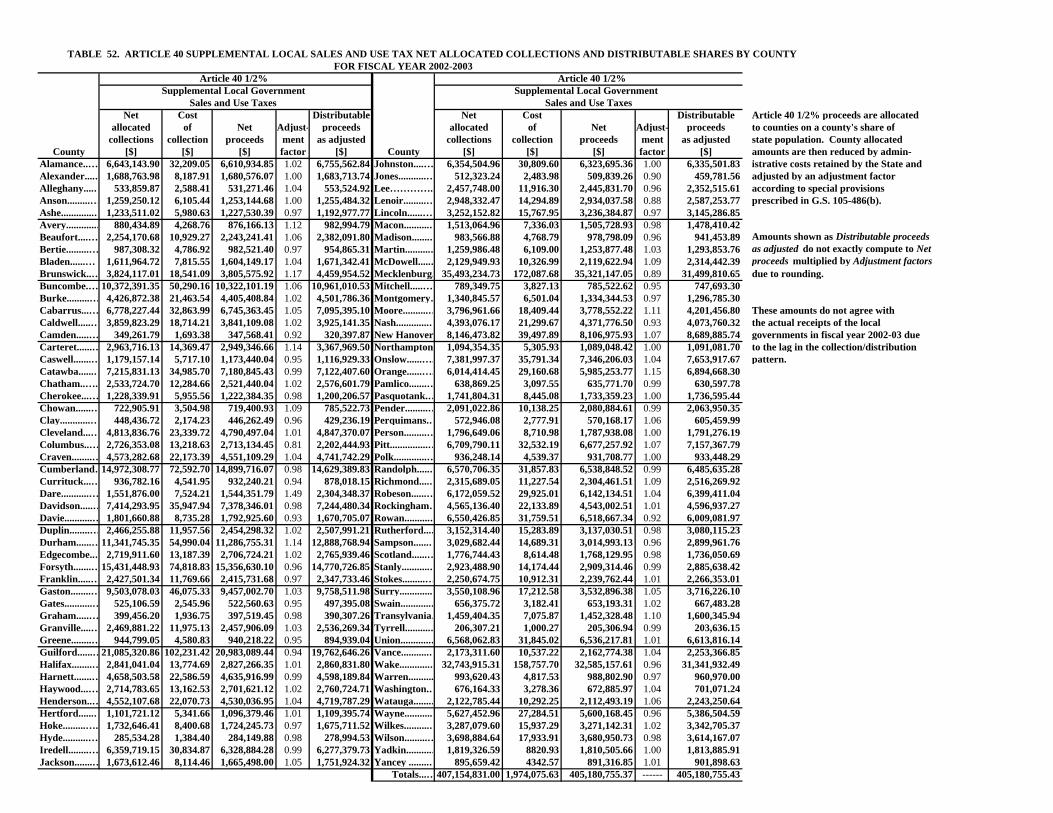
TABLE 52. ARTICLE 40 SUPPLEMENTAL LOCAL SALES AND USE TAX NET ALLOCATED COLLECTIONS AND DISTRIBUTABLE SHARES BY COUNTY FOR FISCAL YEAR 2002-2003
Article 40 1/2% Article 40 1/2% Supplemental Local Government Supplemental Local Government Sales and Use Taxes Sales and Use Taxes
Net Cost Distributable Net Cost Distributable Article 40 1/2% proceeds are allocated allocated of Net Adjust- proceeds allocated of Net Adjust- proceeds to counties on a county's share of
collections collection proceeds ment as adjusted collections collection proceeds ment as adjusted state population. County allocated County [$] [$] [$] factor [$] County [$] [$] [$] factor [$] amounts are then reduced by admin-
Alamance..… 6,643,143.90 32,209.05 6,610,934.85 1.02 6,755,562.84 Johnston....… 6,354,504.96 30,809.60 6,323,695.36 1.00 6,335,501.83 istrative costs retained by the State andAlexander....… 1,688,763.98 8,187.91 1,680,576.07 1.00 1,683,713.74 Jones...........… 512,323.24 2,483.98 509,839.26 0.90 459,781.56 adjusted by an adjustment factorAlleghany....… 533,859.87 2,588.41 531,271.46 1.04 553,524.92 Lee………….. 2,457,748.00 11,916.30 2,445,831.70 0.96 2,352,515.61 according to special provisions Anson.........… 1,259,250.12 6,105.44 1,253,144.68 1.00 1,255,484.32 Lenoir.........… 2,948,332.47 14,294.89 2,934,037.58 0.88 2,587,253.77 prescribed in G.S. 105-486(b).Ashe.............… 1,233,511.02 5,980.63 1,227,530.39 0.97 1,192,977.77 Lincoln......… 3,252,152.82 15,767.95 3,236,384.87 0.97 3,145,286.85Avery............… 880,434.89 4,268.76 876,166.13 1.12 982,994.79 Macon..........… 1,513,064.96 7,336.03 1,505,728.93 0.98 1,478,410.42Beaufort....… 2,254,170.68 10,929.27 2,243,241.41 1.06 2,382,091.80 Madison.......… 983,566.88 4,768.79 978,798.09 0.96 941,453.89 Amounts shown as Distributable proceedsBertie.........… 987,308.32 4,786.92 982,521.40 0.97 954,865.31 Martin..........… 1,259,986.48 6,109.00 1,253,877.48 1.03 1,293,853.76 as adjusted do not exactly compute to Net Bladen......… 1,611,964.72 7,815.55 1,604,149.17 1.04 1,671,342.41 McDowell.....… 2,129,949.93 10,326.99 2,119,622.94 1.09 2,314,442.39 proceeds multiplied by Adjustment factors Brunswick..… 3,824,117.01 18,541.09 3,805,575.92 1.17 4,459,954.52 Mecklenburg. 35,493,234.73 172,087.68 35,321,147.05 0.89 31,499,810.65 due to rounding.Buncombe.… 10,372,391.35 50,290.16 10,322,101.19 1.06 10,961,010.53 Mitchell.....…. 789,349.75 3,827.13 785,522.62 0.95 747,693.30Burke.........… 4,426,872.38 21,463.54 4,405,408.84 1.02 4,501,786.36 Montgomery… 1,340,845.57 6,501.04 1,334,344.53 0.97 1,296,785.30Cabarrus...… 6,778,227.44 32,863.99 6,745,363.45 1.05 7,095,395.10 Moore..........… 3,796,961.66 18,409.44 3,778,552.22 1.11 4,201,456.80 These amounts do not agree withCaldwell.....… 3,859,823.29 18,714.21 3,841,109.08 1.02 3,925,141.35 Nash.............… 4,393,076.17 21,299.67 4,371,776.50 0.93 4,073,760.32 the actual receipts of the local Camden.....… 349,261.79 1,693.38 347,568.41 0.92 320,397.87 New Hanover 8,146,473.82 39,497.89 8,106,975.93 1.07 8,689,885.74 governments in fiscal year 2002-03 dueCarteret......… 2,963,716.13 14,369.47 2,949,346.66 1.14 3,367,969.50 Northampton. 1,094,354.35 5,305.93 1,089,048.42 1.00 1,091,081.70 to the lag in the collection/distribution Caswell.......… 1,179,157.14 5,717.10 1,173,440.04 0.95 1,116,929.33 Onslow......…. 7,381,997.37 35,791.34 7,346,206.03 1.04 7,653,917.67 pattern. Catawba......… 7,215,831.13 34,985.70 7,180,845.43 0.99 7,122,407.60 Orange......…. 6,014,414.45 29,160.68 5,985,253.77 1.15 6,894,668.30Chatham..….. 2,533,724.70 12,284.66 2,521,440.04 1.02 2,576,601.79 Pamlico.......… 638,869.25 3,097.55 635,771.70 0.99 630,597.78Cherokee...… 1,228,339.91 5,955.56 1,222,384.35 0.98 1,200,206.57 Pasquotank.… 1,741,804.31 8,445.08 1,733,359.23 1.00 1,736,595.44Chowan......… 722,905.91 3,504.98 719,400.93 1.09 785,522.73 Pender.........… 2,091,022.86 10,138.25 2,080,884.61 0.99 2,063,950.35Clay............… 448,436.72 2,174.23 446,262.49 0.96 429,236.19 Perquimans.… 572,946.08 2,777.91 570,168.17 1.06 605,459.99Cleveland...… 4,813,836.76 23,339.72 4,790,497.04 1.01 4,847,370.07 Person.........… 1,796,649.06 8,710.98 1,787,938.08 1.00 1,791,276.19Columbus..… 2,726,353.08 13,218.63 2,713,134.45 0.81 2,202,444.93 Pitt...............… 6,709,790.11 32,532.19 6,677,257.92 1.07 7,157,367.79Craven........… 4,573,282.68 22,173.39 4,551,109.29 1.04 4,741,742.29 Polk.............… 936,248.14 4,539.37 931,708.77 1.00 933,448.29Cumberland…14,972,308.77 72,592.70 14,899,716.07 0.98 14,629,389.83 Randolph.....… 6,570,706.35 31,857.83 6,538,848.52 0.99 6,485,635.28Currituck...… 936,782.16 4,541.95 932,240.21 0.94 878,018.15 Richmond....… 2,315,689.05 11,227.54 2,304,461.51 1.09 2,516,269.92Dare...........… 1,551,876.00 7,524.21 1,544,351.79 1.49 2,304,348.37 Robeson......… 6,172,059.52 29,925.01 6,142,134.51 1.04 6,399,411.04Davidson.....… 7,414,293.95 35,947.94 7,378,346.01 0.98 7,244,480.34 Rockingham… 4,565,136.40 22,133.89 4,543,002.51 1.01 4,596,937.27Davie...........… 1,801,660.88 8,735.28 1,792,925.60 0.93 1,670,705.07 Rowan..........… 6,550,426.85 31,759.51 6,518,667.34 0.92 6,009,081.97Duplin........… 2,466,255.88 11,957.56 2,454,298.32 1.02 2,507,991.21 Rutherford...… 3,152,314.40 15,283.89 3,137,030.51 0.98 3,080,115.23Durham......…11,341,745.35 54,990.04 11,286,755.31 1.14 12,888,768.94 Sampson......… 3,029,682.44 14,689.31 3,014,993.13 0.96 2,899,961.76Edgecombe..… 2,719,911.60 13,187.39 2,706,724.21 1.02 2,765,939.46 Scotland......… 1,776,744.43 8,614.48 1,768,129.95 0.98 1,736,050.69Forsyth.......…15,431,448.93 74,818.83 15,356,630.10 0.96 14,770,726.85 Stanly...........… 2,923,488.90 14,174.44 2,909,314.46 0.99 2,885,638.42Franklin.....… 2,427,501.34 11,769.66 2,415,731.68 0.97 2,347,733.46 Stokes.........… 2,250,674.75 10,912.31 2,239,762.44 1.01 2,266,353.01Gaston........… 9,503,078.03 46,075.33 9,457,002.70 1.03 9,758,511.98 Surry.............… 3,550,108.96 17,212.58 3,532,896.38 1.05 3,716,226.10Gates...........… 525,106.59 2,545.96 522,560.63 0.95 497,395.08 Swain............… 656,375.72 3,182.41 653,193.31 1.02 667,483.28Graham.....… 399,456.20 1,936.75 397,519.45 0.98 390,307.26 Transylvania… 1,459,404.35 7,075.87 1,452,328.48 1.10 1,600,345.94Granville....… 2,469,881.22 11,975.13 2,457,906.09 1.03 2,536,269.34 Tyrrell..........… 206,307.21 1,000.27 205,306.94 0.99 203,636.15Greene........… 944,799.05 4,580.83 940,218.22 0.95 894,939.04 Union............… 6,568,062.83 31,845.02 6,536,217.81 1.01 6,613,816.14Guilford......…21,085,320.86 102,231.42 20,983,089.44 0.94 19,762,646.26 Vance...........… 2,173,311.60 10,537.22 2,162,774.38 1.04 2,253,366.85Halifax........… 2,841,041.04 13,774.69 2,827,266.35 1.01 2,860,831.80 Wake............… 32,743,915.31 158,757.70 32,585,157.61 0.96 31,341,932.49Harnett.......… 4,658,503.58 22,586.59 4,635,916.99 0.99 4,598,189.84 Warren.......... 993,620.43 4,817.53 988,802.90 0.97 960,970.00Haywood...… 2,714,783.65 13,162.53 2,701,621.12 1.02 2,760,724.71 Washington.… 676,164.33 3,278.36 672,885.97 1.04 701,071.24Henderson..… 4,552,107.68 22,070.73 4,530,036.95 1.04 4,719,787.29 Watauga.......… 2,122,785.44 10,292.25 2,112,493.19 1.06 2,243,250.64Hertford......… 1,101,721.12 5,341.66 1,096,379.46 1.01 1,109,395.74 Wayne...........… 5,627,452.96 27,284.51 5,600,168.45 0.96 5,386,504.59Hoke.........…. 1,732,646.41 8,400.68 1,724,245.73 0.97 1,675,711.52 Wilkes..........… 3,287,079.60 15,937.29 3,271,142.31 1.02 3,342,705.37Hyde..........… 285,534.28 1,384.40 284,149.88 0.98 278,994.53 Wilson.........… 3,698,884.64 17,933.91 3,680,950.73 0.98 3,614,167.07Iredell........… 6,359,719.15 30,834.87 6,328,884.28 0.99 6,277,379.73 Yadkin..........… 1,819,326.59 8820.93 1,810,505.66 1.00 1,813,885.91Jackson.......… 1,673,612.46 8,114.46 1,665,498.00 1.05 1,751,924.32 Yancey ........… 895,659.42 4342.57 891,316.85 1.01 901,898.63
Totals...…407,154,831.00 1,974,075.63 405,180,755.37 ------ 405,180,755.43
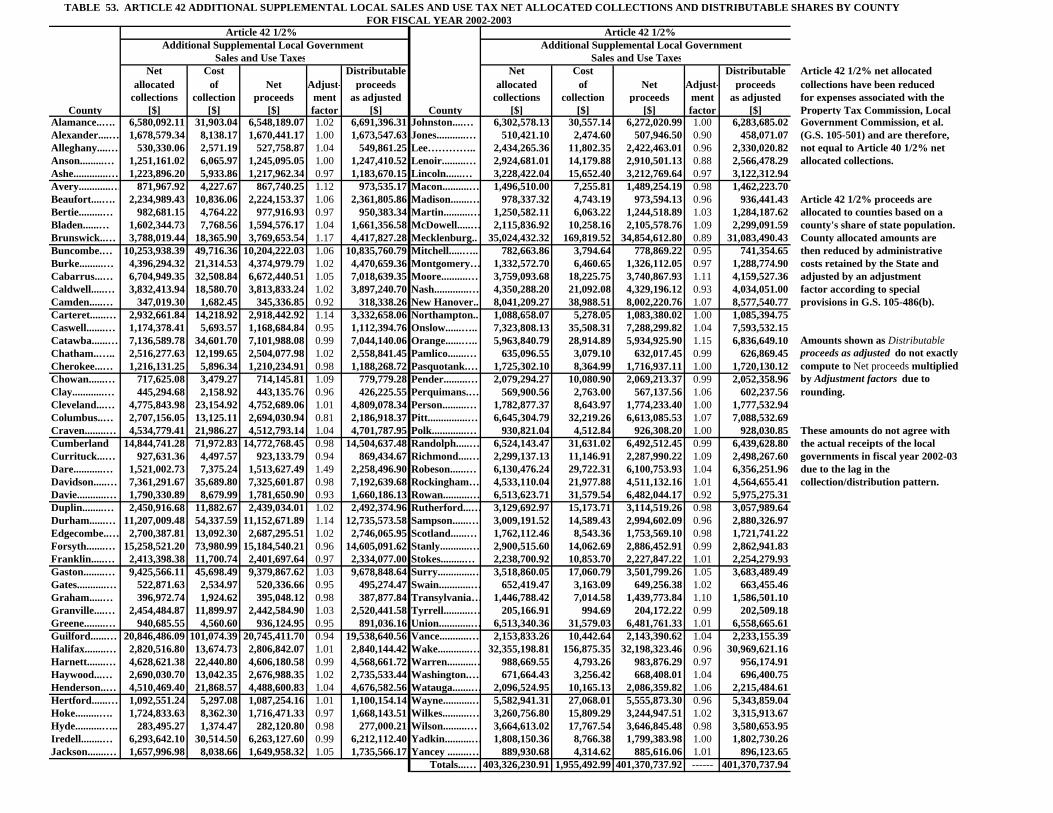
TABLE 53. ARTICLE 42 ADDITIONAL SUPPLEMENTAL LOCAL SALES AND USE TAX NET ALLOCATED COLLECTIONS AND DISTRIBUTABLE SHARES BY COUNTY FOR FISCAL YEAR 2002-2003
Article 42 1/2% Article 42 1/2% Additional Supplemental Local Government Additional Supplemental Local Government Sales and Use Taxes Sales and Use Taxes
Net Cost Distributable Net Cost Distributable Article 42 1/2% net allocated allocated of Net Adjust- proceeds allocated of Net Adjust- proceeds collections have been reduced
collections collection proceeds ment as adjusted collections collection proceeds ment as adjusted for expenses associated with the County [$] [$] [$] factor [$] County [$] [$] [$] factor [$] Property Tax Commission, Local
Alamance..…. 6,580,092.11 31,903.04 6,548,189.07 1.02 6,691,396.31 Johnston....… 6,302,578.13 30,557.14 6,272,020.99 1.00 6,283,685.02 Government Commission, et al. Alexander....… 1,678,579.34 8,138.17 1,670,441.17 1.00 1,673,547.63 Jones...........… 510,421.10 2,474.60 507,946.50 0.90 458,071.07 (G.S. 105-501) and are therefore, Alleghany....… 530,330.06 2,571.19 527,758.87 1.04 549,861.25 Lee………….. 2,434,265.36 11,802.35 2,422,463.01 0.96 2,330,020.82 not equal to Article 40 1/2% net Anson.........… 1,251,161.02 6,065.97 1,245,095.05 1.00 1,247,410.52 Lenoir.........… 2,924,681.01 14,179.88 2,910,501.13 0.88 2,566,478.29 allocated collections.Ashe.............… 1,223,896.20 5,933.86 1,217,962.34 0.97 1,183,670.15 Lincoln......… 3,228,422.04 15,652.40 3,212,769.64 0.97 3,122,312.94Avery............… 871,967.92 4,227.67 867,740.25 1.12 973,535.17 Macon..........… 1,496,510.00 7,255.81 1,489,254.19 0.98 1,462,223.70Beaufort....…. 2,234,989.43 10,836.06 2,224,153.37 1.06 2,361,805.86 Madison.......… 978,337.32 4,743.19 973,594.13 0.96 936,441.43 Article 42 1/2% proceeds are Bertie.........… 982,681.15 4,764.22 977,916.93 0.97 950,383.34 Martin..........… 1,250,582.11 6,063.22 1,244,518.89 1.03 1,284,187.62 allocated to counties based on a Bladen......… 1,602,344.73 7,768.56 1,594,576.17 1.04 1,661,356.58 McDowell.....… 2,115,836.92 10,258.16 2,105,578.76 1.09 2,299,091.59 county's share of state population.Brunswick..… 3,788,019.44 18,365.90 3,769,653.54 1.17 4,417,827.28 Mecklenburg.. 35,024,432.32 169,819.52 34,854,612.80 0.89 31,083,490.43 County allocated amounts are Buncombe.… 10,253,938.39 49,716.36 10,204,222.03 1.06 10,835,760.79 Mitchell.....….. 782,663.86 3,794.64 778,869.22 0.95 741,354.65 then reduced by administrative Burke.........… 4,396,294.32 21,314.53 4,374,979.79 1.02 4,470,659.36 Montgomery… 1,332,572.70 6,460.65 1,326,112.05 0.97 1,288,774.90 costs retained by the State andCabarrus...… 6,704,949.35 32,508.84 6,672,440.51 1.05 7,018,639.35 Moore..........… 3,759,093.68 18,225.75 3,740,867.93 1.11 4,159,527.36 adjusted by an adjustment Caldwell.....… 3,832,413.94 18,580.70 3,813,833.24 1.02 3,897,240.70 Nash.............… 4,350,288.20 21,092.08 4,329,196.12 0.93 4,034,051.00 factor according to specialCamden.....… 347,019.30 1,682.45 345,336.85 0.92 318,338.26 New Hanover.. 8,041,209.27 38,988.51 8,002,220.76 1.07 8,577,540.77 provisions in G.S. 105-486(b).Carteret......… 2,932,661.84 14,218.92 2,918,442.92 1.14 3,332,658.06 Northampton.. 1,088,658.07 5,278.05 1,083,380.02 1.00 1,085,394.75Caswell.......… 1,174,378.41 5,693.57 1,168,684.84 0.95 1,112,394.76 Onslow......….. 7,323,808.13 35,508.31 7,288,299.82 1.04 7,593,532.15Catawba......… 7,136,589.78 34,601.70 7,101,988.08 0.99 7,044,140.06 Orange......….. 5,963,840.79 28,914.89 5,934,925.90 1.15 6,836,649.10 Amounts shown as Distributable Chatham..….. 2,516,277.63 12,199.65 2,504,077.98 1.02 2,558,841.45 Pamlico.......… 635,096.55 3,079.10 632,017.45 0.99 626,869.45 proceeds as adjusted do not exactlyCherokee...… 1,216,131.25 5,896.34 1,210,234.91 0.98 1,188,268.72 Pasquotank.… 1,725,302.10 8,364.99 1,716,937.11 1.00 1,720,130.12 compute to Net proceeds multiplied Chowan......… 717,625.08 3,479.27 714,145.81 1.09 779,779.28 Pender.........… 2,079,294.27 10,080.90 2,069,213.37 0.99 2,052,358.96 by Adjustment factors due toClay............… 445,294.68 2,158.92 443,135.76 0.96 426,225.55 Perquimans.… 569,900.56 2,763.00 567,137.56 1.06 602,237.56 rounding.Cleveland...… 4,775,843.98 23,154.92 4,752,689.06 1.01 4,809,078.34 Person.........… 1,782,877.37 8,643.97 1,774,233.40 1.00 1,777,532.94Columbus..… 2,707,156.05 13,125.11 2,694,030.94 0.81 2,186,918.37 Pitt...............… 6,645,304.79 32,219.26 6,613,085.53 1.07 7,088,532.69Craven........… 4,534,779.41 21,986.27 4,512,793.14 1.04 4,701,787.95 Polk.............… 930,821.04 4,512.84 926,308.20 1.00 928,030.85 These amounts do not agree with Cumberland 14,844,741.28 71,972.83 14,772,768.45 0.98 14,504,637.48 Randolph.....… 6,524,143.47 31,631.02 6,492,512.45 0.99 6,439,628.80 the actual receipts of the localCurrituck...… 927,631.36 4,497.57 923,133.79 0.94 869,434.67 Richmond....… 2,299,137.13 11,146.91 2,287,990.22 1.09 2,498,267.60 governments in fiscal year 2002-03Dare...........… 1,521,002.73 7,375.24 1,513,627.49 1.49 2,258,496.90 Robeson......… 6,130,476.24 29,722.31 6,100,753.93 1.04 6,356,251.96 due to the lag in the Davidson.....… 7,361,291.67 35,689.80 7,325,601.87 0.98 7,192,639.68 Rockingham… 4,533,110.04 21,977.88 4,511,132.16 1.01 4,564,655.41 collection/distribution pattern. Davie...........… 1,790,330.89 8,679.99 1,781,650.90 0.93 1,660,186.13 Rowan..........… 6,513,623.71 31,579.54 6,482,044.17 0.92 5,975,275.31Duplin........… 2,450,916.68 11,882.67 2,439,034.01 1.02 2,492,374.96 Rutherford...… 3,129,692.97 15,173.71 3,114,519.26 0.98 3,057,989.64Durham......… 11,207,009.48 54,337.59 11,152,671.89 1.14 12,735,573.58 Sampson......… 3,009,191.52 14,589.43 2,994,602.09 0.96 2,880,326.97Edgecombe..… 2,700,387.81 13,092.30 2,687,295.51 1.02 2,746,065.95 Scotland......… 1,762,112.46 8,543.36 1,753,569.10 0.98 1,721,741.22Forsyth.......… 15,258,521.20 73,980.99 15,184,540.21 0.96 14,605,091.62 Stanly...........… 2,900,515.60 14,062.69 2,886,452.91 0.99 2,862,941.83Franklin.....… 2,413,398.38 11,700.74 2,401,697.64 0.97 2,334,077.00 Stokes.........… 2,238,700.92 10,853.70 2,227,847.22 1.01 2,254,279.93Gaston........… 9,425,566.11 45,698.49 9,379,867.62 1.03 9,678,848.64 Surry.............… 3,518,860.05 17,060.79 3,501,799.26 1.05 3,683,489.49Gates...........… 522,871.63 2,534.97 520,336.66 0.95 495,274.47 Swain............… 652,419.47 3,163.09 649,256.38 1.02 663,455.46Graham.....… 396,972.74 1,924.62 395,048.12 0.98 387,877.84 Transylvania… 1,446,788.42 7,014.58 1,439,773.84 1.10 1,586,501.10Granville....… 2,454,484.87 11,899.97 2,442,584.90 1.03 2,520,441.58 Tyrrell..........… 205,166.91 994.69 204,172.22 0.99 202,509.18Greene........… 940,685.55 4,560.60 936,124.95 0.95 891,036.16 Union............… 6,513,340.36 31,579.03 6,481,761.33 1.01 6,558,665.61Guilford......… 20,846,486.09 101,074.39 20,745,411.70 0.94 19,538,640.56 Vance...........… 2,153,833.26 10,442.64 2,143,390.62 1.04 2,233,155.39Halifax........… 2,820,516.80 13,674.73 2,806,842.07 1.01 2,840,144.42 Wake............… 32,355,198.81 156,875.35 32,198,323.46 0.96 30,969,621.16Harnett.......… 4,628,621.38 22,440.80 4,606,180.58 0.99 4,568,661.72 Warren..........… 988,669.55 4,793.26 983,876.29 0.97 956,174.91Haywood...… 2,690,030.70 13,042.35 2,676,988.35 1.02 2,735,533.44 Washington.… 671,664.43 3,256.42 668,408.01 1.04 696,400.75Henderson..… 4,510,469.40 21,868.57 4,488,600.83 1.04 4,676,582.56 Watauga.......… 2,096,524.95 10,165.13 2,086,359.82 1.06 2,215,484.61Hertford......… 1,092,551.24 5,297.08 1,087,254.16 1.01 1,100,154.14 Wayne...........… 5,582,941.31 27,068.01 5,555,873.30 0.96 5,343,859.04Hoke.........…. 1,724,833.63 8,362.30 1,716,471.33 0.97 1,668,143.51 Wilkes..........… 3,260,756.80 15,809.29 3,244,947.51 1.02 3,315,913.67Hyde..........….. 283,495.27 1,374.47 282,120.80 0.98 277,000.21 Wilson.........… 3,664,613.02 17,767.54 3,646,845.48 0.98 3,580,653.95Iredell........… 6,293,642.10 30,514.50 6,263,127.60 0.99 6,212,112.40 Yadkin..........… 1,808,150.36 8,766.38 1,799,383.98 1.00 1,802,730.26Jackson.......… 1,657,996.98 8,038.66 1,649,958.32 1.05 1,735,566.17 Yancey ........… 889,930.68 4,314.62 885,616.06 1.01 896,123.65
Totals...… 403,326,230.91 1,955,492.99 401,370,737.92 ------ 401,370,737.94
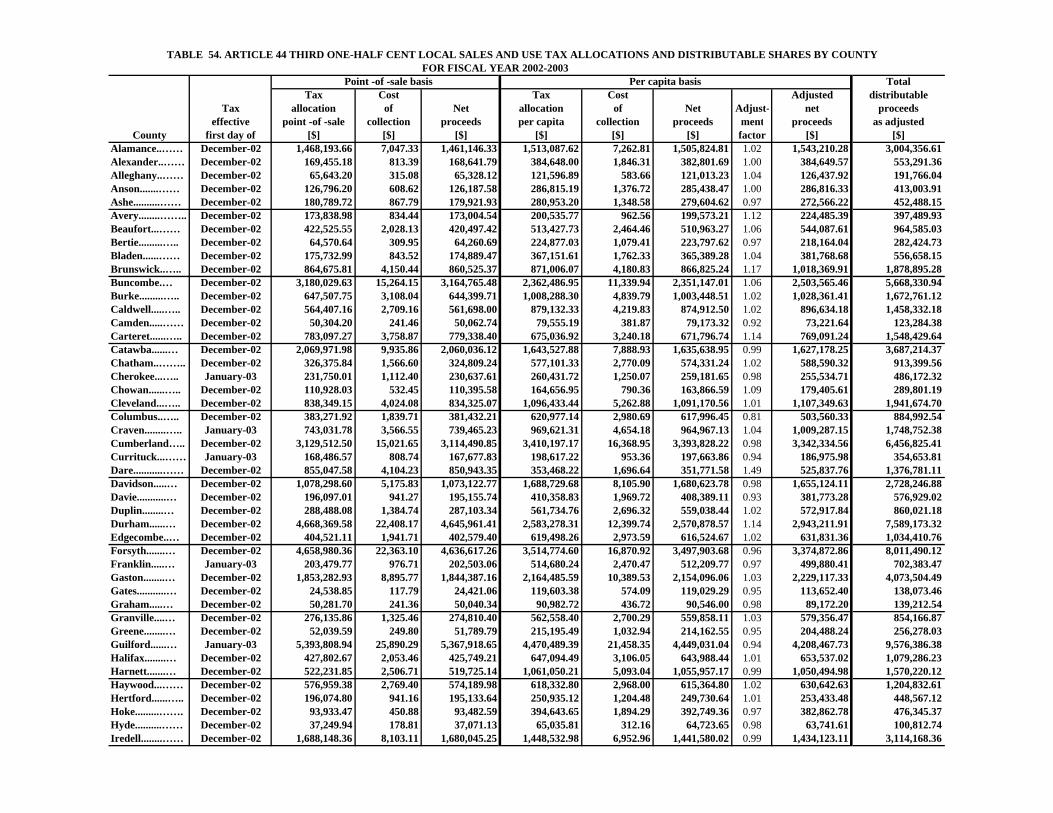
TABLE 54. ARTICLE 44 THIRD ONE-HALF CENT LOCAL SALES AND USE TAX ALLOCATIONS AND DISTRIBUTABLE SHARES BY COUNTY FOR FISCAL YEAR 2002-2003
Point -of -sale basis Per capita basis TotalTax Cost Tax Cost Adjusted distributable
Tax allocation of Net allocation of Net Adjust- net proceedseffective point -of -sale collection proceeds per capita collection proceeds ment proceeds as adjusted
County first day of [$] [$] [$] [$] [$] [$] factor [$] [$]Alamance..…… December-02 1,468,193.66 7,047.33 1,461,146.33 1,513,087.62 7,262.81 1,505,824.81 1.02 1,543,210.28 3,004,356.61Alexander..…… December-02 169,455.18 813.39 168,641.79 384,648.00 1,846.31 382,801.69 1.00 384,649.57 553,291.36Alleghany..…… December-02 65,643.20 315.08 65,328.12 121,596.89 583.66 121,013.23 1.04 126,437.92 191,766.04Anson.......…… December-02 126,796.20 608.62 126,187.58 286,815.19 1,376.72 285,438.47 1.00 286,816.33 413,003.91Ashe..........…… December-02 180,789.72 867.79 179,921.93 280,953.20 1,348.58 279,604.62 0.97 272,566.22 452,488.15Avery........…….. December-02 173,838.98 834.44 173,004.54 200,535.77 962.56 199,573.21 1.12 224,485.39 397,489.93Beaufort...…… December-02 422,525.55 2,028.13 420,497.42 513,427.73 2,464.46 510,963.27 1.06 544,087.61 964,585.03Bertie.........….. December-02 64,570.64 309.95 64,260.69 224,877.03 1,079.41 223,797.62 0.97 218,164.04 282,424.73Bladen......…… December-02 175,732.99 843.52 174,889.47 367,151.61 1,762.33 365,389.28 1.04 381,768.68 556,658.15Brunswick..….. December-02 864,675.81 4,150.44 860,525.37 871,006.07 4,180.83 866,825.24 1.17 1,018,369.91 1,878,895.28Buncombe.… December-02 3,180,029.63 15,264.15 3,164,765.48 2,362,486.95 11,339.94 2,351,147.01 1.06 2,503,565.46 5,668,330.94Burke.........….. December-02 647,507.75 3,108.04 644,399.71 1,008,288.30 4,839.79 1,003,448.51 1.02 1,028,361.41 1,672,761.12Caldwell.....….. December-02 564,407.16 2,709.16 561,698.00 879,132.33 4,219.83 874,912.50 1.02 896,634.18 1,458,332.18Camden.....…… December-02 50,304.20 241.46 50,062.74 79,555.19 381.87 79,173.32 0.92 73,221.64 123,284.38Carteret......….. December-02 783,097.27 3,758.87 779,338.40 675,036.92 3,240.18 671,796.74 1.14 769,091.24 1,548,429.64Catawba......… December-02 2,069,971.98 9,935.86 2,060,036.12 1,643,527.88 7,888.93 1,635,638.95 0.99 1,627,178.25 3,687,214.37Chatham..…….. December-02 326,375.84 1,566.60 324,809.24 577,101.33 2,770.09 574,331.24 1.02 588,590.32 913,399.56Cherokee...….. January-03 231,750.01 1,112.40 230,637.61 260,431.72 1,250.07 259,181.65 0.98 255,534.71 486,172.32Chowan......….. December-02 110,928.03 532.45 110,395.58 164,656.95 790.36 163,866.59 1.09 179,405.61 289,801.19Cleveland...….. December-02 838,349.15 4,024.08 834,325.07 1,096,433.44 5,262.88 1,091,170.56 1.01 1,107,349.63 1,941,674.70Columbus..….. December-02 383,271.92 1,839.71 381,432.21 620,977.14 2,980.69 617,996.45 0.81 503,560.33 884,992.54Craven........….. January-03 743,031.78 3,566.55 739,465.23 969,621.31 4,654.18 964,967.13 1.04 1,009,287.15 1,748,752.38Cumberland….. December-02 3,129,512.50 15,021.65 3,114,490.85 3,410,197.17 16,368.95 3,393,828.22 0.98 3,342,334.56 6,456,825.41Currituck...…… January-03 168,486.57 808.74 167,677.83 198,617.22 953.36 197,663.86 0.94 186,975.98 354,653.81Dare...........…… December-02 855,047.58 4,104.23 850,943.35 353,468.22 1,696.64 351,771.58 1.49 525,837.76 1,376,781.11Davidson.....… December-02 1,078,298.60 5,175.83 1,073,122.77 1,688,729.68 8,105.90 1,680,623.78 0.98 1,655,124.11 2,728,246.88Davie...........… December-02 196,097.01 941.27 195,155.74 410,358.83 1,969.72 408,389.11 0.93 381,773.28 576,929.02Duplin........… December-02 288,488.08 1,384.74 287,103.34 561,734.76 2,696.32 559,038.44 1.02 572,917.84 860,021.18Durham......… December-02 4,668,369.58 22,408.17 4,645,961.41 2,583,278.31 12,399.74 2,570,878.57 1.14 2,943,211.91 7,589,173.32Edgecombe..… December-02 404,521.11 1,941.71 402,579.40 619,498.26 2,973.59 616,524.67 1.02 631,831.36 1,034,410.76Forsyth.......… December-02 4,658,980.36 22,363.10 4,636,617.26 3,514,774.60 16,870.92 3,497,903.68 0.96 3,374,872.86 8,011,490.12Franklin.....… January-03 203,479.77 976.71 202,503.06 514,680.24 2,470.47 512,209.77 0.97 499,880.41 702,383.47Gaston........… December-02 1,853,282.93 8,895.77 1,844,387.16 2,164,485.59 10,389.53 2,154,096.06 1.03 2,229,117.33 4,073,504.49Gates...........… December-02 24,538.85 117.79 24,421.06 119,603.38 574.09 119,029.29 0.95 113,652.40 138,073.46Graham.....… December-02 50,281.70 241.36 50,040.34 90,982.72 436.72 90,546.00 0.98 89,172.20 139,212.54Granville....… December-02 276,135.86 1,325.46 274,810.40 562,558.40 2,700.29 559,858.11 1.03 579,356.47 854,166.87Greene........… December-02 52,039.59 249.80 51,789.79 215,195.49 1,032.94 214,162.55 0.95 204,488.24 256,278.03Guilford......… January-03 5,393,808.94 25,890.29 5,367,918.65 4,470,489.39 21,458.35 4,449,031.04 0.94 4,208,467.73 9,576,386.38Halifax........… December-02 427,802.67 2,053.46 425,749.21 647,094.49 3,106.05 643,988.44 1.01 653,537.02 1,079,286.23Harnett.......… December-02 522,231.85 2,506.71 519,725.14 1,061,050.21 5,093.04 1,055,957.17 0.99 1,050,494.98 1,570,220.12Haywood...…… December-02 576,959.38 2,769.40 574,189.98 618,332.80 2,968.00 615,364.80 1.02 630,642.63 1,204,832.61Hertford......….. December-02 196,074.80 941.16 195,133.64 250,935.12 1,204.48 249,730.64 1.01 253,433.48 448,567.12Hoke.........……. December-02 93,933.47 450.88 93,482.59 394,643.65 1,894.29 392,749.36 0.97 382,862.78 476,345.37Hyde..........…… December-02 37,249.94 178.81 37,071.13 65,035.81 312.16 64,723.65 0.98 63,741.61 100,812.74Iredell........…… December-02 1,688,148.36 8,103.11 1,680,045.25 1,448,532.98 6,952.96 1,441,580.02 0.99 1,434,123.11 3,114,168.36
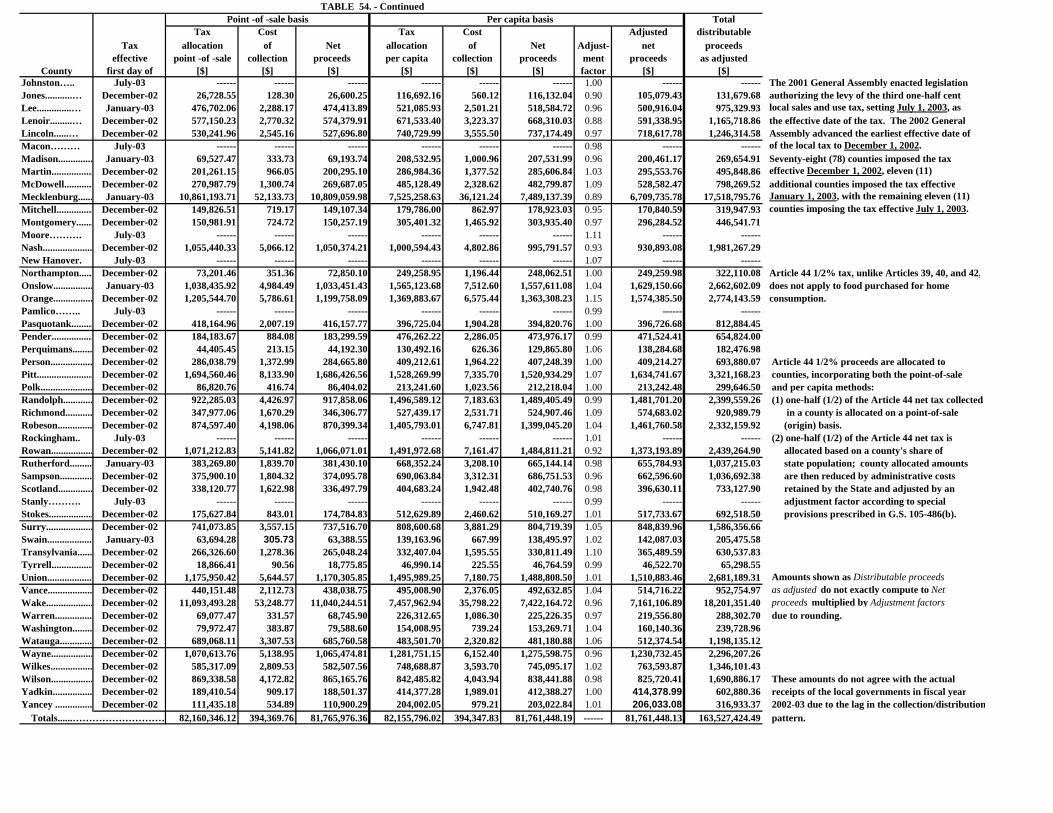
TABLE 54. - ContinuedPoint -of -sale basis Per capita basis Total
Tax Cost Tax Cost Adjusted distributableTax allocation of Net allocation of Net Adjust- net proceeds
effective point -of -sale collection proceeds per capita collection proceeds ment proceeds as adjustedCounty first day of [$] [$] [$] [$] [$] [$] factor [$] [$]
Johnston….. July-03 ------ ------ ------ ------ ------ ------ 1.00 ------ ------ The 2001 General Assembly enacted legislation Jones...........… December-02 26,728.55 128.30 26,600.25 116,692.16 560.12 116,132.04 0.90 105,079.43 131,679.68 authorizing the levy of the third one-half cent Lee..............… January-03 476,702.06 2,288.17 474,413.89 521,085.93 2,501.21 518,584.72 0.96 500,916.04 975,329.93 local sales and use tax, setting July 1, 2003, as Lenoir.........… December-02 577,150.23 2,770.32 574,379.91 671,533.40 3,223.37 668,310.03 0.88 591,338.95 1,165,718.86 the effective date of the tax. The 2002 GeneralLincoln......… December-02 530,241.96 2,545.16 527,696.80 740,729.99 3,555.50 737,174.49 0.97 718,617.78 1,246,314.58 Assembly advanced the earliest effective date ofMacon……… July-03 ------ ------ ------ ------ ------ ------ 0.98 ------ ------ of the local tax to December 1, 2002. Madison.............. January-03 69,527.47 333.73 69,193.74 208,532.95 1,000.96 207,531.99 0.96 200,461.17 269,654.91 Seventy-eight (78) counties imposed the taxMartin................. December-02 201,261.15 966.05 200,295.10 286,984.36 1,377.52 285,606.84 1.03 295,553.76 495,848.86 effective December 1, 2002, eleven (11) McDowell............ December-02 270,987.79 1,300.74 269,687.05 485,128.49 2,328.62 482,799.87 1.09 528,582.47 798,269.52 additional counties imposed the tax effectiveMecklenburg...... January-03 10,861,193.71 52,133.73 10,809,059.98 7,525,258.63 36,121.24 7,489,137.39 0.89 6,709,735.78 17,518,795.76 January 1, 2003, with the remaining eleven (11)Mitchell............... December-02 149,826.51 719.17 149,107.34 179,786.00 862.97 178,923.03 0.95 170,840.59 319,947.93 counties imposing the tax effective July 1, 2003.Montgomery....... December-02 150,981.91 724.72 150,257.19 305,401.32 1,465.92 303,935.40 0.97 296,284.52 446,541.71Moore………. July-03 ------ ------ ------ ------ ------ ------ 1.11 ------ ------Nash.................... December-02 1,055,440.33 5,066.12 1,050,374.21 1,000,594.43 4,802.86 995,791.57 0.93 930,893.08 1,981,267.29New Hanover. July-03 ------ ------ ------ ------ ------ ------ 1.07 ------ ------Northampton...... December-02 73,201.46 351.36 72,850.10 249,258.95 1,196.44 248,062.51 1.00 249,259.98 322,110.08 Article 44 1/2% tax, unlike Articles 39, 40, and 42,Onslow................ January-03 1,038,435.92 4,984.49 1,033,451.43 1,565,123.68 7,512.60 1,557,611.08 1.04 1,629,150.66 2,662,602.09 does not apply to food purchased for home Orange................ December-02 1,205,544.70 5,786.61 1,199,758.09 1,369,883.67 6,575.44 1,363,308.23 1.15 1,574,385.50 2,774,143.59 consumption.Pamlico…….. July-03 ------ ------ ------ ------ ------ ------ 0.99 ------ ------Pasquotank......... December-02 418,164.96 2,007.19 416,157.77 396,725.04 1,904.28 394,820.76 1.00 396,726.68 812,884.45Pender................. December-02 184,183.67 884.08 183,299.59 476,262.22 2,286.05 473,976.17 0.99 471,524.41 654,824.00Perquimans........ December-02 44,405.45 213.15 44,192.30 130,492.16 626.36 129,865.80 1.06 138,284.68 182,476.98Person................. December-02 286,038.79 1,372.99 284,665.80 409,212.61 1,964.22 407,248.39 1.00 409,214.27 693,880.07 Article 44 1/2% proceeds are allocated to Pitt....................... December-02 1,694,560.46 8,133.90 1,686,426.56 1,528,269.99 7,335.70 1,520,934.29 1.07 1,634,741.67 3,321,168.23 counties, incorporating both the point-of-salePolk..................... December-02 86,820.76 416.74 86,404.02 213,241.60 1,023.56 212,218.04 1.00 213,242.48 299,646.50 and per capita methods:Randolph............ December-02 922,285.03 4,426.97 917,858.06 1,496,589.12 7,183.63 1,489,405.49 0.99 1,481,701.20 2,399,559.26 (1) one-half (1/2) of the Article 44 net tax collected Richmond........... December-02 347,977.06 1,670.29 346,306.77 527,439.17 2,531.71 524,907.46 1.09 574,683.02 920,989.79 in a county is allocated on a point-of-sale Robeson.............. December-02 874,597.40 4,198.06 870,399.34 1,405,793.01 6,747.81 1,399,045.20 1.04 1,461,760.58 2,332,159.92 (origin) basis.Rockingham.. July-03 ------ ------ ------ ------ ------ ------ 1.01 ------ ------ (2) one-half (1/2) of the Article 44 net tax isRowan................. December-02 1,071,212.83 5,141.82 1,066,071.01 1,491,972.68 7,161.47 1,484,811.21 0.92 1,373,193.89 2,439,264.90 allocated based on a county's share of Rutherford......... January-03 383,269.80 1,839.70 381,430.10 668,352.24 3,208.10 665,144.14 0.98 655,784.93 1,037,215.03 state population; county allocated amounts Sampson............. December-02 375,900.10 1,804.32 374,095.78 690,063.84 3,312.31 686,751.53 0.96 662,596.60 1,036,692.38 are then reduced by administrative costs Scotland.............. December-02 338,120.77 1,622.98 336,497.79 404,683.24 1,942.48 402,740.76 0.98 396,630.11 733,127.90 retained by the State and adjusted by an Stanly………. July-03 ------ ------ ------ ------ ------ ------ 0.99 ------ ------ adjustment factor according to special Stokes.................. December-02 175,627.84 843.01 174,784.83 512,629.89 2,460.62 510,169.27 1.01 517,733.67 692,518.50 provisions prescribed in G.S. 105-486(b). Surry................... December-02 741,073.85 3,557.15 737,516.70 808,600.68 3,881.29 804,719.39 1.05 848,839.96 1,586,356.66Swain................... January-03 63,694.28 305.73 63,388.55 139,163.96 667.99 138,495.97 1.02 142,087.03 205,475.58Transylvania...... December-02 266,326.60 1,278.36 265,048.24 332,407.04 1,595.55 330,811.49 1.10 365,489.59 630,537.83Tyrrell................. December-02 18,866.41 90.56 18,775.85 46,990.14 225.55 46,764.59 0.99 46,522.70 65,298.55Union................... December-02 1,175,950.42 5,644.57 1,170,305.85 1,495,989.25 7,180.75 1,488,808.50 1.01 1,510,883.46 2,681,189.31 Amounts shown as Distributable proceedsVance.................. December-02 440,151.48 2,112.73 438,038.75 495,008.90 2,376.05 492,632.85 1.04 514,716.22 952,754.97 as adjusted do not exactly compute to Net Wake................... December-02 11,093,493.28 53,248.77 11,040,244.51 7,457,962.94 35,798.22 7,422,164.72 0.96 7,161,106.89 18,201,351.40 proceeds multiplied by Adjustment factors Warren............... December-02 69,077.47 331.57 68,745.90 226,312.65 1,086.30 225,226.35 0.97 219,556.80 288,302.70 due to rounding.Washington........ December-02 79,972.47 383.87 79,588.60 154,008.95 739.24 153,269.71 1.04 160,140.36 239,728.96Watauga............. December-02 689,068.11 3,307.53 685,760.58 483,501.70 2,320.82 481,180.88 1.06 512,374.54 1,198,135.12Wayne................. December-02 1,070,613.76 5,138.95 1,065,474.81 1,281,751.15 6,152.40 1,275,598.75 0.96 1,230,732.45 2,296,207.26Wilkes................. December-02 585,317.09 2,809.53 582,507.56 748,688.87 3,593.70 745,095.17 1.02 763,593.87 1,346,101.43Wilson................. December-02 869,338.58 4,172.82 865,165.76 842,485.82 4,043.94 838,441.88 0.98 825,720.41 1,690,886.17 These amounts do not agree with the actual Yadkin................ December-02 189,410.54 909.17 188,501.37 414,377.28 1,989.01 412,388.27 1.00 414,378.99 602,880.36 receipts of the local governments in fiscal yearYancey ............... December-02 111,435.18 534.89 110,900.29 204,002.05 979.21 203,022.84 1.01 206,033.08 316,933.37 2002-03 due to the lag in the collection/distribution Totals......………………………… 82,160,346.12 394,369.76 81,765,976.36 82,155,796.02 394,347.83 81,761,448.19 ------ 81,761,448.13 163,527,424.49 pattern.
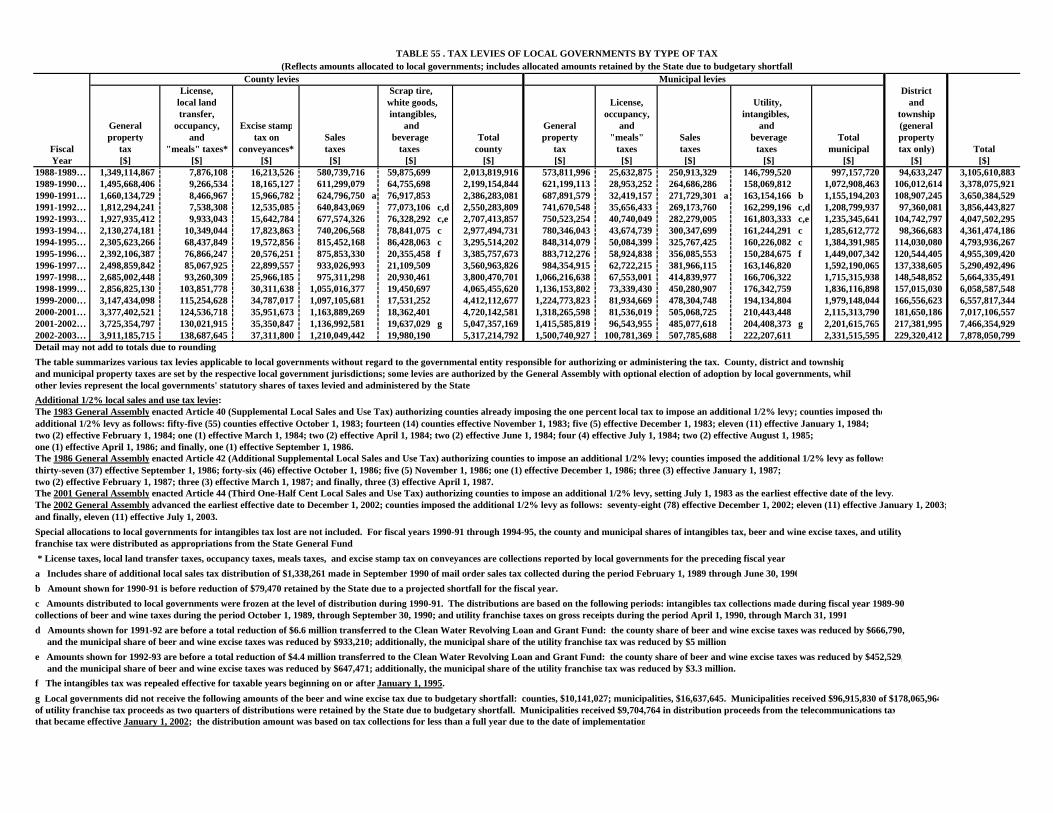
TABLE 55 . TAX LEVIES OF LOCAL GOVERNMENTS BY TYPE OF TAX (Reflects amounts allocated to local governments; includes allocated amounts retained by the State due to budgetary shortfall)
County levies Municipal leviesLicense, Scrap tire, District
local land white goods, License, Utility, andtransfer, intangibles, occupancy, intangibles, township
General occupancy, Excise stamp and General and and (general property and tax on Sales beverage Total property "meals" Sales beverage Total property
Fiscal tax "meals" taxes* conveyances* taxes taxes county tax taxes taxes taxes municipal tax only) TotalYear [$] [$] [$] [$] [$] [$] [$] [$] [$] [$] [$] [$] [$]
1988-1989… 1,349,114,867 7,876,108 16,213,526 580,739,716 59,875,699 2,013,819,916 573,811,996 25,632,875 250,913,329 146,799,520 997,157,720 94,633,247 3,105,610,8831989-1990… 1,495,668,406 9,266,534 18,165,127 611,299,079 64,755,698 2,199,154,844 621,199,113 28,953,252 264,686,286 158,069,812 1,072,908,463 106,012,614 3,378,075,9211990-1991… 1,660,134,729 8,466,967 15,966,782 624,796,750 a 76,917,853 2,386,283,081 687,891,579 32,419,157 271,729,301 a 163,154,166 b 1,155,194,203 108,907,245 3,650,384,5291991-1992… 1,812,294,241 7,538,308 12,535,085 640,843,069 77,073,106 c,d 2,550,283,809 741,670,548 35,656,433 269,173,760 162,299,196 c,d 1,208,799,937 97,360,081 3,856,443,8271992-1993… 1,927,935,412 9,933,043 15,642,784 677,574,326 76,328,292 c,e 2,707,413,857 750,523,254 40,740,049 282,279,005 161,803,333 c,e 1,235,345,641 104,742,797 4,047,502,2951993-1994… 2,130,274,181 10,349,044 17,823,863 740,206,568 78,841,075 c 2,977,494,731 780,346,043 43,674,739 300,347,699 161,244,291 c 1,285,612,772 98,366,683 4,361,474,1861994-1995… 2,305,623,266 68,437,849 19,572,856 815,452,168 86,428,063 c 3,295,514,202 848,314,079 50,084,399 325,767,425 160,226,082 c 1,384,391,985 114,030,080 4,793,936,2671995-1996… 2,392,106,387 76,866,247 20,576,251 875,853,330 20,355,458 f 3,385,757,673 883,712,276 58,924,838 356,085,553 150,284,675 f 1,449,007,342 120,544,405 4,955,309,4201996-1997… 2,498,859,842 85,067,925 22,899,557 933,026,993 21,109,509 3,560,963,826 984,354,915 62,722,215 381,966,115 163,146,820 1,592,190,065 137,338,605 5,290,492,4961997-1998… 2,685,002,448 93,260,309 25,966,185 975,311,298 20,930,461 3,800,470,701 1,066,216,638 67,553,001 414,839,977 166,706,322 1,715,315,938 148,548,852 5,664,335,4911998-1999… 2,856,825,130 103,851,778 30,311,638 1,055,016,377 19,450,697 4,065,455,620 1,136,153,802 73,339,430 450,280,907 176,342,759 1,836,116,898 157,015,030 6,058,587,5481999-2000… 3,147,434,098 115,254,628 34,787,017 1,097,105,681 17,531,252 4,412,112,677 1,224,773,823 81,934,669 478,304,748 194,134,804 1,979,148,044 166,556,623 6,557,817,3442000-2001… 3,377,402,521 124,536,718 35,951,673 1,163,889,269 18,362,401 4,720,142,581 1,318,265,598 81,536,019 505,068,725 210,443,448 2,115,313,790 181,650,186 7,017,106,5572001-2002… 3,725,354,797 130,021,915 35,350,847 1,136,992,581 19,637,029 g 5,047,357,169 1,415,585,819 96,543,955 485,077,618 204,408,373 g 2,201,615,765 217,381,995 7,466,354,9292002-2003… 3,911,185,715 138,687,645 37,311,800 1,210,049,442 19,980,190 5,317,214,792 1,500,740,927 100,781,369 507,785,688 222,207,611 2,331,515,595 229,320,412 7,878,050,799Detail may not add to totals due to rounding.The table summarizes various tax levies applicable to local governments without regard to the governmental entity responsible for authorizing or administering the tax. County, district and townshipand municipal property taxes are set by the respective local government jurisdictions; some levies are authorized by the General Assembly with optional election of adoption by local governments, whileother levies represent the local governments' statutory shares of taxes levied and administered by the State.Additional 1/2% local sales and use tax levies:The 1983 General Assembly enacted Article 40 (Supplemental Local Sales and Use Tax) authorizing counties already imposing the one percent local tax to impose an additional 1/2% levy; counties imposed theadditional 1/2% levy as follows: fifty-five (55) counties effective October 1, 1983; fourteen (14) counties effective November 1, 1983; five (5) effective December 1, 1983; eleven (11) effective January 1, 1984; two (2) effective February 1, 1984; one (1) effective March 1, 1984; two (2) effective April 1, 1984; two (2) effective June 1, 1984; four (4) effective July 1, 1984; two (2) effective August 1, 1985; one (1) effective April 1, 1986; and finally, one (1) effective September 1, 1986.The 1986 General Assembly enacted Article 42 (Additional Supplemental Local Sales and Use Tax) authorizing counties to impose an additional 1/2% levy; counties imposed the additional 1/2% levy as followsthirty-seven (37) effective September 1, 1986; forty-six (46) effective October 1, 1986; five (5) November 1, 1986; one (1) effective December 1, 1986; three (3) effective January 1, 1987; two (2) effective February 1, 1987; three (3) effective March 1, 1987; and finally, three (3) effective April 1, 1987.The 2001 General Assembly enacted Article 44 (Third One-Half Cent Local Sales and Use Tax) authorizing counties to impose an additional 1/2% levy, setting July 1, 1983 as the earliest effective date of the levy.The 2002 General Assembly advanced the earliest effective date to December 1, 2002; counties imposed the additional 1/2% levy as follows: seventy-eight (78) effective December 1, 2002; eleven (11) effective January 1, 2003;and finally, eleven (11) effective July 1, 2003.Special allocations to local governments for intangibles tax lost are not included. For fiscal years 1990-91 through 1994-95, the county and municipal shares of intangibles tax, beer and wine excise taxes, and utilityfranchise tax were distributed as appropriations from the State General Fund. * License taxes, local land transfer taxes, occupancy taxes, meals taxes, and excise stamp tax on conveyances are collections reported by local governments for the preceding fiscal yeara Includes share of additional local sales tax distribution of $1,338,261 made in September 1990 of mail order sales tax collected during the period February 1, 1989 through June 30, 1990b Amount shown for 1990-91 is before reduction of $79,470 retained by the State due to a projected shortfall for the fiscal year. c Amounts distributed to local governments were frozen at the level of distribution during 1990-91. The distributions are based on the following periods: intangibles tax collections made during fiscal year 1989-90;collections of beer and wine taxes during the period October 1, 1989, through September 30, 1990; and utility franchise taxes on gross receipts during the period April 1, 1990, through March 31, 1991d Amounts shown for 1991-92 are before a total reduction of $6.6 million transferred to the Clean Water Revolving Loan and Grant Fund: the county share of beer and wine excise taxes was reduced by $666,790, and the municipal share of beer and wine excise taxes was reduced by $933,210; additionally, the municipal share of the utility franchise tax was reduced by $5 millione Amounts shown for 1992-93 are before a total reduction of $4.4 million transferred to the Clean Water Revolving Loan and Grant Fund: the county share of beer and wine excise taxes was reduced by $452,529, and the municipal share of beer and wine excise taxes was reduced by $647,471; additionally, the municipal share of the utility franchise tax was reduced by $3.3 million. f The intangibles tax was repealed effective for taxable years beginning on or after January 1, 1995.g Local governments did not receive the following amounts of the beer and wine excise tax due to budgetary shortfall: counties, $10,141,027; municipalities, $16,637,645. Municipalities received $96,915,830 of $178,065,964of utility franchise tax proceeds as two quarters of distributions were retained by the State due to budgetary shortfall. Municipalities received $9,704,764 in distribution proceeds from the telecommunications taxthat became effective January 1, 2002; the distribution amount was based on tax collections for less than a full year due to the date of implementation
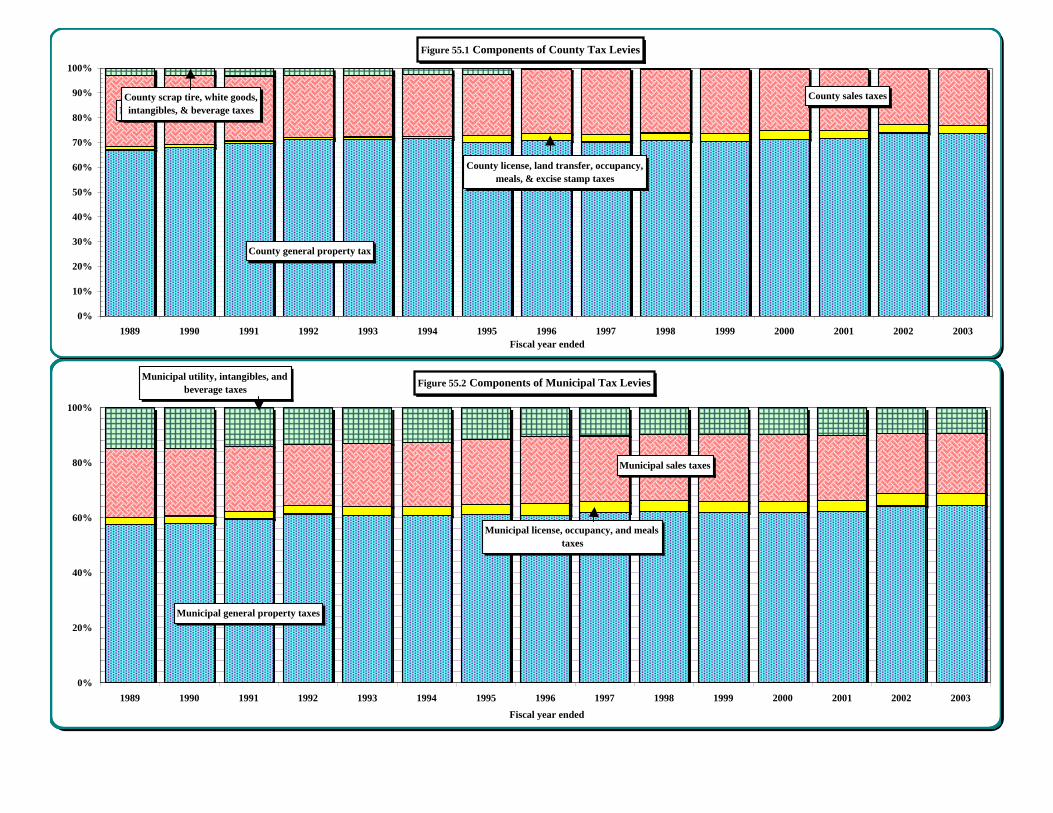
County general Municipal gene County license,nse, occupancy, aCounty Sales taxeunicipal Sales ta County Scrap t Municipal utilitDistrict & township property taxes 1989 ############ 573,811,996 24,089,634 25,632,875 $580,739,716 250,913,329 $59,875,699 146,799,520 94,633,2471990 ############ 621,199,113 27,431,661 28,953,252 $611,299,079 264,686,286 $64,755,698 158,069,812 106,012,6141991 ############ 687,891,579 24,433,749 32,419,157 $624,796,750 271,729,301 $76,917,853 163,154,166 108,907,2451992 ############ 741,670,548 20,073,393 35,656,433 $640,843,069 269,173,760 $77,073,106 162,299,196 97,360,0811993 ############ 750,523,254 25,575,827 40,740,049 $677,574,326 282,279,005 $76,328,292 161,803,333 104,742,7971994 ############ 780,346,043 28,172,907 43,674,739 $740,206,568 300,347,699 $78,841,075 161,244,291 98,366,6831995 ############ 848,314,079 88,010,705 50,084,399 $815,452,168 325,767,425 $86,428,063 160,226,082 114,030,0801996 ############ 883,712,276 97,442,498 58,924,838 $875,853,330 356,085,553 $20,355,458 150,284,675 120,544,4051997 ############ 984,354,915 107,967,482 62,722,215 $933,026,993 381,966,115 $21,109,509 163,146,820 137,338,6051998 ############ 1,066,216,638 119,226,494 67,553,001 $975,311,298 414,839,977 $20,930,461 166,706,322 148,548,8521999 ############ 1,136,153,802 134,163,416 73,339,430 ############ 450,280,907 $19,450,697 176,342,759 152,582,4972000 ############ 1,224,773,823 150,041,645 81,934,669 ############ 478,304,748 $17,531,252 194,134,804 166,556,6232001 ############ 1,318,265,598 160,488,391 81,536,019 ############ 505,068,725 $18,362,401 210,443,448 181,682,8552002 ############ 1,415,585,819 165,372,762 96,543,955 ############ 485,077,618 $19,637,029 204,408,373 217,381,9952003 ############ 1,500,740,927 175,999,445 100,781,369 ############ 507,785,688 $19,980,190 222,207,611 229,320,412
Figure 55.1 Components of County Tax Levies
1989 1990 1991
County general property tax
County sales taxes
County license, land transfer, occupancy, meals, & excise stamp taxes
County scrap tire, white goods, intangibles, & beverage taxes
0%
10%
20%
30%
40%
50%
60%
70%
80%
90%
100%
1989 1990 1991 1992 1993 1994 1995 1996 1997 1998 1999 2000 2001 2002 2003Fiscal year ended
Figure 55.2 Components of Municipal Tax Levies
Municipal general property taxes
Municipal license, occupancy, and meals taxes
Municipal sales taxes
Municipal utility, intangibles, and beverage taxes
0%
20%
40%
60%
80%
100%
1989 1990 1991 1992 1993 1994 1995 1996 1997 1998 1999 2000 2001 2002 2003
Fiscal year ended
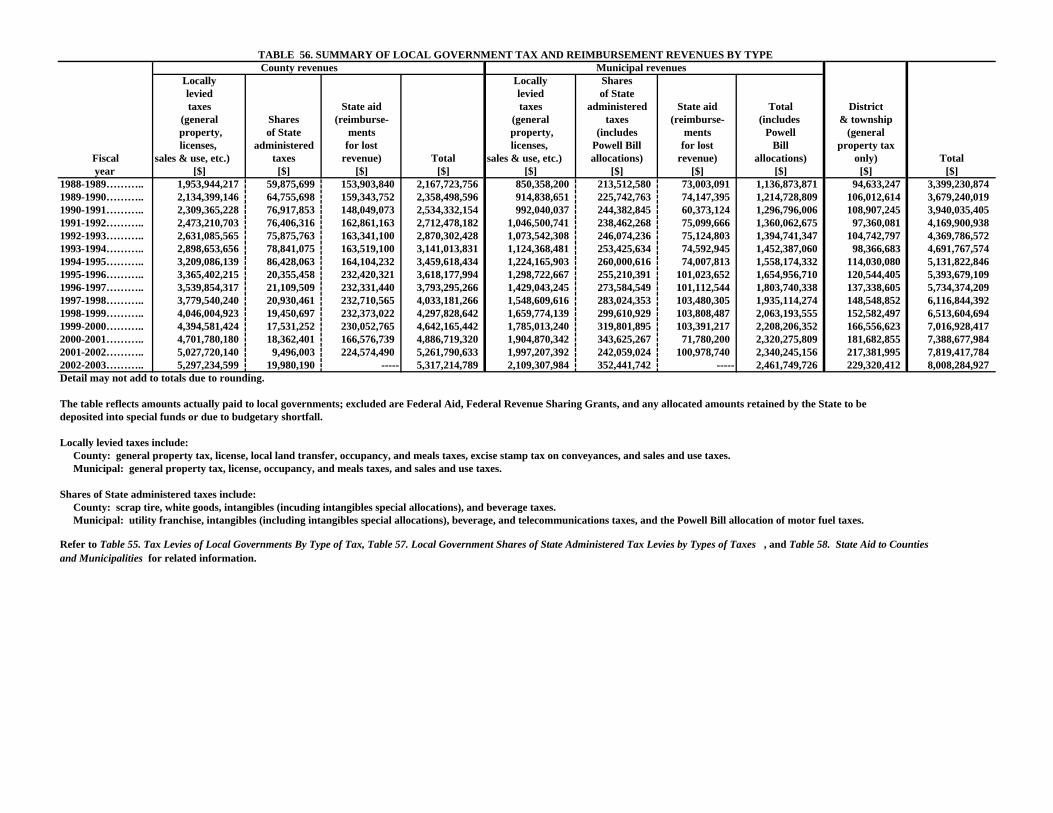
TABLE 56. SUMMARY OF LOCAL GOVERNMENT TAX AND REIMBURSEMENT REVENUES BY TYPE County revenues Municipal revenues
Locally Locally Shareslevied levied of Statetaxes State aid taxes administered State aid Total District
(general Shares (reimburse- (general taxes (reimburse- (includes & township property, of State ments property, (includes ments Powell (generallicenses, administered for lost licenses, Powell Bill for lost Bill property tax
Fiscal sales & use, etc.) taxes revenue) Total sales & use, etc.) allocations) revenue) allocations) only) Total year [$] [$] [$] [$] [$] [$] [$] [$] [$] [$]1988-1989……….. 1,953,944,217 59,875,699 153,903,840 2,167,723,756 850,358,200 213,512,580 73,003,091 1,136,873,871 94,633,247 3,399,230,8741989-1990……….. 2,134,399,146 64,755,698 159,343,752 2,358,498,596 914,838,651 225,742,763 74,147,395 1,214,728,809 106,012,614 3,679,240,0191990-1991……….. 2,309,365,228 76,917,853 148,049,073 2,534,332,154 992,040,037 244,382,845 60,373,124 1,296,796,006 108,907,245 3,940,035,4051991-1992……….. 2,473,210,703 76,406,316 162,861,163 2,712,478,182 1,046,500,741 238,462,268 75,099,666 1,360,062,675 97,360,081 4,169,900,9381992-1993……….. 2,631,085,565 75,875,763 163,341,100 2,870,302,428 1,073,542,308 246,074,236 75,124,803 1,394,741,347 104,742,797 4,369,786,5721993-1994……….. 2,898,653,656 78,841,075 163,519,100 3,141,013,831 1,124,368,481 253,425,634 74,592,945 1,452,387,060 98,366,683 4,691,767,5741994-1995……….. 3,209,086,139 86,428,063 164,104,232 3,459,618,434 1,224,165,903 260,000,616 74,007,813 1,558,174,332 114,030,080 5,131,822,8461995-1996……….. 3,365,402,215 20,355,458 232,420,321 3,618,177,994 1,298,722,667 255,210,391 101,023,652 1,654,956,710 120,544,405 5,393,679,1091996-1997……….. 3,539,854,317 21,109,509 232,331,440 3,793,295,266 1,429,043,245 273,584,549 101,112,544 1,803,740,338 137,338,605 5,734,374,2091997-1998……….. 3,779,540,240 20,930,461 232,710,565 4,033,181,266 1,548,609,616 283,024,353 103,480,305 1,935,114,274 148,548,852 6,116,844,3921998-1999……….. 4,046,004,923 19,450,697 232,373,022 4,297,828,642 1,659,774,139 299,610,929 103,808,487 2,063,193,555 152,582,497 6,513,604,6941999-2000……….. 4,394,581,424 17,531,252 230,052,765 4,642,165,442 1,785,013,240 319,801,895 103,391,217 2,208,206,352 166,556,623 7,016,928,4172000-2001……….. 4,701,780,180 18,362,401 166,576,739 4,886,719,320 1,904,870,342 343,625,267 71,780,200 2,320,275,809 181,682,855 7,388,677,9842001-2002……….. 5,027,720,140 9,496,003 224,574,490 5,261,790,633 1,997,207,392 242,059,024 100,978,740 2,340,245,156 217,381,995 7,819,417,7842002-2003……….. 5,297,234,599 19,980,190 ----- 5,317,214,789 2,109,307,984 352,441,742 ----- 2,461,749,726 229,320,412 8,008,284,927Detail may not add to totals due to rounding.
The table reflects amounts actually paid to local governments; excluded are Federal Aid, Federal Revenue Sharing Grants, and any allocated amounts retained by the State to bedeposited into special funds or due to budgetary shortfall.
Locally levied taxes include: County: general property tax, license, local land transfer, occupancy, and meals taxes, excise stamp tax on conveyances, and sales and use taxes. Municipal: general property tax, license, occupancy, and meals taxes, and sales and use taxes.
Shares of State administered taxes include: County: scrap tire, white goods, intangibles (incuding intangibles special allocations), and beverage taxes. Municipal: utility franchise, intangibles (including intangibles special allocations), beverage, and telecommunications taxes, and the Powell Bill allocation of motor fuel taxes.
Refer to Table 55. Tax Levies of Local Governments By Type of Tax, Table 57. Local Government Shares of State Administered Tax Levies by Types of Taxes , and Table 58. State Aid to Countiesand Municipalities for related information.
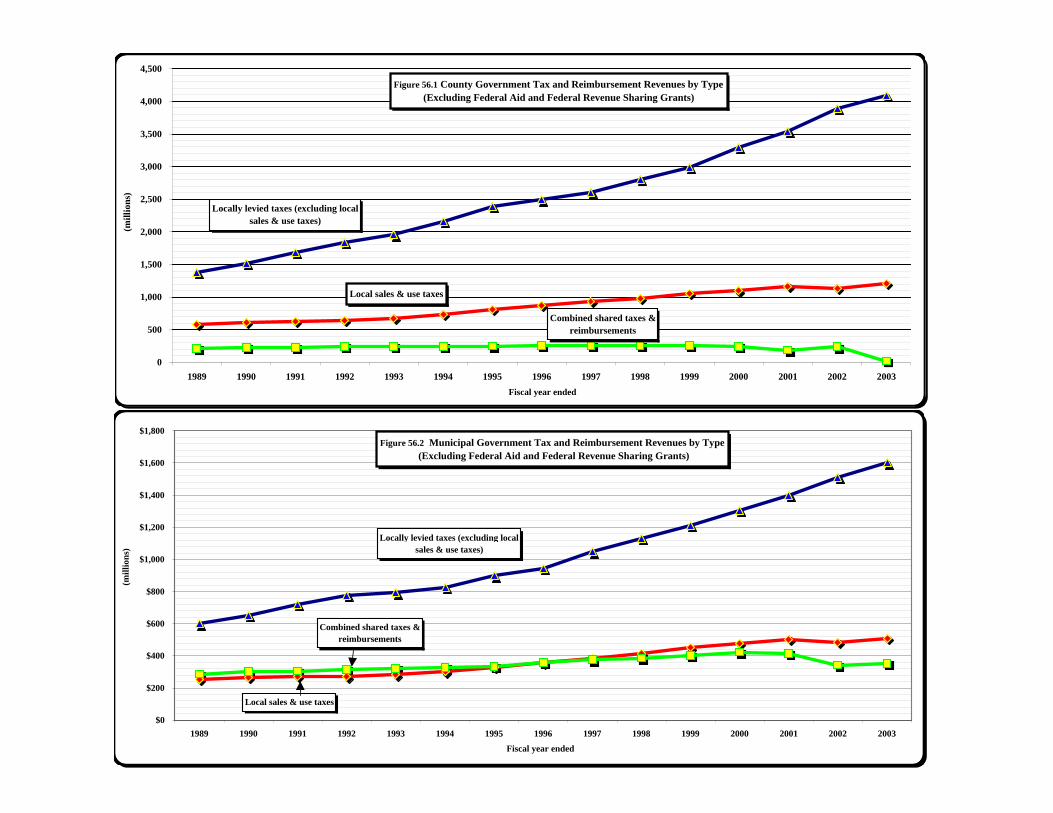
Locally levied taxe Local sales & use Combined shared taxes & reimbursements1989 1,373,204,501 580,739,716 213,779,5391990 1,523,100,067 611,299,079 224,099,4501991 1,684,568,478 624,796,750 224,966,9261992 1,832,367,634 640,843,069 239,267,4791993 1,953,511,239 677,574,326 239,216,8631994 2,158,447,088 740,206,568 242,360,1751995 2,393,633,971 815,452,168 250,532,2951996 2,489,548,885 875,853,330 252,775,7791997 2,606,827,324 933,026,993 253,440,9491998 2,804,228,942 975,311,298 253,641,0261999 2,990,988,546 1,055,016,377 251,823,7192000 3,297,475,743 1,097,105,681 247,584,0172001 3,537,890,911 1,163,889,269 184,939,1402002 3,890,727,559 1,136,992,581 234,070,4932003 4,087,185,157 1,210,049,442 19,980,190
Locally levied taxe Local sales & use Combined shared taxes & reimbursements1989 $599,444,871 $250,913,329 $286,515,6711990 $650,152,365 $264,686,286 $299,890,1581991 $720,310,736 $271,729,301 $304,755,9691992 $777,326,981 $269,173,760 $313,561,9341993 $791,263,303 $282,279,005 $321,199,0391994 $824,020,782 $300,347,699 $328,018,5791995 $898,398,478 $325,767,425 $334,008,4291996 $942,637,114 $356,085,553 $356,234,0431997 $1,047,077,130 $381,966,115 $374,697,0931998 $1,133,769,639 $414,839,977 $386,504,6581999 $1,209,493,232 $450,280,907 $403,419,4162000 $1,306,708,492 $478,304,748 $423,193,1122001 $1,399,801,617 $505,068,725 $415,405,4672002 $1,512,129,774 $485,077,618 $343,037,7642003 $1,601,522,296 $507,785,688 $352,441,742
Figure 56.1 County Government Tax and Reimbursement Revenues by Type(Excluding Federal Aid and Federal Revenue Sharing Grants)
Locally levied taxes (excluding local sales & use taxes)
Local sales & use taxes
Combined shared taxes &reimbursements
0
500
1,000
1,500
2,000
2,500
3,000
3,500
4,000
4,500
1989 1990 1991 1992 1993 1994 1995 1996 1997 1998 1999 2000 2001 2002 2003
(mill
ions
)
Fiscal year ended
Figure 56.2 Municipal Government Tax and Reimbursement Revenues by Type (Excluding Federal Aid and Federal Revenue Sharing Grants)
Locally levied taxes (excluding local sales & use taxes)
Combined shared taxes & reimbursements
Local sales & use taxes
$0
$200
$400
$600
$800
$1,000
$1,200
$1,400
$1,600
$1,800
1989 1990 1991 1992 1993 1994 1995 1996 1997 1998 1999 2000 2001 2002 2003
(mill
ions
)
Fiscal year ended
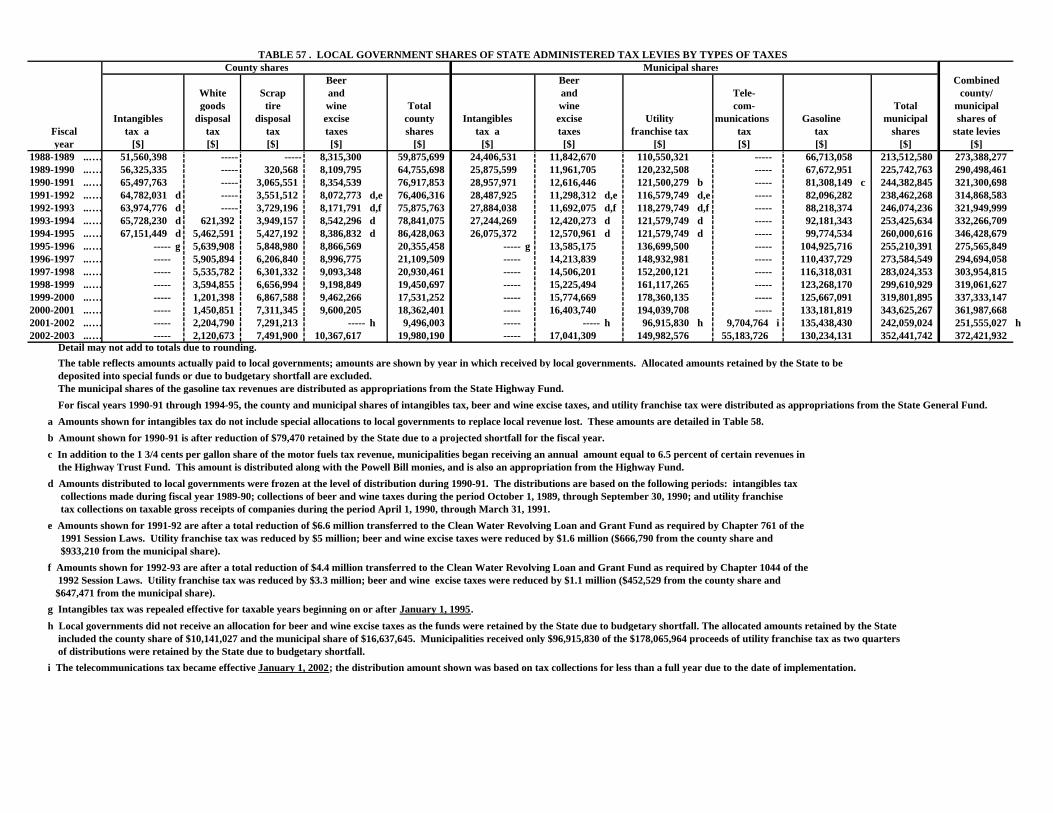
TABLE 57 . LOCAL GOVERNMENT SHARES OF STATE ADMINISTERED TAX LEVIES BY TYPES OF TAXES County shares Municipal shares
Beer Beer CombinedWhite Scrap and and Tele- county/goods tire wine Total wine com- Total municipal
Intangibles disposal disposal excise county Intangibles excise Utility munications Gasoline municipal shares of Fiscal tax a tax tax taxes shares tax a taxes franchise tax tax tax shares state levies year [$] [$] [$] [$] [$] [$] [$] [$] [$] [$] [$] [$]
1988-1989 ..…… 51,560,398 ----- ----- 8,315,300 59,875,699 24,406,531 11,842,670 110,550,321 ----- 66,713,058 213,512,580 273,388,2771989-1990 ..…… 56,325,335 ----- 320,568 8,109,795 64,755,698 25,875,599 11,961,705 120,232,508 ----- 67,672,951 225,742,763 290,498,4611990-1991 ..…… 65,497,763 ----- 3,065,551 8,354,539 76,917,853 28,957,971 12,616,446 121,500,279 b ----- 81,308,149 c 244,382,845 321,300,6981991-1992 ..…… 64,782,031 d ----- 3,551,512 8,072,773 d,e 76,406,316 28,487,925 11,298,312 d,e 116,579,749 d,e ----- 82,096,282 238,462,268 314,868,5831992-1993 ..…… 63,974,776 d ----- 3,729,196 8,171,791 d,f 75,875,763 27,884,038 11,692,075 d,f 118,279,749 d,f ----- 88,218,374 246,074,236 321,949,9991993-1994 ..…… 65,728,230 d 621,392 3,949,157 8,542,296 d 78,841,075 27,244,269 12,420,273 d 121,579,749 d ----- 92,181,343 253,425,634 332,266,7091994-1995 ..…… 67,151,449 d 5,462,591 5,427,192 8,386,832 d 86,428,063 26,075,372 12,570,961 d 121,579,749 d ----- 99,774,534 260,000,616 346,428,6791995-1996 ..…… ----- g 5,639,908 5,848,980 8,866,569 20,355,458 ----- g 13,585,175 136,699,500 ----- 104,925,716 255,210,391 275,565,8491996-1997 ..…… ----- 5,905,894 6,206,840 8,996,775 21,109,509 ----- 14,213,839 148,932,981 ----- 110,437,729 273,584,549 294,694,0581997-1998 ..…… ----- 5,535,782 6,301,332 9,093,348 20,930,461 ----- 14,506,201 152,200,121 ----- 116,318,031 283,024,353 303,954,8151998-1999 ..…… ----- 3,594,855 6,656,994 9,198,849 19,450,697 ----- 15,225,494 161,117,265 ----- 123,268,170 299,610,929 319,061,6271999-2000 ..…… ----- 1,201,398 6,867,588 9,462,266 17,531,252 ----- 15,774,669 178,360,135 ----- 125,667,091 319,801,895 337,333,1472000-2001 ..…… ----- 1,450,851 7,311,345 9,600,205 18,362,401 ----- 16,403,740 194,039,708 ----- 133,181,819 343,625,267 361,987,6682001-2002 ..…… ----- 2,204,790 7,291,213 ----- h 9,496,003 ----- ----- h 96,915,830 h 9,704,764 i 135,438,430 242,059,024 251,555,027 h2002-2003 ..…… ----- 2,120,673 7,491,900 10,367,617 19,980,190 ----- 17,041,309 149,982,576 55,183,726 130,234,131 352,441,742 372,421,932 Detail may not add to totals due to rounding. The table reflects amounts actually paid to local governments; amounts are shown by year in which received by local governments. Allocated amounts retained by the State to be deposited into special funds or due to budgetary shortfall are excluded. The municipal shares of the gasoline tax revenues are distributed as appropriations from the State Highway Fund. For fiscal years 1990-91 through 1994-95, the county and municipal shares of intangibles tax, beer and wine excise taxes, and utility franchise tax were distributed as appropriations from the State General Fund. a Amounts shown for intangibles tax do not include special allocations to local governments to replace local revenue lost. These amounts are detailed in Table 58. b Amount shown for 1990-91 is after reduction of $79,470 retained by the State due to a projected shortfall for the fiscal year. c In addition to the 1 3/4 cents per gallon share of the motor fuels tax revenue, municipalities began receiving an annual amount equal to 6.5 percent of certain revenues in the Highway Trust Fund. This amount is distributed along with the Powell Bill monies, and is also an appropriation from the Highway Fund. d Amounts distributed to local governments were frozen at the level of distribution during 1990-91. The distributions are based on the following periods: intangibles tax collections made during fiscal year 1989-90; collections of beer and wine taxes during the period October 1, 1989, through September 30, 1990; and utility franchise tax collections on taxable gross receipts of companies during the period April 1, 1990, through March 31, 1991. e Amounts shown for 1991-92 are after a total reduction of $6.6 million transferred to the Clean Water Revolving Loan and Grant Fund as required by Chapter 761 of the 1991 Session Laws. Utility franchise tax was reduced by $5 million; beer and wine excise taxes were reduced by $1.6 million ($666,790 from the county share and $933,210 from the municipal share). f Amounts shown for 1992-93 are after a total reduction of $4.4 million transferred to the Clean Water Revolving Loan and Grant Fund as required by Chapter 1044 of the 1992 Session Laws. Utility franchise tax was reduced by $3.3 million; beer and wine excise taxes were reduced by $1.1 million ($452,529 from the county share and $647,471 from the municipal share). g Intangibles tax was repealed effective for taxable years beginning on or after January 1, 1995. h Local governments did not receive an allocation for beer and wine excise taxes as the funds were retained by the State due to budgetary shortfall. The allocated amounts retained by the State included the county share of $10,141,027 and the municipal share of $16,637,645. Municipalities received only $96,915,830 of the $178,065,964 proceeds of utility franchise tax as two quarters of distributions were retained by the State due to budgetary shortfall. i The telecommunications tax became effective January 1, 2002; the distribution amount shown was based on tax collections for less than a full year due to the date of implementation.
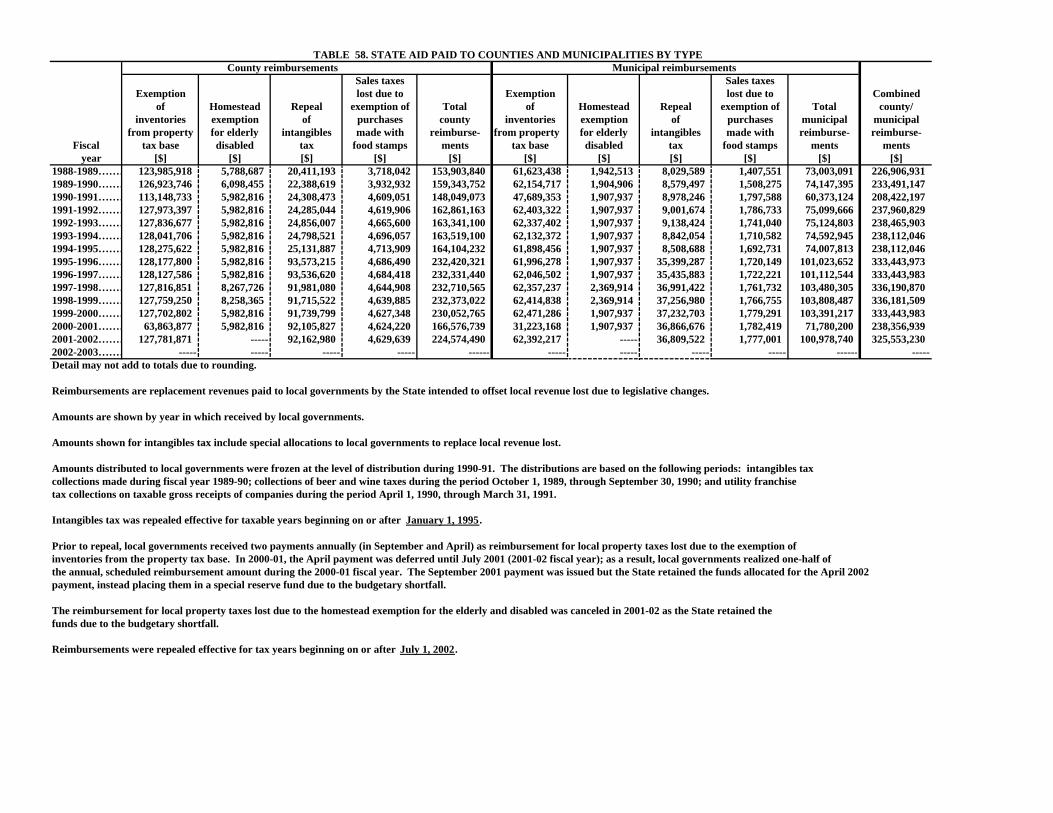
TABLE 58. STATE AID PAID TO COUNTIES AND MUNICIPALITIES BY TYPE County reimbursements Municipal reimbursements
Sales taxes Sales taxesExemption lost due to Exemption lost due to Combined
of Homestead Repeal exemption of Total of Homestead Repeal exemption of Total county/inventories exemption of purchases county inventories exemption of purchases municipal municipal
from property for elderly intangibles made with reimburse- from property for elderly intangibles made with reimburse- reimburse-Fiscal tax base disabled tax food stamps ments tax base disabled tax food stamps ments ments
year [$] [$] [$] [$] [$] [$] [$] [$] [$] [$] [$]1988-1989……… 123,985,918 5,788,687 20,411,193 3,718,042 153,903,840 61,623,438 1,942,513 8,029,589 1,407,551 73,003,091 226,906,9311989-1990……… 126,923,746 6,098,455 22,388,619 3,932,932 159,343,752 62,154,717 1,904,906 8,579,497 1,508,275 74,147,395 233,491,1471990-1991……… 113,148,733 5,982,816 24,308,473 4,609,051 148,049,073 47,689,353 1,907,937 8,978,246 1,797,588 60,373,124 208,422,1971991-1992……… 127,973,397 5,982,816 24,285,044 4,619,906 162,861,163 62,403,322 1,907,937 9,001,674 1,786,733 75,099,666 237,960,8291992-1993……… 127,836,677 5,982,816 24,856,007 4,665,600 163,341,100 62,337,402 1,907,937 9,138,424 1,741,040 75,124,803 238,465,9031993-1994……… 128,041,706 5,982,816 24,798,521 4,696,057 163,519,100 62,132,372 1,907,937 8,842,054 1,710,582 74,592,945 238,112,0461994-1995……… 128,275,622 5,982,816 25,131,887 4,713,909 164,104,232 61,898,456 1,907,937 8,508,688 1,692,731 74,007,813 238,112,0461995-1996……… 128,177,800 5,982,816 93,573,215 4,686,490 232,420,321 61,996,278 1,907,937 35,399,287 1,720,149 101,023,652 333,443,9731996-1997……… 128,127,586 5,982,816 93,536,620 4,684,418 232,331,440 62,046,502 1,907,937 35,435,883 1,722,221 101,112,544 333,443,9831997-1998……… 127,816,851 8,267,726 91,981,080 4,644,908 232,710,565 62,357,237 2,369,914 36,991,422 1,761,732 103,480,305 336,190,8701998-1999……… 127,759,250 8,258,365 91,715,522 4,639,885 232,373,022 62,414,838 2,369,914 37,256,980 1,766,755 103,808,487 336,181,5091999-2000……… 127,702,802 5,982,816 91,739,799 4,627,348 230,052,765 62,471,286 1,907,937 37,232,703 1,779,291 103,391,217 333,443,9832000-2001……… 63,863,877 5,982,816 92,105,827 4,624,220 166,576,739 31,223,168 1,907,937 36,866,676 1,782,419 71,780,200 238,356,9392001-2002……… 127,781,871 ----- 92,162,980 4,629,639 224,574,490 62,392,217 ----- 36,809,522 1,777,001 100,978,740 325,553,2302002-2003……… ----- ----- ----- ----- ------ ----- ----- ----- ----- ------ -----Detail may not add to totals due to rounding.
Reimbursements are replacement revenues paid to local governments by the State intended to offset local revenue lost due to legislative changes.
Amounts are shown by year in which received by local governments.
Amounts shown for intangibles tax include special allocations to local governments to replace local revenue lost.
Amounts distributed to local governments were frozen at the level of distribution during 1990-91. The distributions are based on the following periods: intangibles tax collections made during fiscal year 1989-90; collections of beer and wine taxes during the period October 1, 1989, through September 30, 1990; and utility franchisetax collections on taxable gross receipts of companies during the period April 1, 1990, through March 31, 1991.
Intangibles tax was repealed effective for taxable years beginning on or after January 1, 1995.
Prior to repeal, local governments received two payments annually (in September and April) as reimbursement for local property taxes lost due to the exemption ofinventories from the property tax base. In 2000-01, the April payment was deferred until July 2001 (2001-02 fiscal year); as a result, local governments realized one-half ofthe annual, scheduled reimbursement amount during the 2000-01 fiscal year. The September 2001 payment was issued but the State retained the funds allocated for the April 2002payment, instead placing them in a special reserve fund due to the budgetary shortfall.
The reimbursement for local property taxes lost due to the homestead exemption for the elderly and disabled was canceled in 2001-02 as the State retained thefunds due to the budgetary shortfall.
Reimbursements were repealed effective for tax years beginning on or after July 1, 2002.
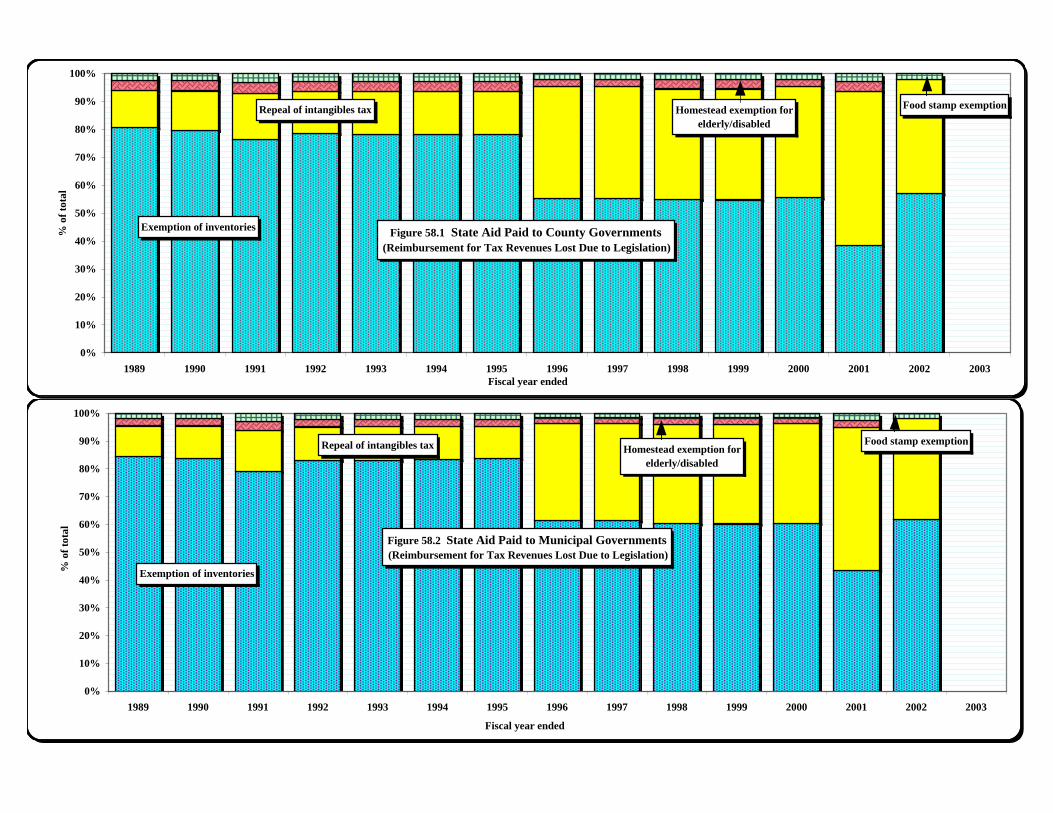
Exemption of inventoremption of inventorexemption for eldeexemption for eldepeal of intangibles peal of intangibles ociated with Food SSales tax loss associated with Food Stamp purchases1989 123,985,918 61,623,438 5,788,687 1,942,513 20,411,193 8,029,589 3,718,042 1,407,5511990 126,923,746 62,154,717 6,098,455 1,904,906 22,388,619 8,579,497 3,932,932 1,508,2751991 113,148,733 47,689,353 5,982,816 1,907,937 24,308,473 8,978,246 4,609,051 1,797,5881992 127,973,397 62,403,322 5,982,816 1,907,937 24,285,044 9,001,674 4,619,906 1,786,7331993 127,836,677 62,337,402 5,982,816 1,907,937 24,856,007 9,138,424 4,665,600 1,741,0401994 128,041,706 62,132,372 5,982,816 1,907,937 24,798,521 8,842,054 4,696,057 1,710,5821995 128,275,622 61,898,456 5,982,816 1,907,937 25,131,887 8,508,688 4,713,909 1,692,7311996 128,177,800 61,996,278 5,982,816 1,907,937 93,573,215 35,399,287 4,686,490 1,720,1491997 128,127,586 62,046,502 5,982,816 1,907,937 93,536,620 35,435,883 4,684,418 1,722,2211998 127,816,851 62,357,237 8,267,726 2,369,914 91,981,080 36,991,422 4,644,908 1,761,7321999 127,759,250 62,414,838 8,258,365 2,369,914 92,872,933 37,256,980 4,639,885 1,766,7552000 127,702,802 62,471,286 5,982,816 1,907,937 91,739,799 37,232,703 4,627,348 1,779,2912001 63,863,877 31,223,168 5,982,816 1,907,937 92,105,827 36,866,676 4,624,220 1,782,4192002 127,781,871 62,392,217 0 0 92,162,980 36,809,522 4,629,639 1,777,0012003 0 0 0 0 0 0 0 0
Figure 58.1 State Aid Paid to County Governments (Reimbursement for Tax Revenues Lost Due to Legislation)
Exemption of inventories
Repeal of intangibles tax Homestead exemption for elderly/disabled
Food stamp exemption
0%
10%
20%
30%
40%
50%
60%
70%
80%
90%
100%
1989 1990 1991 1992 1993 1994 1995 1996 1997 1998 1999 2000 2001 2002 2003Fiscal year ended
% o
f tot
al
Figure 58.2 State Aid Paid to Municipal Governments (Reimbursement for Tax Revenues Lost Due to Legislation)
Exemption of inventories
Repeal of intangibles tax Homestead exemption for elderly/disabled
Food stamp exemption
0%
10%
20%
30%
40%
50%
60%
70%
80%
90%
100%
1989 1990 1991 1992 1993 1994 1995 1996 1997 1998 1999 2000 2001 2002 2003
Fiscal year ended
% o
f tot
al
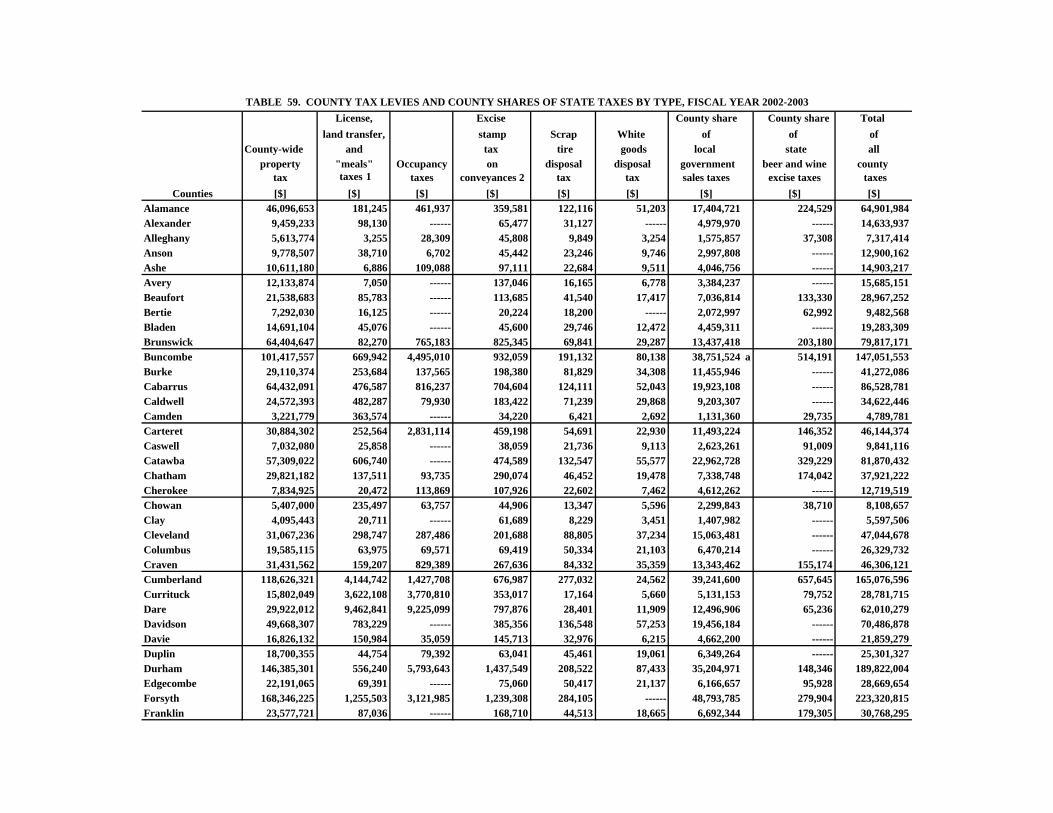
TABLE 59. COUNTY TAX LEVIES AND COUNTY SHARES OF STATE TAXES BY TYPE, FISCAL YEAR 2002-2003License, Excise County share County share Total
land transfer, stamp Scrap White of of ofCounty-wide and tax tire goods local state all
property "meals" Occupancy on disposal disposal government beer and wine county tax taxes 1 taxes conveyances 2 tax tax sales taxes excise taxes taxes
Counties [$] [$] [$] [$] [$] [$] [$] [$] [$]Alamance 46,096,653 181,245 461,937 359,581 122,116 51,203 17,404,721 224,529 64,901,984Alexander 9,459,233 98,130 ------ 65,477 31,127 ------ 4,979,970 ------ 14,633,937Alleghany 5,613,774 3,255 28,309 45,808 9,849 3,254 1,575,857 37,308 7,317,414Anson 9,778,507 38,710 6,702 45,442 23,246 9,746 2,997,808 ------ 12,900,162Ashe 10,611,180 6,886 109,088 97,111 22,684 9,511 4,046,756 ------ 14,903,217Avery 12,133,874 7,050 ------ 137,046 16,165 6,778 3,384,237 ------ 15,685,151Beaufort 21,538,683 85,783 ------ 113,685 41,540 17,417 7,036,814 133,330 28,967,252Bertie 7,292,030 16,125 ------ 20,224 18,200 ------ 2,072,997 62,992 9,482,568Bladen 14,691,104 45,076 ------ 45,600 29,746 12,472 4,459,311 ------ 19,283,309Brunswick 64,404,647 82,270 765,183 825,345 69,841 29,287 13,437,418 203,180 79,817,171Buncombe 101,417,557 669,942 4,495,010 932,059 191,132 80,138 38,751,524 a 514,191 147,051,553Burke 29,110,374 253,684 137,565 198,380 81,829 34,308 11,455,946 ------ 41,272,086Cabarrus 64,432,091 476,587 816,237 704,604 124,111 52,043 19,923,108 ------ 86,528,781Caldwell 24,572,393 482,287 79,930 183,422 71,239 29,868 9,203,307 ------ 34,622,446Camden 3,221,779 363,574 ------ 34,220 6,421 2,692 1,131,360 29,735 4,789,781Carteret 30,884,302 252,564 2,831,114 459,198 54,691 22,930 11,493,224 146,352 46,144,374Caswell 7,032,080 25,858 ------ 38,059 21,736 9,113 2,623,261 91,009 9,841,116Catawba 57,309,022 606,740 ------ 474,589 132,547 55,577 22,962,728 329,229 81,870,432Chatham 29,821,182 137,511 93,735 290,074 46,452 19,478 7,338,748 174,042 37,921,222Cherokee 7,834,925 20,472 113,869 107,926 22,602 7,462 4,612,262 ------ 12,719,519Chowan 5,407,000 235,497 63,757 44,906 13,347 5,596 2,299,843 38,710 8,108,657Clay 4,095,443 20,711 ------ 61,689 8,229 3,451 1,407,982 ------ 5,597,506Cleveland 31,067,236 298,747 287,486 201,688 88,805 37,234 15,063,481 ------ 47,044,678Columbus 19,585,115 63,975 69,571 69,419 50,334 21,103 6,470,214 ------ 26,329,732Craven 31,431,562 159,207 829,389 267,636 84,332 35,359 13,343,462 155,174 46,306,121Cumberland 118,626,321 4,144,742 1,427,708 676,987 277,032 24,562 39,241,600 657,645 165,076,596Currituck 15,802,049 3,622,108 3,770,810 353,017 17,164 5,660 5,131,153 79,752 28,781,715Dare 29,922,012 9,462,841 9,225,099 797,876 28,401 11,909 12,496,906 65,236 62,010,279Davidson 49,668,307 783,229 ------ 385,356 136,548 57,253 19,456,184 ------ 70,486,878Davie 16,826,132 150,984 35,059 145,713 32,976 6,215 4,662,200 ------ 21,859,279Duplin 18,700,355 44,754 79,392 63,041 45,461 19,061 6,349,264 ------ 25,301,327Durham 146,385,301 556,240 5,793,643 1,437,549 208,522 87,433 35,204,971 148,346 189,822,004Edgecombe 22,191,065 69,391 ------ 75,060 50,417 21,137 6,166,657 95,928 28,669,654Forsyth 168,346,225 1,255,503 3,121,985 1,239,308 284,105 ------ 48,793,785 279,904 223,320,815Franklin 23,577,721 87,036 ------ 168,710 44,513 18,665 6,692,344 179,305 30,768,295
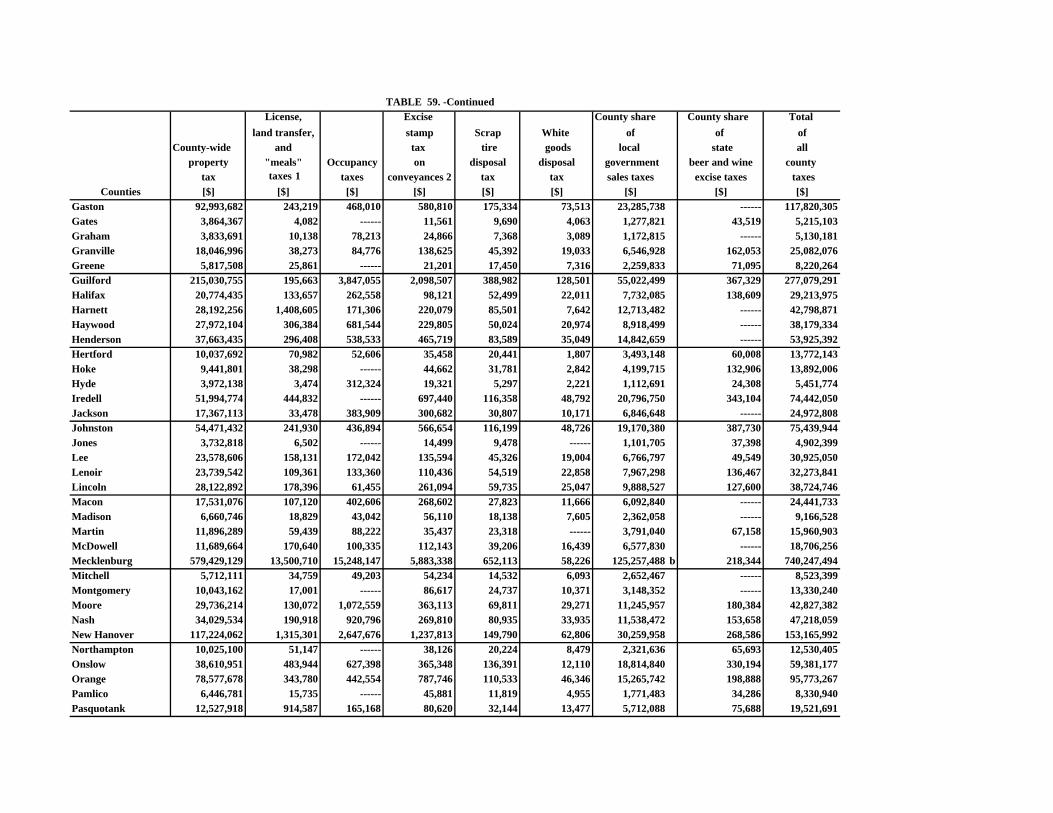
TABLE 59. -ContinuedLicense, Excise County share County share Total
land transfer, stamp Scrap White of of ofCounty-wide and tax tire goods local state all
property "meals" Occupancy on disposal disposal government beer and wine county tax taxes 1 taxes conveyances 2 tax tax sales taxes excise taxes taxes
Counties [$] [$] [$] [$] [$] [$] [$] [$] [$]Gaston 92,993,682 243,219 468,010 580,810 175,334 73,513 23,285,738 ------ 117,820,305Gates 3,864,367 4,082 ------ 11,561 9,690 4,063 1,277,821 43,519 5,215,103Graham 3,833,691 10,138 78,213 24,866 7,368 3,089 1,172,815 ------ 5,130,181Granville 18,046,996 38,273 84,776 138,625 45,392 19,033 6,546,928 162,053 25,082,076Greene 5,817,508 25,861 ------ 21,201 17,450 7,316 2,259,833 71,095 8,220,264Guilford 215,030,755 195,663 3,847,055 2,098,507 388,982 128,501 55,022,499 367,329 277,079,291Halifax 20,774,435 133,657 262,558 98,121 52,499 22,011 7,732,085 138,609 29,213,975Harnett 28,192,256 1,408,605 171,306 220,079 85,501 7,642 12,713,482 ------ 42,798,871Haywood 27,972,104 306,384 681,544 229,805 50,024 20,974 8,918,499 ------ 38,179,334Henderson 37,663,435 296,408 538,533 465,719 83,589 35,049 14,842,659 ------ 53,925,392Hertford 10,037,692 70,982 52,606 35,458 20,441 1,807 3,493,148 60,008 13,772,143Hoke 9,441,801 38,298 ------ 44,662 31,781 2,842 4,199,715 132,906 13,892,006Hyde 3,972,138 3,474 312,324 19,321 5,297 2,221 1,112,691 24,308 5,451,774Iredell 51,994,774 444,832 ------ 697,440 116,358 48,792 20,796,750 343,104 74,442,050Jackson 17,367,113 33,478 383,909 300,682 30,807 10,171 6,846,648 ------ 24,972,808Johnston 54,471,432 241,930 436,894 566,654 116,199 48,726 19,170,380 387,730 75,439,944Jones 3,732,818 6,502 ------ 14,499 9,478 ------ 1,101,705 37,398 4,902,399Lee 23,578,606 158,131 172,042 135,594 45,326 19,004 6,766,797 49,549 30,925,050Lenoir 23,739,542 109,361 133,360 110,436 54,519 22,858 7,967,298 136,467 32,273,841Lincoln 28,122,892 178,396 61,455 261,094 59,735 25,047 9,888,527 127,600 38,724,746Macon 17,531,076 107,120 402,606 268,602 27,823 11,666 6,092,840 ------ 24,441,733Madison 6,660,746 18,829 43,042 56,110 18,138 7,605 2,362,058 ------ 9,166,528Martin 11,896,289 59,439 88,222 35,437 23,318 ------ 3,791,040 67,158 15,960,903McDowell 11,689,664 170,640 100,335 112,143 39,206 16,439 6,577,830 ------ 18,706,256Mecklenburg 579,429,129 13,500,710 15,248,147 5,883,338 652,113 58,226 125,257,488 b 218,344 740,247,494Mitchell 5,712,111 34,759 49,203 54,234 14,532 6,093 2,652,467 ------ 8,523,399Montgomery 10,043,162 17,001 ------ 86,617 24,737 10,371 3,148,352 ------ 13,330,240Moore 29,736,214 130,072 1,072,559 363,113 69,811 29,271 11,245,957 180,384 42,827,382Nash 34,029,534 190,918 920,796 269,810 80,935 33,935 11,538,472 153,658 47,218,059New Hanover 117,224,062 1,315,301 2,647,676 1,237,813 149,790 62,806 30,259,958 268,586 153,165,992Northampton 10,025,100 51,147 ------ 38,126 20,224 8,479 2,321,636 65,693 12,530,405Onslow 38,610,951 483,944 627,398 365,348 136,391 12,110 18,814,840 330,194 59,381,177Orange 78,577,678 343,780 442,554 787,746 110,533 46,346 15,265,742 198,888 95,773,267Pamlico 6,446,781 15,735 ------ 45,881 11,819 4,955 1,771,483 34,286 8,330,940Pasquotank 12,527,918 914,587 165,168 80,620 32,144 13,477 5,712,088 75,688 19,521,691
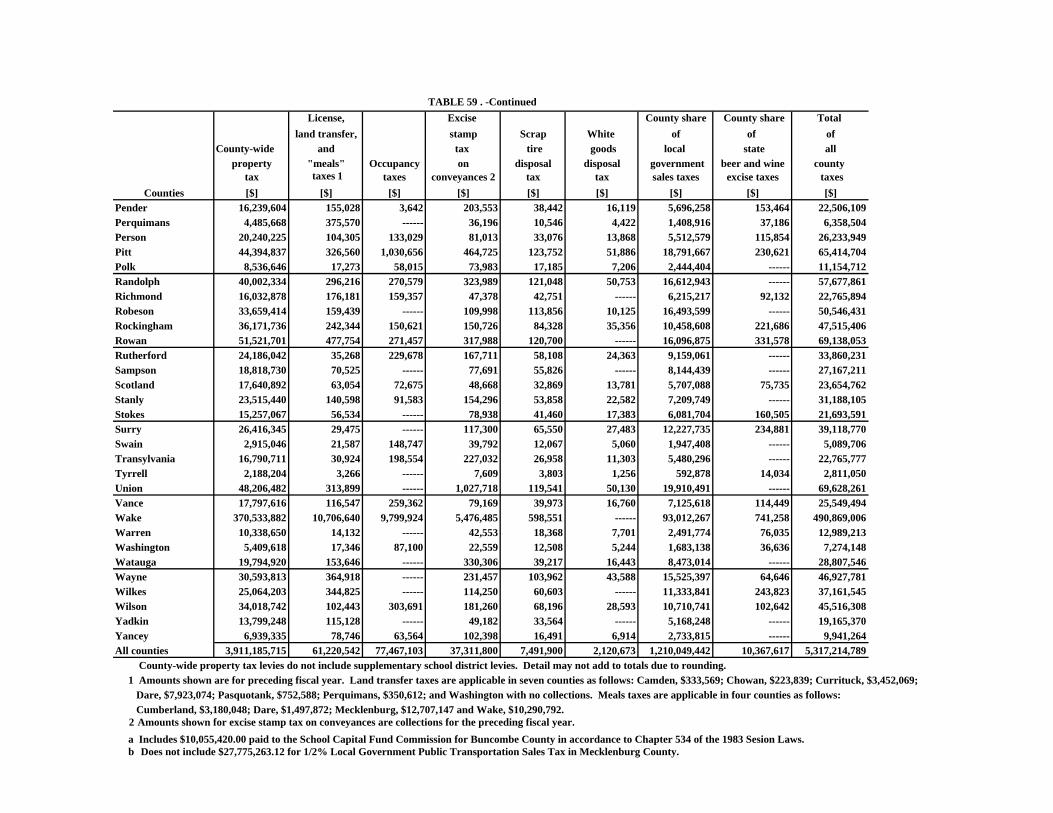
TABLE 59 . -ContinuedLicense, Excise County share County share Total
land transfer, stamp Scrap White of of ofCounty-wide and tax tire goods local state all
property "meals" Occupancy on disposal disposal government beer and wine county tax taxes 1 taxes conveyances 2 tax tax sales taxes excise taxes taxes
Counties [$] [$] [$] [$] [$] [$] [$] [$] [$]Pender 16,239,604 155,028 3,642 203,553 38,442 16,119 5,696,258 153,464 22,506,109Perquimans 4,485,668 375,570 ------ 36,196 10,546 4,422 1,408,916 37,186 6,358,504Person 20,240,225 104,305 133,029 81,013 33,076 13,868 5,512,579 115,854 26,233,949Pitt 44,394,837 326,560 1,030,656 464,725 123,752 51,886 18,791,667 230,621 65,414,704Polk 8,536,646 17,273 58,015 73,983 17,185 7,206 2,444,404 ------ 11,154,712Randolph 40,002,334 296,216 270,579 323,989 121,048 50,753 16,612,943 ------ 57,677,861Richmond 16,032,878 176,181 159,357 47,378 42,751 ------ 6,215,217 92,132 22,765,894Robeson 33,659,414 159,439 ------ 109,998 113,856 10,125 16,493,599 ------ 50,546,431Rockingham 36,171,736 242,344 150,621 150,726 84,328 35,356 10,458,608 221,686 47,515,406Rowan 51,521,701 477,754 271,457 317,988 120,700 ------ 16,096,875 331,578 69,138,053Rutherford 24,186,042 35,268 229,678 167,711 58,108 24,363 9,159,061 ------ 33,860,231Sampson 18,818,730 70,525 ------ 77,691 55,826 ------ 8,144,439 ------ 27,167,211Scotland 17,640,892 63,054 72,675 48,668 32,869 13,781 5,707,088 75,735 23,654,762Stanly 23,515,440 140,598 91,583 154,296 53,858 22,582 7,209,749 ------ 31,188,105Stokes 15,257,067 56,534 ------ 78,938 41,460 17,383 6,081,704 160,505 21,693,591Surry 26,416,345 29,475 ------ 117,300 65,550 27,483 12,227,735 234,881 39,118,770Swain 2,915,046 21,587 148,747 39,792 12,067 5,060 1,947,408 ------ 5,089,706Transylvania 16,790,711 30,924 198,554 227,032 26,958 11,303 5,480,296 ------ 22,765,777Tyrrell 2,188,204 3,266 ------ 7,609 3,803 1,256 592,878 14,034 2,811,050Union 48,206,482 313,899 ------ 1,027,718 119,541 50,130 19,910,491 ------ 69,628,261Vance 17,797,616 116,547 259,362 79,169 39,973 16,760 7,125,618 114,449 25,549,494Wake 370,533,882 10,706,640 9,799,924 5,476,485 598,551 ------ 93,012,267 741,258 490,869,006Warren 10,338,650 14,132 ------ 42,553 18,368 7,701 2,491,774 76,035 12,989,213Washington 5,409,618 17,346 87,100 22,559 12,508 5,244 1,683,138 36,636 7,274,148Watauga 19,794,920 153,646 ------ 330,306 39,217 16,443 8,473,014 ------ 28,807,546Wayne 30,593,813 364,918 ------ 231,457 103,962 43,588 15,525,397 64,646 46,927,781Wilkes 25,064,203 344,825 ------ 114,250 60,603 ------ 11,333,841 243,823 37,161,545Wilson 34,018,742 102,443 303,691 181,260 68,196 28,593 10,710,741 102,642 45,516,308Yadkin 13,799,248 115,128 ------ 49,182 33,564 ------ 5,168,248 ------ 19,165,370Yancey 6,939,335 78,746 63,564 102,398 16,491 6,914 2,733,815 ------ 9,941,264All counties 3,911,185,715 61,220,542 77,467,103 37,311,800 7,491,900 2,120,673 1,210,049,442 10,367,617 5,317,214,789 County-wide property tax levies do not include supplementary school district levies. Detail may not add to totals due to rounding. 1 Amounts shown are for preceding fiscal year. Land transfer taxes are applicable in seven counties as follows: Camden, $333,569; Chowan, $223,839; Currituck, $3,452,069; Dare, $7,923,074; Pasquotank, $752,588; Perquimans, $350,612; and Washington with no collections. Meals taxes are applicable in four counties as follows: Cumberland, $3,180,048; Dare, $1,497,872; Mecklenburg, $12,707,147 and Wake, $10,290,792. 2 Amounts shown for excise stamp tax on conveyances are collections for the preceding fiscal year. a Includes $10,055,420.00 paid to the School Capital Fund Commission for Buncombe County in accordance to Chapter 534 of the 1983 Sesion Laws. b Does not include $27,775,263.12 for 1/2% Local Government Public Transportation Sales Tax in Mecklenburg County.
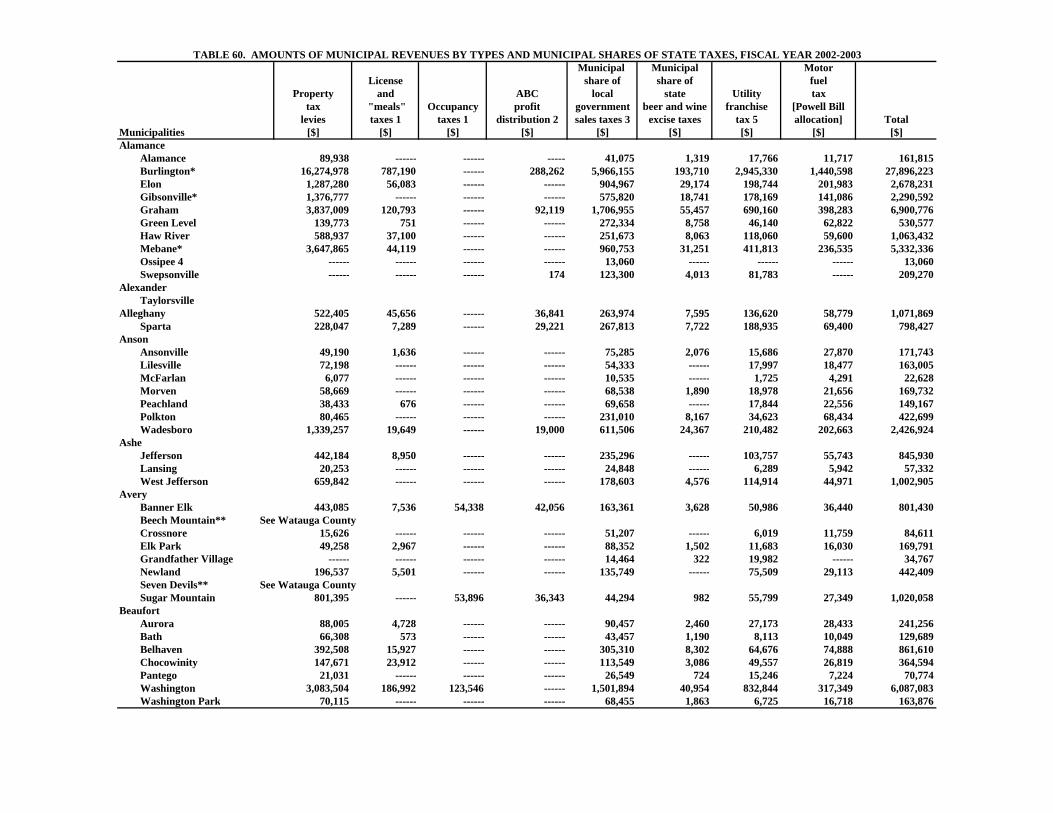
TABLE 60. AMOUNTS OF MUNICIPAL REVENUES BY TYPES AND MUNICIPAL SHARES OF STATE TAXES, FISCAL YEAR 2002-2003 Municipal Municipal Motor
License share of share of fuelProperty and ABC local state Utility tax
tax "meals" Occupancy profit government beer and wine franchise [Powell Billlevies taxes 1 taxes 1 distribution 2 sales taxes 3 excise taxes tax 5 allocation] Total
Municipalities [$] [$] [$] [$] [$] [$] [$] [$] [$]Alamance
Alamance 89,938 ------ ------ ----- 41,075 1,319 17,766 11,717 161,815Burlington* 16,274,978 787,190 ------ 288,262 5,966,155 193,710 2,945,330 1,440,598 27,896,223Elon 1,287,280 56,083 ------ ------ 904,967 29,174 198,744 201,983 2,678,231Gibsonville* 1,376,777 ------ ------ ------ 575,820 18,741 178,169 141,086 2,290,592Graham 3,837,009 120,793 ------ 92,119 1,706,955 55,457 690,160 398,283 6,900,776Green Level 139,773 751 ------ ------ 272,334 8,758 46,140 62,822 530,577Haw River 588,937 37,100 ------ ------ 251,673 8,063 118,060 59,600 1,063,432Mebane* 3,647,865 44,119 ------ ------ 960,753 31,251 411,813 236,535 5,332,336Ossipee 4 ------ ------ ------ ------ 13,060 ------ ------ ------ 13,060Swepsonville ------ ------ ------ 174 123,300 4,013 81,783 ------ 209,270
AlexanderTaylorsville
Alleghany 522,405 45,656 ------ 36,841 263,974 7,595 136,620 58,779 1,071,869Sparta 228,047 7,289 ------ 29,221 267,813 7,722 188,935 69,400 798,427
AnsonAnsonville 49,190 1,636 ------ ------ 75,285 2,076 15,686 27,870 171,743Lilesville 72,198 ------ ------ ------ 54,333 ------ 17,997 18,477 163,005McFarlan 6,077 ------ ------ ------ 10,535 ------ 1,725 4,291 22,628Morven 58,669 ------ ------ ------ 68,538 1,890 18,978 21,656 169,732Peachland 38,433 676 ------ ------ 69,658 ------ 17,844 22,556 149,167Polkton 80,465 ------ ------ ------ 231,010 8,167 34,623 68,434 422,699Wadesboro 1,339,257 19,649 ------ 19,000 611,506 24,367 210,482 202,663 2,426,924
AsheJefferson 442,184 8,950 ------ ------ 235,296 ------ 103,757 55,743 845,930Lansing 20,253 ------ ------ ------ 24,848 ------ 6,289 5,942 57,332West Jefferson 659,842 ------ ------ ------ 178,603 4,576 114,914 44,971 1,002,905
AveryBanner Elk 443,085 7,536 54,338 42,056 163,361 3,628 50,986 36,440 801,430Beech Mountain** See Watauga CountyCrossnore 15,626 ------ ------ ------ 51,207 ------ 6,019 11,759 84,611Elk Park 49,258 2,967 ------ ------ 88,352 1,502 11,683 16,030 169,791Grandfather Village ------ ------ ------ ------ 14,464 322 19,982 ------ 34,767Newland 196,537 5,501 ------ ------ 135,749 ------ 75,509 29,113 442,409Seven Devils** See Watauga CountySugar Mountain 801,395 ------ 53,896 36,343 44,294 982 55,799 27,349 1,020,058
BeaufortAurora 88,005 4,728 ------ ------ 90,457 2,460 27,173 28,433 241,256Bath 66,308 573 ------ ------ 43,457 1,190 8,113 10,049 129,689Belhaven 392,508 15,927 ------ ------ 305,310 8,302 64,676 74,888 861,610Chocowinity 147,671 23,912 ------ ------ 113,549 3,086 49,557 26,819 364,594Pantego 21,031 ------ ------ ------ 26,549 724 15,246 7,224 70,774Washington 3,083,504 186,992 123,546 ------ 1,501,894 40,954 832,844 317,349 6,087,083Washington Park 70,115 ------ ------ ------ 68,455 1,863 6,725 16,718 163,876
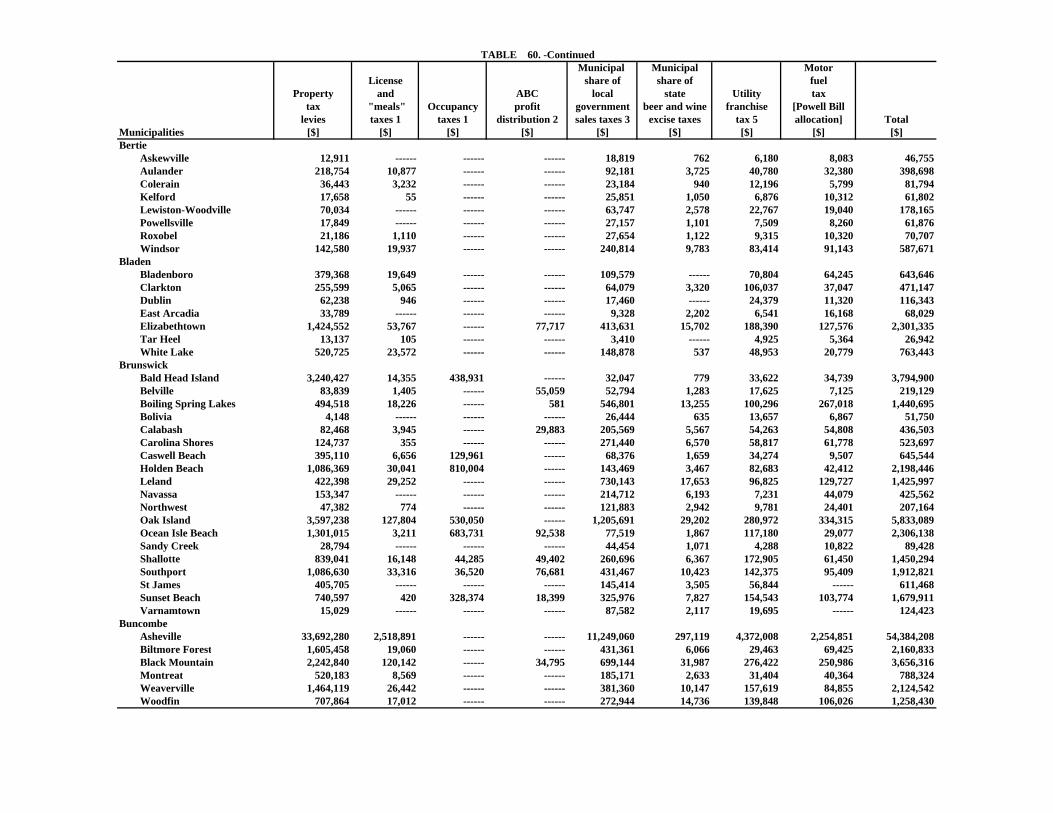
TABLE 60. -Continued Municipal Municipal Motor
License share of share of fuelProperty and ABC local state Utility tax
tax "meals" Occupancy profit government beer and wine franchise [Powell Billlevies taxes 1 taxes 1 distribution 2 sales taxes 3 excise taxes tax 5 allocation] Total
Municipalities [$] [$] [$] [$] [$] [$] [$] [$] [$]Bertie
Askewville 12,911 ------ ------ ------ 18,819 762 6,180 8,083 46,755Aulander 218,754 10,877 ------ ------ 92,181 3,725 40,780 32,380 398,698Colerain 36,443 3,232 ------ ------ 23,184 940 12,196 5,799 81,794Kelford 17,658 55 ------ ------ 25,851 1,050 6,876 10,312 61,802Lewiston-Woodville 70,034 ------ ------ ------ 63,747 2,578 22,767 19,040 178,165Powellsville 17,849 ------ ------ ------ 27,157 1,101 7,509 8,260 61,876Roxobel 21,186 1,110 ------ ------ 27,654 1,122 9,315 10,320 70,707Windsor 142,580 19,937 ------ ------ 240,814 9,783 83,414 91,143 587,671
BladenBladenboro 379,368 19,649 ------ ------ 109,579 ------ 70,804 64,245 643,646Clarkton 255,599 5,065 ------ ------ 64,079 3,320 106,037 37,047 471,147Dublin 62,238 946 ------ ------ 17,460 ------ 24,379 11,320 116,343East Arcadia 33,789 ------ ------ ------ 9,328 2,202 6,541 16,168 68,029Elizabethtown 1,424,552 53,767 ------ 77,717 413,631 15,702 188,390 127,576 2,301,335Tar Heel 13,137 105 ------ ------ 3,410 ------ 4,925 5,364 26,942White Lake 520,725 23,572 ------ ------ 148,878 537 48,953 20,779 763,443
BrunswickBald Head Island 3,240,427 14,355 438,931 ------ 32,047 779 33,622 34,739 3,794,900Belville 83,839 1,405 ------ 55,059 52,794 1,283 17,625 7,125 219,129Boiling Spring Lakes 494,518 18,226 ------ 581 546,801 13,255 100,296 267,018 1,440,695Bolivia 4,148 ------ ------ ------ 26,444 635 13,657 6,867 51,750Calabash 82,468 3,945 ------ 29,883 205,569 5,567 54,263 54,808 436,503Carolina Shores 124,737 355 ------ ------ 271,440 6,570 58,817 61,778 523,697Caswell Beach 395,110 6,656 129,961 ------ 68,376 1,659 34,274 9,507 645,544Holden Beach 1,086,369 30,041 810,004 ------ 143,469 3,467 82,683 42,412 2,198,446Leland 422,398 29,252 ------ ------ 730,143 17,653 96,825 129,727 1,425,997Navassa 153,347 ------ ------ ------ 214,712 6,193 7,231 44,079 425,562Northwest 47,382 774 ------ ------ 121,883 2,942 9,781 24,401 207,164Oak Island 3,597,238 127,804 530,050 ------ 1,205,691 29,202 280,972 334,315 5,833,089Ocean Isle Beach 1,301,015 3,211 683,731 92,538 77,519 1,867 117,180 29,077 2,306,138Sandy Creek 28,794 ------ ------ ------ 44,454 1,071 4,288 10,822 89,428Shallotte 839,041 16,148 44,285 49,402 260,696 6,367 172,905 61,450 1,450,294Southport 1,086,630 33,316 36,520 76,681 431,467 10,423 142,375 95,409 1,912,821St James 405,705 ------ ------ ------ 145,414 3,505 56,844 ------ 611,468Sunset Beach 740,597 420 328,374 18,399 325,976 7,827 154,543 103,774 1,679,911Varnamtown 15,029 ------ ------ ------ 87,582 2,117 19,695 ------ 124,423
BuncombeAsheville 33,692,280 2,518,891 ------ ------ 11,249,060 297,119 4,372,008 2,254,851 54,384,208Biltmore Forest 1,605,458 19,060 ------ ------ 431,361 6,066 29,463 69,425 2,160,833Black Mountain 2,242,840 120,142 ------ 34,795 699,144 31,987 276,422 250,986 3,656,316Montreat 520,183 8,569 ------ ------ 185,171 2,633 31,404 40,364 788,324Weaverville 1,464,119 26,442 ------ ------ 381,360 10,147 157,619 84,855 2,124,542Woodfin 707,864 17,012 ------ ------ 272,944 14,736 139,848 106,026 1,258,430
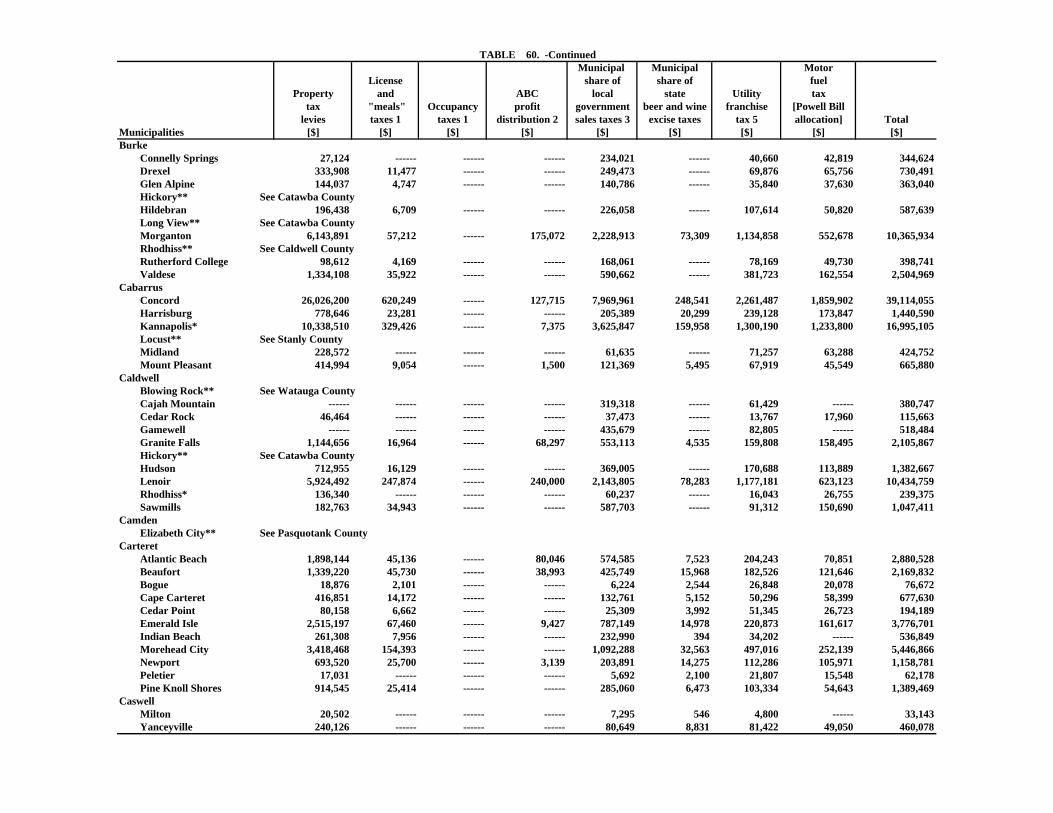
TABLE 60. -Continued Municipal Municipal Motor
License share of share of fuelProperty and ABC local state Utility tax
tax "meals" Occupancy profit government beer and wine franchise [Powell Billlevies taxes 1 taxes 1 distribution 2 sales taxes 3 excise taxes tax 5 allocation] Total
Municipalities [$] [$] [$] [$] [$] [$] [$] [$] [$]Burke
Connelly Springs 27,124 ------ ------ ------ 234,021 ------ 40,660 42,819 344,624Drexel 333,908 11,477 ------ ------ 249,473 ------ 69,876 65,756 730,491Glen Alpine 144,037 4,747 ------ ------ 140,786 ------ 35,840 37,630 363,040Hickory** See Catawba CountyHildebran 196,438 6,709 ------ ------ 226,058 ------ 107,614 50,820 587,639Long View** See Catawba CountyMorganton 6,143,891 57,212 ------ 175,072 2,228,913 73,309 1,134,858 552,678 10,365,934Rhodhiss** See Caldwell CountyRutherford College 98,612 4,169 ------ ------ 168,061 ------ 78,169 49,730 398,741Valdese 1,334,108 35,922 ------ ------ 590,662 ------ 381,723 162,554 2,504,969
CabarrusConcord 26,026,200 620,249 ------ 127,715 7,969,961 248,541 2,261,487 1,859,902 39,114,055Harrisburg 778,646 23,281 ------ ------ 205,389 20,299 239,128 173,847 1,440,590Kannapolis* 10,338,510 329,426 ------ 7,375 3,625,847 159,958 1,300,190 1,233,800 16,995,105Locust** See Stanly CountyMidland 228,572 ------ ------ ------ 61,635 ------ 71,257 63,288 424,752Mount Pleasant 414,994 9,054 ------ 1,500 121,369 5,495 67,919 45,549 665,880
CaldwellBlowing Rock** See Watauga CountyCajah Mountain ------ ------ ------ ------ 319,318 ------ 61,429 ------ 380,747Cedar Rock 46,464 ------ ------ ------ 37,473 ------ 13,767 17,960 115,663Gamewell ------ ------ ------ ------ 435,679 ------ 82,805 ------ 518,484Granite Falls 1,144,656 16,964 ------ 68,297 553,113 4,535 159,808 158,495 2,105,867Hickory** See Catawba CountyHudson 712,955 16,129 ------ ------ 369,005 ------ 170,688 113,889 1,382,667Lenoir 5,924,492 247,874 ------ 240,000 2,143,805 78,283 1,177,181 623,123 10,434,759Rhodhiss* 136,340 ------ ------ ------ 60,237 ------ 16,043 26,755 239,375Sawmills 182,763 34,943 ------ ------ 587,703 ------ 91,312 150,690 1,047,411
CamdenElizabeth City** See Pasquotank County
CarteretAtlantic Beach 1,898,144 45,136 ------ 80,046 574,585 7,523 204,243 70,851 2,880,528Beaufort 1,339,220 45,730 ------ 38,993 425,749 15,968 182,526 121,646 2,169,832Bogue 18,876 2,101 ------ ------ 6,224 2,544 26,848 20,078 76,672Cape Carteret 416,851 14,172 ------ ------ 132,761 5,152 50,296 58,399 677,630Cedar Point 80,158 6,662 ------ ------ 25,309 3,992 51,345 26,723 194,189Emerald Isle 2,515,197 67,460 ------ 9,427 787,149 14,978 220,873 161,617 3,776,701Indian Beach 261,308 7,956 ------ ------ 232,990 394 34,202 ------ 536,849Morehead City 3,418,468 154,393 ------ ------ 1,092,288 32,563 497,016 252,139 5,446,866Newport 693,520 25,700 ------ 3,139 203,891 14,275 112,286 105,971 1,158,781Peletier 17,031 ------ ------ ------ 5,692 2,100 21,807 15,548 62,178Pine Knoll Shores 914,545 25,414 ------ ------ 285,060 6,473 103,334 54,643 1,389,469
CaswellMilton 20,502 ------ ------ ------ 7,295 546 4,800 ------ 33,143Yanceyville 240,126 ------ ------ ------ 80,649 8,831 81,422 49,050 460,078
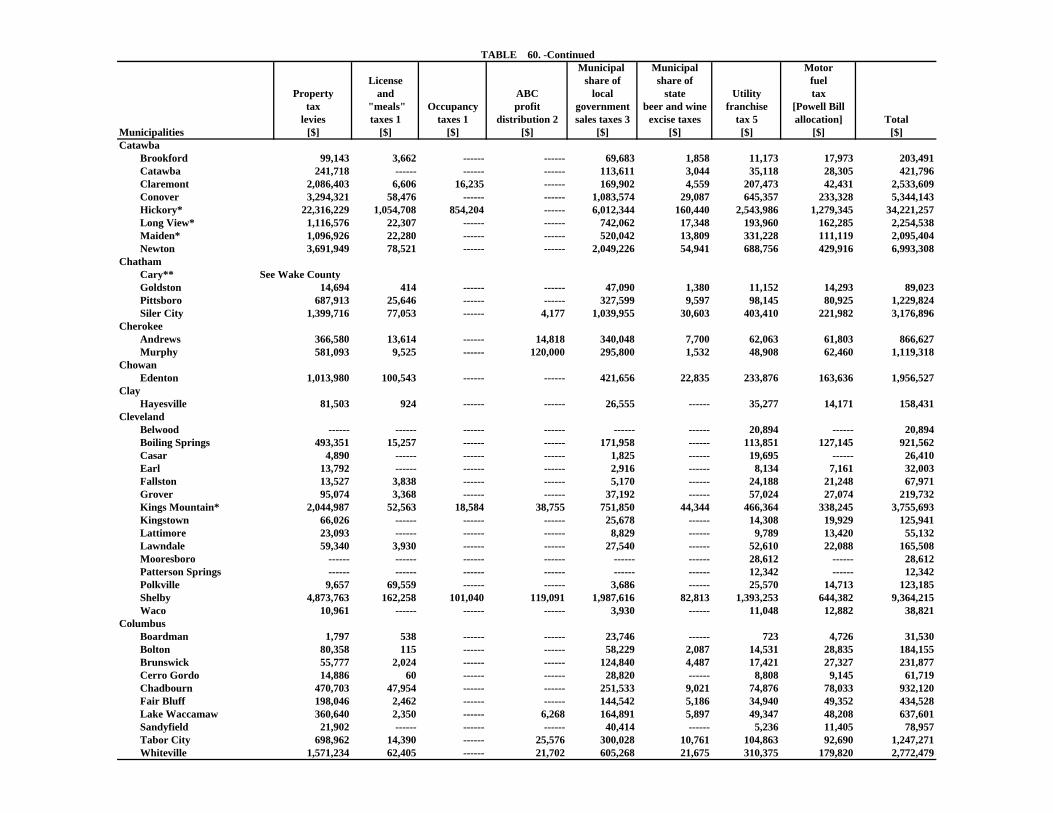
TABLE 60. -Continued Municipal Municipal Motor
License share of share of fuelProperty and ABC local state Utility tax
tax "meals" Occupancy profit government beer and wine franchise [Powell Billlevies taxes 1 taxes 1 distribution 2 sales taxes 3 excise taxes tax 5 allocation] Total
Municipalities [$] [$] [$] [$] [$] [$] [$] [$] [$]Catawba
Brookford 99,143 3,662 ------ ------ 69,683 1,858 11,173 17,973 203,491Catawba 241,718 ------ ------ ------ 113,611 3,044 35,118 28,305 421,796Claremont 2,086,403 6,606 16,235 ------ 169,902 4,559 207,473 42,431 2,533,609Conover 3,294,321 58,476 ------ ------ 1,083,574 29,087 645,357 233,328 5,344,143Hickory* 22,316,229 1,054,708 854,204 ------ 6,012,344 160,440 2,543,986 1,279,345 34,221,257Long View* 1,116,576 22,307 ------ ------ 742,062 17,348 193,960 162,285 2,254,538Maiden* 1,096,926 22,280 ------ ------ 520,042 13,809 331,228 111,119 2,095,404Newton 3,691,949 78,521 ------ ------ 2,049,226 54,941 688,756 429,916 6,993,308
ChathamCary** See Wake CountyGoldston 14,694 414 ------ ------ 47,090 1,380 11,152 14,293 89,023Pittsboro 687,913 25,646 ------ ------ 327,599 9,597 98,145 80,925 1,229,824Siler City 1,399,716 77,053 ------ 4,177 1,039,955 30,603 403,410 221,982 3,176,896
CherokeeAndrews 366,580 13,614 ------ 14,818 340,048 7,700 62,063 61,803 866,627Murphy 581,093 9,525 ------ 120,000 295,800 1,532 48,908 62,460 1,119,318
ChowanEdenton 1,013,980 100,543 ------ ------ 421,656 22,835 233,876 163,636 1,956,527
ClayHayesville 81,503 924 ------ ------ 26,555 ------ 35,277 14,171 158,431
ClevelandBelwood ------ ------ ------ ------ ------ ------ 20,894 ------ 20,894Boiling Springs 493,351 15,257 ------ ------ 171,958 ------ 113,851 127,145 921,562Casar 4,890 ------ ------ ------ 1,825 ------ 19,695 ------ 26,410Earl 13,792 ------ ------ ------ 2,916 ------ 8,134 7,161 32,003Fallston 13,527 3,838 ------ ------ 5,170 ------ 24,188 21,248 67,971Grover 95,074 3,368 ------ ------ 37,192 ------ 57,024 27,074 219,732Kings Mountain* 2,044,987 52,563 18,584 38,755 751,850 44,344 466,364 338,245 3,755,693Kingstown 66,026 ------ ------ ------ 25,678 ------ 14,308 19,929 125,941Lattimore 23,093 ------ ------ ------ 8,829 ------ 9,789 13,420 55,132Lawndale 59,340 3,930 ------ ------ 27,540 ------ 52,610 22,088 165,508Mooresboro ------ ------ ------ ------ ------ ------ 28,612 ------ 28,612Patterson Springs ------ ------ ------ ------ ------ ------ 12,342 ------ 12,342Polkville 9,657 69,559 ------ ------ 3,686 ------ 25,570 14,713 123,185Shelby 4,873,763 162,258 101,040 119,091 1,987,616 82,813 1,393,253 644,382 9,364,215Waco 10,961 ------ ------ ------ 3,930 ------ 11,048 12,882 38,821
ColumbusBoardman 1,797 538 ------ ------ 23,746 ------ 723 4,726 31,530Bolton 80,358 115 ------ ------ 58,229 2,087 14,531 28,835 184,155Brunswick 55,777 2,024 ------ ------ 124,840 4,487 17,421 27,327 231,877Cerro Gordo 14,886 60 ------ ------ 28,820 ------ 8,808 9,145 61,719Chadbourn 470,703 47,954 ------ ------ 251,533 9,021 74,876 78,033 932,120Fair Bluff 198,046 2,462 ------ ------ 144,542 5,186 34,940 49,352 434,528Lake Waccamaw 360,640 2,350 ------ 6,268 164,891 5,897 49,347 48,208 637,601Sandyfield 21,902 ------ ------ ------ 40,414 ------ 5,236 11,405 78,957Tabor City 698,962 14,390 ------ 25,576 300,028 10,761 104,863 92,690 1,247,271Whiteville 1,571,234 62,405 ------ 21,702 605,268 21,675 310,375 179,820 2,772,479
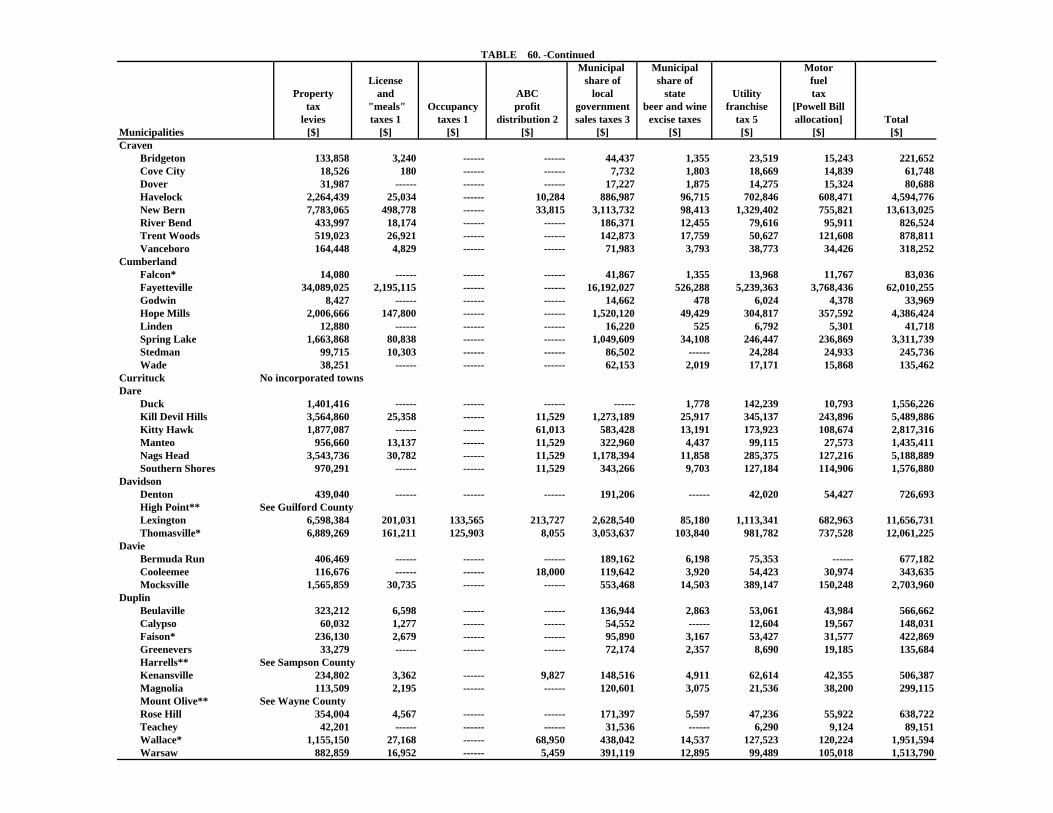
TABLE 60. -Continued Municipal Municipal Motor
License share of share of fuelProperty and ABC local state Utility tax
tax "meals" Occupancy profit government beer and wine franchise [Powell Billlevies taxes 1 taxes 1 distribution 2 sales taxes 3 excise taxes tax 5 allocation] Total
Municipalities [$] [$] [$] [$] [$] [$] [$] [$] [$]Craven
Bridgeton 133,858 3,240 ------ ------ 44,437 1,355 23,519 15,243 221,652Cove City 18,526 180 ------ ------ 7,732 1,803 18,669 14,839 61,748Dover 31,987 ------ ------ ------ 17,227 1,875 14,275 15,324 80,688Havelock 2,264,439 25,034 ------ 10,284 886,987 96,715 702,846 608,471 4,594,776New Bern 7,783,065 498,778 ------ 33,815 3,113,732 98,413 1,329,402 755,821 13,613,025River Bend 433,997 18,174 ------ ------ 186,371 12,455 79,616 95,911 826,524Trent Woods 519,023 26,921 ------ ------ 142,873 17,759 50,627 121,608 878,811Vanceboro 164,448 4,829 ------ ------ 71,983 3,793 38,773 34,426 318,252
CumberlandFalcon* 14,080 ------ ------ ------ 41,867 1,355 13,968 11,767 83,036Fayetteville 34,089,025 2,195,115 ------ ------ 16,192,027 526,288 5,239,363 3,768,436 62,010,255Godwin 8,427 ------ ------ ------ 14,662 478 6,024 4,378 33,969Hope Mills 2,006,666 147,800 ------ ------ 1,520,120 49,429 304,817 357,592 4,386,424Linden 12,880 ------ ------ ------ 16,220 525 6,792 5,301 41,718Spring Lake 1,663,868 80,838 ------ ------ 1,049,609 34,108 246,447 236,869 3,311,739Stedman 99,715 10,303 ------ ------ 86,502 ------ 24,284 24,933 245,736Wade 38,251 ------ ------ ------ 62,153 2,019 17,171 15,868 135,462
Currituck No incorporated townsDare
Duck 1,401,416 ------ ------ ------ ------ 1,778 142,239 10,793 1,556,226Kill Devil Hills 3,564,860 25,358 ------ 11,529 1,273,189 25,917 345,137 243,896 5,489,886Kitty Hawk 1,877,087 ------ ------ 61,013 583,428 13,191 173,923 108,674 2,817,316Manteo 956,660 13,137 ------ 11,529 322,960 4,437 99,115 27,573 1,435,411Nags Head 3,543,736 30,782 ------ 11,529 1,178,394 11,858 285,375 127,216 5,188,889Southern Shores 970,291 ------ ------ 11,529 343,266 9,703 127,184 114,906 1,576,880
DavidsonDenton 439,040 ------ ------ ------ 191,206 ------ 42,020 54,427 726,693High Point** See Guilford CountyLexington 6,598,384 201,031 133,565 213,727 2,628,540 85,180 1,113,341 682,963 11,656,731Thomasville* 6,889,269 161,211 125,903 8,055 3,053,637 103,840 981,782 737,528 12,061,225
DavieBermuda Run 406,469 ------ ------ ------ 189,162 6,198 75,353 ------ 677,182Cooleemee 116,676 ------ ------ 18,000 119,642 3,920 54,423 30,974 343,635Mocksville 1,565,859 30,735 ------ ------ 553,468 14,503 389,147 150,248 2,703,960
DuplinBeulaville 323,212 6,598 ------ ------ 136,944 2,863 53,061 43,984 566,662Calypso 60,032 1,277 ------ ------ 54,552 ------ 12,604 19,567 148,031Faison* 236,130 2,679 ------ ------ 95,890 3,167 53,427 31,577 422,869Greenevers 33,279 ------ ------ ------ 72,174 2,357 8,690 19,185 135,684Harrells** See Sampson CountyKenansville 234,802 3,362 ------ 9,827 148,516 4,911 62,614 42,355 506,387Magnolia 113,509 2,195 ------ ------ 120,601 3,075 21,536 38,200 299,115Mount Olive** See Wayne CountyRose Hill 354,004 4,567 ------ ------ 171,397 5,597 47,236 55,922 638,722Teachey 42,201 ------ ------ ------ 31,536 ------ 6,290 9,124 89,151Wallace* 1,155,150 27,168 ------ 68,950 438,042 14,537 127,523 120,224 1,951,594Warsaw 882,859 16,952 ------ 5,459 391,119 12,895 99,489 105,018 1,513,790
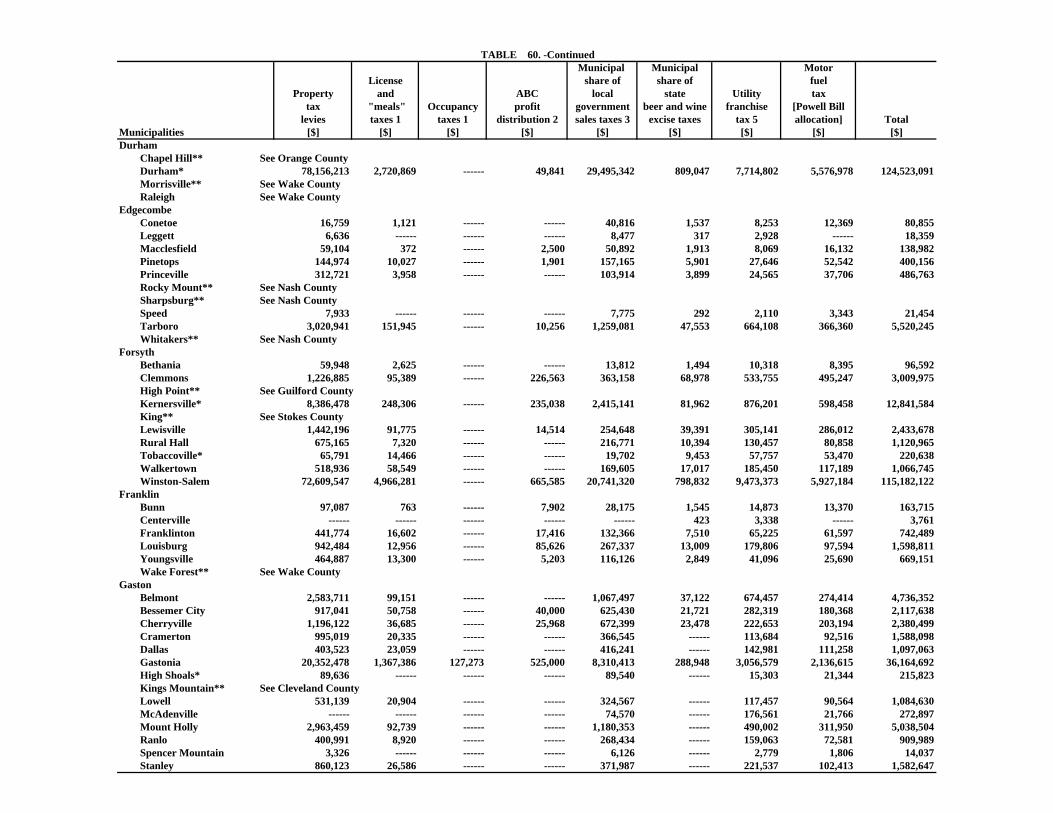
TABLE 60. -Continued Municipal Municipal Motor
License share of share of fuelProperty and ABC local state Utility tax
tax "meals" Occupancy profit government beer and wine franchise [Powell Billlevies taxes 1 taxes 1 distribution 2 sales taxes 3 excise taxes tax 5 allocation] Total
Municipalities [$] [$] [$] [$] [$] [$] [$] [$] [$]Durham
Chapel Hill** See Orange CountyDurham* 78,156,213 2,720,869 ------ 49,841 29,495,342 809,047 7,714,802 5,576,978 124,523,091Morrisville** See Wake CountyRaleigh See Wake County
EdgecombeConetoe 16,759 1,121 ------ ------ 40,816 1,537 8,253 12,369 80,855Leggett 6,636 ------ ------ ------ 8,477 317 2,928 ------ 18,359Macclesfield 59,104 372 ------ 2,500 50,892 1,913 8,069 16,132 138,982Pinetops 144,974 10,027 ------ 1,901 157,165 5,901 27,646 52,542 400,156Princeville 312,721 3,958 ------ ------ 103,914 3,899 24,565 37,706 486,763Rocky Mount** See Nash CountySharpsburg** See Nash CountySpeed 7,933 ------ ------ ------ 7,775 292 2,110 3,343 21,454Tarboro 3,020,941 151,945 ------ 10,256 1,259,081 47,553 664,108 366,360 5,520,245Whitakers** See Nash County
ForsythBethania 59,948 2,625 ------ ------ 13,812 1,494 10,318 8,395 96,592Clemmons 1,226,885 95,389 ------ 226,563 363,158 68,978 533,755 495,247 3,009,975High Point** See Guilford CountyKernersville* 8,386,478 248,306 ------ 235,038 2,415,141 81,962 876,201 598,458 12,841,584King** See Stokes CountyLewisville 1,442,196 91,775 ------ 14,514 254,648 39,391 305,141 286,012 2,433,678Rural Hall 675,165 7,320 ------ ------ 216,771 10,394 130,457 80,858 1,120,965Tobaccoville* 65,791 14,466 ------ ------ 19,702 9,453 57,757 53,470 220,638Walkertown 518,936 58,549 ------ ------ 169,605 17,017 185,450 117,189 1,066,745Winston-Salem 72,609,547 4,966,281 ------ 665,585 20,741,320 798,832 9,473,373 5,927,184 115,182,122
FranklinBunn 97,087 763 ------ 7,902 28,175 1,545 14,873 13,370 163,715Centerville ------ ------ ------ ------ ------ 423 3,338 ------ 3,761Franklinton 441,774 16,602 ------ 17,416 132,366 7,510 65,225 61,597 742,489Louisburg 942,484 12,956 ------ 85,626 267,337 13,009 179,806 97,594 1,598,811Youngsville 464,887 13,300 ------ 5,203 116,126 2,849 41,096 25,690 669,151Wake Forest** See Wake County
GastonBelmont 2,583,711 99,151 ------ ------ 1,067,497 37,122 674,457 274,414 4,736,352Bessemer City 917,041 50,758 ------ 40,000 625,430 21,721 282,319 180,368 2,117,638Cherryville 1,196,122 36,685 ------ 25,968 672,399 23,478 222,653 203,194 2,380,499Cramerton 995,019 20,335 ------ ------ 366,545 ------ 113,684 92,516 1,588,098Dallas 403,523 23,059 ------ ------ 416,241 ------ 142,981 111,258 1,097,063Gastonia 20,352,478 1,367,386 127,273 525,000 8,310,413 288,948 3,056,579 2,136,615 36,164,692High Shoals* 89,636 ------ ------ ------ 89,540 ------ 15,303 21,344 215,823Kings Mountain** See Cleveland CountyLowell 531,139 20,904 ------ ------ 324,567 ------ 117,457 90,564 1,084,630McAdenville ------ ------ ------ ------ 74,570 ------ 176,561 21,766 272,897Mount Holly 2,963,459 92,739 ------ ------ 1,180,353 ------ 490,002 311,950 5,038,504Ranlo 400,991 8,920 ------ ------ 268,434 ------ 159,063 72,581 909,989Spencer Mountain 3,326 ------ ------ ------ 6,126 ------ 2,779 1,806 14,037Stanley 860,123 26,586 ------ ------ 371,987 ------ 221,537 102,413 1,582,647
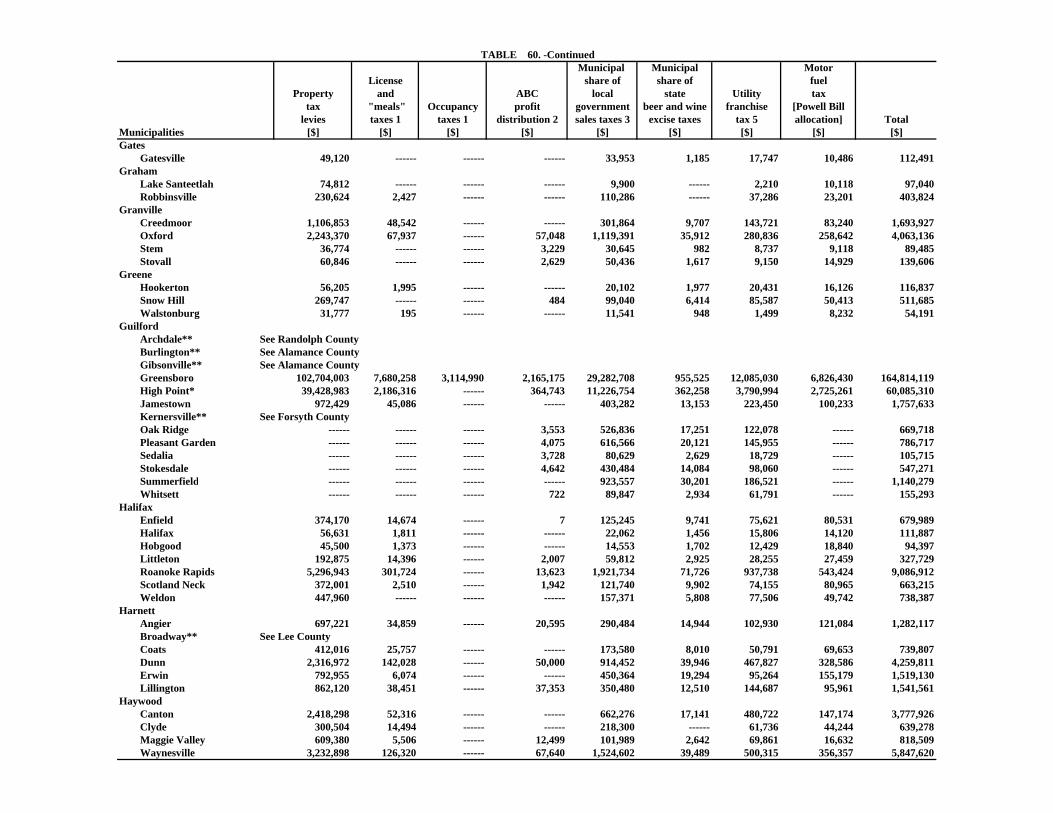
TABLE 60. -Continued Municipal Municipal Motor
License share of share of fuelProperty and ABC local state Utility tax
tax "meals" Occupancy profit government beer and wine franchise [Powell Billlevies taxes 1 taxes 1 distribution 2 sales taxes 3 excise taxes tax 5 allocation] Total
Municipalities [$] [$] [$] [$] [$] [$] [$] [$] [$]Gates
Gatesville 49,120 ------ ------ ------ 33,953 1,185 17,747 10,486 112,491Graham
Lake Santeetlah 74,812 ------ ------ ------ 9,900 ------ 2,210 10,118 97,040Robbinsville 230,624 2,427 ------ ------ 110,286 ------ 37,286 23,201 403,824
GranvilleCreedmoor 1,106,853 48,542 ------ ------ 301,864 9,707 143,721 83,240 1,693,927Oxford 2,243,370 67,937 ------ 57,048 1,119,391 35,912 280,836 258,642 4,063,136Stem 36,774 ------ ------ 3,229 30,645 982 8,737 9,118 89,485Stovall 60,846 ------ ------ 2,629 50,436 1,617 9,150 14,929 139,606
GreeneHookerton 56,205 1,995 ------ ------ 20,102 1,977 20,431 16,126 116,837Snow Hill 269,747 ------ ------ 484 99,040 6,414 85,587 50,413 511,685Walstonburg 31,777 195 ------ ------ 11,541 948 1,499 8,232 54,191
GuilfordArchdale** See Randolph CountyBurlington** See Alamance CountyGibsonville** See Alamance CountyGreensboro 102,704,003 7,680,258 3,114,990 2,165,175 29,282,708 955,525 12,085,030 6,826,430 164,814,119High Point* 39,428,983 2,186,316 ------ 364,743 11,226,754 362,258 3,790,994 2,725,261 60,085,310Jamestown 972,429 45,086 ------ ------ 403,282 13,153 223,450 100,233 1,757,633Kernersville** See Forsyth CountyOak Ridge ------ ------ ------ 3,553 526,836 17,251 122,078 ------ 669,718Pleasant Garden ------ ------ ------ 4,075 616,566 20,121 145,955 ------ 786,717Sedalia ------ ------ ------ 3,728 80,629 2,629 18,729 ------ 105,715Stokesdale ------ ------ ------ 4,642 430,484 14,084 98,060 ------ 547,271Summerfield ------ ------ ------ ------ 923,557 30,201 186,521 ------ 1,140,279Whitsett ------ ------ ------ 722 89,847 2,934 61,791 ------ 155,293
HalifaxEnfield 374,170 14,674 ------ 7 125,245 9,741 75,621 80,531 679,989Halifax 56,631 1,811 ------ ------ 22,062 1,456 15,806 14,120 111,887Hobgood 45,500 1,373 ------ ------ 14,553 1,702 12,429 18,840 94,397Littleton 192,875 14,396 ------ 2,007 59,812 2,925 28,255 27,459 327,729Roanoke Rapids 5,296,943 301,724 ------ 13,623 1,921,734 71,726 937,738 543,424 9,086,912Scotland Neck 372,001 2,510 ------ 1,942 121,740 9,902 74,155 80,965 663,215Weldon 447,960 ------ ------ ------ 157,371 5,808 77,506 49,742 738,387
HarnettAngier 697,221 34,859 ------ 20,595 290,484 14,944 102,930 121,084 1,282,117Broadway** See Lee CountyCoats 412,016 25,757 ------ ------ 173,580 8,010 50,791 69,653 739,807Dunn 2,316,972 142,028 ------ 50,000 914,452 39,946 467,827 328,586 4,259,811Erwin 792,955 6,074 ------ ------ 450,364 19,294 95,264 155,179 1,519,130Lillington 862,120 38,451 ------ 37,353 350,480 12,510 144,687 95,961 1,541,561
HaywoodCanton 2,418,298 52,316 ------ ------ 662,276 17,141 480,722 147,174 3,777,926Clyde 300,504 14,494 ------ ------ 218,300 ------ 61,736 44,244 639,278Maggie Valley 609,380 5,506 ------ 12,499 101,989 2,642 69,861 16,632 818,509Waynesville 3,232,898 126,320 ------ 67,640 1,524,602 39,489 500,315 356,357 5,847,620
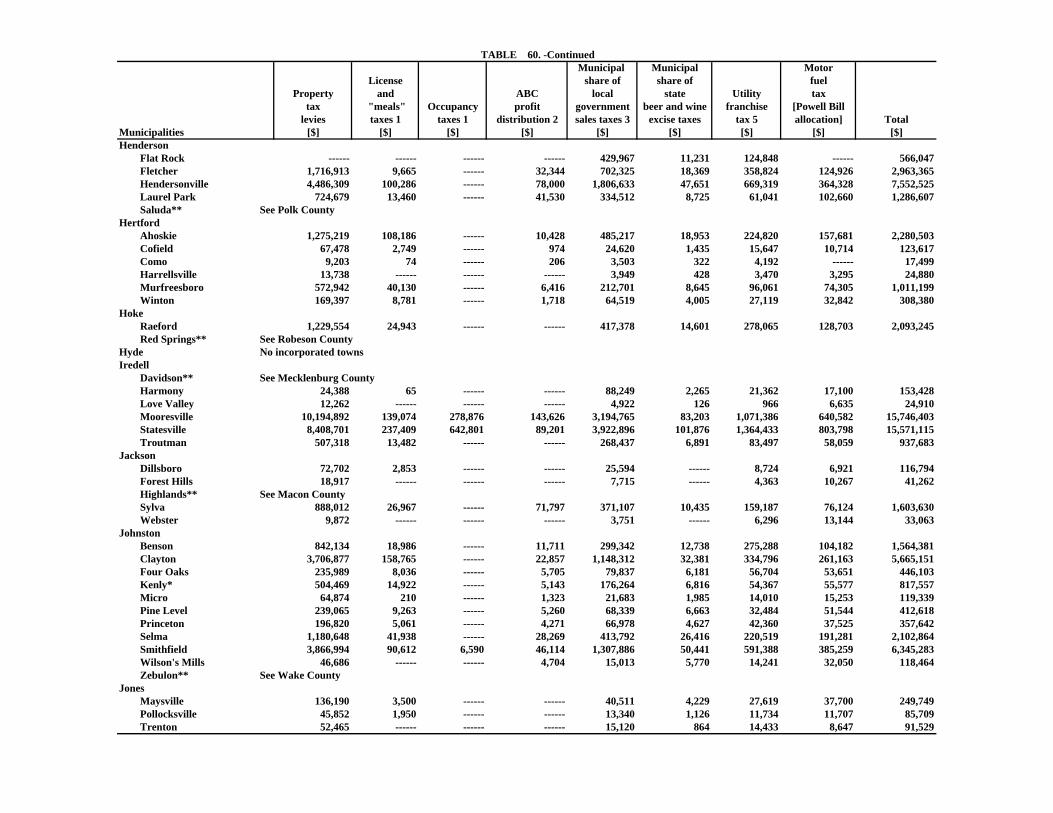
TABLE 60. -Continued Municipal Municipal Motor
License share of share of fuelProperty and ABC local state Utility tax
tax "meals" Occupancy profit government beer and wine franchise [Powell Billlevies taxes 1 taxes 1 distribution 2 sales taxes 3 excise taxes tax 5 allocation] Total
Municipalities [$] [$] [$] [$] [$] [$] [$] [$] [$]Henderson
Flat Rock ------ ------ ------ ------ 429,967 11,231 124,848 ------ 566,047Fletcher 1,716,913 9,665 ------ 32,344 702,325 18,369 358,824 124,926 2,963,365Hendersonville 4,486,309 100,286 ------ 78,000 1,806,633 47,651 669,319 364,328 7,552,525Laurel Park 724,679 13,460 ------ 41,530 334,512 8,725 61,041 102,660 1,286,607Saluda** See Polk County
HertfordAhoskie 1,275,219 108,186 ------ 10,428 485,217 18,953 224,820 157,681 2,280,503Cofield 67,478 2,749 ------ 974 24,620 1,435 15,647 10,714 123,617Como 9,203 74 ------ 206 3,503 322 4,192 ------ 17,499Harrellsville 13,738 ------ ------ ------ 3,949 428 3,470 3,295 24,880Murfreesboro 572,942 40,130 ------ 6,416 212,701 8,645 96,061 74,305 1,011,199Winton 169,397 8,781 ------ 1,718 64,519 4,005 27,119 32,842 308,380
HokeRaeford 1,229,554 24,943 ------ ------ 417,378 14,601 278,065 128,703 2,093,245Red Springs** See Robeson County
Hyde No incorporated townsIredell
Davidson** See Mecklenburg CountyHarmony 24,388 65 ------ ------ 88,249 2,265 21,362 17,100 153,428Love Valley 12,262 ------ ------ ------ 4,922 126 966 6,635 24,910Mooresville 10,194,892 139,074 278,876 143,626 3,194,765 83,203 1,071,386 640,582 15,746,403Statesville 8,408,701 237,409 642,801 89,201 3,922,896 101,876 1,364,433 803,798 15,571,115Troutman 507,318 13,482 ------ ------ 268,437 6,891 83,497 58,059 937,683
JacksonDillsboro 72,702 2,853 ------ ------ 25,594 ------ 8,724 6,921 116,794Forest Hills 18,917 ------ ------ ------ 7,715 ------ 4,363 10,267 41,262Highlands** See Macon CountySylva 888,012 26,967 ------ 71,797 371,107 10,435 159,187 76,124 1,603,630Webster 9,872 ------ ------ ------ 3,751 ------ 6,296 13,144 33,063
JohnstonBenson 842,134 18,986 ------ 11,711 299,342 12,738 275,288 104,182 1,564,381Clayton 3,706,877 158,765 ------ 22,857 1,148,312 32,381 334,796 261,163 5,665,151Four Oaks 235,989 8,036 ------ 5,705 79,837 6,181 56,704 53,651 446,103Kenly* 504,469 14,922 ------ 5,143 176,264 6,816 54,367 55,577 817,557Micro 64,874 210 ------ 1,323 21,683 1,985 14,010 15,253 119,339Pine Level 239,065 9,263 ------ 5,260 68,339 6,663 32,484 51,544 412,618Princeton 196,820 5,061 ------ 4,271 66,978 4,627 42,360 37,525 357,642Selma 1,180,648 41,938 ------ 28,269 413,792 26,416 220,519 191,281 2,102,864Smithfield 3,866,994 90,612 6,590 46,114 1,307,886 50,441 591,388 385,259 6,345,283Wilson's Mills 46,686 ------ ------ 4,704 15,013 5,770 14,241 32,050 118,464Zebulon** See Wake County
JonesMaysville 136,190 3,500 ------ ------ 40,511 4,229 27,619 37,700 249,749Pollocksville 45,852 1,950 ------ ------ 13,340 1,126 11,734 11,707 85,709Trenton 52,465 ------ ------ ------ 15,120 864 14,433 8,647 91,529
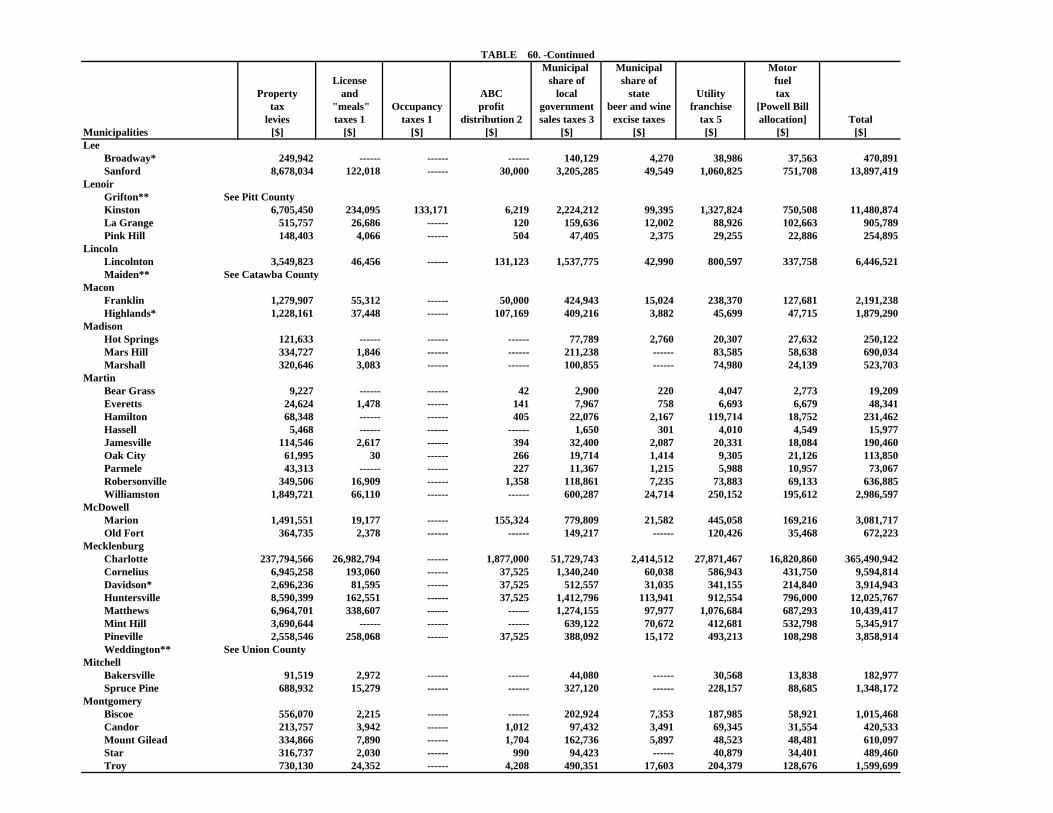
TABLE 60. -Continued Municipal Municipal Motor
License share of share of fuelProperty and ABC local state Utility tax
tax "meals" Occupancy profit government beer and wine franchise [Powell Billlevies taxes 1 taxes 1 distribution 2 sales taxes 3 excise taxes tax 5 allocation] Total
Municipalities [$] [$] [$] [$] [$] [$] [$] [$] [$]Lee
Broadway* 249,942 ------ ------ ------ 140,129 4,270 38,986 37,563 470,891Sanford 8,678,034 122,018 ------ 30,000 3,205,285 49,549 1,060,825 751,708 13,897,419
LenoirGrifton** See Pitt CountyKinston 6,705,450 234,095 133,171 6,219 2,224,212 99,395 1,327,824 750,508 11,480,874La Grange 515,757 26,686 ------ 120 159,636 12,002 88,926 102,663 905,789Pink Hill 148,403 4,066 ------ 504 47,405 2,375 29,255 22,886 254,895
LincolnLincolnton 3,549,823 46,456 ------ 131,123 1,537,775 42,990 800,597 337,758 6,446,521Maiden** See Catawba County
MaconFranklin 1,279,907 55,312 ------ 50,000 424,943 15,024 238,370 127,681 2,191,238Highlands* 1,228,161 37,448 ------ 107,169 409,216 3,882 45,699 47,715 1,879,290
MadisonHot Springs 121,633 ------ ------ ------ 77,789 2,760 20,307 27,632 250,122Mars Hill 334,727 1,846 ------ ------ 211,238 ------ 83,585 58,638 690,034Marshall 320,646 3,083 ------ ------ 100,855 ------ 74,980 24,139 523,703
MartinBear Grass 9,227 ------ ------ 42 2,900 220 4,047 2,773 19,209Everetts 24,624 1,478 ------ 141 7,967 758 6,693 6,679 48,341Hamilton 68,348 ------ ------ 405 22,076 2,167 119,714 18,752 231,462Hassell 5,468 ------ ------ ------ 1,650 301 4,010 4,549 15,977Jamesville 114,546 2,617 ------ 394 32,400 2,087 20,331 18,084 190,460Oak City 61,995 30 ------ 266 19,714 1,414 9,305 21,126 113,850Parmele 43,313 ------ ------ 227 11,367 1,215 5,988 10,957 73,067Robersonville 349,506 16,909 ------ 1,358 118,861 7,235 73,883 69,133 636,885Williamston 1,849,721 66,110 ------ ------ 600,287 24,714 250,152 195,612 2,986,597
McDowellMarion 1,491,551 19,177 ------ 155,324 779,809 21,582 445,058 169,216 3,081,717Old Fort 364,735 2,378 ------ ------ 149,217 ------ 120,426 35,468 672,223
MecklenburgCharlotte 237,794,566 26,982,794 ------ 1,877,000 51,729,743 2,414,512 27,871,467 16,820,860 365,490,942Cornelius 6,945,258 193,060 ------ 37,525 1,340,240 60,038 586,943 431,750 9,594,814Davidson* 2,696,236 81,595 ------ 37,525 512,557 31,035 341,155 214,840 3,914,943Huntersville 8,590,399 162,551 ------ 37,525 1,412,796 113,941 912,554 796,000 12,025,767Matthews 6,964,701 338,607 ------ ------ 1,274,155 97,977 1,076,684 687,293 10,439,417Mint Hill 3,690,644 ------ ------ ------ 639,122 70,672 412,681 532,798 5,345,917Pineville 2,558,546 258,068 ------ 37,525 388,092 15,172 493,213 108,298 3,858,914Weddington** See Union County
MitchellBakersville 91,519 2,972 ------ ------ 44,080 ------ 30,568 13,838 182,977Spruce Pine 688,932 15,279 ------ ------ 327,120 ------ 228,157 88,685 1,348,172
MontgomeryBiscoe 556,070 2,215 ------ ------ 202,924 7,353 187,985 58,921 1,015,468Candor 213,757 3,942 ------ 1,012 97,432 3,491 69,345 31,554 420,533Mount Gilead 334,866 7,890 ------ 1,704 162,736 5,897 48,523 48,481 610,097Star 316,737 2,030 ------ 990 94,423 ------ 40,879 34,401 489,460Troy 730,130 24,352 ------ 4,208 490,351 17,603 204,379 128,676 1,599,699
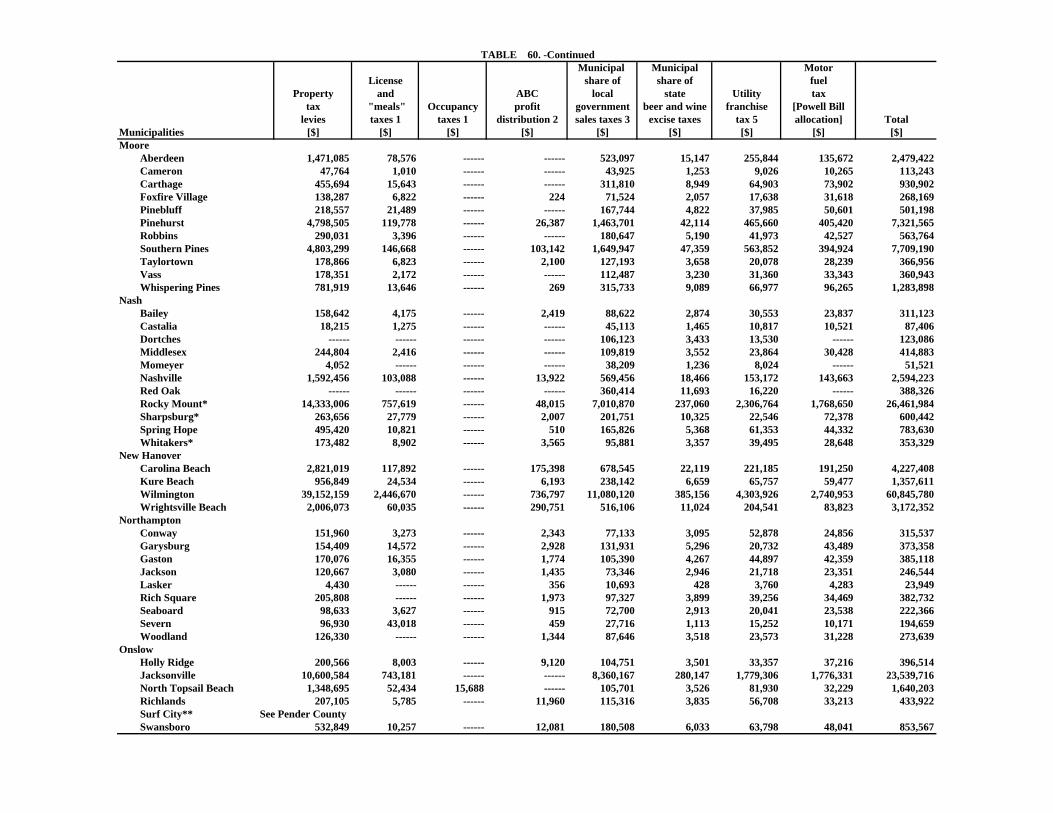
TABLE 60. -Continued Municipal Municipal Motor
License share of share of fuelProperty and ABC local state Utility tax
tax "meals" Occupancy profit government beer and wine franchise [Powell Billlevies taxes 1 taxes 1 distribution 2 sales taxes 3 excise taxes tax 5 allocation] Total
Municipalities [$] [$] [$] [$] [$] [$] [$] [$] [$]Moore
Aberdeen 1,471,085 78,576 ------ ------ 523,097 15,147 255,844 135,672 2,479,422Cameron 47,764 1,010 ------ ------ 43,925 1,253 9,026 10,265 113,243Carthage 455,694 15,643 ------ ------ 311,810 8,949 64,903 73,902 930,902Foxfire Village 138,287 6,822 ------ 224 71,524 2,057 17,638 31,618 268,169Pinebluff 218,557 21,489 ------ ------ 167,744 4,822 37,985 50,601 501,198Pinehurst 4,798,505 119,778 ------ 26,387 1,463,701 42,114 465,660 405,420 7,321,565Robbins 290,031 3,396 ------ ------ 180,647 5,190 41,973 42,527 563,764Southern Pines 4,803,299 146,668 ------ 103,142 1,649,947 47,359 563,852 394,924 7,709,190Taylortown 178,866 6,823 ------ 2,100 127,193 3,658 20,078 28,239 366,956Vass 178,351 2,172 ------ ------ 112,487 3,230 31,360 33,343 360,943Whispering Pines 781,919 13,646 ------ 269 315,733 9,089 66,977 96,265 1,283,898
NashBailey 158,642 4,175 ------ 2,419 88,622 2,874 30,553 23,837 311,123Castalia 18,215 1,275 ------ ------ 45,113 1,465 10,817 10,521 87,406Dortches ------ ------ ------ ------ 106,123 3,433 13,530 ------ 123,086Middlesex 244,804 2,416 ------ ------ 109,819 3,552 23,864 30,428 414,883Momeyer 4,052 ------ ------ ------ 38,209 1,236 8,024 ------ 51,521Nashville 1,592,456 103,088 ------ 13,922 569,456 18,466 153,172 143,663 2,594,223Red Oak ------ ------ ------ ------ 360,414 11,693 16,220 ------ 388,326Rocky Mount* 14,333,006 757,619 ------ 48,015 7,010,870 237,060 2,306,764 1,768,650 26,461,984Sharpsburg* 263,656 27,779 ------ 2,007 201,751 10,325 22,546 72,378 600,442Spring Hope 495,420 10,821 ------ 510 165,826 5,368 61,353 44,332 783,630Whitakers* 173,482 8,902 ------ 3,565 95,881 3,357 39,495 28,648 353,329
New HanoverCarolina Beach 2,821,019 117,892 ------ 175,398 678,545 22,119 221,185 191,250 4,227,408Kure Beach 956,849 24,534 ------ 6,193 238,142 6,659 65,757 59,477 1,357,611Wilmington 39,152,159 2,446,670 ------ 736,797 11,080,120 385,156 4,303,926 2,740,953 60,845,780Wrightsville Beach 2,006,073 60,035 ------ 290,751 516,106 11,024 204,541 83,823 3,172,352
NorthamptonConway 151,960 3,273 ------ 2,343 77,133 3,095 52,878 24,856 315,537Garysburg 154,409 14,572 ------ 2,928 131,931 5,296 20,732 43,489 373,358Gaston 170,076 16,355 ------ 1,774 105,390 4,267 44,897 42,359 385,118Jackson 120,667 3,080 ------ 1,435 73,346 2,946 21,718 23,351 246,544Lasker 4,430 ------ ------ 356 10,693 428 3,760 4,283 23,949Rich Square 205,808 ------ ------ 1,973 97,327 3,899 39,256 34,469 382,732Seaboard 98,633 3,627 ------ 915 72,700 2,913 20,041 23,538 222,366Severn 96,930 43,018 ------ 459 27,716 1,113 15,252 10,171 194,659Woodland 126,330 ------ ------ 1,344 87,646 3,518 23,573 31,228 273,639
OnslowHolly Ridge 200,566 8,003 ------ 9,120 104,751 3,501 33,357 37,216 396,514Jacksonville 10,600,584 743,181 ------ ------ 8,360,167 280,147 1,779,306 1,776,331 23,539,716North Topsail Beach 1,348,695 52,434 15,688 ------ 105,701 3,526 81,930 32,229 1,640,203Richlands 207,105 5,785 ------ 11,960 115,316 3,835 56,708 33,213 433,922Surf City** See Pender CountySwansboro 532,849 10,257 ------ 12,081 180,508 6,033 63,798 48,041 853,567
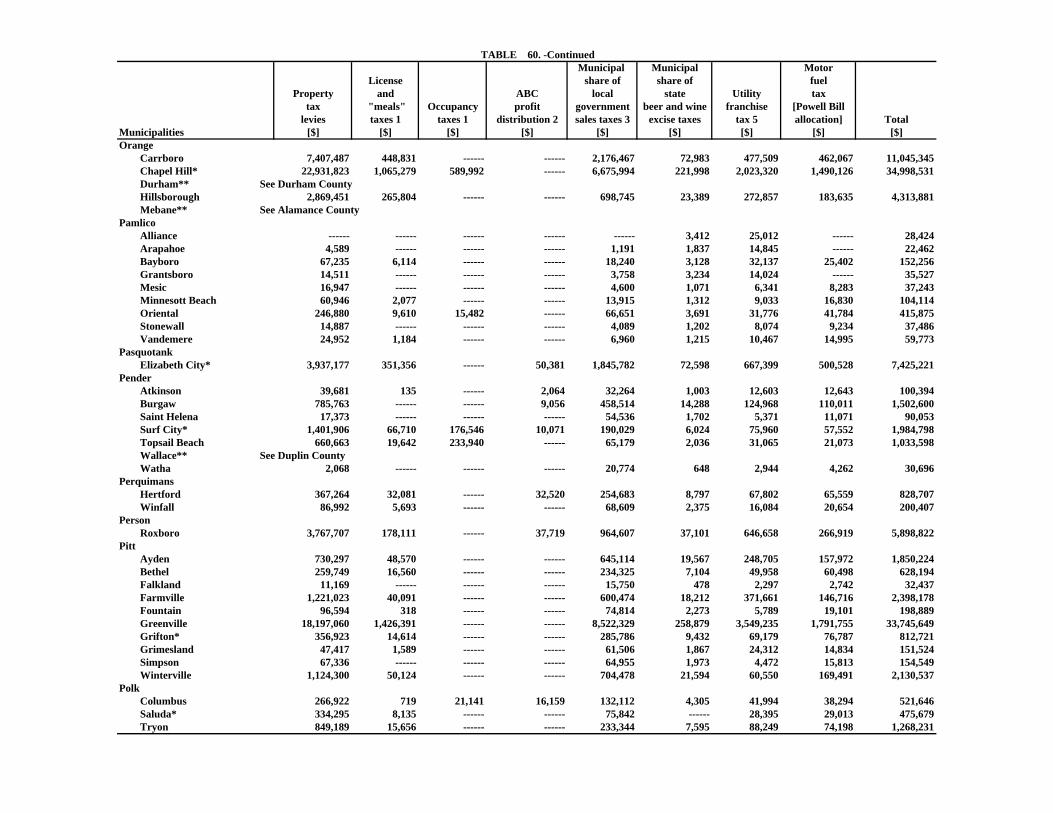
TABLE 60. -Continued Municipal Municipal Motor
License share of share of fuelProperty and ABC local state Utility tax
tax "meals" Occupancy profit government beer and wine franchise [Powell Billlevies taxes 1 taxes 1 distribution 2 sales taxes 3 excise taxes tax 5 allocation] Total
Municipalities [$] [$] [$] [$] [$] [$] [$] [$] [$]Orange
Carrboro 7,407,487 448,831 ------ ------ 2,176,467 72,983 477,509 462,067 11,045,345Chapel Hill* 22,931,823 1,065,279 589,992 ------ 6,675,994 221,998 2,023,320 1,490,126 34,998,531Durham** See Durham CountyHillsborough 2,869,451 265,804 ------ ------ 698,745 23,389 272,857 183,635 4,313,881Mebane** See Alamance County
PamlicoAlliance ------ ------ ------ ------ ------ 3,412 25,012 ------ 28,424Arapahoe 4,589 ------ ------ ------ 1,191 1,837 14,845 ------ 22,462Bayboro 67,235 6,114 ------ ------ 18,240 3,128 32,137 25,402 152,256Grantsboro 14,511 ------ ------ ------ 3,758 3,234 14,024 ------ 35,527Mesic 16,947 ------ ------ ------ 4,600 1,071 6,341 8,283 37,243Minnesott Beach 60,946 2,077 ------ ------ 13,915 1,312 9,033 16,830 104,114Oriental 246,880 9,610 15,482 ------ 66,651 3,691 31,776 41,784 415,875Stonewall 14,887 ------ ------ ------ 4,089 1,202 8,074 9,234 37,486Vandemere 24,952 1,184 ------ ------ 6,960 1,215 10,467 14,995 59,773
PasquotankElizabeth City* 3,937,177 351,356 ------ 50,381 1,845,782 72,598 667,399 500,528 7,425,221
PenderAtkinson 39,681 135 ------ 2,064 32,264 1,003 12,603 12,643 100,394Burgaw 785,763 ------ ------ 9,056 458,514 14,288 124,968 110,011 1,502,600Saint Helena 17,373 ------ ------ ------ 54,536 1,702 5,371 11,071 90,053Surf City* 1,401,906 66,710 176,546 10,071 190,029 6,024 75,960 57,552 1,984,798Topsail Beach 660,663 19,642 233,940 ------ 65,179 2,036 31,065 21,073 1,033,598Wallace** See Duplin CountyWatha 2,068 ------ ------ ------ 20,774 648 2,944 4,262 30,696
PerquimansHertford 367,264 32,081 ------ 32,520 254,683 8,797 67,802 65,559 828,707Winfall 86,992 5,693 ------ ------ 68,609 2,375 16,084 20,654 200,407
PersonRoxboro 3,767,707 178,111 ------ 37,719 964,607 37,101 646,658 266,919 5,898,822
PittAyden 730,297 48,570 ------ ------ 645,114 19,567 248,705 157,972 1,850,224Bethel 259,749 16,560 ------ ------ 234,325 7,104 49,958 60,498 628,194Falkland 11,169 ------ ------ ------ 15,750 478 2,297 2,742 32,437Farmville 1,221,023 40,091 ------ ------ 600,474 18,212 371,661 146,716 2,398,178Fountain 96,594 318 ------ ------ 74,814 2,273 5,789 19,101 198,889Greenville 18,197,060 1,426,391 ------ ------ 8,522,329 258,879 3,549,235 1,791,755 33,745,649Grifton* 356,923 14,614 ------ ------ 285,786 9,432 69,179 76,787 812,721Grimesland 47,417 1,589 ------ ------ 61,506 1,867 24,312 14,834 151,524Simpson 67,336 ------ ------ ------ 64,955 1,973 4,472 15,813 154,549Winterville 1,124,300 50,124 ------ ------ 704,478 21,594 60,550 169,491 2,130,537
PolkColumbus 266,922 719 21,141 16,159 132,112 4,305 41,994 38,294 521,646Saluda* 334,295 8,135 ------ ------ 75,842 ------ 28,395 29,013 475,679Tryon 849,189 15,656 ------ ------ 233,344 7,595 88,249 74,198 1,268,231
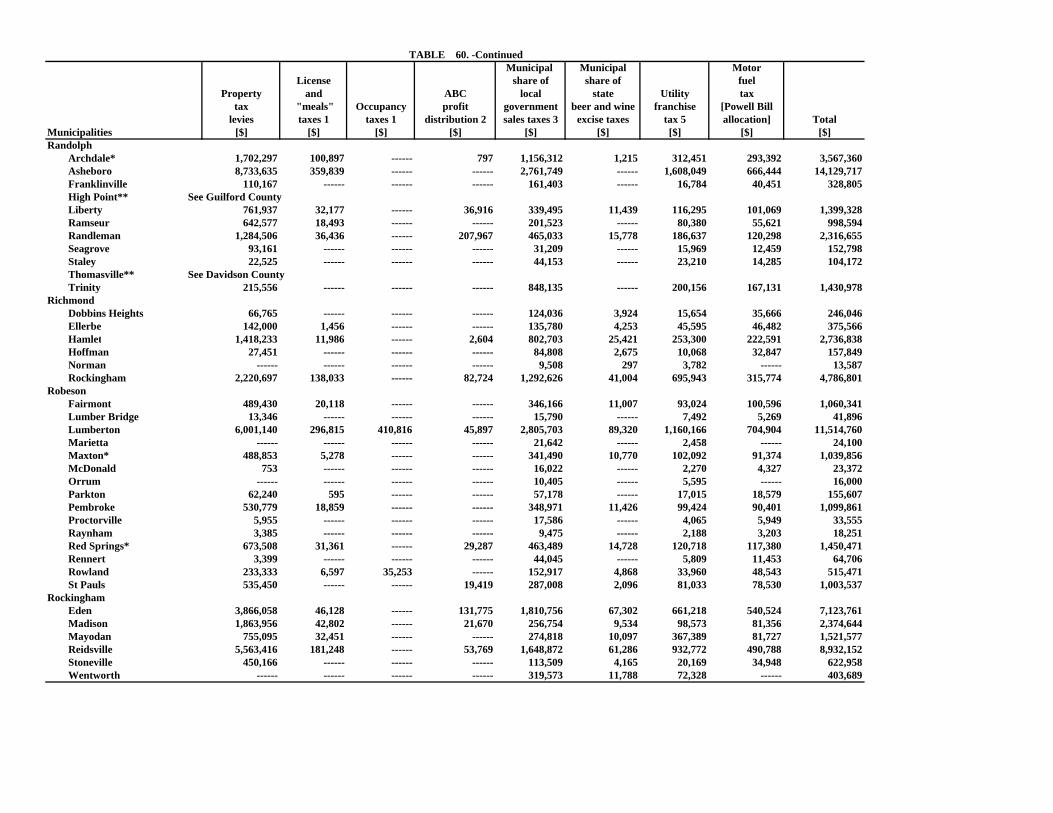
TABLE 60. -Continued Municipal Municipal Motor
License share of share of fuelProperty and ABC local state Utility tax
tax "meals" Occupancy profit government beer and wine franchise [Powell Billlevies taxes 1 taxes 1 distribution 2 sales taxes 3 excise taxes tax 5 allocation] Total
Municipalities [$] [$] [$] [$] [$] [$] [$] [$] [$]Randolph
Archdale* 1,702,297 100,897 ------ 797 1,156,312 1,215 312,451 293,392 3,567,360Asheboro 8,733,635 359,839 ------ ------ 2,761,749 ------ 1,608,049 666,444 14,129,717Franklinville 110,167 ------ ------ ------ 161,403 ------ 16,784 40,451 328,805High Point** See Guilford CountyLiberty 761,937 32,177 ------ 36,916 339,495 11,439 116,295 101,069 1,399,328Ramseur 642,577 18,493 ------ ------ 201,523 ------ 80,380 55,621 998,594Randleman 1,284,506 36,436 ------ 207,967 465,033 15,778 186,637 120,298 2,316,655Seagrove 93,161 ------ ------ ------ 31,209 ------ 15,969 12,459 152,798Staley 22,525 ------ ------ ------ 44,153 ------ 23,210 14,285 104,172Thomasville** See Davidson CountyTrinity 215,556 ------ ------ ------ 848,135 ------ 200,156 167,131 1,430,978
RichmondDobbins Heights 66,765 ------ ------ ------ 124,036 3,924 15,654 35,666 246,046Ellerbe 142,000 1,456 ------ ------ 135,780 4,253 45,595 46,482 375,566Hamlet 1,418,233 11,986 ------ 2,604 802,703 25,421 253,300 222,591 2,736,838Hoffman 27,451 ------ ------ ------ 84,808 2,675 10,068 32,847 157,849Norman ------ ------ ------ ------ 9,508 297 3,782 ------ 13,587Rockingham 2,220,697 138,033 ------ 82,724 1,292,626 41,004 695,943 315,774 4,786,801
RobesonFairmont 489,430 20,118 ------ ------ 346,166 11,007 93,024 100,596 1,060,341Lumber Bridge 13,346 ------ ------ ------ 15,790 ------ 7,492 5,269 41,896Lumberton 6,001,140 296,815 410,816 45,897 2,805,703 89,320 1,160,166 704,904 11,514,760Marietta ------ ------ ------ ------ 21,642 ------ 2,458 ------ 24,100Maxton* 488,853 5,278 ------ ------ 341,490 10,770 102,092 91,374 1,039,856McDonald 753 ------ ------ ------ 16,022 ------ 2,270 4,327 23,372Orrum ------ ------ ------ ------ 10,405 ------ 5,595 ------ 16,000Parkton 62,240 595 ------ ------ 57,178 ------ 17,015 18,579 155,607Pembroke 530,779 18,859 ------ ------ 348,971 11,426 99,424 90,401 1,099,861Proctorville 5,955 ------ ------ ------ 17,586 ------ 4,065 5,949 33,555Raynham 3,385 ------ ------ ------ 9,475 ------ 2,188 3,203 18,251Red Springs* 673,508 31,361 ------ 29,287 463,489 14,728 120,718 117,380 1,450,471Rennert 3,399 ------ ------ ------ 44,045 ------ 5,809 11,453 64,706Rowland 233,333 6,597 35,253 ------ 152,917 4,868 33,960 48,543 515,471St Pauls 535,450 ------ ------ 19,419 287,008 2,096 81,033 78,530 1,003,537
RockinghamEden 3,866,058 46,128 ------ 131,775 1,810,756 67,302 661,218 540,524 7,123,761Madison 1,863,956 42,802 ------ 21,670 256,754 9,534 98,573 81,356 2,374,644Mayodan 755,095 32,451 ------ ------ 274,818 10,097 367,389 81,727 1,521,577Reidsville 5,563,416 181,248 ------ 53,769 1,648,872 61,286 932,772 490,788 8,932,152Stoneville 450,166 ------ ------ ------ 113,509 4,165 20,169 34,948 622,958Wentworth ------ ------ ------ ------ 319,573 11,788 72,328 ------ 403,689
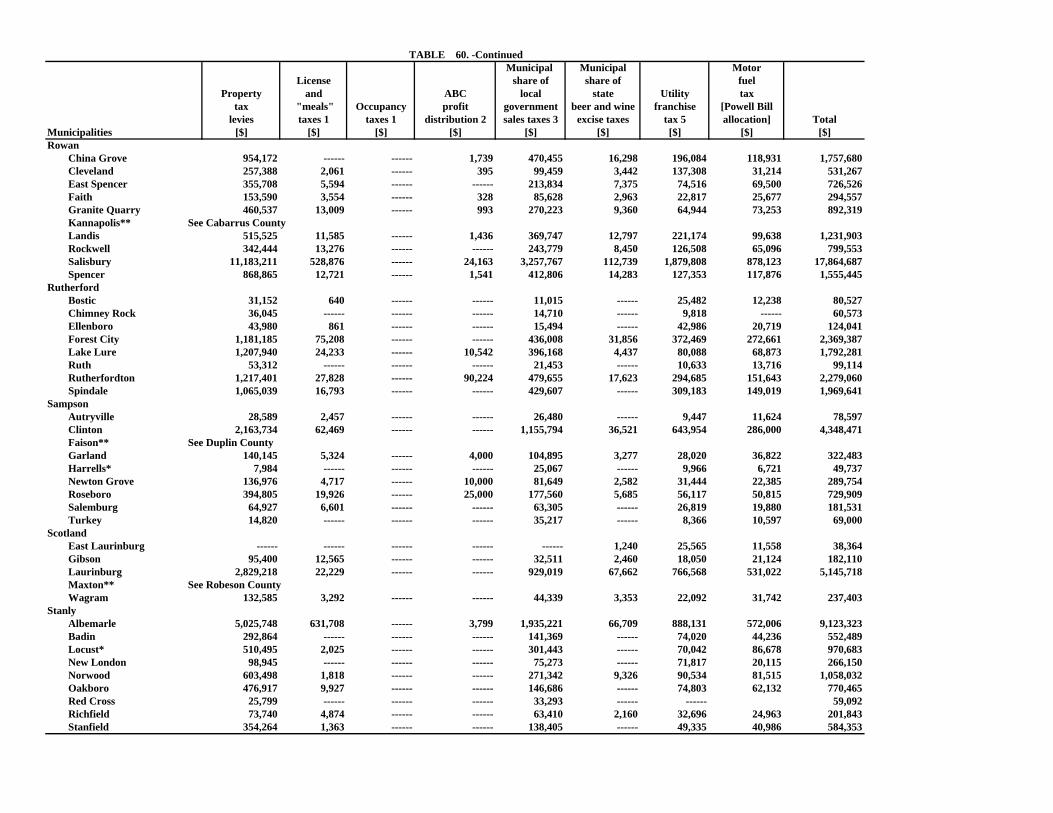
TABLE 60. -Continued Municipal Municipal Motor
License share of share of fuelProperty and ABC local state Utility tax
tax "meals" Occupancy profit government beer and wine franchise [Powell Billlevies taxes 1 taxes 1 distribution 2 sales taxes 3 excise taxes tax 5 allocation] Total
Municipalities [$] [$] [$] [$] [$] [$] [$] [$] [$]Rowan
China Grove 954,172 ------ ------ 1,739 470,455 16,298 196,084 118,931 1,757,680Cleveland 257,388 2,061 ------ 395 99,459 3,442 137,308 31,214 531,267East Spencer 355,708 5,594 ------ ------ 213,834 7,375 74,516 69,500 726,526Faith 153,590 3,554 ------ 328 85,628 2,963 22,817 25,677 294,557Granite Quarry 460,537 13,009 ------ 993 270,223 9,360 64,944 73,253 892,319Kannapolis** See Cabarrus CountyLandis 515,525 11,585 ------ 1,436 369,747 12,797 221,174 99,638 1,231,903Rockwell 342,444 13,276 ------ ------ 243,779 8,450 126,508 65,096 799,553Salisbury 11,183,211 528,876 ------ 24,163 3,257,767 112,739 1,879,808 878,123 17,864,687Spencer 868,865 12,721 ------ 1,541 412,806 14,283 127,353 117,876 1,555,445
RutherfordBostic 31,152 640 ------ ------ 11,015 ------ 25,482 12,238 80,527Chimney Rock 36,045 ------ ------ ------ 14,710 ------ 9,818 ------ 60,573Ellenboro 43,980 861 ------ ------ 15,494 ------ 42,986 20,719 124,041Forest City 1,181,185 75,208 ------ ------ 436,008 31,856 372,469 272,661 2,369,387Lake Lure 1,207,940 24,233 ------ 10,542 396,168 4,437 80,088 68,873 1,792,281Ruth 53,312 ------ ------ ------ 21,453 ------ 10,633 13,716 99,114Rutherfordton 1,217,401 27,828 ------ 90,224 479,655 17,623 294,685 151,643 2,279,060Spindale 1,065,039 16,793 ------ ------ 429,607 ------ 309,183 149,019 1,969,641
SampsonAutryville 28,589 2,457 ------ ------ 26,480 ------ 9,447 11,624 78,597Clinton 2,163,734 62,469 ------ ------ 1,155,794 36,521 643,954 286,000 4,348,471Faison** See Duplin CountyGarland 140,145 5,324 ------ 4,000 104,895 3,277 28,020 36,822 322,483Harrells* 7,984 ------ ------ ------ 25,067 ------ 9,966 6,721 49,737Newton Grove 136,976 4,717 ------ 10,000 81,649 2,582 31,444 22,385 289,754Roseboro 394,805 19,926 ------ 25,000 177,560 5,685 56,117 50,815 729,909Salemburg 64,927 6,601 ------ ------ 63,305 ------ 26,819 19,880 181,531Turkey 14,820 ------ ------ ------ 35,217 ------ 8,366 10,597 69,000
ScotlandEast Laurinburg ------ ------ ------ ------ ------ 1,240 25,565 11,558 38,364Gibson 95,400 12,565 ------ ------ 32,511 2,460 18,050 21,124 182,110Laurinburg 2,829,218 22,229 ------ ------ 929,019 67,662 766,568 531,022 5,145,718Maxton** See Robeson CountyWagram 132,585 3,292 ------ ------ 44,339 3,353 22,092 31,742 237,403
StanlyAlbemarle 5,025,748 631,708 ------ 3,799 1,935,221 66,709 888,131 572,006 9,123,323Badin 292,864 ------ ------ ------ 141,369 ------ 74,020 44,236 552,489Locust* 510,495 2,025 ------ ------ 301,443 ------ 70,042 86,678 970,683New London 98,945 ------ ------ ------ 75,273 ------ 71,817 20,115 266,150Norwood 603,498 1,818 ------ ------ 271,342 9,326 90,534 81,515 1,058,032Oakboro 476,917 9,927 ------ ------ 146,686 ------ 74,803 62,132 770,465Red Cross 25,799 ------ ------ ------ 33,293 ------ ------ 59,092Richfield 73,740 4,874 ------ ------ 63,410 2,160 32,696 24,963 201,843Stanfield 354,264 1,363 ------ ------ 138,405 ------ 49,335 40,986 584,353
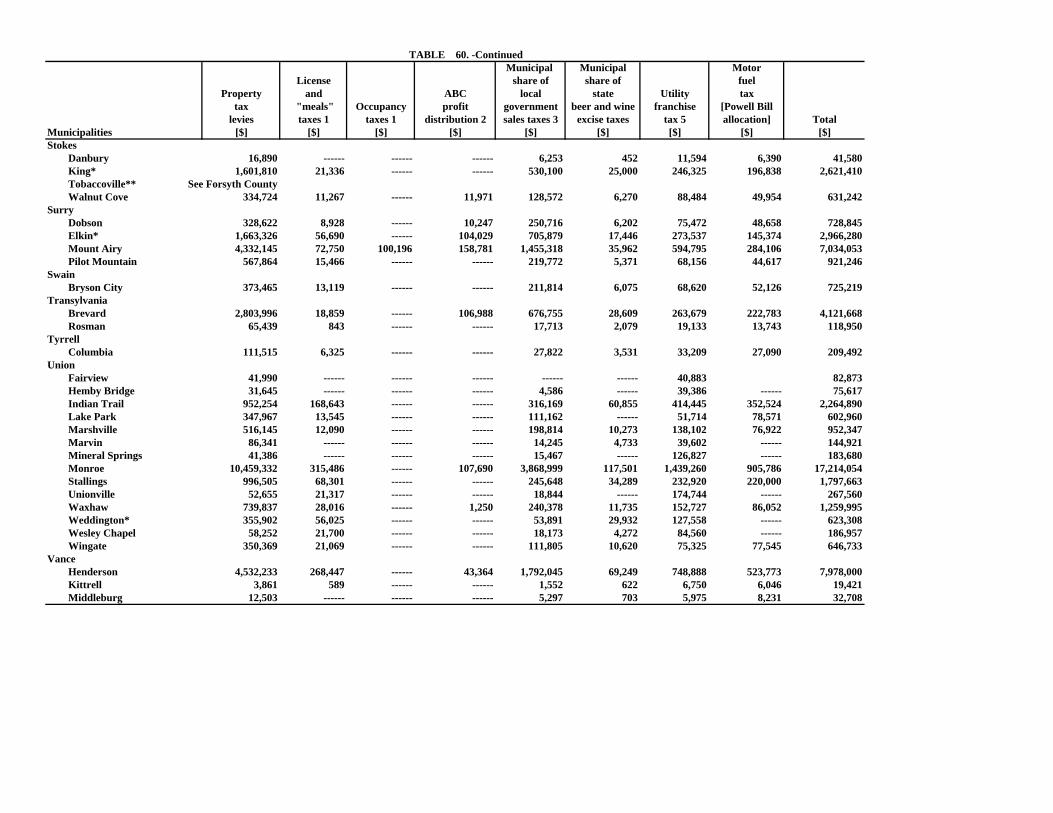
TABLE 60. -Continued Municipal Municipal Motor
License share of share of fuelProperty and ABC local state Utility tax
tax "meals" Occupancy profit government beer and wine franchise [Powell Billlevies taxes 1 taxes 1 distribution 2 sales taxes 3 excise taxes tax 5 allocation] Total
Municipalities [$] [$] [$] [$] [$] [$] [$] [$] [$]Stokes
Danbury 16,890 ------ ------ ------ 6,253 452 11,594 6,390 41,580King* 1,601,810 21,336 ------ ------ 530,100 25,000 246,325 196,838 2,621,410Tobaccoville** See Forsyth CountyWalnut Cove 334,724 11,267 ------ 11,971 128,572 6,270 88,484 49,954 631,242
SurryDobson 328,622 8,928 ------ 10,247 250,716 6,202 75,472 48,658 728,845Elkin* 1,663,326 56,690 ------ 104,029 705,879 17,446 273,537 145,374 2,966,280Mount Airy 4,332,145 72,750 100,196 158,781 1,455,318 35,962 594,795 284,106 7,034,053Pilot Mountain 567,864 15,466 ------ ------ 219,772 5,371 68,156 44,617 921,246
SwainBryson City 373,465 13,119 ------ ------ 211,814 6,075 68,620 52,126 725,219
TransylvaniaBrevard 2,803,996 18,859 ------ 106,988 676,755 28,609 263,679 222,783 4,121,668Rosman 65,439 843 ------ ------ 17,713 2,079 19,133 13,743 118,950
TyrrellColumbia 111,515 6,325 ------ ------ 27,822 3,531 33,209 27,090 209,492
UnionFairview 41,990 ------ ------ ------ ------ ------ 40,883 82,873Hemby Bridge 31,645 ------ ------ ------ 4,586 ------ 39,386 ------ 75,617Indian Trail 952,254 168,643 ------ ------ 316,169 60,855 414,445 352,524 2,264,890Lake Park 347,967 13,545 ------ ------ 111,162 ------ 51,714 78,571 602,960Marshville 516,145 12,090 ------ ------ 198,814 10,273 138,102 76,922 952,347Marvin 86,341 ------ ------ ------ 14,245 4,733 39,602 ------ 144,921Mineral Springs 41,386 ------ ------ ------ 15,467 ------ 126,827 ------ 183,680Monroe 10,459,332 315,486 ------ 107,690 3,868,999 117,501 1,439,260 905,786 17,214,054Stallings 996,505 68,301 ------ ------ 245,648 34,289 232,920 220,000 1,797,663Unionville 52,655 21,317 ------ ------ 18,844 ------ 174,744 ------ 267,560Waxhaw 739,837 28,016 ------ 1,250 240,378 11,735 152,727 86,052 1,259,995Weddington* 355,902 56,025 ------ ------ 53,891 29,932 127,558 ------ 623,308Wesley Chapel 58,252 21,700 ------ ------ 18,173 4,272 84,560 ------ 186,957Wingate 350,369 21,069 ------ ------ 111,805 10,620 75,325 77,545 646,733
VanceHenderson 4,532,233 268,447 ------ 43,364 1,792,045 69,249 748,888 523,773 7,978,000Kittrell 3,861 589 ------ ------ 1,552 622 6,750 6,046 19,421Middleburg 12,503 ------ ------ ------ 5,297 703 5,975 8,231 32,708
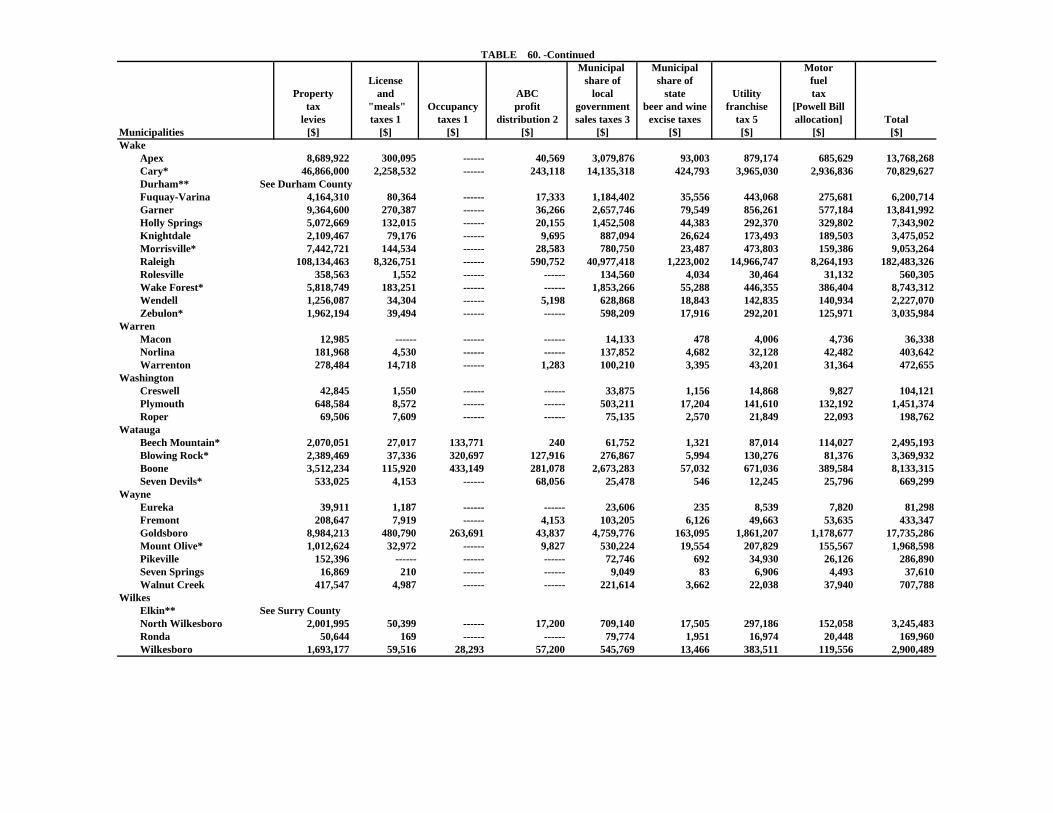
TABLE 60. -Continued Municipal Municipal Motor
License share of share of fuelProperty and ABC local state Utility tax
tax "meals" Occupancy profit government beer and wine franchise [Powell Billlevies taxes 1 taxes 1 distribution 2 sales taxes 3 excise taxes tax 5 allocation] Total
Municipalities [$] [$] [$] [$] [$] [$] [$] [$] [$]Wake
Apex 8,689,922 300,095 ------ 40,569 3,079,876 93,003 879,174 685,629 13,768,268Cary* 46,866,000 2,258,532 ------ 243,118 14,135,318 424,793 3,965,030 2,936,836 70,829,627Durham** See Durham CountyFuquay-Varina 4,164,310 80,364 ------ 17,333 1,184,402 35,556 443,068 275,681 6,200,714Garner 9,364,600 270,387 ------ 36,266 2,657,746 79,549 856,261 577,184 13,841,992Holly Springs 5,072,669 132,015 ------ 20,155 1,452,508 44,383 292,370 329,802 7,343,902Knightdale 2,109,467 79,176 ------ 9,695 887,094 26,624 173,493 189,503 3,475,052Morrisville* 7,442,721 144,534 ------ 28,583 780,750 23,487 473,803 159,386 9,053,264Raleigh 108,134,463 8,326,751 ------ 590,752 40,977,418 1,223,002 14,966,747 8,264,193 182,483,326Rolesville 358,563 1,552 ------ ------ 134,560 4,034 30,464 31,132 560,305Wake Forest* 5,818,749 183,251 ------ ------ 1,853,266 55,288 446,355 386,404 8,743,312Wendell 1,256,087 34,304 ------ 5,198 628,868 18,843 142,835 140,934 2,227,070Zebulon* 1,962,194 39,494 ------ ------ 598,209 17,916 292,201 125,971 3,035,984
WarrenMacon 12,985 ------ ------ ------ 14,133 478 4,006 4,736 36,338Norlina 181,968 4,530 ------ ------ 137,852 4,682 32,128 42,482 403,642Warrenton 278,484 14,718 ------ 1,283 100,210 3,395 43,201 31,364 472,655
WashingtonCreswell 42,845 1,550 ------ ------ 33,875 1,156 14,868 9,827 104,121Plymouth 648,584 8,572 ------ ------ 503,211 17,204 141,610 132,192 1,451,374Roper 69,506 7,609 ------ ------ 75,135 2,570 21,849 22,093 198,762
WataugaBeech Mountain* 2,070,051 27,017 133,771 240 61,752 1,321 87,014 114,027 2,495,193Blowing Rock* 2,389,469 37,336 320,697 127,916 276,867 5,994 130,276 81,376 3,369,932Boone 3,512,234 115,920 433,149 281,078 2,673,283 57,032 671,036 389,584 8,133,315Seven Devils* 533,025 4,153 ------ 68,056 25,478 546 12,245 25,796 669,299
WayneEureka 39,911 1,187 ------ ------ 23,606 235 8,539 7,820 81,298Fremont 208,647 7,919 ------ 4,153 103,205 6,126 49,663 53,635 433,347Goldsboro 8,984,213 480,790 263,691 43,837 4,759,776 163,095 1,861,207 1,178,677 17,735,286Mount Olive* 1,012,624 32,972 ------ 9,827 530,224 19,554 207,829 155,567 1,968,598Pikeville 152,396 ------ ------ ------ 72,746 692 34,930 26,126 286,890Seven Springs 16,869 210 ------ ------ 9,049 83 6,906 4,493 37,610Walnut Creek 417,547 4,987 ------ ------ 221,614 3,662 22,038 37,940 707,788
WilkesElkin** See Surry CountyNorth Wilkesboro 2,001,995 50,399 ------ 17,200 709,140 17,505 297,186 152,058 3,245,483Ronda 50,644 169 ------ ------ 79,774 1,951 16,974 20,448 169,960Wilkesboro 1,693,177 59,516 28,293 57,200 545,769 13,466 383,511 119,556 2,900,489
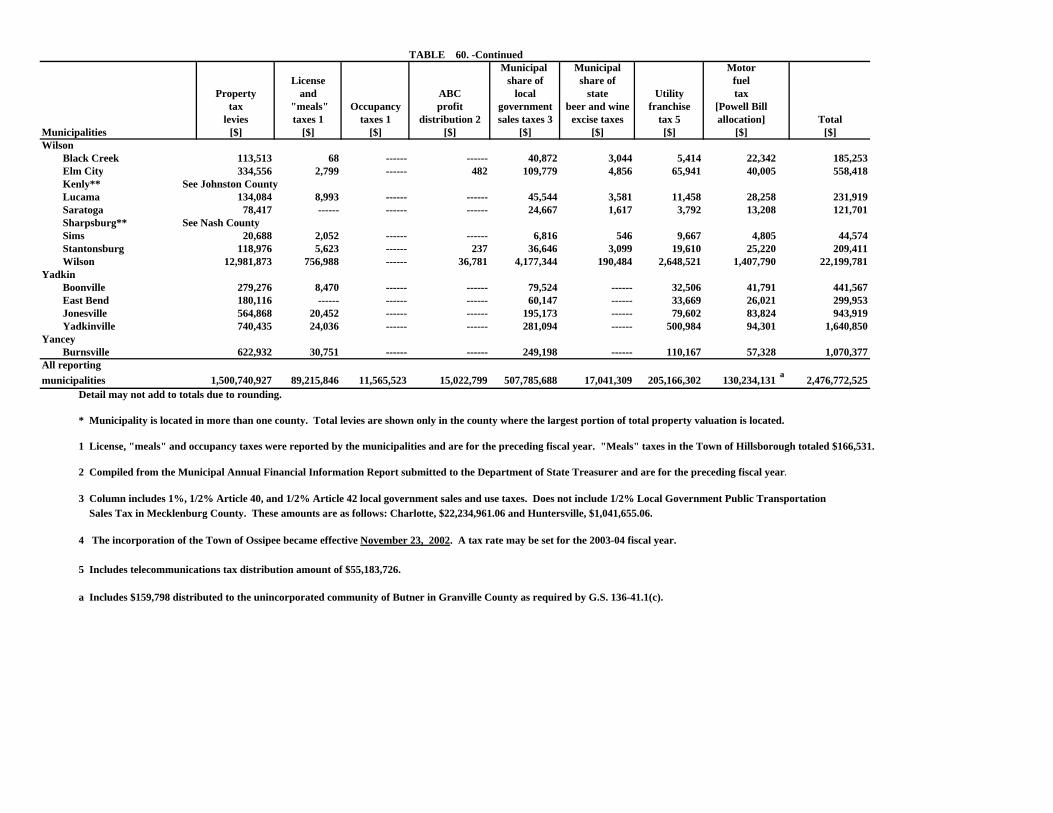
TABLE 60. -Continued Municipal Municipal Motor
License share of share of fuelProperty and ABC local state Utility tax
tax "meals" Occupancy profit government beer and wine franchise [Powell Billlevies taxes 1 taxes 1 distribution 2 sales taxes 3 excise taxes tax 5 allocation] Total
Municipalities [$] [$] [$] [$] [$] [$] [$] [$] [$]Wilson
Black Creek 113,513 68 ------ ------ 40,872 3,044 5,414 22,342 185,253Elm City 334,556 2,799 ------ 482 109,779 4,856 65,941 40,005 558,418Kenly** See Johnston CountyLucama 134,084 8,993 ------ ------ 45,544 3,581 11,458 28,258 231,919Saratoga 78,417 ------ ------ ------ 24,667 1,617 3,792 13,208 121,701Sharpsburg** See Nash CountySims 20,688 2,052 ------ ------ 6,816 546 9,667 4,805 44,574Stantonsburg 118,976 5,623 ------ 237 36,646 3,099 19,610 25,220 209,411Wilson 12,981,873 756,988 ------ 36,781 4,177,344 190,484 2,648,521 1,407,790 22,199,781
YadkinBoonville 279,276 8,470 ------ ------ 79,524 ------ 32,506 41,791 441,567East Bend 180,116 ------ ------ ------ 60,147 ------ 33,669 26,021 299,953Jonesville 564,868 20,452 ------ ------ 195,173 ------ 79,602 83,824 943,919Yadkinville 740,435 24,036 ------ ------ 281,094 ------ 500,984 94,301 1,640,850
YanceyBurnsville 622,932 30,751 ------ ------ 249,198 ------ 110,167 57,328 1,070,377
All reportingmunicipalities 1,500,740,927 89,215,846 11,565,523 15,022,799 507,785,688 17,041,309 205,166,302 130,234,131 a 2,476,772,525
Detail may not add to totals due to rounding.
* Municipality is located in more than one county. Total levies are shown only in the county where the largest portion of total property valuation is located.
1 License, "meals" and occupancy taxes were reported by the municipalities and are for the preceding fiscal year. "Meals" taxes in the Town of Hillsborough totaled $166,531.
2 Compiled from the Municipal Annual Financial Information Report submitted to the Department of State Treasurer and are for the preceding fiscal year.
3 Column includes 1%, 1/2% Article 40, and 1/2% Article 42 local government sales and use taxes. Does not include 1/2% Local Government Public Transportation Sales Tax in Mecklenburg County. These amounts are as follows: Charlotte, $22,234,961.06 and Huntersville, $1,041,655.06.
4 The incorporation of the Town of Ossipee became effective November 23, 2002. A tax rate may be set for the 2003-04 fiscal year.
5 Includes telecommunications tax distribution amount of $55,183,726. a Includes $159,798 distributed to the unincorporated community of Butner in Granville County as required by G.S. 136-41.1(c).
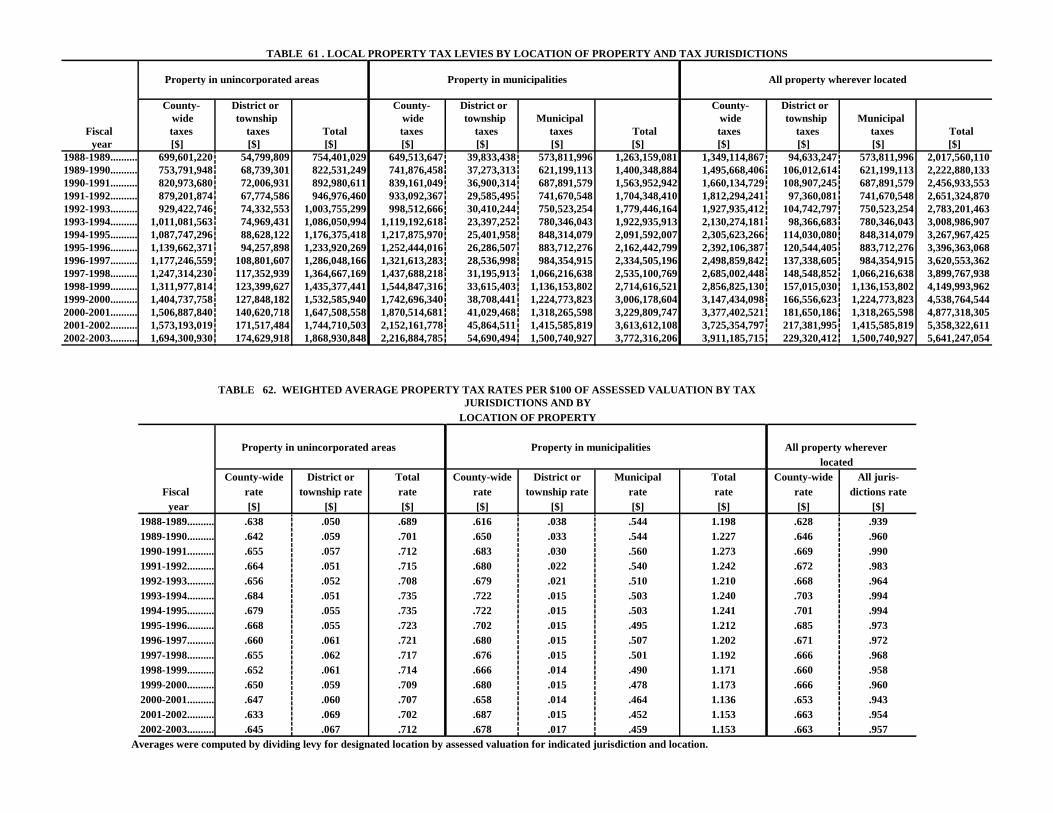
TABLE 61 . LOCAL PROPERTY TAX LEVIES BY LOCATION OF PROPERTY AND TAX JURISDICTIONS
Property in unincorporated areas Property in municipalities All property wherever located
County- District or County- District or County- District or
wide township wide township Municipal wide township Municipal
Fiscal taxes taxes Total taxes taxes taxes Total taxes taxes taxes Total
year [$] [$] [$] [$] [$] [$] [$] [$] [$] [$] [$]
1988-1989............... 699,601,220 54,799,809 754,401,029 649,513,647 39,833,438 573,811,996 1,263,159,081 1,349,114,867 94,633,247 573,811,996 2,017,560,110
1989-1990............... 753,791,948 68,739,301 822,531,249 741,876,458 37,273,313 621,199,113 1,400,348,884 1,495,668,406 106,012,614 621,199,113 2,222,880,133
1990-1991............... 820,973,680 72,006,931 892,980,611 839,161,049 36,900,314 687,891,579 1,563,952,942 1,660,134,729 108,907,245 687,891,579 2,456,933,553
1991-1992............... 879,201,874 67,774,586 946,976,460 933,092,367 29,585,495 741,670,548 1,704,348,410 1,812,294,241 97,360,081 741,670,548 2,651,324,870
1992-1993............... 929,422,746 74,332,553 1,003,755,299 998,512,666 30,410,244 750,523,254 1,779,446,164 1,927,935,412 104,742,797 750,523,254 2,783,201,463
1993-1994...............1,011,081,563 74,969,431 1,086,050,994 1,119,192,618 23,397,252 780,346,043 1,922,935,913 2,130,274,181 98,366,683 780,346,043 3,008,986,907
1994-1995...............1,087,747,296 88,628,122 1,176,375,418 1,217,875,970 25,401,958 848,314,079 2,091,592,007 2,305,623,266 114,030,080 848,314,079 3,267,967,425
1995-1996...............1,139,662,371 94,257,898 1,233,920,269 1,252,444,016 26,286,507 883,712,276 2,162,442,799 2,392,106,387 120,544,405 883,712,276 3,396,363,068
1996-1997...............1,177,246,559 108,801,607 1,286,048,166 1,321,613,283 28,536,998 984,354,915 2,334,505,196 2,498,859,842 137,338,605 984,354,915 3,620,553,362
1997-1998...............1,247,314,230 117,352,939 1,364,667,169 1,437,688,218 31,195,913 1,066,216,638 2,535,100,769 2,685,002,448 148,548,852 1,066,216,638 3,899,767,938
1998-1999...............1,311,977,814 123,399,627 1,435,377,441 1,544,847,316 33,615,403 1,136,153,802 2,714,616,521 2,856,825,130 157,015,030 1,136,153,802 4,149,993,962
1999-2000...............1,404,737,758 127,848,182 1,532,585,940 1,742,696,340 38,708,441 1,224,773,823 3,006,178,604 3,147,434,098 166,556,623 1,224,773,823 4,538,764,544
2000-2001...............1,506,887,840 140,620,718 1,647,508,558 1,870,514,681 41,029,468 1,318,265,598 3,229,809,747 3,377,402,521 181,650,186 1,318,265,598 4,877,318,305
2001-2002...............1,573,193,019 171,517,484 1,744,710,503 2,152,161,778 45,864,511 1,415,585,819 3,613,612,108 3,725,354,797 217,381,995 1,415,585,819 5,358,322,611
2002-2003...............1,694,300,930 174,629,918 1,868,930,848 2,216,884,785 54,690,494 1,500,740,927 3,772,316,206 3,911,185,715 229,320,412 1,500,740,927 5,641,247,054
TABLE 62. WEIGHTED AVERAGE PROPERTY TAX RATES PER $100 OF ASSESSED VALUATION BY TAX
JURISDICTIONS AND BY
LOCATION OF PROPERTY
Property in unincorporated areas Property in municipalities All property wherever
located
County-wide District or Total County-wide District or Municipal Total County-wide All juris-
Fiscal rate township rate rate rate township rate rate rate rate dictions rate
year [$] [$] [$] [$] [$] [$] [$] [$] [$]
1988-1989............... .638 .050 .689 .616 .038 .544 1.198 .628 .939
1989-1990............... .642 .059 .701 .650 .033 .544 1.227 .646 .960
1990-1991............... .655 .057 .712 .683 .030 .560 1.273 .669 .990
1991-1992............... .664 .051 .715 .680 .022 .540 1.242 .672 .983
1992-1993............... .656 .052 .708 .679 .021 .510 1.210 .668 .964
1993-1994............... .684 .051 .735 .722 .015 .503 1.240 .703 .994
1994-1995............... .679 .055 .735 .722 .015 .503 1.241 .701 .994
1995-1996............... .668 .055 .723 .702 .015 .495 1.212 .685 .973
1996-1997............... .660 .061 .721 .680 .015 .507 1.202 .671 .972
1997-1998............... .655 .062 .717 .676 .015 .501 1.192 .666 .968
1998-1999............... .652 .061 .714 .666 .014 .490 1.171 .660 .958
1999-2000............... .650 .059 .709 .680 .015 .478 1.173 .666 .960
2000-2001............... .647 .060 .707 .658 .014 .464 1.136 .653 .943
2001-2002............... .633 .069 .702 .687 .015 .452 1.153 .663 .954
2002-2003............... .645 .067 .712 .678 .017 .459 1.153 .663 .957
Averages were computed by dividing levy for designated location by assessed valuation for indicated jurisdiction and location.
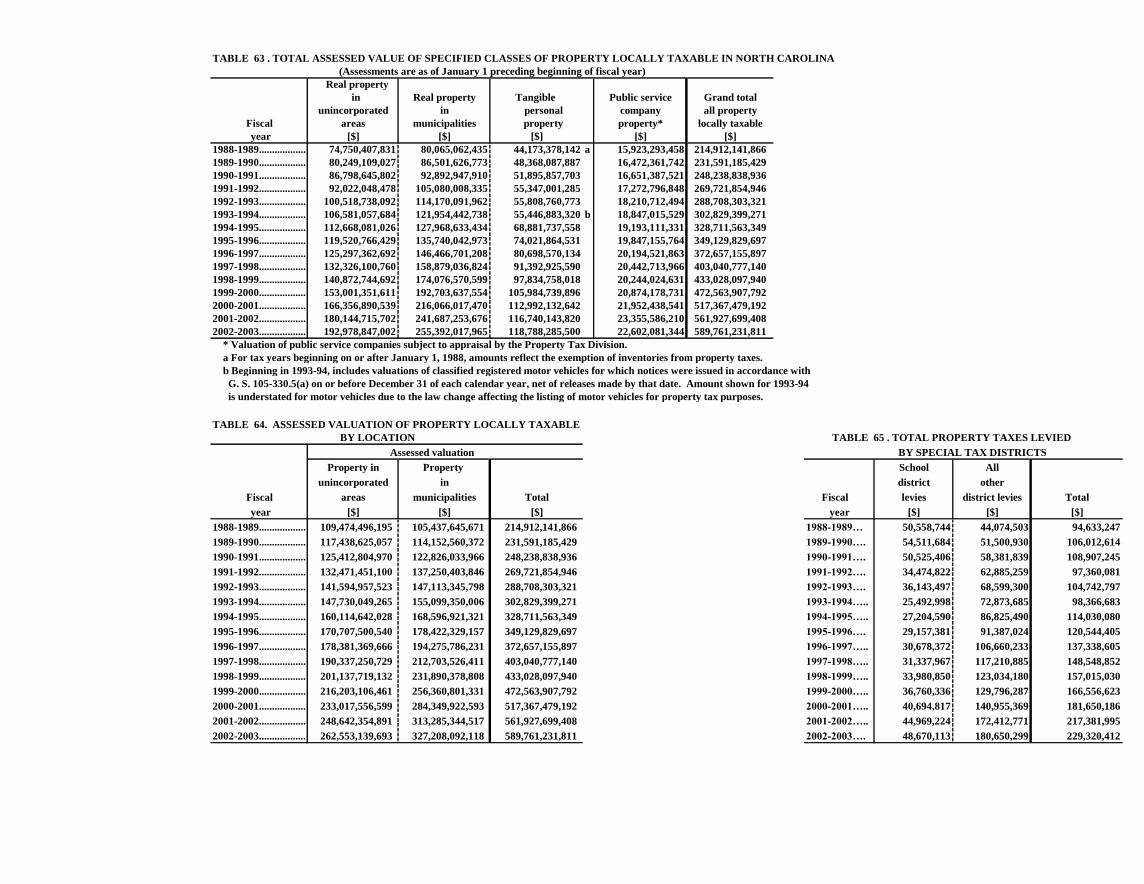
TABLE 63 . TOTAL ASSESSED VALUE OF SPECIFIED CLASSES OF PROPERTY LOCALLY TAXABLE IN NORTH CAROLINA
(Assessments are as of January 1 preceding beginning of fiscal year)
Real property
in Real property Tangible Public service Grand total
unincorporated in personal company all property
Fiscal areas municipalities property property* locally taxable
year [$] [$] [$] [$] [$]
1988-1989..................... 74,750,407,831 80,065,062,435 44,173,378,142 a 15,923,293,458 214,912,141,866
1989-1990..................... 80,249,109,027 86,501,626,773 48,368,087,887 16,472,361,742 231,591,185,429
1990-1991..................... 86,798,645,802 92,892,947,910 51,895,857,703 16,651,387,521 248,238,838,936
1991-1992..................... 92,022,048,478 105,080,008,335 55,347,001,285 17,272,796,848 269,721,854,946
1992-1993..................... 100,518,738,092 114,170,091,962 55,808,760,773 18,210,712,494 288,708,303,321
1993-1994..................... 106,581,057,684 121,954,442,738 55,446,883,320 b 18,847,015,529 302,829,399,271
1994-1995..................... 112,668,081,026 127,968,633,434 68,881,737,558 19,193,111,331 328,711,563,349
1995-1996..................... 119,520,766,429 135,740,042,973 74,021,864,531 19,847,155,764 349,129,829,697
1996-1997..................... 125,297,362,692 146,466,701,208 80,698,570,134 20,194,521,863 372,657,155,897
1997-1998..................... 132,326,100,760 158,879,036,824 91,392,925,590 20,442,713,966 403,040,777,140
1998-1999..................... 140,872,744,692 174,076,570,599 97,834,758,018 20,244,024,631 433,028,097,940
1999-2000..................... 153,001,351,611 192,703,637,554 105,984,739,896 20,874,178,731 472,563,907,792
2000-2001..................... 166,356,890,539 216,066,017,470 112,992,132,642 21,952,438,541 517,367,479,192
2001-2002..................... 180,144,715,702 241,687,253,676 116,740,143,820 23,355,586,210 561,927,699,408
2002-2003..................... 192,978,847,002 255,392,017,965 118,788,285,500 22,602,081,344 589,761,231,811
* Valuation of public service companies subject to appraisal by the Property Tax Division.
a For tax years beginning on or after January 1, 1988, amounts reflect the exemption of inventories from property taxes.
b Beginning in 1993-94, includes valuations of classified registered motor vehicles for which notices were issued in accordance with
G. S. 105-330.5(a) on or before December 31 of each calendar year, net of releases made by that date. Amount shown for 1993-94
is understated for motor vehicles due to the law change affecting the listing of motor vehicles for property tax purposes.
TABLE 64. ASSESSED VALUATION OF PROPERTY LOCALLY TAXABLE
BY LOCATION TABLE 65 . TOTAL PROPERTY TAXES LEVIED
Assessed valuation BY SPECIAL TAX DISTRICTS
Property in Property School All
unincorporated in district other
Fiscal areas municipalities Total Fiscal levies district levies Total
year [$] [$] [$] year [$] [$] [$]
1988-1989..................... 109,474,496,195 105,437,645,671 214,912,141,866 1988-1989… 50,558,744 44,074,503 94,633,247
1989-1990..................... 117,438,625,057 114,152,560,372 231,591,185,429 1989-1990…. 54,511,684 51,500,930 106,012,614
1990-1991..................... 125,412,804,970 122,826,033,966 248,238,838,936 1990-1991…. 50,525,406 58,381,839 108,907,245
1991-1992..................... 132,471,451,100 137,250,403,846 269,721,854,946 1991-1992…. 34,474,822 62,885,259 97,360,081
1992-1993..................... 141,594,957,523 147,113,345,798 288,708,303,321 1992-1993…. 36,143,497 68,599,300 104,742,797
1993-1994..................... 147,730,049,265 155,099,350,006 302,829,399,271 1993-1994….. 25,492,998 72,873,685 98,366,683
1994-1995..................... 160,114,642,028 168,596,921,321 328,711,563,349 1994-1995….. 27,204,590 86,825,490 114,030,080
1995-1996..................... 170,707,500,540 178,422,329,157 349,129,829,697 1995-1996…. 29,157,381 91,387,024 120,544,405
1996-1997..................... 178,381,369,666 194,275,786,231 372,657,155,897 1996-1997….. 30,678,372 106,660,233 137,338,605
1997-1998..................... 190,337,250,729 212,703,526,411 403,040,777,140 1997-1998….. 31,337,967 117,210,885 148,548,852
1998-1999..................... 201,137,719,132 231,890,378,808 433,028,097,940 1998-1999….. 33,980,850 123,034,180 157,015,030
1999-2000..................... 216,203,106,461 256,360,801,331 472,563,907,792 1999-2000….. 36,760,336 129,796,287 166,556,623
2000-2001..................... 233,017,556,599 284,349,922,593 517,367,479,192 2000-2001….. 40,694,817 140,955,369 181,650,186
2001-2002..................... 248,642,354,891 313,285,344,517 561,927,699,408 2001-2002….. 44,969,224 172,412,771 217,381,995
2002-2003..................... 262,553,139,693 327,208,092,118 589,761,231,811 2002-2003…. 48,670,113 180,650,299 229,320,412
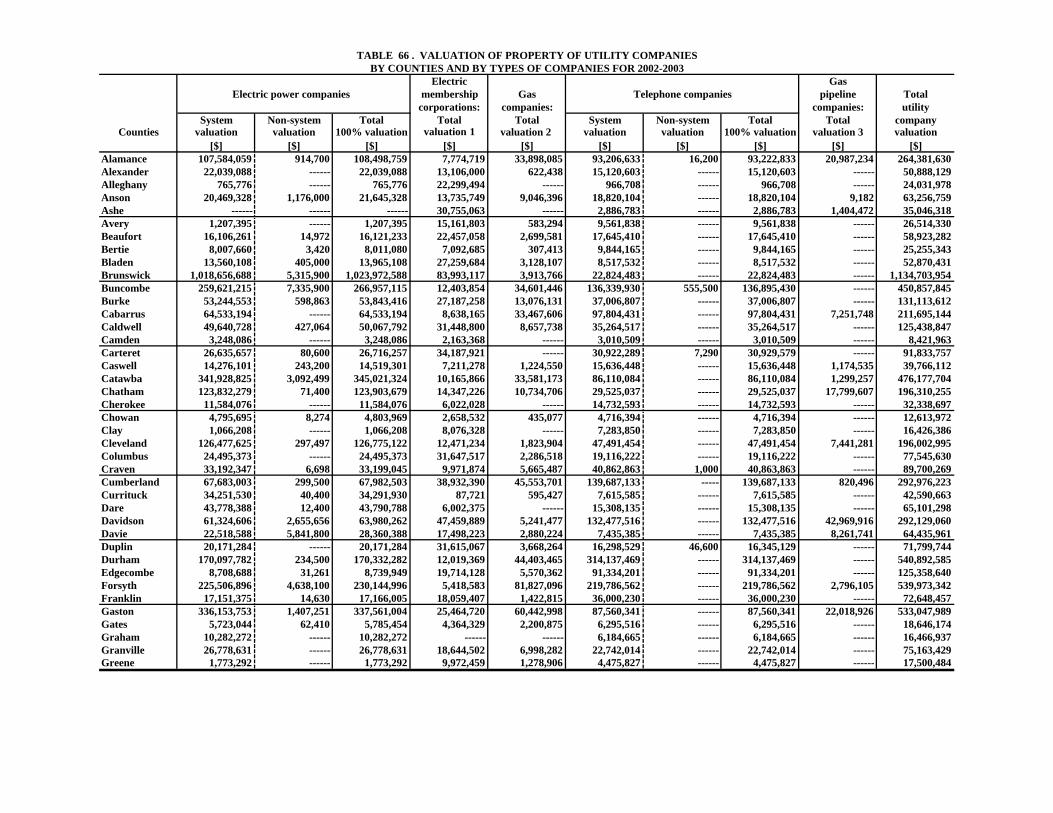
TABLE 66 . VALUATION OF PROPERTY OF UTILITY COMPANIESBY COUNTIES AND BY TYPES OF COMPANIES FOR 2002-2003
Electric Gas Electric power companies membership Gas Telephone companies pipeline Total
corporations: companies: companies: utilitySystem Non-system Total Total Total System Non-system Total Total company
Counties valuation valuation 100% valuation valuation 1 valuation 2 valuation valuation 100% valuation valuation 3 valuation[$] [$] [$] [$] [$] [$] [$] [$] [$] [$]
Alamance 107,584,059 914,700 108,498,759 7,774,719 33,898,085 93,206,633 16,200 93,222,833 20,987,234 264,381,630Alexander 22,039,088 ------ 22,039,088 13,106,000 622,438 15,120,603 ------ 15,120,603 ------ 50,888,129Alleghany 765,776 ------ 765,776 22,299,494 ------ 966,708 ------ 966,708 ------ 24,031,978Anson 20,469,328 1,176,000 21,645,328 13,735,749 9,046,396 18,820,104 ------ 18,820,104 9,182 63,256,759Ashe ------ ------ ------ 30,755,063 ------ 2,886,783 ------ 2,886,783 1,404,472 35,046,318Avery 1,207,395 ------ 1,207,395 15,161,803 583,294 9,561,838 ------ 9,561,838 ------ 26,514,330Beaufort 16,106,261 14,972 16,121,233 22,457,058 2,699,581 17,645,410 ------ 17,645,410 ------ 58,923,282Bertie 8,007,660 3,420 8,011,080 7,092,685 307,413 9,844,165 ------ 9,844,165 ------ 25,255,343Bladen 13,560,108 405,000 13,965,108 27,259,684 3,128,107 8,517,532 ------ 8,517,532 ------ 52,870,431Brunswick 1,018,656,688 5,315,900 1,023,972,588 83,993,117 3,913,766 22,824,483 ------ 22,824,483 ------ 1,134,703,954Buncombe 259,621,215 7,335,900 266,957,115 12,403,854 34,601,446 136,339,930 555,500 136,895,430 ------ 450,857,845Burke 53,244,553 598,863 53,843,416 27,187,258 13,076,131 37,006,807 ------ 37,006,807 ------ 131,113,612Cabarrus 64,533,194 ------ 64,533,194 8,638,165 33,467,606 97,804,431 ------ 97,804,431 7,251,748 211,695,144Caldwell 49,640,728 427,064 50,067,792 31,448,800 8,657,738 35,264,517 ------ 35,264,517 ------ 125,438,847Camden 3,248,086 ------ 3,248,086 2,163,368 ------ 3,010,509 ------ 3,010,509 ------ 8,421,963Carteret 26,635,657 80,600 26,716,257 34,187,921 ------ 30,922,289 7,290 30,929,579 ------ 91,833,757Caswell 14,276,101 243,200 14,519,301 7,211,278 1,224,550 15,636,448 ------ 15,636,448 1,174,535 39,766,112Catawba 341,928,825 3,092,499 345,021,324 10,165,866 33,581,173 86,110,084 ------ 86,110,084 1,299,257 476,177,704Chatham 123,832,279 71,400 123,903,679 14,347,226 10,734,706 29,525,037 ------ 29,525,037 17,799,607 196,310,255Cherokee 11,584,076 ------ 11,584,076 6,022,028 ------ 14,732,593 ------ 14,732,593 ------ 32,338,697Chowan 4,795,695 8,274 4,803,969 2,658,532 435,077 4,716,394 ------ 4,716,394 ------ 12,613,972Clay 1,066,208 ------ 1,066,208 8,076,328 ------ 7,283,850 ------ 7,283,850 ------ 16,426,386Cleveland 126,477,625 297,497 126,775,122 12,471,234 1,823,904 47,491,454 ------ 47,491,454 7,441,281 196,002,995Columbus 24,495,373 ------ 24,495,373 31,647,517 2,286,518 19,116,222 ------ 19,116,222 ------ 77,545,630Craven 33,192,347 6,698 33,199,045 9,971,874 5,665,487 40,862,863 1,000 40,863,863 ------ 89,700,269Cumberland 67,683,003 299,500 67,982,503 38,932,390 45,553,701 139,687,133 ----- 139,687,133 820,496 292,976,223Currituck 34,251,530 40,400 34,291,930 87,721 595,427 7,615,585 ------ 7,615,585 ------ 42,590,663Dare 43,778,388 12,400 43,790,788 6,002,375 ------ 15,308,135 ------ 15,308,135 ------ 65,101,298Davidson 61,324,606 2,655,656 63,980,262 47,459,889 5,241,477 132,477,516 ------ 132,477,516 42,969,916 292,129,060Davie 22,518,588 5,841,800 28,360,388 17,498,223 2,880,224 7,435,385 ------ 7,435,385 8,261,741 64,435,961Duplin 20,171,284 ------ 20,171,284 31,615,067 3,668,264 16,298,529 46,600 16,345,129 ------ 71,799,744Durham 170,097,782 234,500 170,332,282 12,019,369 44,403,465 314,137,469 ------ 314,137,469 ------ 540,892,585Edgecombe 8,708,688 31,261 8,739,949 19,714,128 5,570,362 91,334,201 ------ 91,334,201 ------ 125,358,640Forsyth 225,506,896 4,638,100 230,144,996 5,418,583 81,827,096 219,786,562 ------ 219,786,562 2,796,105 539,973,342Franklin 17,151,375 14,630 17,166,005 18,059,407 1,422,815 36,000,230 ------ 36,000,230 ------ 72,648,457Gaston 336,153,753 1,407,251 337,561,004 25,464,720 60,442,998 87,560,341 ------ 87,560,341 22,018,926 533,047,989Gates 5,723,044 62,410 5,785,454 4,364,329 2,200,875 6,295,516 ------ 6,295,516 ------ 18,646,174Graham 10,282,272 ------ 10,282,272 ------ ------ 6,184,665 ------ 6,184,665 ------ 16,466,937Granville 26,778,631 ------ 26,778,631 18,644,502 6,998,282 22,742,014 ------ 22,742,014 ------ 75,163,429Greene 1,773,292 ------ 1,773,292 9,972,459 1,278,906 4,475,827 ------ 4,475,827 ------ 17,500,484
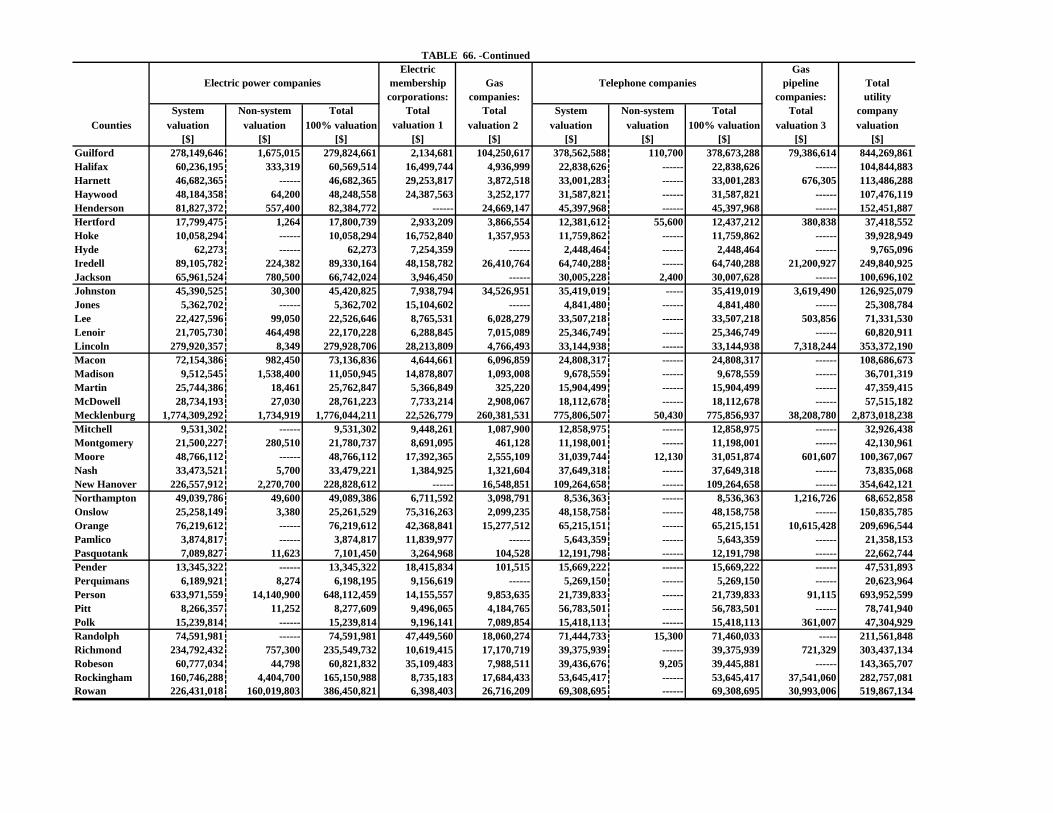
TABLE 66. -ContinuedElectric Gas
Electric power companies membership Gas Telephone companies pipeline Totalcorporations: companies: companies: utility
System Non-system Total Total Total System Non-system Total Total companyCounties valuation valuation 100% valuation valuation 1 valuation 2 valuation valuation 100% valuation valuation 3 valuation
[$] [$] [$] [$] [$] [$] [$] [$] [$] [$]Guilford 278,149,646 1,675,015 279,824,661 2,134,681 104,250,617 378,562,588 110,700 378,673,288 79,386,614 844,269,861Halifax 60,236,195 333,319 60,569,514 16,499,744 4,936,999 22,838,626 ------ 22,838,626 ------ 104,844,883Harnett 46,682,365 ------ 46,682,365 29,253,817 3,872,518 33,001,283 ------ 33,001,283 676,305 113,486,288Haywood 48,184,358 64,200 48,248,558 24,387,563 3,252,177 31,587,821 ------ 31,587,821 ------ 107,476,119Henderson 81,827,372 557,400 82,384,772 ------ 24,669,147 45,397,968 ------ 45,397,968 ------ 152,451,887Hertford 17,799,475 1,264 17,800,739 2,933,209 3,866,554 12,381,612 55,600 12,437,212 380,838 37,418,552Hoke 10,058,294 ------ 10,058,294 16,752,840 1,357,953 11,759,862 ------ 11,759,862 ------ 39,928,949Hyde 62,273 ------ 62,273 7,254,359 ------ 2,448,464 ------ 2,448,464 ------ 9,765,096Iredell 89,105,782 224,382 89,330,164 48,158,782 26,410,764 64,740,288 ------ 64,740,288 21,200,927 249,840,925Jackson 65,961,524 780,500 66,742,024 3,946,450 ------ 30,005,228 2,400 30,007,628 ------ 100,696,102Johnston 45,390,525 30,300 45,420,825 7,938,794 34,526,951 35,419,019 ----- 35,419,019 3,619,490 126,925,079Jones 5,362,702 ------ 5,362,702 15,104,602 ------ 4,841,480 ------ 4,841,480 ------ 25,308,784Lee 22,427,596 99,050 22,526,646 8,765,531 6,028,279 33,507,218 ------ 33,507,218 503,856 71,331,530Lenoir 21,705,730 464,498 22,170,228 6,288,845 7,015,089 25,346,749 ------ 25,346,749 ------ 60,820,911Lincoln 279,920,357 8,349 279,928,706 28,213,809 4,766,493 33,144,938 ------ 33,144,938 7,318,244 353,372,190Macon 72,154,386 982,450 73,136,836 4,644,661 6,096,859 24,808,317 ------ 24,808,317 ------ 108,686,673Madison 9,512,545 1,538,400 11,050,945 14,878,807 1,093,008 9,678,559 ------ 9,678,559 ------ 36,701,319Martin 25,744,386 18,461 25,762,847 5,366,849 325,220 15,904,499 ------ 15,904,499 ------ 47,359,415McDowell 28,734,193 27,030 28,761,223 7,733,214 2,908,067 18,112,678 ------ 18,112,678 ------ 57,515,182Mecklenburg 1,774,309,292 1,734,919 1,776,044,211 22,526,779 260,381,531 775,806,507 50,430 775,856,937 38,208,780 2,873,018,238Mitchell 9,531,302 ------ 9,531,302 9,448,261 1,087,900 12,858,975 ------ 12,858,975 ------ 32,926,438Montgomery 21,500,227 280,510 21,780,737 8,691,095 461,128 11,198,001 ------ 11,198,001 ------ 42,130,961Moore 48,766,112 ------ 48,766,112 17,392,365 2,555,109 31,039,744 12,130 31,051,874 601,607 100,367,067Nash 33,473,521 5,700 33,479,221 1,384,925 1,321,604 37,649,318 ------ 37,649,318 ------ 73,835,068New Hanover 226,557,912 2,270,700 228,828,612 ------ 16,548,851 109,264,658 ------ 109,264,658 ------ 354,642,121Northampton 49,039,786 49,600 49,089,386 6,711,592 3,098,791 8,536,363 ------ 8,536,363 1,216,726 68,652,858Onslow 25,258,149 3,380 25,261,529 75,316,263 2,099,235 48,158,758 ------ 48,158,758 ------ 150,835,785Orange 76,219,612 ------ 76,219,612 42,368,841 15,277,512 65,215,151 ------ 65,215,151 10,615,428 209,696,544Pamlico 3,874,817 ------ 3,874,817 11,839,977 ------ 5,643,359 ------ 5,643,359 ------ 21,358,153Pasquotank 7,089,827 11,623 7,101,450 3,264,968 104,528 12,191,798 ------ 12,191,798 ------ 22,662,744Pender 13,345,322 ------ 13,345,322 18,415,834 101,515 15,669,222 ------ 15,669,222 ------ 47,531,893Perquimans 6,189,921 8,274 6,198,195 9,156,619 ------ 5,269,150 ------ 5,269,150 ------ 20,623,964Person 633,971,559 14,140,900 648,112,459 14,155,557 9,853,635 21,739,833 ------ 21,739,833 91,115 693,952,599Pitt 8,266,357 11,252 8,277,609 9,496,065 4,184,765 56,783,501 ------ 56,783,501 ------ 78,741,940Polk 15,239,814 ------ 15,239,814 9,196,141 7,089,854 15,418,113 ------ 15,418,113 361,007 47,304,929Randolph 74,591,981 ------ 74,591,981 47,449,560 18,060,274 71,444,733 15,300 71,460,033 ----- 211,561,848Richmond 234,792,432 757,300 235,549,732 10,619,415 17,170,719 39,375,939 ------ 39,375,939 721,329 303,437,134Robeson 60,777,034 44,798 60,821,832 35,109,483 7,988,511 39,436,676 9,205 39,445,881 ------ 143,365,707Rockingham 160,746,288 4,404,700 165,150,988 8,735,183 17,684,433 53,645,417 ------ 53,645,417 37,541,060 282,757,081Rowan 226,431,018 160,019,803 386,450,821 6,398,403 26,716,209 69,308,695 ------ 69,308,695 30,993,006 519,867,134
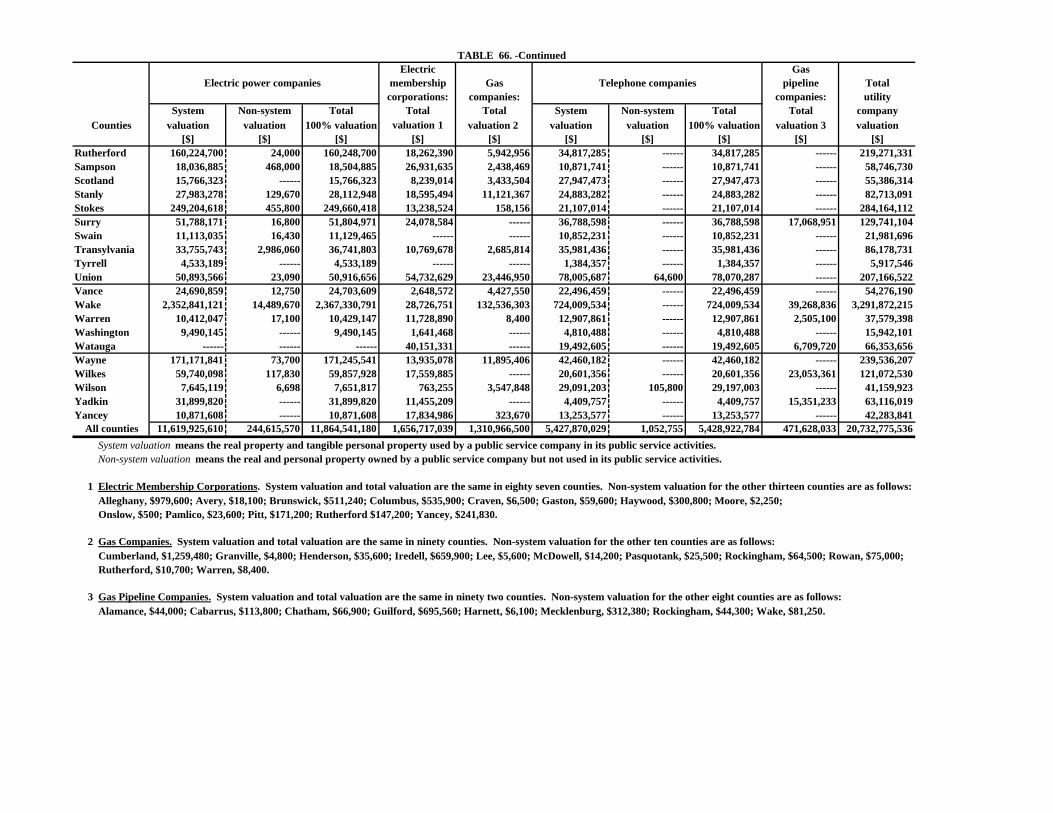
TABLE 66. -ContinuedElectric Gas
Electric power companies membership Gas Telephone companies pipeline Totalcorporations: companies: companies: utility
System Non-system Total Total Total System Non-system Total Total companyCounties valuation valuation 100% valuation valuation 1 valuation 2 valuation valuation 100% valuation valuation 3 valuation
[$] [$] [$] [$] [$] [$] [$] [$] [$] [$]Rutherford 160,224,700 24,000 160,248,700 18,262,390 5,942,956 34,817,285 ------ 34,817,285 ------ 219,271,331Sampson 18,036,885 468,000 18,504,885 26,931,635 2,438,469 10,871,741 ------ 10,871,741 ------ 58,746,730Scotland 15,766,323 ------ 15,766,323 8,239,014 3,433,504 27,947,473 ------ 27,947,473 ------ 55,386,314Stanly 27,983,278 129,670 28,112,948 18,595,494 11,121,367 24,883,282 ------ 24,883,282 ------ 82,713,091Stokes 249,204,618 455,800 249,660,418 13,238,524 158,156 21,107,014 ------ 21,107,014 ------ 284,164,112Surry 51,788,171 16,800 51,804,971 24,078,584 ------ 36,788,598 ------ 36,788,598 17,068,951 129,741,104Swain 11,113,035 16,430 11,129,465 ------ ------ 10,852,231 ------ 10,852,231 ------ 21,981,696Transylvania 33,755,743 2,986,060 36,741,803 10,769,678 2,685,814 35,981,436 ------ 35,981,436 ------ 86,178,731Tyrrell 4,533,189 ------ 4,533,189 ------ ------ 1,384,357 ------ 1,384,357 ------ 5,917,546Union 50,893,566 23,090 50,916,656 54,732,629 23,446,950 78,005,687 64,600 78,070,287 ------ 207,166,522Vance 24,690,859 12,750 24,703,609 2,648,572 4,427,550 22,496,459 ------ 22,496,459 ------ 54,276,190Wake 2,352,841,121 14,489,670 2,367,330,791 28,726,751 132,536,303 724,009,534 ------ 724,009,534 39,268,836 3,291,872,215Warren 10,412,047 17,100 10,429,147 11,728,890 8,400 12,907,861 ------ 12,907,861 2,505,100 37,579,398Washington 9,490,145 ------ 9,490,145 1,641,468 ------ 4,810,488 ------ 4,810,488 ------ 15,942,101Watauga ------ ------ ------ 40,151,331 ------ 19,492,605 ------ 19,492,605 6,709,720 66,353,656Wayne 171,171,841 73,700 171,245,541 13,935,078 11,895,406 42,460,182 ------ 42,460,182 ------ 239,536,207Wilkes 59,740,098 117,830 59,857,928 17,559,885 ------ 20,601,356 ------ 20,601,356 23,053,361 121,072,530Wilson 7,645,119 6,698 7,651,817 763,255 3,547,848 29,091,203 105,800 29,197,003 ------ 41,159,923Yadkin 31,899,820 ------ 31,899,820 11,455,209 ------ 4,409,757 ------ 4,409,757 15,351,233 63,116,019Yancey 10,871,608 ------ 10,871,608 17,834,986 323,670 13,253,577 ------ 13,253,577 ------ 42,283,841 All counties 11,619,925,610 244,615,570 11,864,541,180 1,656,717,039 1,310,966,500 5,427,870,029 1,052,755 5,428,922,784 471,628,033 20,732,775,536 System valuation means the real property and tangible personal property used by a public service company in its public service activities. Non-system valuation means the real and personal property owned by a public service company but not used in its public service activities.
1 Electric Membership Corporations. System valuation and total valuation are the same in eighty seven counties. Non-system valuation for the other thirteen counties are as follows: Alleghany, $979,600; Avery, $18,100; Brunswick, $511,240; Columbus, $535,900; Craven, $6,500; Gaston, $59,600; Haywood, $300,800; Moore, $2,250; Onslow, $500; Pamlico, $23,600; Pitt, $171,200; Rutherford $147,200; Yancey, $241,830. 2 Gas Companies. System valuation and total valuation are the same in ninety counties. Non-system valuation for the other ten counties are as follows: Cumberland, $1,259,480; Granville, $4,800; Henderson, $35,600; Iredell, $659,900; Lee, $5,600; McDowell, $14,200; Pasquotank, $25,500; Rockingham, $64,500; Rowan, $75,000; Rutherford, $10,700; Warren, $8,400.
3 Gas Pipeline Companies. System valuation and total valuation are the same in ninety two counties. Non-system valuation for the other eight counties are as follows: Alamance, $44,000; Cabarrus, $113,800; Chatham, $66,900; Guilford, $695,560; Harnett, $6,100; Mecklenburg, $312,380; Rockingham, $44,300; Wake, $81,250.
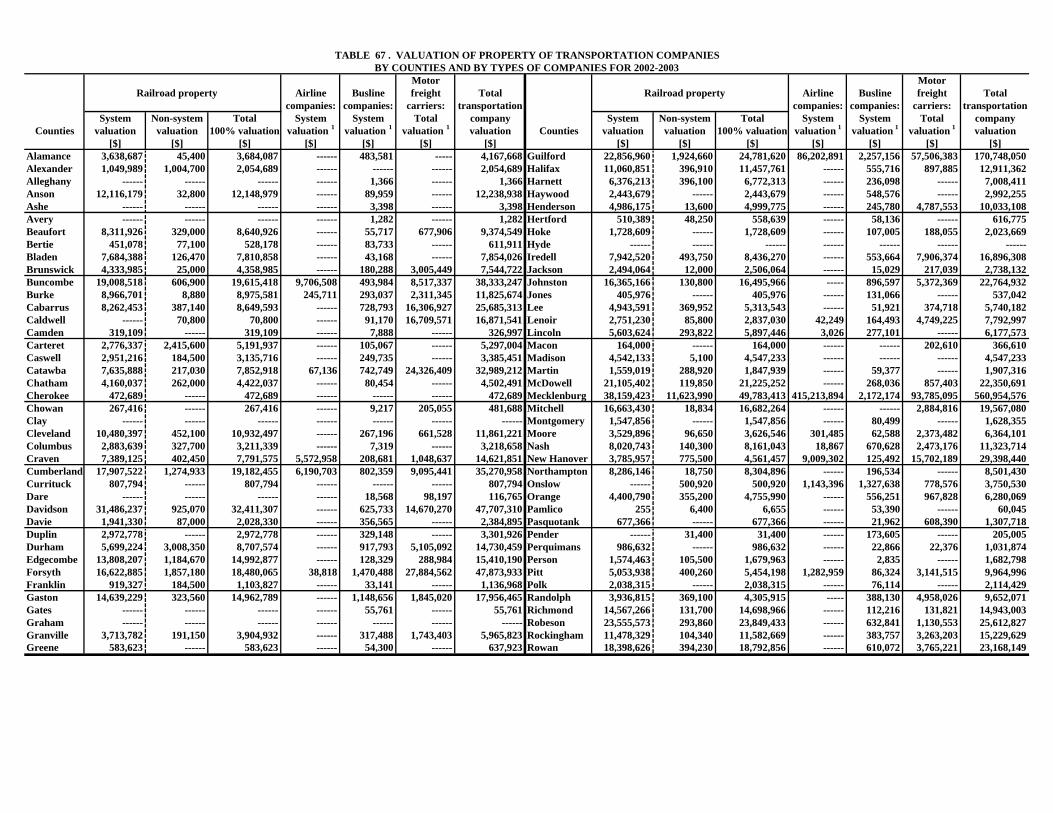
TABLE 67 . VALUATION OF PROPERTY OF TRANSPORTATION COMPANIESBY COUNTIES AND BY TYPES OF COMPANIES FOR 2002-2003
Motor MotorRailroad property Airline Busline freight Total Railroad property Airline Busline freight Total
companies: companies: carriers: transportation companies: companies: carriers: transportationSystem Non-system Total System System Total company System Non-system Total System System Total company
Counties valuation valuation 100% valuation valuation 1 valuation 1 valuation 1 valuation Counties valuation valuation 100% valuation valuation 1 valuation 1 valuation 1 valuation[$] [$] [$] [$] [$] [$] [$] [$] [$] [$] [$] [$] [$] [$]
Alamance 3,638,687 45,400 3,684,087 ------ 483,581 ----- 4,167,668 Guilford 22,856,960 1,924,660 24,781,620 86,202,891 2,257,156 57,506,383 170,748,050Alexander 1,049,989 1,004,700 2,054,689 ------ ------ ------ 2,054,689 Halifax 11,060,851 396,910 11,457,761 ------ 555,716 897,885 12,911,362Alleghany ------ ------ ------ ------ 1,366 ------ 1,366 Harnett 6,376,213 396,100 6,772,313 ------ 236,098 ------ 7,008,411Anson 12,116,179 32,800 12,148,979 ------ 89,959 ------ 12,238,938 Haywood 2,443,679 ------ 2,443,679 ------ 548,576 ------ 2,992,255Ashe ------ ------ ------ ------ 3,398 ------ 3,398 Henderson 4,986,175 13,600 4,999,775 ------ 245,780 4,787,553 10,033,108Avery ------ ------ ------ ------ 1,282 ------ 1,282 Hertford 510,389 48,250 558,639 ------ 58,136 ------ 616,775Beaufort 8,311,926 329,000 8,640,926 ------ 55,717 677,906 9,374,549 Hoke 1,728,609 ------ 1,728,609 ------ 107,005 188,055 2,023,669Bertie 451,078 77,100 528,178 ------ 83,733 ------ 611,911 Hyde ------ ------ ------ ------ ------ ------ ------Bladen 7,684,388 126,470 7,810,858 ------ 43,168 ------ 7,854,026 Iredell 7,942,520 493,750 8,436,270 ------ 553,664 7,906,374 16,896,308Brunswick 4,333,985 25,000 4,358,985 ------ 180,288 3,005,449 7,544,722 Jackson 2,494,064 12,000 2,506,064 ------ 15,029 217,039 2,738,132Buncombe 19,008,518 606,900 19,615,418 9,706,508 493,984 8,517,337 38,333,247 Johnston 16,365,166 130,800 16,495,966 ----- 896,597 5,372,369 22,764,932Burke 8,966,701 8,880 8,975,581 245,711 293,037 2,311,345 11,825,674 Jones 405,976 ------ 405,976 ------ 131,066 ------ 537,042Cabarrus 8,262,453 387,140 8,649,593 ------ 728,793 16,306,927 25,685,313 Lee 4,943,591 369,952 5,313,543 ------ 51,921 374,718 5,740,182Caldwell ------ 70,800 70,800 ------ 91,170 16,709,571 16,871,541 Lenoir 2,751,230 85,800 2,837,030 42,249 164,493 4,749,225 7,792,997Camden 319,109 ------ 319,109 ------ 7,888 ------ 326,997 Lincoln 5,603,624 293,822 5,897,446 3,026 277,101 ------ 6,177,573Carteret 2,776,337 2,415,600 5,191,937 ------ 105,067 ------ 5,297,004 Macon 164,000 ------ 164,000 ------ ------ 202,610 366,610Caswell 2,951,216 184,500 3,135,716 ------ 249,735 ------ 3,385,451 Madison 4,542,133 5,100 4,547,233 ------ ------ ------ 4,547,233Catawba 7,635,888 217,030 7,852,918 67,136 742,749 24,326,409 32,989,212 Martin 1,559,019 288,920 1,847,939 ------ 59,377 ------ 1,907,316Chatham 4,160,037 262,000 4,422,037 ------ 80,454 ------ 4,502,491 McDowell 21,105,402 119,850 21,225,252 ------ 268,036 857,403 22,350,691Cherokee 472,689 ------ 472,689 ------ ------ ------ 472,689 Mecklenburg 38,159,423 11,623,990 49,783,413 415,213,894 2,172,174 93,785,095 560,954,576Chowan 267,416 ------ 267,416 ------ 9,217 205,055 481,688 Mitchell 16,663,430 18,834 16,682,264 ------ ------ 2,884,816 19,567,080Clay ------ ------ ------ ------ ------ ------ ------ Montgomery 1,547,856 ------ 1,547,856 ------ 80,499 ------ 1,628,355Cleveland 10,480,397 452,100 10,932,497 ------ 267,196 661,528 11,861,221 Moore 3,529,896 96,650 3,626,546 301,485 62,588 2,373,482 6,364,101Columbus 2,883,639 327,700 3,211,339 ------ 7,319 ------ 3,218,658 Nash 8,020,743 140,300 8,161,043 18,867 670,628 2,473,176 11,323,714Craven 7,389,125 402,450 7,791,575 5,572,958 208,681 1,048,637 14,621,851 New Hanover 3,785,957 775,500 4,561,457 9,009,302 125,492 15,702,189 29,398,440Cumberland 17,907,522 1,274,933 19,182,455 6,190,703 802,359 9,095,441 35,270,958 Northampton 8,286,146 18,750 8,304,896 ------ 196,534 ------ 8,501,430Currituck 807,794 ------ 807,794 ------ ------ ------ 807,794 Onslow ------ 500,920 500,920 1,143,396 1,327,638 778,576 3,750,530Dare ------ ------ ------ ------ 18,568 98,197 116,765 Orange 4,400,790 355,200 4,755,990 ------ 556,251 967,828 6,280,069Davidson 31,486,237 925,070 32,411,307 ------ 625,733 14,670,270 47,707,310 Pamlico 255 6,400 6,655 ------ 53,390 ------ 60,045Davie 1,941,330 87,000 2,028,330 ------ 356,565 ------ 2,384,895 Pasquotank 677,366 ------ 677,366 ------ 21,962 608,390 1,307,718Duplin 2,972,778 ------ 2,972,778 ------ 329,148 ------ 3,301,926 Pender ------ 31,400 31,400 ------ 173,605 ------ 205,005Durham 5,699,224 3,008,350 8,707,574 ------ 917,793 5,105,092 14,730,459 Perquimans 986,632 ------ 986,632 ------ 22,866 22,376 1,031,874Edgecombe 13,808,207 1,184,670 14,992,877 ------ 128,329 288,984 15,410,190 Person 1,574,463 105,500 1,679,963 ------ 2,835 ------ 1,682,798Forsyth 16,622,885 1,857,180 18,480,065 38,818 1,470,488 27,884,562 47,873,933 Pitt 5,053,938 400,260 5,454,198 1,282,959 86,324 3,141,515 9,964,996Franklin 919,327 184,500 1,103,827 ------ 33,141 ------ 1,136,968 Polk 2,038,315 ------ 2,038,315 ------ 76,114 ------ 2,114,429Gaston 14,639,229 323,560 14,962,789 ------ 1,148,656 1,845,020 17,956,465 Randolph 3,936,815 369,100 4,305,915 ----- 388,130 4,958,026 9,652,071Gates ------ ------ ------ ------ 55,761 ------ 55,761 Richmond 14,567,266 131,700 14,698,966 ------ 112,216 131,821 14,943,003Graham ------ ------ ------ ------ ------ ------ ------ Robeson 23,555,573 293,860 23,849,433 ------ 632,841 1,130,553 25,612,827Granville 3,713,782 191,150 3,904,932 ------ 317,488 1,743,403 5,965,823 Rockingham 11,478,329 104,340 11,582,669 ------ 383,757 3,263,203 15,229,629Greene 583,623 ------ 583,623 ------ 54,300 ------ 637,923 Rowan 18,398,626 394,230 18,792,856 ------ 610,072 3,765,221 23,168,149
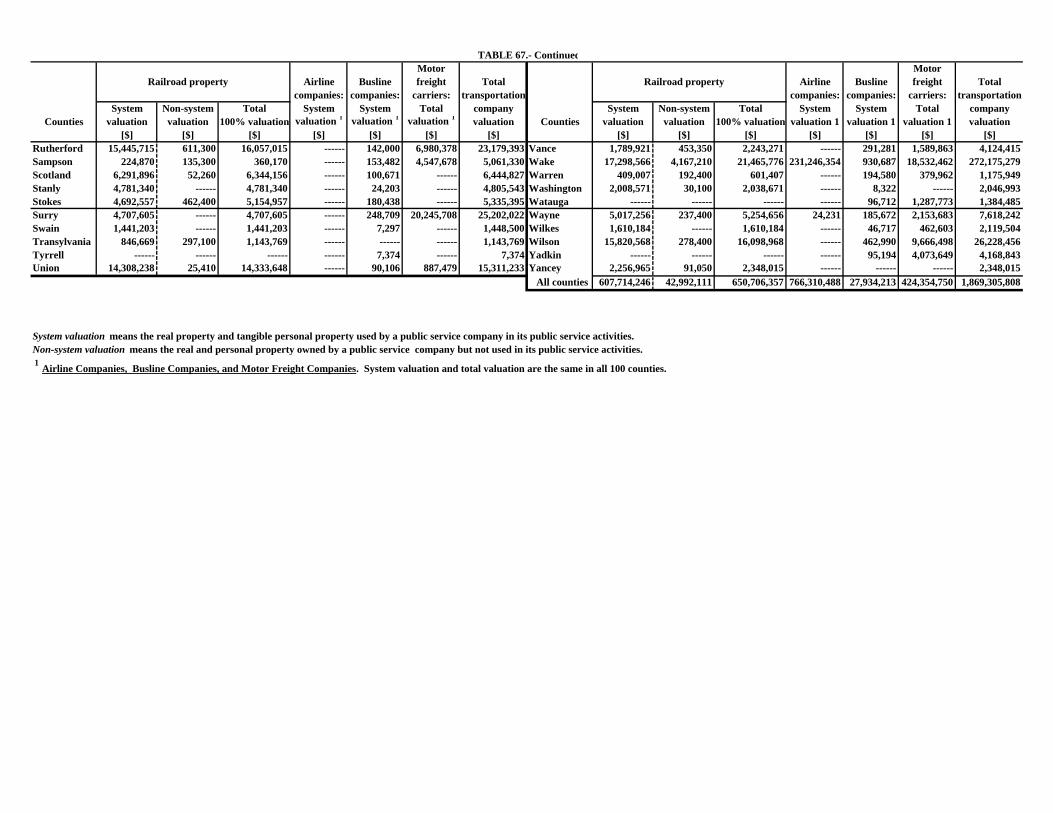
TABLE 67.- ContinuedMotor Motor
Railroad property Airline Busline freight Total Railroad property Airline Busline freight Totalcompanies: companies: carriers: transportation companies: companies: carriers: transportation
System Non-system Total System System Total company System Non-system Total System System Total companyCounties valuation valuation 100% valuation valuation 1 valuation 1 valuation 1 valuation Counties valuation valuation 100% valuation valuation 1 valuation 1 valuation 1 valuation
[$] [$] [$] [$] [$] [$] [$] [$] [$] [$] [$] [$] [$] [$]Rutherford 15,445,715 611,300 16,057,015 ------ 142,000 6,980,378 23,179,393 Vance 1,789,921 453,350 2,243,271 ------ 291,281 1,589,863 4,124,415Sampson 224,870 135,300 360,170 ------ 153,482 4,547,678 5,061,330 Wake 17,298,566 4,167,210 21,465,776 231,246,354 930,687 18,532,462 272,175,279Scotland 6,291,896 52,260 6,344,156 ------ 100,671 ------ 6,444,827 Warren 409,007 192,400 601,407 ------ 194,580 379,962 1,175,949Stanly 4,781,340 ------ 4,781,340 ------ 24,203 ------ 4,805,543 Washington 2,008,571 30,100 2,038,671 ------ 8,322 ------ 2,046,993Stokes 4,692,557 462,400 5,154,957 ------ 180,438 ------ 5,335,395 Watauga ------ ------ ------ ------ 96,712 1,287,773 1,384,485Surry 4,707,605 ------ 4,707,605 ------ 248,709 20,245,708 25,202,022 Wayne 5,017,256 237,400 5,254,656 24,231 185,672 2,153,683 7,618,242Swain 1,441,203 ------ 1,441,203 ------ 7,297 ------ 1,448,500 Wilkes 1,610,184 ------ 1,610,184 ------ 46,717 462,603 2,119,504Transylvania 846,669 297,100 1,143,769 ------ ------ ------ 1,143,769 Wilson 15,820,568 278,400 16,098,968 ------ 462,990 9,666,498 26,228,456Tyrrell ------ ------ ------ ------ 7,374 ------ 7,374 Yadkin ------ ------ ------ ------ 95,194 4,073,649 4,168,843Union 14,308,238 25,410 14,333,648 ------ 90,106 887,479 15,311,233 Yancey 2,256,965 91,050 2,348,015 ------ ------ ------ 2,348,015
All counties 607,714,246 42,992,111 650,706,357 766,310,488 27,934,213 424,354,750 1,869,305,808
System valuation means the real property and tangible personal property used by a public service company in its public service activities. Non-system valuation means the real and personal property owned by a public service company but not used in its public service activities. 1 Airline Companies, Busline Companies, and Motor Freight Companies. System valuation and total valuation are the same in all 100 counties.
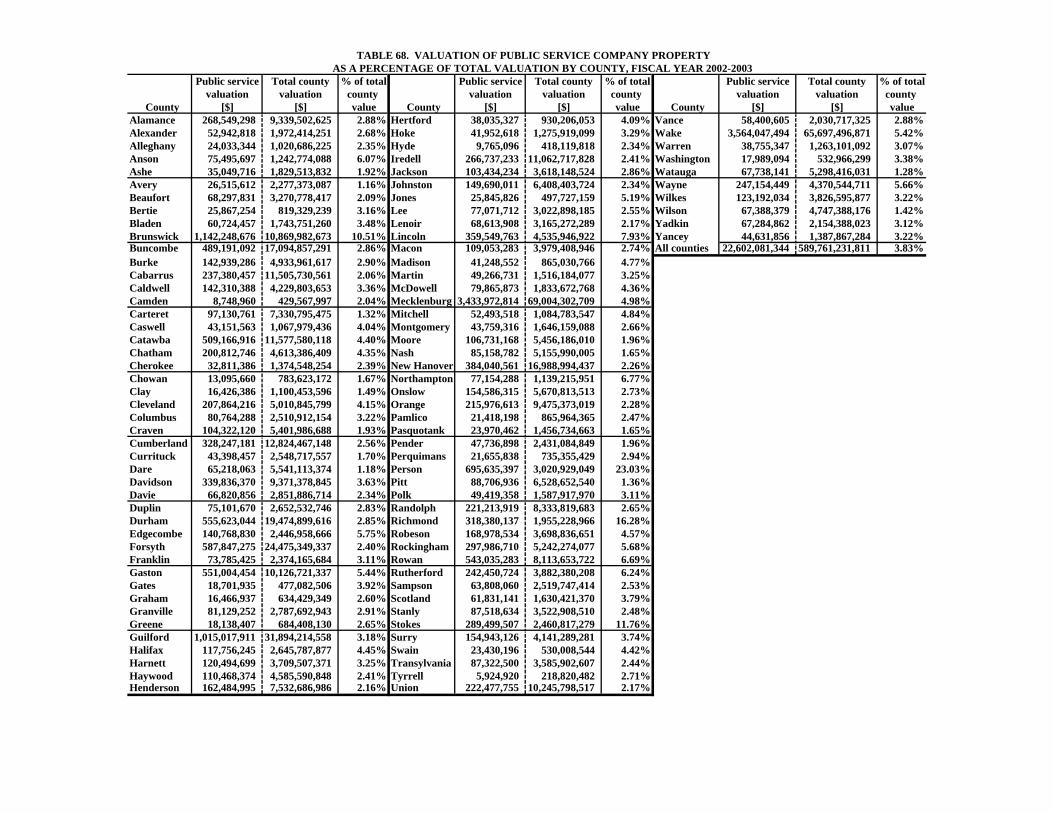
TABLE 68. VALUATION OF PUBLIC SERVICE COMPANY PROPERTY AS A PERCENTAGE OF TOTAL VALUATION BY COUNTY, FISCAL YEAR 2002-2003
Public service Total county % of total Public service Total county % of total Public service Total county % of totalvaluation valuation county valuation valuation county valuation valuation county
County [$] [$] value County [$] [$] value County [$] [$] valueAlamance 268,549,298 9,339,502,625 2.88% Hertford 38,035,327 930,206,053 4.09% Vance 58,400,605 2,030,717,325 2.88%Alexander 52,942,818 1,972,414,251 2.68% Hoke 41,952,618 1,275,919,099 3.29% Wake 3,564,047,494 65,697,496,871 5.42%Alleghany 24,033,344 1,020,686,225 2.35% Hyde 9,765,096 418,119,818 2.34% Warren 38,755,347 1,263,101,092 3.07%Anson 75,495,697 1,242,774,088 6.07% Iredell 266,737,233 11,062,717,828 2.41% Washington 17,989,094 532,966,299 3.38%Ashe 35,049,716 1,829,513,832 1.92% Jackson 103,434,234 3,618,148,524 2.86% Watauga 67,738,141 5,298,416,031 1.28%Avery 26,515,612 2,277,373,087 1.16% Johnston 149,690,011 6,408,403,724 2.34% Wayne 247,154,449 4,370,544,711 5.66%Beaufort 68,297,831 3,270,778,417 2.09% Jones 25,845,826 497,727,159 5.19% Wilkes 123,192,034 3,826,595,877 3.22%Bertie 25,867,254 819,329,239 3.16% Lee 77,071,712 3,022,898,185 2.55% Wilson 67,388,379 4,747,388,176 1.42%Bladen 60,724,457 1,743,751,260 3.48% Lenoir 68,613,908 3,165,272,289 2.17% Yadkin 67,284,862 2,154,388,023 3.12%Brunswick 1,142,248,676 10,869,982,673 10.51% Lincoln 359,549,763 4,535,946,922 7.93% Yancey 44,631,856 1,387,867,284 3.22%Buncombe 489,191,092 17,094,857,291 2.86% Macon 109,053,283 3,979,408,946 2.74% All counties 22,602,081,344 589,761,231,811 3.83%Burke 142,939,286 4,933,961,617 2.90% Madison 41,248,552 865,030,766 4.77%Cabarrus 237,380,457 11,505,730,561 2.06% Martin 49,266,731 1,516,184,077 3.25%Caldwell 142,310,388 4,229,803,653 3.36% McDowell 79,865,873 1,833,672,768 4.36%Camden 8,748,960 429,567,997 2.04% Mecklenburg 3,433,972,814 69,004,302,709 4.98%Carteret 97,130,761 7,330,795,475 1.32% Mitchell 52,493,518 1,084,783,547 4.84%Caswell 43,151,563 1,067,979,436 4.04% Montgomery 43,759,316 1,646,159,088 2.66%Catawba 509,166,916 11,577,580,118 4.40% Moore 106,731,168 5,456,186,010 1.96%Chatham 200,812,746 4,613,386,409 4.35% Nash 85,158,782 5,155,990,005 1.65%Cherokee 32,811,386 1,374,548,254 2.39% New Hanover 384,040,561 16,988,994,437 2.26%Chowan 13,095,660 783,623,172 1.67% Northampton 77,154,288 1,139,215,951 6.77%Clay 16,426,386 1,100,453,596 1.49% Onslow 154,586,315 5,670,813,513 2.73%Cleveland 207,864,216 5,010,845,799 4.15% Orange 215,976,613 9,475,373,019 2.28%Columbus 80,764,288 2,510,912,154 3.22% Pamlico 21,418,198 865,964,365 2.47%Craven 104,322,120 5,401,986,688 1.93% Pasquotank 23,970,462 1,456,734,663 1.65%Cumberland 328,247,181 12,824,467,148 2.56% Pender 47,736,898 2,431,084,849 1.96%Currituck 43,398,457 2,548,717,557 1.70% Perquimans 21,655,838 735,355,429 2.94%Dare 65,218,063 5,541,113,374 1.18% Person 695,635,397 3,020,929,049 23.03%Davidson 339,836,370 9,371,378,845 3.63% Pitt 88,706,936 6,528,652,540 1.36%Davie 66,820,856 2,851,886,714 2.34% Polk 49,419,358 1,587,917,970 3.11%Duplin 75,101,670 2,652,532,746 2.83% Randolph 221,213,919 8,333,819,683 2.65%Durham 555,623,044 19,474,899,616 2.85% Richmond 318,380,137 1,955,228,966 16.28%Edgecombe 140,768,830 2,446,958,666 5.75% Robeson 168,978,534 3,698,836,651 4.57%Forsyth 587,847,275 24,475,349,337 2.40% Rockingham 297,986,710 5,242,274,077 5.68%Franklin 73,785,425 2,374,165,684 3.11% Rowan 543,035,283 8,113,653,722 6.69%Gaston 551,004,454 10,126,721,337 5.44% Rutherford 242,450,724 3,882,380,208 6.24%Gates 18,701,935 477,082,506 3.92% Sampson 63,808,060 2,519,747,414 2.53%Graham 16,466,937 634,429,349 2.60% Scotland 61,831,141 1,630,421,370 3.79%Granville 81,129,252 2,787,692,943 2.91% Stanly 87,518,634 3,522,908,510 2.48%Greene 18,138,407 684,408,130 2.65% Stokes 289,499,507 2,460,817,279 11.76%Guilford 1,015,017,911 31,894,214,558 3.18% Surry 154,943,126 4,141,289,281 3.74%Halifax 117,756,245 2,645,787,877 4.45% Swain 23,430,196 530,008,544 4.42%Harnett 120,494,699 3,709,507,371 3.25% Transylvania 87,322,500 3,585,902,607 2.44%Haywood 110,468,374 4,585,590,848 2.41% Tyrrell 5,924,920 218,820,482 2.71%Henderson 162,484,995 7,532,686,986 2.16% Union 222,477,755 10,245,798,517 2.17%
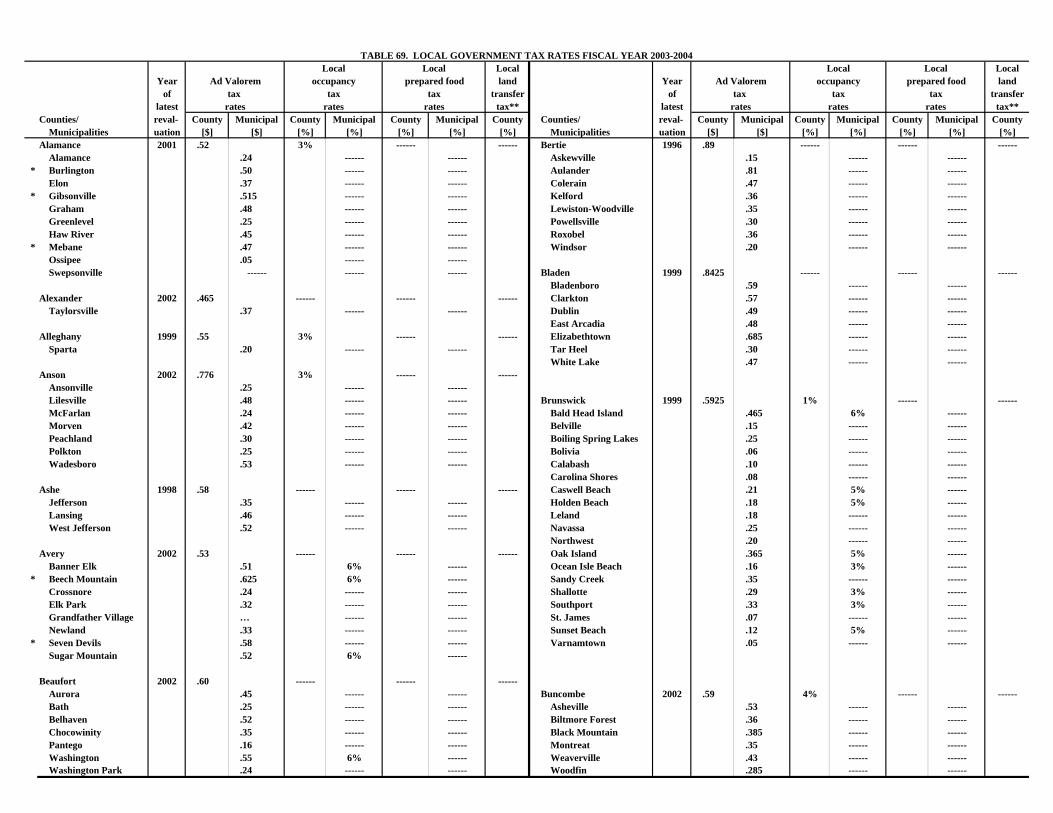
TABLE 69. LOCAL GOVERNMENT TAX RATES FISCAL YEAR 2003-2004Local Local Local Local Local Local
Year Ad Valorem occupancy prepared food land Year Ad Valorem occupancy prepared food landof tax tax tax transfer of tax tax tax transfer
latest rates rates rates tax** latest rates rates rates tax**Counties/ reval- County Municipal County Municipal County Municipal County Counties/ reval- County Municipal County Municipal County Municipal County
Municipalities uation [$] [$] [%] [%] [%] [%] [%] Municipalities uation [$] [$] [%] [%] [%] [%] [%]Alamance 2001 .52 3% ------ ------ Bertie 1996 .89 ------ ------ ------
Alamance .24 ------ ------ Askewville .15 ------ ------* Burlington .50 ------ ------ Aulander .81 ------ ------
Elon .37 ------ ------ Colerain .47 ------ ------* Gibsonville .515 ------ ------ Kelford .36 ------ ------
Graham .48 ------ ------ Lewiston-Woodville .35 ------ ------Greenlevel .25 ------ ------ Powellsville .30 ------ ------Haw River .45 ------ ------ Roxobel .36 ------ ------
* Mebane .47 ------ ------ Windsor .20 ------ ------Ossipee .05 ------ ------Swepsonville ------ ------ ------ Bladen 1999 .8425 ------ ------ ------
Bladenboro .59 ------ ------Alexander 2002 .465 ------ ------ ------ Clarkton .57 ------ ------
Taylorsville .37 ------ ------ Dublin .49 ------ ------East Arcadia .48 ------ ------
Alleghany 1999 .55 3% ------ ------ Elizabethtown .685 ------ ------Sparta .20 ------ ------ Tar Heel .30 ------ ------
White Lake .47 ------ ------Anson 2002 .776 3% ------ ------
Ansonville .25 ------ ------Lilesville .48 ------ ------ Brunswick 1999 .5925 1% ------ ------McFarlan .24 ------ ------ Bald Head Island .465 6% ------Morven .42 ------ ------ Belville .15 ------ ------Peachland .30 ------ ------ Boiling Spring Lakes .25 ------ ------Polkton .25 ------ ------ Bolivia .06 ------ ------Wadesboro .53 ------ ------ Calabash .10 ------ ------
Carolina Shores .08 ------ ------Ashe 1998 .58 ------ ------ ------ Caswell Beach .21 5% ------
Jefferson .35 ------ ------ Holden Beach .18 5% ------Lansing .46 ------ ------ Leland .18 ------ ------West Jefferson .52 ------ ------ Navassa .25 ------ ------
Northwest .20 ------ ------Avery 2002 .53 ------ ------ ------ Oak Island .365 5% ------
Banner Elk .51 6% ------ Ocean Isle Beach .16 3% ------* Beech Mountain .625 6% ------ Sandy Creek .35 ------ ------
Crossnore .24 ------ ------ Shallotte .29 3% ------Elk Park .32 ------ ------ Southport .33 3% ------Grandfather Village … ------ ------ St. James .07 ------ ------Newland .33 ------ ------ Sunset Beach .12 5% ------
* Seven Devils .58 ------ ------ Varnamtown .05 ------ ------Sugar Mountain .52 6% ------
Beaufort 2002 .60 ------ ------ ------Aurora .45 ------ ------ Buncombe 2002 .59 4% ------ ------Bath .25 ------ ------ Asheville .53 ------ ------Belhaven .52 ------ ------ Biltmore Forest .36 ------ ------Chocowinity .35 ------ ------ Black Mountain .385 ------ ------Pantego .16 ------ ------ Montreat .35 ------ ------Washington .55 6% ------ Weaverville .43 ------ ------Washington Park .24 ------ ------ Woodfin .285 ------ ------
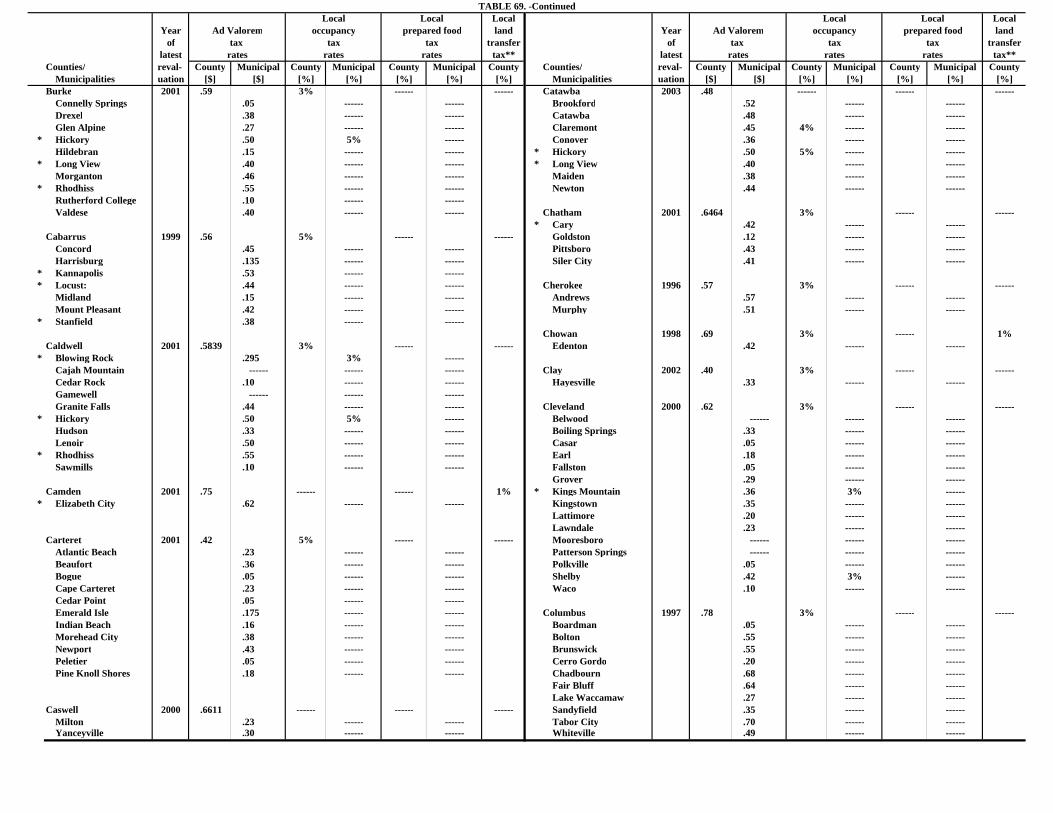
TABLE 69. -ContinuedLocal Local Local Local Local Local
Year Ad Valorem occupancy prepared food land Year Ad Valorem occupancy prepared food landof tax tax tax transfer of tax tax tax transfer
latest rates rates rates tax** latest rates rates rates tax**Counties/ reval- County Municipal County Municipal County Municipal County Counties/ reval- County Municipal County Municipal County Municipal County
Municipalities uation [$] [$] [%] [%] [%] [%] [%] Municipalities uation [$] [$] [%] [%] [%] [%] [%]Burke 2001 .59 3% ------ ------ Catawba 2003 .48 ------ ------ ------
Connelly Springs .05 ------ ------ Brookford .52 ------ ------Drexel .38 ------ ------ Catawba .48 ------ ------Glen Alpine .27 ------ ------ Claremont .45 4% ------ ------
* Hickory .50 5% ------ Conover .36 ------ ------Hildebran .15 ------ ------ * Hickory .50 5% ------ ------
* Long View .40 ------ ------ * Long View .40 ------ ------Morganton .46 ------ ------ Maiden .38 ------ ------
* Rhodhiss .55 ------ ------ Newton .44 ------ ------Rutherford College .10 ------ ------Valdese .40 ------ ------ Chatham 2001 .6464 3% ------ ------
* Cary .42 ------ ------Cabarrus 1999 .56 5% ------ ------ Goldston .12 ------ ------
Concord .45 ------ ------ Pittsboro .43 ------ ------Harrisburg .135 ------ ------ Siler City .41 ------ ------
* Kannapolis .53 ------ ------* Locust: .44 ------ ------ Cherokee 1996 .57 3% ------ ------
Midland .15 ------ ------ Andrews .57 ------ ------Mount Pleasant .42 ------ ------ Murphy .51 ------ ------
* Stanfield .38 ------ ------Chowan 1998 .69 3% ------ 1%
Caldwell 2001 .5839 3% ------ ------ Edenton .42 ------ ------* Blowing Rock .295 3% ------
Cajah Mountain ------ ------ ------ Clay 2002 .40 3% ------ ------Cedar Rock .10 ------ ------ Hayesville .33 ------ ------Gamewell ------ ------ ------Granite Falls .44 ------ ------ Cleveland 2000 .62 3% ------ ------
* Hickory .50 5% ------ Belwood ------ ------ ------Hudson .33 ------ ------ Boiling Springs .33 ------ ------Lenoir .50 ------ ------ Casar .05 ------ ------
* Rhodhiss .55 ------ ------ Earl .18 ------ ------Sawmills .10 ------ ------ Fallston .05 ------ ------
Grover .29 ------ ------Camden 2001 .75 ------ ------ 1% * Kings Mountain .36 3% ------
* Elizabeth City .62 ------ ------ Kingstown .35 ------ ------Lattimore .20 ------ ------Lawndale .23 ------ ------
Carteret 2001 .42 5% ------ ------ Mooresboro ------ ------ ------Atlantic Beach .23 ------ ------ Patterson Springs ------ ------ ------Beaufort .36 ------ ------ Polkville .05 ------ ------Bogue .05 ------ ------ Shelby .42 3% ------Cape Carteret .23 ------ ------ Waco .10 ------ ------Cedar Point .05 ------ ------Emerald Isle .175 ------ ------ Columbus 1997 .78 3% ------ ------Indian Beach .16 ------ ------ Boardman .05 ------ ------Morehead City .38 ------ ------ Bolton .55 ------ ------Newport .43 ------ ------ Brunswick .55 ------ ------Peletier .05 ------ ------ Cerro Gordo .20 ------ ------Pine Knoll Shores .18 ------ ------ Chadbourn .68 ------ ------
Fair Bluff .64 ------ ------Lake Waccamaw .27 ------ ------
Caswell 2000 .6611 ------ ------ ------ Sandyfield .35 ------ ------Milton .23 ------ ------ Tabor City .70 ------ ------Yanceyville .30 ------ ------ Whiteville .49 ------ ------
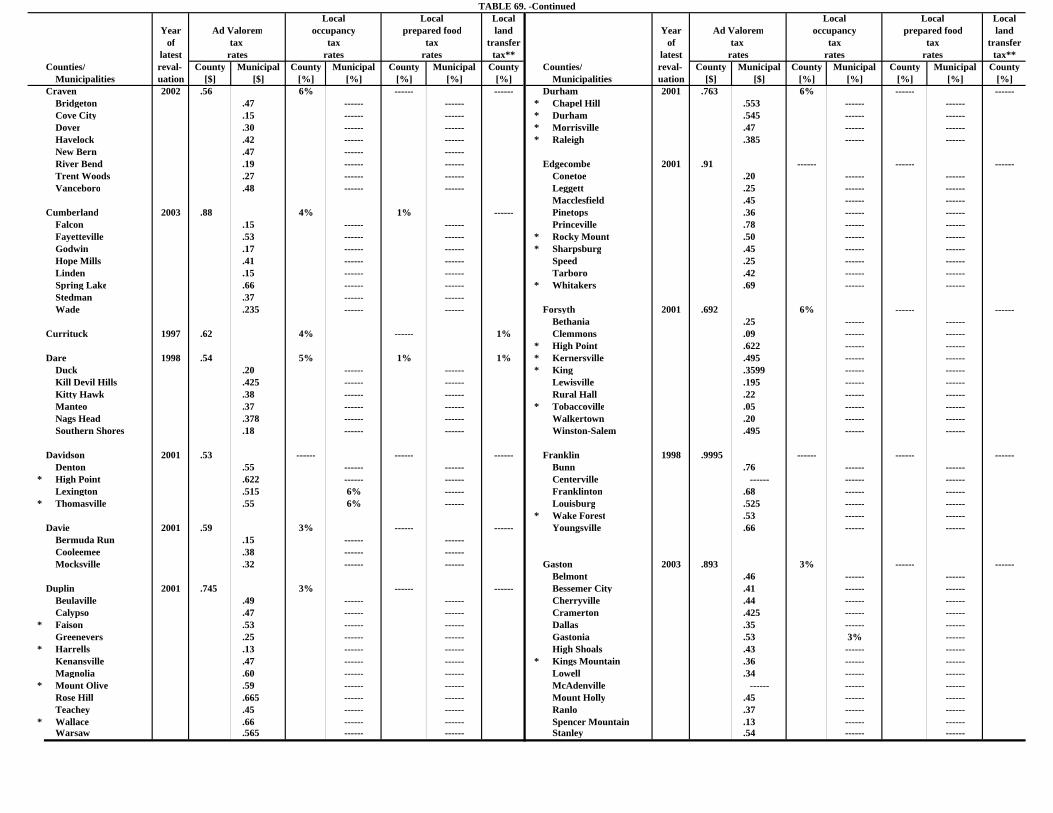
TABLE 69. -ContinuedLocal Local Local Local Local Local
Year Ad Valorem occupancy prepared food land Year Ad Valorem occupancy prepared food landof tax tax tax transfer of tax tax tax transfer
latest rates rates rates tax** latest rates rates rates tax**Counties/ reval- County Municipal County Municipal County Municipal County Counties/ reval- County Municipal County Municipal County Municipal County
Municipalities uation [$] [$] [%] [%] [%] [%] [%] Municipalities uation [$] [$] [%] [%] [%] [%] [%]Craven 2002 .56 6% ------ ------ Durham 2001 .763 6% ------ ------
Bridgeton .47 ------ ------ * Chapel Hill .553 ------ ------Cove City .15 ------ ------ * Durham .545 ------ ------Dover .30 ------ ------ * Morrisville .47 ------ ------Havelock .42 ------ ------ * Raleigh .385 ------ ------New Bern .47 ------ ------River Bend .19 ------ ------ Edgecombe 2001 .91 ------ ------ ------Trent Woods .27 ------ ------ Conetoe .20 ------ ------Vanceboro .48 ------ ------ Leggett .25 ------ ------
Macclesfield .45 ------ ------Cumberland 2003 .88 4% 1% ------ Pinetops .36 ------ ------
Falcon .15 ------ ------ Princeville .78 ------ ------Fayetteville .53 ------ ------ * Rocky Mount .50 ------ ------Godwin .17 ------ ------ * Sharpsburg .45 ------ ------Hope Mills .41 ------ ------ Speed .25 ------ ------Linden .15 ------ ------ Tarboro .42 ------ ------Spring Lake .66 ------ ------ * Whitakers .69 ------ ------Stedman .37 ------ ------Wade .235 ------ ------ Forsyth 2001 .692 6% ------ ------
Bethania .25 ------ ------Currituck 1997 .62 4% ------ 1% Clemmons .09 ------ ------
* High Point .622 ------ ------Dare 1998 .54 5% 1% 1% * Kernersville .495 ------ ------
Duck .20 ------ ------ * King .3599 ------ ------Kill Devil Hills .425 ------ ------ Lewisville .195 ------ ------Kitty Hawk .38 ------ ------ Rural Hall .22 ------ ------Manteo .37 ------ ------ * Tobaccoville .05 ------ ------Nags Head .378 ------ ------ Walkertown .20 ------ ------Southern Shores .18 ------ ------ Winston-Salem .495 ------ ------
Davidson 2001 .53 ------ ------ ------ Franklin 1998 .9995 ------ ------ ------Denton .55 ------ ------ Bunn .76 ------ ------
* High Point .622 ------ ------ Centerville ------ ------ ------Lexington .515 6% ------ Franklinton .68 ------ ------
* Thomasville .55 6% ------ Louisburg .525 ------ ------* Wake Forest .53 ------ ------
Davie 2001 .59 3% ------ ------ Youngsville .66 ------ ------Bermuda Run .15 ------ ------Cooleemee .38 ------ ------Mocksville .32 ------ ------ Gaston 2003 .893 3% ------ ------
Belmont .46 ------ ------Duplin 2001 .745 3% ------ ------ Bessemer City .41 ------ ------
Beulaville .49 ------ ------ Cherryville .44 ------ ------Calypso .47 ------ ------ Cramerton .425 ------ ------
* Faison .53 ------ ------ Dallas .35 ------ ------Greenevers .25 ------ ------ Gastonia .53 3% ------
* Harrells .13 ------ ------ High Shoals .43 ------ ------Kenansville .47 ------ ------ * Kings Mountain .36 ------ ------Magnolia .60 ------ ------ Lowell .34 ------ ------
* Mount Olive .59 ------ ------ McAdenville ------ ------ ------Rose Hill .665 ------ ------ Mount Holly .45 ------ ------Teachey .45 ------ ------ Ranlo .37 ------ ------
* Wallace .66 ------ ------ Spencer Mountain .13 ------ ------Warsaw .565 ------ ------ Stanley .54 ------ ------
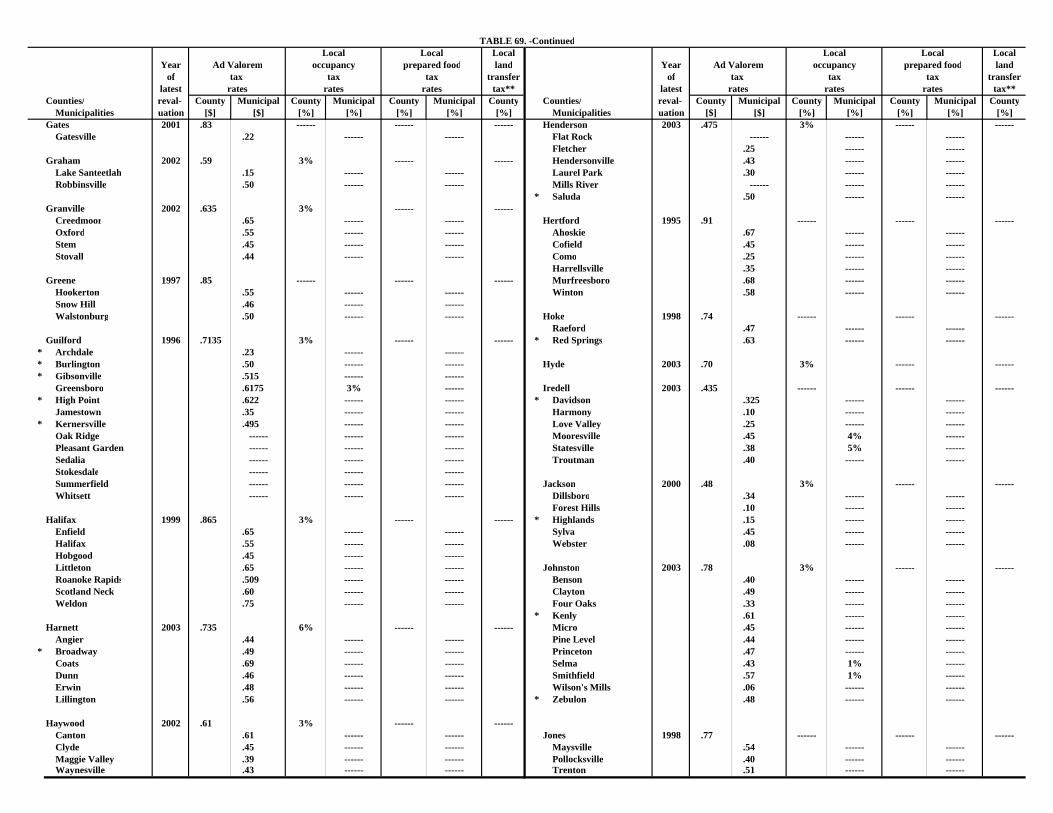
TABLE 69. -ContinuedLocal Local Local Local Local Local
Year Ad Valorem occupancy prepared food land Year Ad Valorem occupancy prepared food landof tax tax tax transfer of tax tax tax transfer
latest rates rates rates tax** latest rates rates rates tax**Counties/ reval- County Municipal County Municipal County Municipal County Counties/ reval- County Municipal County Municipal County Municipal County
Municipalities uation [$] [$] [%] [%] [%] [%] [%] Municipalities uation [$] [$] [%] [%] [%] [%] [%]Gates 2001 .83 ------ ------ ------ Henderson 2003 .475 3% ------ ------
Gatesville .22 ------ ------ Flat Rock ------ ------ ------Fletcher .25 ------ ------
Graham 2002 .59 3% ------ ------ Hendersonville .43 ------ ------Lake Santeetlah .15 ------ ------ Laurel Park .30 ------ ------Robbinsville .50 ------ ------ Mills River ------ ------ ------
* Saluda .50 ------ ------Granville 2002 .635 3% ------ ------
Creedmoor .65 ------ ------ Hertford 1995 .91 ------ ------ ------Oxford .55 ------ ------ Ahoskie .67 ------ ------Stem .45 ------ ------ Cofield .45 ------ ------Stovall .44 ------ ------ Como .25 ------ ------
Harrellsville .35 ------ ------Greene 1997 .85 ------ ------ ------ Murfreesboro .68 ------ ------
Hookerton .55 ------ ------ Winton .58 ------ ------Snow Hill .46 ------ ------Walstonburg .50 ------ ------ Hoke 1998 .74 ------ ------ ------
Raeford .47 ------ ------Guilford 1996 .7135 3% ------ ------ * Red Springs .63 ------ ------
* Archdale .23 ------ ------* Burlington .50 ------ ------ Hyde 2003 .70 3% ------ ------* Gibsonville .515 ------ ------
Greensboro .6175 3% ------ Iredell 2003 .435 ------ ------ ------* High Point .622 ------ ------ * Davidson .325 ------ ------
Jamestown .35 ------ ------ Harmony .10 ------ ------* Kernersville .495 ------ ------ Love Valley .25 ------ ------
Oak Ridge ------ ------ ------ Mooresville .45 4% ------Pleasant Garden ------ ------ ------ Statesville .38 5% ------Sedalia ------ ------ ------ Troutman .40 ------ ------Stokesdale ------ ------ ------Summerfield ------ ------ ------ Jackson 2000 .48 3% ------ ------Whitsett ------ ------ ------ Dillsboro .34 ------ ------
Forest Hills .10 ------ ------Halifax 1999 .865 3% ------ ------ * Highlands .15 ------ ------
Enfield .65 ------ ------ Sylva .45 ------ ------Halifax .55 ------ ------ Webster .08 ------ ------Hobgood .45 ------ ------Littleton .65 ------ ------ Johnston 2003 .78 3% ------ ------Roanoke Rapids .509 ------ ------ Benson .40 ------ ------Scotland Neck .60 ------ ------ Clayton .49 ------ ------Weldon .75 ------ ------ Four Oaks .33 ------ ------
* Kenly .61 ------ ------Harnett 2003 .735 6% ------ ------ Micro .45 ------ ------
Angier .44 ------ ------ Pine Level .44 ------ ------* Broadway .49 ------ ------ Princeton .47 ------ ------
Coats .69 ------ ------ Selma .43 1% ------Dunn .46 ------ ------ Smithfield .57 1% ------Erwin .48 ------ ------ Wilson's Mills .06 ------ ------Lillington .56 ------ ------ * Zebulon .48 ------ ------
Haywood 2002 .61 3% ------ ------Canton .61 ------ ------ Jones 1998 .77 ------ ------ ------Clyde .45 ------ ------ Maysville .54 ------ ------Maggie Valley .39 ------ ------ Pollocksville .40 ------ ------Waynesville .43 ------ ------ Trenton .51 ------ ------
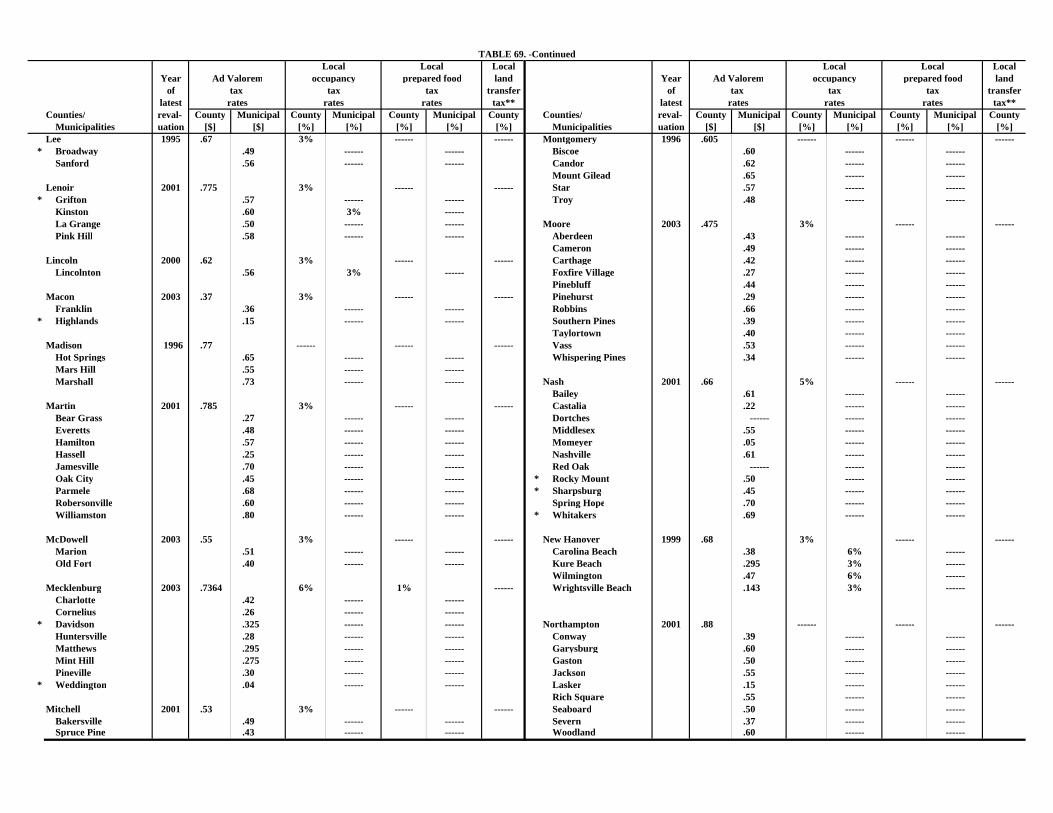
TABLE 69. -ContinuedLocal Local Local Local Local Local
Year Ad Valorem occupancy prepared food land Year Ad Valorem occupancy prepared food landof tax tax tax transfer of tax tax tax transfer
latest rates rates rates tax** latest rates rates rates tax**Counties/ reval- County Municipal County Municipal County Municipal County Counties/ reval- County Municipal County Municipal County Municipal County
Municipalities uation [$] [$] [%] [%] [%] [%] [%] Municipalities uation [$] [$] [%] [%] [%] [%] [%]Lee 1995 .67 3% ------ ------ Montgomery 1996 .605 ------ ------ ------
* Broadway .49 ------ ------ Biscoe .60 ------ ------Sanford .56 ------ ------ Candor .62 ------ ------
Mount Gilead .65 ------ ------Lenoir 2001 .775 3% ------ ------ Star .57 ------ ------
* Grifton .57 ------ ------ Troy .48 ------ ------Kinston .60 3% ------La Grange .50 ------ ------ Moore 2003 .475 3% ------ ------Pink Hill .58 ------ ------ Aberdeen .43 ------ ------
Cameron .49 ------ ------Lincoln 2000 .62 3% ------ ------ Carthage .42 ------ ------
Lincolnton .56 3% ------ Foxfire Village .27 ------ ------Pinebluff .44 ------ ------
Macon 2003 .37 3% ------ ------ Pinehurst .29 ------ ------Franklin .36 ------ ------ Robbins .66 ------ ------
* Highlands .15 ------ ------ Southern Pines .39 ------ ------Taylortown .40 ------ ------
Madison 1996 .77 ------ ------ ------ Vass .53 ------ ------Hot Springs .65 ------ ------ Whispering Pines .34 ------ ------Mars Hill .55 ------ ------Marshall .73 ------ ------ Nash 2001 .66 5% ------ ------
Bailey .61 ------ ------Martin 2001 .785 3% ------ ------ Castalia .22 ------ ------
Bear Grass .27 ------ ------ Dortches ------ ------ ------Everetts .48 ------ ------ Middlesex .55 ------ ------Hamilton .57 ------ ------ Momeyer .05 ------ ------Hassell .25 ------ ------ Nashville .61 ------ ------Jamesville .70 ------ ------ Red Oak ------ ------ ------Oak City .45 ------ ------ * Rocky Mount .50 ------ ------Parmele .68 ------ ------ * Sharpsburg .45 ------ ------Robersonville .60 ------ ------ Spring Hope .70 ------ ------Williamston .80 ------ ------ * Whitakers .69 ------ ------
McDowell 2003 .55 3% ------ ------ New Hanover 1999 .68 3% ------ ------Marion .51 ------ ------ Carolina Beach .38 6% ------Old Fort .40 ------ ------ Kure Beach .295 3% ------
Wilmington .47 6% ------Mecklenburg 2003 .7364 6% 1% ------ Wrightsville Beach .143 3% ------
Charlotte .42 ------ ------Cornelius .26 ------ ------
* Davidson .325 ------ ------ Northampton 2001 .88 ------ ------ ------Huntersville .28 ------ ------ Conway .39 ------ ------Matthews .295 ------ ------ Garysburg .60 ------ ------Mint Hill .275 ------ ------ Gaston .50 ------ ------Pineville .30 ------ ------ Jackson .55 ------ ------
* Weddington .04 ------ ------ Lasker .15 ------ ------Rich Square .55 ------ ------
Mitchell 2001 .53 3% ------ ------ Seaboard .50 ------ ------Bakersville .49 ------ ------ Severn .37 ------ ------Spruce Pine .43 ------ ------ Woodland .60 ------ ------
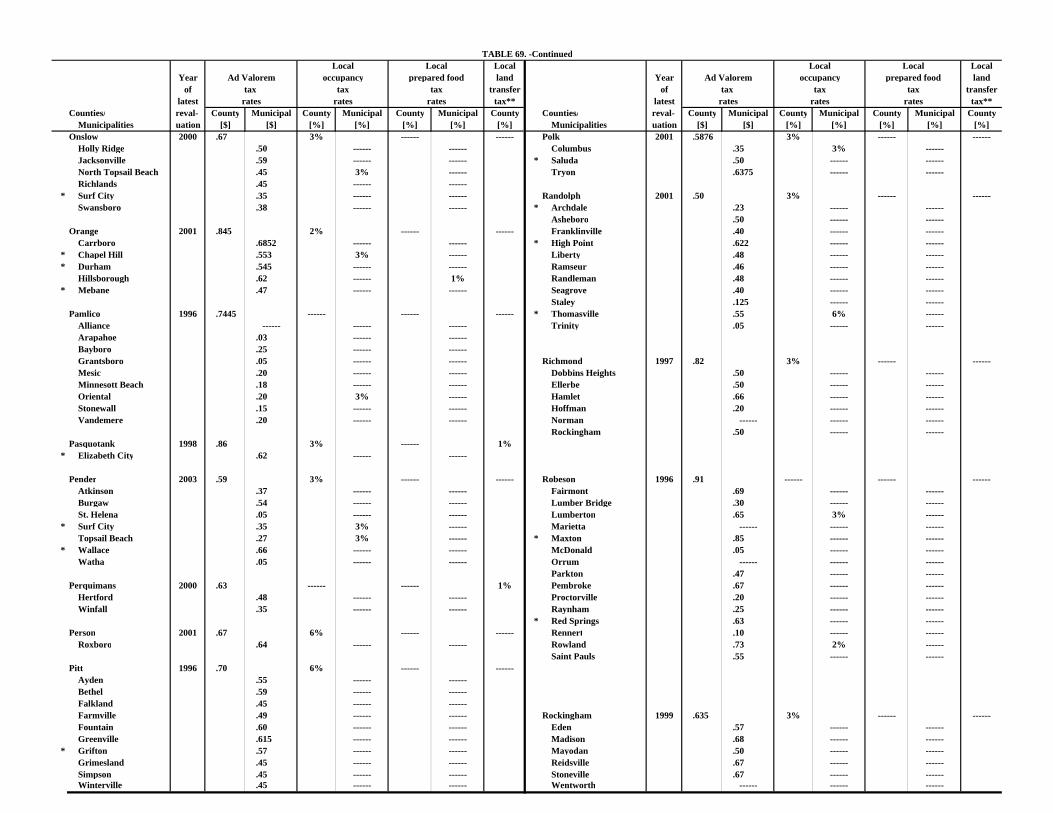
TABLE 69. -ContinuedLocal Local Local Local Local Local
Year Ad Valorem occupancy prepared food land Year Ad Valorem occupancy prepared food landof tax tax tax transfer of tax tax tax transfer
latest rates rates rates tax** latest rates rates rates tax**Counties/ reval- County Municipal County Municipal County Municipal County Counties/ reval- County Municipal County Municipal County Municipal County
Municipalities uation [$] [$] [%] [%] [%] [%] [%] Municipalities uation [$] [$] [%] [%] [%] [%] [%]Onslow 2000 .67 3% ------ ------ Polk 2001 .5876 3% ------ ------
Holly Ridge .50 ------ ------ Columbus .35 3% ------Jacksonville .59 ------ ------ * Saluda .50 ------ ------North Topsail Beach .45 3% ------ Tryon .6375 ------ ------Richlands .45 ------ ------
* Surf City .35 ------ ------ Randolph 2001 .50 3% ------ ------Swansboro .38 ------ ------ * Archdale .23 ------ ------
Asheboro .50 ------ ------Orange 2001 .845 2% ------ ------ Franklinville .40 ------ ------
Carrboro .6852 ------ ------ * High Point .622 ------ ------* Chapel Hill .553 3% ------ Liberty .48 ------ ------* Durham .545 ------ ------ Ramseur .46 ------ ------
Hillsborough .62 ------ 1% Randleman .48 ------ ------* Mebane .47 ------ ------ Seagrove .40 ------ ------
Staley .125 ------ ------Pamlico 1996 .7445 ------ ------ ------ * Thomasville .55 6% ------
Alliance ------ ------ ------ Trinity .05 ------ ------Arapahoe .03 ------ ------Bayboro .25 ------ ------Grantsboro .05 ------ ------ Richmond 1997 .82 3% ------ ------Mesic .20 ------ ------ Dobbins Heights .50 ------ ------Minnesott Beach .18 ------ ------ Ellerbe .50 ------ ------Oriental .20 3% ------ Hamlet .66 ------ ------Stonewall .15 ------ ------ Hoffman .20 ------ ------Vandemere .20 ------ ------ Norman ------ ------ ------
Rockingham .50 ------ ------Pasquotank 1998 .86 3% ------ 1%
* Elizabeth City .62 ------ ------
Pender 2003 .59 3% ------ ------ Robeson 1996 .91 ------ ------ ------Atkinson .37 ------ ------ Fairmont .69 ------ ------Burgaw .54 ------ ------ Lumber Bridge .30 ------ ------St. Helena .05 ------ ------ Lumberton .65 3% ------
* Surf City .35 3% ------ Marietta ------ ------ ------Topsail Beach .27 3% ------ * Maxton .85 ------ ------
* Wallace .66 ------ ------ McDonald .05 ------ ------Watha .05 ------ ------ Orrum ------ ------ ------
Parkton .47 ------ ------Perquimans 2000 .63 ------ ------ 1% Pembroke .67 ------ ------
Hertford .48 ------ ------ Proctorville .20 ------ ------Winfall .35 ------ ------ Raynham .25 ------ ------
* Red Springs .63 ------ ------Person 2001 .67 6% ------ ------ Rennert .10 ------ ------
Roxboro .64 ------ ------ Rowland .73 2% ------Saint Pauls .55 ------ ------
Pitt 1996 .70 6% ------ ------Ayden .55 ------ ------Bethel .59 ------ ------Falkland .45 ------ ------Farmville .49 ------ ------ Rockingham 1999 .635 3% ------ ------Fountain .60 ------ ------ Eden .57 ------ ------Greenville .615 ------ ------ Madison .68 ------ ------
* Grifton .57 ------ ------ Mayodan .50 ------ ------Grimesland .45 ------ ------ Reidsville .67 ------ ------Simpson .45 ------ ------ Stoneville .67 ------ ------Winterville .45 ------ ------ Wentworth ------ ------ ------
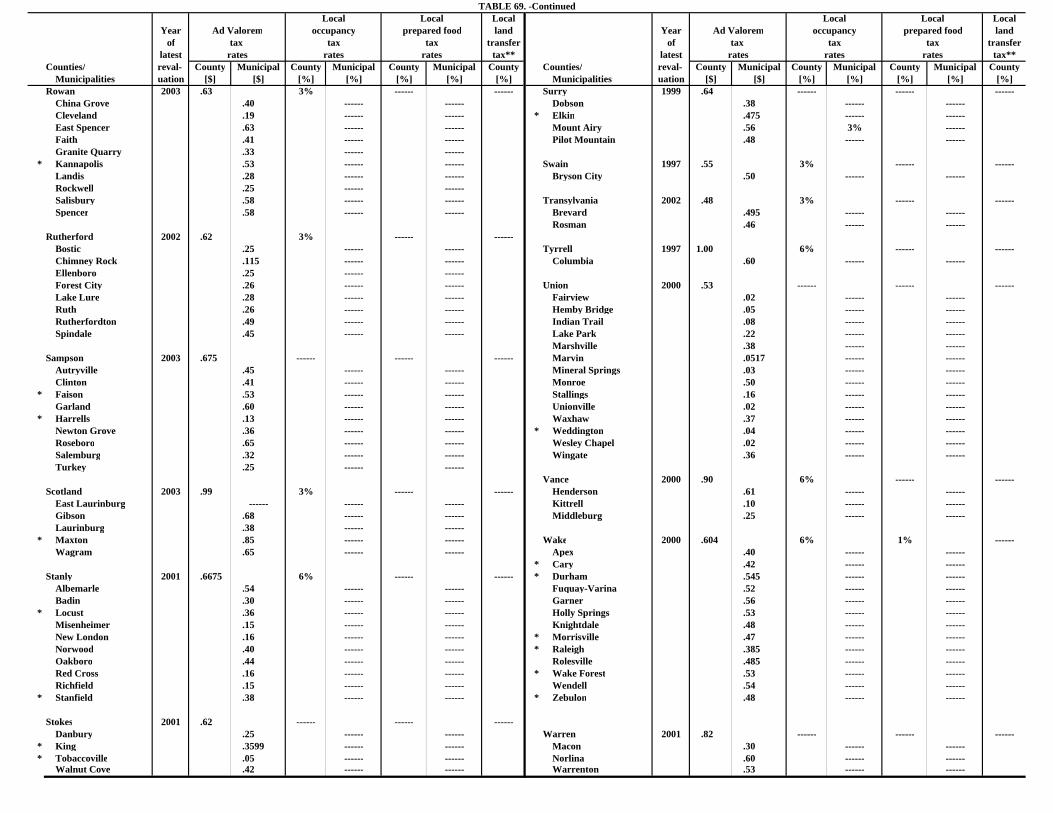
TABLE 69. -ContinuedLocal Local Local Local Local Local
Year Ad Valorem occupancy prepared food land Year Ad Valorem occupancy prepared food landof tax tax tax transfer of tax tax tax transfer
latest rates rates rates tax** latest rates rates rates tax**Counties/ reval- County Municipal County Municipal County Municipal County Counties/ reval- County Municipal County Municipal County Municipal County
Municipalities uation [$] [$] [%] [%] [%] [%] [%] Municipalities uation [$] [$] [%] [%] [%] [%] [%]Rowan 2003 .63 3% ------ ------ Surry 1999 .64 ------ ------ ------
China Grove .40 ------ ------ Dobson .38 ------ ------Cleveland .19 ------ ------ * Elkin .475 ------ ------East Spencer .63 ------ ------ Mount Airy .56 3% ------Faith .41 ------ ------ Pilot Mountain .48 ------ ------Granite Quarry .33 ------ ------
* Kannapolis .53 ------ ------ Swain 1997 .55 3% ------ ------Landis .28 ------ ------ Bryson City .50 ------ ------Rockwell .25 ------ ------Salisbury .58 ------ ------ Transylvania 2002 .48 3% ------ ------Spencer .58 ------ ------ Brevard .495 ------ ------
Rosman .46 ------ ------Rutherford 2002 .62 3% ------ ------
Bostic .25 ------ ------ Tyrrell 1997 1.00 6% ------ ------Chimney Rock .115 ------ ------ Columbia .60 ------ ------Ellenboro .25 ------ ------Forest City .26 ------ ------ Union 2000 .53 ------ ------ ------Lake Lure .28 ------ ------ Fairview .02 ------ ------Ruth .26 ------ ------ Hemby Bridge .05 ------ ------Rutherfordton .49 ------ ------ Indian Trail .08 ------ ------Spindale .45 ------ ------ Lake Park .22 ------ ------
Marshville .38 ------ ------Sampson 2003 .675 ------ ------ ------ Marvin .0517 ------ ------
Autryville .45 ------ ------ Mineral Springs .03 ------ ------Clinton .41 ------ ------ Monroe .50 ------ ------
* Faison .53 ------ ------ Stallings .16 ------ ------Garland .60 ------ ------ Unionville .02 ------ ------
* Harrells .13 ------ ------ Waxhaw .37 ------ ------Newton Grove .36 ------ ------ * Weddington .04 ------ ------Roseboro .65 ------ ------ Wesley Chapel .02 ------ ------Salemburg .32 ------ ------ Wingate .36 ------ ------Turkey .25 ------ ------
Vance 2000 .90 6% ------ ------Scotland 2003 .99 3% ------ ------ Henderson .61 ------ ------
East Laurinburg ------ ------ ------ Kittrell .10 ------ ------Gibson .68 ------ ------ Middleburg .25 ------ ------Laurinburg .38 ------ ------
* Maxton .85 ------ ------ Wake 2000 .604 6% 1% ------Wagram .65 ------ ------ Apex .40 ------ ------
* Cary .42 ------ ------Stanly 2001 .6675 6% ------ ------ * Durham .545 ------ ------
Albemarle .54 ------ ------ Fuquay-Varina .52 ------ ------Badin .30 ------ ------ Garner .56 ------ ------
* Locust .36 ------ ------ Holly Springs .53 ------ ------Misenheimer .15 ------ ------ Knightdale .48 ------ ------New London .16 ------ ------ * Morrisville .47 ------ ------Norwood .40 ------ ------ * Raleigh .385 ------ ------Oakboro .44 ------ ------ Rolesville .485 ------ ------Red Cross .16 ------ ------ * Wake Forest .53 ------ ------Richfield .15 ------ ------ Wendell .54 ------ ------
* Stanfield .38 ------ ------ * Zebulon .48 ------ ------
Stokes 2001 .62 ------ ------ ------Danbury .25 ------ ------ Warren 2001 .82 ------ ------ ------
* King .3599 ------ ------ Macon .30 ------ ------* Tobaccoville .05 ------ ------ Norlina .60 ------ ------
Walnut Cove .42 ------ ------ Warrenton .53 ------ ------
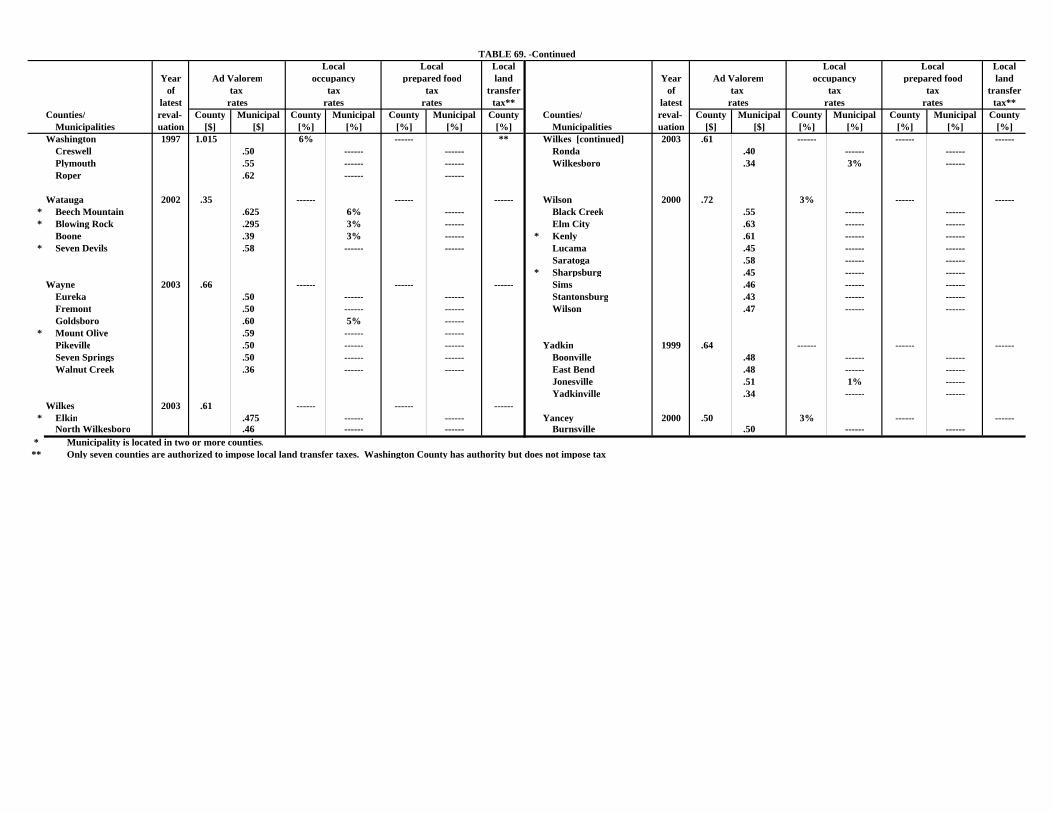
TABLE 69. -ContinuedLocal Local Local Local Local Local
Year Ad Valorem occupancy prepared food land Year Ad Valorem occupancy prepared food landof tax tax tax transfer of tax tax tax transfer
latest rates rates rates tax** latest rates rates rates tax**Counties/ reval- County Municipal County Municipal County Municipal County Counties/ reval- County Municipal County Municipal County Municipal County
Municipalities uation [$] [$] [%] [%] [%] [%] [%] Municipalities uation [$] [$] [%] [%] [%] [%] [%]Washington 1997 1.015 6% ------ ** Wilkes [continued] 2003 .61 ------ ------ ------
Creswell .50 ------ ------ Ronda .40 ------ ------Plymouth .55 ------ ------ Wilkesboro .34 3% ------Roper .62 ------ ------
Watauga 2002 .35 ------ ------ ------ Wilson 2000 .72 3% ------ ------* Beech Mountain .625 6% ------ Black Creek .55 ------ ------* Blowing Rock .295 3% ------ Elm City .63 ------ ------
Boone .39 3% ------ * Kenly .61 ------ ------* Seven Devils .58 ------ ------ Lucama .45 ------ ------
Saratoga .58 ------ ------* Sharpsburg .45 ------ ------
Wayne 2003 .66 ------ ------ ------ Sims .46 ------ ------Eureka .50 ------ ------ Stantonsburg .43 ------ ------Fremont .50 ------ ------ Wilson .47 ------ ------Goldsboro .60 5% ------
* Mount Olive .59 ------ ------Pikeville .50 ------ ------ Yadkin 1999 .64 ------ ------ ------Seven Springs .50 ------ ------ Boonville .48 ------ ------Walnut Creek .36 ------ ------ East Bend .48 ------ ------
Jonesville .51 1% ------Yadkinville .34 ------ ------
Wilkes 2003 .61 ------ ------ ------* Elkin .475 ------ ------ Yancey 2000 .50 3% ------ ------
North Wilkesboro .46 ------ ------ Burnsville .50 ------ ------* Municipality is located in two or more counties.** Only seven counties are authorized to impose local land transfer taxes. Washington County has authority but does not impose tax
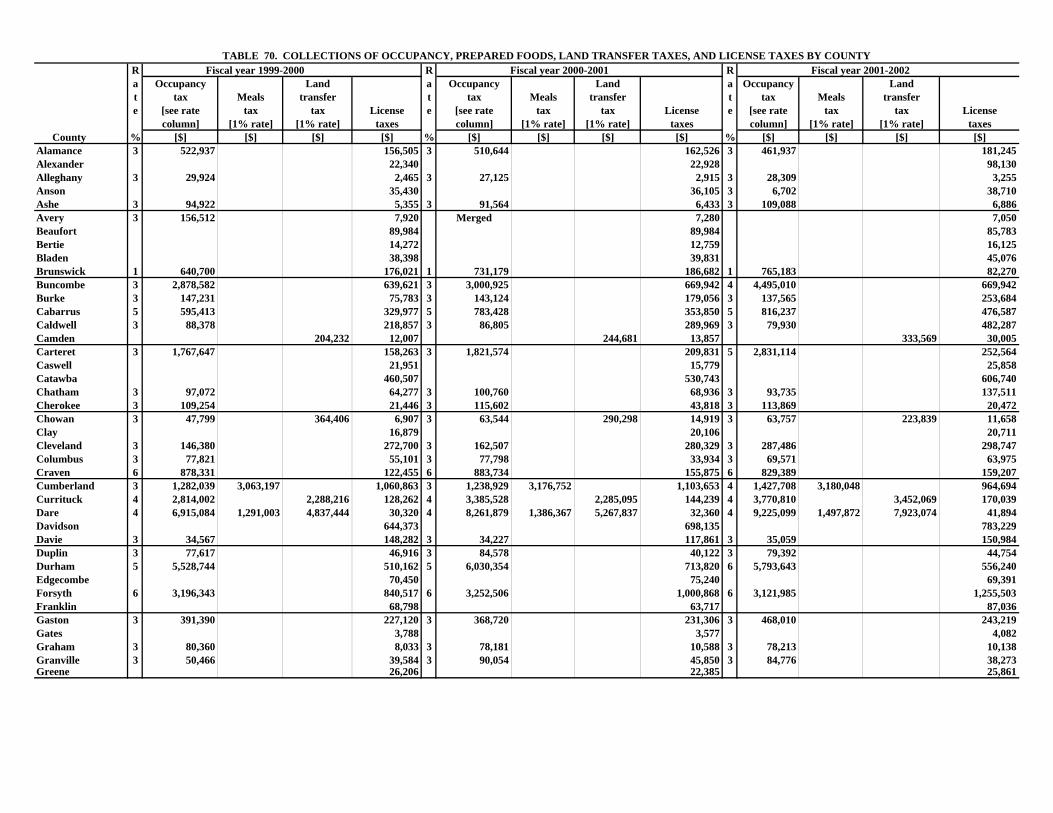
TABLE 70. COLLECTIONS OF OCCUPANCY, PREPARED FOODS, LAND TRANSFER TAXES, AND LICENSE TAXES BY COUNTY R Fiscal year 1999-2000 R Fiscal year 2000-2001 R Fiscal year 2001-2002a Occupancy Land a Occupancy Land a Occupancy Landt tax Meals transfer t tax Meals transfer t tax Meals transfere [see rate tax tax License e [see rate tax tax License e [see rate tax tax License
column] [1% rate] [1% rate] taxes column] [1% rate] [1% rate] taxes column] [1% rate] [1% rate] taxes County % [$] [$] [$] [$] % [$] [$] [$] [$] % [$] [$] [$] [$]Alamance 3 522,937 156,505 3 510,644 162,526 3 461,937 181,245Alexander 22,340 22,928 98,130Alleghany 3 29,924 2,465 3 27,125 2,915 3 28,309 3,255Anson 35,430 36,105 3 6,702 38,710Ashe 3 94,922 5,355 3 91,564 6,433 3 109,088 6,886Avery 3 156,512 7,920 Merged 7,280 7,050Beaufort 89,984 89,984 85,783Bertie 14,272 12,759 16,125Bladen 38,398 39,831 45,076Brunswick 1 640,700 176,021 1 731,179 186,682 1 765,183 82,270Buncombe 3 2,878,582 639,621 3 3,000,925 669,942 4 4,495,010 669,942Burke 3 147,231 75,783 3 143,124 179,056 3 137,565 253,684Cabarrus 5 595,413 329,977 5 783,428 353,850 5 816,237 476,587Caldwell 3 88,378 218,857 3 86,805 289,969 3 79,930 482,287Camden 204,232 12,007 244,681 13,857 333,569 30,005Carteret 3 1,767,647 158,263 3 1,821,574 209,831 5 2,831,114 252,564Caswell 21,951 15,779 25,858Catawba 460,507 530,743 606,740Chatham 3 97,072 64,277 3 100,760 68,936 3 93,735 137,511Cherokee 3 109,254 21,446 3 115,602 43,818 3 113,869 20,472Chowan 3 47,799 364,406 6,907 3 63,544 290,298 14,919 3 63,757 223,839 11,658Clay 16,879 20,106 20,711Cleveland 3 146,380 272,700 3 162,507 280,329 3 287,486 298,747Columbus 3 77,821 55,101 3 77,798 33,934 3 69,571 63,975Craven 6 878,331 122,455 6 883,734 155,875 6 829,389 159,207Cumberland 3 1,282,039 3,063,197 1,060,863 3 1,238,929 3,176,752 1,103,653 4 1,427,708 3,180,048 964,694Currituck 4 2,814,002 2,288,216 128,262 4 3,385,528 2,285,095 144,239 4 3,770,810 3,452,069 170,039Dare 4 6,915,084 1,291,003 4,837,444 30,320 4 8,261,879 1,386,367 5,267,837 32,360 4 9,225,099 1,497,872 7,923,074 41,894Davidson 644,373 698,135 783,229Davie 3 34,567 148,282 3 34,227 117,861 3 35,059 150,984Duplin 3 77,617 46,916 3 84,578 40,122 3 79,392 44,754Durham 5 5,528,744 510,162 5 6,030,354 713,820 6 5,793,643 556,240Edgecombe 70,450 75,240 69,391Forsyth 6 3,196,343 840,517 6 3,252,506 1,000,868 6 3,121,985 1,255,503Franklin 68,798 63,717 87,036Gaston 3 391,390 227,120 3 368,720 231,306 3 468,010 243,219Gates 3,788 3,577 4,082Graham 3 80,360 8,033 3 78,181 10,588 3 78,213 10,138Granville 3 50,466 39,584 3 90,054 45,850 3 84,776 38,273Greene 26,206 22,385 25,861
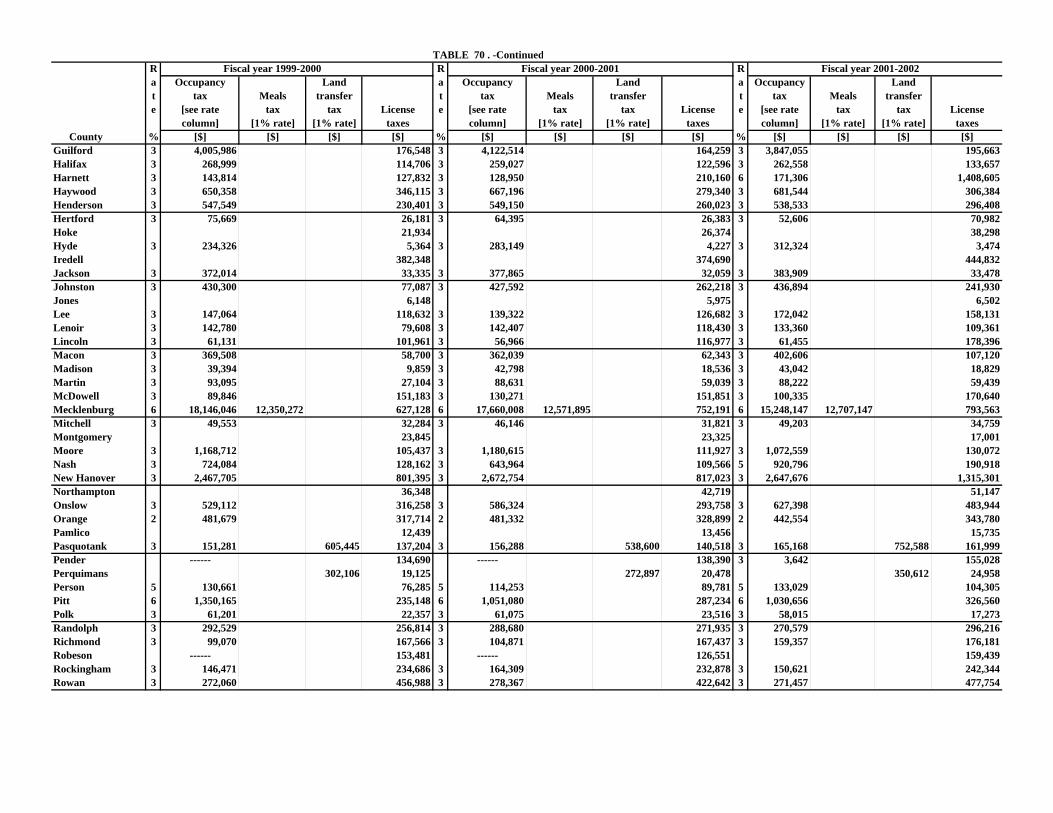
TABLE 70 . -ContinuedR Fiscal year 1999-2000 R Fiscal year 2000-2001 R Fiscal year 2001-2002a Occupancy Land a Occupancy Land a Occupancy Landt tax Meals transfer t tax Meals transfer t tax Meals transfere [see rate tax tax License e [see rate tax tax License e [see rate tax tax License
column] [1% rate] [1% rate] taxes column] [1% rate] [1% rate] taxes column] [1% rate] [1% rate] taxes County % [$] [$] [$] [$] % [$] [$] [$] [$] % [$] [$] [$] [$]Guilford 3 4,005,986 176,548 3 4,122,514 164,259 3 3,847,055 195,663Halifax 3 268,999 114,706 3 259,027 122,596 3 262,558 133,657Harnett 3 143,814 127,832 3 128,950 210,160 6 171,306 1,408,605Haywood 3 650,358 346,115 3 667,196 279,340 3 681,544 306,384Henderson 3 547,549 230,401 3 549,150 260,023 3 538,533 296,408Hertford 3 75,669 26,181 3 64,395 26,383 3 52,606 70,982Hoke 21,934 26,374 38,298Hyde 3 234,326 5,364 3 283,149 4,227 3 312,324 3,474Iredell 382,348 374,690 444,832Jackson 3 372,014 33,335 3 377,865 32,059 3 383,909 33,478Johnston 3 430,300 77,087 3 427,592 262,218 3 436,894 241,930Jones 6,148 5,975 6,502Lee 3 147,064 118,632 3 139,322 126,682 3 172,042 158,131Lenoir 3 142,780 79,608 3 142,407 118,430 3 133,360 109,361Lincoln 3 61,131 101,961 3 56,966 116,977 3 61,455 178,396Macon 3 369,508 58,700 3 362,039 62,343 3 402,606 107,120Madison 3 39,394 9,859 3 42,798 18,536 3 43,042 18,829Martin 3 93,095 27,104 3 88,631 59,039 3 88,222 59,439McDowell 3 89,846 151,183 3 130,271 151,851 3 100,335 170,640Mecklenburg 6 18,146,046 12,350,272 627,128 6 17,660,008 12,571,895 752,191 6 15,248,147 12,707,147 793,563Mitchell 3 49,553 32,284 3 46,146 31,821 3 49,203 34,759Montgomery 23,845 23,325 17,001Moore 3 1,168,712 105,437 3 1,180,615 111,927 3 1,072,559 130,072Nash 3 724,084 128,162 3 643,964 109,566 5 920,796 190,918New Hanover 3 2,467,705 801,395 3 2,672,754 817,023 3 2,647,676 1,315,301Northampton 36,348 42,719 51,147Onslow 3 529,112 316,258 3 586,324 293,758 3 627,398 483,944Orange 2 481,679 317,714 2 481,332 328,899 2 442,554 343,780Pamlico 12,439 13,456 15,735Pasquotank 3 151,281 605,445 137,204 3 156,288 538,600 140,518 3 165,168 752,588 161,999Pender ------ 134,690 ------ 138,390 3 3,642 155,028Perquimans 302,106 19,125 272,897 20,478 350,612 24,958Person 5 130,661 76,285 5 114,253 89,781 5 133,029 104,305Pitt 6 1,350,165 235,148 6 1,051,080 287,234 6 1,030,656 326,560Polk 3 61,201 22,357 3 61,075 23,516 3 58,015 17,273Randolph 3 292,529 256,814 3 288,680 271,935 3 270,579 296,216Richmond 3 99,070 167,566 3 104,871 167,437 3 159,357 176,181Robeson ------ 153,481 ------ 126,551 159,439Rockingham 3 146,471 234,686 3 164,309 232,878 3 150,621 242,344Rowan 3 272,060 456,988 3 278,367 422,642 3 271,457 477,754
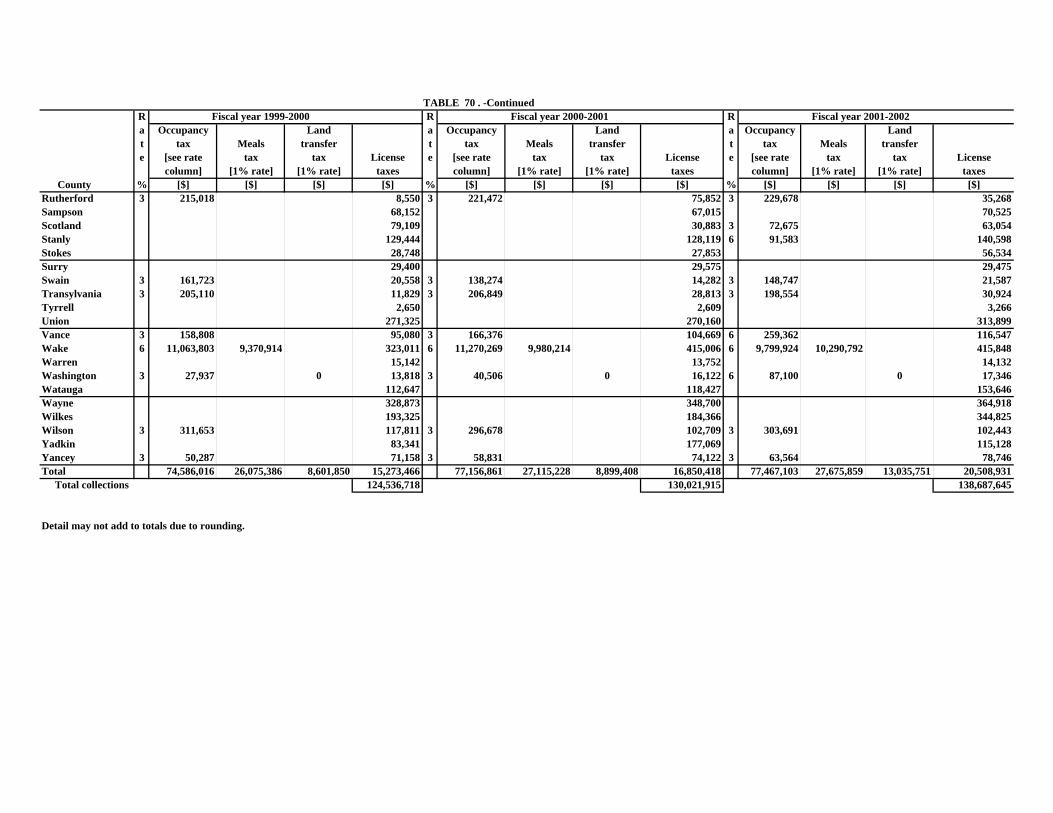
TABLE 70 . -ContinuedR Fiscal year 1999-2000 R Fiscal year 2000-2001 R Fiscal year 2001-2002a Occupancy Land a Occupancy Land a Occupancy Landt tax Meals transfer t tax Meals transfer t tax Meals transfere [see rate tax tax License e [see rate tax tax License e [see rate tax tax License
column] [1% rate] [1% rate] taxes column] [1% rate] [1% rate] taxes column] [1% rate] [1% rate] taxes County % [$] [$] [$] [$] % [$] [$] [$] [$] % [$] [$] [$] [$]Rutherford 3 215,018 8,550 3 221,472 75,852 3 229,678 35,268Sampson 68,152 67,015 70,525Scotland 79,109 30,883 3 72,675 63,054Stanly 129,444 128,119 6 91,583 140,598Stokes 28,748 27,853 56,534Surry 29,400 29,575 29,475Swain 3 161,723 20,558 3 138,274 14,282 3 148,747 21,587Transylvania 3 205,110 11,829 3 206,849 28,813 3 198,554 30,924Tyrrell 2,650 2,609 3,266Union 271,325 270,160 313,899Vance 3 158,808 95,080 3 166,376 104,669 6 259,362 116,547Wake 6 11,063,803 9,370,914 323,011 6 11,270,269 9,980,214 415,006 6 9,799,924 10,290,792 415,848Warren 15,142 13,752 14,132Washington 3 27,937 0 13,818 3 40,506 0 16,122 6 87,100 0 17,346Watauga 112,647 118,427 153,646Wayne 328,873 348,700 364,918Wilkes 193,325 184,366 344,825Wilson 3 311,653 117,811 3 296,678 102,709 3 303,691 102,443Yadkin 83,341 177,069 115,128Yancey 3 50,287 71,158 3 58,831 74,122 3 63,564 78,746Total 74,586,016 26,075,386 8,601,850 15,273,466 77,156,861 27,115,228 8,899,408 16,850,418 77,467,103 27,675,859 13,035,751 20,508,931 Total collections 124,536,718 130,021,915 138,687,645
Detail may not add to totals due to rounding.
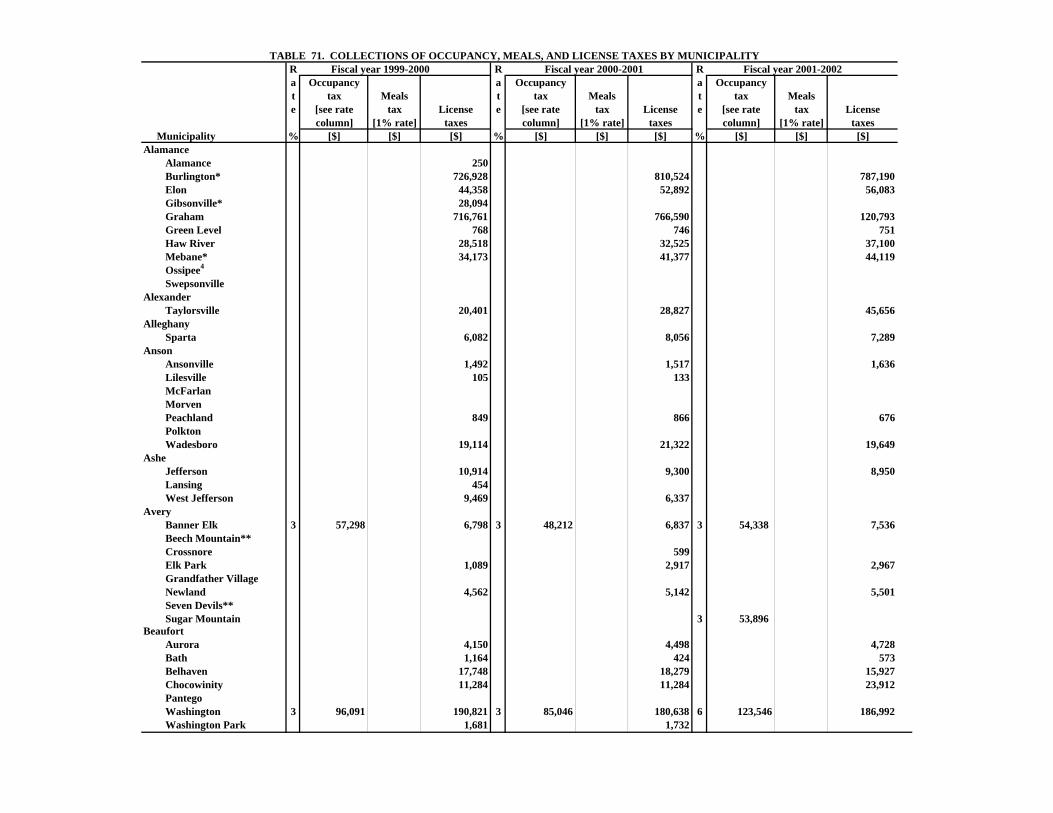
TABLE 71. COLLECTIONS OF OCCUPANCY, MEALS, AND LICENSE TAXES BY MUNICIPALITY R Fiscal year 1999-2000 R Fiscal year 2000-2001 R Fiscal year 2001-2002a Occupancy a Occupancy a Occupancyt tax Meals t tax Meals t tax Mealse [see rate tax License e [see rate tax License e [see rate tax License
column] [1% rate] taxes column] [1% rate] taxes column] [1% rate] taxes Municipality % [$] [$] [$] % [$] [$] [$] % [$] [$] [$]Alamance
Alamance 250Burlington* 726,928 810,524 787,190Elon 44,358 52,892 56,083Gibsonville* 28,094Graham 716,761 766,590 120,793Green Level 768 746 751Haw River 28,518 32,525 37,100Mebane* 34,173 41,377 44,119Ossipee4
SwepsonvilleAlexander
Taylorsville 20,401 28,827 45,656Alleghany
Sparta 6,082 8,056 7,289Anson
Ansonville 1,492 1,517 1,636Lilesville 105 133McFarlanMorvenPeachland 849 866 676PolktonWadesboro 19,114 21,322 19,649
AsheJefferson 10,914 9,300 8,950Lansing 454West Jefferson 9,469 6,337
AveryBanner Elk 3 57,298 6,798 3 48,212 6,837 3 54,338 7,536Beech Mountain**Crossnore 599Elk Park 1,089 2,917 2,967Grandfather VillageNewland 4,562 5,142 5,501Seven Devils**Sugar Mountain 3 53,896
BeaufortAurora 4,150 4,498 4,728Bath 1,164 424 573Belhaven 17,748 18,279 15,927Chocowinity 11,284 11,284 23,912PantegoWashington 3 96,091 190,821 3 85,046 180,638 6 123,546 186,992Washington Park 1,681 1,732
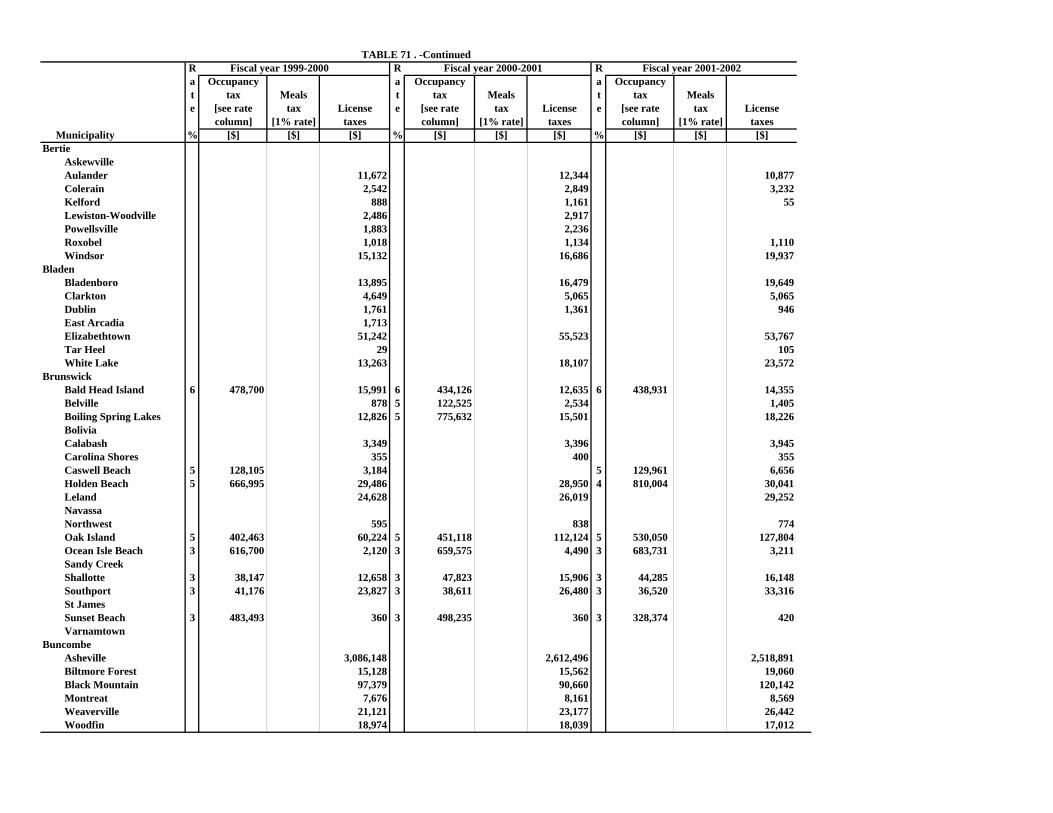
TABLE 71 . -ContinuedR Fiscal year 1999-2000 R Fiscal year 2000-2001 R Fiscal year 2001-2002a Occupancy a Occupancy a Occupancyt tax Meals t tax Meals t tax Mealse [see rate tax License e [see rate tax License e [see rate tax License
column] [1% rate] taxes column] [1% rate] taxes column] [1% rate] taxes Municipality % [$] [$] [$] % [$] [$] [$] % [$] [$] [$]Bertie
AskewvilleAulander 11,672 12,344 10,877Colerain 2,542 2,849 3,232Kelford 888 1,161 55Lewiston-Woodville 2,486 2,917Powellsville 1,883 2,236Roxobel 1,018 1,134 1,110Windsor 15,132 16,686 19,937
BladenBladenboro 13,895 16,479 19,649Clarkton 4,649 5,065 5,065Dublin 1,761 1,361 946East Arcadia 1,713Elizabethtown 51,242 55,523 53,767Tar Heel 29 105White Lake 13,263 18,107 23,572
BrunswickBald Head Island 6 478,700 15,991 6 434,126 12,635 6 438,931 14,355Belville 878 5 122,525 2,534 1,405Boiling Spring Lakes 12,826 5 775,632 15,501 18,226BoliviaCalabash 3,349 3,396 3,945Carolina Shores 355 400 355Caswell Beach 5 128,105 3,184 5 129,961 6,656Holden Beach 5 666,995 29,486 28,950 4 810,004 30,041Leland 24,628 26,019 29,252NavassaNorthwest 595 838 774Oak Island 5 402,463 60,224 5 451,118 112,124 5 530,050 127,804Ocean Isle Beach 3 616,700 2,120 3 659,575 4,490 3 683,731 3,211Sandy CreekShallotte 3 38,147 12,658 3 47,823 15,906 3 44,285 16,148Southport 3 41,176 23,827 3 38,611 26,480 3 36,520 33,316St JamesSunset Beach 3 483,493 360 3 498,235 360 3 328,374 420Varnamtown
BuncombeAsheville 3,086,148 2,612,496 2,518,891Biltmore Forest 15,128 15,562 19,060Black Mountain 97,379 90,660 120,142Montreat 7,676 8,161 8,569Weaverville 21,121 23,177 26,442Woodfin 18,974 18,039 17,012
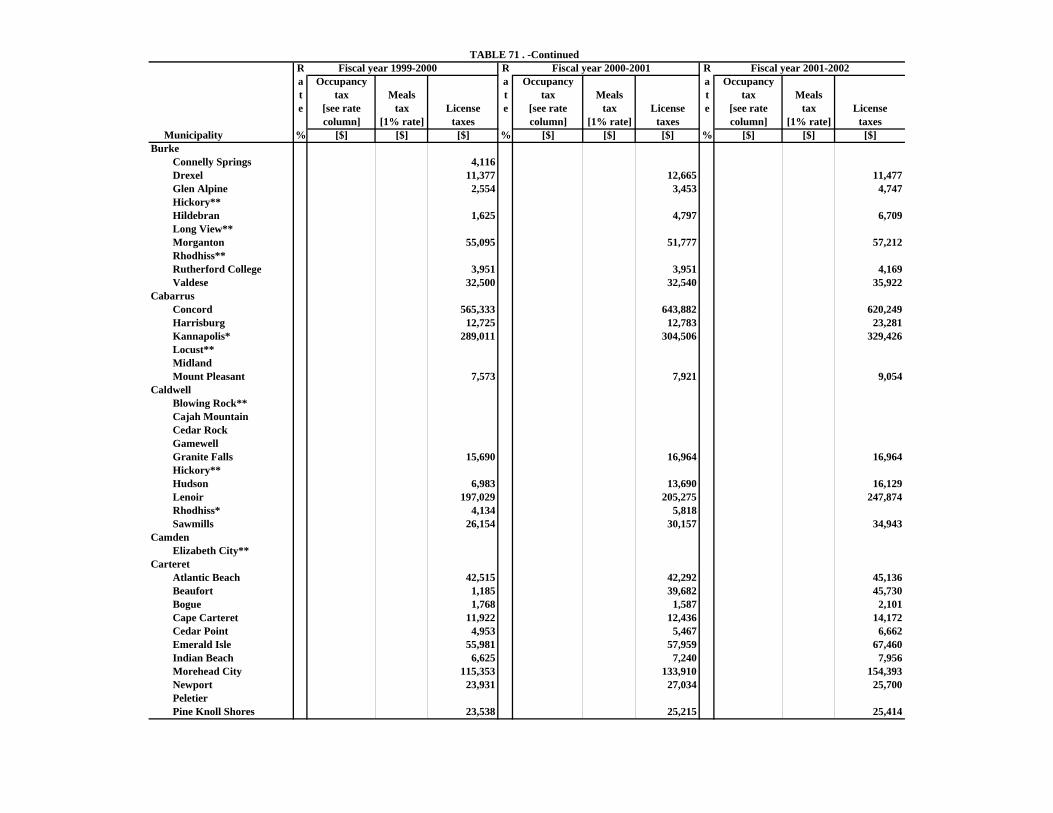
TABLE 71 . -ContinuedR Fiscal year 1999-2000 R Fiscal year 2000-2001 R Fiscal year 2001-2002a Occupancy a Occupancy a Occupancyt tax Meals t tax Meals t tax Mealse [see rate tax License e [see rate tax License e [see rate tax License
column] [1% rate] taxes column] [1% rate] taxes column] [1% rate] taxes Municipality % [$] [$] [$] % [$] [$] [$] % [$] [$] [$]Burke
Connelly Springs 4,116Drexel 11,377 12,665 11,477Glen Alpine 2,554 3,453 4,747Hickory**Hildebran 1,625 4,797 6,709Long View**Morganton 55,095 51,777 57,212Rhodhiss**Rutherford College 3,951 3,951 4,169Valdese 32,500 32,540 35,922
CabarrusConcord 565,333 643,882 620,249Harrisburg 12,725 12,783 23,281Kannapolis* 289,011 304,506 329,426Locust**MidlandMount Pleasant 7,573 7,921 9,054
CaldwellBlowing Rock**Cajah MountainCedar RockGamewellGranite Falls 15,690 16,964 16,964Hickory**Hudson 6,983 13,690 16,129Lenoir 197,029 205,275 247,874Rhodhiss* 4,134 5,818Sawmills 26,154 30,157 34,943
CamdenElizabeth City**
CarteretAtlantic Beach 42,515 42,292 45,136Beaufort 1,185 39,682 45,730Bogue 1,768 1,587 2,101Cape Carteret 11,922 12,436 14,172Cedar Point 4,953 5,467 6,662Emerald Isle 55,981 57,959 67,460Indian Beach 6,625 7,240 7,956Morehead City 115,353 133,910 154,393Newport 23,931 27,034 25,700PeletierPine Knoll Shores 23,538 25,215 25,414
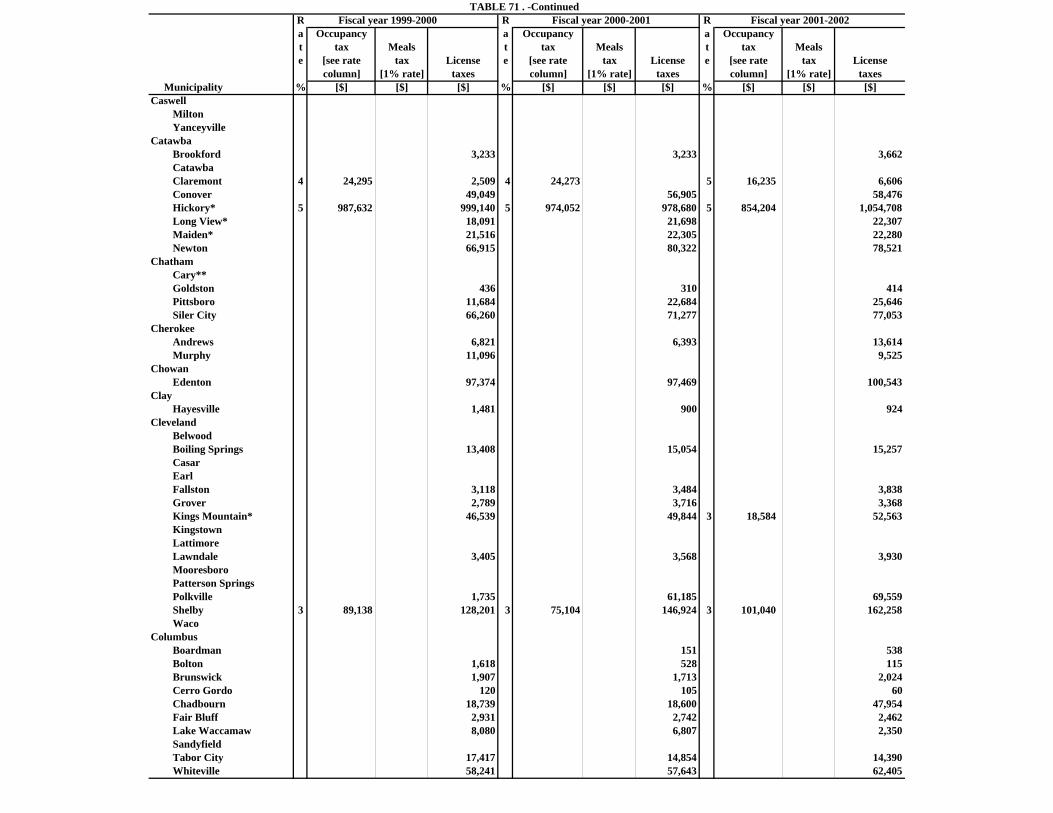
TABLE 71 . -ContinuedR Fiscal year 1999-2000 R Fiscal year 2000-2001 R Fiscal year 2001-2002a Occupancy a Occupancy a Occupancyt tax Meals t tax Meals t tax Mealse [see rate tax License e [see rate tax License e [see rate tax License
column] [1% rate] taxes column] [1% rate] taxes column] [1% rate] taxes Municipality % [$] [$] [$] % [$] [$] [$] % [$] [$] [$]Caswell
MiltonYanceyville
CatawbaBrookford 3,233 3,233 3,662CatawbaClaremont 4 24,295 2,509 4 24,273 5 16,235 6,606Conover 49,049 56,905 58,476Hickory* 5 987,632 999,140 5 974,052 978,680 5 854,204 1,054,708Long View* 18,091 21,698 22,307Maiden* 21,516 22,305 22,280Newton 66,915 80,322 78,521
ChathamCary**Goldston 436 310 414Pittsboro 11,684 22,684 25,646Siler City 66,260 71,277 77,053
CherokeeAndrews 6,821 6,393 13,614Murphy 11,096 9,525
ChowanEdenton 97,374 97,469 100,543
ClayHayesville 1,481 900 924
ClevelandBelwoodBoiling Springs 13,408 15,054 15,257CasarEarlFallston 3,118 3,484 3,838Grover 2,789 3,716 3,368Kings Mountain* 46,539 49,844 3 18,584 52,563KingstownLattimoreLawndale 3,405 3,568 3,930MooresboroPatterson SpringsPolkville 1,735 61,185 69,559Shelby 3 89,138 128,201 3 75,104 146,924 3 101,040 162,258Waco
ColumbusBoardman 151 538Bolton 1,618 528 115Brunswick 1,907 1,713 2,024Cerro Gordo 120 105 60Chadbourn 18,739 18,600 47,954Fair Bluff 2,931 2,742 2,462Lake Waccamaw 8,080 6,807 2,350SandyfieldTabor City 17,417 14,854 14,390Whiteville 58,241 57,643 62,405
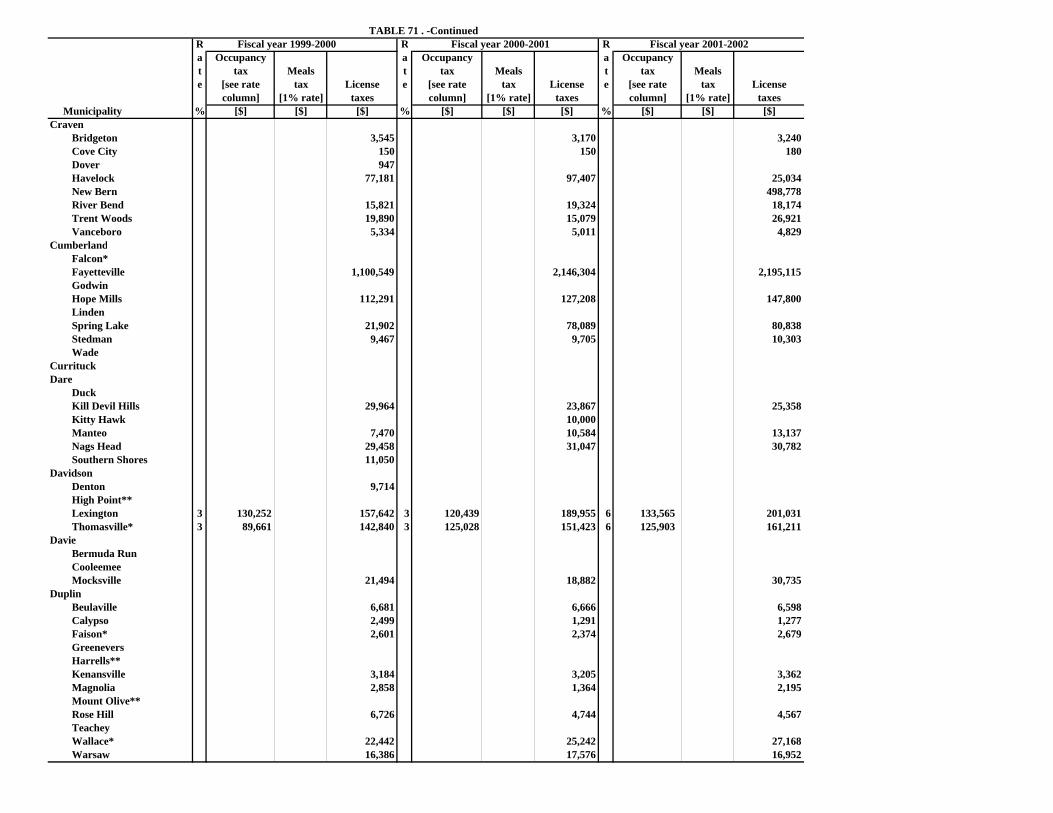
TABLE 71 . -ContinuedR Fiscal year 1999-2000 R Fiscal year 2000-2001 R Fiscal year 2001-2002a Occupancy a Occupancy a Occupancyt tax Meals t tax Meals t tax Mealse [see rate tax License e [see rate tax License e [see rate tax License
column] [1% rate] taxes column] [1% rate] taxes column] [1% rate] taxes Municipality % [$] [$] [$] % [$] [$] [$] % [$] [$] [$]Craven
Bridgeton 3,545 3,170 3,240Cove City 150 150 180Dover 947Havelock 77,181 97,407 25,034New Bern 498,778River Bend 15,821 19,324 18,174Trent Woods 19,890 15,079 26,921Vanceboro 5,334 5,011 4,829
CumberlandFalcon*Fayetteville 1,100,549 2,146,304 2,195,115GodwinHope Mills 112,291 127,208 147,800LindenSpring Lake 21,902 78,089 80,838Stedman 9,467 9,705 10,303Wade
CurrituckDare
DuckKill Devil Hills 29,964 23,867 25,358Kitty Hawk 10,000Manteo 7,470 10,584 13,137Nags Head 29,458 31,047 30,782Southern Shores 11,050
DavidsonDenton 9,714High Point**Lexington 3 130,252 157,642 3 120,439 189,955 6 133,565 201,031Thomasville* 3 89,661 142,840 3 125,028 151,423 6 125,903 161,211
DavieBermuda RunCooleemeeMocksville 21,494 18,882 30,735
DuplinBeulaville 6,681 6,666 6,598Calypso 2,499 1,291 1,277Faison* 2,601 2,374 2,679GreeneversHarrells**Kenansville 3,184 3,205 3,362Magnolia 2,858 1,364 2,195Mount Olive**Rose Hill 6,726 4,744 4,567TeacheyWallace* 22,442 25,242 27,168Warsaw 16,386 17,576 16,952
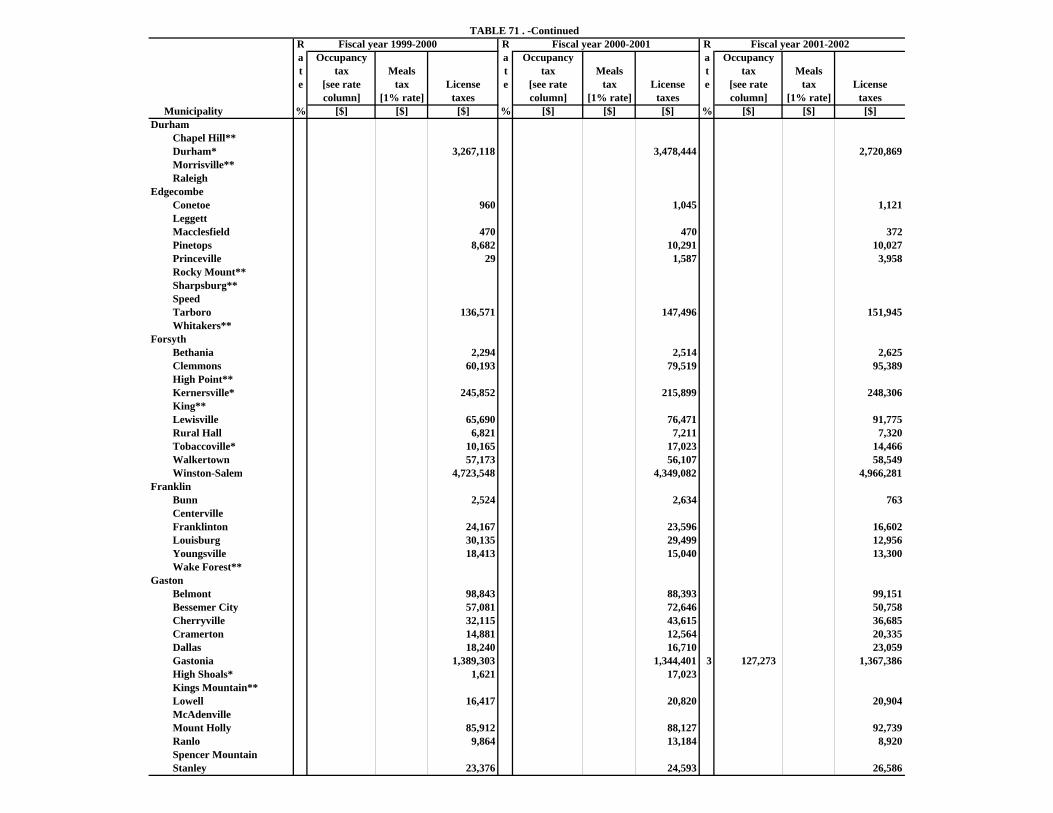
TABLE 71 . -ContinuedR Fiscal year 1999-2000 R Fiscal year 2000-2001 R Fiscal year 2001-2002a Occupancy a Occupancy a Occupancyt tax Meals t tax Meals t tax Mealse [see rate tax License e [see rate tax License e [see rate tax License
column] [1% rate] taxes column] [1% rate] taxes column] [1% rate] taxes Municipality % [$] [$] [$] % [$] [$] [$] % [$] [$] [$]Durham
Chapel Hill**Durham* 3,267,118 3,478,444 2,720,869Morrisville**Raleigh
EdgecombeConetoe 960 1,045 1,121LeggettMacclesfield 470 470 372Pinetops 8,682 10,291 10,027Princeville 29 1,587 3,958Rocky Mount**Sharpsburg**SpeedTarboro 136,571 147,496 151,945Whitakers**
ForsythBethania 2,294 2,514 2,625Clemmons 60,193 79,519 95,389High Point**Kernersville* 245,852 215,899 248,306King**Lewisville 65,690 76,471 91,775Rural Hall 6,821 7,211 7,320Tobaccoville* 10,165 17,023 14,466Walkertown 57,173 56,107 58,549Winston-Salem 4,723,548 4,349,082 4,966,281
FranklinBunn 2,524 2,634 763CentervilleFranklinton 24,167 23,596 16,602Louisburg 30,135 29,499 12,956Youngsville 18,413 15,040 13,300Wake Forest**
GastonBelmont 98,843 88,393 99,151Bessemer City 57,081 72,646 50,758Cherryville 32,115 43,615 36,685Cramerton 14,881 12,564 20,335Dallas 18,240 16,710 23,059Gastonia 1,389,303 1,344,401 3 127,273 1,367,386High Shoals* 1,621 17,023Kings Mountain**Lowell 16,417 20,820 20,904McAdenvilleMount Holly 85,912 88,127 92,739Ranlo 9,864 13,184 8,920Spencer MountainStanley 23,376 24,593 26,586
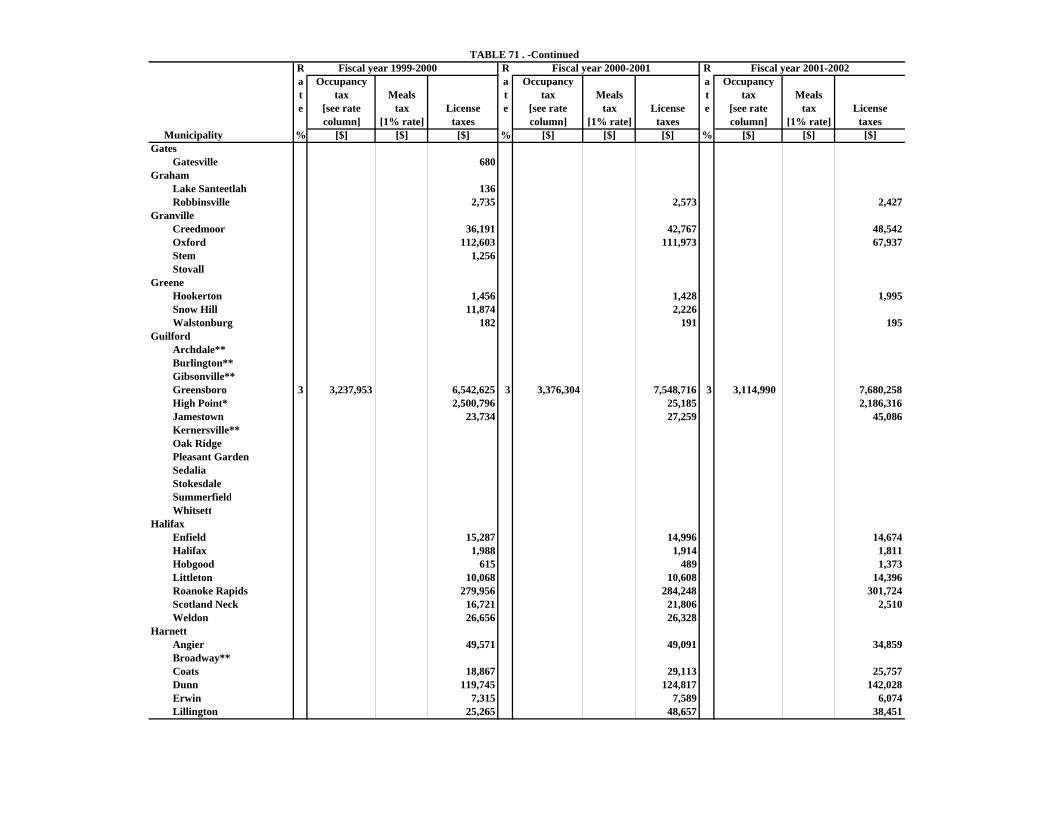
TABLE 71 . -ContinuedR Fiscal year 1999-2000 R Fiscal year 2000-2001 R Fiscal year 2001-2002a Occupancy a Occupancy a Occupancyt tax Meals t tax Meals t tax Mealse [see rate tax License e [see rate tax License e [see rate tax License
column] [1% rate] taxes column] [1% rate] taxes column] [1% rate] taxes Municipality % [$] [$] [$] % [$] [$] [$] % [$] [$] [$]Gates
Gatesville 680Graham
Lake Santeetlah 136Robbinsville 2,735 2,573 2,427
GranvilleCreedmoor 36,191 42,767 48,542Oxford 112,603 111,973 67,937Stem 1,256Stovall
GreeneHookerton 1,456 1,428 1,995Snow Hill 11,874 2,226Walstonburg 182 191 195
GuilfordArchdale**Burlington**Gibsonville**Greensboro 3 3,237,953 6,542,625 3 3,376,304 7,548,716 3 3,114,990 7,680,258High Point* 2,500,796 25,185 2,186,316Jamestown 23,734 27,259 45,086Kernersville**Oak RidgePleasant GardenSedaliaStokesdaleSummerfieldWhitsett
HalifaxEnfield 15,287 14,996 14,674Halifax 1,988 1,914 1,811Hobgood 615 489 1,373Littleton 10,068 10,608 14,396Roanoke Rapids 279,956 284,248 301,724Scotland Neck 16,721 21,806 2,510Weldon 26,656 26,328
HarnettAngier 49,571 49,091 34,859Broadway**Coats 18,867 29,113 25,757Dunn 119,745 124,817 142,028Erwin 7,315 7,589 6,074Lillington 25,265 48,657 38,451
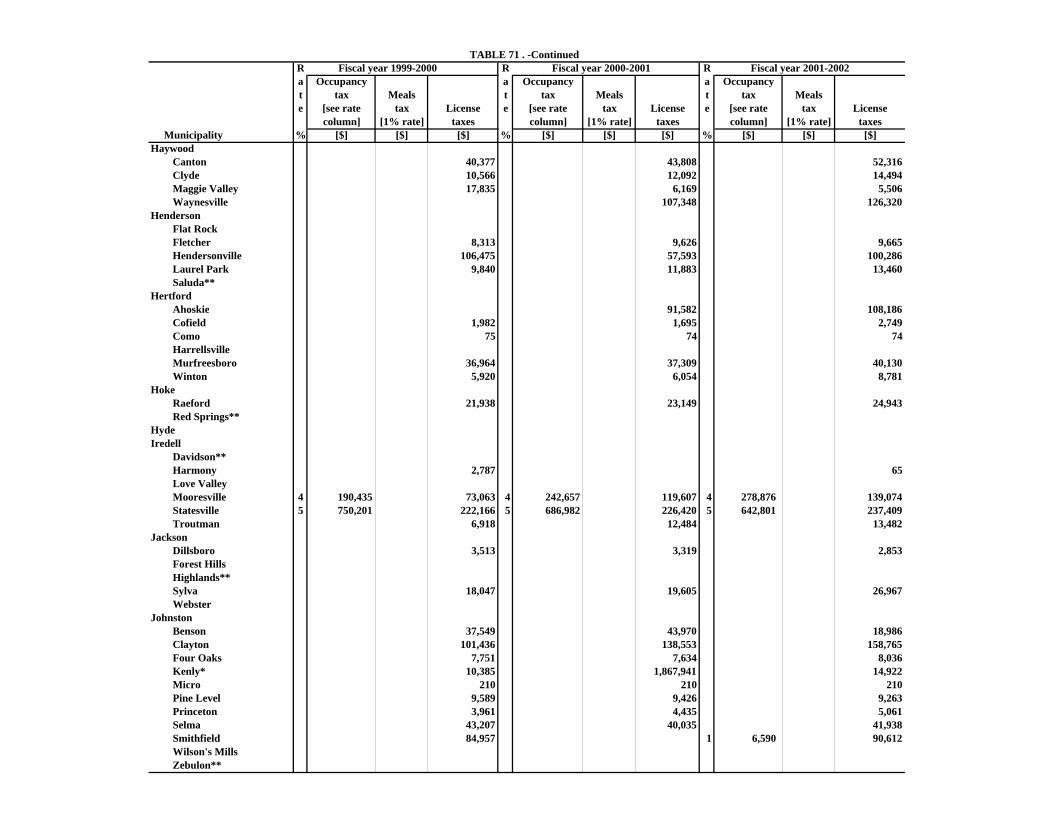
TABLE 71 . -ContinuedR Fiscal year 1999-2000 R Fiscal year 2000-2001 R Fiscal year 2001-2002a Occupancy a Occupancy a Occupancyt tax Meals t tax Meals t tax Mealse [see rate tax License e [see rate tax License e [see rate tax License
column] [1% rate] taxes column] [1% rate] taxes column] [1% rate] taxes Municipality % [$] [$] [$] % [$] [$] [$] % [$] [$] [$]Haywood
Canton 40,377 43,808 52,316Clyde 10,566 12,092 14,494Maggie Valley 17,835 6,169 5,506Waynesville 107,348 126,320
HendersonFlat RockFletcher 8,313 9,626 9,665Hendersonville 106,475 57,593 100,286Laurel Park 9,840 11,883 13,460Saluda**
HertfordAhoskie 91,582 108,186Cofield 1,982 1,695 2,749Como 75 74 74HarrellsvilleMurfreesboro 36,964 37,309 40,130Winton 5,920 6,054 8,781
HokeRaeford 21,938 23,149 24,943Red Springs**
HydeIredell
Davidson**Harmony 2,787 65Love ValleyMooresville 4 190,435 73,063 4 242,657 119,607 4 278,876 139,074Statesville 5 750,201 222,166 5 686,982 226,420 5 642,801 237,409Troutman 6,918 12,484 13,482
JacksonDillsboro 3,513 3,319 2,853Forest HillsHighlands**Sylva 18,047 19,605 26,967Webster
JohnstonBenson 37,549 43,970 18,986Clayton 101,436 138,553 158,765Four Oaks 7,751 7,634 8,036Kenly* 10,385 1,867,941 14,922Micro 210 210 210Pine Level 9,589 9,426 9,263Princeton 3,961 4,435 5,061Selma 43,207 40,035 41,938Smithfield 84,957 1 6,590 90,612Wilson's MillsZebulon**
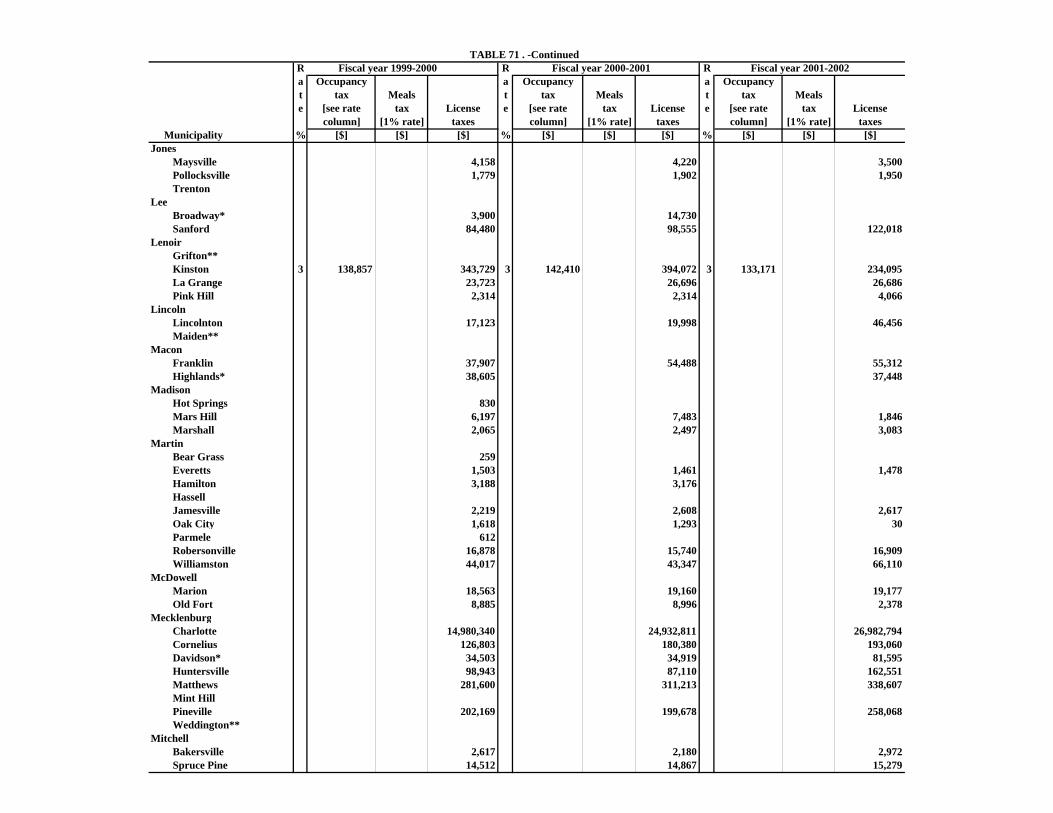
TABLE 71 . -ContinuedR Fiscal year 1999-2000 R Fiscal year 2000-2001 R Fiscal year 2001-2002a Occupancy a Occupancy a Occupancyt tax Meals t tax Meals t tax Mealse [see rate tax License e [see rate tax License e [see rate tax License
column] [1% rate] taxes column] [1% rate] taxes column] [1% rate] taxes Municipality % [$] [$] [$] % [$] [$] [$] % [$] [$] [$]Jones
Maysville 4,158 4,220 3,500Pollocksville 1,779 1,902 1,950Trenton
LeeBroadway* 3,900 14,730Sanford 84,480 98,555 122,018
LenoirGrifton**Kinston 3 138,857 343,729 3 142,410 394,072 3 133,171 234,095La Grange 23,723 26,696 26,686Pink Hill 2,314 2,314 4,066
LincolnLincolnton 17,123 19,998 46,456Maiden**
MaconFranklin 37,907 54,488 55,312Highlands* 38,605 37,448
MadisonHot Springs 830Mars Hill 6,197 7,483 1,846Marshall 2,065 2,497 3,083
MartinBear Grass 259Everetts 1,503 1,461 1,478Hamilton 3,188 3,176HassellJamesville 2,219 2,608 2,617Oak City 1,618 1,293 30Parmele 612Robersonville 16,878 15,740 16,909Williamston 44,017 43,347 66,110
McDowellMarion 18,563 19,160 19,177Old Fort 8,885 8,996 2,378
MecklenburgCharlotte 14,980,340 24,932,811 26,982,794Cornelius 126,803 180,380 193,060Davidson* 34,503 34,919 81,595Huntersville 98,943 87,110 162,551Matthews 281,600 311,213 338,607Mint HillPineville 202,169 199,678 258,068Weddington**
MitchellBakersville 2,617 2,180 2,972Spruce Pine 14,512 14,867 15,279
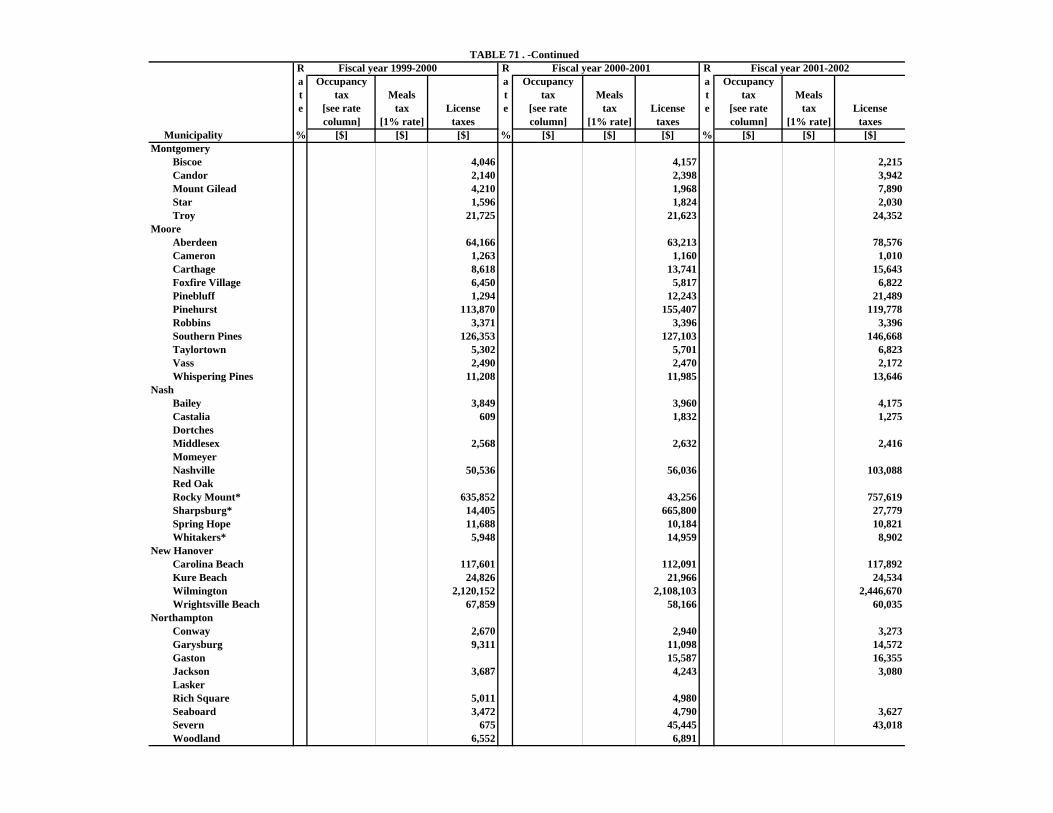
TABLE 71 . -ContinuedR Fiscal year 1999-2000 R Fiscal year 2000-2001 R Fiscal year 2001-2002a Occupancy a Occupancy a Occupancyt tax Meals t tax Meals t tax Mealse [see rate tax License e [see rate tax License e [see rate tax License
column] [1% rate] taxes column] [1% rate] taxes column] [1% rate] taxes Municipality % [$] [$] [$] % [$] [$] [$] % [$] [$] [$]Montgomery
Biscoe 4,046 4,157 2,215Candor 2,140 2,398 3,942Mount Gilead 4,210 1,968 7,890Star 1,596 1,824 2,030Troy 21,725 21,623 24,352
MooreAberdeen 64,166 63,213 78,576Cameron 1,263 1,160 1,010Carthage 8,618 13,741 15,643Foxfire Village 6,450 5,817 6,822Pinebluff 1,294 12,243 21,489Pinehurst 113,870 155,407 119,778Robbins 3,371 3,396 3,396Southern Pines 126,353 127,103 146,668Taylortown 5,302 5,701 6,823Vass 2,490 2,470 2,172Whispering Pines 11,208 11,985 13,646
NashBailey 3,849 3,960 4,175Castalia 609 1,832 1,275DortchesMiddlesex 2,568 2,632 2,416MomeyerNashville 50,536 56,036 103,088Red OakRocky Mount* 635,852 43,256 757,619Sharpsburg* 14,405 665,800 27,779Spring Hope 11,688 10,184 10,821Whitakers* 5,948 14,959 8,902
New HanoverCarolina Beach 117,601 112,091 117,892Kure Beach 24,826 21,966 24,534Wilmington 2,120,152 2,108,103 2,446,670Wrightsville Beach 67,859 58,166 60,035
NorthamptonConway 2,670 2,940 3,273Garysburg 9,311 11,098 14,572Gaston 15,587 16,355Jackson 3,687 4,243 3,080LaskerRich Square 5,011 4,980Seaboard 3,472 4,790 3,627Severn 675 45,445 43,018Woodland 6,552 6,891
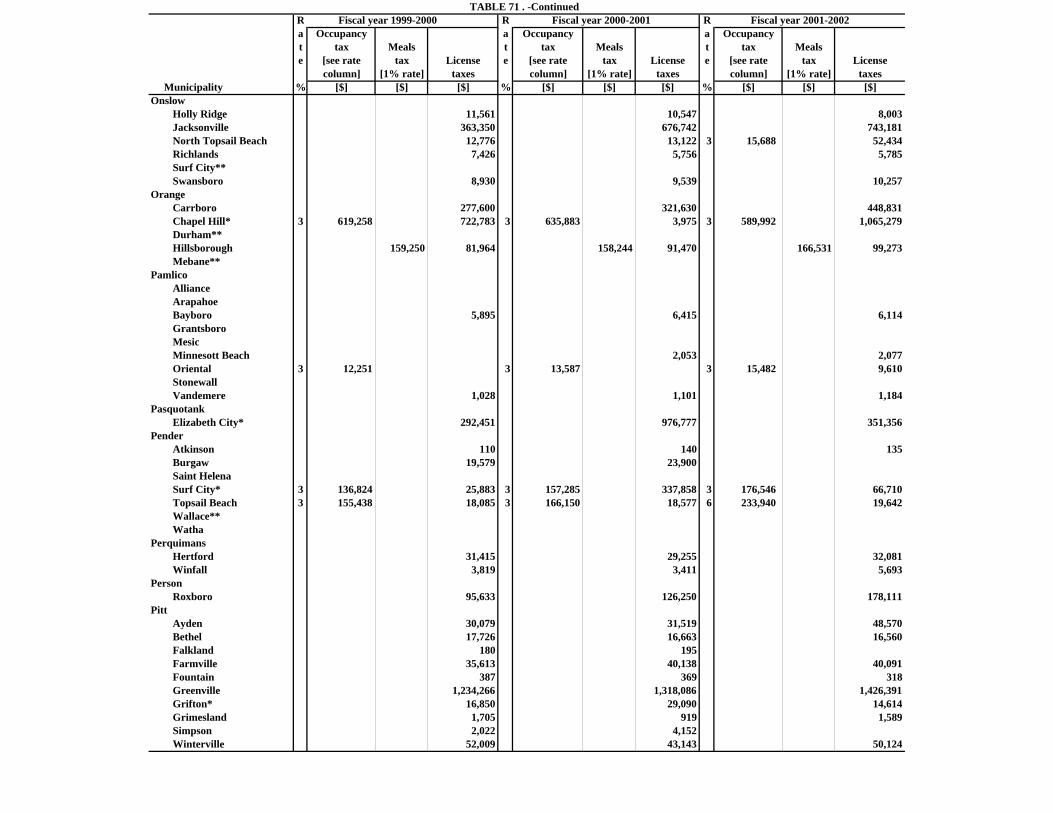
TABLE 71 . -ContinuedR Fiscal year 1999-2000 R Fiscal year 2000-2001 R Fiscal year 2001-2002a Occupancy a Occupancy a Occupancyt tax Meals t tax Meals t tax Mealse [see rate tax License e [see rate tax License e [see rate tax License
column] [1% rate] taxes column] [1% rate] taxes column] [1% rate] taxes Municipality % [$] [$] [$] % [$] [$] [$] % [$] [$] [$]Onslow
Holly Ridge 11,561 10,547 8,003Jacksonville 363,350 676,742 743,181North Topsail Beach 12,776 13,122 3 15,688 52,434Richlands 7,426 5,756 5,785Surf City**Swansboro 8,930 9,539 10,257
OrangeCarrboro 277,600 321,630 448,831Chapel Hill* 3 619,258 722,783 3 635,883 3,975 3 589,992 1,065,279Durham**Hillsborough 159,250 81,964 158,244 91,470 166,531 99,273Mebane**
PamlicoAllianceArapahoeBayboro 5,895 6,415 6,114GrantsboroMesicMinnesott Beach 2,053 2,077Oriental 3 12,251 3 13,587 3 15,482 9,610StonewallVandemere 1,028 1,101 1,184
PasquotankElizabeth City* 292,451 976,777 351,356
PenderAtkinson 110 140 135Burgaw 19,579 23,900Saint HelenaSurf City* 3 136,824 25,883 3 157,285 337,858 3 176,546 66,710Topsail Beach 3 155,438 18,085 3 166,150 18,577 6 233,940 19,642Wallace**Watha
PerquimansHertford 31,415 29,255 32,081Winfall 3,819 3,411 5,693
PersonRoxboro 95,633 126,250 178,111
PittAyden 30,079 31,519 48,570Bethel 17,726 16,663 16,560Falkland 180 195Farmville 35,613 40,138 40,091Fountain 387 369 318Greenville 1,234,266 1,318,086 1,426,391Grifton* 16,850 29,090 14,614Grimesland 1,705 919 1,589Simpson 2,022 4,152Winterville 52,009 43,143 50,124
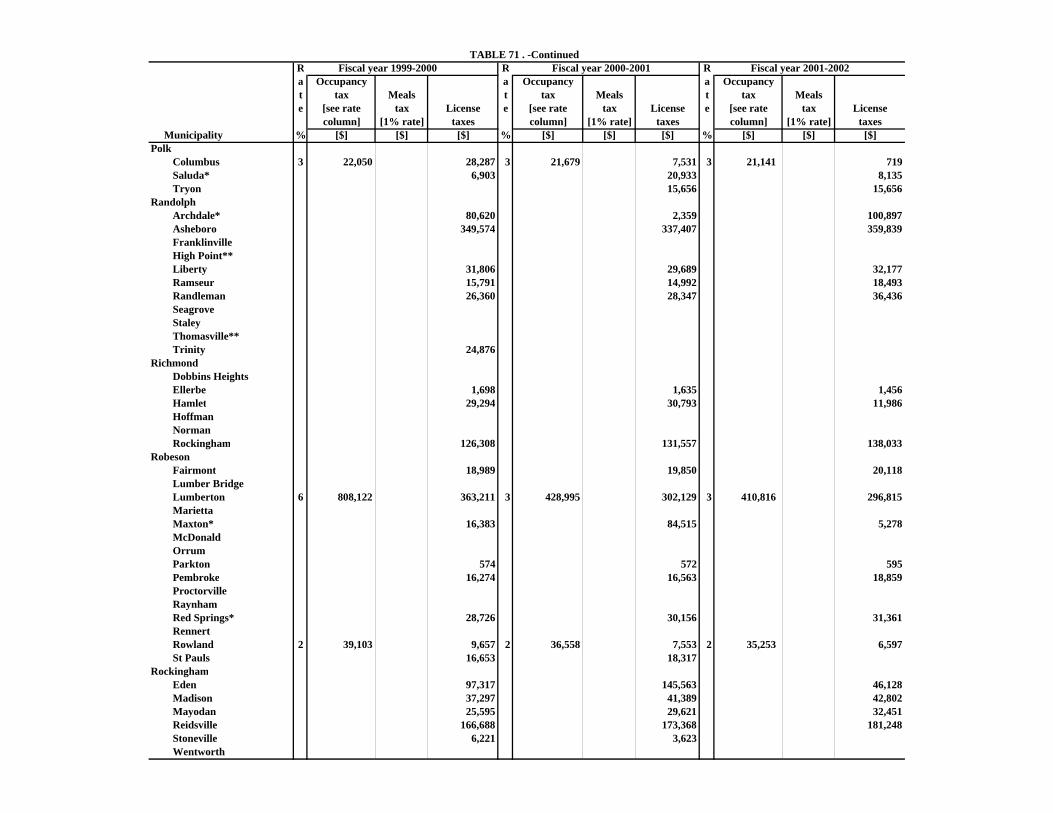
TABLE 71 . -ContinuedR Fiscal year 1999-2000 R Fiscal year 2000-2001 R Fiscal year 2001-2002a Occupancy a Occupancy a Occupancyt tax Meals t tax Meals t tax Mealse [see rate tax License e [see rate tax License e [see rate tax License
column] [1% rate] taxes column] [1% rate] taxes column] [1% rate] taxes Municipality % [$] [$] [$] % [$] [$] [$] % [$] [$] [$]Polk
Columbus 3 22,050 28,287 3 21,679 7,531 3 21,141 719Saluda* 6,903 20,933 8,135Tryon 15,656 15,656
RandolphArchdale* 80,620 2,359 100,897Asheboro 349,574 337,407 359,839FranklinvilleHigh Point**Liberty 31,806 29,689 32,177Ramseur 15,791 14,992 18,493Randleman 26,360 28,347 36,436SeagroveStaleyThomasville**Trinity 24,876
RichmondDobbins HeightsEllerbe 1,698 1,635 1,456Hamlet 29,294 30,793 11,986HoffmanNormanRockingham 126,308 131,557 138,033
RobesonFairmont 18,989 19,850 20,118Lumber BridgeLumberton 6 808,122 363,211 3 428,995 302,129 3 410,816 296,815MariettaMaxton* 16,383 84,515 5,278McDonaldOrrumParkton 574 572 595Pembroke 16,274 16,563 18,859ProctorvilleRaynhamRed Springs* 28,726 30,156 31,361RennertRowland 2 39,103 9,657 2 36,558 7,553 2 35,253 6,597St Pauls 16,653 18,317
RockinghamEden 97,317 145,563 46,128Madison 37,297 41,389 42,802Mayodan 25,595 29,621 32,451Reidsville 166,688 173,368 181,248Stoneville 6,221 3,623Wentworth
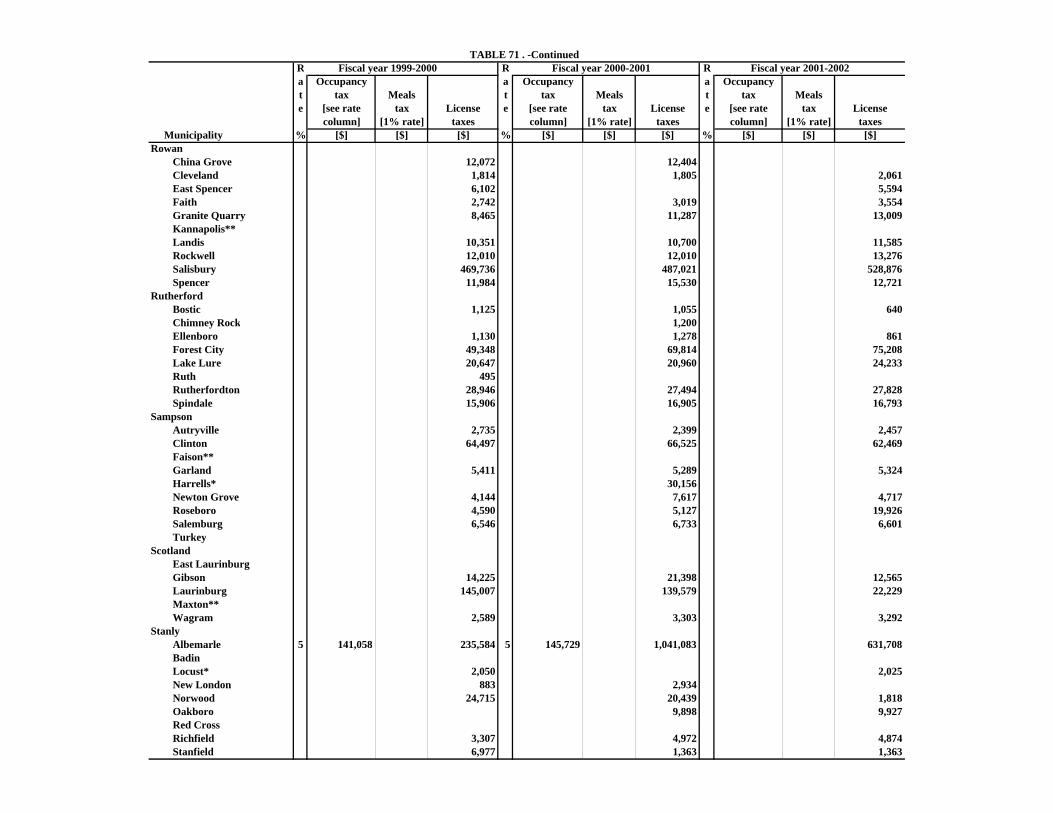
TABLE 71 . -ContinuedR Fiscal year 1999-2000 R Fiscal year 2000-2001 R Fiscal year 2001-2002a Occupancy a Occupancy a Occupancyt tax Meals t tax Meals t tax Mealse [see rate tax License e [see rate tax License e [see rate tax License
column] [1% rate] taxes column] [1% rate] taxes column] [1% rate] taxes Municipality % [$] [$] [$] % [$] [$] [$] % [$] [$] [$]Rowan
China Grove 12,072 12,404Cleveland 1,814 1,805 2,061East Spencer 6,102 5,594Faith 2,742 3,019 3,554Granite Quarry 8,465 11,287 13,009Kannapolis**Landis 10,351 10,700 11,585Rockwell 12,010 12,010 13,276Salisbury 469,736 487,021 528,876Spencer 11,984 15,530 12,721
RutherfordBostic 1,125 1,055 640Chimney Rock 1,200Ellenboro 1,130 1,278 861Forest City 49,348 69,814 75,208Lake Lure 20,647 20,960 24,233Ruth 495Rutherfordton 28,946 27,494 27,828Spindale 15,906 16,905 16,793
SampsonAutryville 2,735 2,399 2,457Clinton 64,497 66,525 62,469Faison**Garland 5,411 5,289 5,324Harrells* 30,156Newton Grove 4,144 7,617 4,717Roseboro 4,590 5,127 19,926Salemburg 6,546 6,733 6,601Turkey
ScotlandEast LaurinburgGibson 14,225 21,398 12,565Laurinburg 145,007 139,579 22,229Maxton**Wagram 2,589 3,303 3,292
StanlyAlbemarle 5 141,058 235,584 5 145,729 1,041,083 631,708BadinLocust* 2,050 2,025New London 883 2,934Norwood 24,715 20,439 1,818Oakboro 9,898 9,927Red CrossRichfield 3,307 4,972 4,874Stanfield 6,977 1,363 1,363
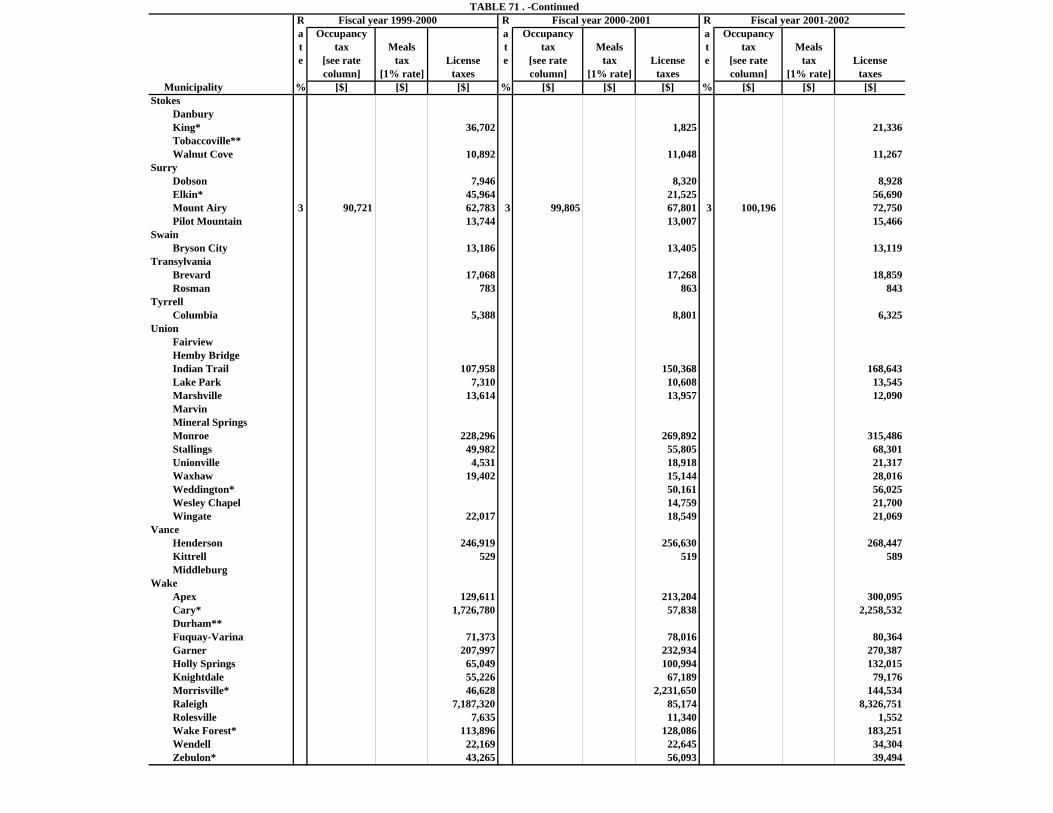
TABLE 71 . -ContinuedR Fiscal year 1999-2000 R Fiscal year 2000-2001 R Fiscal year 2001-2002a Occupancy a Occupancy a Occupancyt tax Meals t tax Meals t tax Mealse [see rate tax License e [see rate tax License e [see rate tax License
column] [1% rate] taxes column] [1% rate] taxes column] [1% rate] taxes Municipality % [$] [$] [$] % [$] [$] [$] % [$] [$] [$]Stokes
DanburyKing* 36,702 1,825 21,336Tobaccoville**Walnut Cove 10,892 11,048 11,267
SurryDobson 7,946 8,320 8,928Elkin* 45,964 21,525 56,690Mount Airy 3 90,721 62,783 3 99,805 67,801 3 100,196 72,750Pilot Mountain 13,744 13,007 15,466
SwainBryson City 13,186 13,405 13,119
TransylvaniaBrevard 17,068 17,268 18,859Rosman 783 863 843
TyrrellColumbia 5,388 8,801 6,325
UnionFairviewHemby BridgeIndian Trail 107,958 150,368 168,643Lake Park 7,310 10,608 13,545Marshville 13,614 13,957 12,090MarvinMineral SpringsMonroe 228,296 269,892 315,486Stallings 49,982 55,805 68,301Unionville 4,531 18,918 21,317Waxhaw 19,402 15,144 28,016Weddington* 50,161 56,025Wesley Chapel 14,759 21,700Wingate 22,017 18,549 21,069
VanceHenderson 246,919 256,630 268,447Kittrell 529 519 589Middleburg
WakeApex 129,611 213,204 300,095Cary* 1,726,780 57,838 2,258,532Durham**Fuquay-Varina 71,373 78,016 80,364Garner 207,997 232,934 270,387Holly Springs 65,049 100,994 132,015Knightdale 55,226 67,189 79,176Morrisville* 46,628 2,231,650 144,534Raleigh 7,187,320 85,174 8,326,751Rolesville 7,635 11,340 1,552Wake Forest* 113,896 128,086 183,251Wendell 22,169 22,645 34,304Zebulon* 43,265 56,093 39,494
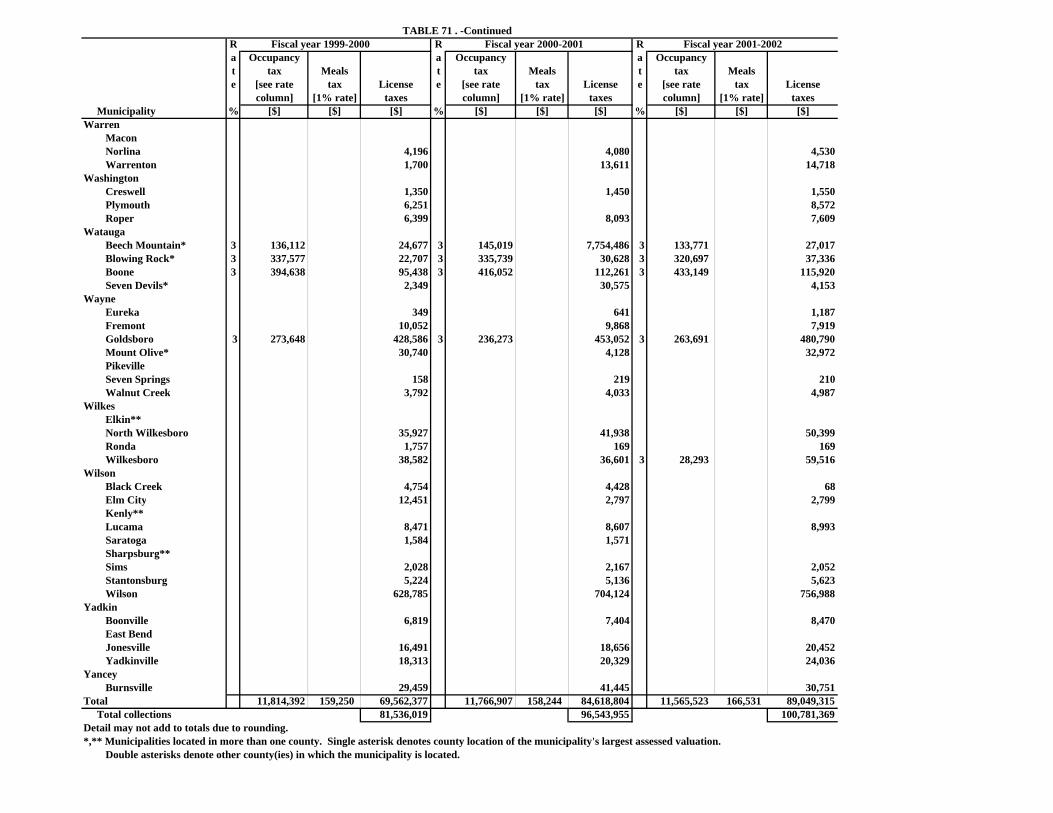
TABLE 71 . -ContinuedR Fiscal year 1999-2000 R Fiscal year 2000-2001 R Fiscal year 2001-2002a Occupancy a Occupancy a Occupancyt tax Meals t tax Meals t tax Mealse [see rate tax License e [see rate tax License e [see rate tax License
column] [1% rate] taxes column] [1% rate] taxes column] [1% rate] taxes Municipality % [$] [$] [$] % [$] [$] [$] % [$] [$] [$]Warren
MaconNorlina 4,196 4,080 4,530Warrenton 1,700 13,611 14,718
WashingtonCreswell 1,350 1,450 1,550Plymouth 6,251 8,572Roper 6,399 8,093 7,609
WataugaBeech Mountain* 3 136,112 24,677 3 145,019 7,754,486 3 133,771 27,017Blowing Rock* 3 337,577 22,707 3 335,739 30,628 3 320,697 37,336Boone 3 394,638 95,438 3 416,052 112,261 3 433,149 115,920Seven Devils* 2,349 30,575 4,153
WayneEureka 349 641 1,187Fremont 10,052 9,868 7,919Goldsboro 3 273,648 428,586 3 236,273 453,052 3 263,691 480,790Mount Olive* 30,740 4,128 32,972PikevilleSeven Springs 158 219 210Walnut Creek 3,792 4,033 4,987
WilkesElkin**North Wilkesboro 35,927 41,938 50,399Ronda 1,757 169 169Wilkesboro 38,582 36,601 3 28,293 59,516
WilsonBlack Creek 4,754 4,428 68Elm City 12,451 2,797 2,799Kenly**Lucama 8,471 8,607 8,993Saratoga 1,584 1,571Sharpsburg**Sims 2,028 2,167 2,052Stantonsburg 5,224 5,136 5,623Wilson 628,785 704,124 756,988
YadkinBoonville 6,819 7,404 8,470East BendJonesville 16,491 18,656 20,452Yadkinville 18,313 20,329 24,036
YanceyBurnsville 29,459 41,445 30,751
Total 11,814,392 159,250 69,562,377 11,766,907 158,244 84,618,804 11,565,523 166,531 89,049,315 Total collections 81,536,019 96,543,955 100,781,369Detail may not add to totals due to rounding.*,** Municipalities located in more than one county. Single asterisk denotes county location of the municipality's largest assessed valuation. Double asterisks denote other county(ies) in which the municipality is located.
APPENDIX
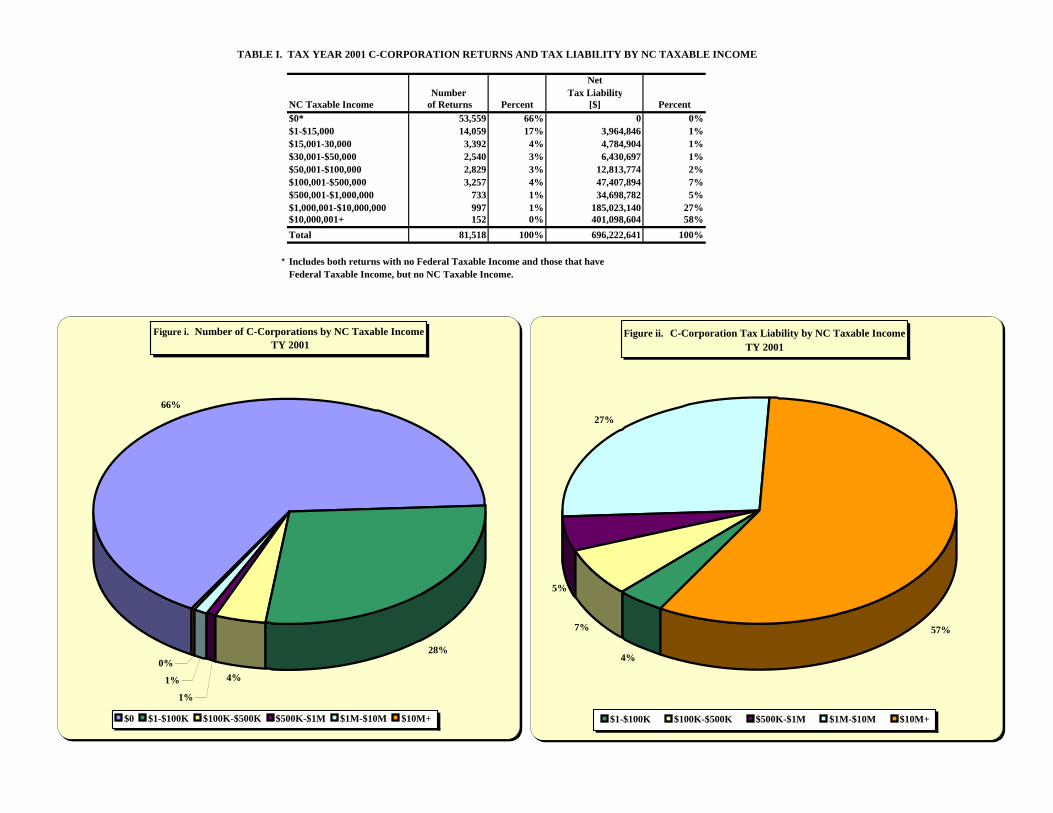
TABLE I. TAX YEAR 2001 C-CORPORATION RETURNS AND TAX LIABILITY BY NC TAXABLE INCOME
NetNumber Tax Liability
NC Taxable Income of Returns Percent [$] Percent$0* 53,559 66% 0 0%$1-$15,000 14,059 17% 3,964,846 1%$15,001-30,000 3,392 4% 4,784,904 1%$30,001-$50,000 2,540 3% 6,430,697 1%$50,001-$100,000 2,829 3% 12,813,774 2%$100,001-$500,000 3,257 4% 47,407,894 7%$500,001-$1,000,000 733 1% 34,698,782 5%$1,000,001-$10,000,000 997 1% 185,023,140 27%$10,000,001+ 152 0% 401,098,604 58%Total 81,518 100% 696,222,641 100%
* Includes both returns with no Federal Taxable Income and those that have Federal Taxable Income, but no NC Taxable Income.
$0$1-$15K $0 53,559 0$15-30K $1-$100K 22,820 ########$30K-$50K $100K-$500K 3,257 ########$50K-$100K $500K-$1M 733 ########$100K-$500K $1M-$10M 997 ########$500K-$1M $10M+ 152 ########$1M-$10M$10M+
Figure i. Number of C-Corporations by NC Taxable Income TY 2001
66%
28%
4%
1%
1%
0%
$0 $1-$100K $100K-$500K $500K-$1M $1M-$10M $10M+
Figure ii. C-Corporation Tax Liability by NC Taxable IncomeTY 2001
4%
7%
27%
5%
57%
$1-$100K $100K-$500K $500K-$1M $1M-$10M $10M+
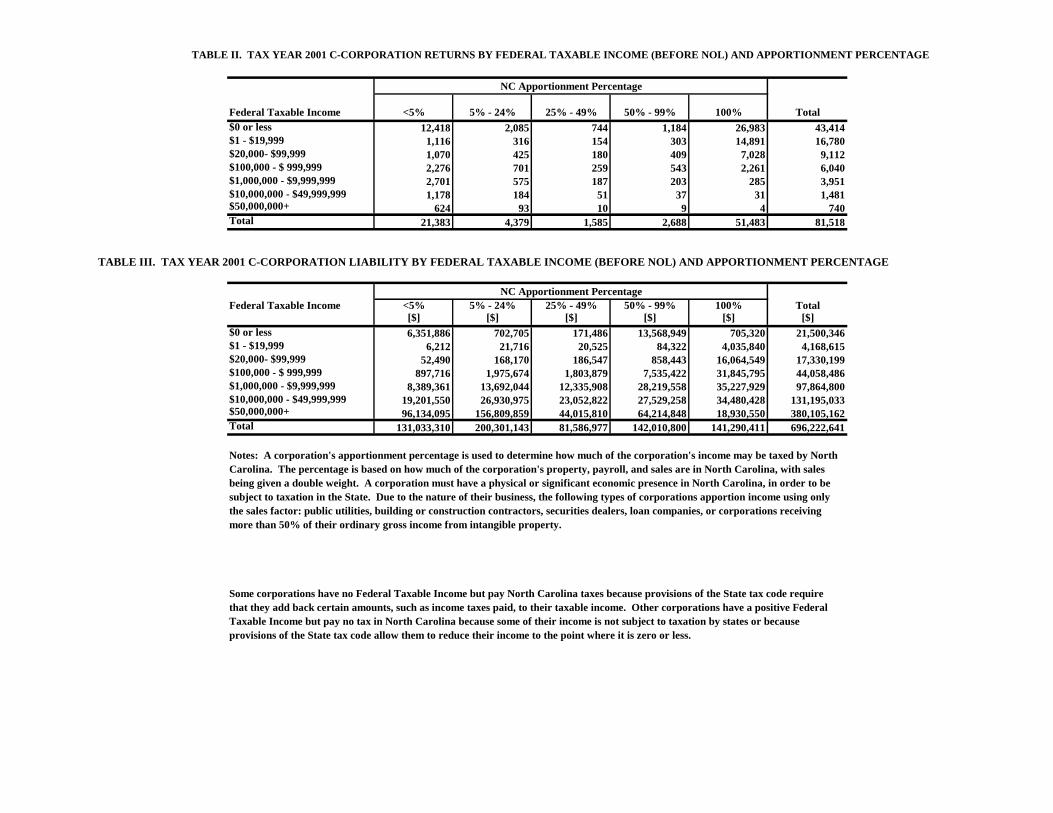
TABLE II. TAX YEAR 2001 C-CORPORATION RETURNS BY FEDERAL TAXABLE INCOME (BEFORE NOL) AND APPORTIONMENT PERCENTAGE
NC Apportionment Percentage
Federal Taxable Income <5% 5% - 24% 25% - 49% 50% - 99% 100% Total
$0 or less 12,418 2,085 744 1,184 26,983 43,414
$1 - $19,999 1,116 316 154 303 14,891 16,780
$20,000- $99,999 1,070 425 180 409 7,028 9,112
$100,000 - $ 999,999 2,276 701 259 543 2,261 6,040
$1,000,000 - $9,999,999 2,701 575 187 203 285 3,951
$10,000,000 - $49,999,999 1,178 184 51 37 31 1,481$50,000,000+ 624 93 10 9 4 740
Total 21,383 4,379 1,585 2,688 51,483 81,518
TABLE III. TAX YEAR 2001 C-CORPORATION LIABILITY BY FEDERAL TAXABLE INCOME (BEFORE NOL) AND APPORTIONMENT PERCENTAGE
NC Apportionment Percentage
Federal Taxable Income <5% 5% - 24% 25% - 49% 50% - 99% 100% Total
[$] [$] [$] [$] [$] [$]
$0 or less 6,351,886 702,705 171,486 13,568,949 705,320 21,500,346
$1 - $19,999 6,212 21,716 20,525 84,322 4,035,840 4,168,615
$20,000- $99,999 52,490 168,170 186,547 858,443 16,064,549 17,330,199
$100,000 - $ 999,999 897,716 1,975,674 1,803,879 7,535,422 31,845,795 44,058,486
$1,000,000 - $9,999,999 8,389,361 13,692,044 12,335,908 28,219,558 35,227,929 97,864,800
$10,000,000 - $49,999,999 19,201,550 26,930,975 23,052,822 27,529,258 34,480,428 131,195,033$50,000,000+ 96,134,095 156,809,859 44,015,810 64,214,848 18,930,550 380,105,162
Total 131,033,310 200,301,143 81,586,977 142,010,800 141,290,411 696,222,641
Notes: A corporation's apportionment percentage is used to determine how much of the corporation's income may be taxed by North
Carolina. The percentage is based on how much of the corporation's property, payroll, and sales are in North Carolina, with sales
being given a double weight. A corporation must have a physical or significant economic presence in North Carolina, in order to be
subject to taxation in the State. Due to the nature of their business, the following types of corporations apportion income using only
the sales factor: public utilities, building or construction contractors, securities dealers, loan companies, or corporations receiving
more than 50% of their ordinary gross income from intangible property.
Some corporations have no Federal Taxable Income but pay North Carolina taxes because provisions of the State tax code require
that they add back certain amounts, such as income taxes paid, to their taxable income. Other corporations have a positive Federal
Taxable Income but pay no tax in North Carolina because some of their income is not subject to taxation by states or because
provisions of the State tax code allow them to reduce their income to the point where it is zero or less.
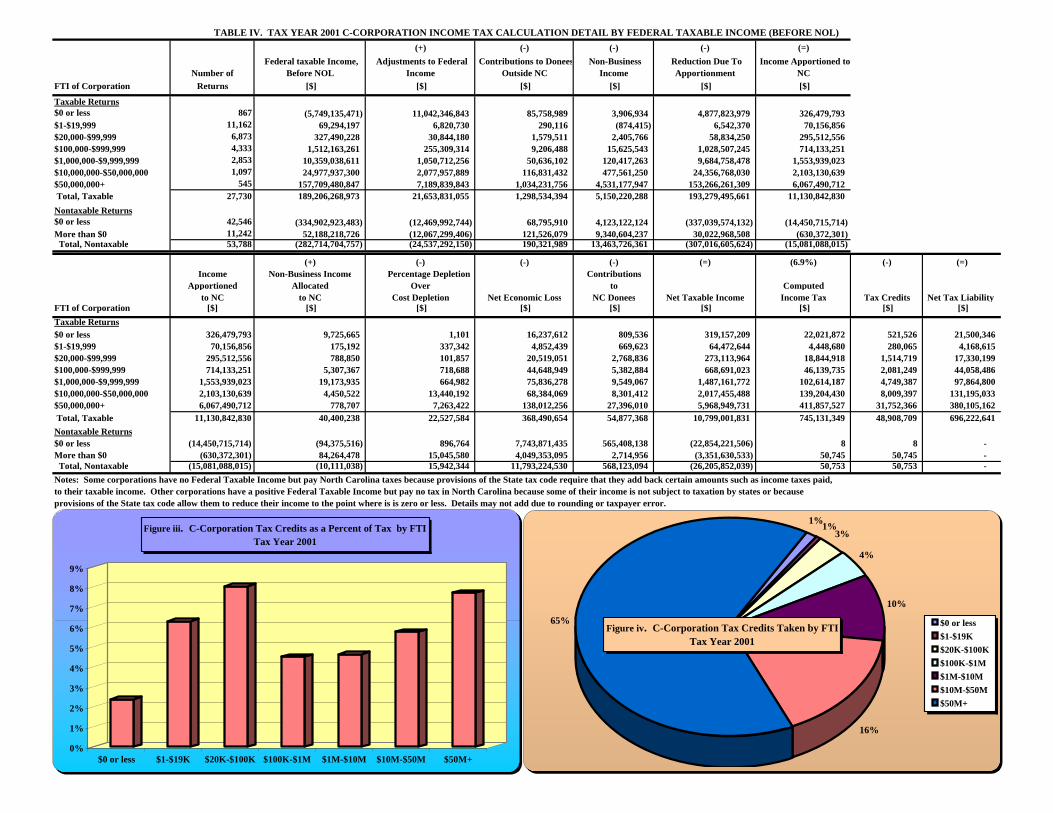
TABLE IV. TAX YEAR 2001 C-CORPORATION INCOME TAX CALCULATION DETAIL BY FEDERAL TAXABLE INCOME (BEFORE NOL)(+) (-) (-) (-) (=)
Number of Federal taxable Income,
Before NOL Adjustments to Federal
Income Contributions to Donees
Outside NC Non-Business
Income Reduction Due To
Apportionment Income Apportioned to
NC FTI of Corporation Returns [$] [$] [$] [$] [$] [$]
Taxable Returns$0 or less 867 (5,749,135,471) 11,042,346,843 85,758,989 3,906,934 4,877,823,979 326,479,793 $1-$19,999 11,162 69,294,197 6,820,730 290,116 (874,415) 6,542,370 70,156,856 $20,000-$99,999 6,873 327,490,228 30,844,180 1,579,511 2,405,766 58,834,250 295,512,556 $100,000-$999,999 4,333 1,512,163,261 255,309,314 9,206,488 15,625,543 1,028,507,245 714,133,251 $1,000,000-$9,999,999 2,853 10,359,038,611 1,050,712,256 50,636,102 120,417,263 9,684,758,478 1,553,939,023 $10,000,000-$50,000,000 1,097 24,977,937,300 2,077,957,889 116,831,432 477,561,250 24,356,768,030 2,103,130,639 $50,000,000+ 545 157,709,480,847 7,189,839,843 1,034,231,756 4,531,177,947 153,266,261,309 6,067,490,712 Total, Taxable 27,730 189,206,268,973 21,653,831,055 1,298,534,394 5,150,220,288 193,279,495,661 11,130,842,830 Nontaxable Returns$0 or less 42,546 (334,902,923,483) (12,469,992,744) 68,795,910 4,123,122,124 (337,039,574,132) (14,450,715,714) More than $0 11,242 52,188,218,726 (12,067,299,406) 121,526,079 9,340,604,237 30,022,968,508 (630,372,301) Total, Nontaxable 53,788 (282,714,704,757) (24,537,292,150) 190,321,989 13,463,726,361 (307,016,605,624) (15,081,088,015)
(+) (-) (-) (-) (=) (6.9%) (-) (=)Income Non-Business Income Percentage Depletion Contributions
Apportioned Allocated Over to Computedto NC to NC Cost Depletion Net Economic Loss NC Donees Net Taxable Income Income Tax Tax Credits Net Tax Liability
FTI of Corporation [$] [$] [$] [$] [$] [$] [$] [$] [$] Taxable Returns$0 or less 326,479,793 9,725,665 1,101 16,237,612 809,536 319,157,209 22,021,872 521,526 21,500,346 $1-$19,999 70,156,856 175,192 337,342 4,852,439 669,623 64,472,644 4,448,680 280,065 4,168,615 $20,000-$99,999 295,512,556 788,850 101,857 20,519,051 2,768,836 273,113,964 18,844,918 1,514,719 17,330,199 $100,000-$999,999 714,133,251 5,307,367 718,688 44,648,949 5,382,884 668,691,023 46,139,735 2,081,249 44,058,486 $1,000,000-$9,999,999 1,553,939,023 19,173,935 664,982 75,836,278 9,549,067 1,487,161,772 102,614,187 4,749,387 97,864,800 $10,000,000-$50,000,000 2,103,130,639 4,450,522 13,440,192 68,384,069 8,301,412 2,017,455,488 139,204,430 8,009,397 131,195,033 $50,000,000+ 6,067,490,712 778,707 7,263,422 138,012,256 27,396,010 5,968,949,731 411,857,527 31,752,366 380,105,162 Total, Taxable 11,130,842,830 40,400,238 22,527,584 368,490,654 54,877,368 10,799,001,831 745,131,349 48,908,709 696,222,641 Nontaxable Returns$0 or less (14,450,715,714) (94,375,516) 896,764 7,743,871,435 565,408,138 (22,854,221,506) 8 8 - More than $0 (630,372,301) 84,264,478 15,045,580 4,049,353,095 2,714,956 (3,351,630,533) 50,745 50,745 - Total, Nontaxable (15,081,088,015) (10,111,038) 15,942,344 11,793,224,530 568,123,094 (26,205,852,039) 50,753 50,753 - Notes: Some corporations have no Federal Taxable Income but pay North Carolina taxes because provisions of the State tax code require that they add back certain amounts such as income taxes paid, to their taxable income. Other corporations have a positive Federal Taxable Income but pay no tax in North Carolina because some of their income is not subject to taxation by states or because provisions of the State tax code allow them to reduce their income to the point where is is zero or less. Details may not add due to rounding or taxpayer error.
325,721,470 70,156,856
295,514,881 714,133,299
1,553,939,024 2,104,734,477 6,067,649,678
(14,525,260,129) 740,048,975 635,820,496 18,844,864 18,844,918 319,157,209 22,021,847 21,500,321 -25 2.4% 0.069000 $0 or less (24.58) -
64,472,644 4,448,612 4,168,547 -68 6.3% 0.069001 $1-$19K (67.56) -
0%
1%
2%
3%
4%
5%
6%
7%
8%
9%
$0 or less $1-$19K $20K-$100K $100K-$1M $1M-$10M $10M-$50M $50M+
Figure iii. C-Corporation Tax Credits as a Percent of Tax by FTITax Year 2001
Figure iv. C-Corporation Tax Credits Taken by FTITax Year 2001
1%3%
4%
10%
16%
65%
1%
$0 or less$1-$19K$20K-$100K$100K-$1M$1M-$10M$10M-$50M$50M+
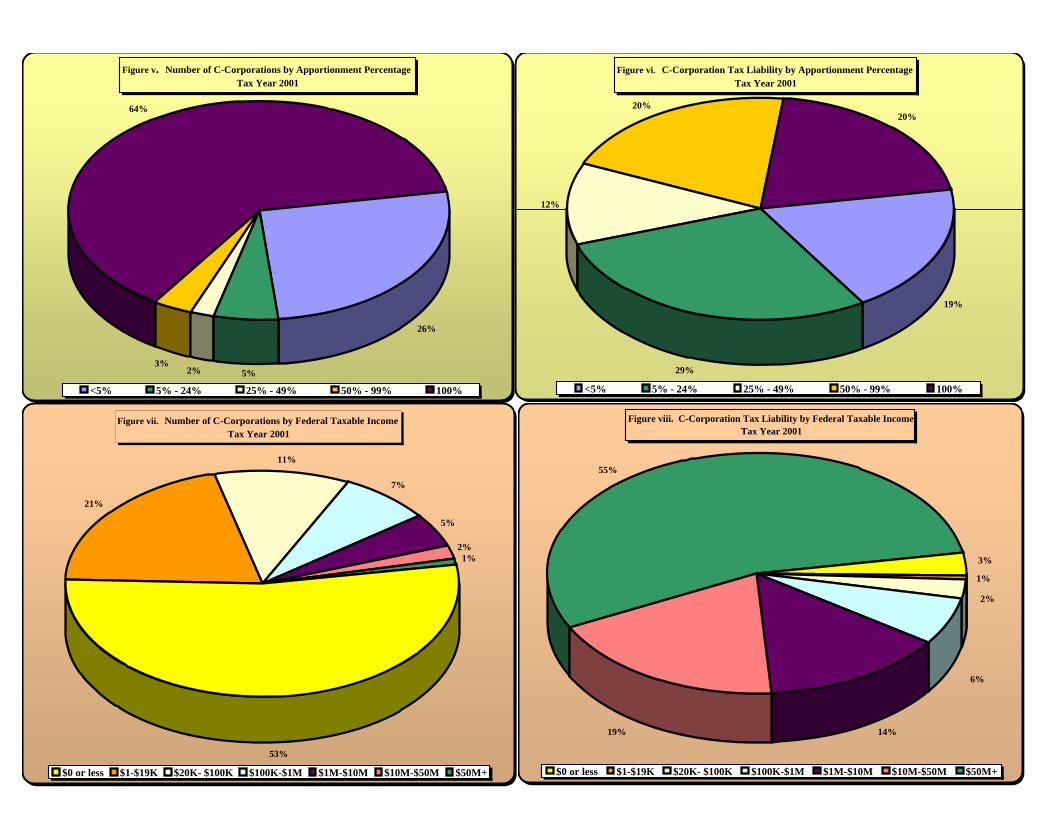
NC Apportionment Percentage
Federal Taxab <5% 5% - 24% 25% - 49% 50% - 99% 100% Total
$0 or less 12,418 2,085 744 1,184 26,983 43,414$1-$19K 1,116 316 154 303 14,891 16,780$20K- $100K 1,070 425 180 409 7,028 9,112$100K-$1M 2,276 701 259 543 2,261 6,040$1M-$10M 2,701 575 187 203 285 3,951$10M-$50M 1,178 184 51 37 31 1,481$50M+ 624 93 10 9 4 740Total 21,383 4,379 1,585 2,688 51,483 81,518
NC Apportionment PercentageFederal Taxab <5% 5% - 24% 25% - 49% 50% - 99% 100% Total
[$] [$] [$] [$] [$] [$]
$0 or less 6,351,886 702,705 171,486 13,568,949 705,320 21,500,346$1-$19K 6,212 21,716 20,525 84,322 4,035,840 4,168,615$20K- $100K 52,490 168,170 186,547 858,443 16,064,549 17,330,199$100K-$1M 897,716 1,975,674 1,803,879 7,535,422 31,845,795 44,058,486$1M-$10M 8,389,361 13,692,044 12,335,908 28,219,558 35,227,929 97,864,800$10M-$50M 19,201,550 26,930,975 23,052,822 27,529,258 34,480,428 131,195,033$50M+ 96,134,095 156,809,859 44,015,810 64,214,848 18,930,550 380,105,162Total 131,033,310 200,301,143 81,586,977 142,010,800 141,290,411 696,222,641
Figure v. Number of C-Corporations by Apportionment PercentageTax Year 2001
26%
2%3%
64%
5%
<5% 5% - 24% 25% - 49% 50% - 99% 100%
Figure vii. Number of C-Corporations by Federal Taxable IncomeTax Year 2001
53%
21%
11%
7%
5%
2%1%
$0 or less $1-$19K $20K- $100K $100K-$1M $1M-$10M $10M-$50M $50M+
Figure vi. C-Corporation Tax Liability by Apportionment PercentageTax Year 2001
19%
29%
12%
20%20%
<5% 5% - 24% 25% - 49% 50% - 99% 100%
Figure viii. C-Corporation Tax Liability by Federal Taxable Income Tax Year 2001
$0 or less $1-$19K $20K- $100K $100K-$1M $1M-$10M $10M-$50M $50M+
55%
14%
3%
19%
1%
2%
6%
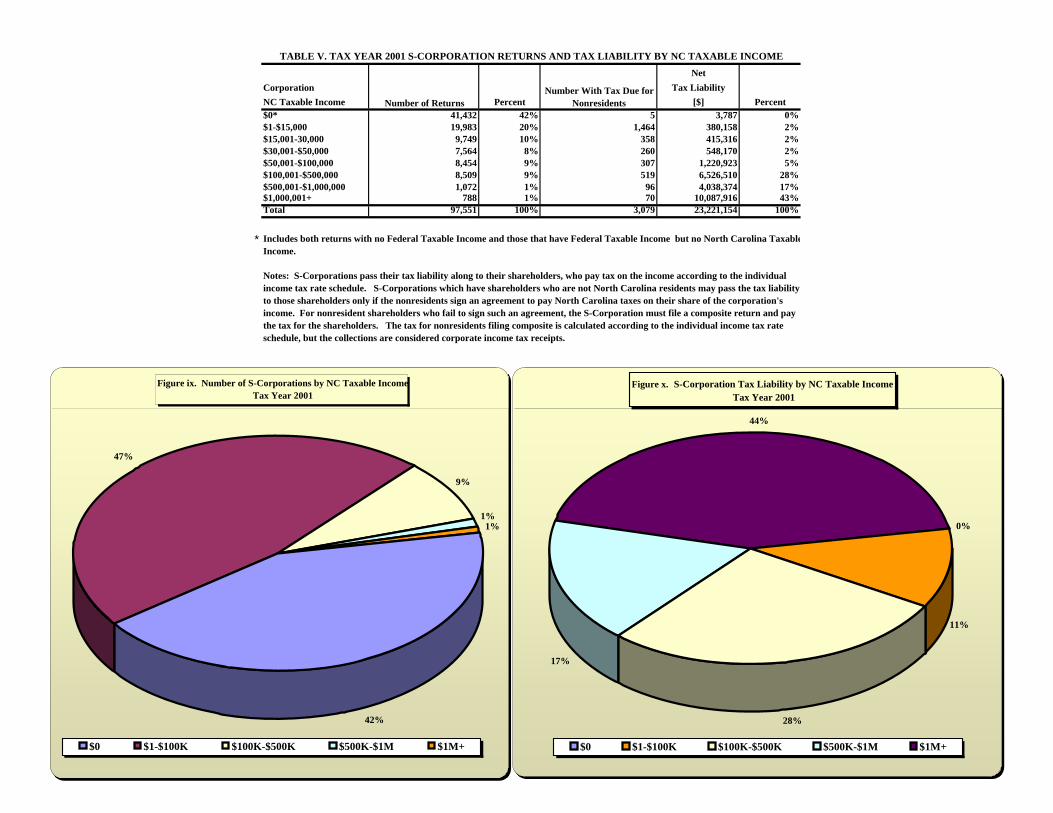
TABLE V. TAX YEAR 2001 S-CORPORATION RETURNS AND TAX LIABILITY BY NC TAXABLE INCOMENet
Corporation Tax LiabilityNC Taxable Income Percent [$] Percent$0* 41,432 42% 5 3,787 0%$1-$15,000 19,983 20% 1,464 380,158 2%$15,001-30,000 9,749 10% 358 415,316 2%$30,001-$50,000 7,564 8% 260 548,170 2%$50,001-$100,000 8,454 9% 307 1,220,923 5%$100,001-$500,000 8,509 9% 519 6,526,510 28%$500,001-$1,000,000 1,072 1% 96 4,038,374 17%$1,000,001+ 788 1% 70 10,087,916 43%Total 97,551 100% 3,079 23,221,154 100%
*
$0$1-$15K $0 41,432 3,787$15-30K $1-$100K 45,750 2,564,567$30K-$50K $100K-$500K 8,509 6,526,510$50K-$100K $500K-$1M 1,072 4,038,374$100K-$500K $1M+ 788 ########$500K-$1M$1M-$10M
Notes: S-Corporations pass their tax liability along to their shareholders, who pay tax on the income according to the individual income tax rate schedule. S-Corporations which have shareholders who are not North Carolina residents may pass the tax liability to those shareholders only if the nonresidents sign an agreement to pay North Carolina taxes on their share of the corporation's income. For nonresident shareholders who fail to sign such an agreement, the S-Corporation must file a composite return and pay the tax for the shareholders. The tax for nonresidents filing composite is calculated according to the individual income tax rate schedule, but the collections are considered corporate income tax receipts.
Number of ReturnsNumber With Tax Due for
Nonresidents
Includes both returns with no Federal Taxable Income and those that have Federal Taxable Income but no North Carolina TaxableIncome.
Figure ix. Number of S-Corporations by NC Taxable Income Tax Year 2001
42%
47%
9%
1%1%
$0 $1-$100K $100K-$500K $500K-$1M $1M+
Figure x. S-Corporation Tax Liability by NC Taxable Income Tax Year 2001
0%
28%
44%
11%
17%
$0 $1-$100K $100K-$500K $500K-$1M $1M+
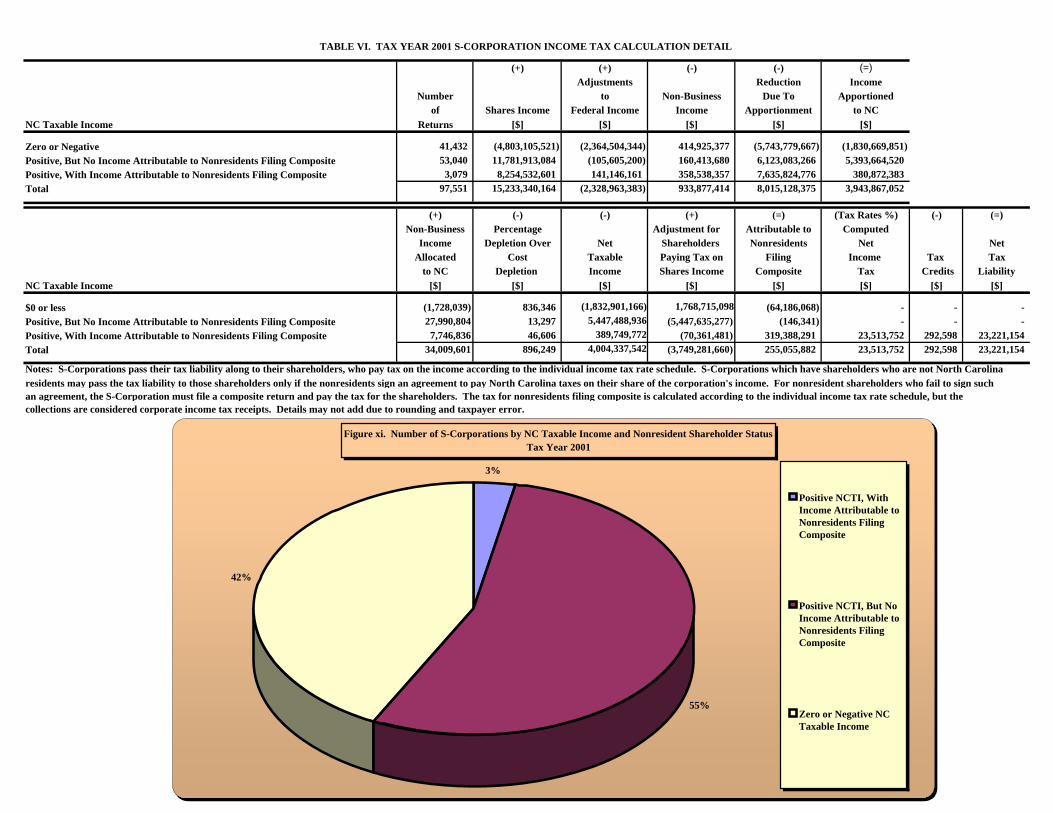
TABLE VI. TAX YEAR 2001 S-CORPORATION INCOME TAX CALCULATION DETAIL
(+) (+) (-) (-) (=)Adjustments Reduction Income
Number to Non-Business Due To Apportionedof Shares Income Federal Income Income Apportionment to NC
NC Taxable Income Returns [$] [$] [$] [$] [$]
Zero or Negative 41,432 (4,803,105,521) (2,364,504,344) 414,925,377 (5,743,779,667) (1,830,669,851) Positive, But No Income Attributable to Nonresidents Filing Composite 53,040 11,781,913,084 (105,605,200) 160,413,680 6,123,083,266 5,393,664,520 Positive, With Income Attributable to Nonresidents Filing Composite 3,079 8,254,532,601 141,146,161 358,538,357 7,635,824,776 380,872,383 Total 97,551 15,233,340,164 (2,328,963,383) 933,877,414 8,015,128,375 3,943,867,052
(+) (-) (-) (+) (=) (Tax Rates %) (-) (=)Non-Business Percentage Adjustment for Attributable to Computed
Income Depletion Over Net Shareholders Nonresidents Net NetAllocated Cost Taxable Paying Tax on Filing Income Tax Tax
to NC Depletion Income Shares Income Composite Tax Credits LiabilityNC Taxable Income [$] [$] [$] [$] [$] [$] [$] [$]
$0 or less (1,728,039) 836,346 (1,832,901,166) 1,768,715,098 (64,186,068) - - - Positive, But No Income Attributable to Nonresidents Filing Composite 27,990,804 13,297 5,447,488,936 (5,447,635,277) (146,341) - - - Positive, With Income Attributable to Nonresidents Filing Composite 7,746,836 46,606 389,749,772 (70,361,481) 319,388,291 23,513,752 292,598 23,221,154 Total 34,009,601 896,249 4,004,337,542 (3,749,281,660) 255,055,882 23,513,752 292,598 23,221,154
Notes: S-Corporations pass their tax liability along to their shareholders, who pay tax on the income according to the individual income tax rate schedule. S-Corporations which have shareholders who are not North Carolinaresidents may pass the tax liability to those shareholders only if the nonresidents sign an agreement to pay North Carolina taxes on their share of the corporation's income. For nonresident shareholders who fail to sign suchan agreement, the S-Corporation must file a composite return and pay the tax for the shareholders. The tax for nonresidents filing composite is calculated according to the individual income tax rate schedule, but the collections are considered corporate income tax receipts. Details may not add due to rounding and taxpayer error.
Positive NCTI, W 3,079Positive NCTI, Bu 53,040Zero or Negative 41,432
Figure xi. Number of S-Corporations by NC Taxable Income and Nonresident Shareholder StatusTax Year 2001
55%
42%
3%
Positive NCTI, WithIncome Attributable toNonresidents FilingComposite
Positive NCTI, But NoIncome Attributable toNonresidents FilingComposite
Zero or Negative NCTaxable Income
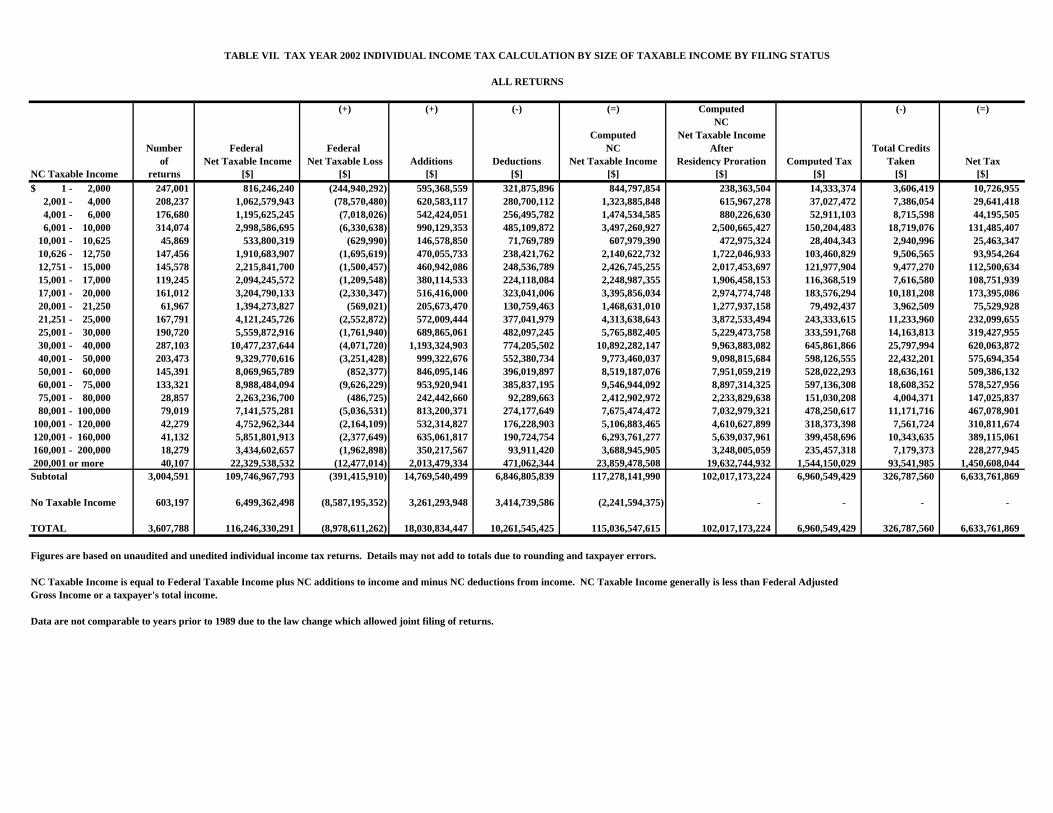
TABLE VII. TAX YEAR 2002 INDIVIDUAL INCOME TAX CALCULATION BY SIZE OF TAXABLE INCOME BY FILING STATUS
ALL RETURNS
(+) (+) (-) (=) Computed (-) (=)NC
Computed Net Taxable IncomeNumber Federal Federal NC After Total Credits
of Net Taxable Income Net Taxable Loss Additions Deductions Net Taxable Income Residency Proration Computed Tax Taken Net TaxNC Taxable Income returns [$] [$] [$] [$] [$] [$] [$] [$] [$]$ 1 - 2,000 247,001 816,246,240 (244,940,292) 595,368,559 321,875,896 844,797,854 238,363,504 14,333,374 3,606,419 10,726,955 2,001 - 4,000 208,237 1,062,579,943 (78,570,480) 620,583,117 280,700,112 1,323,885,848 615,967,278 37,027,472 7,386,054 29,641,418 4,001 - 6,000 176,680 1,195,625,245 (7,018,026) 542,424,051 256,495,782 1,474,534,585 880,226,630 52,911,103 8,715,598 44,195,505 6,001 - 10,000 314,074 2,998,586,695 (6,330,638) 990,129,353 485,109,872 3,497,260,927 2,500,665,427 150,204,483 18,719,076 131,485,407 10,001 - 10,625 45,869 533,800,319 (629,990) 146,578,850 71,769,789 607,979,390 472,975,324 28,404,343 2,940,996 25,463,347 10,626 - 12,750 147,456 1,910,683,907 (1,695,619) 470,055,733 238,421,762 2,140,622,732 1,722,046,933 103,460,829 9,506,565 93,954,264 12,751 - 15,000 145,578 2,215,841,700 (1,500,457) 460,942,086 248,536,789 2,426,745,255 2,017,453,697 121,977,904 9,477,270 112,500,634 15,001 - 17,000 119,245 2,094,245,572 (1,209,548) 380,114,533 224,118,084 2,248,987,355 1,906,458,153 116,368,519 7,616,580 108,751,939 17,001 - 20,000 161,012 3,204,790,133 (2,330,347) 516,416,000 323,041,006 3,395,856,034 2,974,774,748 183,576,294 10,181,208 173,395,086 20,001 - 21,250 61,967 1,394,273,827 (569,021) 205,673,470 130,759,463 1,468,631,010 1,277,937,158 79,492,437 3,962,509 75,529,928 21,251 - 25,000 167,791 4,121,245,726 (2,552,872) 572,009,444 377,041,979 4,313,638,643 3,872,533,494 243,333,615 11,233,960 232,099,655 25,001 - 30,000 190,720 5,559,872,916 (1,761,940) 689,865,061 482,097,245 5,765,882,405 5,229,473,758 333,591,768 14,163,813 319,427,955 30,001 - 40,000 287,103 10,477,237,644 (4,071,720) 1,193,324,903 774,205,502 10,892,282,147 9,963,883,082 645,861,866 25,797,994 620,063,872 40,001 - 50,000 203,473 9,329,770,616 (3,251,428) 999,322,676 552,380,734 9,773,460,037 9,098,815,684 598,126,555 22,432,201 575,694,354 50,001 - 60,000 145,391 8,069,965,789 (852,377) 846,095,146 396,019,897 8,519,187,076 7,951,059,219 528,022,293 18,636,161 509,386,132 60,001 - 75,000 133,321 8,988,484,094 (9,626,229) 953,920,941 385,837,195 9,546,944,092 8,897,314,325 597,136,308 18,608,352 578,527,956 75,001 - 80,000 28,857 2,263,236,700 (486,725) 242,442,660 92,289,663 2,412,902,972 2,233,829,638 151,030,208 4,004,371 147,025,837 80,001 - 100,000 79,019 7,141,575,281 (5,036,531) 813,200,371 274,177,649 7,675,474,472 7,032,979,321 478,250,617 11,171,716 467,078,901 100,001 - 120,000 42,279 4,752,962,344 (2,164,109) 532,314,827 176,228,903 5,106,883,465 4,610,627,899 318,373,398 7,561,724 310,811,674 120,001 - 160,000 41,132 5,851,801,913 (2,377,649) 635,061,817 190,724,754 6,293,761,277 5,639,037,961 399,458,696 10,343,635 389,115,061 160,001 - 200,000 18,279 3,434,602,657 (1,962,898) 350,217,567 93,911,420 3,688,945,905 3,248,005,059 235,457,318 7,179,373 228,277,945 200,001 or more 40,107 22,329,538,532 (12,477,014) 2,013,479,334 471,062,344 23,859,478,508 19,632,744,932 1,544,150,029 93,541,985 1,450,608,044 Subtotal 3,004,591 109,746,967,793 (391,415,910) 14,769,540,499 6,846,805,839 117,278,141,990 102,017,173,224 6,960,549,429 326,787,560 6,633,761,869
No Taxable Income 603,197 6,499,362,498 (8,587,195,352) 3,261,293,948 3,414,739,586 (2,241,594,375) - - - -
TOTAL 3,607,788 116,246,330,291 (8,978,611,262) 18,030,834,447 10,261,545,425 115,036,547,615 102,017,173,224 6,960,549,429 326,787,560 6,633,761,869
Figures are based on unaudited and unedited individual income tax returns. Details may not add to totals due to rounding and taxpayer errors.
NC Taxable Income is equal to Federal Taxable Income plus NC additions to income and minus NC deductions from income. NC Taxable Income generally is less than Federal AdjustedGross Income or a taxpayer's total income.
Data are not comparable to years prior to 1989 due to the law change which allowed joint filing of returns.
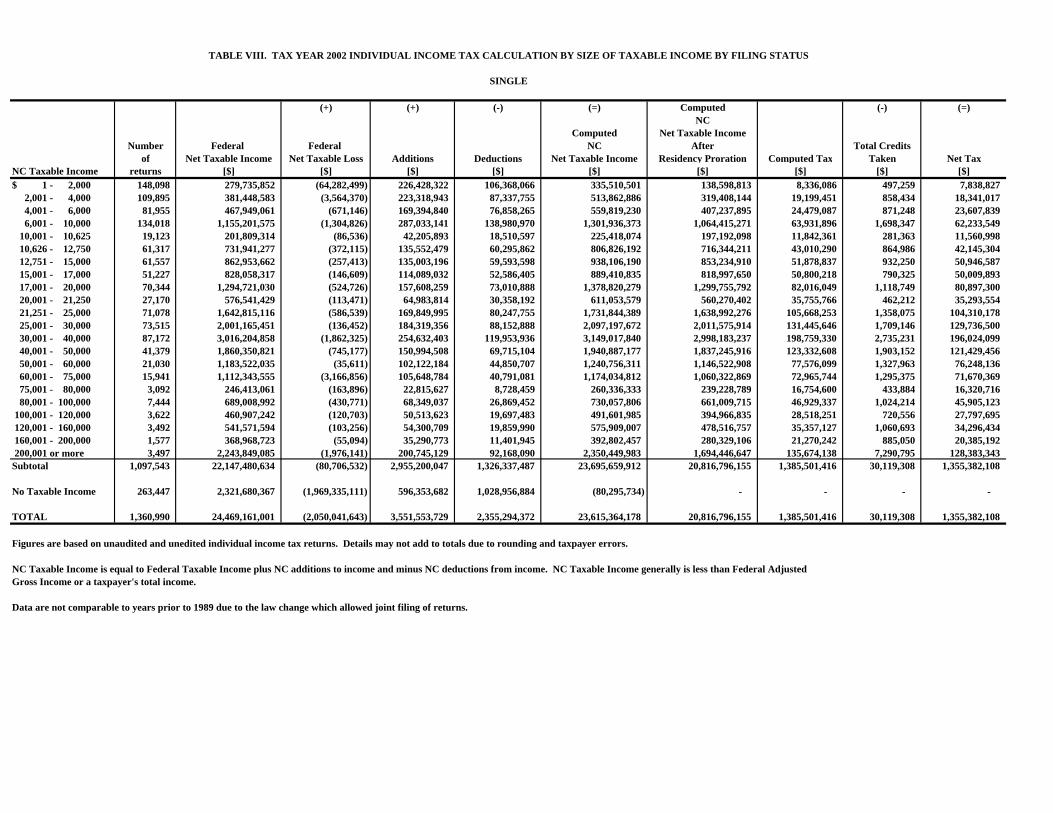
TABLE VIII. TAX YEAR 2002 INDIVIDUAL INCOME TAX CALCULATION BY SIZE OF TAXABLE INCOME BY FILING STATUS
SINGLE
(+) (+) (-) (=) Computed (-) (=)NC
Computed Net Taxable IncomeNumber Federal Federal NC After Total Credits
of Net Taxable Income Net Taxable Loss Additions Deductions Net Taxable Income Residency Proration Computed Tax Taken Net TaxNC Taxable Income returns [$] [$] [$] [$] [$] [$] [$] [$] [$]$ 1 - 2,000 148,098 279,735,852 (64,282,499) 226,428,322 106,368,066 335,510,501 138,598,813 8,336,086 497,259 7,838,827 2,001 - 4,000 109,895 381,448,583 (3,564,370) 223,318,943 87,337,755 513,862,886 319,408,144 19,199,451 858,434 18,341,017 4,001 - 6,000 81,955 467,949,061 (671,146) 169,394,840 76,858,265 559,819,230 407,237,895 24,479,087 871,248 23,607,839 6,001 - 10,000 134,018 1,155,201,575 (1,304,826) 287,033,141 138,980,970 1,301,936,373 1,064,415,271 63,931,896 1,698,347 62,233,549 10,001 - 10,625 19,123 201,809,314 (86,536) 42,205,893 18,510,597 225,418,074 197,192,098 11,842,361 281,363 11,560,998 10,626 - 12,750 61,317 731,941,277 (372,115) 135,552,479 60,295,862 806,826,192 716,344,211 43,010,290 864,986 42,145,304 12,751 - 15,000 61,557 862,953,662 (257,413) 135,003,196 59,593,598 938,106,190 853,234,910 51,878,837 932,250 50,946,587 15,001 - 17,000 51,227 828,058,317 (146,609) 114,089,032 52,586,405 889,410,835 818,997,650 50,800,218 790,325 50,009,893 17,001 - 20,000 70,344 1,294,721,030 (524,726) 157,608,259 73,010,888 1,378,820,279 1,299,755,792 82,016,049 1,118,749 80,897,300 20,001 - 21,250 27,170 576,541,429 (113,471) 64,983,814 30,358,192 611,053,579 560,270,402 35,755,766 462,212 35,293,554 21,251 - 25,000 71,078 1,642,815,116 (586,539) 169,849,995 80,247,755 1,731,844,389 1,638,992,276 105,668,253 1,358,075 104,310,178 25,001 - 30,000 73,515 2,001,165,451 (136,452) 184,319,356 88,152,888 2,097,197,672 2,011,575,914 131,445,646 1,709,146 129,736,500 30,001 - 40,000 87,172 3,016,204,858 (1,862,325) 254,632,403 119,953,936 3,149,017,840 2,998,183,237 198,759,330 2,735,231 196,024,099 40,001 - 50,000 41,379 1,860,350,821 (745,177) 150,994,508 69,715,104 1,940,887,177 1,837,245,916 123,332,608 1,903,152 121,429,456 50,001 - 60,000 21,030 1,183,522,035 (35,611) 102,122,184 44,850,707 1,240,756,311 1,146,522,908 77,576,099 1,327,963 76,248,136 60,001 - 75,000 15,941 1,112,343,555 (3,166,856) 105,648,784 40,791,081 1,174,034,812 1,060,322,869 72,965,744 1,295,375 71,670,369 75,001 - 80,000 3,092 246,413,061 (163,896) 22,815,627 8,728,459 260,336,333 239,228,789 16,754,600 433,884 16,320,716 80,001 - 100,000 7,444 689,008,992 (430,771) 68,349,037 26,869,452 730,057,806 661,009,715 46,929,337 1,024,214 45,905,123 100,001 - 120,000 3,622 460,907,242 (120,703) 50,513,623 19,697,483 491,601,985 394,966,835 28,518,251 720,556 27,797,695 120,001 - 160,000 3,492 541,571,594 (103,256) 54,300,709 19,859,990 575,909,007 478,516,757 35,357,127 1,060,693 34,296,434 160,001 - 200,000 1,577 368,968,723 (55,094) 35,290,773 11,401,945 392,802,457 280,329,106 21,270,242 885,050 20,385,192 200,001 or more 3,497 2,243,849,085 (1,976,141) 200,745,129 92,168,090 2,350,449,983 1,694,446,647 135,674,138 7,290,795 128,383,343 Subtotal 1,097,543 22,147,480,634 (80,706,532) 2,955,200,047 1,326,337,487 23,695,659,912 20,816,796,155 1,385,501,416 30,119,308 1,355,382,108
No Taxable Income 263,447 2,321,680,367 (1,969,335,111) 596,353,682 1,028,956,884 (80,295,734) - - - -
TOTAL 1,360,990 24,469,161,001 (2,050,041,643) 3,551,553,729 2,355,294,372 23,615,364,178 20,816,796,155 1,385,501,416 30,119,308 1,355,382,108
Figures are based on unaudited and unedited individual income tax returns. Details may not add to totals due to rounding and taxpayer errors.
NC Taxable Income is equal to Federal Taxable Income plus NC additions to income and minus NC deductions from income. NC Taxable Income generally is less than Federal AdjustedGross Income or a taxpayer's total income.
Data are not comparable to years prior to 1989 due to the law change which allowed joint filing of returns.
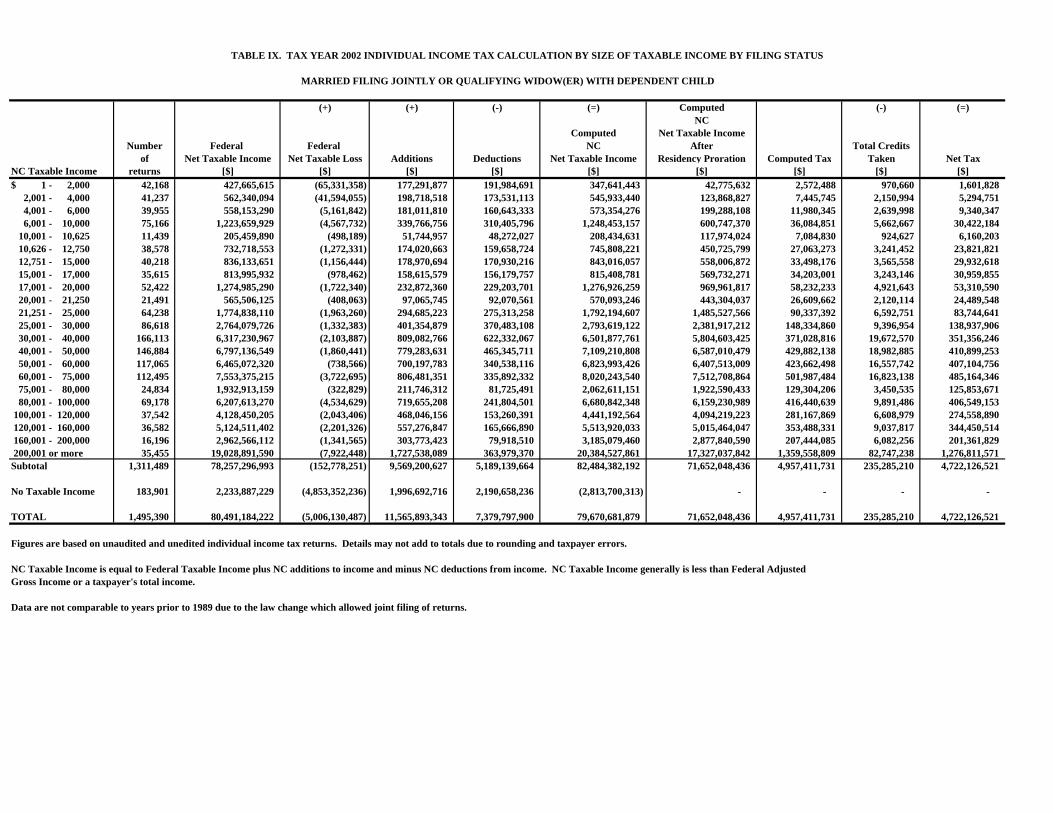
TABLE IX. TAX YEAR 2002 INDIVIDUAL INCOME TAX CALCULATION BY SIZE OF TAXABLE INCOME BY FILING STATUS
MARRIED FILING JOINTLY OR QUALIFYING WIDOW(ER) WITH DEPENDENT CHILD
(+) (+) (-) (=) Computed (-) (=)NC
Computed Net Taxable IncomeNumber Federal Federal NC After Total Credits
of Net Taxable Income Net Taxable Loss Additions Deductions Net Taxable Income Residency Proration Computed Tax Taken Net TaxNC Taxable Income returns [$] [$] [$] [$] [$] [$] [$] [$] [$]$ 1 - 2,000 42,168 427,665,615 (65,331,358) 177,291,877 191,984,691 347,641,443 42,775,632 2,572,488 970,660 1,601,828 2,001 - 4,000 41,237 562,340,094 (41,594,055) 198,718,518 173,531,113 545,933,440 123,868,827 7,445,745 2,150,994 5,294,751 4,001 - 6,000 39,955 558,153,290 (5,161,842) 181,011,810 160,643,333 573,354,276 199,288,108 11,980,345 2,639,998 9,340,347 6,001 - 10,000 75,166 1,223,659,929 (4,567,732) 339,766,756 310,405,796 1,248,453,157 600,747,370 36,084,851 5,662,667 30,422,184 10,001 - 10,625 11,439 205,459,890 (498,189) 51,744,957 48,272,027 208,434,631 117,974,024 7,084,830 924,627 6,160,203 10,626 - 12,750 38,578 732,718,553 (1,272,331) 174,020,663 159,658,724 745,808,221 450,725,799 27,063,273 3,241,452 23,821,821 12,751 - 15,000 40,218 836,133,651 (1,156,444) 178,970,694 170,930,216 843,016,057 558,006,872 33,498,176 3,565,558 29,932,618 15,001 - 17,000 35,615 813,995,932 (978,462) 158,615,579 156,179,757 815,408,781 569,732,271 34,203,001 3,243,146 30,959,855 17,001 - 20,000 52,422 1,274,985,290 (1,722,340) 232,872,360 229,203,701 1,276,926,259 969,961,817 58,232,233 4,921,643 53,310,590 20,001 - 21,250 21,491 565,506,125 (408,063) 97,065,745 92,070,561 570,093,246 443,304,037 26,609,662 2,120,114 24,489,548 21,251 - 25,000 64,238 1,774,838,110 (1,963,260) 294,685,223 275,313,258 1,792,194,607 1,485,527,566 90,337,392 6,592,751 83,744,641 25,001 - 30,000 86,618 2,764,079,726 (1,332,383) 401,354,879 370,483,108 2,793,619,122 2,381,917,212 148,334,860 9,396,954 138,937,906 30,001 - 40,000 166,113 6,317,230,967 (2,103,887) 809,082,766 622,332,067 6,501,877,761 5,804,603,425 371,028,816 19,672,570 351,356,246 40,001 - 50,000 146,884 6,797,136,549 (1,860,441) 779,283,631 465,345,711 7,109,210,808 6,587,010,479 429,882,138 18,982,885 410,899,253 50,001 - 60,000 117,065 6,465,072,320 (738,566) 700,197,783 340,538,116 6,823,993,426 6,407,513,009 423,662,498 16,557,742 407,104,756 60,001 - 75,000 112,495 7,553,375,215 (3,722,695) 806,481,351 335,892,332 8,020,243,540 7,512,708,864 501,987,484 16,823,138 485,164,346 75,001 - 80,000 24,834 1,932,913,159 (322,829) 211,746,312 81,725,491 2,062,611,151 1,922,590,433 129,304,206 3,450,535 125,853,671 80,001 - 100,000 69,178 6,207,613,270 (4,534,629) 719,655,208 241,804,501 6,680,842,348 6,159,230,989 416,440,639 9,891,486 406,549,153 100,001 - 120,000 37,542 4,128,450,205 (2,043,406) 468,046,156 153,260,391 4,441,192,564 4,094,219,223 281,167,869 6,608,979 274,558,890 120,001 - 160,000 36,582 5,124,511,402 (2,201,326) 557,276,847 165,666,890 5,513,920,033 5,015,464,047 353,488,331 9,037,817 344,450,514 160,001 - 200,000 16,196 2,962,566,112 (1,341,565) 303,773,423 79,918,510 3,185,079,460 2,877,840,590 207,444,085 6,082,256 201,361,829 200,001 or more 35,455 19,028,891,590 (7,922,448) 1,727,538,089 363,979,370 20,384,527,861 17,327,037,842 1,359,558,809 82,747,238 1,276,811,571 Subtotal 1,311,489 78,257,296,993 (152,778,251) 9,569,200,627 5,189,139,664 82,484,382,192 71,652,048,436 4,957,411,731 235,285,210 4,722,126,521
No Taxable Income 183,901 2,233,887,229 (4,853,352,236) 1,996,692,716 2,190,658,236 (2,813,700,313) - - - -
TOTAL 1,495,390 80,491,184,222 (5,006,130,487) 11,565,893,343 7,379,797,900 79,670,681,879 71,652,048,436 4,957,411,731 235,285,210 4,722,126,521
Figures are based on unaudited and unedited individual income tax returns. Details may not add to totals due to rounding and taxpayer errors.
NC Taxable Income is equal to Federal Taxable Income plus NC additions to income and minus NC deductions from income. NC Taxable Income generally is less than Federal AdjustedGross Income or a taxpayer's total income.
Data are not comparable to years prior to 1989 due to the law change which allowed joint filing of returns.
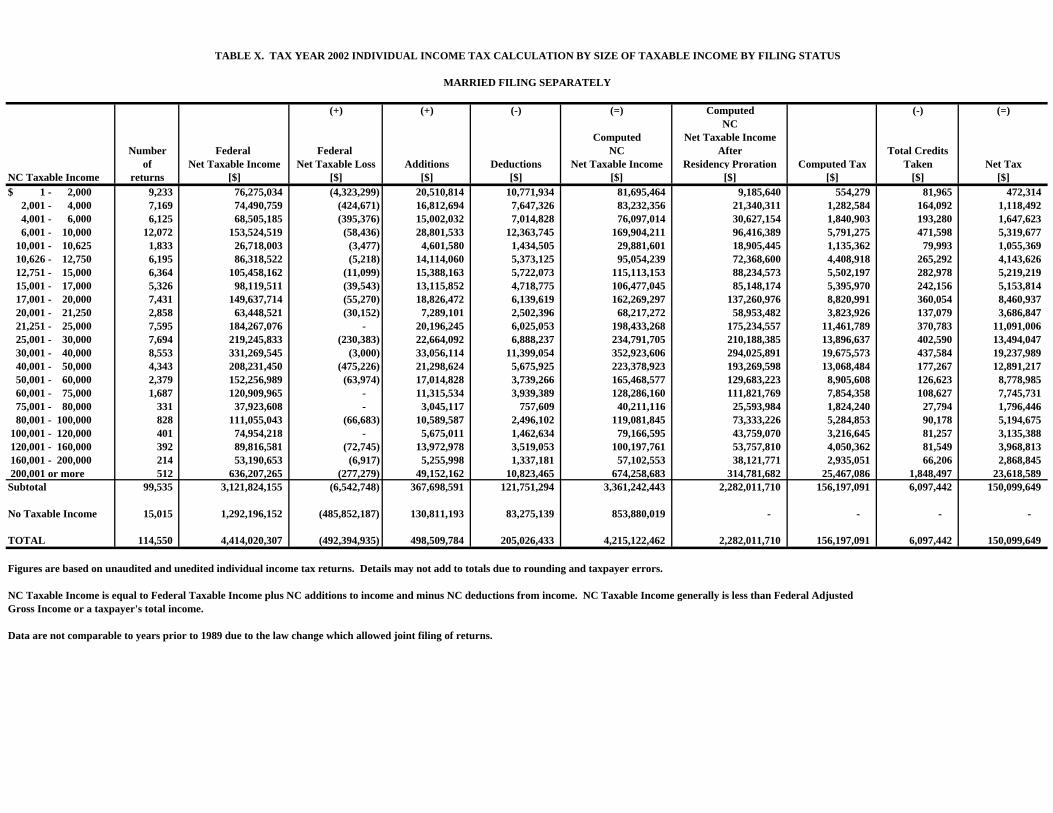
TABLE X. TAX YEAR 2002 INDIVIDUAL INCOME TAX CALCULATION BY SIZE OF TAXABLE INCOME BY FILING STATUS
MARRIED FILING SEPARATELY
(+) (+) (-) (=) Computed (-) (=)NC
Computed Net Taxable IncomeNumber Federal Federal NC After Total Credits
of Net Taxable Income Net Taxable Loss Additions Deductions Net Taxable Income Residency Proration Computed Tax Taken Net TaxNC Taxable Income returns [$] [$] [$] [$] [$] [$] [$] [$] [$]$ 1 - 2,000 9,233 76,275,034 (4,323,299) 20,510,814 10,771,934 81,695,464 9,185,640 554,279 81,965 472,314 2,001 - 4,000 7,169 74,490,759 (424,671) 16,812,694 7,647,326 83,232,356 21,340,311 1,282,584 164,092 1,118,492 4,001 - 6,000 6,125 68,505,185 (395,376) 15,002,032 7,014,828 76,097,014 30,627,154 1,840,903 193,280 1,647,623 6,001 - 10,000 12,072 153,524,519 (58,436) 28,801,533 12,363,745 169,904,211 96,416,389 5,791,275 471,598 5,319,677 10,001 - 10,625 1,833 26,718,003 (3,477) 4,601,580 1,434,505 29,881,601 18,905,445 1,135,362 79,993 1,055,369 10,626 - 12,750 6,195 86,318,522 (5,218) 14,114,060 5,373,125 95,054,239 72,368,600 4,408,918 265,292 4,143,626 12,751 - 15,000 6,364 105,458,162 (11,099) 15,388,163 5,722,073 115,113,153 88,234,573 5,502,197 282,978 5,219,219 15,001 - 17,000 5,326 98,119,511 (39,543) 13,115,852 4,718,775 106,477,045 85,148,174 5,395,970 242,156 5,153,814 17,001 - 20,000 7,431 149,637,714 (55,270) 18,826,472 6,139,619 162,269,297 137,260,976 8,820,991 360,054 8,460,937 20,001 - 21,250 2,858 63,448,521 (30,152) 7,289,101 2,502,396 68,217,272 58,953,482 3,823,926 137,079 3,686,847 21,251 - 25,000 7,595 184,267,076 - 20,196,245 6,025,053 198,433,268 175,234,557 11,461,789 370,783 11,091,006 25,001 - 30,000 7,694 219,245,833 (230,383) 22,664,092 6,888,237 234,791,705 210,188,385 13,896,637 402,590 13,494,047 30,001 - 40,000 8,553 331,269,545 (3,000) 33,056,114 11,399,054 352,923,606 294,025,891 19,675,573 437,584 19,237,989 40,001 - 50,000 4,343 208,231,450 (475,226) 21,298,624 5,675,925 223,378,923 193,269,598 13,068,484 177,267 12,891,217 50,001 - 60,000 2,379 152,256,989 (63,974) 17,014,828 3,739,266 165,468,577 129,683,223 8,905,608 126,623 8,778,985 60,001 - 75,000 1,687 120,909,965 - 11,315,534 3,939,389 128,286,160 111,821,769 7,854,358 108,627 7,745,731 75,001 - 80,000 331 37,923,608 - 3,045,117 757,609 40,211,116 25,593,984 1,824,240 27,794 1,796,446 80,001 - 100,000 828 111,055,043 (66,683) 10,589,587 2,496,102 119,081,845 73,333,226 5,284,853 90,178 5,194,675 100,001 - 120,000 401 74,954,218 - 5,675,011 1,462,634 79,166,595 43,759,070 3,216,645 81,257 3,135,388 120,001 - 160,000 392 89,816,581 (72,745) 13,972,978 3,519,053 100,197,761 53,757,810 4,050,362 81,549 3,968,813 160,001 - 200,000 214 53,190,653 (6,917) 5,255,998 1,337,181 57,102,553 38,121,771 2,935,051 66,206 2,868,845 200,001 or more 512 636,207,265 (277,279) 49,152,162 10,823,465 674,258,683 314,781,682 25,467,086 1,848,497 23,618,589 Subtotal 99,535 3,121,824,155 (6,542,748) 367,698,591 121,751,294 3,361,242,443 2,282,011,710 156,197,091 6,097,442 150,099,649
No Taxable Income 15,015 1,292,196,152 (485,852,187) 130,811,193 83,275,139 853,880,019 - - - -
TOTAL 114,550 4,414,020,307 (492,394,935) 498,509,784 205,026,433 4,215,122,462 2,282,011,710 156,197,091 6,097,442 150,099,649
Figures are based on unaudited and unedited individual income tax returns. Details may not add to totals due to rounding and taxpayer errors.
NC Taxable Income is equal to Federal Taxable Income plus NC additions to income and minus NC deductions from income. NC Taxable Income generally is less than Federal AdjustedGross Income or a taxpayer's total income.
Data are not comparable to years prior to 1989 due to the law change which allowed joint filing of returns.
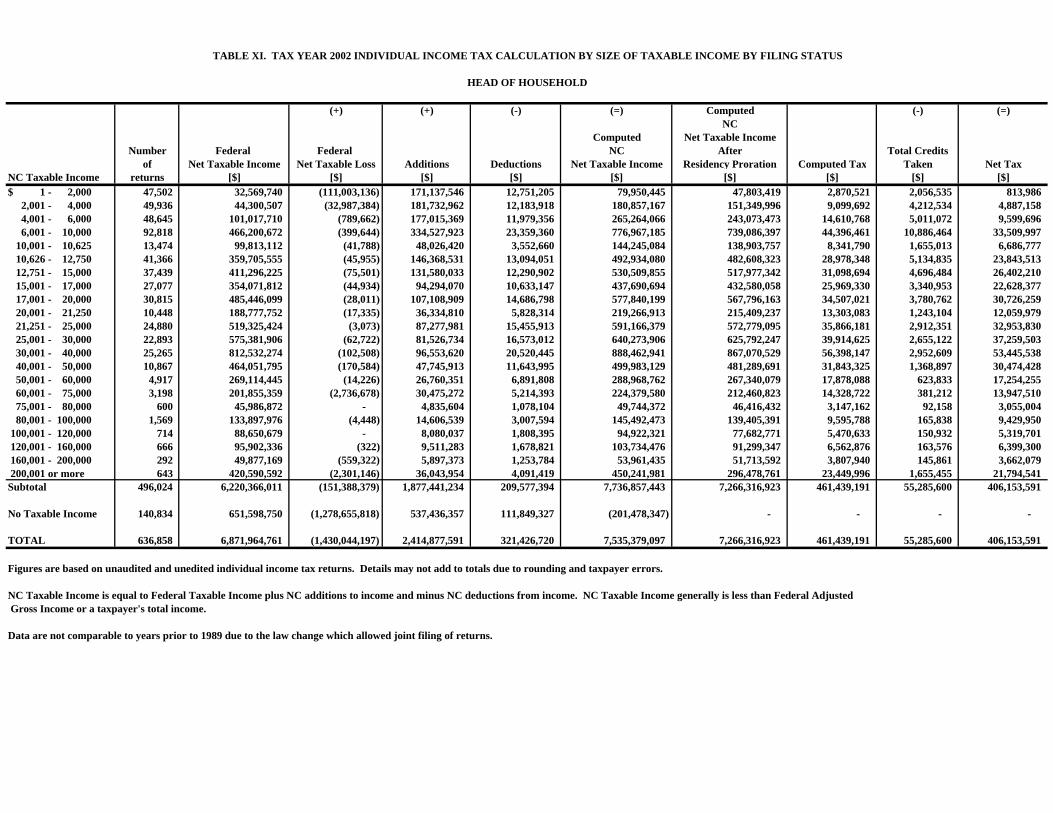
TABLE XI. TAX YEAR 2002 INDIVIDUAL INCOME TAX CALCULATION BY SIZE OF TAXABLE INCOME BY FILING STATUS
HEAD OF HOUSEHOLD
(+) (+) (-) (=) Computed (-) (=)NC
Computed Net Taxable IncomeNumber Federal Federal NC After Total Credits
of Net Taxable Income Net Taxable Loss Additions Deductions Net Taxable Income Residency Proration Computed Tax Taken Net TaxNC Taxable Income returns [$] [$] [$] [$] [$] [$] [$] [$] [$]$ 1 - 2,000 47,502 32,569,740 (111,003,136) 171,137,546 12,751,205 79,950,445 47,803,419 2,870,521 2,056,535 813,986 2,001 - 4,000 49,936 44,300,507 (32,987,384) 181,732,962 12,183,918 180,857,167 151,349,996 9,099,692 4,212,534 4,887,158 4,001 - 6,000 48,645 101,017,710 (789,662) 177,015,369 11,979,356 265,264,066 243,073,473 14,610,768 5,011,072 9,599,696 6,001 - 10,000 92,818 466,200,672 (399,644) 334,527,923 23,359,360 776,967,185 739,086,397 44,396,461 10,886,464 33,509,997 10,001 - 10,625 13,474 99,813,112 (41,788) 48,026,420 3,552,660 144,245,084 138,903,757 8,341,790 1,655,013 6,686,777 10,626 - 12,750 41,366 359,705,555 (45,955) 146,368,531 13,094,051 492,934,080 482,608,323 28,978,348 5,134,835 23,843,513 12,751 - 15,000 37,439 411,296,225 (75,501) 131,580,033 12,290,902 530,509,855 517,977,342 31,098,694 4,696,484 26,402,210 15,001 - 17,000 27,077 354,071,812 (44,934) 94,294,070 10,633,147 437,690,694 432,580,058 25,969,330 3,340,953 22,628,377 17,001 - 20,000 30,815 485,446,099 (28,011) 107,108,909 14,686,798 577,840,199 567,796,163 34,507,021 3,780,762 30,726,259 20,001 - 21,250 10,448 188,777,752 (17,335) 36,334,810 5,828,314 219,266,913 215,409,237 13,303,083 1,243,104 12,059,979 21,251 - 25,000 24,880 519,325,424 (3,073) 87,277,981 15,455,913 591,166,379 572,779,095 35,866,181 2,912,351 32,953,830 25,001 - 30,000 22,893 575,381,906 (62,722) 81,526,734 16,573,012 640,273,906 625,792,247 39,914,625 2,655,122 37,259,503 30,001 - 40,000 25,265 812,532,274 (102,508) 96,553,620 20,520,445 888,462,941 867,070,529 56,398,147 2,952,609 53,445,538 40,001 - 50,000 10,867 464,051,795 (170,584) 47,745,913 11,643,995 499,983,129 481,289,691 31,843,325 1,368,897 30,474,428 50,001 - 60,000 4,917 269,114,445 (14,226) 26,760,351 6,891,808 288,968,762 267,340,079 17,878,088 623,833 17,254,255 60,001 - 75,000 3,198 201,855,359 (2,736,678) 30,475,272 5,214,393 224,379,580 212,460,823 14,328,722 381,212 13,947,510 75,001 - 80,000 600 45,986,872 - 4,835,604 1,078,104 49,744,372 46,416,432 3,147,162 92,158 3,055,004 80,001 - 100,000 1,569 133,897,976 (4,448) 14,606,539 3,007,594 145,492,473 139,405,391 9,595,788 165,838 9,429,950 100,001 - 120,000 714 88,650,679 - 8,080,037 1,808,395 94,922,321 77,682,771 5,470,633 150,932 5,319,701 120,001 - 160,000 666 95,902,336 (322) 9,511,283 1,678,821 103,734,476 91,299,347 6,562,876 163,576 6,399,300 160,001 - 200,000 292 49,877,169 (559,322) 5,897,373 1,253,784 53,961,435 51,713,592 3,807,940 145,861 3,662,079 200,001 or more 643 420,590,592 (2,301,146) 36,043,954 4,091,419 450,241,981 296,478,761 23,449,996 1,655,455 21,794,541 Subtotal 496,024 6,220,366,011 (151,388,379) 1,877,441,234 209,577,394 7,736,857,443 7,266,316,923 461,439,191 55,285,600 406,153,591
No Taxable Income 140,834 651,598,750 (1,278,655,818) 537,436,357 111,849,327 (201,478,347) - - - -
TOTAL 636,858 6,871,964,761 (1,430,044,197) 2,414,877,591 321,426,720 7,535,379,097 7,266,316,923 461,439,191 55,285,600 406,153,591
Figures are based on unaudited and unedited individual income tax returns. Details may not add to totals due to rounding and taxpayer errors.
NC Taxable Income is equal to Federal Taxable Income plus NC additions to income and minus NC deductions from income. NC Taxable Income generally is less than Federal Adjusted Gross Income or a taxpayer's total income.
Data are not comparable to years prior to 1989 due to the law change which allowed joint filing of returns.
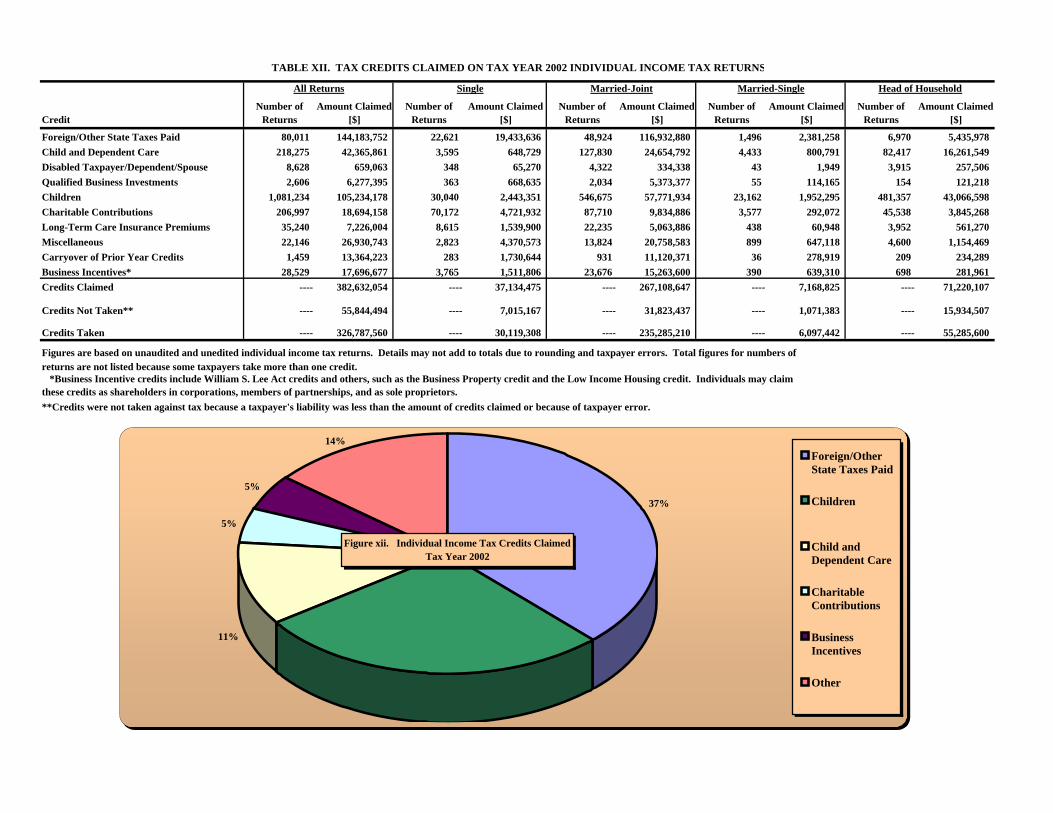
TABLE XII. TAX CREDITS CLAIMED ON TAX YEAR 2002 INDIVIDUAL INCOME TAX RETURNS
All Returns Single Married-Joint Married-Single Head of Household
CreditNumber of
ReturnsAmount Claimed
[$]Number of
ReturnsAmount Claimed
[$]Number of
ReturnsAmount Claimed
[$]Number of
ReturnsAmount Claimed
[$]Number of
ReturnsAmount Claimed
[$]
Foreign/Other State Taxes Paid 80,011 144,183,752 22,621 19,433,636 48,924 116,932,880 1,496 2,381,258 6,970 5,435,978Child and Dependent Care 218,275 42,365,861 3,595 648,729 127,830 24,654,792 4,433 800,791 82,417 16,261,549Disabled Taxpayer/Dependent/Spouse 8,628 659,063 348 65,270 4,322 334,338 43 1,949 3,915 257,506Qualified Business Investments 2,606 6,277,395 363 668,635 2,034 5,373,377 55 114,165 154 121,218Children 1,081,234 105,234,178 30,040 2,443,351 546,675 57,771,934 23,162 1,952,295 481,357 43,066,598Charitable Contributions 206,997 18,694,158 70,172 4,721,932 87,710 9,834,886 3,577 292,072 45,538 3,845,268Long-Term Care Insurance Premiums 35,240 7,226,004 8,615 1,539,900 22,235 5,063,886 438 60,948 3,952 561,270Miscellaneous 22,146 26,930,743 2,823 4,370,573 13,824 20,758,583 899 647,118 4,600 1,154,469Carryover of Prior Year Credits 1,459 13,364,223 283 1,730,644 931 11,120,371 36 278,919 209 234,289Business Incentives* 28,529 17,696,677 3,765 1,511,806 23,676 15,263,600 390 639,310 698 281,961Credits Claimed ---- 382,632,054 ---- 37,134,475 ---- 267,108,647 ---- 7,168,825 ---- 71,220,107
Credits Not Taken** ---- 55,844,494 ---- 7,015,167 ---- 31,823,437 ---- 1,071,383 ---- 15,934,507
Credits Taken ---- 326,787,560 ---- 30,119,308 ---- 235,285,210 ---- 6,097,442 ---- 55,285,600
returns are not listed because some taxpayers take more than one credit.
these credits as shareholders in corporations, members of partnerships, and as sole proprietors.**Credits were not taken against tax because a taxpayer's liability was less than the amount of credits claimed or because of taxpayer error.
Foreign/Other S 80,011 144,183,752Children 1,081,234 105,234,178Child and Depen 218,275 42,365,861Charitable Cont 206,997 18,694,158Business Incenti 28,529 17,696,677Other 70,079 54,457,428
Figures are based on unaudited and unedited individual income tax returns. Details may not add to totals due to rounding and taxpayer errors. Total figures for numbers of
*Business Incentive credits include William S. Lee Act credits and others, such as the Business Property credit and the Low Income Housing credit. Individuals may claim
Figure xii. Individual Income Tax Credits ClaimedTax Year 2002
37%
11%
5%
5%
14%Foreign/OtherState Taxes Paid
Children
Child andDependent Care
CharitableContributions
BusinessIncentives
Other