Embed Size (px)
Citation preview
2017
2017
Copyrights Reserved for Statistics Centre - Abu Dhabi
Statistical Yearbookof Abu Dhabi 2017

His Highness Sheikh
Khalifa bin Zayed Al NahyanPresident of the United Arab Emirates

His Highness Sheikh
Mohammad bin Zayed Al NahyanCrown Prince of Abu Dhabi and Deputy Supreme
Commander of the UAE Armed Forces
Foreword
The Statistics Centre - Abu Dhabi (SCAD) is pleased to present the Abu Dhabi Statistical Yearbook – 2017, this latest issue of this annual publication, which closely monitors a whole spectrum of indicators that gauge the comprehensive development taking place across the Emirate under the wise leadership of HH Sheikh Khalifa bin Zayed Al Nahyan, President of the United Arab Emirates and Ruler of Abu Dhabi, and the sustained support and guidance of HH General Sheikh Mohammed bin Zayed Al Nahyan, Crown Prince of Abu Dhabi, Deputy Supreme Commander of the Armed Forces and Chairman of the Executive Council of the Emirate of Abu Dhabi.
The publication of Abu Dhabi Statistical Yearbook 2017 translates SCAD’s belief in the importance of timely access to statistical data in decision support and policy making at all public and private levels. SYB 2017 reviews a wide range of development indicators for the period 2010 - 2016, highlighting the major transformations experienced by the emirate in all spheres, including the economy, industry and business, population and demography, society and the labour force, agriculture and the environment, water and energy. etc.
It remains to be noted that despite the thorough efforts made by SCAD in collecting data, conducting surveys and compiling various indicators for this statistical abstract, the credit for the widespread interest in this release among broad segments of society goes also to the collaboration of our strategic partners, namely, local government entities, Federal ministries, and private enterprises, which supplied the centre with a considerable proportion of the datasets required for this publication, realizing the importance of working in true team spirit for the progress of the nation.
Working towards a transformation to fully electronic operations, transactions and procedures, in fulfillment of the "Paperless Centre" project, we would like to note that this will be the last issue of SCAD’s SYB to be published in hard copies. Beginning from next year, only electronic copies of the book will be available, with utmost care taken to maintain the quality of the final output, and meet your needs of statistical data and indicators on the Emirate of Abu Dhabi.
Butti Ahmed Mohammed Bin Butti Al Qubaisi
Director General
July 2017
Units and Abbreviations
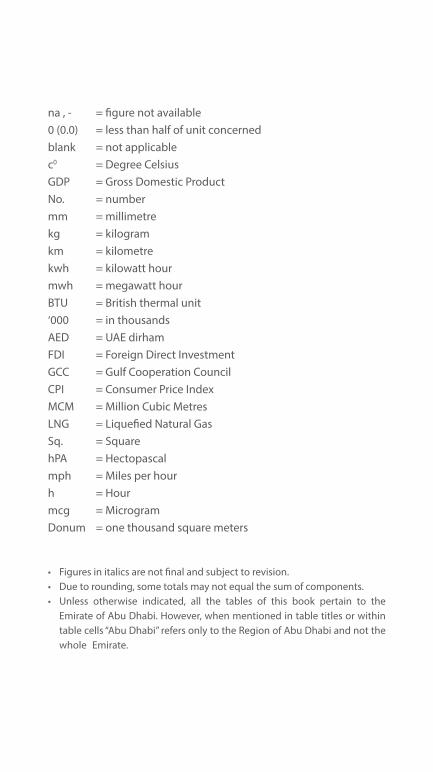
na , - = figure not available0 (0.0) = less than half of unit concernedblank = not applicablec0 = Degree CelsiusGDP = Gross Domestic ProductNo. = numbermm = millimetrekg = kilogramkm = kilometrekwh = kilowatt hourmwh = megawatt hourBTU = British thermal unit‘000 = in thousandsAED = UAE dirhamFDI = Foreign Direct InvestmentGCC = Gulf Cooperation CouncilCPI = Consumer Price IndexMCM = Million Cubic MetresLNG = Liquefied Natural GasSq. = SquarehPA = Hectopascalmph = Miles per hourh = Hourmcg = Microgram Donum = one thousand square meters
• Figures in italics are not final and subject to revision. • Due to rounding, some totals may not equal the sum of components.• Unless otherwise indicated, all the tables of this book pertain to the
Emirate of Abu Dhabi. However, when mentioned in table titles or within table cells “Abu Dhabi” refers only to the Region of Abu Dhabi and not the whole Emirate.
Contents
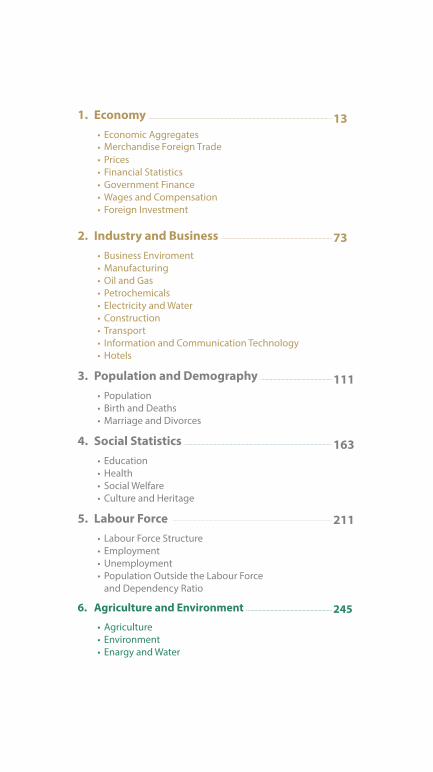
1. Economy• Economic Aggregates• Merchandise Foreign Trade• Prices• Financial Statistics• Government Finance• Wages and Compensation• Foreign Investment
2 . Industry and Business • Business Enviroment• Manufacturing• Oil and Gas• Petrochemicals• Electricity and Water• Construction• Transport• Information and Communication Technology• Hotels
3 . Population and Demography • Population• Birth and Deaths• Marriage and Divorces
4 . Social Statistics • Education• Health• Social Welfare• Culture and Heritage
5 . Labour Force• Labour Force Structure• Employment• Unemployment• Population Outside the Labour Force
and Dependency Ratio
6 . Agriculture and Environment
• Agriculture • Environment• Enargy and Water
13
73
111
163
211
245
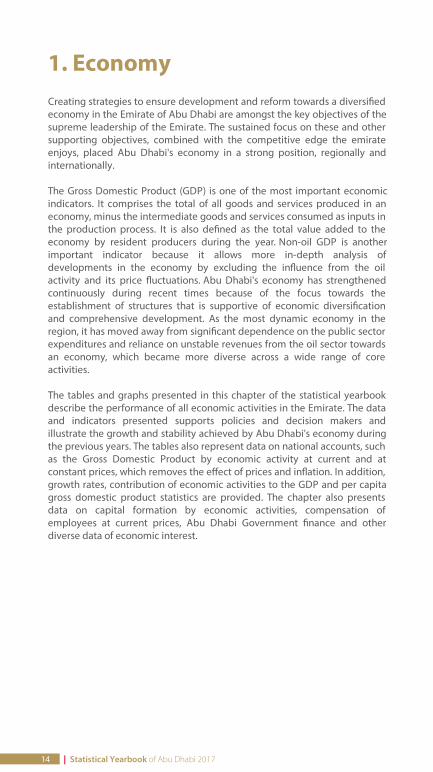
1. EconomyCreating strategies to ensure development and reform towards a diversi edeconomy in the Emirate of Abu Dhabi are amongst the key objectives of thesupreme leadership of the Emirate. The sustained focus on these and othersupporting objectives, combined with the competitive edge the emirateenjoys, placed Abu Dhabi's economy in a strong position, regionally andinternationally.
The Gross Domestic Product (GDP) is one of the most important economicindicators. It comprises the total of all goods and services produced in aneconomy, minus the intermediate goods and services consumed as inputs inthe production process. It is also de ned as the total value added to theeconomy by resident producers during the year. Non-oil GDP is anotherimportant indicator because it allows more in-depth analysis ofdevelopments in the economy by excluding the in uence from the oilactivity and its price uctuations. Abu Dhabi's economy has strengthenedcontinuously during recent times because of the focus towards theestablishment of structures that is supportive of economic diversi cationand comprehensive development. As the most dynamic economy in theregion, it has moved away from signi cant dependence on the public sectorexpenditures and reliance on unstable revenues from the oil sector towardsan economy, which became more diverse across a wide range of coreactivities.
The tables and graphs presented in this chapter of the statistical yearbookdescribe the performance of all economic activities in the Emirate. The dataand indicators presented supports policies and decision makers andillustrate the growth and stability achieved by Abu Dhabi's economy duringthe previous years. The tables also represent data on national accounts, suchas the Gross Domestic Product by economic activity at current and atconstant prices, which removes the effect of prices and in ation. In addition,growth rates, contribution of economic activities to the GDP and per capitagross domestic product statistics are provided. The chapter also presentsdata on capital formation by economic activities, compensation ofemployees at current prices, Abu Dhabi Government nance and otherdiverse data of economic interest.
14 | Statistical Yearbook of Abu Dhabi 2017
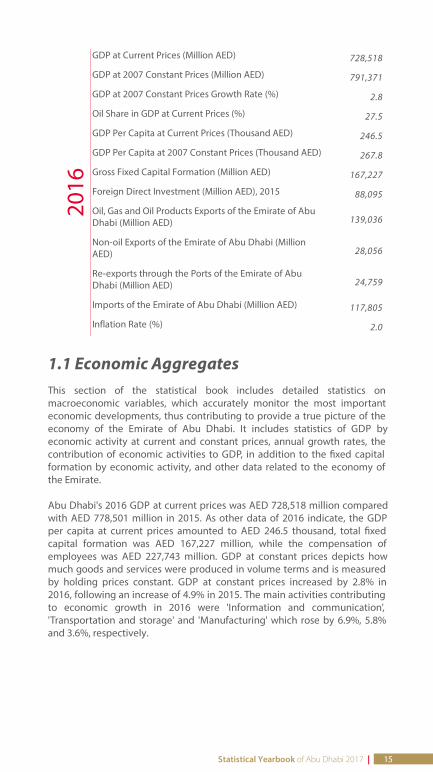
GDP at Current Prices (Million AED) 728,518
GDP at 2007 Constant Prices (Million AED) 791,371
GDP at 2007 Constant Prices Growth Rate (%) 2.8
Oil Share in GDP at Current Prices (%) 27.5
GDP Per Capita at Current Prices (Thousand AED) 246.5
GDP Per Capita at 2007 Constant Prices (Thousand AED) 267.8
Gross Fixed Capital Formation (Million AED) 167,227
Foreign Direct Investment (Million AED), 2015 88,095
Oil, Gas and Oil Products Exports of the Emirate of AbuDhabi (Million AED) 139,036
Non-oil Exports of the Emirate of Abu Dhabi (MillionAED) 28,056
Re-exports through the Ports of the Emirate of AbuDhabi (Million AED) 24,759
Imports of the Emirate of Abu Dhabi (Million AED) 117,805
Inflation Rate (%) 2.0
1.1 Economic AggregatesThis section of the statistical book includes detailed statistics onmacroeconomic variables, which accurately monitor the most importanteconomic developments, thus contributing to provide a true picture of theeconomy of the Emirate of Abu Dhabi. It includes statistics of GDP byeconomic activity at current and constant prices, annual growth rates, thecontribution of economic activities to GDP, in addition to the xed capitalformation by economic activity, and other data related to the economy ofthe Emirate.
Abu Dhabi's 2016 GDP at current prices was AED 728,518 million comparedwith AED 778,501 million in 2015. As other data of 2016 indicate, the GDPper capita at current prices amounted to AED 246.5 thousand, total xedcapital formation was AED 167,227 million, while the compensation ofemployees was AED 227,743 million. GDP at constant prices depicts howmuch goods and services were produced in volume terms and is measuredby holding prices constant. GDP at constant prices increased by 2.8% in2016, following an increase of 4.9% in 2015. The main activities contributingto economic growth in 2016 were 'Information and communication','Transportation and storage' and 'Manufacturing' which rose by 6.9%, 5.8%and 3.6%, respectively.
2016
Statistical Yearbook of Abu Dhabi 2017 | 15
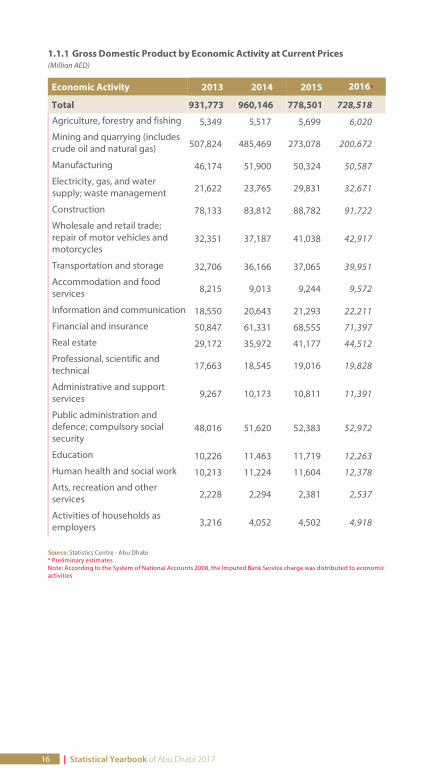
1.1.1 Gross Domestic Product by Economic Activity at Current Prices(Million AED)
Economic Activity 2013 2014 2015 2016*
Total 931,773 960,146 778,501 728,518
Agriculture, forestry and fishing 5,349 5,517 5,699 6,020
Mining and quarrying (includescrude oil and natural gas) 507,824 485,469 273,078 200,672
Manufacturing 46,174 51,900 50,324 50,587
Electricity, gas, and watersupply; waste management 21,622 23,765 29,831 32,671
Construction 78,133 83,812 88,782 91,722
Wholesale and retail trade;repair of motor vehicles andmotorcycles
32,351 37,187 41,038 42,917
Transportation and storage 32,706 36,166 37,065 39,951
Accommodation and foodservices 8,215 9,013 9,244 9,572
Information and communication 18,550 20,643 21,293 22,211
Financial and insurance 50,847 61,331 68,555 71,397
Real estate 29,172 35,972 41,177 44,512
Professional, scientific andtechnical 17,663 18,545 19,016 19,828
Administrative and supportservices 9,267 10,173 10,811 11,391
Public administration anddefence; compulsory socialsecurity
48,016 51,620 52,383 52,972
Education 10,226 11,463 11,719 12,263
Human health and social work 10,213 11,224 11,604 12,378
Arts, recreation and otherservices 2,228 2,294 2,381 2,537
Activities of households asemployers 3,216 4,052 4,502 4,918
Source: Statistics Centre - Abu Dhabi* Preliminary estimatesNote: According to the System of National Accounts 2008, the Imputed Bank Service charge was distributed to economicactivities
16 | Statistical Yearbook of Abu Dhabi 2017
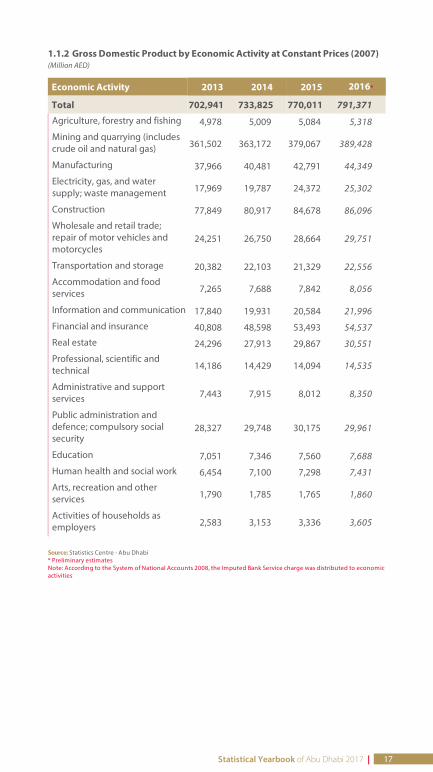
1.1.2 Gross Domestic Product by Economic Activity at Constant Prices (2007)(Million AED)
Economic Activity 2013 2014 2015 2016*
Total 702,941 733,825 770,011 791,371
Agriculture, forestry and fishing 4,978 5,009 5,084 5,318
Mining and quarrying (includescrude oil and natural gas) 361,502 363,172 379,067 389,428
Manufacturing 37,966 40,481 42,791 44,349
Electricity, gas, and watersupply; waste management 17,969 19,787 24,372 25,302
Construction 77,849 80,917 84,678 86,096
Wholesale and retail trade;repair of motor vehicles andmotorcycles
24,251 26,750 28,664 29,751
Transportation and storage 20,382 22,103 21,329 22,556
Accommodation and foodservices 7,265 7,688 7,842 8,056
Information and communication 17,840 19,931 20,584 21,996
Financial and insurance 40,808 48,598 53,493 54,537
Real estate 24,296 27,913 29,867 30,551
Professional, scientific andtechnical 14,186 14,429 14,094 14,535
Administrative and supportservices 7,443 7,915 8,012 8,350
Public administration anddefence; compulsory socialsecurity
28,327 29,748 30,175 29,961
Education 7,051 7,346 7,560 7,688
Human health and social work 6,454 7,100 7,298 7,431
Arts, recreation and otherservices 1,790 1,785 1,765 1,860
Activities of households asemployers 2,583 3,153 3,336 3,605
Source: Statistics Centre - Abu Dhabi* Preliminary estimatesNote: According to the System of National Accounts 2008, the Imputed Bank Service charge was distributed to economicactivities
Statistical Yearbook of Abu Dhabi 2017 | 17
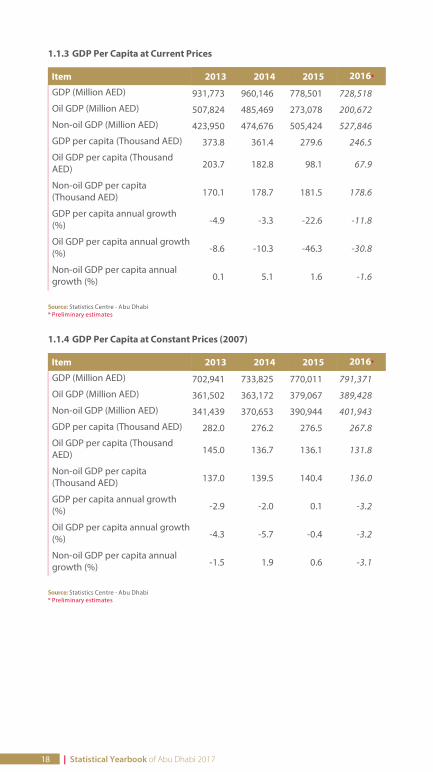
1.1.3 GDP Per Capita at Current Prices
Item 2013 2014 2015 2016*
GDP (Million AED) 931,773 960,146 778,501 728,518
Oil GDP (Million AED) 507,824 485,469 273,078 200,672
Non-oil GDP (Million AED) 423,950 474,676 505,424 527,846
GDP per capita (Thousand AED) 373.8 361.4 279.6 246.5
Oil GDP per capita (ThousandAED) 203.7 182.8 98.1 67.9
Non-oil GDP per capita(Thousand AED) 170.1 178.7 181.5 178.6
GDP per capita annual growth(%) -4.9 -3.3 -22.6 -11.8
Oil GDP per capita annual growth(%) -8.6 -10.3 -46.3 -30.8
Non-oil GDP per capita annualgrowth (%) 0.1 5.1 1.6 -1.6
Source: Statistics Centre - Abu Dhabi* Preliminary estimates
1.1.4 GDP Per Capita at Constant Prices (2007)
Item 2013 2014 2015 2016*
GDP (Million AED) 702,941 733,825 770,011 791,371
Oil GDP (Million AED) 361,502 363,172 379,067 389,428
Non-oil GDP (Million AED) 341,439 370,653 390,944 401,943
GDP per capita (Thousand AED) 282.0 276.2 276.5 267.8
Oil GDP per capita (ThousandAED) 145.0 136.7 136.1 131.8
Non-oil GDP per capita(Thousand AED) 137.0 139.5 140.4 136.0
GDP per capita annual growth(%) -2.9 -2.0 0.1 -3.2
Oil GDP per capita annual growth(%) -4.3 -5.7 -0.4 -3.2
Non-oil GDP per capita annualgrowth (%) -1.5 1.9 0.6 -3.1
Source: Statistics Centre - Abu Dhabi* Preliminary estimates
18 | Statistical Yearbook of Abu Dhabi 2017
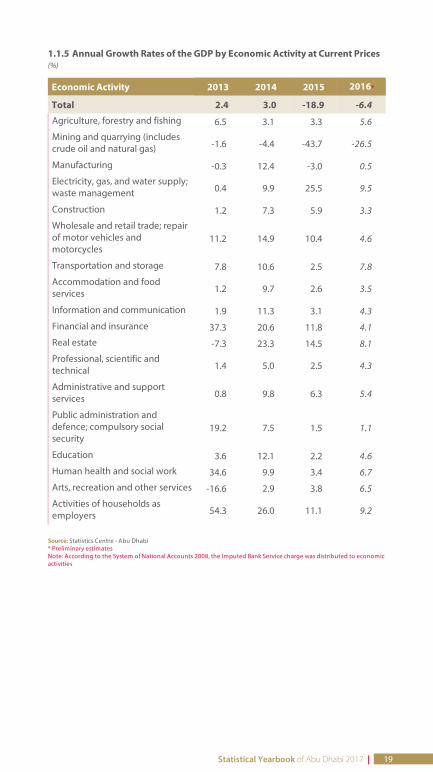
1.1.5 Annual Growth Rates of the GDP by Economic Activity at Current Prices(%)
Economic Activity 2013 2014 2015 2016*
Total 2.4 3.0 -18.9 -6.4
Agriculture, forestry and fishing 6.5 3.1 3.3 5.6
Mining and quarrying (includescrude oil and natural gas) -1.6 -4.4 -43.7 -26.5
Manufacturing -0.3 12.4 -3.0 0.5
Electricity, gas, and water supply;waste management 0.4 9.9 25.5 9.5
Construction 1.2 7.3 5.9 3.3
Wholesale and retail trade; repairof motor vehicles andmotorcycles
11.2 14.9 10.4 4.6
Transportation and storage 7.8 10.6 2.5 7.8
Accommodation and foodservices 1.2 9.7 2.6 3.5
Information and communication 1.9 11.3 3.1 4.3
Financial and insurance 37.3 20.6 11.8 4.1
Real estate -7.3 23.3 14.5 8.1
Professional, scientific andtechnical 1.4 5.0 2.5 4.3
Administrative and supportservices 0.8 9.8 6.3 5.4
Public administration anddefence; compulsory socialsecurity
19.2 7.5 1.5 1.1
Education 3.6 12.1 2.2 4.6
Human health and social work 34.6 9.9 3.4 6.7
Arts, recreation and other services -16.6 2.9 3.8 6.5
Activities of households asemployers 54.3 26.0 11.1 9.2
Source: Statistics Centre - Abu Dhabi* Preliminary estimatesNote: According to the System of National Accounts 2008, the Imputed Bank Service charge was distributed to economicactivities
Statistical Yearbook of Abu Dhabi 2017 | 19
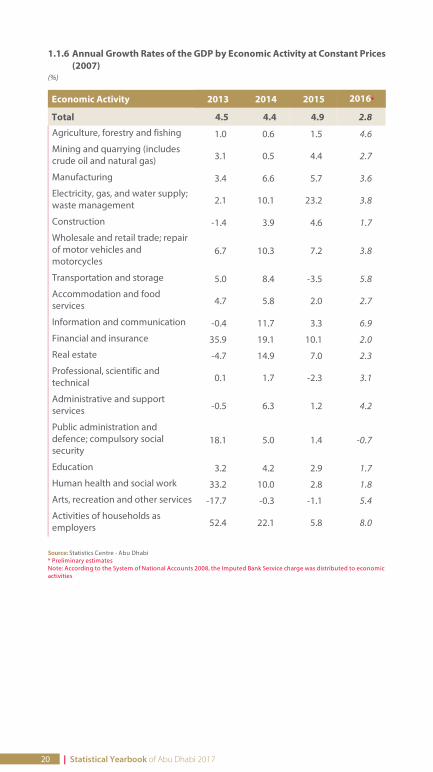
1.1.6 Annual Growth Rates of the GDP by Economic Activity at Constant Prices(2007)
(%)
Economic Activity 2013 2014 2015 2016*
Total 4.5 4.4 4.9 2.8
Agriculture, forestry and fishing 1.0 0.6 1.5 4.6
Mining and quarrying (includescrude oil and natural gas) 3.1 0.5 4.4 2.7
Manufacturing 3.4 6.6 5.7 3.6
Electricity, gas, and water supply;waste management 2.1 10.1 23.2 3.8
Construction -1.4 3.9 4.6 1.7
Wholesale and retail trade; repairof motor vehicles andmotorcycles
6.7 10.3 7.2 3.8
Transportation and storage 5.0 8.4 -3.5 5.8
Accommodation and foodservices 4.7 5.8 2.0 2.7
Information and communication -0.4 11.7 3.3 6.9
Financial and insurance 35.9 19.1 10.1 2.0
Real estate -4.7 14.9 7.0 2.3
Professional, scientific andtechnical 0.1 1.7 -2.3 3.1
Administrative and supportservices -0.5 6.3 1.2 4.2
Public administration anddefence; compulsory socialsecurity
18.1 5.0 1.4 -0.7
Education 3.2 4.2 2.9 1.7
Human health and social work 33.2 10.0 2.8 1.8
Arts, recreation and other services -17.7 -0.3 -1.1 5.4
Activities of households asemployers 52.4 22.1 5.8 8.0
Source: Statistics Centre - Abu Dhabi* Preliminary estimatesNote: According to the System of National Accounts 2008, the Imputed Bank Service charge was distributed to economicactivities
20 | Statistical Yearbook of Abu Dhabi 2017

1.1.7 Percentage Distribution of the GDP by Economic Activity at CurrentPrices
(%)
Economic Activity 2013 2014 2015 2016*
Total 100 100 100 100
Agriculture, forestry and fishing 0.6 0.6 0.7 0.8
Mining and quarrying (includescrude oil and natural gas) 54.5 50.6 35.1 27.5
Manufacturing 5.0 5.4 6.5 6.9
Electricity, gas, and water supply;waste management 2.3 2.5 3.8 4.5
Construction 8.4 8.7 11.4 12.6
Wholesale and retail trade; repairof motor vehicles andmotorcycles
3.5 3.9 5.3 5.9
Transportation and storage 3.5 3.8 4.8 5.5
Accommodation and foodservices 0.9 0.9 1.2 1.3
Information and communication 2.0 2.1 2.7 3.0
Financial and insurance 5.5 6.4 8.8 9.8
Real estate 3.1 3.7 5.3 6.1
Professional, scientific andtechnical 1.9 1.9 2.4 2.7
Administrative and supportservices 1.0 1.1 1.4 1.6
Public administration anddefence; compulsory socialsecurity
5.2 5.4 6.7 7.3
Education 1.1 1.2 1.5 1.7
Human health and social work 1.1 1.2 1.5 1.7
Arts, recreation and other services 0.2 0.2 0.3 0.3
Activities of households asemployers 0.3 0.4 0.6 0.7
Source: Statistics Centre - Abu Dhabi* Preliminary estimatesNote: According to the System of National Accounts 2008, the Imputed Bank Service charge was distributed to economicactivities
Statistical Yearbook of Abu Dhabi 2017 | 21
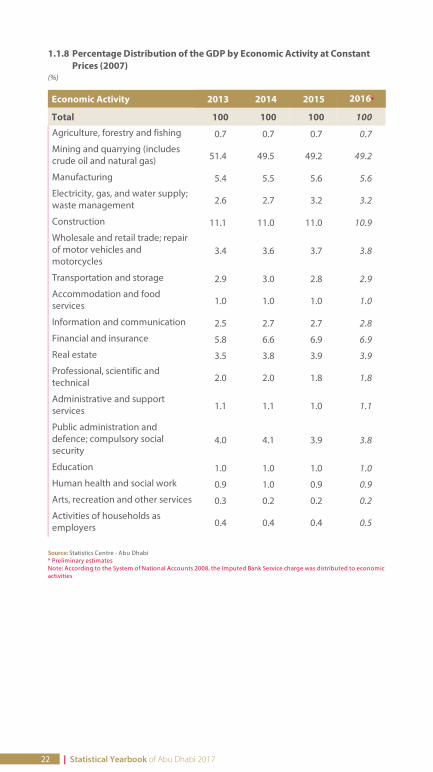
1.1.8 Percentage Distribution of the GDP by Economic Activity at ConstantPrices (2007)
(%)
Economic Activity 2013 2014 2015 2016*
Total 100 100 100 100
Agriculture, forestry and fishing 0.7 0.7 0.7 0.7
Mining and quarrying (includescrude oil and natural gas) 51.4 49.5 49.2 49.2
Manufacturing 5.4 5.5 5.6 5.6
Electricity, gas, and water supply;waste management 2.6 2.7 3.2 3.2
Construction 11.1 11.0 11.0 10.9
Wholesale and retail trade; repairof motor vehicles andmotorcycles
3.4 3.6 3.7 3.8
Transportation and storage 2.9 3.0 2.8 2.9
Accommodation and foodservices 1.0 1.0 1.0 1.0
Information and communication 2.5 2.7 2.7 2.8
Financial and insurance 5.8 6.6 6.9 6.9
Real estate 3.5 3.8 3.9 3.9
Professional, scientific andtechnical 2.0 2.0 1.8 1.8
Administrative and supportservices 1.1 1.1 1.0 1.1
Public administration anddefence; compulsory socialsecurity
4.0 4.1 3.9 3.8
Education 1.0 1.0 1.0 1.0
Human health and social work 0.9 1.0 0.9 0.9
Arts, recreation and other services 0.3 0.2 0.2 0.2
Activities of households asemployers 0.4 0.4 0.4 0.5
Source: Statistics Centre - Abu Dhabi* Preliminary estimatesNote: According to the System of National Accounts 2008, the Imputed Bank Service charge was distributed to economicactivities
22 | Statistical Yearbook of Abu Dhabi 2017
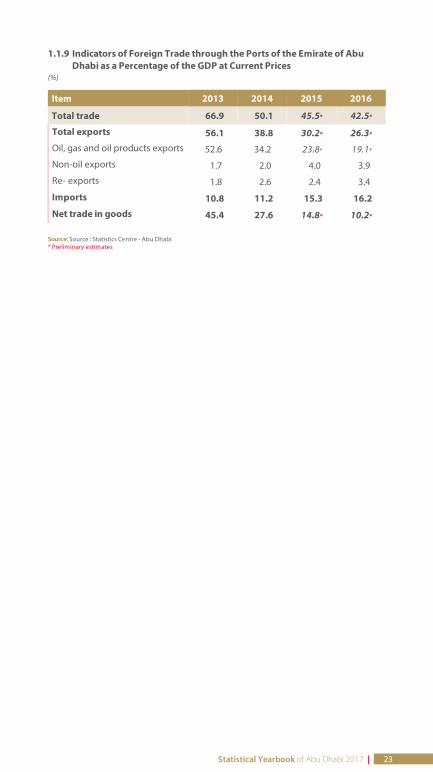
1.1.9 Indicators of Foreign Trade through the Ports of the Emirate of AbuDhabi as a Percentage of the GDP at Current Prices
(%)
Item 2013 2014 2015 2016
Total trade 66.9 50.1 45.5* 42.5*
Total exports 56.1 38.8 30.2* 26.3* Oil, gas and oil products exports 52.6 34.2 23.8* 19.1*
Non-oil exports 1.7 2.0 4.0 3.9
Re- exports 1.8 2.6 2.4 3.4
Imports 10.8 11.2 15.3 16.2
Net trade in goods 45.4 27.6 14.8* 10.2*
Source: Source : Statistics Centre - Abu Dhabi* Preliminary estimates
Statistical Yearbook of Abu Dhabi 2017 | 23
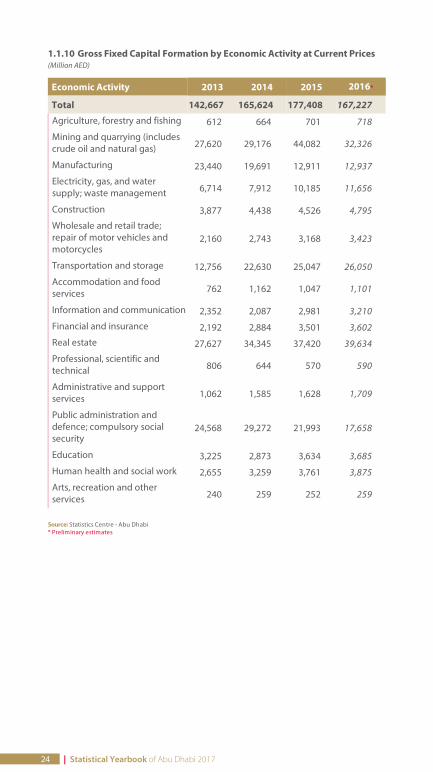
1.1.10 Gross Fixed Capital Formation by Economic Activity at Current Prices(Million AED)
Economic Activity 2013 2014 2015 2016*
Total 142,667 165,624 177,408 167,227
Agriculture, forestry and fishing 612 664 701 718
Mining and quarrying (includescrude oil and natural gas) 27,620 29,176 44,082 32,326
Manufacturing 23,440 19,691 12,911 12,937
Electricity, gas, and watersupply; waste management 6,714 7,912 10,185 11,656
Construction 3,877 4,438 4,526 4,795
Wholesale and retail trade;repair of motor vehicles andmotorcycles
2,160 2,743 3,168 3,423
Transportation and storage 12,756 22,630 25,047 26,050
Accommodation and foodservices 762 1,162 1,047 1,101
Information and communication 2,352 2,087 2,981 3,210
Financial and insurance 2,192 2,884 3,501 3,602
Real estate 27,627 34,345 37,420 39,634
Professional, scientific andtechnical 806 644 570 590
Administrative and supportservices 1,062 1,585 1,628 1,709
Public administration anddefence; compulsory socialsecurity
24,568 29,272 21,993 17,658
Education 3,225 2,873 3,634 3,685
Human health and social work 2,655 3,259 3,761 3,875
Arts, recreation and otherservices 240 259 252 259
Source: Statistics Centre - Abu Dhabi* Preliminary estimates
24 | Statistical Yearbook of Abu Dhabi 2017

1.1.11 Percentage Distribution of Gross Fixed Capital Formation by EconomicActivity at Current Prices
(%)
Economic Activity 2013 2014 2015 2016*
Total 100 100 100 100
Agriculture, forestry and fishing 0.4 0.4 0.4 0.4
Mining and quarrying (includescrude oil and natural gas) 19.4 17.6 24.8 19.3
Manufacturing 16.4 11.9 7.3 7.7
Electricity, gas, and water supply;waste management 4.7 4.8 5.7 7.0
Construction 2.7 2.7 2.6 2.9
Wholesale and retail trade; repairof motor vehicles andmotorcycles
1.5 1.7 1.8 2.0
Transportation and storage 8.9 13.7 14.1 15.6
Accommodation and foodservices 0.5 0.7 0.6 0.7
Information and communication 1.6 1.3 1.7 1.9
Financial and insurance 1.5 1.7 2.0 2.2
Real estate 19.4 20.7 21.1 23.7
Professional, scientific andtechnical 0.6 0.4 0.3 0.4
Administrative and supportservices 0.7 1.0 0.9 1.0
Public administration anddefence; compulsory socialsecurity
17.2 17.7 12.4 10.6
Education 2.3 1.7 2.0 2.2
Human health and social work 1.9 2.0 2.1 2.3
Arts, recreation and other services 0.2 0.2 0.1 0.2
Source: Statistics Centre - Abu Dhabi* Preliminary estimates
Statistical Yearbook of Abu Dhabi 2017 | 25
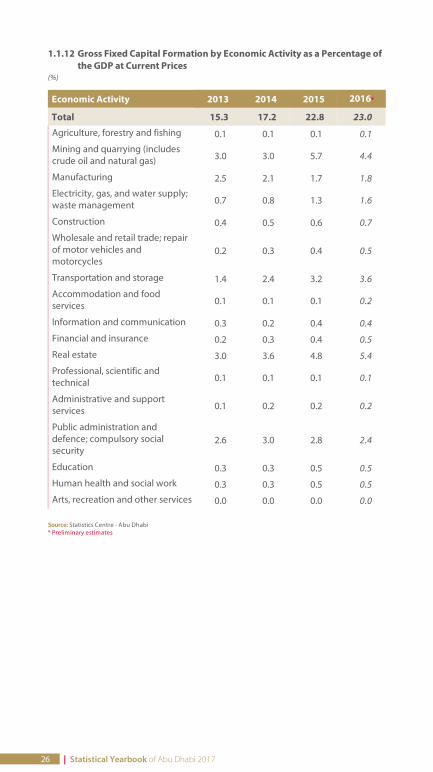
1.1.12 Gross Fixed Capital Formation by Economic Activity as a Percentage ofthe GDP at Current Prices
(%)
Economic Activity 2013 2014 2015 2016*
Total 15.3 17.2 22.8 23.0
Agriculture, forestry and fishing 0.1 0.1 0.1 0.1
Mining and quarrying (includescrude oil and natural gas) 3.0 3.0 5.7 4.4
Manufacturing 2.5 2.1 1.7 1.8
Electricity, gas, and water supply;waste management 0.7 0.8 1.3 1.6
Construction 0.4 0.5 0.6 0.7
Wholesale and retail trade; repairof motor vehicles andmotorcycles
0.2 0.3 0.4 0.5
Transportation and storage 1.4 2.4 3.2 3.6
Accommodation and foodservices 0.1 0.1 0.1 0.2
Information and communication 0.3 0.2 0.4 0.4
Financial and insurance 0.2 0.3 0.4 0.5
Real estate 3.0 3.6 4.8 5.4
Professional, scientific andtechnical 0.1 0.1 0.1 0.1
Administrative and supportservices 0.1 0.2 0.2 0.2
Public administration anddefence; compulsory socialsecurity
2.6 3.0 2.8 2.4
Education 0.3 0.3 0.5 0.5
Human health and social work 0.3 0.3 0.5 0.5
Arts, recreation and other services 0.0 0.0 0.0 0.0
Source: Statistics Centre - Abu Dhabi* Preliminary estimates
26 | Statistical Yearbook of Abu Dhabi 2017
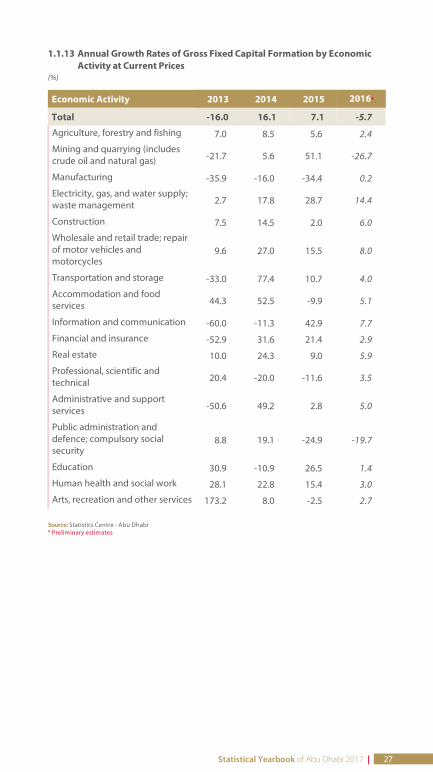
1.1.13 Annual Growth Rates of Gross Fixed Capital Formation by EconomicActivity at Current Prices
(%)
Economic Activity 2013 2014 2015 2016*
Total -16.0 16.1 7.1 -5.7
Agriculture, forestry and fishing 7.0 8.5 5.6 2.4
Mining and quarrying (includescrude oil and natural gas) -21.7 5.6 51.1 -26.7
Manufacturing -35.9 -16.0 -34.4 0.2
Electricity, gas, and water supply;waste management 2.7 17.8 28.7 14.4
Construction 7.5 14.5 2.0 6.0
Wholesale and retail trade; repairof motor vehicles andmotorcycles
9.6 27.0 15.5 8.0
Transportation and storage -33.0 77.4 10.7 4.0
Accommodation and foodservices 44.3 52.5 -9.9 5.1
Information and communication -60.0 -11.3 42.9 7.7
Financial and insurance -52.9 31.6 21.4 2.9
Real estate 10.0 24.3 9.0 5.9
Professional, scientific andtechnical 20.4 -20.0 -11.6 3.5
Administrative and supportservices -50.6 49.2 2.8 5.0
Public administration anddefence; compulsory socialsecurity
8.8 19.1 -24.9 -19.7
Education 30.9 -10.9 26.5 1.4
Human health and social work 28.1 22.8 15.4 3.0
Arts, recreation and other services 173.2 8.0 -2.5 2.7
Source: Statistics Centre - Abu Dhabi* Preliminary estimates
Statistical Yearbook of Abu Dhabi 2017 | 27
1.2. Merchandise Foreign TradeForeign trade in goods is of paramount importance to the economy of theEmirate of Abu Dhabi and contribute to a considerable proportion of theEmirate's GDP. In 2016, net trade in goods accounted for 10.2% of the GDP,reflection the contribution of foreign trade to the economy in general.
The non-oil merchandise trade statistics presented in this section comprisestrade in goods which entered or exited the territory of the Emirate of AbuDhabi through the ports of Abu Dhabi (comprising air, sea and road ports). Itshould be noted that foreign trade data presented in this report do notcover non-oil exports, re-exports and imports through ports of the otherEmirates in the UAE.
Commodity imports in goods through the ports of the Emirate Abu Dhabiwere valued at AED 117.8 billion in 2016 compared with AED 119.3 billion in2015. The main imports during 2016 were 'Machinery, sound recorder,reproducers and parts', which accounted for 27.7% of the total value. TheUnited States of America was the main country for imports, from which theEmirate received goods worth AED 21.7 billion. Non-oil exports were valuedat AED 28.1 billion, with Plastic, rubber and articles thereof' contributing47.7% of the total. China was the top destination of Abu Dhabi non-oilexports, receiving goods worth AED 5.2 billion from the Emirate in 2016.
Re-exports in 2016 were valued at AED 24.8 billion compared with AED 18.8billion in 2015. The top category during 2016 was 'Machinery, soundrecorders, reproducers and parts', which contributed 26.7% of the re-exportstotal. The Saudi Arabia was the top country destination for re-exports withgoods valued at AED 3.0 billion.The value of imports in goods from Asiancountries through the ports of the Emirate of Abu Dhabi was AED 55.2 billionduring 2016 compared with AED 52.1 billion in 2015. The value of non-oilexports in goods to Asian countries through the ports of the Emirate of AbuDhabi was AED 21.1 billion while re-exports to Asian countries amounted toAED 19.8 billion.
28 | Statistical Yearbook of Abu Dhabi 2017
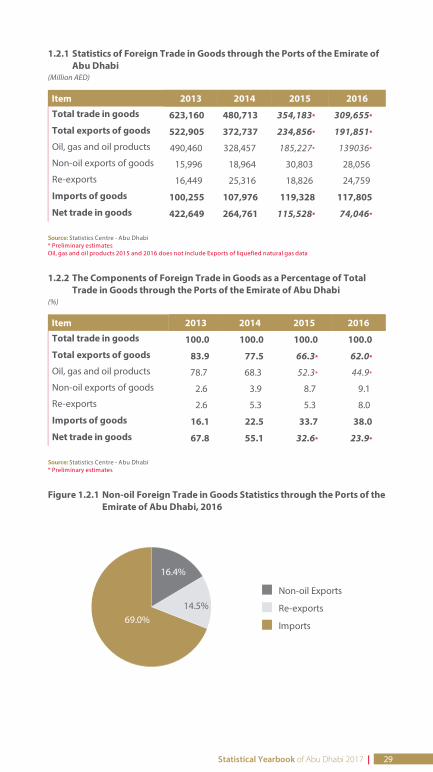
1.2.1 Statistics of Foreign Trade in Goods through the Ports of the Emirate ofAbu Dhabi
(Million AED)
Item 2013 2014 2015 2016
Total trade in goods 623,160 480,713 354,183* 309,655*
Total exports of goods 522,905 372,737 234,856* 191,851* Oil, gas and oil products 490,460 328,457 185,227* 139036*
Non-oil exports of goods 15,996 18,964 30,803 28,056
Re-exports 16,449 25,316 18,826 24,759
Imports of goods 100,255 107,976 119,328 117,805
Net trade in goods 422,649 264,761 115,528* 74,046*
Source: Statistics Centre - Abu Dhabi* Preliminary estimatesOil, gas and oil products 2015 and 2016 does not include Exports of liquefied natural gas data
1.2.2 The Components of Foreign Trade in Goods as a Percentage of TotalTrade in Goods through the Ports of the Emirate of Abu Dhabi
(%)
Item 2013 2014 2015 2016
Total trade in goods 100.0 100.0 100.0 100.0
Total exports of goods 83.9 77.5 66.3* 62.0* Oil, gas and oil products 78.7 68.3 52.3* 44.9*
Non-oil exports of goods 2.6 3.9 8.7 9.1
Re-exports 2.6 5.3 5.3 8.0
Imports of goods 16.1 22.5 33.7 38.0
Net trade in goods 67.8 55.1 32.6* 23.9*
Source: Statistics Centre - Abu Dhabi* Preliminary estimates
Figure 1.2.1 Non-oil Foreign Trade in Goods Statistics through the Ports of theEmirate of Abu Dhabi, 2016
. Non-oil Exports
. Re-exports
. Imports
16.4%
14.5%69.0%
Statistical Yearbook of Abu Dhabi 2017 | 29
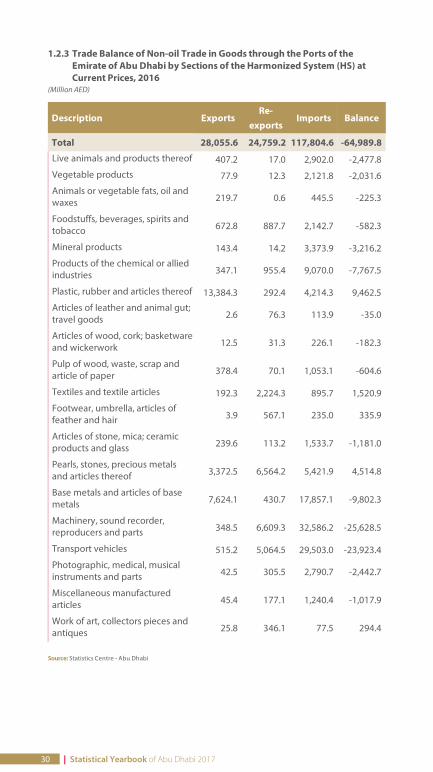
1.2.3 Trade Balance of Non-oil Trade in Goods through the Ports of theEmirate of Abu Dhabi by Sections of the Harmonized System (HS) atCurrent Prices, 2016
(Million AED)
Description ExportsRe-
exportsImports Balance
Total 28,055.6 24,759.2 117,804.6 -64,989.8
Live animals and products thereof 407.2 17.0 2,902.0 -2,477.8
Vegetable products 77.9 12.3 2,121.8 -2,031.6
Animals or vegetable fats, oil andwaxes 219.7 0.6 445.5 -225.3
Foodstuffs, beverages, spirits andtobacco 672.8 887.7 2,142.7 -582.3
Mineral products 143.4 14.2 3,373.9 -3,216.2
Products of the chemical or alliedindustries 347.1 955.4 9,070.0 -7,767.5
Plastic, rubber and articles thereof 13,384.3 292.4 4,214.3 9,462.5
Articles of leather and animal gut;travel goods 2.6 76.3 113.9 -35.0
Articles of wood, cork; basketwareand wickerwork 12.5 31.3 226.1 -182.3
Pulp of wood, waste, scrap andarticle of paper 378.4 70.1 1,053.1 -604.6
Textiles and textile articles 192.3 2,224.3 895.7 1,520.9
Footwear, umbrella, articles offeather and hair 3.9 567.1 235.0 335.9
Articles of stone, mica; ceramicproducts and glass 239.6 113.2 1,533.7 -1,181.0
Pearls, stones, precious metalsand articles thereof 3,372.5 6,564.2 5,421.9 4,514.8
Base metals and articles of basemetals 7,624.1 430.7 17,857.1 -9,802.3
Machinery, sound recorder,reproducers and parts 348.5 6,609.3 32,586.2 -25,628.5
Transport vehicles 515.2 5,064.5 29,503.0 -23,923.4
Photographic, medical, musicalinstruments and parts 42.5 305.5 2,790.7 -2,442.7
Miscellaneous manufacturedarticles 45.4 177.1 1,240.4 -1,017.9
Work of art, collectors pieces andantiques 25.8 346.1 77.5 294.4
Source: Statistics Centre - Abu Dhabi
30 | Statistical Yearbook of Abu Dhabi 2017
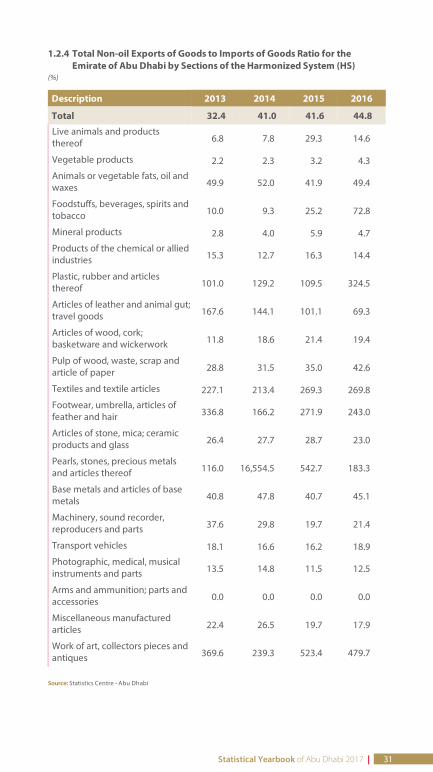
1.2.4 Total Non-oil Exports of Goods to Imports of Goods Ratio for theEmirate of Abu Dhabi by Sections of the Harmonized System (HS)
(%)
Description 2013 2014 2015 2016
Total 32.4 41.0 41.6 44.8
Live animals and productsthereof 6.8 7.8 29.3 14.6
Vegetable products 2.2 2.3 3.2 4.3
Animals or vegetable fats, oil andwaxes 49.9 52.0 41.9 49.4
Foodstuffs, beverages, spirits andtobacco 10.0 9.3 25.2 72.8
Mineral products 2.8 4.0 5.9 4.7
Products of the chemical or alliedindustries 15.3 12.7 16.3 14.4
Plastic, rubber and articlesthereof 101.0 129.2 109.5 324.5
Articles of leather and animal gut;travel goods 167.6 144.1 101.1 69.3
Articles of wood, cork;basketware and wickerwork 11.8 18.6 21.4 19.4
Pulp of wood, waste, scrap andarticle of paper 28.8 31.5 35.0 42.6
Textiles and textile articles 227.1 213.4 269.3 269.8
Footwear, umbrella, articles offeather and hair 336.8 166.2 271.9 243.0
Articles of stone, mica; ceramicproducts and glass 26.4 27.7 28.7 23.0
Pearls, stones, precious metalsand articles thereof 116.0 16,554.5 542.7 183.3
Base metals and articles of basemetals 40.8 47.8 40.7 45.1
Machinery, sound recorder,reproducers and parts 37.6 29.8 19.7 21.4
Transport vehicles 18.1 16.6 16.2 18.9
Photographic, medical, musicalinstruments and parts 13.5 14.8 11.5 12.5
Arms and ammunition; parts andaccessories 0.0 0.0 0.0 0.0
Miscellaneous manufacturedarticles 22.4 26.5 19.7 17.9
Work of art, collectors pieces andantiques 369.6 239.3 523.4 479.7
Source: Statistics Centre - Abu Dhabi
Statistical Yearbook of Abu Dhabi 2017 | 31
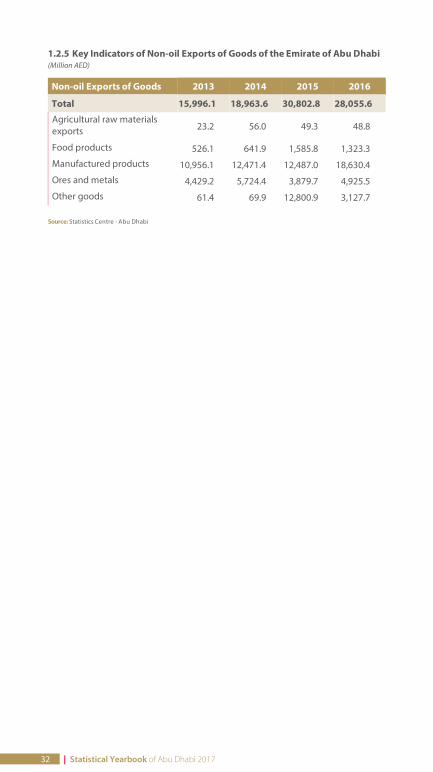
1.2.5 Key Indicators of Non-oil Exports of Goods of the Emirate of Abu Dhabi(Million AED)
Non-oil Exports of Goods 2013 2014 2015 2016
Total 15,996.1 18,963.6 30,802.8 28,055.6
Agricultural raw materialsexports 23.2 56.0 49.3 48.8
Food products 526.1 641.9 1,585.8 1,323.3
Manufactured products 10,956.1 12,471.4 12,487.0 18,630.4
Ores and metals 4,429.2 5,724.4 3,879.7 4,925.5
Other goods 61.4 69.9 12,800.9 3,127.7
Source: Statistics Centre - Abu Dhabi
32 | Statistical Yearbook of Abu Dhabi 2017
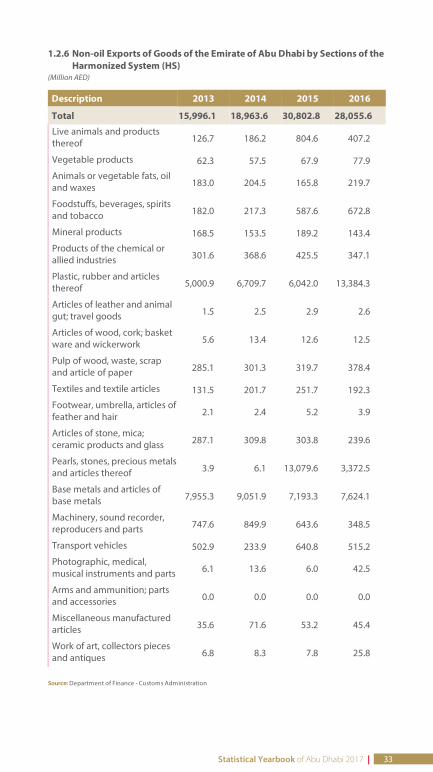
1.2.6 Non-oil Exports of Goods of the Emirate of Abu Dhabi by Sections of theHarmonized System (HS)
(Million AED)
Description 2013 2014 2015 2016
Total 15,996.1 18,963.6 30,802.8 28,055.6
Live animals and productsthereof 126.7 186.2 804.6 407.2
Vegetable products 62.3 57.5 67.9 77.9
Animals or vegetable fats, oiland waxes 183.0 204.5 165.8 219.7
Foodstuffs, beverages, spiritsand tobacco 182.0 217.3 587.6 672.8
Mineral products 168.5 153.5 189.2 143.4
Products of the chemical orallied industries 301.6 368.6 425.5 347.1
Plastic, rubber and articlesthereof 5,000.9 6,709.7 6,042.0 13,384.3
Articles of leather and animalgut; travel goods 1.5 2.5 2.9 2.6
Articles of wood, cork; basketware and wickerwork 5.6 13.4 12.6 12.5
Pulp of wood, waste, scrapand article of paper 285.1 301.3 319.7 378.4
Textiles and textile articles 131.5 201.7 251.7 192.3
Footwear, umbrella, articles offeather and hair 2.1 2.4 5.2 3.9
Articles of stone, mica;ceramic products and glass 287.1 309.8 303.8 239.6
Pearls, stones, precious metalsand articles thereof 3.9 6.1 13,079.6 3,372.5
Base metals and articles ofbase metals 7,955.3 9,051.9 7,193.3 7,624.1
Machinery, sound recorder,reproducers and parts 747.6 849.9 643.6 348.5
Transport vehicles 502.9 233.9 640.8 515.2
Photographic, medical,musical instruments and parts 6.1 13.6 6.0 42.5
Arms and ammunition; partsand accessories 0.0 0.0 0.0 0.0
Miscellaneous manufacturedarticles 35.6 71.6 53.2 45.4
Work of art, collectors piecesand antiques 6.8 8.3 7.8 25.8
Source: Department of Finance - Customs Administration
Statistical Yearbook of Abu Dhabi 2017 | 33

1.2.7 Non-oil Exports by Utilization of Items of the Emirate of Abu Dhabi(Million AED)
Non-oil Exports of Goods 2013 2014 2015 2016
Total 15,996.1 18,963.6 30,802.8 28,055.6
Capital goods 822.7 797.3 1,109.4 479.6
Intermediate goods 14,281.1 17,274.8 27,167.2 24,880.2
Final consumption goods 892.3 891.5 2,526.2 2,695.8
Source: Statistics Centre - Abu Dhabi
1.2.8 Non-oil Exports of Goods of the Emirate of Abu Dhabi by Continent(Million AED)
Continent2015 2016
Value % Value %
Total 30,802.8 100.0 28,055.6 100.0
Asia 20,949.8 68.0 21,102.5 75.2
Europe 8,090.3 26.3 3,730.2 13.3
Africa 1,123.4 3.6 2,267.3 8.1
Northern America 492.2 1.6 843.7 3.0
Australia and Oceania 106.9 0.3 83.2 0.3
South America 40.1 0.1 28.7 0.1
Source: Statistics Centre - Abu Dhabi
1.2.9 Top Trade in Goods Partners of the Emirate of Abu Dhabi (Non-oilExports)
(Million AED)
Countries2015 2016
Value % Value %
Total 30,802.8 100.0 28,055.6 100.0
China 2,649.4 8.6 5,186.3 18.5
Saudi Arabia 9,035.5 29.3 3,920.2 14.0
India 979.3 3.2 2,631.5 9.4
Switzerland 6,559.8 21.3 2,240.0 8.0
Singapore 1,118.7 3.6 1,857.1 6.6
Qatar 1,446.5 4.7 1,684.1 6.0
Pakistan 196.8 0.6 1,011.7 3.6
Arab Republic of Egypt 501.9 1.6 966.8 3.4
Oman 983.7 3.2 950.6 3.4
Kuwait 1,354.9 4.4 905.2 3.2
Others 5,976.2 19.4 6,702.2 23.9
Source: Department of Finance - Customs Administration
34 | Statistical Yearbook of Abu Dhabi 2017
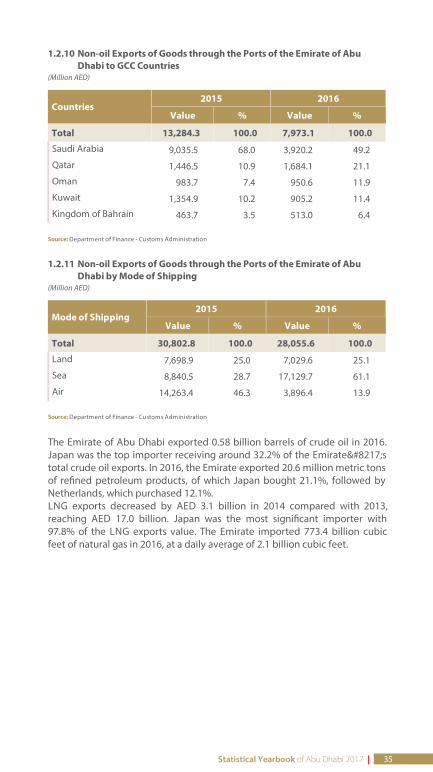
1.2.10 Non-oil Exports of Goods through the Ports of the Emirate of AbuDhabi to GCC Countries
(Million AED)
Countries2015 2016
Value % Value %
Total 13,284.3 100.0 7,973.1 100.0
Saudi Arabia 9,035.5 68.0 3,920.2 49.2
Qatar 1,446.5 10.9 1,684.1 21.1
Oman 983.7 7.4 950.6 11.9
Kuwait 1,354.9 10.2 905.2 11.4
Kingdom of Bahrain 463.7 3.5 513.0 6.4
Source: Department of Finance - Customs Administration
1.2.11 Non-oil Exports of Goods through the Ports of the Emirate of AbuDhabi by Mode of Shipping
(Million AED)
Mode of Shipping2015 2016
Value % Value %
Total 30,802.8 100.0 28,055.6 100.0
Land 7,698.9 25.0 7,029.6 25.1
Sea 8,840.5 28.7 17,129.7 61.1
Air 14,263.4 46.3 3,896.4 13.9
Source: Department of Finance - Customs Administration
The Emirate of Abu Dhabi exported 0.58 billion barrels of crude oil in 2016.Japan was the top importer receiving around 32.2% of the Emirate’stotal crude oil exports. In 2016, the Emirate exported 20.6 million metric tonsof re ned petroleum products, of which Japan bought 21.1%, followed byNetherlands, which purchased 12.1%.LNG exports decreased by AED 3.1 billion in 2014 compared with 2013,reaching AED 17.0 billion. Japan was the most signi cant importer with97.8% of the LNG exports value. The Emirate imported 773.4 billion cubicfeet of natural gas in 2016, at a daily average of 2.1 billion cubic feet.
Statistical Yearbook of Abu Dhabi 2017 | 35
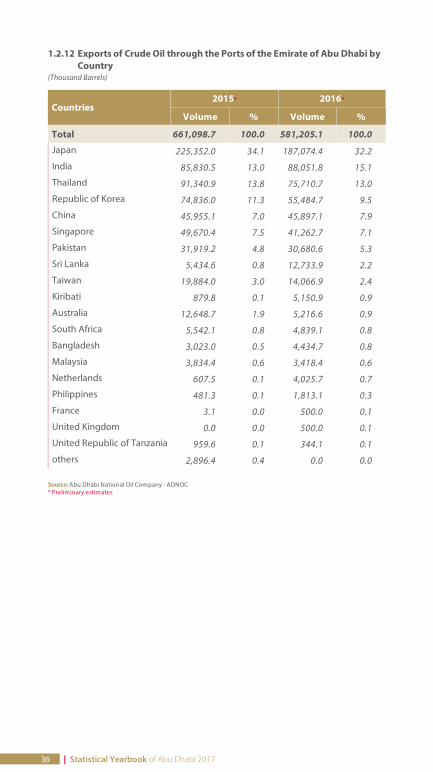
1.2.12 Exports of Crude Oil through the Ports of the Emirate of Abu Dhabi byCountry
(Thousand Barrels)
Countries2015* 2016*
Volume % Volume %
Total 661,098.7 100.0 581,205.1 100.0
Japan 225,352.0 34.1 187,074.4 32.2
India 85,830.5 13.0 88,051.8 15.1
Thailand 91,340.9 13.8 75,710.7 13.0
Republic of Korea 74,836.0 11.3 55,484.7 9.5
China 45,955.1 7.0 45,897.1 7.9
Singapore 49,670.4 7.5 41,262.7 7.1
Pakistan 31,919.2 4.8 30,680.6 5.3
Sri Lanka 5,434.6 0.8 12,733.9 2.2
Taiwan 19,884.0 3.0 14,066.9 2.4
Kiribati 879.8 0.1 5,150.9 0.9
Australia 12,648.7 1.9 5,216.6 0.9
South Africa 5,542.1 0.8 4,839.1 0.8
Bangladesh 3,023.0 0.5 4,434.7 0.8
Malaysia 3,834.4 0.6 3,418.4 0.6
Netherlands 607.5 0.1 4,025.7 0.7
Philippines 481.3 0.1 1,813.1 0.3
France 3.1 0.0 500.0 0.1
United Kingdom 0.0 0.0 500.0 0.1
United Republic of Tanzania 959.6 0.1 344.1 0.1
others 2,896.4 0.4 0.0 0.0
Source: Abu Dhabi National Oil Company - ADNOC* Preliminary estimates
36 | Statistical Yearbook of Abu Dhabi 2017
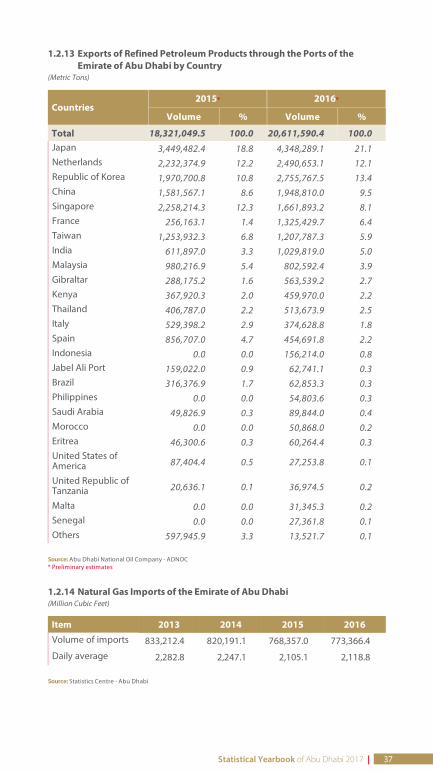
1.2.13 Exports of Refined Petroleum Products through the Ports of theEmirate of Abu Dhabi by Country
(Metric Tons)
Countries2015* 2016*
Volume % Volume %
Total 18,321,049.5 100.0 20,611,590.4 100.0 Japan 3,449,482.4 18.8 4,348,289.1 21.1 Netherlands 2,232,374.9 12.2 2,490,653.1 12.1 Republic of Korea 1,970,700.8 10.8 2,755,767.5 13.4 China 1,581,567.1 8.6 1,948,810.0 9.5 Singapore 2,258,214.3 12.3 1,661,893.2 8.1 France 256,163.1 1.4 1,325,429.7 6.4 Taiwan 1,253,932.3 6.8 1,207,787.3 5.9 India 611,897.0 3.3 1,029,819.0 5.0 Malaysia 980,216.9 5.4 802,592.4 3.9 Gibraltar 288,175.2 1.6 563,539.2 2.7 Kenya 367,920.3 2.0 459,970.0 2.2 Thailand 406,787.0 2.2 513,673.9 2.5 Italy 529,398.2 2.9 374,628.8 1.8 Spain 856,707.0 4.7 454,691.8 2.2 Indonesia 0.0 0.0 156,214.0 0.8 Jabel Ali Port 159,022.0 0.9 62,741.1 0.3 Brazil 316,376.9 1.7 62,853.3 0.3 Philippines 0.0 0.0 54,803.6 0.3 Saudi Arabia 49,826.9 0.3 89,844.0 0.4 Morocco 0.0 0.0 50,868.0 0.2 Eritrea 46,300.6 0.3 60,264.4 0.3 United States ofAmerica 87,404.4 0.5 27,253.8 0.1
United Republic ofTanzania 20,636.1 0.1 36,974.5 0.2
Malta 0.0 0.0 31,345.3 0.2 Senegal 0.0 0.0 27,361.8 0.1 Others 597,945.9 3.3 13,521.7 0.1
Source: Abu Dhabi National Oil Company - ADNOC* Preliminary estimates
1.2.14 Natural Gas Imports of the Emirate of Abu Dhabi(Million Cubic Feet)
Item 2013 2014 2015 2016Volume of imports 833,212.4 820,191.1 768,357.0 773,366.4
Daily average 2,282.8 2,247.1 2,105.1 2,118.8
Source: Statistics Centre - Abu Dhabi
Statistical Yearbook of Abu Dhabi 2017 | 37
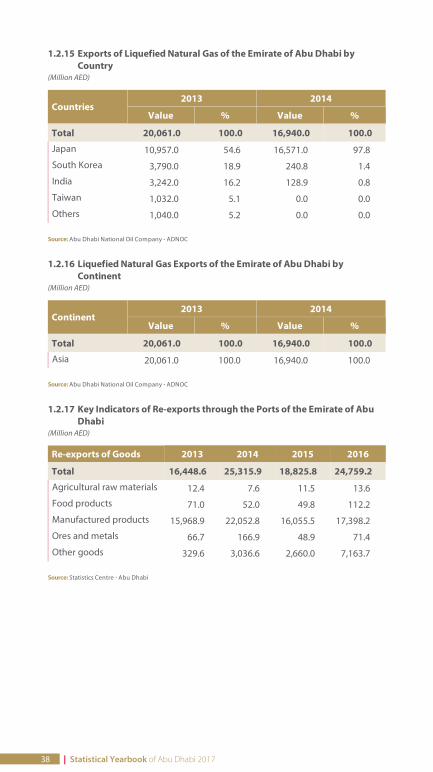
1.2.15 Exports of Liquefied Natural Gas of the Emirate of Abu Dhabi byCountry
(Million AED)
Countries2013 2014
Value % Value %
Total 20,061.0 100.0 16,940.0 100.0
Japan 10,957.0 54.6 16,571.0 97.8
South Korea 3,790.0 18.9 240.8 1.4
India 3,242.0 16.2 128.9 0.8
Taiwan 1,032.0 5.1 0.0 0.0
Others 1,040.0 5.2 0.0 0.0
Source: Abu Dhabi National Oil Company - ADNOC
1.2.16 Liquefied Natural Gas Exports of the Emirate of Abu Dhabi byContinent
(Million AED)
Continent2013 2014
Value % Value %
Total 20,061.0 100.0 16,940.0 100.0
Asia 20,061.0 100.0 16,940.0 100.0
Source: Abu Dhabi National Oil Company - ADNOC
1.2.17 Key Indicators of Re-exports through the Ports of the Emirate of AbuDhabi
(Million AED)
Re-exports of Goods 2013 2014 2015 2016
Total 16,448.6 25,315.9 18,825.8 24,759.2
Agricultural raw materials 12.4 7.6 11.5 13.6
Food products 71.0 52.0 49.8 112.2
Manufactured products 15,968.9 22,052.8 16,055.5 17,398.2
Ores and metals 66.7 166.9 48.9 71.4
Other goods 329.6 3,036.6 2,660.0 7,163.7
Source: Statistics Centre - Abu Dhabi
38 | Statistical Yearbook of Abu Dhabi 2017
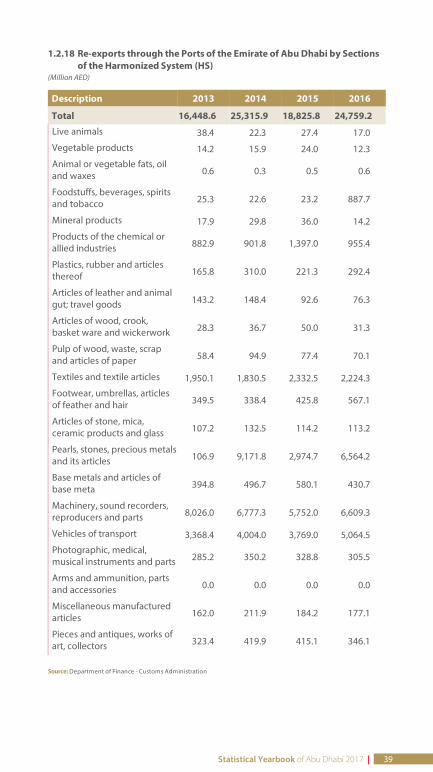
1.2.18 Re-exports through the Ports of the Emirate of Abu Dhabi by Sectionsof the Harmonized System (HS)
(Million AED)
Description 2013 2014 2015 2016
Total 16,448.6 25,315.9 18,825.8 24,759.2
Live animals 38.4 22.3 27.4 17.0
Vegetable products 14.2 15.9 24.0 12.3
Animal or vegetable fats, oiland waxes 0.6 0.3 0.5 0.6
Foodstuffs, beverages, spiritsand tobacco 25.3 22.6 23.2 887.7
Mineral products 17.9 29.8 36.0 14.2
Products of the chemical orallied industries 882.9 901.8 1,397.0 955.4
Plastics, rubber and articlesthereof 165.8 310.0 221.3 292.4
Articles of leather and animalgut; travel goods 143.2 148.4 92.6 76.3
Articles of wood, crook,basket ware and wickerwork 28.3 36.7 50.0 31.3
Pulp of wood, waste, scrapand articles of paper 58.4 94.9 77.4 70.1
Textiles and textile articles 1,950.1 1,830.5 2,332.5 2,224.3
Footwear, umbrellas, articlesof feather and hair 349.5 338.4 425.8 567.1
Articles of stone, mica,ceramic products and glass 107.2 132.5 114.2 113.2
Pearls, stones, precious metalsand its articles 106.9 9,171.8 2,974.7 6,564.2
Base metals and articles ofbase meta 394.8 496.7 580.1 430.7
Machinery, sound recorders,reproducers and parts 8,026.0 6,777.3 5,752.0 6,609.3
Vehicles of transport 3,368.4 4,004.0 3,769.0 5,064.5
Photographic, medical,musical instruments and parts 285.2 350.2 328.8 305.5
Arms and ammunition, partsand accessories 0.0 0.0 0.0 0.0
Miscellaneous manufacturedarticles 162.0 211.9 184.2 177.1
Pieces and antiques, works ofart, collectors 323.4 419.9 415.1 346.1
Source: Department of Finance - Customs Administration
Statistical Yearbook of Abu Dhabi 2017 | 39
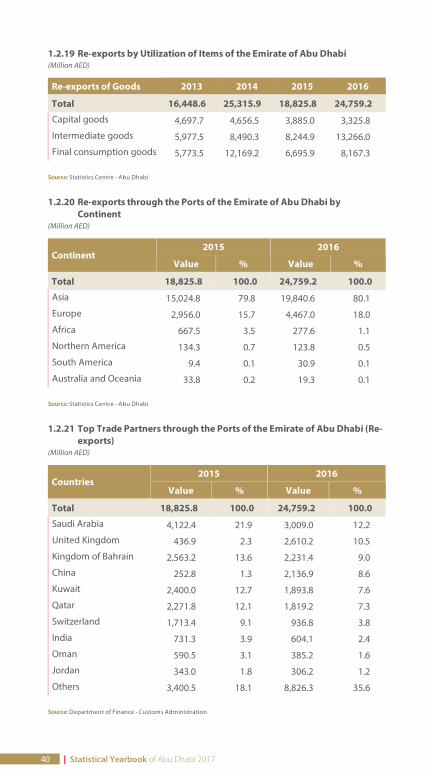
1.2.19 Re-exports by Utilization of Items of the Emirate of Abu Dhabi(Million AED)
Re-exports of Goods 2013 2014 2015 2016
Total 16,448.6 25,315.9 18,825.8 24,759.2
Capital goods 4,697.7 4,656.5 3,885.0 3,325.8
Intermediate goods 5,977.5 8,490.3 8,244.9 13,266.0
Final consumption goods 5,773.5 12,169.2 6,695.9 8,167.3
Source: Statistics Centre - Abu Dhabi
1.2.20 Re-exports through the Ports of the Emirate of Abu Dhabi byContinent
(Million AED)
Continent2015 2016
Value % Value %
Total 18,825.8 100.0 24,759.2 100.0
Asia 15,024.8 79.8 19,840.6 80.1
Europe 2,956.0 15.7 4,467.0 18.0
Africa 667.5 3.5 277.6 1.1
Northern America 134.3 0.7 123.8 0.5
South America 9.4 0.1 30.9 0.1
Australia and Oceania 33.8 0.2 19.3 0.1
Source: Statistics Centre - Abu Dhabi
1.2.21 Top Trade Partners through the Ports of the Emirate of Abu Dhabi (Re-exports)
(Million AED)
Countries2015 2016
Value % Value %
Total 18,825.8 100.0 24,759.2 100.0
Saudi Arabia 4,122.4 21.9 3,009.0 12.2
United Kingdom 436.9 2.3 2,610.2 10.5
Kingdom of Bahrain 2,563.2 13.6 2,231.4 9.0
China 252.8 1.3 2,136.9 8.6
Kuwait 2,400.0 12.7 1,893.8 7.6
Qatar 2,271.8 12.1 1,819.2 7.3
Switzerland 1,713.4 9.1 936.8 3.8
India 731.3 3.9 604.1 2.4
Oman 590.5 3.1 385.2 1.6
Jordan 343.0 1.8 306.2 1.2
Others 3,400.5 18.1 8,826.3 35.6
Source: Department of Finance - Customs Administration
40 | Statistical Yearbook of Abu Dhabi 2017
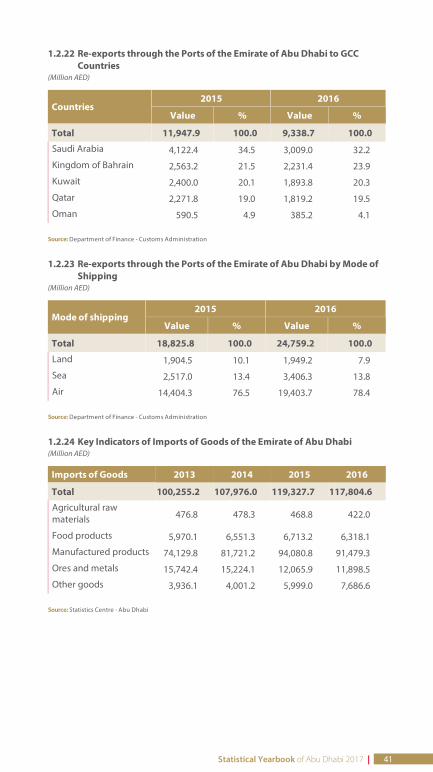
1.2.22 Re-exports through the Ports of the Emirate of Abu Dhabi to GCCCountries
(Million AED)
Countries2015 2016
Value % Value %
Total 11,947.9 100.0 9,338.7 100.0
Saudi Arabia 4,122.4 34.5 3,009.0 32.2
Kingdom of Bahrain 2,563.2 21.5 2,231.4 23.9
Kuwait 2,400.0 20.1 1,893.8 20.3
Qatar 2,271.8 19.0 1,819.2 19.5
Oman 590.5 4.9 385.2 4.1
Source: Department of Finance - Customs Administration
1.2.23 Re-exports through the Ports of the Emirate of Abu Dhabi by Mode ofShipping
(Million AED)
Mode of shipping2015 2016
Value % Value %
Total 18,825.8 100.0 24,759.2 100.0
Land 1,904.5 10.1 1,949.2 7.9
Sea 2,517.0 13.4 3,406.3 13.8
Air 14,404.3 76.5 19,403.7 78.4
Source: Department of Finance - Customs Administration
1.2.24 Key Indicators of Imports of Goods of the Emirate of Abu Dhabi(Million AED)
Imports of Goods 2013 2014 2015 2016
Total 100,255.2 107,976.0 119,327.7 117,804.6
Agricultural rawmaterials 476.8 478.3 468.8 422.0
Food products 5,970.1 6,551.3 6,713.2 6,318.1
Manufactured products 74,129.8 81,721.2 94,080.8 91,479.3
Ores and metals 15,742.4 15,224.1 12,065.9 11,898.5
Other goods 3,936.1 4,001.2 5,999.0 7,686.6
Source: Statistics Centre - Abu Dhabi
Statistical Yearbook of Abu Dhabi 2017 | 41
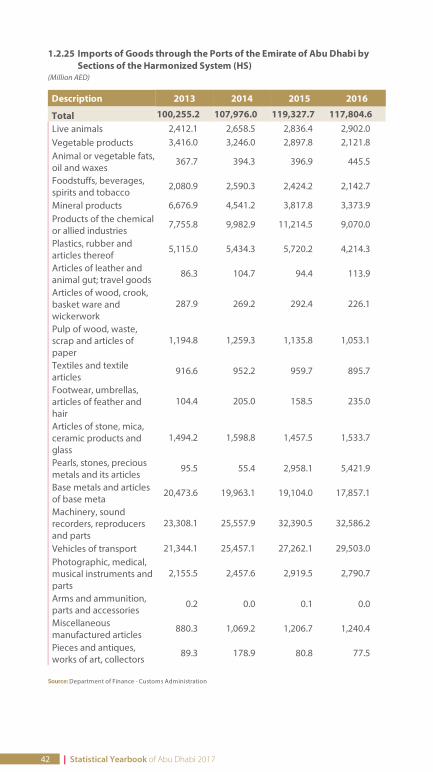
1.2.25 Imports of Goods through the Ports of the Emirate of Abu Dhabi bySections of the Harmonized System (HS)
(Million AED)
Description 2013 2014 2015 2016
Total 100,255.2 107,976.0 119,327.7 117,804.6 Live animals 2,412.1 2,658.5 2,836.4 2,902.0 Vegetable products 3,416.0 3,246.0 2,897.8 2,121.8 Animal or vegetable fats,oil and waxes
367.7 394.3 396.9 445.5
Foodstuffs, beverages,spirits and tobacco
2,080.9 2,590.3 2,424.2 2,142.7
Mineral products 6,676.9 4,541.2 3,817.8 3,373.9 Products of the chemicalor allied industries
7,755.8 9,982.9 11,214.5 9,070.0
Plastics, rubber andarticles thereof
5,115.0 5,434.3 5,720.2 4,214.3
Articles of leather andanimal gut; travel goods
86.3 104.7 94.4 113.9
Articles of wood, crook,basket ware andwickerwork
287.9 269.2 292.4 226.1
Pulp of wood, waste,scrap and articles ofpaper
1,194.8 1,259.3 1,135.8 1,053.1
Textiles and textilearticles
916.6 952.2 959.7 895.7
Footwear, umbrellas,articles of feather andhair
104.4 205.0 158.5 235.0
Articles of stone, mica,ceramic products andglass
1,494.2 1,598.8 1,457.5 1,533.7
Pearls, stones, preciousmetals and its articles
95.5 55.4 2,958.1 5,421.9
Base metals and articlesof base meta
20,473.6 19,963.1 19,104.0 17,857.1
Machinery, soundrecorders, reproducersand parts
23,308.1 25,557.9 32,390.5 32,586.2
Vehicles of transport 21,344.1 25,457.1 27,262.1 29,503.0 Photographic, medical,musical instruments andparts
2,155.5 2,457.6 2,919.5 2,790.7
Arms and ammunition,parts and accessories
0.2 0.0 0.1 0.0
Miscellaneousmanufactured articles
880.3 1,069.2 1,206.7 1,240.4
Pieces and antiques,works of art, collectors
89.3 178.9 80.8 77.5
Source: Department of Finance - Customs Administration
42 | Statistical Yearbook of Abu Dhabi 2017
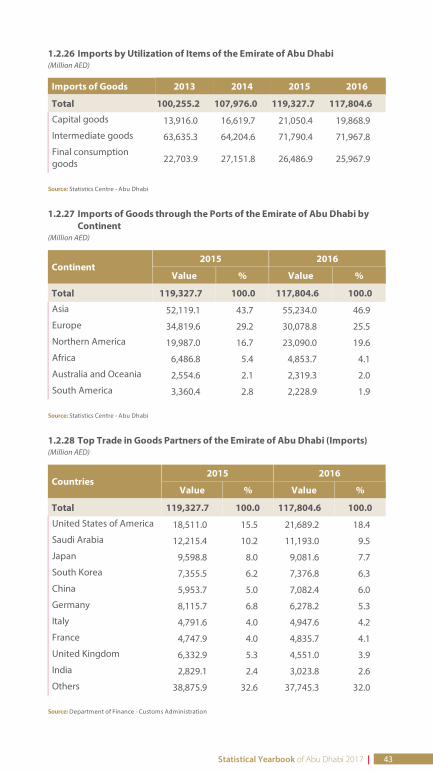
1.2.26 Imports by Utilization of Items of the Emirate of Abu Dhabi(Million AED)
Imports of Goods 2013 2014 2015 2016
Total 100,255.2 107,976.0 119,327.7 117,804.6
Capital goods 13,916.0 16,619.7 21,050.4 19,868.9
Intermediate goods 63,635.3 64,204.6 71,790.4 71,967.8
Final consumptiongoods 22,703.9 27,151.8 26,486.9 25,967.9
Source: Statistics Centre - Abu Dhabi
1.2.27 Imports of Goods through the Ports of the Emirate of Abu Dhabi byContinent
(Million AED)
Continent2015 2016
Value % Value %
Total 119,327.7 100.0 117,804.6 100.0
Asia 52,119.1 43.7 55,234.0 46.9
Europe 34,819.6 29.2 30,078.8 25.5
Northern America 19,987.0 16.7 23,090.0 19.6
Africa 6,486.8 5.4 4,853.7 4.1
Australia and Oceania 2,554.6 2.1 2,319.3 2.0
South America 3,360.4 2.8 2,228.9 1.9
Source: Statistics Centre - Abu Dhabi
1.2.28 Top Trade in Goods Partners of the Emirate of Abu Dhabi (Imports)(Million AED)
Countries2015 2016
Value % Value %
Total 119,327.7 100.0 117,804.6 100.0
United States of America 18,511.0 15.5 21,689.2 18.4
Saudi Arabia 12,215.4 10.2 11,193.0 9.5
Japan 9,598.8 8.0 9,081.6 7.7
South Korea 7,355.5 6.2 7,376.8 6.3
China 5,953.7 5.0 7,082.4 6.0
Germany 8,115.7 6.8 6,278.2 5.3
Italy 4,791.6 4.0 4,947.6 4.2
France 4,747.9 4.0 4,835.7 4.1
United Kingdom 6,332.9 5.3 4,551.0 3.9
India 2,829.1 2.4 3,023.8 2.6
Others 38,875.9 32.6 37,745.3 32.0
Source: Department of Finance - Customs Administration
Statistical Yearbook of Abu Dhabi 2017 | 43
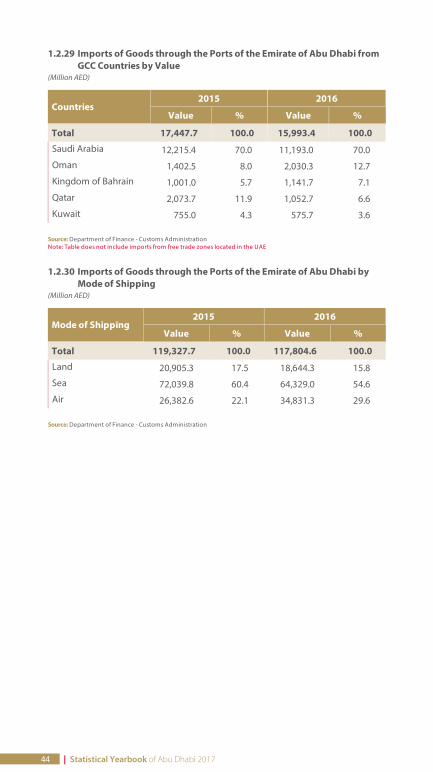
1.2.29 Imports of Goods through the Ports of the Emirate of Abu Dhabi fromGCC Countries by Value
(Million AED)
Countries2015 2016
Value % Value %
Total 17,447.7 100.0 15,993.4 100.0
Saudi Arabia 12,215.4 70.0 11,193.0 70.0
Oman 1,402.5 8.0 2,030.3 12.7
Kingdom of Bahrain 1,001.0 5.7 1,141.7 7.1
Qatar 2,073.7 11.9 1,052.7 6.6
Kuwait 755.0 4.3 575.7 3.6
Source: Department of Finance - Customs AdministrationNote: Table does not include imports from free trade zones located in the UAE
1.2.30 Imports of Goods through the Ports of the Emirate of Abu Dhabi byMode of Shipping
(Million AED)
Mode of Shipping2015 2016
Value % Value %
Total 119,327.7 100.0 117,804.6 100.0
Land 20,905.3 17.5 18,644.3 15.8
Sea 72,039.8 60.4 64,329.0 54.6
Air 26,382.6 22.1 34,831.3 29.6
Source: Department of Finance - Customs Administration
44 | Statistical Yearbook of Abu Dhabi 2017
1.3. PricesThe price index is defined as a tool for measuring the rate of change in pricesof a set of goods and services between two periods. The period againstwhich prices are compared is known as the base period and the periodunder review is known as the comparison period.
Price statistics and indices include data on price levels in different sectorssuch as consumer, construction materials, and producers, in addition to anumber of economic indicators such as in ation and the index of industrialproduction quantities. The annual and monthly in ation rates of the Emirateof Abu Dhabi are calculated through the consumer price index. Theconsumer price index is calculated according to the type of household, thelevel of family welfare and by region.
The most important results of calculating the consumer price index for 2016with a 2014 base year are as follows:
Consumer price inflation reached 2.0% during 2016 compared with2015. The index reached 106.4% in 2016, while it was 104.3% in 2015.The 'Housing, Water, Electricity, Gas and Other Fuels' group contributed92.1% of the total rate of increase. This contribution was due to the highprices of this group which rose by 5.6%.The 'Education' group contributed 10.3% of the total rate of increaseachieved during 2016, compared with 2015, while prices of this groupincreased by 3.0%.The 'Miscellaneous goods and services' group contributed 8.0% of thetotal rate of increase achieved during 2016 This contribution was due tothe increase in the prices of this group by 2.4%.Prices of the 'Food and Beverages' group decreased by 0.1% in 2016,and this group contributed to reducing the inflation rate by 0.4% during2016.
The producer price index covers the manufacturing sector and is calculatedquarterly. The construction of the producer price index is based on the list ofmajor products in the manufacturing activities of ISIC4. The most importantresult of calculating the index of industrial producer prices for 2016compared with 2015 was the 10.2% decrease in prices.
The quantitative index of industrial producers covers the manufacturingsector. The calculation is based on the list of major products in themanufacturing activities of ISIC 4. The most important results of calculatingthe industrial production index for the year 2016 compared with 2015 wasthe increase of 23.3% in industrial production.
The prices of building materials are considered to be important economicindicators for planning and research in various elds. They are also used inthe compilation of indices of the construction activity and for the calculationof GDP at constant prices. As a result of the continuous development of theEmirate of Abu Dhabi and the continuous growth in the construction sector,the Statistics Center - Abu Dhabi regularly collects data on the prices ofthese materials. The annual relative change in construction materials pricesfor 2016 is shown compared with 2015, in addition to the relative annualchange since 2011.
Statistical Yearbook of Abu Dhabi 2017 | 45
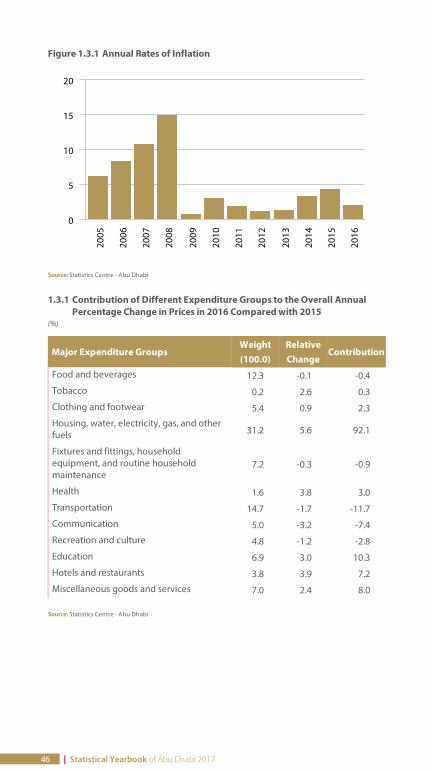
Figure 1.3.1 Annual Rates of Inflation
Source: Statistics Centre - Abu Dhabi
1.3.1 Contribution of Different Expenditure Groups to the Overall AnnualPercentage Change in Prices in 2016 Compared with 2015
(%)
Major Expenditure GroupsWeight(100.0)
RelativeChange
Contribution
Food and beverages 12.3 -0.1 -0.4
Tobacco 0.2 2.6 0.3
Clothing and footwear 5.4 0.9 2.3
Housing, water, electricity, gas, and otherfuels 31.2 5.6 92.1
Fixtures and fittings, householdequipment, and routine householdmaintenance
7.2 -0.3 -0.9
Health 1.6 3.8 3.0
Transportation 14.7 -1.7 -11.7
Communication 5.0 -3.2 -7.4
Recreation and culture 4.8 -1.2 -2.8
Education 6.9 3.0 10.3
Hotels and restaurants 3.8 3.9 7.2
Miscellaneous goods and services 7.0 2.4 8.0
Source: Statistics Centre - Abu Dhabi
2005
2006
2007
2008
2009
2010
2011
2012
2013
2014
2015
2016
0
5
10
15
20
46 | Statistical Yearbook of Abu Dhabi 2017
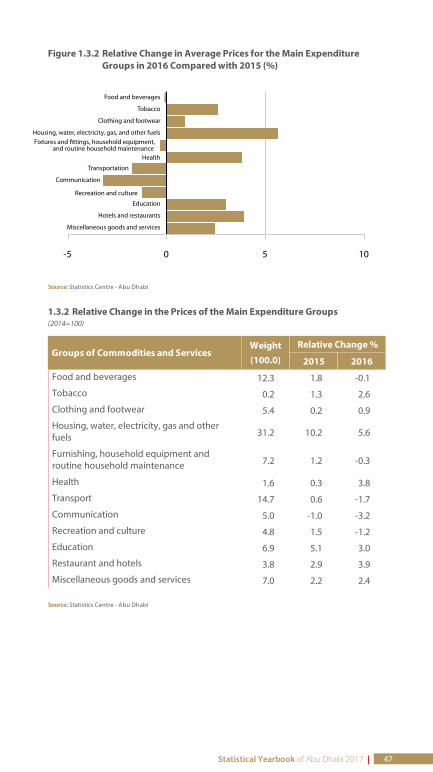
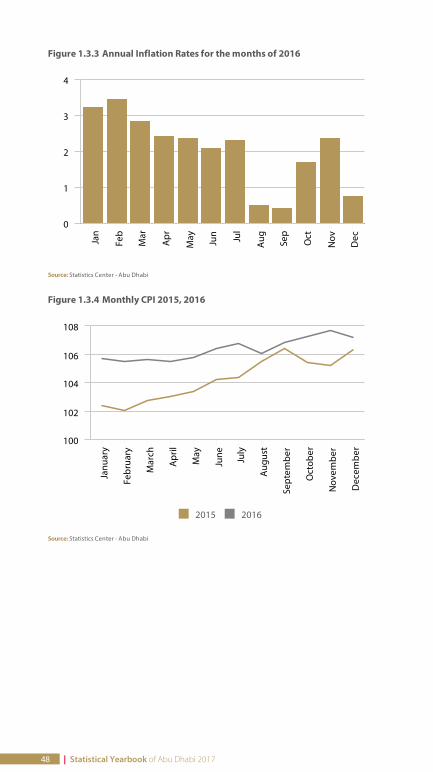
Figure 1.3.3 Annual Inflation Rates for the months of 2016
Source: Statistics Center - Abu Dhabi
Figure 1.3.4 Monthly CPI 2015, 2016
. 2015 . 2016
Source: Statistics Center - Abu Dhabi
Jan
Feb
Mar
Apr
May Jun Jul
Aug Se
p
Oct
Nov
Dec
0
1
2
3
4
Janu
ary
Febr
uary
Mar
ch
Apr
il
May
June July
Aug
ust
Sept
embe
r
Oct
ober
Nov
embe
r
Dec
embe
r
100
102
104
106
108
48 | Statistical Yearbook of Abu Dhabi 2017
1.3.3 Annual CPI and Inflation Rates 2009 - 2016
Year CPI Inflation Rate (%)2009 90.1 0.8
2010 92.8 3.1
2011 94.6 1.9
2012 95.7 1.1
2013 96.9 1.3
2014 100.0 3.2
2015 104.3 4.3
2016 106.4 2.0
Source: Statistic Centre - Abu Dhabi
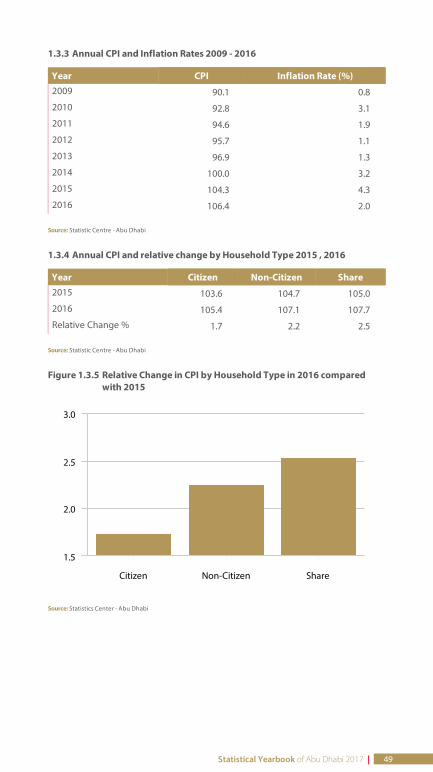
1.3.4 Annual CPI and relative change by Household Type 2015 , 2016
Year Citizen Non-Citizen Share2015 103.6 104.7 105.0
2016 105.4 107.1 107.7
Relative Change % 1.7 2.2 2.5
Source: Statistic Centre - Abu Dhabi
Figure 1.3.5 Relative Change in CPI by Household Type in 2016 comparedwith 2015
Source: Statistics Center - Abu Dhabi
Citizen Non-Citizen Share
1.5
2.0
2.5
3.0
Statistical Yearbook of Abu Dhabi 2017 | 49
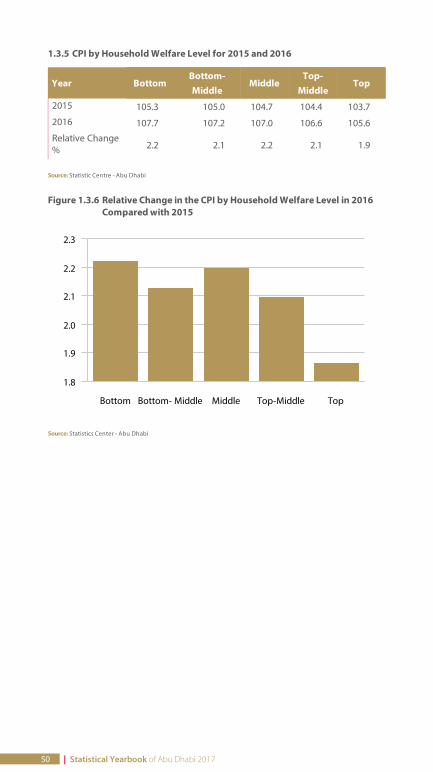
1.3.5 CPI by Household Welfare Level for 2015 and 2016
Year BottomBottom-Middle
MiddleTop-
MiddleTop
2015 105.3 105.0 104.7 104.4 103.7
2016 107.7 107.2 107.0 106.6 105.6
Relative Change% 2.2 2.1 2.2 2.1 1.9
Source: Statistic Centre - Abu Dhabi
Figure 1.3.6 Relative Change in the CPI by Household Welfare Level in 2016Compared with 2015
Source: Statistics Center - Abu Dhabi
Bottom Bottom- Middle Middle Top-Middle Top
1.8
1.9
2.0
2.1
2.2
2.3
50 | Statistical Yearbook of Abu Dhabi 2017
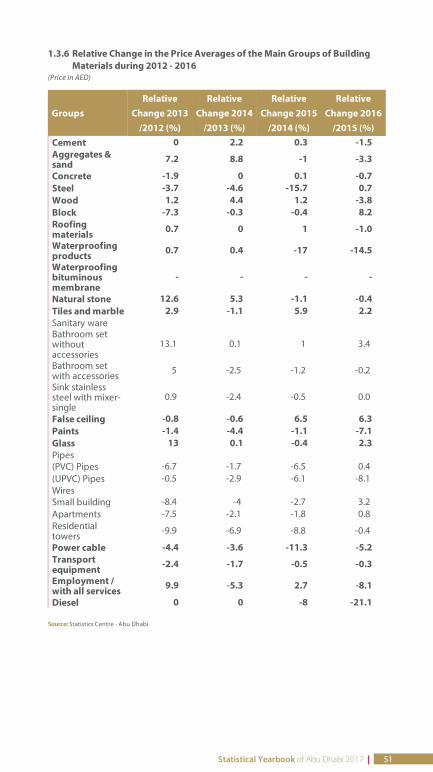
1.3.6 Relative Change in the Price Averages of the Main Groups of BuildingMaterials during 2012 - 2016
(Price in AED)
GroupsRelative
Change 2013/2012 (%)
RelativeChange 2014
/2013 (%)
RelativeChange 2015
/2014 (%)
RelativeChange 2016
/2015 (%)Cement 0 2.2 0.3 -1.5 Aggregates &sand 7.2 8.8 -1 -3.3
Concrete -1.9 0 0.1 -0.7 Steel -3.7 -4.6 -15.7 0.7 Wood 1.2 4.4 1.2 -3.8 Block -7.3 -0.3 -0.4 8.2 Roofingmaterials 0.7 0 1 -1.0
Waterproofingproducts 0.7 0.4 -17 -14.5
Waterproofingbituminousmembrane
- - - -
Natural stone 12.6 5.3 -1.1 -0.4 Tiles and marble 2.9 -1.1 5.9 2.2 Sanitary wareBathroom setwithoutaccessories
13.1 0.1 1 3.4
Bathroom setwith accessories 5 -2.5 -1.2 -0.2
Sink stainlesssteel with mixer-single
0.9 -2.4 -0.5 0.0
False ceiling -0.8 -0.6 6.5 6.3 Paints -1.4 -4.4 -1.1 -7.1 Glass 13 0.1 -0.4 2.3 Pipes(PVC) Pipes -6.7 -1.7 -6.5 0.4 (UPVC) Pipes -0.5 -2.9 -6.1 -8.1 WiresSmall building -8.4 -4 -2.7 3.2 Apartments -7.5 -2.1 -1.8 0.8 Residentialtowers -9.9 -6.9 -8.8 -0.4
Power cable -4.4 -3.6 -11.3 -5.2 Transportequipment -2.4 -1.7 -0.5 -0.3
Employment /with all services 9.9 -5.3 2.7 -8.1
Diesel 0 0 -8 -21.1
Source: Statistics Centre - Abu Dhabi
Statistical Yearbook of Abu Dhabi 2017 | 51
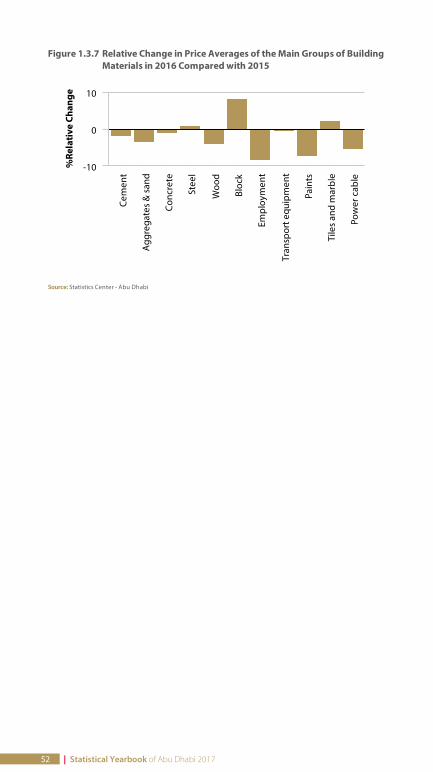
Figure 1.3.7 Relative Change in Price Averages of the Main Groups of BuildingMaterials in 2016 Compared with 2015
Source: Statistics Center - Abu Dhabi
Cem
ent
Agg
rega
tes
& s
and
Conc
rete
Stee
l
Woo
d
Bloc
k
Empl
oym
ent
Tran
spor
t equ
ipm
ent
Pain
ts
Tile
s an
d m
arbl
e
Pow
er c
able
-10
0
10
%Re
lativ
e Ch
ange
52 | Statistical Yearbook of Abu Dhabi 2017
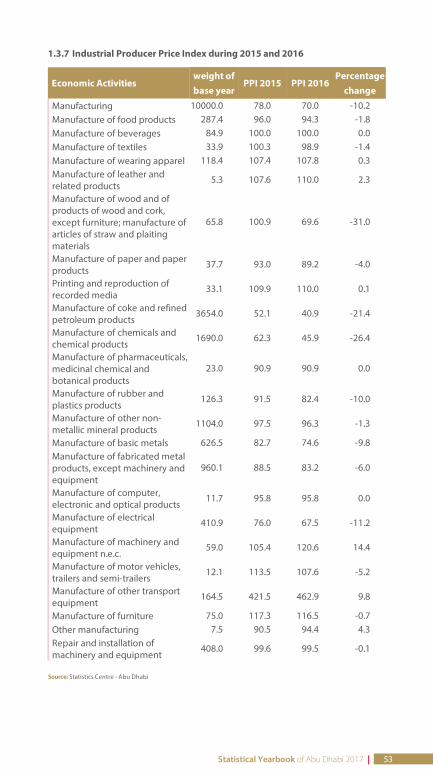
1.3.7 Industrial Producer Price Index during 2015 and 2016
Economic Activitiesweight ofbase year
PPI 2015 PPI 2016Percentage
change
Manufacturing 10000.0 78.0 70.0 -10.2 Manufacture of food products 287.4 96.0 94.3 -1.8 Manufacture of beverages 84.9 100.0 100.0 0.0 Manufacture of textiles 33.9 100.3 98.9 -1.4 Manufacture of wearing apparel 118.4 107.4 107.8 0.3 Manufacture of leather andrelated products
5.3 107.6 110.0 2.3
Manufacture of wood and ofproducts of wood and cork,except furniture; manufacture ofarticles of straw and plaitingmaterials
65.8 100.9 69.6 -31.0
Manufacture of paper and paperproducts
37.7 93.0 89.2 -4.0
Printing and reproduction ofrecorded media
33.1 109.9 110.0 0.1
Manufacture of coke and refinedpetroleum products
3654.0 52.1 40.9 -21.4
Manufacture of chemicals andchemical products
1690.0 62.3 45.9 -26.4
Manufacture of pharmaceuticals,medicinal chemical andbotanical products
23.0 90.9 90.9 0.0
Manufacture of rubber andplastics products
126.3 91.5 82.4 -10.0
Manufacture of other non-metallic mineral products
1104.0 97.5 96.3 -1.3
Manufacture of basic metals 626.5 82.7 74.6 -9.8 Manufacture of fabricated metalproducts, except machinery andequipment
960.1 88.5 83.2 -6.0
Manufacture of computer,electronic and optical products
11.7 95.8 95.8 0.0
Manufacture of electricalequipment
410.9 76.0 67.5 -11.2
Manufacture of machinery andequipment n.e.c.
59.0 105.4 120.6 14.4
Manufacture of motor vehicles,trailers and semi-trailers
12.1 113.5 107.6 -5.2
Manufacture of other transportequipment
164.5 421.5 462.9 9.8
Manufacture of furniture 75.0 117.3 116.5 -0.7 Other manufacturing 7.5 90.5 94.4 4.3 Repair and installation ofmachinery and equipment
408.0 99.6 99.5 -0.1
Source: Statistics Centre - Abu Dhabi
Statistical Yearbook of Abu Dhabi 2017 | 53
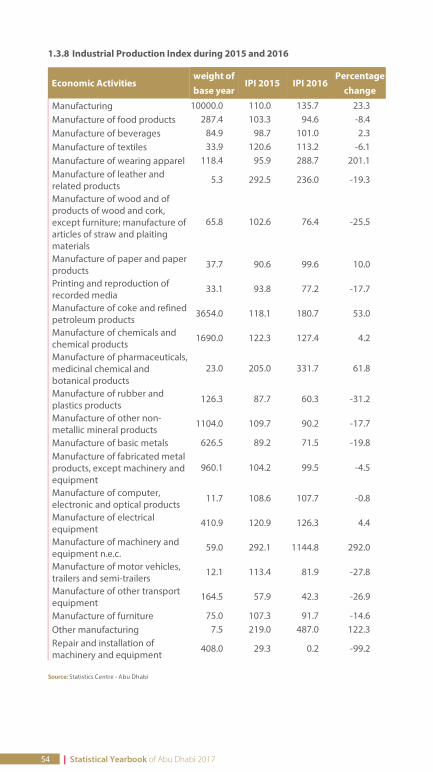
1.3.8 Industrial Production Index during 2015 and 2016
Economic Activitiesweight ofbase year
IPI 2015 IPI 2016Percentage
change
Manufacturing 10000.0 110.0 135.7 23.3 Manufacture of food products 287.4 103.3 94.6 -8.4 Manufacture of beverages 84.9 98.7 101.0 2.3 Manufacture of textiles 33.9 120.6 113.2 -6.1 Manufacture of wearing apparel 118.4 95.9 288.7 201.1 Manufacture of leather andrelated products
5.3 292.5 236.0 -19.3
Manufacture of wood and ofproducts of wood and cork,except furniture; manufacture ofarticles of straw and plaitingmaterials
65.8 102.6 76.4 -25.5
Manufacture of paper and paperproducts
37.7 90.6 99.6 10.0
Printing and reproduction ofrecorded media
33.1 93.8 77.2 -17.7
Manufacture of coke and refinedpetroleum products
3654.0 118.1 180.7 53.0
Manufacture of chemicals andchemical products
1690.0 122.3 127.4 4.2
Manufacture of pharmaceuticals,medicinal chemical andbotanical products
23.0 205.0 331.7 61.8
Manufacture of rubber andplastics products
126.3 87.7 60.3 -31.2
Manufacture of other non-metallic mineral products
1104.0 109.7 90.2 -17.7
Manufacture of basic metals 626.5 89.2 71.5 -19.8 Manufacture of fabricated metalproducts, except machinery andequipment
960.1 104.2 99.5 -4.5
Manufacture of computer,electronic and optical products
11.7 108.6 107.7 -0.8
Manufacture of electricalequipment
410.9 120.9 126.3 4.4
Manufacture of machinery andequipment n.e.c.
59.0 292.1 1144.8 292.0
Manufacture of motor vehicles,trailers and semi-trailers
12.1 113.4 81.9 -27.8
Manufacture of other transportequipment
164.5 57.9 42.3 -26.9
Manufacture of furniture 75.0 107.3 91.7 -14.6 Other manufacturing 7.5 219.0 487.0 122.3 Repair and installation ofmachinery and equipment
408.0 29.3 0.2 -99.2
Source: Statistics Centre - Abu Dhabi
54 | Statistical Yearbook of Abu Dhabi 2017
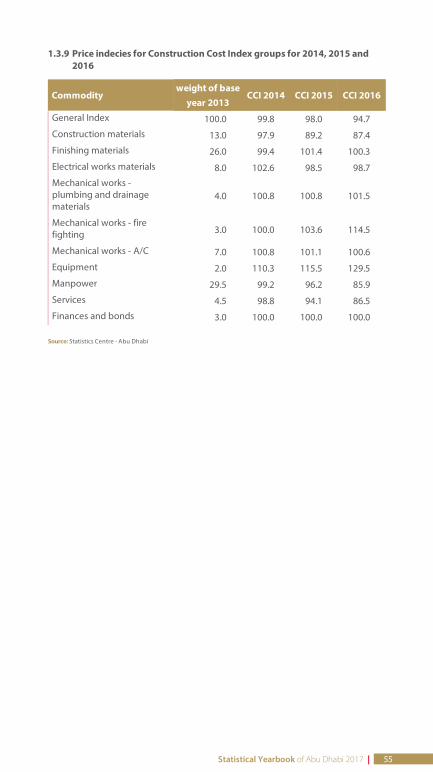
1.3.9 Price indecies for Construction Cost Index groups for 2014, 2015 and2016
Commodityweight of base
year 2013CCI 2014 CCI 2015 CCI 2016
General Index 100.0 99.8 98.0 94.7
Construction materials 13.0 97.9 89.2 87.4
Finishing materials 26.0 99.4 101.4 100.3
Electrical works materials 8.0 102.6 98.5 98.7
Mechanical works -plumbing and drainagematerials
4.0 100.8 100.8 101.5
Mechanical works - firefighting 3.0 100.0 103.6 114.5
Mechanical works - A/C 7.0 100.8 101.1 100.6
Equipment 2.0 110.3 115.5 129.5
Manpower 29.5 99.2 96.2 85.9
Services 4.5 98.8 94.1 86.5
Finances and bonds 3.0 100.0 100.0 100.0
Source: Statistics Centre - Abu Dhabi
Statistical Yearbook of Abu Dhabi 2017 | 55
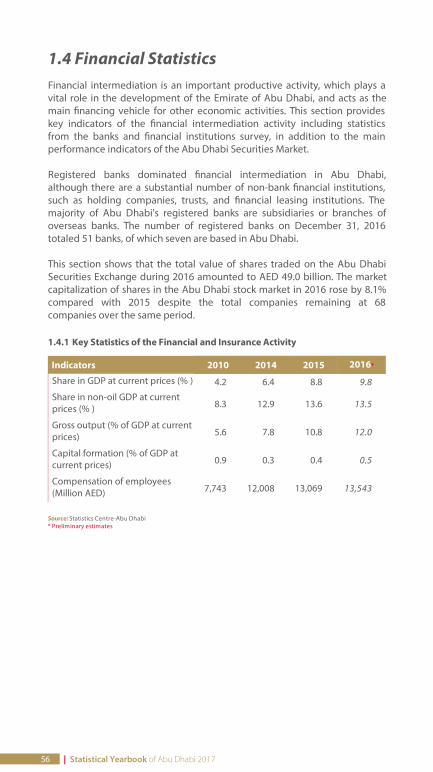
1.4 Financial StatisticsFinancial intermediation is an important productive activity, which plays avital role in the development of the Emirate of Abu Dhabi, and acts as themain nancing vehicle for other economic activities. This section provideskey indicators of the nancial intermediation activity including statisticsfrom the banks and nancial institutions survey, in addition to the mainperformance indicators of the Abu Dhabi Securities Market.
Registered banks dominated nancial intermediation in Abu Dhabi,although there are a substantial number of non-bank nancial institutions,such as holding companies, trusts, and nancial leasing institutions. Themajority of Abu Dhabi's registered banks are subsidiaries or branches ofoverseas banks. The number of registered banks on December 31, 2016totaled 51 banks, of which seven are based in Abu Dhabi.
This section shows that the total value of shares traded on the Abu DhabiSecurities Exchange during 2016 amounted to AED 49.0 billion. The marketcapitalization of shares in the Abu Dhabi stock market in 2016 rose by 8.1%compared with 2015 despite the total companies remaining at 68companies over the same period.
1.4.1 Key Statistics of the Financial and Insurance Activity
Indicators 2010 2014 2015 2016*
Share in GDP at current prices (% ) 4.2 6.4 8.8 9.8
Share in non-oil GDP at currentprices (% ) 8.3 12.9 13.6 13.5
Gross output (% of GDP at currentprices) 5.6 7.8 10.8 12.0
Capital formation (% of GDP atcurrent prices) 0.9 0.3 0.4 0.5
Compensation of employees(Million AED) 7,743 12,008 13,069 13,543
Source: Statistics Centre-Abu Dhabi* Preliminary estimates
56 | Statistical Yearbook of Abu Dhabi 2017
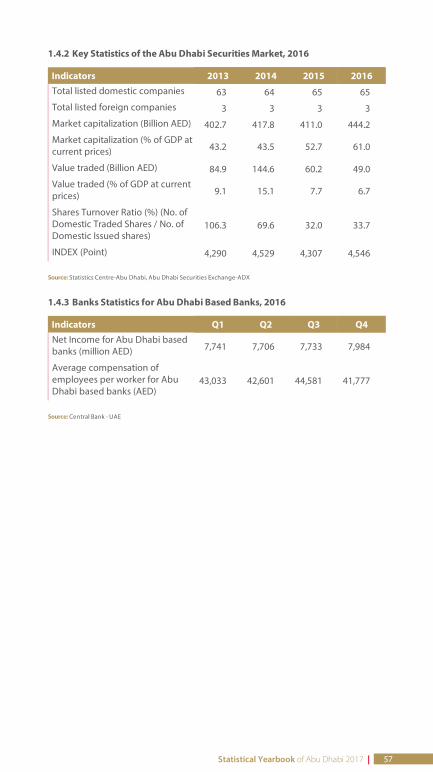
1.4.2 Key Statistics of the Abu Dhabi Securities Market, 2016
Indicators 2013 2014 2015 2016Total listed domestic companies 63 64 65 65
Total listed foreign companies 3 3 3 3
Market capitalization (Billion AED) 402.7 417.8 411.0 444.2
Market capitalization (% of GDP atcurrent prices) 43.2 43.5 52.7 61.0
Value traded (Billion AED) 84.9 144.6 60.2 49.0
Value traded (% of GDP at currentprices) 9.1 15.1 7.7 6.7
Shares Turnover Ratio (%) (No. ofDomestic Traded Shares / No. ofDomestic Issued shares)
106.3 69.6 32.0 33.7
INDEX (Point) 4,290 4,529 4,307 4,546
Source: Statistics Centre-Abu Dhabi, Abu Dhabi Securities Exchange-ADX
1.4.3 Banks Statistics for Abu Dhabi Based Banks, 2016
Indicators Q1 Q2 Q3 Q4Net Income for Abu Dhabi basedbanks (million AED) 7,741 7,706 7,733 7,984
Average compensation ofemployees per worker for AbuDhabi based banks (AED)
43,033 42,601 44,581 41,777
Source: Central Bank - UAE
Statistical Yearbook of Abu Dhabi 2017 | 57
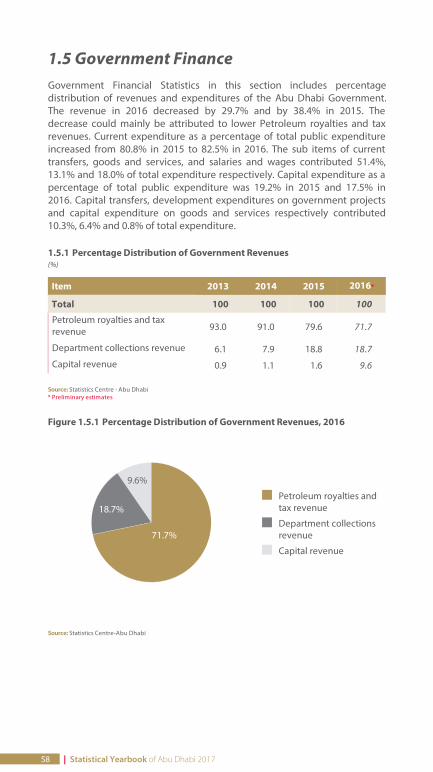
1.5 Government FinanceGovernment Financial Statistics in this section includes percentagedistribution of revenues and expenditures of the Abu Dhabi Government.The revenue in 2016 decreased by 29.7% and by 38.4% in 2015. Thedecrease could mainly be attributed to lower Petroleum royalties and taxrevenues. Current expenditure as a percentage of total public expenditureincreased from 80.8% in 2015 to 82.5% in 2016. The sub items of currenttransfers, goods and services, and salaries and wages contributed 51.4%,13.1% and 18.0% of total expenditure respectively. Capital expenditure as apercentage of total public expenditure was 19.2% in 2015 and 17.5% in2016. Capital transfers, development expenditures on government projectsand capital expenditure on goods and services respectively contributed10.3%, 6.4% and 0.8% of total expenditure.
1.5.1 Percentage Distribution of Government Revenues(%)
Item 2013 2014 2015 2016*
Total 100 100 100 100
Petroleum royalties and taxrevenue 93.0 91.0 79.6 71.7
Department collections revenue 6.1 7.9 18.8 18.7
Capital revenue 0.9 1.1 1.6 9.6
Source: Statistics Centre - Abu Dhabi* Preliminary estimates
Figure 1.5.1 Percentage Distribution of Government Revenues, 2016
. Petroleum royalties andtax revenue
. Department collectionsrevenue
. Capital revenue
Source: Statistics Centre-Abu Dhabi
71.7%
18.7%
9.6%
58 | Statistical Yearbook of Abu Dhabi 2017
1.5.2 Percentage Distribution of Public Expenditures(%)
Item 2013 2014 2015 2016*
Total 100 100 100 100
Current expenditures 74.2 76.2 80.8 82.5 Salaries and wages 11.7 12.4 16.0 18.0
Goods and services 9.9 10.9 13.0 13.1
Current transfers 52.6 52.9 51.8 51.4
Capital expenditures 25.8 23.8 19.2 17.5 Development expenditures ongovernment projects 6.6 5.8 6.6 6.4
Capital expenditures on goods &services 0.4 0.2 0.2 0.8
Capital transfers 18.8 17.8 12.4 10.3
Source: Statistics Centre - Abu Dhabi* Preliminary estimates
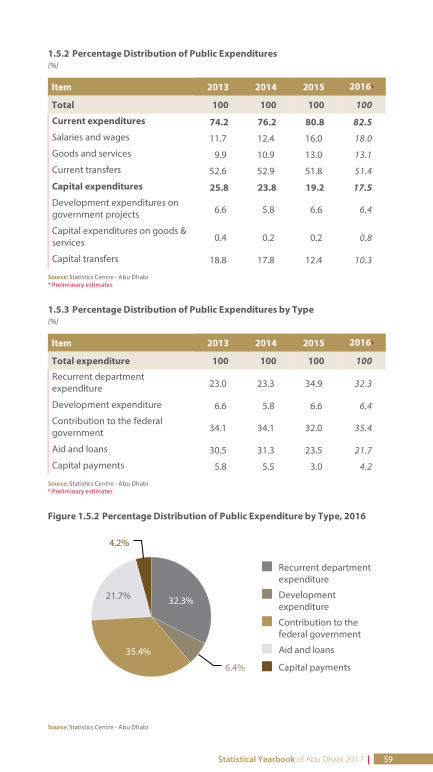
1.5.3 Percentage Distribution of Public Expenditures by Type(%)
Item 2013 2014 2015 2016*
Total expenditure 100 100 100 100
Recurrent departmentexpenditure 23.0 23.3 34.9 32.3
Development expenditure 6.6 5.8 6.6 6.4
Contribution to the federalgovernment 34.1 34.1 32.0 35.4
Aid and loans 30.5 31.3 23.5 21.7
Capital payments 5.8 5.5 3.0 4.2
Source: Statistics Centre - Abu Dhabi* Preliminary estimates
Figure 1.5.2 Percentage Distribution of Public Expenditure by Type, 2016
. Recurrent departmentexpenditure
. Developmentexpenditure
. Contribution to thefederal government
. Aid and loans
. Capital payments
Source: Statistics Centre - Abu Dhabi
32.3%
6.4%
35.4%
21.7%
4.2%
Statistical Yearbook of Abu Dhabi 2017 | 59
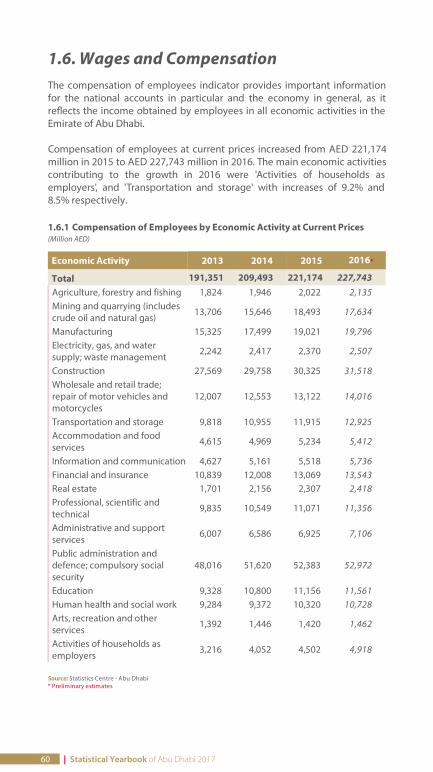
1.6. Wages and CompensationThe compensation of employees indicator provides important informationfor the national accounts in particular and the economy in general, as itre ects the income obtained by employees in all economic activities in theEmirate of Abu Dhabi.
Compensation of employees at current prices increased from AED 221,174million in 2015 to AED 227,743 million in 2016. The main economic activitiescontributing to the growth in 2016 were 'Activities of households asemployers', and 'Transportation and storage' with increases of 9.2% and8.5% respectively.
1.6.1 Compensation of Employees by Economic Activity at Current Prices(Million AED)
Economic Activity 2013 2014 2015 2016*
Total 191,351 209,493 221,174 227,743 Agriculture, forestry and fishing 1,824 1,946 2,022 2,135 Mining and quarrying (includescrude oil and natural gas)
13,706 15,646 18,493 17,634
Manufacturing 15,325 17,499 19,021 19,796 Electricity, gas, and watersupply; waste management
2,242 2,417 2,370 2,507
Construction 27,569 29,758 30,325 31,518 Wholesale and retail trade;repair of motor vehicles andmotorcycles
12,007 12,553 13,122 14,016
Transportation and storage 9,818 10,955 11,915 12,925 Accommodation and foodservices
4,615 4,969 5,234 5,412
Information and communication 4,627 5,161 5,518 5,736 Financial and insurance 10,839 12,008 13,069 13,543 Real estate 1,701 2,156 2,307 2,418 Professional, scientific andtechnical
9,835 10,549 11,071 11,356
Administrative and supportservices
6,007 6,586 6,925 7,106
Public administration anddefence; compulsory socialsecurity
48,016 51,620 52,383 52,972
Education 9,328 10,800 11,156 11,561 Human health and social work 9,284 9,372 10,320 10,728 Arts, recreation and otherservices
1,392 1,446 1,420 1,462
Activities of households asemployers
3,216 4,052 4,502 4,918
Source: Statistics Centre - Abu Dhabi* Preliminary estimates
60 | Statistical Yearbook of Abu Dhabi 2017
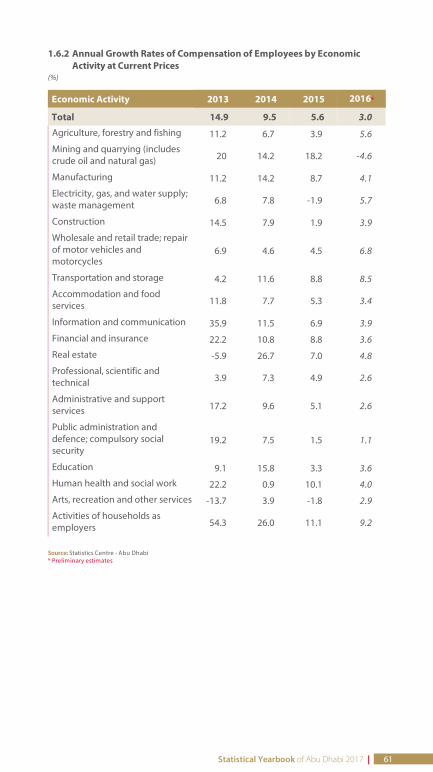
1.6.2 Annual Growth Rates of Compensation of Employees by EconomicActivity at Current Prices
(%)
Economic Activity 2013 2014 2015 2016*
Total 14.9 9.5 5.6 3.0
Agriculture, forestry and fishing 11.2 6.7 3.9 5.6
Mining and quarrying (includescrude oil and natural gas) 20 14.2 18.2 -4.6
Manufacturing 11.2 14.2 8.7 4.1
Electricity, gas, and water supply;waste management 6.8 7.8 -1.9 5.7
Construction 14.5 7.9 1.9 3.9
Wholesale and retail trade; repairof motor vehicles andmotorcycles
6.9 4.6 4.5 6.8
Transportation and storage 4.2 11.6 8.8 8.5
Accommodation and foodservices 11.8 7.7 5.3 3.4
Information and communication 35.9 11.5 6.9 3.9
Financial and insurance 22.2 10.8 8.8 3.6
Real estate -5.9 26.7 7.0 4.8
Professional, scientific andtechnical 3.9 7.3 4.9 2.6
Administrative and supportservices 17.2 9.6 5.1 2.6
Public administration anddefence; compulsory socialsecurity
19.2 7.5 1.5 1.1
Education 9.1 15.8 3.3 3.6
Human health and social work 22.2 0.9 10.1 4.0
Arts, recreation and other services -13.7 3.9 -1.8 2.9
Activities of households asemployers 54.3 26.0 11.1 9.2
Source: Statistics Centre - Abu Dhabi* Preliminary estimates
Statistical Yearbook of Abu Dhabi 2017 | 61
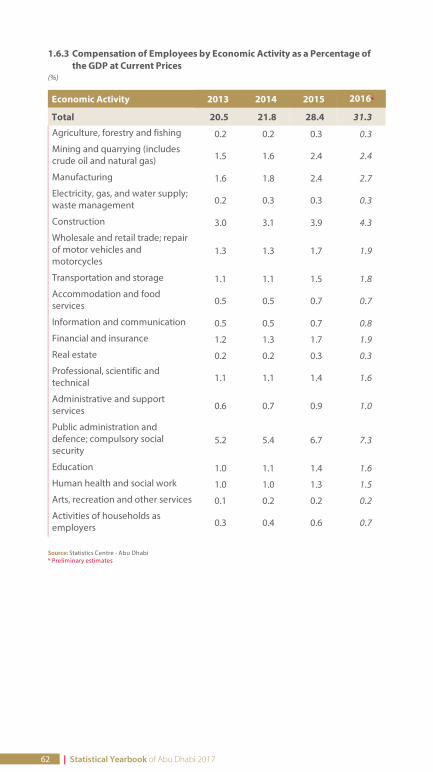
1.6.3 Compensation of Employees by Economic Activity as a Percentage ofthe GDP at Current Prices
(%)
Economic Activity 2013 2014 2015 2016*
Total 20.5 21.8 28.4 31.3
Agriculture, forestry and fishing 0.2 0.2 0.3 0.3
Mining and quarrying (includescrude oil and natural gas) 1.5 1.6 2.4 2.4
Manufacturing 1.6 1.8 2.4 2.7
Electricity, gas, and water supply;waste management 0.2 0.3 0.3 0.3
Construction 3.0 3.1 3.9 4.3
Wholesale and retail trade; repairof motor vehicles andmotorcycles
1.3 1.3 1.7 1.9
Transportation and storage 1.1 1.1 1.5 1.8
Accommodation and foodservices 0.5 0.5 0.7 0.7
Information and communication 0.5 0.5 0.7 0.8
Financial and insurance 1.2 1.3 1.7 1.9
Real estate 0.2 0.2 0.3 0.3
Professional, scientific andtechnical 1.1 1.1 1.4 1.6
Administrative and supportservices 0.6 0.7 0.9 1.0
Public administration anddefence; compulsory socialsecurity
5.2 5.4 6.7 7.3
Education 1.0 1.1 1.4 1.6
Human health and social work 1.0 1.0 1.3 1.5
Arts, recreation and other services 0.1 0.2 0.2 0.2
Activities of households asemployers 0.3 0.4 0.6 0.7
Source: Statistics Centre - Abu Dhabi* Preliminary estimates
62 | Statistical Yearbook of Abu Dhabi 2017
1.7. Foreign InvestmentThe Abu Dhabi Government has made vast strides in establishing favorableconditions and enhancing investor con dence in the economy. Atransparent tax structure, with a supporting judicial system, investmentencouraging business legislation and industrial zones enhancesinternational investor perception about business opportunities in theEmirate.
The total value of Foreign Direct Investment (FDI) at the end of 2015 wasAED 88,095 million, up from AED 81,112 million at the end of 2014. Thisincrease could mainly be attributed to 'Financial institutions and insurance',which attracted FDI worth AED 13,338 in 2015, compared with AED 12,731million in 2014. 'Manufacturing industries' accounted for 19.5% of FDI stocksin 2015 compared with 19.1% in 2014. 'Mining and quarrying' (includingcrude oil and natural gas) accounted of total FDI, AED 7,045 million with8.7% at the end of 2014 and AED 8,354 million with 9.5% at the end of 2015.
FDI from the GCC region amounted to AED 3,213 million or 3.6% of total FDIin 2015 compared with AED 2820 million or 3.5% in 2014. Investments fromother Arab countries totaled AED 6,643 and AED 6,414 million of FDI for theyears 2014 and 2015, respectively. European countries accounted for thelargest proportion of FDI in the Emirate of Abu Dhabi. Investment from thesecountries increased from AED 32,980 million in 2014 to AED 36,021 million in2015.
Total portfolio investments in the Emirate of Abu Dhabi consisting of equitysecurities including debt securities amounted to AED 87,895 million in 2015.Other investments (excluding debt securities) amounted to AED 177,111million in 2015, compared with AED 160,364 million in 2014.
Statistical Yearbook of Abu Dhabi 2017 | 63
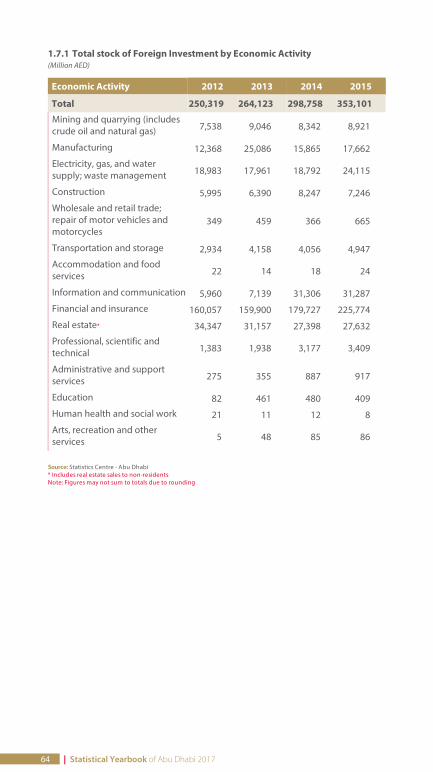
1.7.1 Total stock of Foreign Investment by Economic Activity(Million AED)
Economic Activity 2012 2013 2014 2015
Total 250,319 264,123 298,758 353,101
Mining and quarrying (includescrude oil and natural gas) 7,538 9,046 8,342 8,921
Manufacturing 12,368 25,086 15,865 17,662
Electricity, gas, and watersupply; waste management 18,983 17,961 18,792 24,115
Construction 5,995 6,390 8,247 7,246
Wholesale and retail trade;repair of motor vehicles andmotorcycles
349 459 366 665
Transportation and storage 2,934 4,158 4,056 4,947
Accommodation and foodservices 22 14 18 24
Information and communication 5,960 7,139 31,306 31,287
Financial and insurance 160,057 159,900 179,727 225,774
Real estate* 34,347 31,157 27,398 27,632
Professional, scientific andtechnical 1,383 1,938 3,177 3,409
Administrative and supportservices 275 355 887 917
Education 82 461 480 409
Human health and social work 21 11 12 8
Arts, recreation and otherservices 5 48 85 86
Source: Statistics Centre - Abu Dhabi* Includes real estate sales to non-residentsNote: Figures may not sum to totals due to rounding
64 | Statistical Yearbook of Abu Dhabi 2017
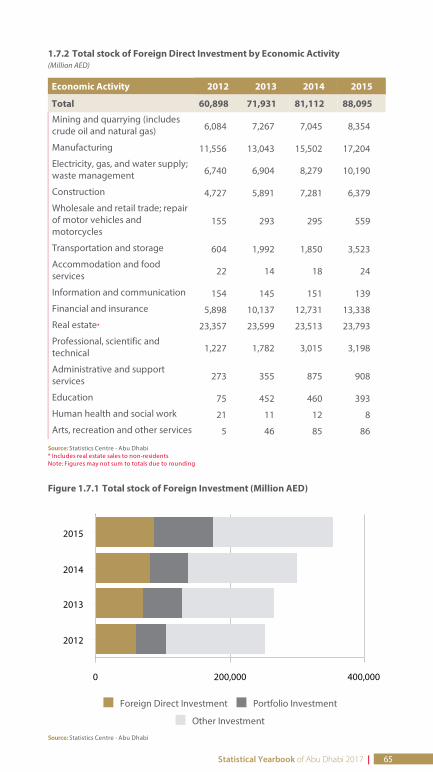
1.7.2 Total stock of Foreign Direct Investment by Economic Activity(Million AED)
Economic Activity 2012 2013 2014 2015
Total 60,898 71,931 81,112 88,095
Mining and quarrying (includescrude oil and natural gas) 6,084 7,267 7,045 8,354
Manufacturing 11,556 13,043 15,502 17,204
Electricity, gas, and water supply;waste management 6,740 6,904 8,279 10,190
Construction 4,727 5,891 7,281 6,379
Wholesale and retail trade; repairof motor vehicles andmotorcycles
155 293 295 559
Transportation and storage 604 1,992 1,850 3,523
Accommodation and foodservices 22 14 18 24
Information and communication 154 145 151 139
Financial and insurance 5,898 10,137 12,731 13,338
Real estate* 23,357 23,599 23,513 23,793
Professional, scientific andtechnical 1,227 1,782 3,015 3,198
Administrative and supportservices 273 355 875 908
Education 75 452 460 393
Human health and social work 21 11 12 8
Arts, recreation and other services 5 46 85 86
Source: Statistics Centre - Abu Dhabi* Includes real estate sales to non-residentsNote: Figures may not sum to totals due to rounding
Figure 1.7.1 Total stock of Foreign Investment (Million AED)
. Foreign Direct Investment . Portfolio Investment
. Other Investment
Source: Statistics Centre - Abu Dhabi
2015
2014
2013
2012
0 200,000 400,000
Statistical Yearbook of Abu Dhabi 2017 | 65
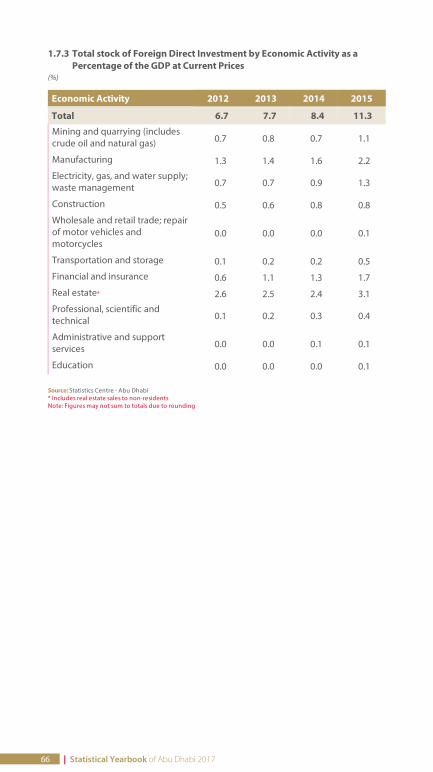
1.7.3 Total stock of Foreign Direct Investment by Economic Activity as aPercentage of the GDP at Current Prices
(%)
Economic Activity 2012 2013 2014 2015
Total 6.7 7.7 8.4 11.3
Mining and quarrying (includescrude oil and natural gas) 0.7 0.8 0.7 1.1
Manufacturing 1.3 1.4 1.6 2.2
Electricity, gas, and water supply;waste management 0.7 0.7 0.9 1.3
Construction 0.5 0.6 0.8 0.8
Wholesale and retail trade; repairof motor vehicles andmotorcycles
0.0 0.0 0.0 0.1
Transportation and storage 0.1 0.2 0.2 0.5
Financial and insurance 0.6 1.1 1.3 1.7
Real estate* 2.6 2.5 2.4 3.1
Professional, scientific andtechnical 0.1 0.2 0.3 0.4
Administrative and supportservices 0.0 0.0 0.1 0.1
Education 0.0 0.0 0.0 0.1
Source: Statistics Centre - Abu Dhabi* Includes real estate sales to non-residentsNote: Figures may not sum to totals due to rounding
66 | Statistical Yearbook of Abu Dhabi 2017
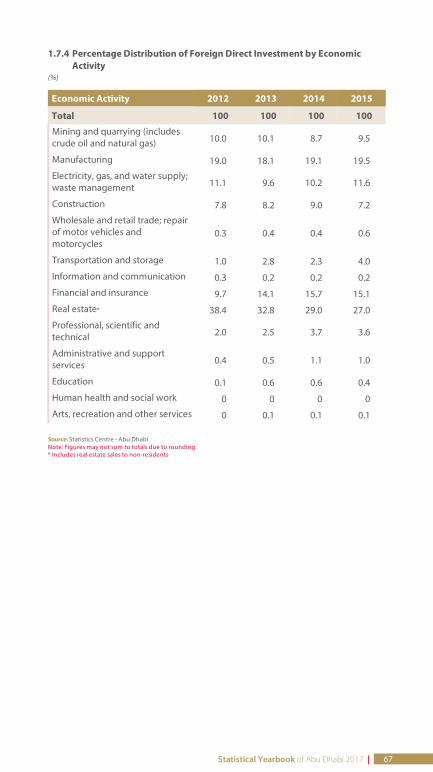
1.7.4 Percentage Distribution of Foreign Direct Investment by EconomicActivity
(%)
Economic Activity 2012 2013 2014 2015
Total 100 100 100 100
Mining and quarrying (includescrude oil and natural gas) 10.0 10.1 8.7 9.5
Manufacturing 19.0 18.1 19.1 19.5
Electricity, gas, and water supply;waste management 11.1 9.6 10.2 11.6
Construction 7.8 8.2 9.0 7.2
Wholesale and retail trade; repairof motor vehicles andmotorcycles
0.3 0.4 0.4 0.6
Transportation and storage 1.0 2.8 2.3 4.0
Information and communication 0.3 0.2 0.2 0.2
Financial and insurance 9.7 14.1 15.7 15.1
Real estate* 38.4 32.8 29.0 27.0
Professional, scientific andtechnical 2.0 2.5 3.7 3.6
Administrative and supportservices 0.4 0.5 1.1 1.0
Education 0.1 0.6 0.6 0.4
Human health and social work 0 0 0 0
Arts, recreation and other services 0 0.1 0.1 0.1
Source: Statistics Centre - Abu DhabiNote: Figures may not sum to totals due to rounding* Includes real estate sales to non-residents
Statistical Yearbook of Abu Dhabi 2017 | 67
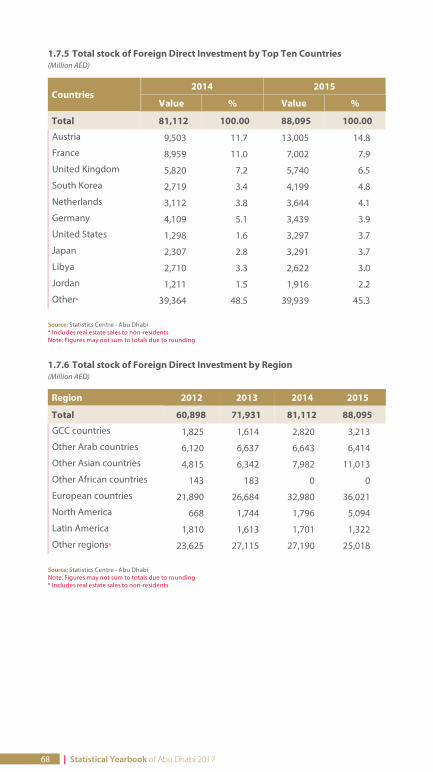
1.7.5 Total stock of Foreign Direct Investment by Top Ten Countries(Million AED)
Countries2014 2015
Value % Value %
Total 81,112 100.00 88,095 100.00
Austria 9,503 11.7 13,005 14.8
France 8,959 11.0 7,002 7.9
United Kingdom 5,820 7.2 5,740 6.5
South Korea 2,719 3.4 4,199 4.8
Netherlands 3,112 3.8 3,644 4.1
Germany 4,109 5.1 3,439 3.9
United States 1,298 1.6 3,297 3.7
Japan 2,307 2.8 3,291 3.7
Libya 2,710 3.3 2,622 3.0
Jordan 1,211 1.5 1,916 2.2
Other* 39,364 48.5 39,939 45.3
Source: Statistics Centre - Abu Dhabi* Includes real estate sales to non-residentsNote: Figures may not sum to totals due to rounding
1.7.6 Total stock of Foreign Direct Investment by Region(Million AED)
Region 2012 2013 2014 2015
Total 60,898 71,931 81,112 88,095
GCC countries 1,825 1,614 2,820 3,213
Other Arab countries 6,120 6,637 6,643 6,414
Other Asian countries 4,815 6,342 7,982 11,013
Other African countries 143 183 0 0
European countries 21,890 26,684 32,980 36,021
North America 668 1,744 1,796 5,094
Latin America 1,810 1,613 1,701 1,322
Other regions* 23,625 27,115 27,190 25,018
Source: Statistics Centre - Abu DhabiNote: Figures may not sum to totals due to rounding* Includes real estate sales to non-residents
68 | Statistical Yearbook of Abu Dhabi 2017
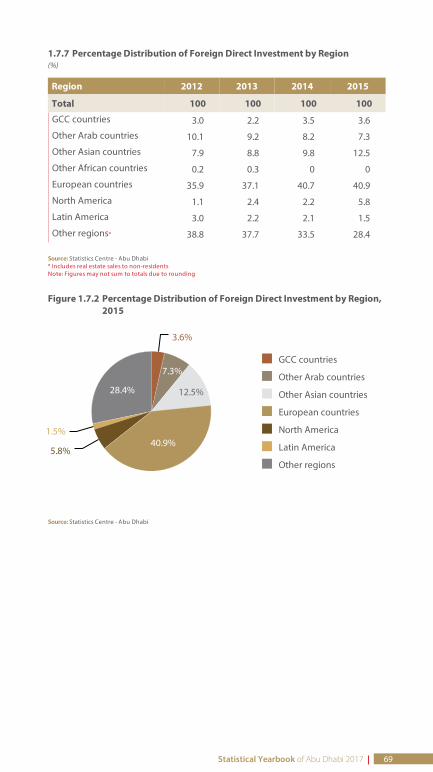
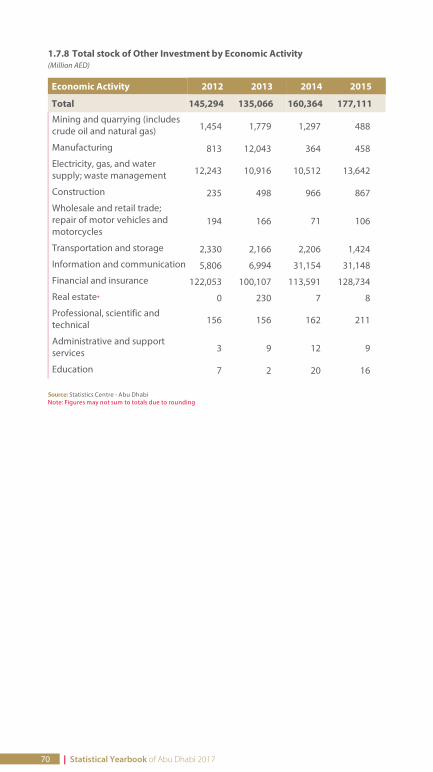
1.7.8 Total stock of Other Investment by Economic Activity(Million AED)
Economic Activity 2012 2013 2014 2015
Total 145,294 135,066 160,364 177,111
Mining and quarrying (includescrude oil and natural gas) 1,454 1,779 1,297 488
Manufacturing 813 12,043 364 458
Electricity, gas, and watersupply; waste management 12,243 10,916 10,512 13,642
Construction 235 498 966 867
Wholesale and retail trade;repair of motor vehicles andmotorcycles
194 166 71 106
Transportation and storage 2,330 2,166 2,206 1,424
Information and communication 5,806 6,994 31,154 31,148
Financial and insurance 122,053 100,107 113,591 128,734
Real estate* 0 230 7 8
Professional, scientific andtechnical 156 156 162 211
Administrative and supportservices 3 9 12 9
Education 7 2 20 16
Source: Statistics Centre - Abu DhabiNote: Figures may not sum to totals due to rounding
70 | Statistical Yearbook of Abu Dhabi 2017
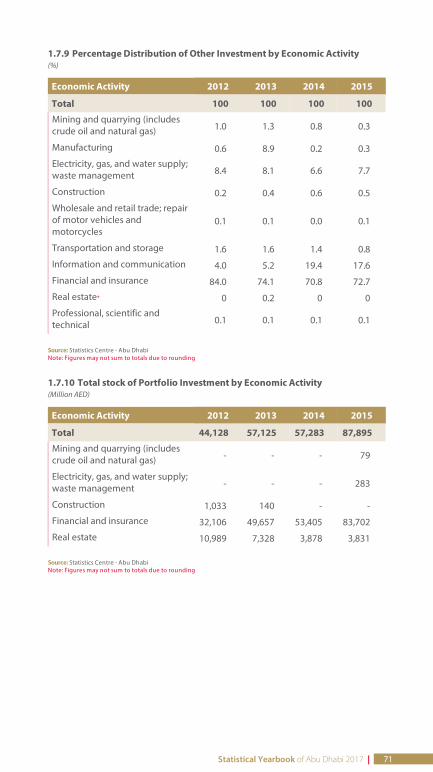
1.7.9 Percentage Distribution of Other Investment by Economic Activity(%)
Economic Activity 2012 2013 2014 2015
Total 100 100 100 100
Mining and quarrying (includescrude oil and natural gas) 1.0 1.3 0.8 0.3
Manufacturing 0.6 8.9 0.2 0.3
Electricity, gas, and water supply;waste management 8.4 8.1 6.6 7.7
Construction 0.2 0.4 0.6 0.5
Wholesale and retail trade; repairof motor vehicles andmotorcycles
0.1 0.1 0.0 0.1
Transportation and storage 1.6 1.6 1.4 0.8
Information and communication 4.0 5.2 19.4 17.6
Financial and insurance 84.0 74.1 70.8 72.7
Real estate* 0 0.2 0 0
Professional, scientific andtechnical 0.1 0.1 0.1 0.1
Source: Statistics Centre - Abu DhabiNote: Figures may not sum to totals due to rounding
1.7.10 Total stock of Portfolio Investment by Economic Activity(Million AED)
Economic Activity 2012 2013 2014 2015
Total 44,128 57,125 57,283 87,895
Mining and quarrying (includescrude oil and natural gas) - - - 79
Electricity, gas, and water supply;waste management - - - 283
Construction 1,033 140 - -
Financial and insurance 32,106 49,657 53,405 83,702
Real estate 10,989 7,328 3,878 3,831
Source: Statistics Centre - Abu DhabiNote: Figures may not sum to totals due to rounding
Statistical Yearbook of Abu Dhabi 2017 | 71
72 Statistical Yearbook of Abu Dhabi 2016
2. Industry and Business
• Business Enviroment
• Manufacturing
• Oil and Gas
• Petrochemicals
• Electricity and Water
• Construction
• Transportation
• Information and CommunicationTechnology
• Hotels
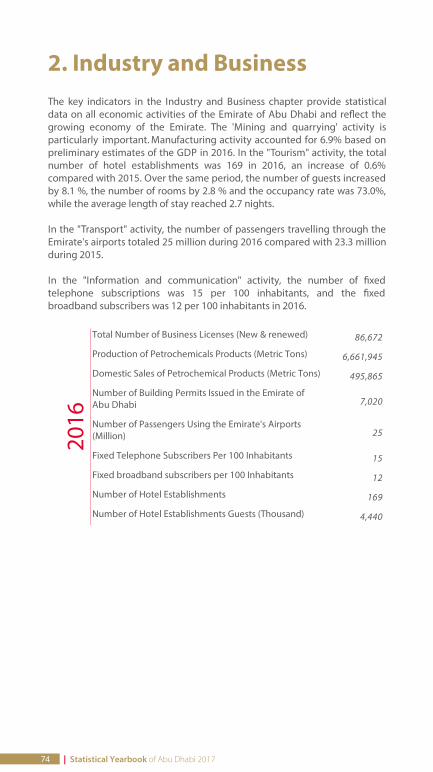
2. Industry and BusinessThe key indicators in the Industry and Business chapter provide statisticaldata on all economic activities of the Emirate of Abu Dhabi and re ect thegrowing economy of the Emirate. The 'Mining and quarrying' activity isparticularly important. Manufacturing activity accounted for 6.9% based onpreliminary estimates of the GDP in 2016. In the "Tourism" activity, the totalnumber of hotel establishments was 169 in 2016, an increase of 0.6%compared with 2015. Over the same period, the number of guests increasedby 8.1 %, the number of rooms by 2.8 % and the occupancy rate was 73.0%,while the average length of stay reached 2.7 nights.
In the "Transport" activity, the number of passengers travelling through theEmirate's airports totaled 25 million during 2016 compared with 23.3 millionduring 2015.
In the "Information and communication" activity, the number of xedtelephone subscriptions was 15 per 100 inhabitants, and the xedbroadband subscribers was 12 per 100 inhabitants in 2016.
Total Number of Business Licenses (New & renewed) 86,672
Production of Petrochemicals Products (Metric Tons) 6,661,945
Domestic Sales of Petrochemical Products (Metric Tons) 495,865
Number of Building Permits Issued in the Emirate ofAbu Dhabi 7,020
Number of Passengers Using the Emirate's Airports(Million) 25
Fixed Telephone Subscribers Per 100 Inhabitants 15
Fixed broadband subscribers per 100 Inhabitants 12
Number of Hotel Establishments 169
Number of Hotel Establishments Guests (Thousand) 4,440
2016
74 | Statistical Yearbook of Abu Dhabi 2017
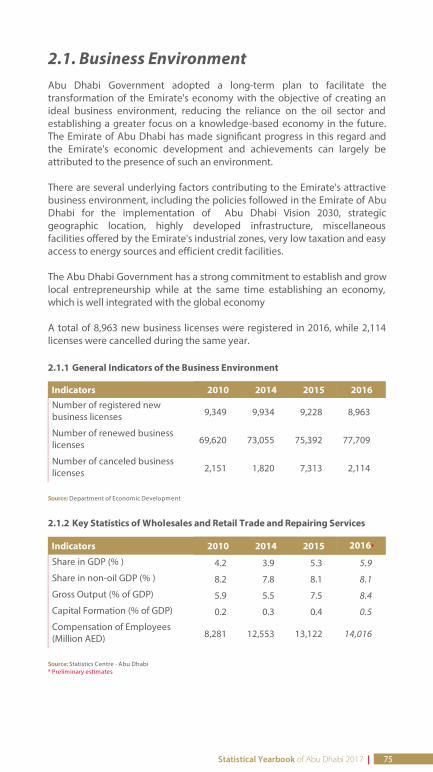
2.1. Business EnvironmentAbu Dhabi Government adopted a long-term plan to facilitate thetransformation of the Emirate's economy with the objective of creating anideal business environment, reducing the reliance on the oil sector andestablishing a greater focus on a knowledge-based economy in the future.The Emirate of Abu Dhabi has made signi cant progress in this regard andthe Emirate's economic development and achievements can largely beattributed to the presence of such an environment.
There are several underlying factors contributing to the Emirate's attractivebusiness environment, including the policies followed in the Emirate of AbuDhabi for the implementation of Abu Dhabi Vision 2030, strategicgeographic location, highly developed infrastructure, miscellaneousfacilities offered by the Emirate's industrial zones, very low taxation and easyaccess to energy sources and efficient credit facilities.
The Abu Dhabi Government has a strong commitment to establish and growlocal entrepreneurship while at the same time establishing an economy,which is well integrated with the global economy
A total of 8,963 new business licenses were registered in 2016, while 2,114licenses were cancelled during the same year.
2.1.1 General Indicators of the Business Environment
Indicators 2010 2014 2015 2016Number of registered newbusiness licenses 9,349 9,934 9,228 8,963
Number of renewed businesslicenses 69,620 73,055 75,392 77,709
Number of canceled businesslicenses 2,151 1,820 7,313 2,114
Source: Department of Economic Development
2.1.2 Key Statistics of Wholesales and Retail Trade and Repairing Services
Indicators 2010 2014 2015 2016*
Share in GDP (% ) 4.2 3.9 5.3 5.9
Share in non-oil GDP (% ) 8.2 7.8 8.1 8.1
Gross Output (% of GDP) 5.9 5.5 7.5 8.4
Capital Formation (% of GDP) 0.2 0.3 0.4 0.5
Compensation of Employees(Million AED) 8,281 12,553 13,122 14,016
Source: Statistics Centre - Abu Dhabi* Preliminary estimates
Statistical Yearbook of Abu Dhabi 2017 | 75
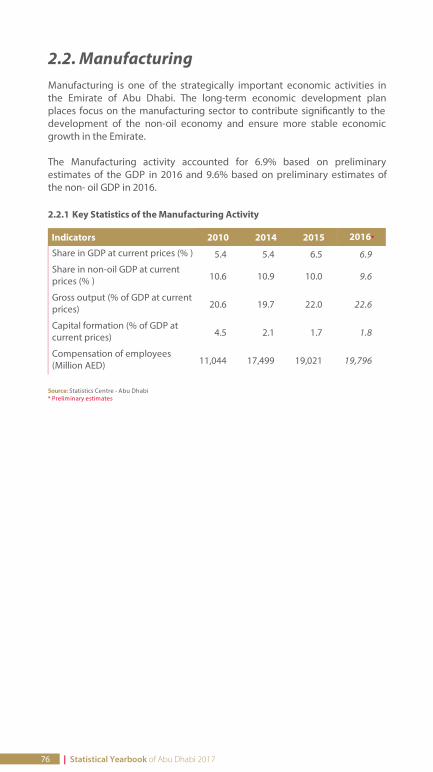
2.2. ManufacturingManufacturing is one of the strategically important economic activities inthe Emirate of Abu Dhabi. The long-term economic development planplaces focus on the manufacturing sector to contribute signi cantly to thedevelopment of the non-oil economy and ensure more stable economicgrowth in the Emirate.
The Manufacturing activity accounted for 6.9% based on preliminaryestimates of the GDP in 2016 and 9.6% based on preliminary estimates ofthe non- oil GDP in 2016.
2.2.1 Key Statistics of the Manufacturing Activity
Indicators 2010 2014 2015 2016*
Share in GDP at current prices (% ) 5.4 5.4 6.5 6.9
Share in non-oil GDP at currentprices (% ) 10.6 10.9 10.0 9.6
Gross output (% of GDP at currentprices) 20.6 19.7 22.0 22.6
Capital formation (% of GDP atcurrent prices) 4.5 2.1 1.7 1.8
Compensation of employees(Million AED) 11,044 17,499 19,021 19,796
Source: Statistics Centre - Abu Dhabi* Preliminary estimates
76 | Statistical Yearbook of Abu Dhabi 2017
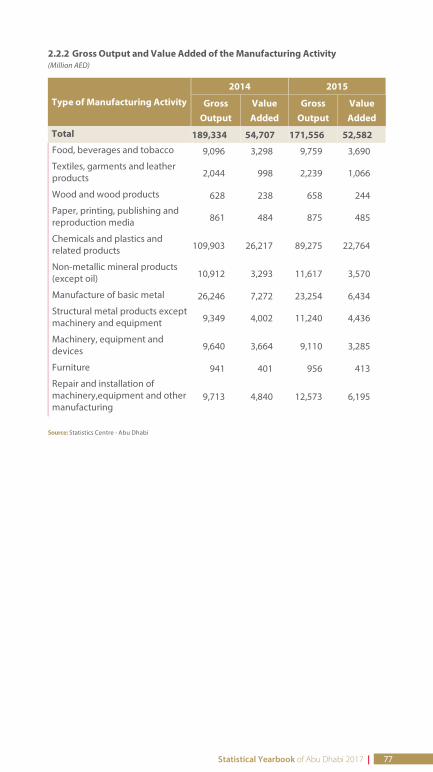
2.2.2 Gross Output and Value Added of the Manufacturing Activity(Million AED)
Type of Manufacturing Activity
2014 2015
GrossOutput
ValueAdded
GrossOutput
ValueAdded
Total 189,334 54,707 171,556 52,582 Food, beverages and tobacco 9,096 3,298 9,759 3,690
Textiles, garments and leatherproducts 2,044 998 2,239 1,066
Wood and wood products 628 238 658 244
Paper, printing, publishing andreproduction media 861 484 875 485
Chemicals and plastics andrelated products 109,903 26,217 89,275 22,764
Non-metallic mineral products(except oil) 10,912 3,293 11,617 3,570
Manufacture of basic metal 26,246 7,272 23,254 6,434
Structural metal products exceptmachinery and equipment 9,349 4,002 11,240 4,436
Machinery, equipment anddevices 9,640 3,664 9,110 3,285
Furniture 941 401 956 413
Repair and installation ofmachinery,equipment and othermanufacturing
9,713 4,840 12,573 6,195
Source: Statistics Centre - Abu Dhabi
Statistical Yearbook of Abu Dhabi 2017 | 77
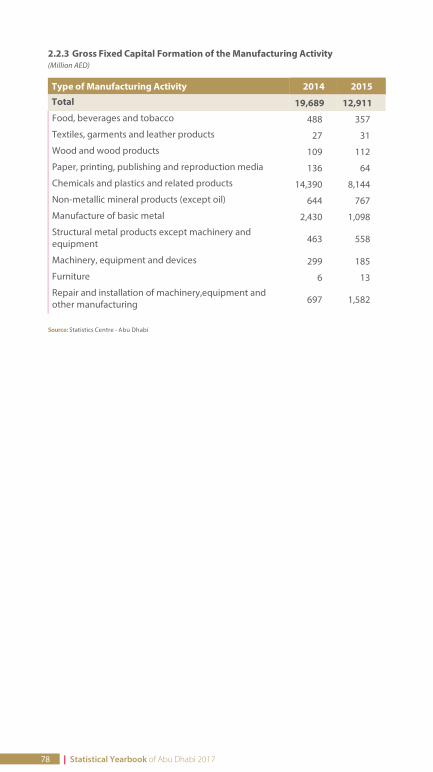
2.2.3 Gross Fixed Capital Formation of the Manufacturing Activity(Million AED)
Type of Manufacturing Activity 2014 2015
Total 19,689 12,911 Food, beverages and tobacco 488 357
Textiles, garments and leather products 27 31
Wood and wood products 109 112
Paper, printing, publishing and reproduction media 136 64
Chemicals and plastics and related products 14,390 8,144
Non-metallic mineral products (except oil) 644 767
Manufacture of basic metal 2,430 1,098
Structural metal products except machinery andequipment 463 558
Machinery, equipment and devices 299 185
Furniture 6 13
Repair and installation of machinery,equipment andother manufacturing 697 1,582
Source: Statistics Centre - Abu Dhabi
78 | Statistical Yearbook of Abu Dhabi 2017
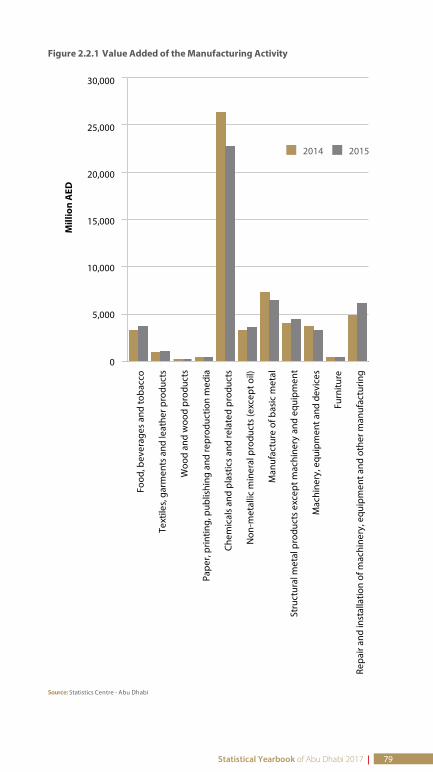
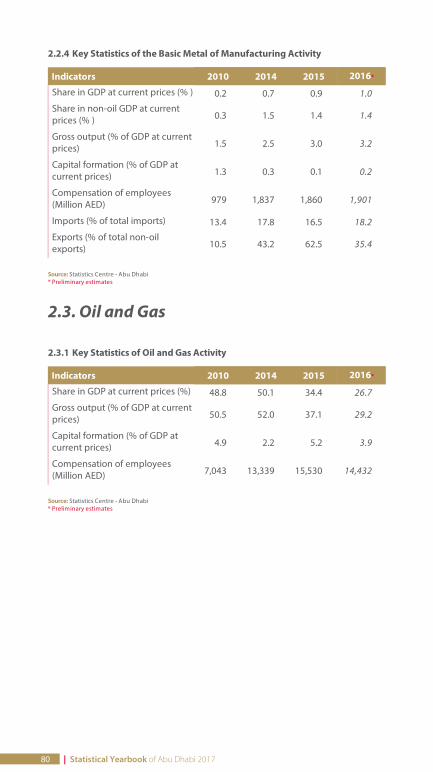
2.2.4 Key Statistics of the Basic Metal of Manufacturing Activity
Indicators 2010 2014 2015 2016*
Share in GDP at current prices (% ) 0.2 0.7 0.9 1.0
Share in non-oil GDP at currentprices (% ) 0.3 1.5 1.4 1.4
Gross output (% of GDP at currentprices) 1.5 2.5 3.0 3.2
Capital formation (% of GDP atcurrent prices) 1.3 0.3 0.1 0.2
Compensation of employees(Million AED) 979 1,837 1,860 1,901
Imports (% of total imports) 13.4 17.8 16.5 18.2
Exports (% of total non-oilexports) 10.5 43.2 62.5 35.4
Source: Statistics Centre - Abu Dhabi* Preliminary estimates
2.3. Oil and Gas
2.3.1 Key Statistics of Oil and Gas Activity
Indicators 2010 2014 2015 2016*
Share in GDP at current prices (%) 48.8 50.1 34.4 26.7
Gross output (% of GDP at currentprices) 50.5 52.0 37.1 29.2
Capital formation (% of GDP atcurrent prices) 4.9 2.2 5.2 3.9
Compensation of employees(Million AED) 7,043 13,339 15,530 14,432
Source: Statistics Centre - Abu Dhabi* Preliminary estimates
80 | Statistical Yearbook of Abu Dhabi 2017
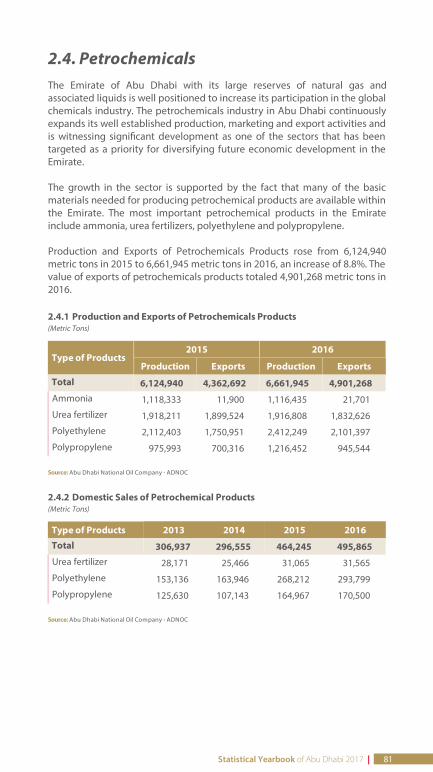
2.4. PetrochemicalsThe Emirate of Abu Dhabi with its large reserves of natural gas andassociated liquids is well positioned to increase its participation in the globalchemicals industry. The petrochemicals industry in Abu Dhabi continuouslyexpands its well established production, marketing and export activities andis witnessing signi cant development as one of the sectors that has beentargeted as a priority for diversifying future economic development in theEmirate.
The growth in the sector is supported by the fact that many of the basicmaterials needed for producing petrochemical products are available withinthe Emirate. The most important petrochemical products in the Emirateinclude ammonia, urea fertilizers, polyethylene and polypropylene.
Production and Exports of Petrochemicals Products rose from 6,124,940metric tons in 2015 to 6,661,945 metric tons in 2016, an increase of 8.8%. Thevalue of exports of petrochemicals products totaled 4,901,268 metric tons in2016.
2.4.1 Production and Exports of Petrochemicals Products(Metric Tons)
Type of Products2015 2016
Production Exports Production Exports
Total 6,124,940 4,362,692 6,661,945 4,901,268 Ammonia 1,118,333 11,900 1,116,435 21,701
Urea fertilizer 1,918,211 1,899,524 1,916,808 1,832,626
Polyethylene 2,112,403 1,750,951 2,412,249 2,101,397
Polypropylene 975,993 700,316 1,216,452 945,544
Source: Abu Dhabi National Oil Company - ADNOC
2.4.2 Domestic Sales of Petrochemical Products(Metric Tons)
Type of Products 2013 2014 2015 2016
Total 306,937 296,555 464,245 495,865 Urea fertilizer 28,171 25,466 31,065 31,565
Polyethylene 153,136 163,946 268,212 293,799
Polypropylene 125,630 107,143 164,967 170,500
Source: Abu Dhabi National Oil Company - ADNOC
Statistical Yearbook of Abu Dhabi 2017 | 81
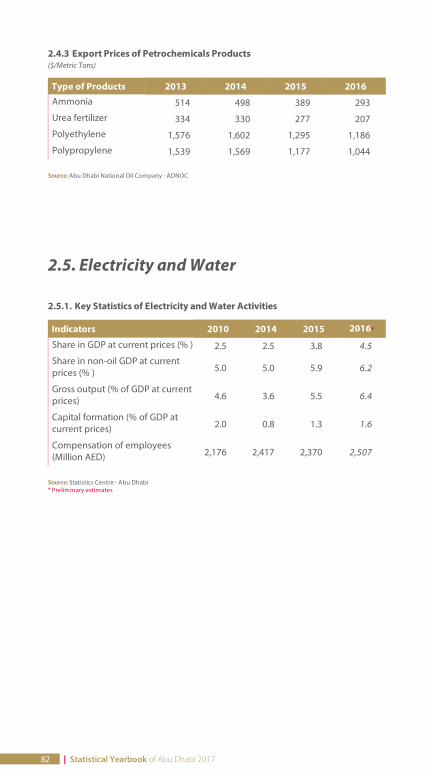
2.4.3 Export Prices of Petrochemicals Products($/Metric Tons)
Type of Products 2013 2014 2015 2016Ammonia 514 498 389 293
Urea fertilizer 334 330 277 207
Polyethylene 1,576 1,602 1,295 1,186
Polypropylene 1,539 1,569 1,177 1,044
Source: Abu Dhabi National Oil Company - ADNOC
2.5. Electricity and Water
2.5.1. Key Statistics of Electricity and Water Activities
Indicators 2010 2014 2015 2016*
Share in GDP at current prices (% ) 2.5 2.5 3.8 4.5
Share in non-oil GDP at currentprices (% ) 5.0 5.0 5.9 6.2
Gross output (% of GDP at currentprices) 4.6 3.6 5.5 6.4
Capital formation (% of GDP atcurrent prices) 2.0 0.8 1.3 1.6
Compensation of employees(Million AED) 2,176 2,417 2,370 2,507
Source: Statistics Centre - Abu Dhabi* Preliminary estimates
82 | Statistical Yearbook of Abu Dhabi 2017
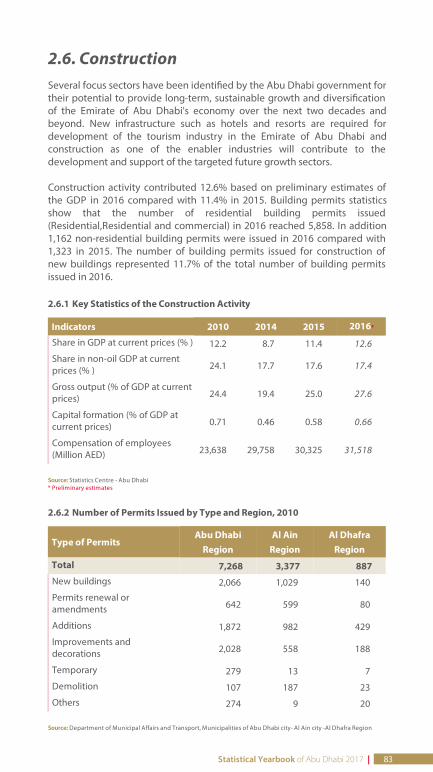
2.6. ConstructionSeveral focus sectors have been identi ed by the Abu Dhabi government fortheir potential to provide long-term, sustainable growth and diversi cationof the Emirate of Abu Dhabi's economy over the next two decades andbeyond. New infrastructure such as hotels and resorts are required fordevelopment of the tourism industry in the Emirate of Abu Dhabi andconstruction as one of the enabler industries will contribute to thedevelopment and support of the targeted future growth sectors.
Construction activity contributed 12.6% based on preliminary estimates ofthe GDP in 2016 compared with 11.4% in 2015. Building permits statisticsshow that the number of residential building permits issued(Residential,Residential and commercial) in 2016 reached 5,858. In addition1,162 non-residential building permits were issued in 2016 compared with1,323 in 2015. The number of building permits issued for construction ofnew buildings represented 11.7% of the total number of building permitsissued in 2016.
2.6.1 Key Statistics of the Construction Activity
Indicators 2010 2014 2015 2016*
Share in GDP at current prices (% ) 12.2 8.7 11.4 12.6
Share in non-oil GDP at currentprices (% ) 24.1 17.7 17.6 17.4
Gross output (% of GDP at currentprices) 24.4 19.4 25.0 27.6
Capital formation (% of GDP atcurrent prices) 0.71 0.46 0.58 0.66
Compensation of employees(Million AED) 23,638 29,758 30,325 31,518
Source: Statistics Centre - Abu Dhabi* Preliminary estimates
2.6.2 Number of Permits Issued by Type and Region, 2010
Type of PermitsAbu Dhabi
RegionAl Ain
RegionAl Dhafra
Region
Total 7,268 3,377 887 New buildings 2,066 1,029 140
Permits renewal oramendments 642 599 80
Additions 1,872 982 429
Improvements anddecorations 2,028 558 188
Temporary 279 13 7
Demolition 107 187 23
Others 274 9 20
Source: Department of Municipal Affairs and Transport, Municipalities of Abu Dhabi city- Al Ain city -Al Dhafra Region
Statistical Yearbook of Abu Dhabi 2017 | 83
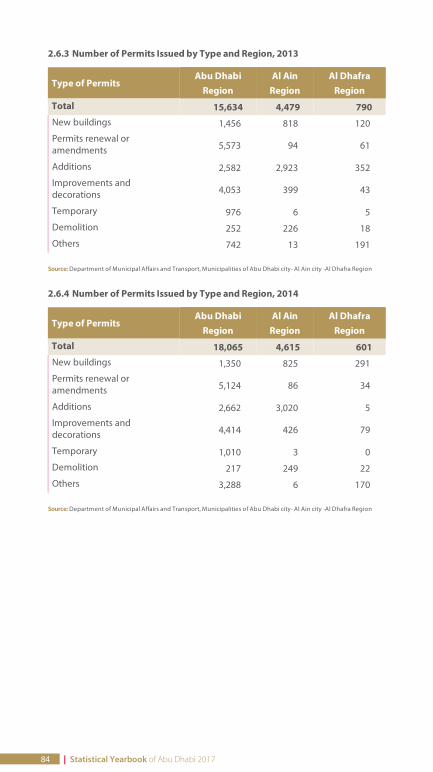
2.6.3 Number of Permits Issued by Type and Region, 2013
Type of PermitsAbu Dhabi
RegionAl Ain
RegionAl Dhafra
Region
Total 15,634 4,479 790 New buildings 1,456 818 120
Permits renewal oramendments 5,573 94 61
Additions 2,582 2,923 352
Improvements anddecorations 4,053 399 43
Temporary 976 6 5
Demolition 252 226 18
Others 742 13 191
Source: Department of Municipal Affairs and Transport, Municipalities of Abu Dhabi city- Al Ain city -Al Dhafra Region
2.6.4 Number of Permits Issued by Type and Region, 2014
Type of PermitsAbu Dhabi
RegionAl Ain
RegionAl Dhafra
Region
Total 18,065 4,615 601 New buildings 1,350 825 291
Permits renewal oramendments 5,124 86 34
Additions 2,662 3,020 5
Improvements anddecorations 4,414 426 79
Temporary 1,010 3 0
Demolition 217 249 22
Others 3,288 6 170
Source: Department of Municipal Affairs and Transport, Municipalities of Abu Dhabi city- Al Ain city -Al Dhafra Region
84 | Statistical Yearbook of Abu Dhabi 2017
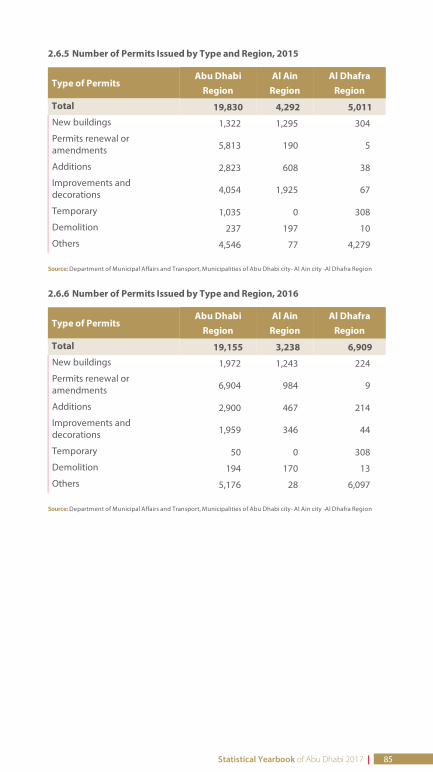
2.6.5 Number of Permits Issued by Type and Region, 2015
Type of PermitsAbu Dhabi
RegionAl Ain
RegionAl Dhafra
Region
Total 19,830 4,292 5,011 New buildings 1,322 1,295 304
Permits renewal oramendments 5,813 190 5
Additions 2,823 608 38
Improvements anddecorations 4,054 1,925 67
Temporary 1,035 0 308
Demolition 237 197 10
Others 4,546 77 4,279
Source: Department of Municipal Affairs and Transport, Municipalities of Abu Dhabi city- Al Ain city -Al Dhafra Region
2.6.6 Number of Permits Issued by Type and Region, 2016
Type of PermitsAbu Dhabi
RegionAl Ain
RegionAl Dhafra
Region
Total 19,155 3,238 6,909 New buildings 1,972 1,243 224
Permits renewal oramendments 6,904 984 9
Additions 2,900 467 214
Improvements anddecorations 1,959 346 44
Temporary 50 0 308
Demolition 194 170 13
Others 5,176 28 6,097
Source: Department of Municipal Affairs and Transport, Municipalities of Abu Dhabi city- Al Ain city -Al Dhafra Region
Statistical Yearbook of Abu Dhabi 2017 | 85
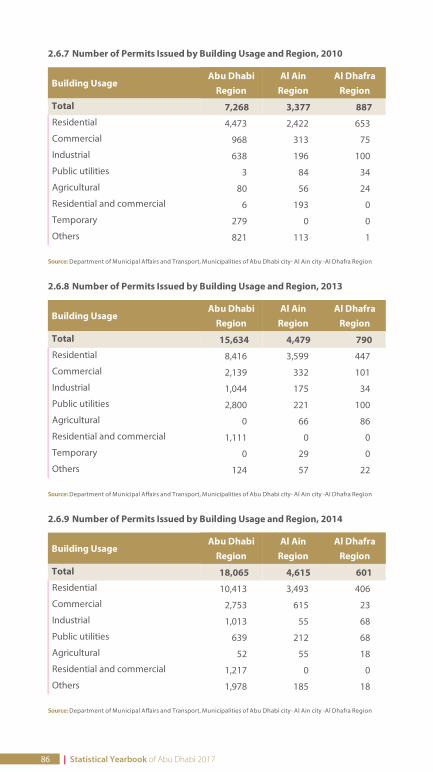
2.6.7 Number of Permits Issued by Building Usage and Region, 2010
Building UsageAbu Dhabi
RegionAl Ain
RegionAl Dhafra
Region
Total 7,268 3,377 887 Residential 4,473 2,422 653
Commercial 968 313 75
Industrial 638 196 100
Public utilities 3 84 34
Agricultural 80 56 24
Residential and commercial 6 193 0
Temporary 279 0 0
Others 821 113 1
Source: Department of Municipal Affairs and Transport, Municipalities of Abu Dhabi city- Al Ain city -Al Dhafra Region
2.6.8 Number of Permits Issued by Building Usage and Region, 2013
Building UsageAbu Dhabi
RegionAl Ain
RegionAl Dhafra
Region
Total 15,634 4,479 790 Residential 8,416 3,599 447
Commercial 2,139 332 101
Industrial 1,044 175 34
Public utilities 2,800 221 100
Agricultural 0 66 86
Residential and commercial 1,111 0 0
Temporary 0 29 0
Others 124 57 22
Source: Department of Municipal Affairs and Transport, Municipalities of Abu Dhabi city- Al Ain city -Al Dhafra Region
2.6.9 Number of Permits Issued by Building Usage and Region, 2014
Building UsageAbu Dhabi
RegionAl Ain
RegionAl Dhafra
Region
Total 18,065 4,615 601 Residential 10,413 3,493 406
Commercial 2,753 615 23
Industrial 1,013 55 68
Public utilities 639 212 68
Agricultural 52 55 18
Residential and commercial 1,217 0 0
Others 1,978 185 18
Source: Department of Municipal Affairs and Transport, Municipalities of Abu Dhabi city- Al Ain city -Al Dhafra Region
86 | Statistical Yearbook of Abu Dhabi 2017
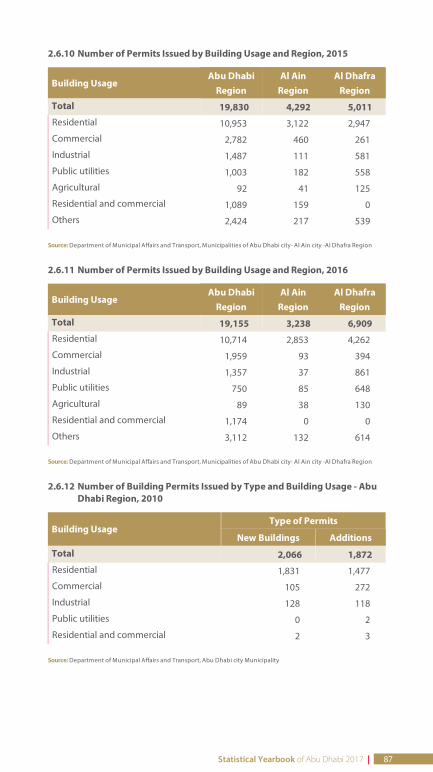
2.6.10 Number of Permits Issued by Building Usage and Region, 2015
Building UsageAbu Dhabi
RegionAl Ain
RegionAl Dhafra
Region
Total 19,830 4,292 5,011 Residential 10,953 3,122 2,947
Commercial 2,782 460 261
Industrial 1,487 111 581
Public utilities 1,003 182 558
Agricultural 92 41 125
Residential and commercial 1,089 159 0
Others 2,424 217 539
Source: Department of Municipal Affairs and Transport, Municipalities of Abu Dhabi city- Al Ain city -Al Dhafra Region
2.6.11 Number of Permits Issued by Building Usage and Region, 2016
Building UsageAbu Dhabi
RegionAl Ain
RegionAl Dhafra
Region
Total 19,155 3,238 6,909 Residential 10,714 2,853 4,262
Commercial 1,959 93 394
Industrial 1,357 37 861
Public utilities 750 85 648
Agricultural 89 38 130
Residential and commercial 1,174 0 0
Others 3,112 132 614
Source: Department of Municipal Affairs and Transport, Municipalities of Abu Dhabi city- Al Ain city -Al Dhafra Region
2.6.12 Number of Building Permits Issued by Type and Building Usage - AbuDhabi Region, 2010
Building UsageType of Permits
New Buildings Additions
Total 2,066 1,872 Residential 1,831 1,477
Commercial 105 272
Industrial 128 118
Public utilities 0 2
Residential and commercial 2 3
Source: Department of Municipal Affairs and Transport, Abu Dhabi city Municipality
Statistical Yearbook of Abu Dhabi 2017 | 87
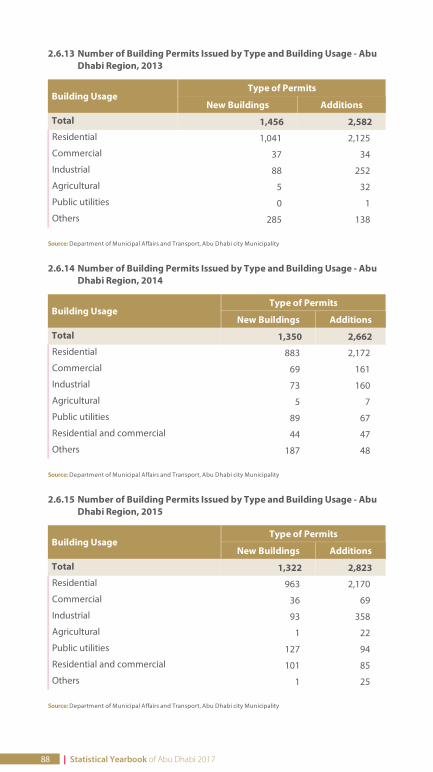
2.6.13 Number of Building Permits Issued by Type and Building Usage - AbuDhabi Region, 2013
Building UsageType of Permits
New Buildings Additions
Total 1,456 2,582 Residential 1,041 2,125
Commercial 37 34
Industrial 88 252
Agricultural 5 32
Public utilities 0 1
Others 285 138
Source: Department of Municipal Affairs and Transport, Abu Dhabi city Municipality
2.6.14 Number of Building Permits Issued by Type and Building Usage - AbuDhabi Region, 2014
Building UsageType of Permits
New Buildings Additions
Total 1,350 2,662 Residential 883 2,172
Commercial 69 161
Industrial 73 160
Agricultural 5 7
Public utilities 89 67
Residential and commercial 44 47
Others 187 48
Source: Department of Municipal Affairs and Transport, Abu Dhabi city Municipality
2.6.15 Number of Building Permits Issued by Type and Building Usage - AbuDhabi Region, 2015
Building UsageType of Permits
New Buildings Additions
Total 1,322 2,823 Residential 963 2,170
Commercial 36 69
Industrial 93 358
Agricultural 1 22
Public utilities 127 94
Residential and commercial 101 85
Others 1 25
Source: Department of Municipal Affairs and Transport, Abu Dhabi city Municipality
88 | Statistical Yearbook of Abu Dhabi 2017
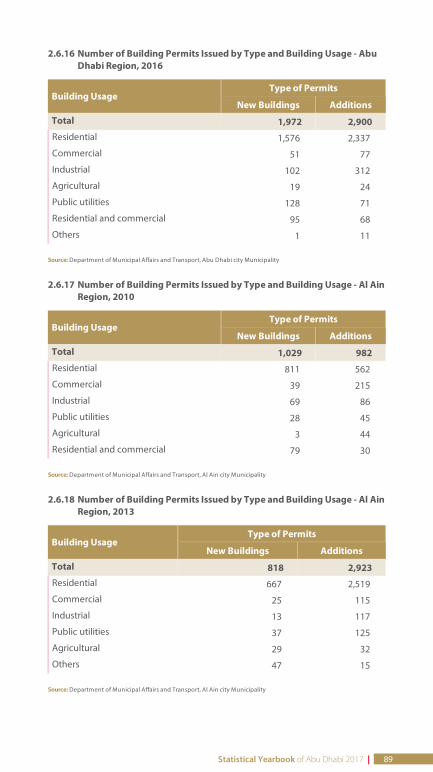
2.6.16 Number of Building Permits Issued by Type and Building Usage - AbuDhabi Region, 2016
Building UsageType of Permits
New Buildings Additions
Total 1,972 2,900 Residential 1,576 2,337
Commercial 51 77
Industrial 102 312
Agricultural 19 24
Public utilities 128 71
Residential and commercial 95 68
Others 1 11
Source: Department of Municipal Affairs and Transport, Abu Dhabi city Municipality
2.6.17 Number of Building Permits Issued by Type and Building Usage - Al AinRegion, 2010
Building UsageType of Permits
New Buildings Additions
Total 1,029 982 Residential 811 562
Commercial 39 215
Industrial 69 86
Public utilities 28 45
Agricultural 3 44
Residential and commercial 79 30
Source: Department of Municipal Affairs and Transport, Al Ain city Municipality
2.6.18 Number of Building Permits Issued by Type and Building Usage - Al AinRegion, 2013
Building UsageType of Permits
New Buildings Additions
Total 818 2,923 Residential 667 2,519
Commercial 25 115
Industrial 13 117
Public utilities 37 125
Agricultural 29 32
Others 47 15
Source: Department of Municipal Affairs and Transport, Al Ain city Municipality
Statistical Yearbook of Abu Dhabi 2017 | 89
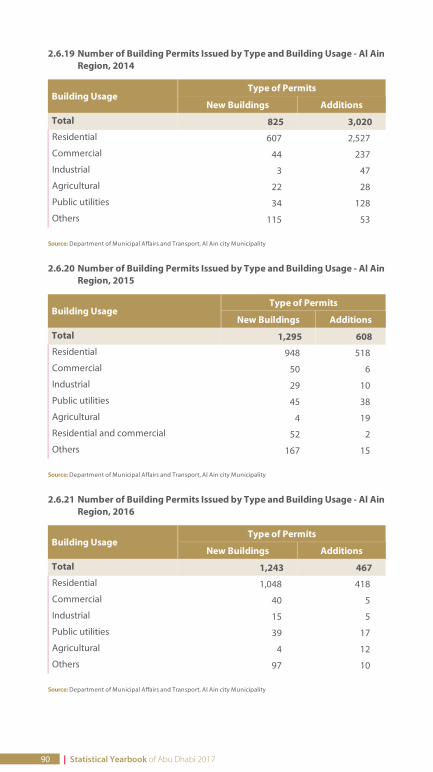
2.6.19 Number of Building Permits Issued by Type and Building Usage - Al AinRegion, 2014
Building UsageType of Permits
New Buildings Additions
Total 825 3,020 Residential 607 2,527
Commercial 44 237
Industrial 3 47
Agricultural 22 28
Public utilities 34 128
Others 115 53
Source: Department of Municipal Affairs and Transport, Al Ain city Municipality
2.6.20 Number of Building Permits Issued by Type and Building Usage - Al AinRegion, 2015
Building UsageType of Permits
New Buildings Additions
Total 1,295 608 Residential 948 518
Commercial 50 6
Industrial 29 10
Public utilities 45 38
Agricultural 4 19
Residential and commercial 52 2
Others 167 15
Source: Department of Municipal Affairs and Transport, Al Ain city Municipality
2.6.21 Number of Building Permits Issued by Type and Building Usage - Al AinRegion, 2016
Building UsageType of Permits
New Buildings Additions
Total 1,243 467 Residential 1,048 418
Commercial 40 5
Industrial 15 5
Public utilities 39 17
Agricultural 4 12
Others 97 10
Source: Department of Municipal Affairs and Transport, Al Ain city Municipality
90 | Statistical Yearbook of Abu Dhabi 2017
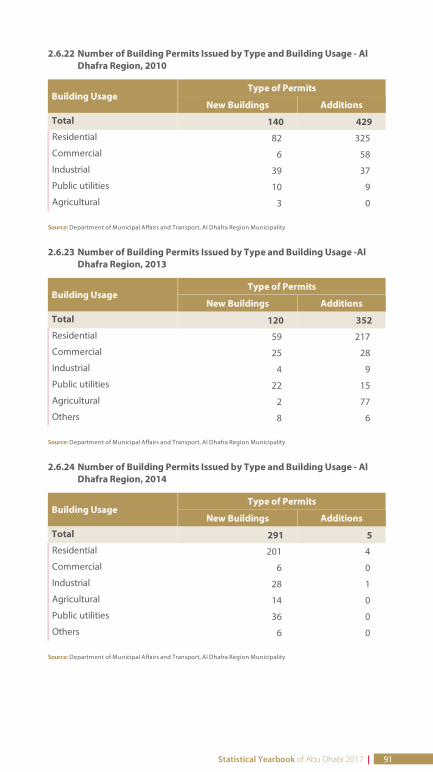
2.6.22 Number of Building Permits Issued by Type and Building Usage - AlDhafra Region, 2010
Building UsageType of Permits
New Buildings Additions
Total 140 429 Residential 82 325
Commercial 6 58
Industrial 39 37
Public utilities 10 9
Agricultural 3 0
Source: Department of Municipal Affairs and Transport, Al Dhafra Region Municipality
2.6.23 Number of Building Permits Issued by Type and Building Usage -AlDhafra Region, 2013
Building UsageType of Permits
New Buildings Additions
Total 120 352 Residential 59 217
Commercial 25 28
Industrial 4 9
Public utilities 22 15
Agricultural 2 77
Others 8 6
Source: Department of Municipal Affairs and Transport, Al Dhafra Region Municipality
2.6.24 Number of Building Permits Issued by Type and Building Usage - AlDhafra Region, 2014
Building UsageType of Permits
New Buildings Additions
Total 291 5 Residential 201 4
Commercial 6 0
Industrial 28 1
Agricultural 14 0
Public utilities 36 0
Others 6 0
Source: Department of Municipal Affairs and Transport, Al Dhafra Region Municipality
Statistical Yearbook of Abu Dhabi 2017 | 91
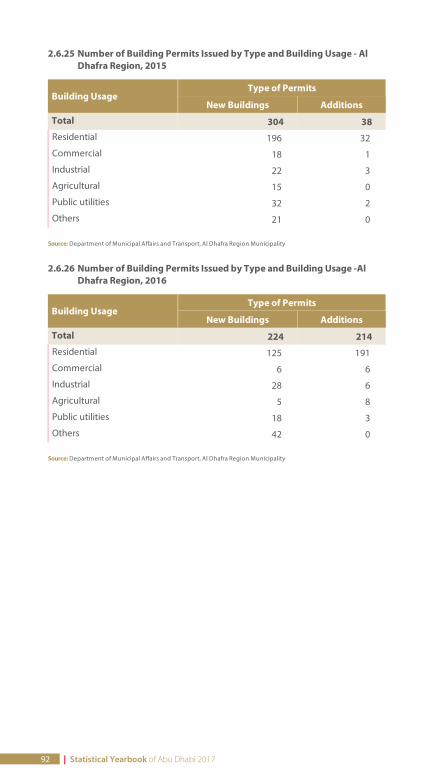
2.6.25 Number of Building Permits Issued by Type and Building Usage - AlDhafra Region, 2015
Building UsageType of Permits
New Buildings Additions
Total 304 38 Residential 196 32
Commercial 18 1
Industrial 22 3
Agricultural 15 0
Public utilities 32 2
Others 21 0
Source: Department of Municipal Affairs and Transport, Al Dhafra Region Municipality
2.6.26 Number of Building Permits Issued by Type and Building Usage -AlDhafra Region, 2016
Building UsageType of Permits
New Buildings Additions
Total 224 214 Residential 125 191
Commercial 6 6
Industrial 28 6
Agricultural 5 8
Public utilities 18 3
Others 42 0
Source: Department of Municipal Affairs and Transport, Al Dhafra Region Municipality
92 | Statistical Yearbook of Abu Dhabi 2017
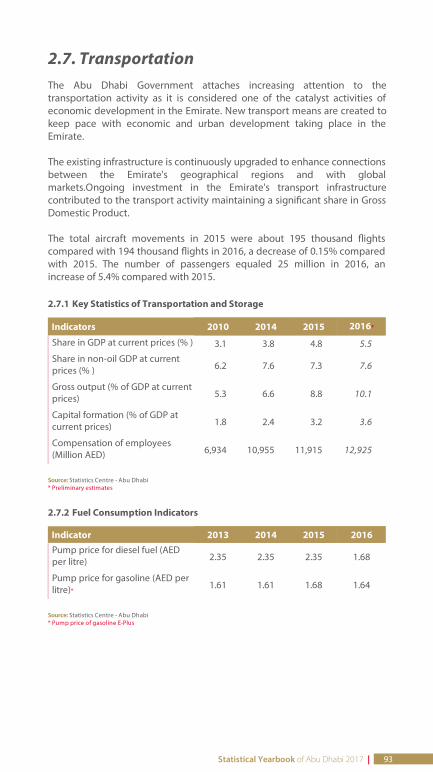
2.7. TransportationThe Abu Dhabi Government attaches increasing attention to thetransportation activity as it is considered one of the catalyst activities ofeconomic development in the Emirate. New transport means are created tokeep pace with economic and urban development taking place in theEmirate.
The existing infrastructure is continuously upgraded to enhance connectionsbetween the Emirate's geographical regions and with globalmarkets.Ongoing investment in the Emirate's transport infrastructurecontributed to the transport activity maintaining a signi cant share in GrossDomestic Product.
The total aircraft movements in 2015 were about 195 thousand ightscompared with 194 thousand ights in 2016, a decrease of 0.15% comparedwith 2015. The number of passengers equaled 25 million in 2016, anincrease of 5.4% compared with 2015.
2.7.1 Key Statistics of Transportation and Storage
Indicators 2010 2014 2015 2016*
Share in GDP at current prices (% ) 3.1 3.8 4.8 5.5
Share in non-oil GDP at currentprices (% ) 6.2 7.6 7.3 7.6
Gross output (% of GDP at currentprices) 5.3 6.6 8.8 10.1
Capital formation (% of GDP atcurrent prices) 1.8 2.4 3.2 3.6
Compensation of employees(Million AED) 6,934 10,955 11,915 12,925
Source: Statistics Centre - Abu Dhabi* Preliminary estimates
2.7.2 Fuel Consumption Indicators
Indicator 2013 2014 2015 2016Pump price for diesel fuel (AEDper litre) 2.35 2.35 2.35 1.68
Pump price for gasoline (AED perlitre)*
1.61 1.61 1.68 1.64
Source: Statistics Centre - Abu Dhabi* Pump price of gasoline E-Plus
Statistical Yearbook of Abu Dhabi 2017 | 93
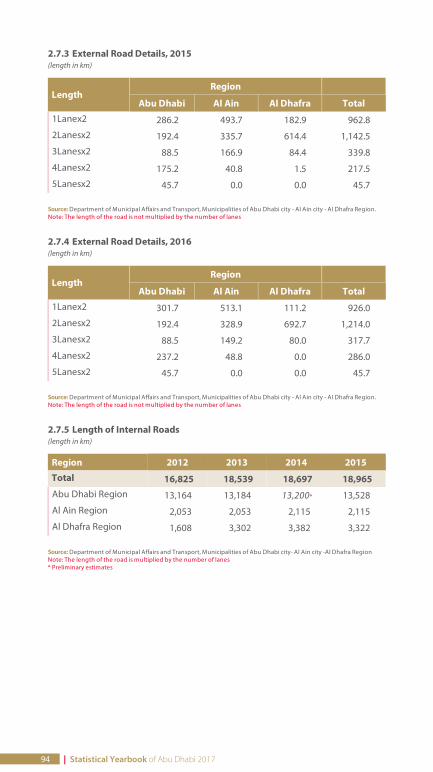
2.7.3 External Road Details, 2015(length in km)
LengthRegion
Abu Dhabi Al Ain Al Dhafra Total
1Lanex2 286.2 493.7 182.9 962.8
2Lanesx2 192.4 335.7 614.4 1,142.5
3Lanesx2 88.5 166.9 84.4 339.8
4Lanesx2 175.2 40.8 1.5 217.5
5Lanesx2 45.7 0.0 0.0 45.7
Source: Department of Municipal Affairs and Transport, Municipalities of Abu Dhabi city - Al Ain city - Al Dhafra Region.Note: The length of the road is not multiplied by the number of lanes
2.7.4 External Road Details, 2016(length in km)
LengthRegion
Abu Dhabi Al Ain Al Dhafra Total
1Lanex2 301.7 513.1 111.2 926.0
2Lanesx2 192.4 328.9 692.7 1,214.0
3Lanesx2 88.5 149.2 80.0 317.7
4Lanesx2 237.2 48.8 0.0 286.0
5Lanesx2 45.7 0.0 0.0 45.7
Source: Department of Municipal Affairs and Transport, Municipalities of Abu Dhabi city - Al Ain city - Al Dhafra Region.Note: The length of the road is not multiplied by the number of lanes
2.7.5 Length of Internal Roads(length in km)
Region 2012 2013 2014 2015
Total 16,825 18,539 18,697 18,965 Abu Dhabi Region 13,164 13,184 13,200* 13,528
Al Ain Region 2,053 2,053 2,115 2,115
Al Dhafra Region 1,608 3,302 3,382 3,322
Source: Department of Municipal Affairs and Transport, Municipalities of Abu Dhabi city- Al Ain city -Al Dhafra RegionNote: The length of the road is multiplied by the number of lanes* Preliminary estimates
94 | Statistical Yearbook of Abu Dhabi 2017
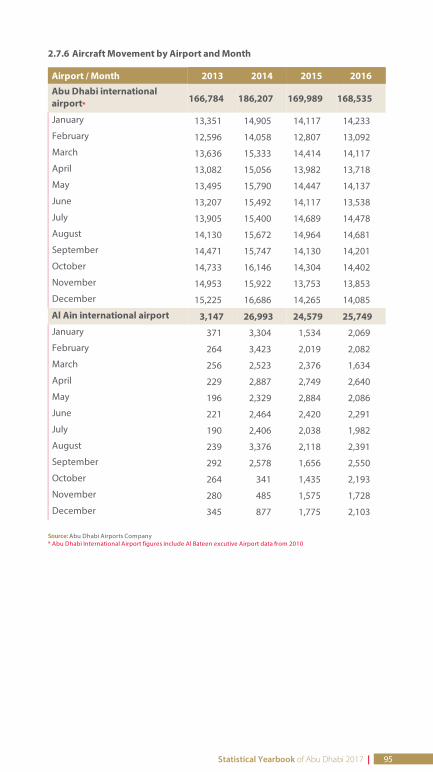
2.7.6 Aircraft Movement by Airport and Month
Airport / Month 2013 2014 2015 2016
Abu Dhabi internationalairport*
166,784 186,207 169,989 168,535
January 13,351 14,905 14,117 14,233
February 12,596 14,058 12,807 13,092
March 13,636 15,333 14,414 14,117
April 13,082 15,056 13,982 13,718
May 13,495 15,790 14,447 14,137
June 13,207 15,492 14,117 13,538
July 13,905 15,400 14,689 14,478
August 14,130 15,672 14,964 14,681
September 14,471 15,747 14,130 14,201
October 14,733 16,146 14,304 14,402
November 14,953 15,922 13,753 13,853
December 15,225 16,686 14,265 14,085
Al Ain international airport 3,147 26,993 24,579 25,749 January 371 3,304 1,534 2,069
February 264 3,423 2,019 2,082
March 256 2,523 2,376 1,634
April 229 2,887 2,749 2,640
May 196 2,329 2,884 2,086
June 221 2,464 2,420 2,291
July 190 2,406 2,038 1,982
August 239 3,376 2,118 2,391
September 292 2,578 1,656 2,550
October 264 341 1,435 2,193
November 280 485 1,575 1,728
December 345 877 1,775 2,103
Source: Abu Dhabi Airports Company* Abu Dhabi International Airport figures include Al Bateen excutive Airport data from 2010
Statistical Yearbook of Abu Dhabi 2017 | 95
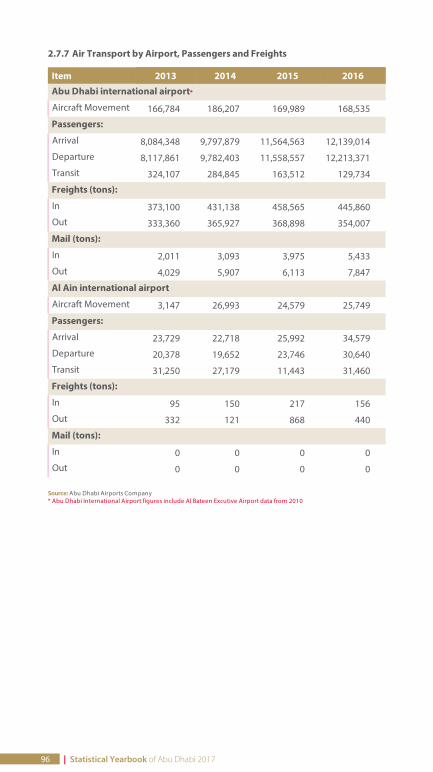
2.7.7 Air Transport by Airport, Passengers and Freights
Item 2013 2014 2015 2016
Abu Dhabi international airport*
Aircraft Movement 166,784 186,207 169,989 168,535
Passengers:
Arrival 8,084,348 9,797,879 11,564,563 12,139,014
Departure 8,117,861 9,782,403 11,558,557 12,213,371
Transit 324,107 284,845 163,512 129,734
Freights (tons):
In 373,100 431,138 458,565 445,860
Out 333,360 365,927 368,898 354,007
Mail (tons):
In 2,011 3,093 3,975 5,433
Out 4,029 5,907 6,113 7,847
Al Ain international airport
Aircraft Movement 3,147 26,993 24,579 25,749
Passengers:
Arrival 23,729 22,718 25,992 34,579
Departure 20,378 19,652 23,746 30,640
Transit 31,250 27,179 11,443 31,460
Freights (tons):
In 95 150 217 156
Out 332 121 868 440
Mail (tons):
In 0 0 0 0
Out 0 0 0 0
Source: Abu Dhabi Airports Company* Abu Dhabi International Airport figures include Al Bateen Excutive Airport data from 2010
96 | Statistical Yearbook of Abu Dhabi 2017
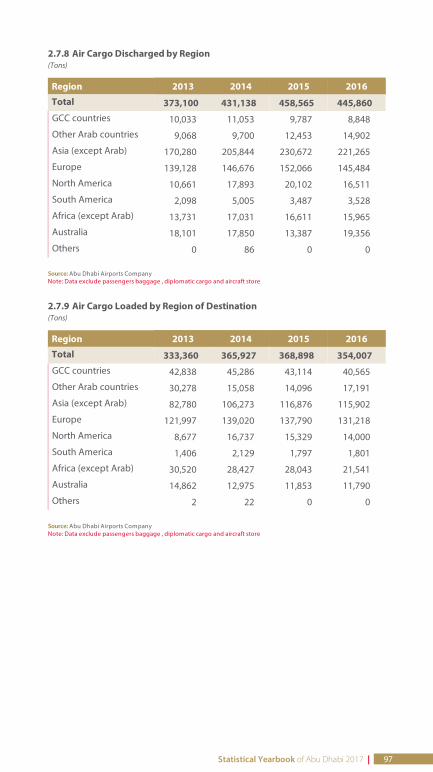
2.7.8 Air Cargo Discharged by Region(Tons)
Region 2013 2014 2015 2016
Total 373,100 431,138 458,565 445,860 GCC countries 10,033 11,053 9,787 8,848
Other Arab countries 9,068 9,700 12,453 14,902
Asia (except Arab) 170,280 205,844 230,672 221,265
Europe 139,128 146,676 152,066 145,484
North America 10,661 17,893 20,102 16,511
South America 2,098 5,005 3,487 3,528
Africa (except Arab) 13,731 17,031 16,611 15,965
Australia 18,101 17,850 13,387 19,356
Others 0 86 0 0
Source: Abu Dhabi Airports CompanyNote: Data exclude passengers baggage , diplomatic cargo and aircraft store
2.7.9 Air Cargo Loaded by Region of Destination(Tons)
Region 2013 2014 2015 2016
Total 333,360 365,927 368,898 354,007 GCC countries 42,838 45,286 43,114 40,565
Other Arab countries 30,278 15,058 14,096 17,191
Asia (except Arab) 82,780 106,273 116,876 115,902
Europe 121,997 139,020 137,790 131,218
North America 8,677 16,737 15,329 14,000
South America 1,406 2,129 1,797 1,801
Africa (except Arab) 30,520 28,427 28,043 21,541
Australia 14,862 12,975 11,853 11,790
Others 2 22 0 0
Source: Abu Dhabi Airports CompanyNote: Data exclude passengers baggage , diplomatic cargo and aircraft store
Statistical Yearbook of Abu Dhabi 2017 | 97
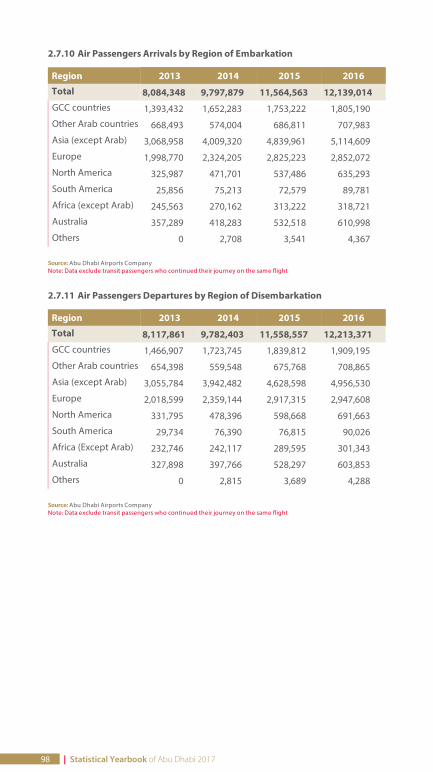
2.7.10 Air Passengers Arrivals by Region of Embarkation
Region 2013 2014 2015 2016
Total 8,084,348 9,797,879 11,564,563 12,139,014 GCC countries 1,393,432 1,652,283 1,753,222 1,805,190
Other Arab countries 668,493 574,004 686,811 707,983
Asia (except Arab) 3,068,958 4,009,320 4,839,961 5,114,609
Europe 1,998,770 2,324,205 2,825,223 2,852,072
North America 325,987 471,701 537,486 635,293
South America 25,856 75,213 72,579 89,781
Africa (except Arab) 245,563 270,162 313,222 318,721
Australia 357,289 418,283 532,518 610,998
Others 0 2,708 3,541 4,367
Source: Abu Dhabi Airports CompanyNote: Data exclude transit passengers who continued their journey on the same flight
2.7.11 Air Passengers Departures by Region of Disembarkation
Region 2013 2014 2015 2016
Total 8,117,861 9,782,403 11,558,557 12,213,371 GCC countries 1,466,907 1,723,745 1,839,812 1,909,195
Other Arab countries 654,398 559,548 675,768 708,865
Asia (except Arab) 3,055,784 3,942,482 4,628,598 4,956,530
Europe 2,018,599 2,359,144 2,917,315 2,947,608
North America 331,795 478,396 598,668 691,663
South America 29,734 76,390 76,815 90,026
Africa (Except Arab) 232,746 242,117 289,595 301,343
Australia 327,898 397,766 528,297 603,853
Others 0 2,815 3,689 4,288
Source: Abu Dhabi Airports CompanyNote: Data exclude transit passengers who continued their journey on the same flight
98 | Statistical Yearbook of Abu Dhabi 2017
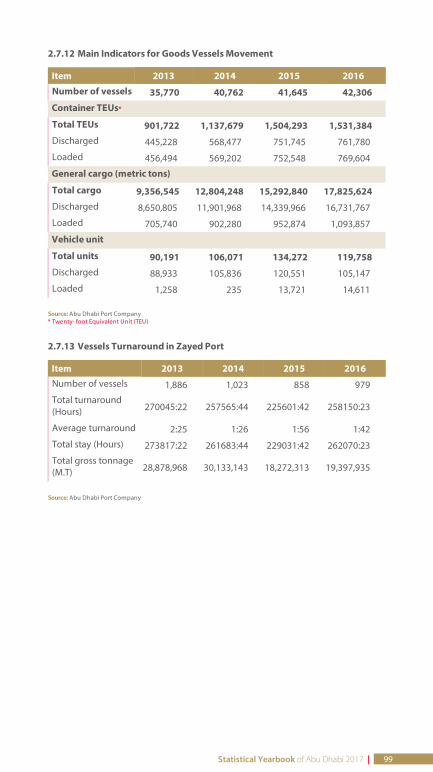
2.7.12 Main Indicators for Goods Vessels Movement
Item 2013 2014 2015 2016
Number of vessels 35,770 40,762 41,645 42,306
Container TEUs*
Total TEUs 901,722 1,137,679 1,504,293 1,531,384 Discharged 445,228 568,477 751,745 761,780
Loaded 456,494 569,202 752,548 769,604
General cargo (metric tons)
Total cargo 9,356,545 12,804,248 15,292,840 17,825,624 Discharged 8,650,805 11,901,968 14,339,966 16,731,767
Loaded 705,740 902,280 952,874 1,093,857
Vehicle unit
Total units 90,191 106,071 134,272 119,758 Discharged 88,933 105,836 120,551 105,147
Loaded 1,258 235 13,721 14,611
Source: Abu Dhabi Port Company* Twenty- foot Equivalent Unit (TEU)
2.7.13 Vessels Turnaround in Zayed Port
Item 2013 2014 2015 2016Number of vessels 1,886 1,023 858 979
Total turnaround(Hours) 270045:22 257565:44 225601:42 258150:23
Average turnaround 2:25 1:26 1:56 1:42
Total stay (Hours) 273817:22 261683:44 229031:42 262070:23
Total gross tonnage(M.T) 28,878,968 30,133,143 18,272,313 19,397,935
Source: Abu Dhabi Port Company
Statistical Yearbook of Abu Dhabi 2017 | 99
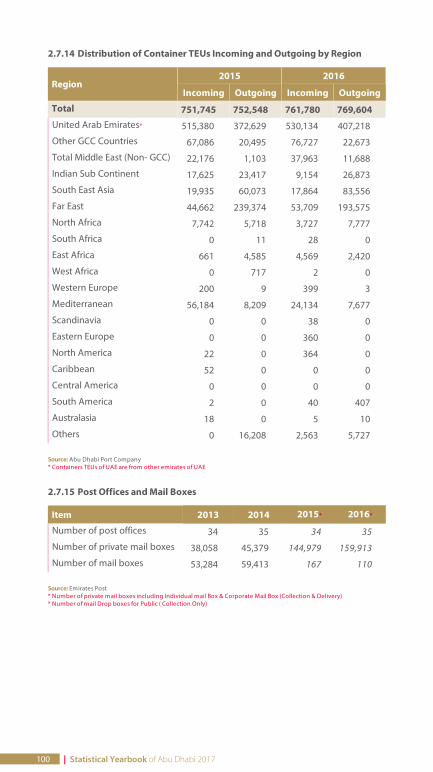
2.7.14 Distribution of Container TEUs Incoming and Outgoing by Region
Region2015 2016
Incoming Outgoing Incoming Outgoing
Total 751,745 752,548 761,780 769,604 United Arab Emirates* 515,380 372,629 530,134 407,218
Other GCC Countries 67,086 20,495 76,727 22,673
Total Middle East (Non- GCC) 22,176 1,103 37,963 11,688
Indian Sub Continent 17,625 23,417 9,154 26,873
South East Asia 19,935 60,073 17,864 83,556
Far East 44,662 239,374 53,709 193,575
North Africa 7,742 5,718 3,727 7,777
South Africa 0 11 28 0
East Africa 661 4,585 4,569 2,420
West Africa 0 717 2 0
Western Europe 200 9 399 3
Mediterranean 56,184 8,209 24,134 7,677
Scandinavia 0 0 38 0
Eastern Europe 0 0 360 0
North America 22 0 364 0
Caribbean 52 0 0 0
Central America 0 0 0 0
South America 2 0 40 407
Australasia 18 0 5 10
Others 0 16,208 2,563 5,727
Source: Abu Dhabi Port Company* Containers TEUs of UAE are from other emirates of UAE
2.7.15 Post Offices and Mail Boxes
Item 2013 2014 2015* 2016*
Number of post offices 34 35 34 35
Number of private mail boxes 38,058 45,379 144,979 159,913
Number of mail boxes 53,284 59,413 167 110
Source: Emirates Post* Number of private mail boxes including Individual mail Box & Corporate Mail Box (Collection & Delivery)* Number of mail Drop boxes for Public ( Collection Only)
100 | Statistical Yearbook of Abu Dhabi 2017
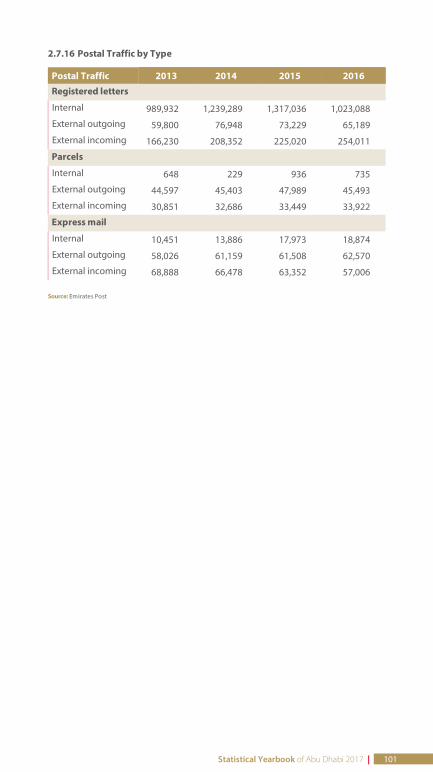
2.7.16 Postal Traffic by Type
Postal Traffic 2013 2014 2015 2016
Registered letters
Internal 989,932 1,239,289 1,317,036 1,023,088
External outgoing 59,800 76,948 73,229 65,189
External incoming 166,230 208,352 225,020 254,011
Parcels
Internal 648 229 936 735
External outgoing 44,597 45,403 47,989 45,493
External incoming 30,851 32,686 33,449 33,922
Express mail
Internal 10,451 13,886 17,973 18,874
External outgoing 58,026 61,159 61,508 62,570
External incoming 68,888 66,478 63,352 57,006
Source: Emirates Post
Statistical Yearbook of Abu Dhabi 2017 | 101
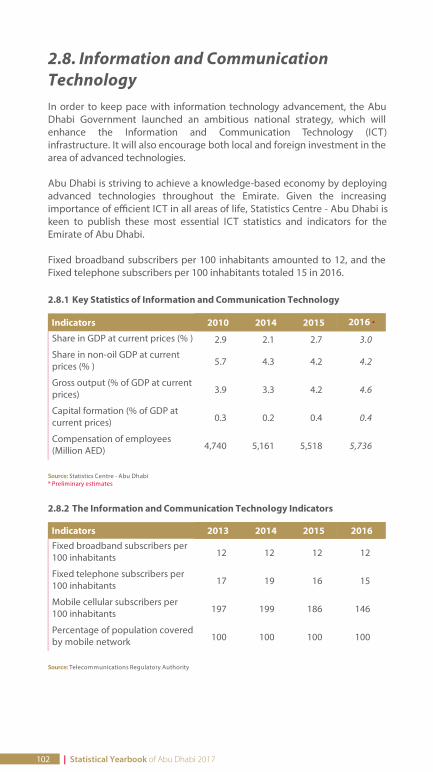
2.8. Information and CommunicationTechnologyIn order to keep pace with information technology advancement, the AbuDhabi Government launched an ambitious national strategy, which willenhance the Information and Communication Technology (ICT)infrastructure. It will also encourage both local and foreign investment in thearea of advanced technologies.
Abu Dhabi is striving to achieve a knowledge-based economy by deployingadvanced technologies throughout the Emirate. Given the increasingimportance of efficient ICT in all areas of life, Statistics Centre - Abu Dhabi iskeen to publish these most essential ICT statistics and indicators for theEmirate of Abu Dhabi.
Fixed broadband subscribers per 100 inhabitants amounted to 12, and theFixed telephone subscribers per 100 inhabitants totaled 15 in 2016.
2.8.1 Key Statistics of Information and Communication Technology
Indicators 2010 2014 2015 2016 *
Share in GDP at current prices (% ) 2.9 2.1 2.7 3.0
Share in non-oil GDP at currentprices (% ) 5.7 4.3 4.2 4.2
Gross output (% of GDP at currentprices) 3.9 3.3 4.2 4.6
Capital formation (% of GDP atcurrent prices) 0.3 0.2 0.4 0.4
Compensation of employees(Million AED) 4,740 5,161 5,518 5,736
Source: Statistics Centre - Abu Dhabi* Preliminary estimates
2.8.2 The Information and Communication Technology Indicators
Indicators 2013 2014 2015 2016Fixed broadband subscribers per100 inhabitants 12 12 12 12
Fixed telephone subscribers per100 inhabitants 17 19 16 15
Mobile cellular subscribers per100 inhabitants 197 199 186 146
Percentage of population coveredby mobile network 100 100 100 100
Source: Telecommunications Regulatory Authority
102 | Statistical Yearbook of Abu Dhabi 2017
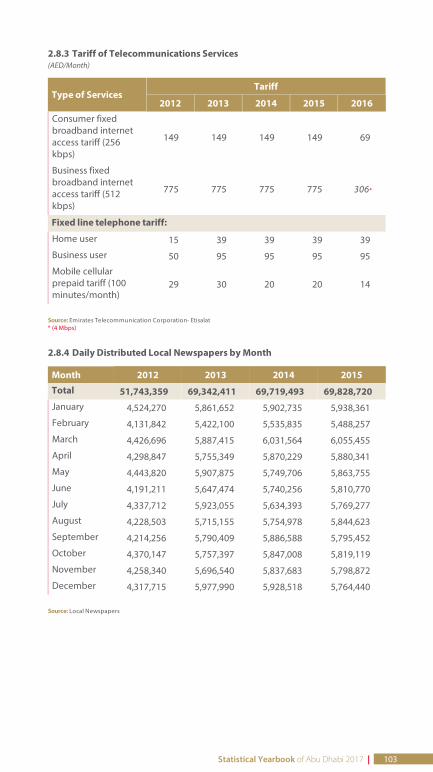
2.8.3 Tariff of Telecommunications Services(AED/Month)
Type of ServicesTariff
2012 2013 2014 2015 2016
Consumer fixedbroadband internetaccess tariff (256kbps)
149 149 149 149 69
Business fixedbroadband internetaccess tariff (512kbps)
775 775 775 775 306*
Fixed line telephone tariff:
Home user 15 39 39 39 39
Business user 50 95 95 95 95
Mobile cellularprepaid tariff (100minutes/month)
29 30 20 20 14
Source: Emirates Telecommunication Corporation- Etisalat* (4 Mbps)
2.8.4 Daily Distributed Local Newspapers by Month
Month 2012 2013 2014 2015
Total 51,743,359 69,342,411 69,719,493 69,828,720 January 4,524,270 5,861,652 5,902,735 5,938,361
February 4,131,842 5,422,100 5,535,835 5,488,257
March 4,426,696 5,887,415 6,031,564 6,055,455
April 4,298,847 5,755,349 5,870,229 5,880,341
May 4,443,820 5,907,875 5,749,706 5,863,755
June 4,191,211 5,647,474 5,740,256 5,810,770
July 4,337,712 5,923,055 5,634,393 5,769,277
August 4,228,503 5,715,155 5,754,978 5,844,623
September 4,214,256 5,790,409 5,886,588 5,795,452
October 4,370,147 5,757,397 5,847,008 5,819,119
November 4,258,340 5,696,540 5,837,683 5,798,872
December 4,317,715 5,977,990 5,928,518 5,764,440
Source: Local Newspapers
Statistical Yearbook of Abu Dhabi 2017 | 103
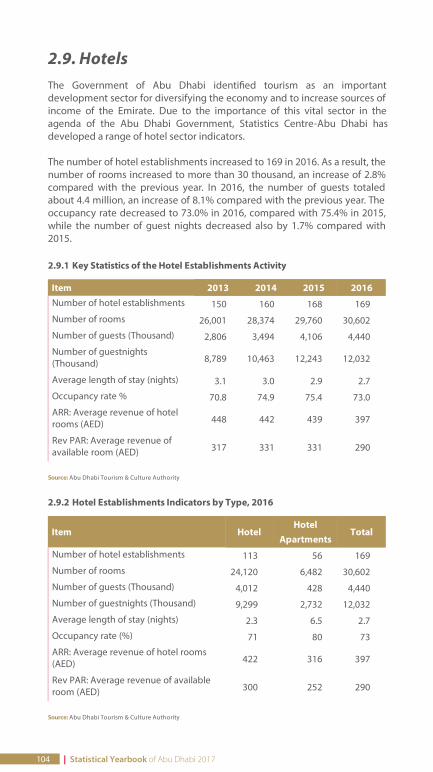
2.9. HotelsThe Government of Abu Dhabi identi ed tourism as an importantdevelopment sector for diversifying the economy and to increase sources ofincome of the Emirate. Due to the importance of this vital sector in theagenda of the Abu Dhabi Government, Statistics Centre-Abu Dhabi hasdeveloped a range of hotel sector indicators.
The number of hotel establishments increased to 169 in 2016. As a result, thenumber of rooms increased to more than 30 thousand, an increase of 2.8%compared with the previous year. In 2016, the number of guests totaledabout 4.4 million, an increase of 8.1% compared with the previous year. Theoccupancy rate decreased to 73.0% in 2016, compared with 75.4% in 2015,while the number of guest nights decreased also by 1.7% compared with2015.
2.9.1 Key Statistics of the Hotel Establishments Activity
Item 2013 2014 2015 2016Number of hotel establishments 150 160 168 169
Number of rooms 26,001 28,374 29,760 30,602
Number of guests (Thousand) 2,806 3,494 4,106 4,440
Number of guestnights(Thousand) 8,789 10,463 12,243 12,032
Average length of stay (nights) 3.1 3.0 2.9 2.7
Occupancy rate % 70.8 74.9 75.4 73.0
ARR: Average revenue of hotelrooms (AED) 448 442 439 397
Rev PAR: Average revenue ofavailable room (AED) 317 331 331 290
Source: Abu Dhabi Tourism & Culture Authority
2.9.2 Hotel Establishments Indicators by Type, 2016
Item HotelHotel
ApartmentsTotal
Number of hotel establishments 113 56 169
Number of rooms 24,120 6,482 30,602
Number of guests (Thousand) 4,012 428 4,440
Number of guestnights (Thousand) 9,299 2,732 12,032
Average length of stay (nights) 2.3 6.5 2.7
Occupancy rate (%) 71 80 73
ARR: Average revenue of hotel rooms(AED) 422 316 397
Rev PAR: Average revenue of availableroom (AED) 300 252 290
Source: Abu Dhabi Tourism & Culture Authority
104 | Statistical Yearbook of Abu Dhabi 2017
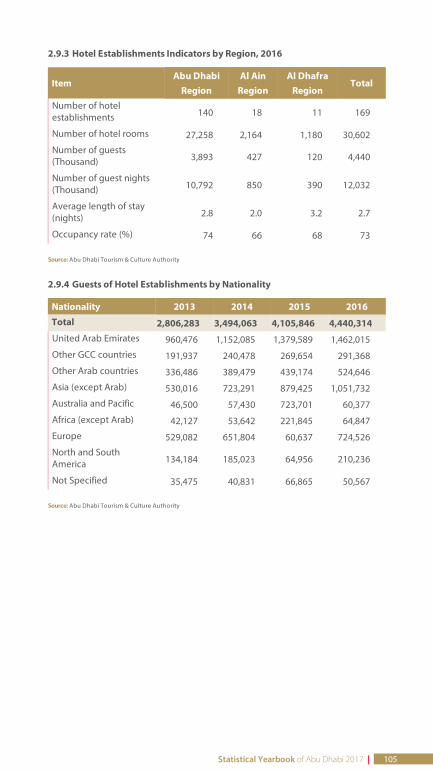
2.9.3 Hotel Establishments Indicators by Region, 2016
ItemAbu Dhabi
RegionAl Ain
RegionAl Dhafra
RegionTotal
Number of hotelestablishments 140 18 11 169
Number of hotel rooms 27,258 2,164 1,180 30,602
Number of guests(Thousand) 3,893 427 120 4,440
Number of guest nights(Thousand) 10,792 850 390 12,032
Average length of stay(nights) 2.8 2.0 3.2 2.7
Occupancy rate (%) 74 66 68 73
Source: Abu Dhabi Tourism & Culture Authority
2.9.4 Guests of Hotel Establishments by Nationality
Nationality 2013 2014 2015 2016
Total 2,806,283 3,494,063 4,105,846 4,440,314 United Arab Emirates 960,476 1,152,085 1,379,589 1,462,015
Other GCC countries 191,937 240,478 269,654 291,368
Other Arab countries 336,486 389,479 439,174 524,646
Asia (except Arab) 530,016 723,291 879,425 1,051,732
Australia and Pacific 46,500 57,430 723,701 60,377
Africa (except Arab) 42,127 53,642 221,845 64,847
Europe 529,082 651,804 60,637 724,526
North and SouthAmerica 134,184 185,023 64,956 210,236
Not Specified 35,475 40,831 66,865 50,567
Source: Abu Dhabi Tourism & Culture Authority
Statistical Yearbook of Abu Dhabi 2017 | 105
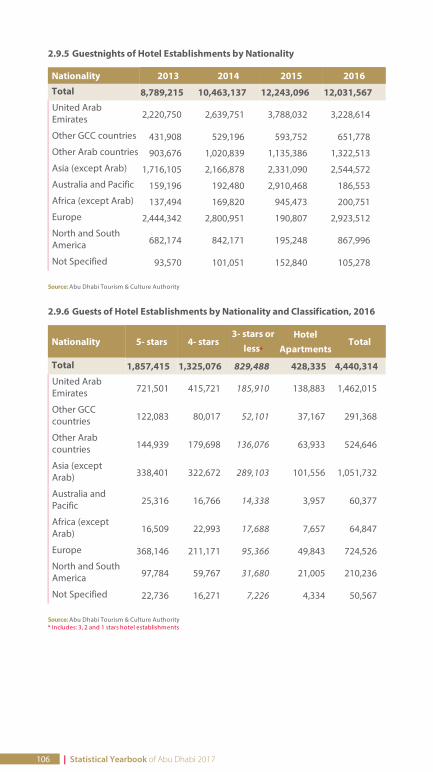
2.9.5 Guestnights of Hotel Establishments by Nationality
Nationality 2013 2014 2015 2016
Total 8,789,215 10,463,137 12,243,096 12,031,567 United ArabEmirates 2,220,750 2,639,751 3,788,032 3,228,614
Other GCC countries 431,908 529,196 593,752 651,778
Other Arab countries 903,676 1,020,839 1,135,386 1,322,513
Asia (except Arab) 1,716,105 2,166,878 2,331,090 2,544,572
Australia and Pacific 159,196 192,480 2,910,468 186,553
Africa (except Arab) 137,494 169,820 945,473 200,751
Europe 2,444,342 2,800,951 190,807 2,923,512
North and SouthAmerica 682,174 842,171 195,248 867,996
Not Specified 93,570 101,051 152,840 105,278
Source: Abu Dhabi Tourism & Culture Authority
2.9.6 Guests of Hotel Establishments by Nationality and Classification, 2016
Nationality 5- stars 4- stars3- stars or
less*
HotelApartments
Total
Total 1,857,415 1,325,076 829,488 428,335 4,440,314 United ArabEmirates 721,501 415,721 185,910 138,883 1,462,015
Other GCCcountries 122,083 80,017 52,101 37,167 291,368
Other Arabcountries 144,939 179,698 136,076 63,933 524,646
Asia (exceptArab) 338,401 322,672 289,103 101,556 1,051,732
Australia andPacific 25,316 16,766 14,338 3,957 60,377
Africa (exceptArab) 16,509 22,993 17,688 7,657 64,847
Europe 368,146 211,171 95,366 49,843 724,526
North and SouthAmerica 97,784 59,767 31,680 21,005 210,236
Not Specified 22,736 16,271 7,226 4,334 50,567
Source: Abu Dhabi Tourism & Culture Authority* Includes: 3, 2 and 1 stars hotel establishments
106 | Statistical Yearbook of Abu Dhabi 2017
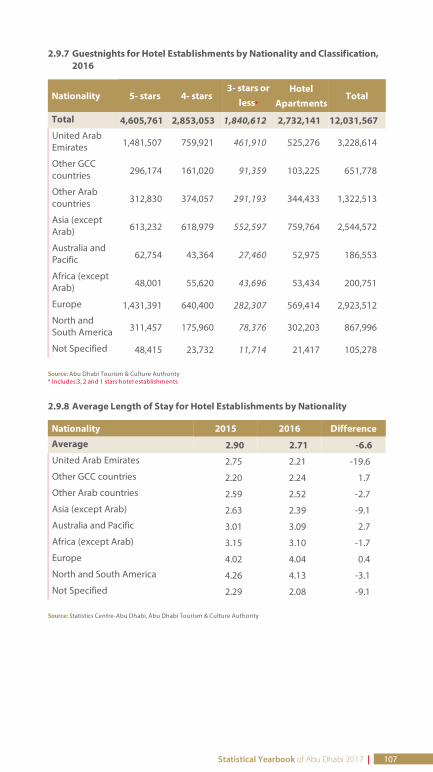
2.9.7 Guestnights for Hotel Establishments by Nationality and Classification,2016
Nationality 5- stars 4- stars3- stars or
less*
HotelApartments
Total
Total 4,605,761 2,853,053 1,840,612 2,732,141 12,031,567 United ArabEmirates 1,481,507 759,921 461,910 525,276 3,228,614
Other GCCcountries 296,174 161,020 91,359 103,225 651,778
Other Arabcountries 312,830 374,057 291,193 344,433 1,322,513
Asia (exceptArab) 613,232 618,979 552,597 759,764 2,544,572
Australia andPacific 62,754 43,364 27,460 52,975 186,553
Africa (exceptArab) 48,001 55,620 43,696 53,434 200,751
Europe 1,431,391 640,400 282,307 569,414 2,923,512
North andSouth America 311,457 175,960 78,376 302,203 867,996
Not Specified 48,415 23,732 11,714 21,417 105,278
Source: Abu Dhabi Tourism & Culture Authority* Includes:3, 2 and 1 stars hotel establishments
2.9.8 Average Length of Stay for Hotel Establishments by Nationality
Nationality 2015 2016 Difference
Average 2.90 2.71 -6.6 United Arab Emirates 2.75 2.21 -19.6
Other GCC countries 2.20 2.24 1.7
Other Arab countries 2.59 2.52 -2.7
Asia (except Arab) 2.63 2.39 -9.1
Australia and Pacific 3.01 3.09 2.7
Africa (except Arab) 3.15 3.10 -1.7
Europe 4.02 4.04 0.4
North and South America 4.26 4.13 -3.1
Not Specified 2.29 2.08 -9.1
Source: Statistics Centre-Abu Dhabi, Abu Dhabi Tourism & Culture Authority
Statistical Yearbook of Abu Dhabi 2017 | 107
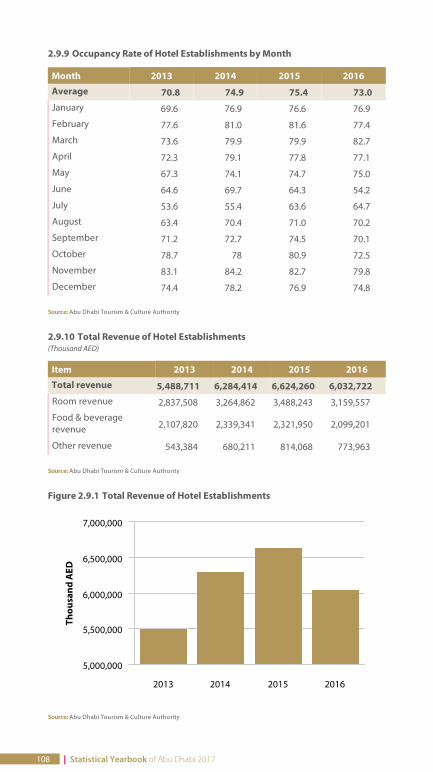
2.9.9 Occupancy Rate of Hotel Establishments by Month
Month 2013 2014 2015 2016
Average 70.8 74.9 75.4 73.0 January 69.6 76.9 76.6 76.9
February 77.6 81.0 81.6 77.4
March 73.6 79.9 79.9 82.7
April 72.3 79.1 77.8 77.1
May 67.3 74.1 74.7 75.0
June 64.6 69.7 64.3 54.2
July 53.6 55.4 63.6 64.7
August 63.4 70.4 71.0 70.2
September 71.2 72.7 74.5 70.1
October 78.7 78 80.9 72.5
November 83.1 84.2 82.7 79.8
December 74.4 78.2 76.9 74.8
Source: Abu Dhabi Tourism & Culture Authority
2.9.10 Total Revenue of Hotel Establishments(Thousand AED)
Item 2013 2014 2015 2016
Total revenue 5,488,711 6,284,414 6,624,260 6,032,722 Room revenue 2,837,508 3,264,862 3,488,243 3,159,557
Food & beveragerevenue 2,107,820 2,339,341 2,321,950 2,099,201
Other revenue 543,384 680,211 814,068 773,963
Source: Abu Dhabi Tourism & Culture Authority
Figure 2.9.1 Total Revenue of Hotel Establishments
Source: Abu Dhabi Tourism & Culture Authority
2013 2014 2015 2016
5,000,000
5,500,000
6,000,000
6,500,000
7,000,000
Thou
sand
AED
108 | Statistical Yearbook of Abu Dhabi 2017

110 Statistical Yearbook of Abu Dhabi 2016
111 Statistical Yearbook of Abu Dhabi 2016
3. Population and Demography
• Population
• Births and Deaths
• Marriage and Divorce
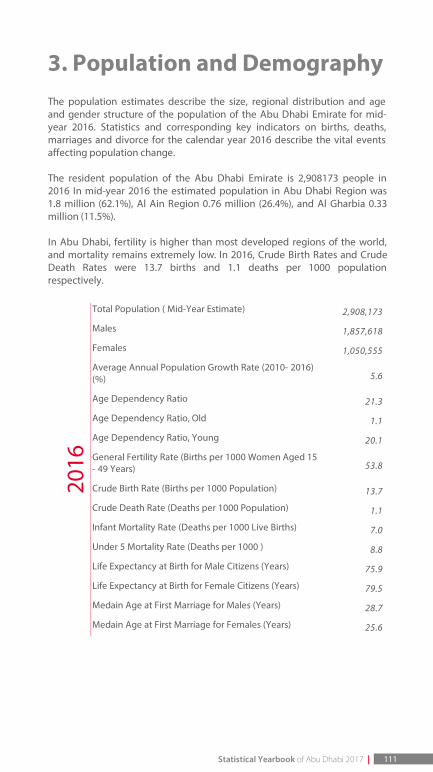
3. Population and DemographyThe population estimates describe the size, regional distribution and ageand gender structure of the population of the Abu Dhabi Emirate for mid-year 2016. Statistics and corresponding key indicators on births, deaths,marriages and divorce for the calendar year 2016 describe the vital eventsaffecting population change.
The resident population of the Abu Dhabi Emirate is 2,908173 people in2016 In mid-year 2016 the estimated population in Abu Dhabi Region was1.8 million (62.1%), Al Ain Region 0.76 million (26.4%), and Al Gharbia 0.33million (11.5%).
In Abu Dhabi, fertility is higher than most developed regions of the world,and mortality remains extremely low. In 2016, Crude Birth Rates and CrudeDeath Rates were 13.7 births and 1.1 deaths per 1000 populationrespectively.
Total Population ( Mid-Year Estimate) 2,908,173
Males 1,857,618
Females 1,050,555
Average Annual Population Growth Rate (2010- 2016)(%) 5.6
Age Dependency Ratio 21.3
Age Dependency Ratio, Old 1.1
Age Dependency Ratio, Young 20.1
General Fertility Rate (Births per 1000 Women Aged 15- 49 Years) 53.8
Crude Birth Rate (Births per 1000 Population) 13.7
Crude Death Rate (Deaths per 1000 Population) 1.1
Infant Mortality Rate (Deaths per 1000 Live Births) 7.0
Under 5 Mortality Rate (Deaths per 1000 ) 8.8
Life Expectancy at Birth for Male Citizens (Years) 75.9
Life Expectancy at Birth for Female Citizens (Years) 79.5
Medain Age at First Marriage for Males (Years) 28.7
Medain Age at First Marriage for Females (Years) 25.6
2016
Statistical Yearbook of Abu Dhabi 2017 | 111
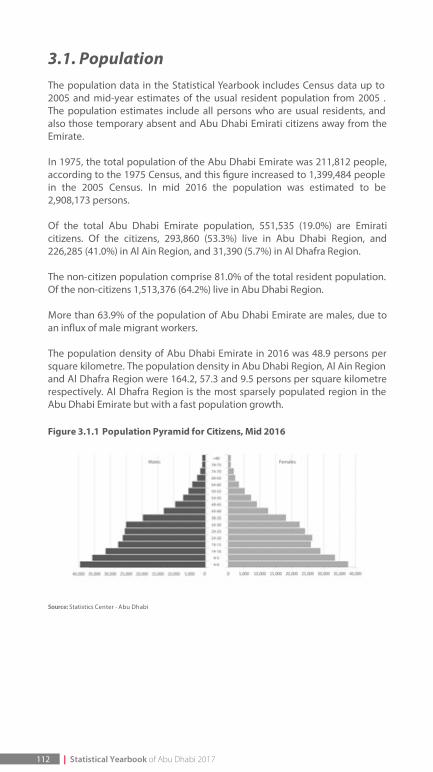
3.1. PopulationThe population data in the Statistical Yearbook includes Census data up to2005 and mid-year estimates of the usual resident population from 2005 .The population estimates include all persons who are usual residents, andalso those temporary absent and Abu Dhabi Emirati citizens away from theEmirate.
In 1975, the total population of the Abu Dhabi Emirate was 211,812 people,according to the 1975 Census, and this gure increased to 1,399,484 peoplein the 2005 Census. In mid 2016 the population was estimated to be2,908,173 persons.
Of the total Abu Dhabi Emirate population, 551,535 (19.0%) are Emiraticitizens. Of the citizens, 293,860 (53.3%) live in Abu Dhabi Region, and226,285 (41.0%) in Al Ain Region, and 31,390 (5.7%) in Al Dhafra Region.
The non-citizen population comprise 81.0% of the total resident population.Of the non-citizens 1,513,376 (64.2%) live in Abu Dhabi Region.
More than 63.9% of the population of Abu Dhabi Emirate are males, due toan influx of male migrant workers.
The population density of Abu Dhabi Emirate in 2016 was 48.9 persons persquare kilometre. The population density in Abu Dhabi Region, Al Ain Regionand Al Dhafra Region were 164.2, 57.3 and 9.5 persons per square kilometrerespectively. Al Dhafra Region is the most sparsely populated region in theAbu Dhabi Emirate but with a fast population growth.
Figure 3.1.1 Population Pyramid for Citizens, Mid 2016
Source: Statistics Center - Abu Dhabi
112 | Statistical Yearbook of Abu Dhabi 2017
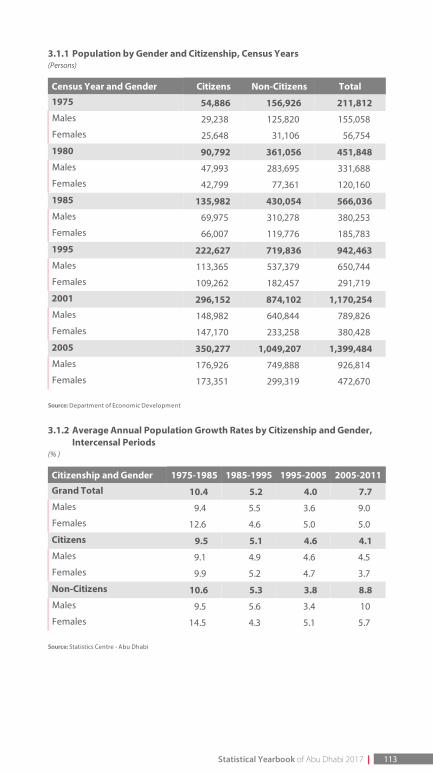
3.1.1 Population by Gender and Citizenship, Census Years(Persons)
Census Year and Gender Citizens Non-Citizens Total
1975 54,886 156,926 211,812 Males 29,238 125,820 155,058
Females 25,648 31,106 56,754
1980 90,792 361,056 451,848 Males 47,993 283,695 331,688
Females 42,799 77,361 120,160
1985 135,982 430,054 566,036 Males 69,975 310,278 380,253
Females 66,007 119,776 185,783
1995 222,627 719,836 942,463 Males 113,365 537,379 650,744
Females 109,262 182,457 291,719
2001 296,152 874,102 1,170,254 Males 148,982 640,844 789,826
Females 147,170 233,258 380,428
2005 350,277 1,049,207 1,399,484 Males 176,926 749,888 926,814
Females 173,351 299,319 472,670
Source: Department of Economic Development
3.1.2 Average Annual Population Growth Rates by Citizenship and Gender,Intercensal Periods
(% )
Citizenship and Gender 1975-1985 1985-1995 1995-2005 2005-2011
Grand Total 10.4 5.2 4.0 7.7 Males 9.4 5.5 3.6 9.0
Females 12.6 4.6 5.0 5.0
Citizens 9.5 5.1 4.6 4.1 Males 9.1 4.9 4.6 4.5
Females 9.9 5.2 4.7 3.7
Non-Citizens 10.6 5.3 3.8 8.8 Males 9.5 5.6 3.4 10
Females 14.5 4.3 5.1 5.7
Source: Statistics Centre - Abu Dhabi
Statistical Yearbook of Abu Dhabi 2017 | 113
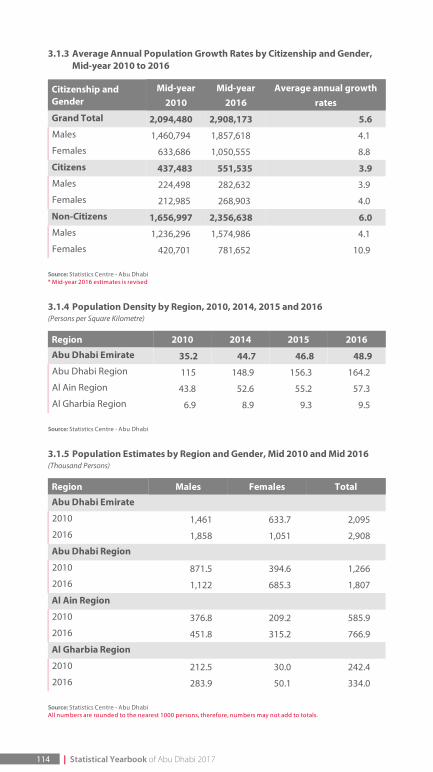
3.1.3 Average Annual Population Growth Rates by Citizenship and Gender,Mid-year 2010 to 2016
Citizenship andGender
Mid-year2010
Mid-year2016
Average annual growthrates
Grand Total 2,094,480 2,908,173 5.6 Males 1,460,794 1,857,618 4.1
Females 633,686 1,050,555 8.8
Citizens 437,483 551,535 3.9 Males 224,498 282,632 3.9
Females 212,985 268,903 4.0
Non-Citizens 1,656,997 2,356,638 6.0 Males 1,236,296 1,574,986 4.1
Females 420,701 781,652 10.9
Source: Statistics Centre - Abu Dhabi* Mid-year 2016 estimates is revised
3.1.4 Population Density by Region, 2010, 2014, 2015 and 2016(Persons per Square Kilometre)
Region 2010 2014 2015 2016
Abu Dhabi Emirate 35.2 44.7 46.8 48.9 Abu Dhabi Region 115 148.9 156.3 164.2
Al Ain Region 43.8 52.6 55.2 57.3
Al Gharbia Region 6.9 8.9 9.3 9.5
Source: Statistics Centre - Abu Dhabi
3.1.5 Population Estimates by Region and Gender, Mid 2010 and Mid 2016(Thousand Persons)
Region Males Females Total
Abu Dhabi Emirate
2010 1,461 633.7 2,095
2016 1,858 1,051 2,908
Abu Dhabi Region
2010 871.5 394.6 1,266
2016 1,122 685.3 1,807
Al Ain Region
2010 376.8 209.2 585.9
2016 451.8 315.2 766.9
Al Gharbia Region
2010 212.5 30.0 242.4
2016 283.9 50.1 334.0
Source: Statistics Centre - Abu DhabiAll numbers are rounded to the nearest 1000 persons, therefore, numbers may not add to totals.
114 | Statistical Yearbook of Abu Dhabi 2017
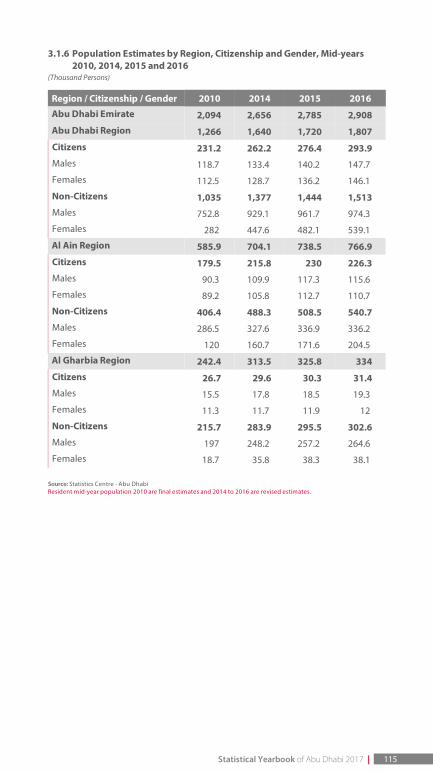
3.1.6 Population Estimates by Region, Citizenship and Gender, Mid-years2010, 2014, 2015 and 2016
(Thousand Persons)
Region / Citizenship / Gender 2010 2014 2015 2016
Abu Dhabi Emirate 2,094 2,656 2,785 2,908
Abu Dhabi Region 1,266 1,640 1,720 1,807
Citizens 231.2 262.2 276.4 293.9 Males 118.7 133.4 140.2 147.7
Females 112.5 128.7 136.2 146.1
Non-Citizens 1,035 1,377 1,444 1,513 Males 752.8 929.1 961.7 974.3
Females 282 447.6 482.1 539.1
Al Ain Region 585.9 704.1 738.5 766.9
Citizens 179.5 215.8 230 226.3 Males 90.3 109.9 117.3 115.6
Females 89.2 105.8 112.7 110.7
Non-Citizens 406.4 488.3 508.5 540.7 Males 286.5 327.6 336.9 336.2
Females 120 160.7 171.6 204.5
Al Gharbia Region 242.4 313.5 325.8 334
Citizens 26.7 29.6 30.3 31.4 Males 15.5 17.8 18.5 19.3
Females 11.3 11.7 11.9 12
Non-Citizens 215.7 283.9 295.5 302.6 Males 197 248.2 257.2 264.6
Females 18.7 35.8 38.3 38.1
Source: Statistics Centre - Abu DhabiResident mid-year population 2010 are final estimates and 2014 to 2016 are revised estimates.
Statistical Yearbook of Abu Dhabi 2017 | 115

3.1.7 Population Estimates by Age Group and Gender,Abu Dhabi Emirate,Mid 2016
(Persons)
Age Group Males Females Total
Total 1,857,618 1,050,555 2,908,173 0-4 96,164 91,284 187,448
5-9 80,013 77,921 157,934
10-14 69,677 68,062 137,739
15-19 66,448 74,559 141,007
20-24 207,339 126,467 333,806
25-29 374,031 159,204 533,235
30-34 329,348 146,401 475,749
35-39 244,053 108,197 352,250
40-44 175,035 74,486 249,521
45-49 98,951 49,505 148,456
50-54 57,256 30,920 88,176
55-59 31,432 19,739 51,171
60-64 13,942 10,730 24,672
65-69 6,564 5,645 12,209
70-74 3,769 3,745 7,514
75-79 1,823 1,836 3,659
80+ 1,773 1,854 3,627
Source: Statistics Centre - Abu Dhabi
116 | Statistical Yearbook of Abu Dhabi 2017

3.1.8 Citizen Population Estimates by Age Group and Gender,Abu DhabiEmirate, Mid 2016
(Persons)
Age Group Males Females Total
Total 282,632 268,903 551,535 0-4 40,102 38,087 78,189
5-9 36,730 34,356 71,086
10-14 32,703 30,089 62,792
15-19 28,249 26,424 54,673
20-24 26,526 26,832 53,358
25-29 25,385 24,390 49,775
30-34 25,081 22,864 47,945
35-39 20,885 19,278 40,163
40-44 14,122 13,608 27,730
45-49 10,171 9,742 19,913
50-54 7,464 7,936 15,400
55-59 5,142 5,665 10,807
60-64 3,899 3,647 7,546
65-69 2,577 2,345 4,922
70-74 1,651 1,834 3,485
75-79 924 916 1,840
80+ 1,021 890 1,911
Source: Statistics Centre - Abu Dhabi
Statistical Yearbook of Abu Dhabi 2017 | 117
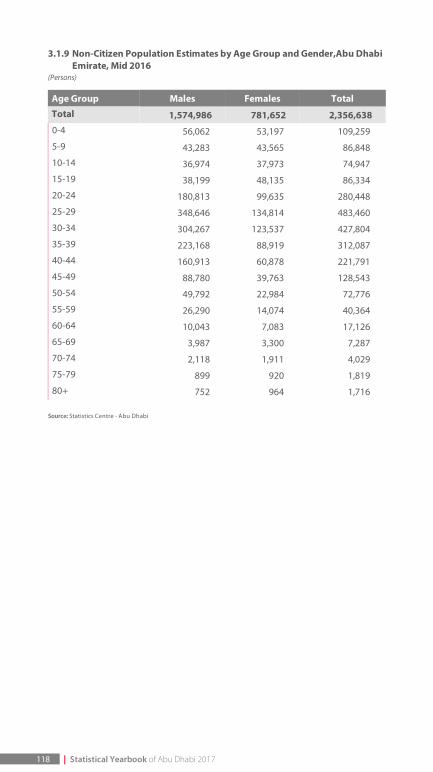
3.1.9 Non-Citizen Population Estimates by Age Group and Gender,Abu DhabiEmirate, Mid 2016
(Persons)
Age Group Males Females Total
Total 1,574,986 781,652 2,356,638 0-4 56,062 53,197 109,259
5-9 43,283 43,565 86,848
10-14 36,974 37,973 74,947
15-19 38,199 48,135 86,334
20-24 180,813 99,635 280,448
25-29 348,646 134,814 483,460
30-34 304,267 123,537 427,804
35-39 223,168 88,919 312,087
40-44 160,913 60,878 221,791
45-49 88,780 39,763 128,543
50-54 49,792 22,984 72,776
55-59 26,290 14,074 40,364
60-64 10,043 7,083 17,126
65-69 3,987 3,300 7,287
70-74 2,118 1,911 4,029
75-79 899 920 1,819
80+ 752 964 1,716
Source: Statistics Centre - Abu Dhabi
118 | Statistical Yearbook of Abu Dhabi 2017

3.1.10 Population Estimates by Age Group and Gender, Abu Dhabi Region,Mid 2016
(Persons)
Age Group Males Females Total
Total 1,121,963 685,273 1,807,236 0-4 59,790 54,692 114,482
5-9 48,160 46,969 95,129
10-14 41,134 40,230 81,364
15-19 35,827 43,048 78,875
20-24 120,127 80,545 200,672
25-29 234,140 108,410 342,550
30-34 209,817 101,908 311,725
35-39 150,012 74,061 224,073
40-44 104,774 51,170 155,944
45-49 55,350 34,378 89,728
50-54 29,419 20,712 50,131
55-59 16,768 13,652 30,420
60-64 8,027 7,429 15,456
65-69 3,919 3,597 7,516
70-74 2,421 2,355 4,776
75-79 1,178 1,134 2,312
80+ 1,100 983 2,083
Source: Statistics Centre - Abu Dhabi
Statistical Yearbook of Abu Dhabi 2017 | 119

3.1.11 Citizen Population Estimates by Age Group and Gender, Abu DhabiRegion, Mid 2016.
(Persons)
Age Group Males Females Total
Total 147,713 146,147 293,860 0-4 22,969 20,565 43,534
5-9 18,950 18,283 37,233
10-14 17,183 16,022 33,205
15-19 13,645 12,610 26,255
20-24 14,568 15,095 29,663
25-29 13,969 16,011 29,980
30-34 12,272 12,673 24,945
35-39 9,947 9,984 19,931
40-44 7,141 7,226 14,367
45-49 5,178 5,358 10,536
50-54 3,878 4,297 8,175
55-59 2,652 3,183 5,835
60-64 1,968 1,981 3,949
65-69 1,287 1,066 2,353
70-74 966 946 1,912
75-79 568 522 1,090
80+ 572 325 897
Source: Statistics Centre - Abu Dhabi
120 | Statistical Yearbook of Abu Dhabi 2017

3.1.12 Non-Citizen Population Estimates by Age Group and Gender, AbuDhabi Region, Mid 2016
(Persons)
Age Group Males Females Total
Total 974,250 539,126 1,513,376 0-4 36,821 34,127 70,948
5-9 29,210 28,686 57,896
10-14 23,951 24,208 48,159
15-19 22,182 30,438 52,620
20-24 105,559 65,450 171,009
25-29 220,171 92,399 312,570
30-34 197,545 89,235 286,780
35-39 140,065 64,077 204,142
40-44 97,633 43,944 141,577
45-49 50,172 29,020 79,192
50-54 25,541 16,415 41,956
55-59 14,116 10,469 24,585
60-64 6,059 5,448 11,507
65-69 2,632 2,531 5,163
70-74 1,455 1,409 2,864
75-79 610 612 1,222
80+ 528 658 1,186
Source: Statistics Centre - Abu Dhabi
Statistical Yearbook of Abu Dhabi 2017 | 121
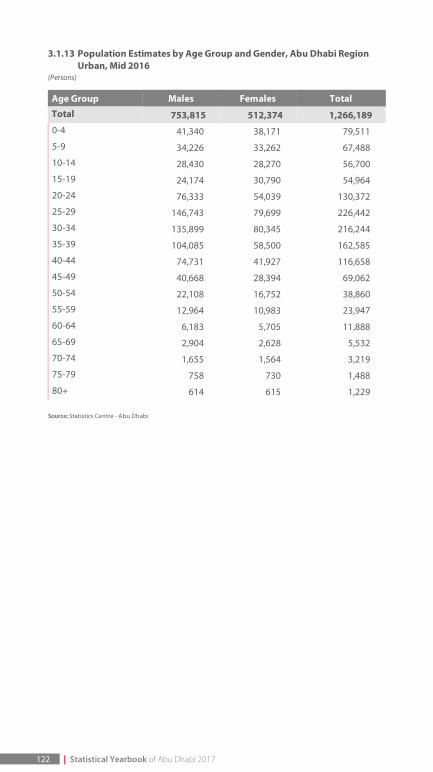
3.1.13 Population Estimates by Age Group and Gender, Abu Dhabi RegionUrban, Mid 2016
(Persons)
Age Group Males Females Total
Total 753,815 512,374 1,266,189 0-4 41,340 38,171 79,511
5-9 34,226 33,262 67,488
10-14 28,430 28,270 56,700
15-19 24,174 30,790 54,964
20-24 76,333 54,039 130,372
25-29 146,743 79,699 226,442
30-34 135,899 80,345 216,244
35-39 104,085 58,500 162,585
40-44 74,731 41,927 116,658
45-49 40,668 28,394 69,062
50-54 22,108 16,752 38,860
55-59 12,964 10,983 23,947
60-64 6,183 5,705 11,888
65-69 2,904 2,628 5,532
70-74 1,655 1,564 3,219
75-79 758 730 1,488
80+ 614 615 1,229
Source: Statistics Centre - Abu Dhabi
122 | Statistical Yearbook of Abu Dhabi 2017

3.1.14 Citizen Population Estimates by Age Group and Gender, Abu DhabiRegion Urban, Mid 2016
(Persons)
Age Group Males Females Total
Total 70,864 69,026 139,890 0-4 10,470 9,433 19,903
5-9 8,978 8,506 17,484
10-14 7,696 7,278 14,974
15-19 5,683 5,932 11,615
20-24 6,392 6,962 13,354
25-29 6,650 7,116 13,766
30-34 6,437 6,589 13,026
35-39 6,002 5,528 11,530
40-44 4,311 3,791 8,102
45-49 2,823 2,559 5,382
50-54 1,984 1,850 3,834
55-59 1,289 1,374 2,663
60-64 825 832 1,657
65-69 482 448 930
70-74 381 443 824
75-79 245 242 487
80+ 216 143 359
Source: Statistics Centre - Abu Dhabi
Statistical Yearbook of Abu Dhabi 2017 | 123
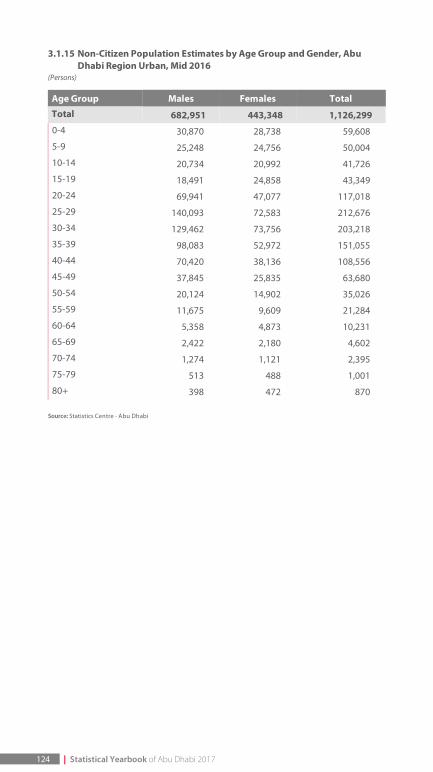
3.1.15 Non-Citizen Population Estimates by Age Group and Gender, AbuDhabi Region Urban, Mid 2016
(Persons)
Age Group Males Females Total
Total 682,951 443,348 1,126,299 0-4 30,870 28,738 59,608
5-9 25,248 24,756 50,004
10-14 20,734 20,992 41,726
15-19 18,491 24,858 43,349
20-24 69,941 47,077 117,018
25-29 140,093 72,583 212,676
30-34 129,462 73,756 203,218
35-39 98,083 52,972 151,055
40-44 70,420 38,136 108,556
45-49 37,845 25,835 63,680
50-54 20,124 14,902 35,026
55-59 11,675 9,609 21,284
60-64 5,358 4,873 10,231
65-69 2,422 2,180 4,602
70-74 1,274 1,121 2,395
75-79 513 488 1,001
80+ 398 472 870
Source: Statistics Centre - Abu Dhabi
124 | Statistical Yearbook of Abu Dhabi 2017
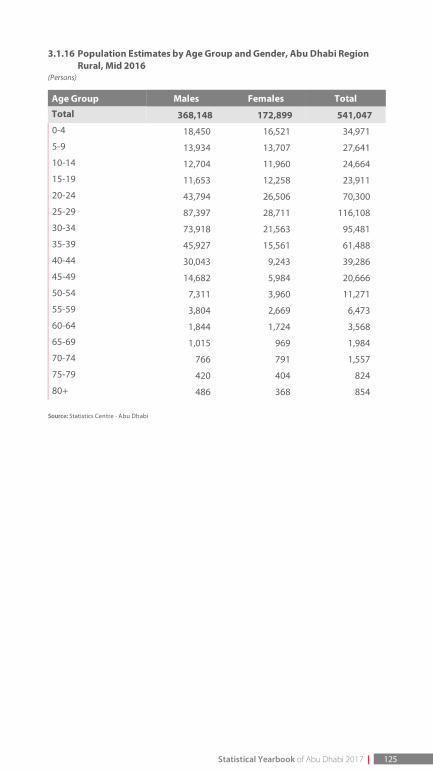
3.1.16 Population Estimates by Age Group and Gender, Abu Dhabi RegionRural, Mid 2016
(Persons)
Age Group Males Females Total
Total 368,148 172,899 541,047 0-4 18,450 16,521 34,971
5-9 13,934 13,707 27,641
10-14 12,704 11,960 24,664
15-19 11,653 12,258 23,911
20-24 43,794 26,506 70,300
25-29 87,397 28,711 116,108
30-34 73,918 21,563 95,481
35-39 45,927 15,561 61,488
40-44 30,043 9,243 39,286
45-49 14,682 5,984 20,666
50-54 7,311 3,960 11,271
55-59 3,804 2,669 6,473
60-64 1,844 1,724 3,568
65-69 1,015 969 1,984
70-74 766 791 1,557
75-79 420 404 824
80+ 486 368 854
Source: Statistics Centre - Abu Dhabi
Statistical Yearbook of Abu Dhabi 2017 | 125

3.1.17 Citizen Population Estimates by Age Group and Gender, Abu DhabiRegion Rural, Mid 2016
(Persons)
Age Group Males Females Total
Total 76,849 77,121 153,970 0-4 12,499 11,132 23,631
5-9 9,972 9,777 19,749
10-14 9,487 8,744 18,231
15-19 7,962 6,678 14,640
20-24 8,176 8,133 16,309
25-29 7,319 8,895 16,214
30-34 5,835 6,084 11,919
35-39 3,945 4,456 8,401
40-44 2,830 3,435 6,265
45-49 2,355 2,799 5,154
50-54 1,894 2,447 4,341
55-59 1,363 1,809 3,172
60-64 1,143 1,149 2,292
65-69 805 618 1,423
70-74 585 503 1,088
75-79 323 280 603
80+ 356 182 538
Source: Statistics Centre - Abu Dhabi
126 | Statistical Yearbook of Abu Dhabi 2017

3.1.18 Non-Citizen Population Estimates by Age Group and Gender, AbuDhabi Region Rural, Mid 2016
(Persons)
Age Group Males Females Total
Total 291,299 95,778 387,077 0-4 5,951 5,389 11,340
5-9 3,962 3,930 7,892
10-14 3,217 3,216 6,433
15-19 3,691 5,580 9,271
20-24 35,618 18,373 53,991
25-29 80,078 19,816 99,894
30-34 68,083 15,479 83,562
35-39 41,982 11,105 53,087
40-44 27,213 5,808 33,021
45-49 12,327 3,185 15,512
50-54 5,417 1,513 6,930
55-59 2,441 860 3,301
60-64 701 575 1,276
65-69 210 351 561
70-74 181 288 469
75-79 97 124 221
80+ 130 186 316
Source: Statistics Centre - Abu Dhabi
Statistical Yearbook of Abu Dhabi 2017 | 127

3.1.19 Population Estimates by Age Group and Gender, Al Ain Region, Mid2016
(Persons)
Age Group Males Females Total
Total 451,754 315,182 766,936 0-4 31,061 31,248 62,309
5-9 27,223 26,795 54,018
10-14 24,804 24,199 49,003
15-19 25,399 27,911 53,310
20-24 51,884 40,169 92,053
25-29 75,039 43,507 118,546
30-34 66,031 38,004 104,035
35-39 52,466 29,081 81,547
40-44 39,189 19,794 58,983
45-49 24,976 13,019 37,995
50-54 16,171 8,827 24,998
55-59 9,021 5,276 14,297
60-64 4,248 2,898 7,146
65-69 2,185 1,842 4,027
70-74 1,114 1,257 2,371
75-79 477 569 1,046
80+ 466 786 1,252
Source: Statistics Centre - Abu Dhabi
128 | Statistical Yearbook of Abu Dhabi 2017

3.1.20 Citizen Population Estimates by Age Group and Gender, Al Ain Region,Mid 2016
(Persons)
Age Group Males Females Total
Total 115,574 110,711 226,285 0-4 15,242 15,759 31,001
5-9 15,696 14,446 30,142
10-14 14,020 12,735 26,755
15-19 13,394 12,773 26,167
20-24 10,148 10,648 20,796
25-29 8,733 7,045 15,778
30-34 10,038 9,110 19,148
35-39 8,802 8,563 17,365
40-44 5,905 5,856 11,761
45-49 4,334 4,014 8,348
50-54 3,040 3,305 6,345
55-59 2,083 2,221 4,304
60-64 1,711 1,443 3,154
65-69 1,202 1,167 2,369
70-74 643 821 1,464
75-79 262 304 566
80+ 321 501 822
Source: Statistics Centre - Abu Dhabi
Statistical Yearbook of Abu Dhabi 2017 | 129
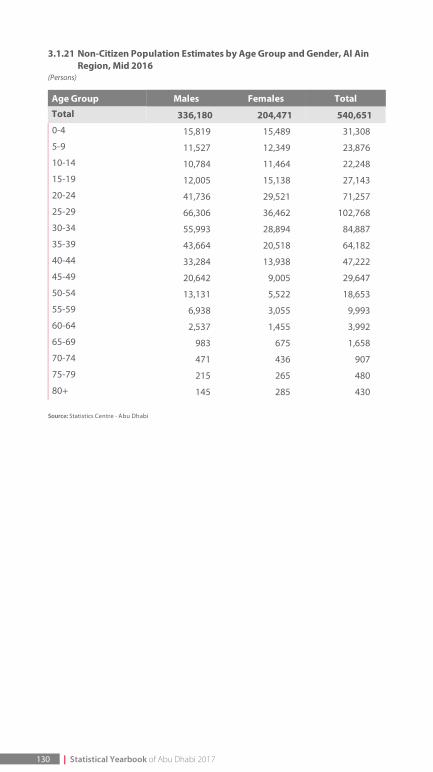
3.1.21 Non-Citizen Population Estimates by Age Group and Gender, Al AinRegion, Mid 2016
(Persons)
Age Group Males Females Total
Total 336,180 204,471 540,651 0-4 15,819 15,489 31,308
5-9 11,527 12,349 23,876
10-14 10,784 11,464 22,248
15-19 12,005 15,138 27,143
20-24 41,736 29,521 71,257
25-29 66,306 36,462 102,768
30-34 55,993 28,894 84,887
35-39 43,664 20,518 64,182
40-44 33,284 13,938 47,222
45-49 20,642 9,005 29,647
50-54 13,131 5,522 18,653
55-59 6,938 3,055 9,993
60-64 2,537 1,455 3,992
65-69 983 675 1,658
70-74 471 436 907
75-79 215 265 480
80+ 145 285 430
Source: Statistics Centre - Abu Dhabi
130 | Statistical Yearbook of Abu Dhabi 2017
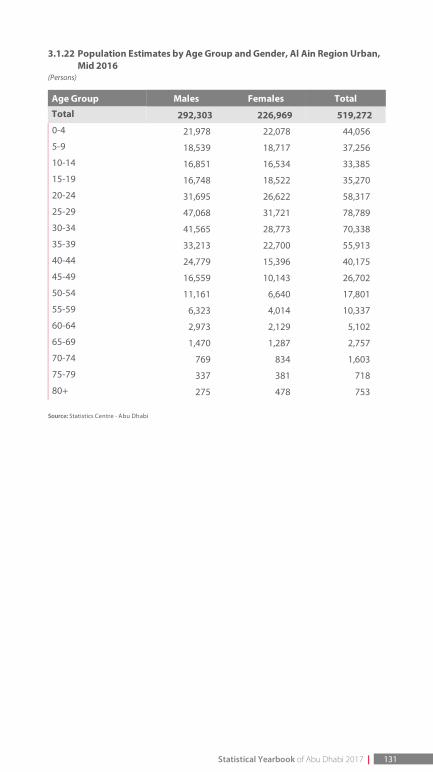
3.1.22 Population Estimates by Age Group and Gender, Al Ain Region Urban,Mid 2016
(Persons)
Age Group Males Females Total
Total 292,303 226,969 519,272 0-4 21,978 22,078 44,056
5-9 18,539 18,717 37,256
10-14 16,851 16,534 33,385
15-19 16,748 18,522 35,270
20-24 31,695 26,622 58,317
25-29 47,068 31,721 78,789
30-34 41,565 28,773 70,338
35-39 33,213 22,700 55,913
40-44 24,779 15,396 40,175
45-49 16,559 10,143 26,702
50-54 11,161 6,640 17,801
55-59 6,323 4,014 10,337
60-64 2,973 2,129 5,102
65-69 1,470 1,287 2,757
70-74 769 834 1,603
75-79 337 381 718
80+ 275 478 753
Source: Statistics Centre - Abu Dhabi
Statistical Yearbook of Abu Dhabi 2017 | 131

3.1.23 Citizen Population Estimates by Age Group and Gender, Al Ain RegionUrban, Mid 2016
(Persons)
Age Group Males Females Total
Total 66,916 65,047 131,963 0-4 8,838 9,185 18,023
5-9 8,881 8,404 17,285
10-14 7,897 7,079 14,976
15-19 7,542 7,001 14,543
20-24 5,698 6,037 11,735
25-29 5,002 4,138 9,140
30-34 6,069 5,764 11,833
35-39 5,646 5,623 11,269
40-44 3,671 3,618 7,289
45-49 2,593 2,364 4,957
50-54 1,691 1,860 3,551
55-59 1,089 1,324 2,413
60-64 921 895 1,816
65-69 648 745 1,393
70-74 375 523 898
75-79 163 175 338
80+ 192 312 504
Source: Statistics Centre - Abu Dhabi
132 | Statistical Yearbook of Abu Dhabi 2017

3.1.24 Non-Citizen Population Estimates by Age Group and Gender, Al AinRegion Urban, Mid 2016
(Persons)
Age Group Males Females Total
Total 225,387 161,922 387,309 0-4 13,140 12,893 26,033
5-9 9,658 10,313 19,971
10-14 8,954 9,455 18,409
15-19 9,206 11,521 20,727
20-24 25,997 20,585 46,582
25-29 42,066 27,583 69,649
30-34 35,496 23,009 58,505
35-39 27,567 17,077 44,644
40-44 21,108 11,778 32,886
45-49 13,966 7,779 21,745
50-54 9,470 4,780 14,250
55-59 5,234 2,690 7,924
60-64 2,052 1,234 3,286
65-69 822 542 1,364
70-74 394 311 705
75-79 174 206 380
80+ 83 166 249
Source: Statistics Centre - Abu Dhabi
Statistical Yearbook of Abu Dhabi 2017 | 133
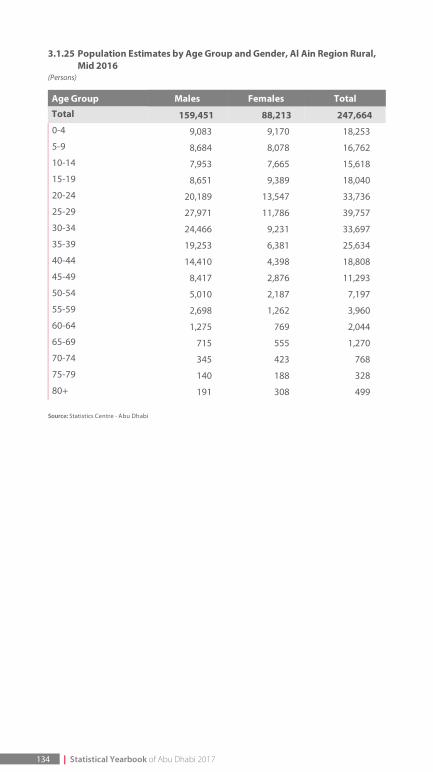
3.1.25 Population Estimates by Age Group and Gender, Al Ain Region Rural,Mid 2016
(Persons)
Age Group Males Females Total
Total 159,451 88,213 247,664 0-4 9,083 9,170 18,253
5-9 8,684 8,078 16,762
10-14 7,953 7,665 15,618
15-19 8,651 9,389 18,040
20-24 20,189 13,547 33,736
25-29 27,971 11,786 39,757
30-34 24,466 9,231 33,697
35-39 19,253 6,381 25,634
40-44 14,410 4,398 18,808
45-49 8,417 2,876 11,293
50-54 5,010 2,187 7,197
55-59 2,698 1,262 3,960
60-64 1,275 769 2,044
65-69 715 555 1,270
70-74 345 423 768
75-79 140 188 328
80+ 191 308 499
Source: Statistics Centre - Abu Dhabi
134 | Statistical Yearbook of Abu Dhabi 2017
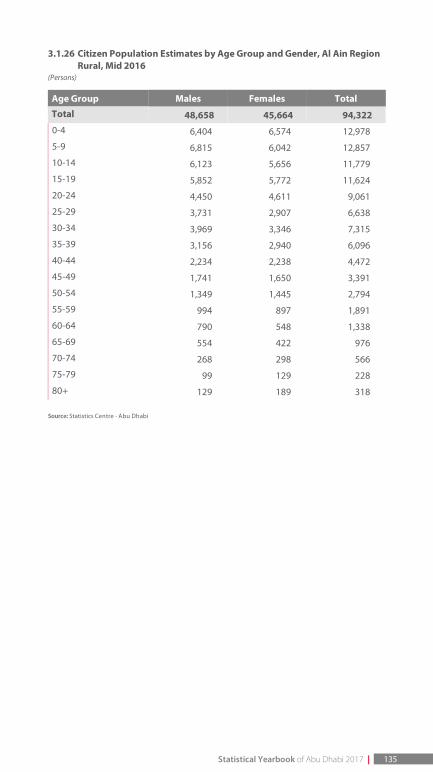
3.1.26 Citizen Population Estimates by Age Group and Gender, Al Ain RegionRural, Mid 2016
(Persons)
Age Group Males Females Total
Total 48,658 45,664 94,322 0-4 6,404 6,574 12,978
5-9 6,815 6,042 12,857
10-14 6,123 5,656 11,779
15-19 5,852 5,772 11,624
20-24 4,450 4,611 9,061
25-29 3,731 2,907 6,638
30-34 3,969 3,346 7,315
35-39 3,156 2,940 6,096
40-44 2,234 2,238 4,472
45-49 1,741 1,650 3,391
50-54 1,349 1,445 2,794
55-59 994 897 1,891
60-64 790 548 1,338
65-69 554 422 976
70-74 268 298 566
75-79 99 129 228
80+ 129 189 318
Source: Statistics Centre - Abu Dhabi
Statistical Yearbook of Abu Dhabi 2017 | 135
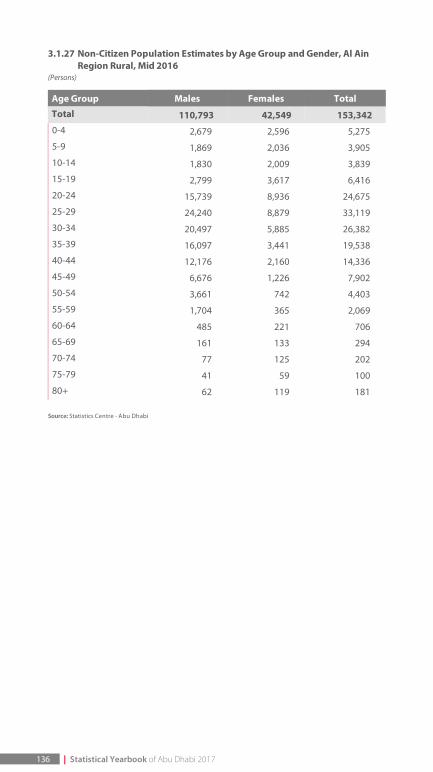
3.1.27 Non-Citizen Population Estimates by Age Group and Gender, Al AinRegion Rural, Mid 2016
(Persons)
Age Group Males Females Total
Total 110,793 42,549 153,342 0-4 2,679 2,596 5,275
5-9 1,869 2,036 3,905
10-14 1,830 2,009 3,839
15-19 2,799 3,617 6,416
20-24 15,739 8,936 24,675
25-29 24,240 8,879 33,119
30-34 20,497 5,885 26,382
35-39 16,097 3,441 19,538
40-44 12,176 2,160 14,336
45-49 6,676 1,226 7,902
50-54 3,661 742 4,403
55-59 1,704 365 2,069
60-64 485 221 706
65-69 161 133 294
70-74 77 125 202
75-79 41 59 100
80+ 62 119 181
Source: Statistics Centre - Abu Dhabi
136 | Statistical Yearbook of Abu Dhabi 2017

3.1.28 Population Estimates by Age Group and Gender, Al Dhafra Region, Mid2016
(Persons)
Age Group Males Females Total
Total 283,901 50,100 334,001 0-4 5,313 5,344 10,657
5-9 4,630 4,157 8,787
10-14 3,739 3,633 7,372
15-19 5,222 3,600 8,822
20-24 35,328 5,753 41,081
25-29 64,852 7,287 72,139
30-34 53,500 6,489 59,989
35-39 41,575 5,055 46,630
40-44 31,072 3,522 34,594
45-49 18,625 2,108 20,733
50-54 11,666 1,381 13,047
55-59 5,643 811 6,454
60-64 1,667 403 2,070
65-69 460 206 666
70-74 234 133 367
75-79 168 133 301
80+ 207 85 292
Source: Statistics Centre - Abu Dhabi
Statistical Yearbook of Abu Dhabi 2017 | 137
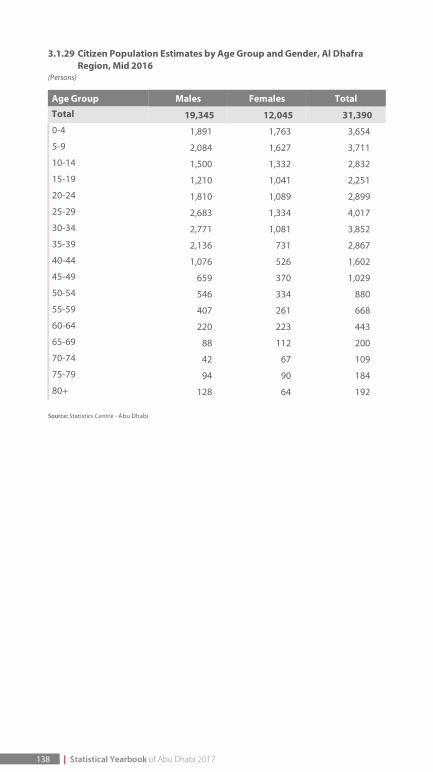
3.1.29 Citizen Population Estimates by Age Group and Gender, Al DhafraRegion, Mid 2016
(Persons)
Age Group Males Females Total
Total 19,345 12,045 31,390 0-4 1,891 1,763 3,654
5-9 2,084 1,627 3,711
10-14 1,500 1,332 2,832
15-19 1,210 1,041 2,251
20-24 1,810 1,089 2,899
25-29 2,683 1,334 4,017
30-34 2,771 1,081 3,852
35-39 2,136 731 2,867
40-44 1,076 526 1,602
45-49 659 370 1,029
50-54 546 334 880
55-59 407 261 668
60-64 220 223 443
65-69 88 112 200
70-74 42 67 109
75-79 94 90 184
80+ 128 64 192
Source: Statistics Centre - Abu Dhabi
138 | Statistical Yearbook of Abu Dhabi 2017
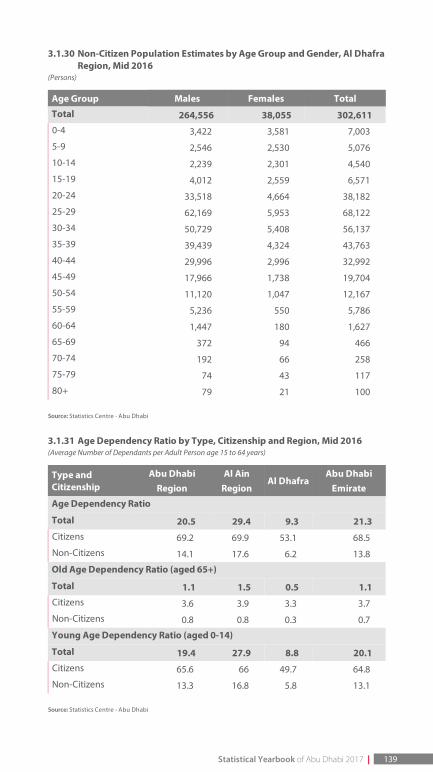
3.1.30 Non-Citizen Population Estimates by Age Group and Gender, Al DhafraRegion, Mid 2016
(Persons)
Age Group Males Females Total
Total 264,556 38,055 302,611 0-4 3,422 3,581 7,003
5-9 2,546 2,530 5,076
10-14 2,239 2,301 4,540
15-19 4,012 2,559 6,571
20-24 33,518 4,664 38,182
25-29 62,169 5,953 68,122
30-34 50,729 5,408 56,137
35-39 39,439 4,324 43,763
40-44 29,996 2,996 32,992
45-49 17,966 1,738 19,704
50-54 11,120 1,047 12,167
55-59 5,236 550 5,786
60-64 1,447 180 1,627
65-69 372 94 466
70-74 192 66 258
75-79 74 43 117
80+ 79 21 100
Source: Statistics Centre - Abu Dhabi
3.1.31 Age Dependency Ratio by Type, Citizenship and Region, Mid 2016(Average Number of Dependants per Adult Person age 15 to 64 years)
Type andCitizenship
Abu DhabiRegion
Al AinRegion
Al DhafraAbu Dhabi
Emirate
Age Dependency Ratio
Total 20.5 29.4 9.3 21.3 Citizens 69.2 69.9 53.1 68.5
Non-Citizens 14.1 17.6 6.2 13.8
Old Age Dependency Ratio (aged 65+)
Total 1.1 1.5 0.5 1.1 Citizens 3.6 3.9 3.3 3.7
Non-Citizens 0.8 0.8 0.3 0.7
Young Age Dependency Ratio (aged 0-14)
Total 19.4 27.9 8.8 20.1 Citizens 65.6 66 49.7 64.8
Non-Citizens 13.3 16.8 5.8 13.1
Source: Statistics Centre - Abu Dhabi
Statistical Yearbook of Abu Dhabi 2017 | 139
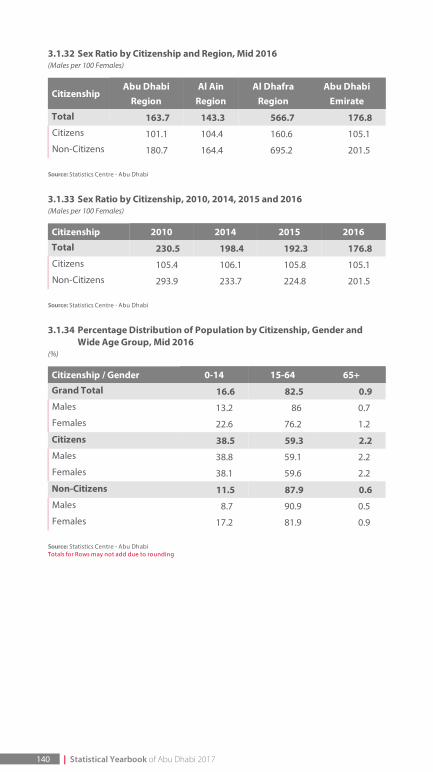
3.1.32 Sex Ratio by Citizenship and Region, Mid 2016(Males per 100 Females)
CitizenshipAbu Dhabi
RegionAl Ain
RegionAl Dhafra
RegionAbu Dhabi
Emirate
Total 163.7 143.3 566.7 176.8 Citizens 101.1 104.4 160.6 105.1
Non-Citizens 180.7 164.4 695.2 201.5
Source: Statistics Centre - Abu Dhabi
3.1.33 Sex Ratio by Citizenship, 2010, 2014, 2015 and 2016(Males per 100 Females)
Citizenship 2010 2014 2015 2016
Total 230.5 198.4 192.3 176.8 Citizens 105.4 106.1 105.8 105.1
Non-Citizens 293.9 233.7 224.8 201.5
Source: Statistics Centre - Abu Dhabi
3.1.34 Percentage Distribution of Population by Citizenship, Gender andWide Age Group, Mid 2016
(%)
Citizenship / Gender 0-14 15-64 65+
Grand Total 16.6 82.5 0.9 Males 13.2 86 0.7
Females 22.6 76.2 1.2
Citizens 38.5 59.3 2.2 Males 38.8 59.1 2.2
Females 38.1 59.6 2.2
Non-Citizens 11.5 87.9 0.6 Males 8.7 90.9 0.5
Females 17.2 81.9 0.9
Source: Statistics Centre - Abu DhabiTotals for Rows may not add due to rounding
140 | Statistical Yearbook of Abu Dhabi 2017
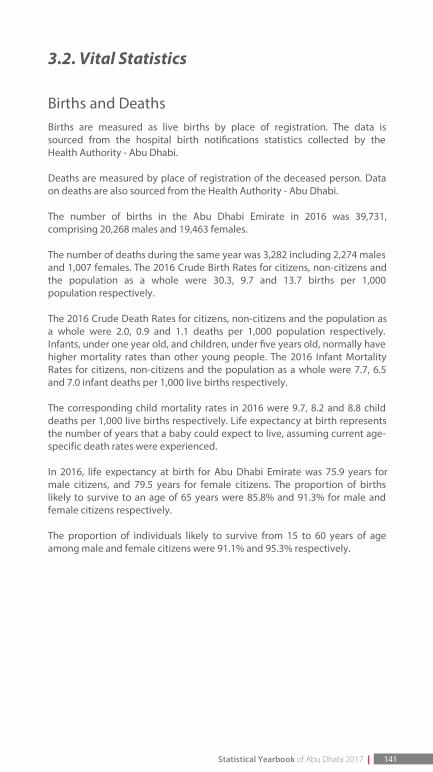
3.2. Vital Statistics
Births and DeathsBirths are measured as live births by place of registration. The data issourced from the hospital birth noti cations statistics collected by theHealth Authority - Abu Dhabi.
Deaths are measured by place of registration of the deceased person. Dataon deaths are also sourced from the Health Authority - Abu Dhabi.
The number of births in the Abu Dhabi Emirate in 2016 was 39,731,comprising 20,268 males and 19,463 females.
The number of deaths during the same year was 3,282 including 2,274 malesand 1,007 females. The 2016 Crude Birth Rates for citizens, non-citizens andthe population as a whole were 30.3, 9.7 and 13.7 births per 1,000population respectively.
The 2016 Crude Death Rates for citizens, non-citizens and the population asa whole were 2.0, 0.9 and 1.1 deaths per 1,000 population respectively.Infants, under one year old, and children, under ve years old, normally havehigher mortality rates than other young people. The 2016 Infant MortalityRates for citizens, non-citizens and the population as a whole were 7.7, 6.5and 7.0 infant deaths per 1,000 live births respectively.
The corresponding child mortality rates in 2016 were 9.7, 8.2 and 8.8 childdeaths per 1,000 live births respectively. Life expectancy at birth representsthe number of years that a baby could expect to live, assuming current age-specific death rates were experienced.
In 2016, life expectancy at birth for Abu Dhabi Emirate was 75.9 years formale citizens, and 79.5 years for female citizens. The proportion of birthslikely to survive to an age of 65 years were 85.8% and 91.3% for male andfemale citizens respectively.
The proportion of individuals likely to survive from 15 to 60 years of ageamong male and female citizens were 91.1% and 95.3% respectively.
Statistical Yearbook of Abu Dhabi 2017 | 141
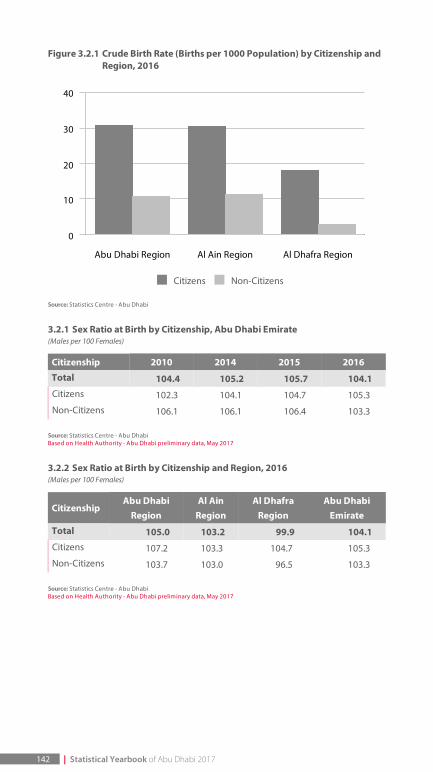
Figure 3.2.1 Crude Birth Rate (Births per 1000 Population) by Citizenship andRegion, 2016
. Citizens . Non-Citizens
Source: Statistics Centre - Abu Dhabi
3.2.1 Sex Ratio at Birth by Citizenship, Abu Dhabi Emirate(Males per 100 Females)
Citizenship 2010 2014 2015 2016
Total 104.4 105.2 105.7 104.1 Citizens 102.3 104.1 104.7 105.3
Non-Citizens 106.1 106.1 106.4 103.3
Source: Statistics Centre - Abu DhabiBased on Health Authority - Abu Dhabi preliminary data, May 2017
3.2.2 Sex Ratio at Birth by Citizenship and Region, 2016(Males per 100 Females)
CitizenshipAbu Dhabi
RegionAl Ain
RegionAl Dhafra
RegionAbu Dhabi
Emirate
Total 105.0 103.2 99.9 104.1 Citizens 107.2 103.3 104.7 105.3
Non-Citizens 103.7 103.0 96.5 103.3
Source: Statistics Centre - Abu DhabiBased on Health Authority - Abu Dhabi preliminary data, May 2017
Abu Dhabi Region Al Ain Region Al Dhafra Region
0
10
20
30
40
142 | Statistical Yearbook of Abu Dhabi 2017
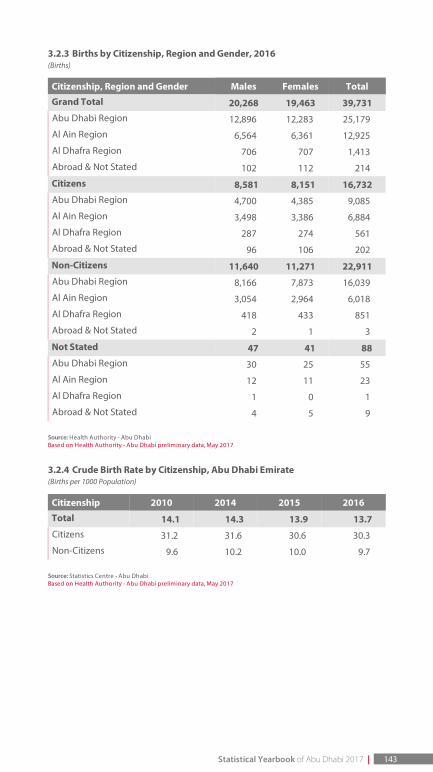
3.2.3 Births by Citizenship, Region and Gender, 2016(Births)
Citizenship, Region and Gender Males Females Total
Grand Total 20,268 19,463 39,731 Abu Dhabi Region 12,896 12,283 25,179
Al Ain Region 6,564 6,361 12,925
Al Dhafra Region 706 707 1,413
Abroad & Not Stated 102 112 214
Citizens 8,581 8,151 16,732 Abu Dhabi Region 4,700 4,385 9,085
Al Ain Region 3,498 3,386 6,884
Al Dhafra Region 287 274 561
Abroad & Not Stated 96 106 202
Non-Citizens 11,640 11,271 22,911 Abu Dhabi Region 8,166 7,873 16,039
Al Ain Region 3,054 2,964 6,018
Al Dhafra Region 418 433 851
Abroad & Not Stated 2 1 3
Not Stated 47 41 88 Abu Dhabi Region 30 25 55
Al Ain Region 12 11 23
Al Dhafra Region 1 0 1
Abroad & Not Stated 4 5 9
Source: Health Authority - Abu DhabiBased on Health Authority - Abu Dhabi preliminary data, May 2017
3.2.4 Crude Birth Rate by Citizenship, Abu Dhabi Emirate(Births per 1000 Population)
Citizenship 2010 2014 2015 2016
Total 14.1 14.3 13.9 13.7 Citizens 31.2 31.6 30.6 30.3
Non-Citizens 9.6 10.2 10.0 9.7
Source: Statistics Centre - Abu DhabiBased on Health Authority - Abu Dhabi preliminary data, May 2017
Statistical Yearbook of Abu Dhabi 2017 | 143
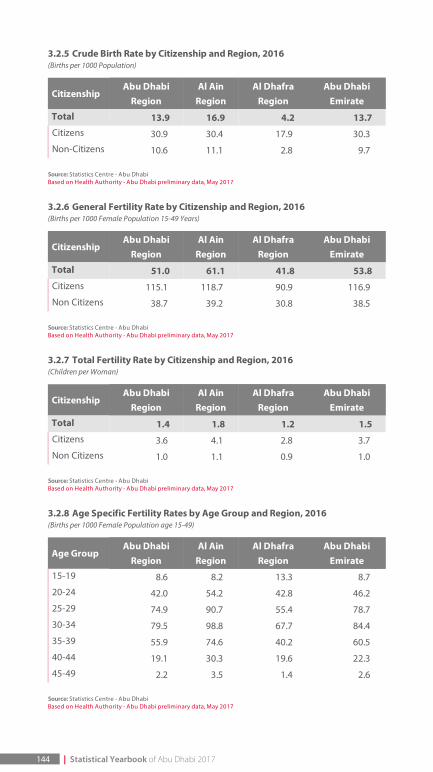
3.2.5 Crude Birth Rate by Citizenship and Region, 2016(Births per 1000 Population)
CitizenshipAbu Dhabi
RegionAl Ain
RegionAl Dhafra
RegionAbu Dhabi
Emirate
Total 13.9 16.9 4.2 13.7 Citizens 30.9 30.4 17.9 30.3
Non-Citizens 10.6 11.1 2.8 9.7
Source: Statistics Centre - Abu DhabiBased on Health Authority - Abu Dhabi preliminary data, May 2017
3.2.6 General Fertility Rate by Citizenship and Region, 2016(Births per 1000 Female Population 15-49 Years)
CitizenshipAbu Dhabi
RegionAl Ain
RegionAl Dhafra
RegionAbu Dhabi
Emirate
Total 51.0 61.1 41.8 53.8 Citizens 115.1 118.7 90.9 116.9
Non Citizens 38.7 39.2 30.8 38.5
Source: Statistics Centre - Abu DhabiBased on Health Authority - Abu Dhabi preliminary data, May 2017
3.2.7 Total Fertility Rate by Citizenship and Region, 2016(Children per Woman)
CitizenshipAbu Dhabi
RegionAl Ain
RegionAl Dhafra
RegionAbu Dhabi
Emirate
Total 1.4 1.8 1.2 1.5 Citizens 3.6 4.1 2.8 3.7
Non Citizens 1.0 1.1 0.9 1.0
Source: Statistics Centre - Abu DhabiBased on Health Authority - Abu Dhabi preliminary data, May 2017
3.2.8 Age Specific Fertility Rates by Age Group and Region, 2016(Births per 1000 Female Population age 15-49)
Age GroupAbu Dhabi
RegionAl Ain
RegionAl Dhafra
RegionAbu Dhabi
Emirate15-19 8.6 8.2 13.3 8.7
20-24 42.0 54.2 42.8 46.2
25-29 74.9 90.7 55.4 78.7
30-34 79.5 98.8 67.7 84.4
35-39 55.9 74.6 40.2 60.5
40-44 19.1 30.3 19.6 22.3
45-49 2.2 3.5 1.4 2.6
Source: Statistics Centre - Abu DhabiBased on Health Authority - Abu Dhabi preliminary data, May 2017
144 | Statistical Yearbook of Abu Dhabi 2017
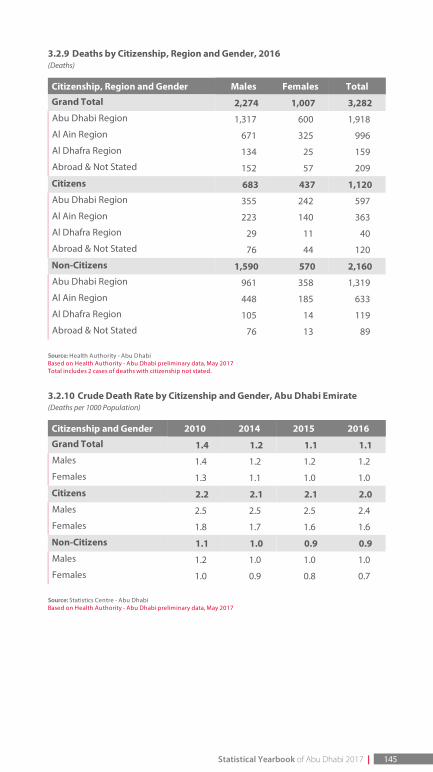
3.2.9 Deaths by Citizenship, Region and Gender, 2016(Deaths)
Citizenship, Region and Gender Males Females Total
Grand Total 2,274 1,007 3,282 Abu Dhabi Region 1,317 600 1,918
Al Ain Region 671 325 996
Al Dhafra Region 134 25 159
Abroad & Not Stated 152 57 209
Citizens 683 437 1,120 Abu Dhabi Region 355 242 597
Al Ain Region 223 140 363
Al Dhafra Region 29 11 40
Abroad & Not Stated 76 44 120
Non-Citizens 1,590 570 2,160 Abu Dhabi Region 961 358 1,319
Al Ain Region 448 185 633
Al Dhafra Region 105 14 119
Abroad & Not Stated 76 13 89
Source: Health Authority - Abu DhabiBased on Health Authority - Abu Dhabi preliminary data, May 2017Total includes 2 cases of deaths with citizenship not stated.
3.2.10 Crude Death Rate by Citizenship and Gender, Abu Dhabi Emirate(Deaths per 1000 Population)
Citizenship and Gender 2010 2014 2015 2016
Grand Total 1.4 1.2 1.1 1.1 Males 1.4 1.2 1.2 1.2
Females 1.3 1.1 1.0 1.0
Citizens 2.2 2.1 2.1 2.0 Males 2.5 2.5 2.5 2.4
Females 1.8 1.7 1.6 1.6
Non-Citizens 1.1 1.0 0.9 0.9 Males 1.2 1.0 1.0 1.0
Females 1.0 0.9 0.8 0.7
Source: Statistics Centre - Abu DhabiBased on Health Authority - Abu Dhabi preliminary data, May 2017
Statistical Yearbook of Abu Dhabi 2017 | 145
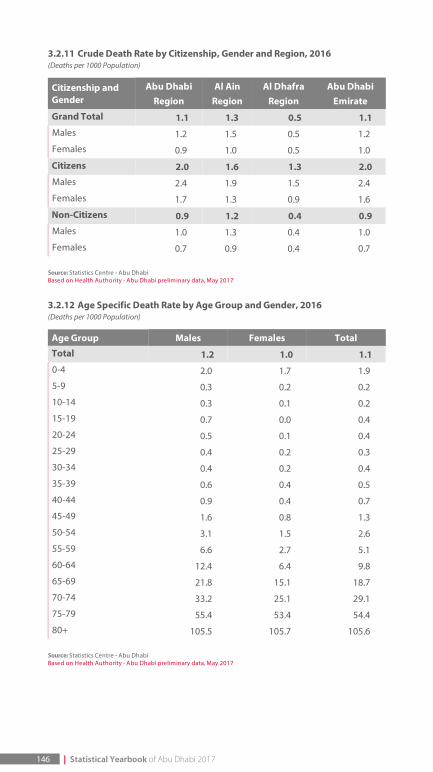
3.2.11 Crude Death Rate by Citizenship, Gender and Region, 2016(Deaths per 1000 Population)
Citizenship andGender
Abu DhabiRegion
Al AinRegion
Al DhafraRegion
Abu DhabiEmirate
Grand Total 1.1 1.3 0.5 1.1 Males 1.2 1.5 0.5 1.2
Females 0.9 1.0 0.5 1.0
Citizens 2.0 1.6 1.3 2.0 Males 2.4 1.9 1.5 2.4
Females 1.7 1.3 0.9 1.6
Non-Citizens 0.9 1.2 0.4 0.9 Males 1.0 1.3 0.4 1.0
Females 0.7 0.9 0.4 0.7
Source: Statistics Centre - Abu DhabiBased on Health Authority - Abu Dhabi preliminary data, May 2017
3.2.12 Age Specific Death Rate by Age Group and Gender, 2016(Deaths per 1000 Population)
Age Group Males Females Total
Total 1.2 1.0 1.1 0-4 2.0 1.7 1.9
5-9 0.3 0.2 0.2
10-14 0.3 0.1 0.2
15-19 0.7 0.0 0.4
20-24 0.5 0.1 0.4
25-29 0.4 0.2 0.3
30-34 0.4 0.2 0.4
35-39 0.6 0.4 0.5
40-44 0.9 0.4 0.7
45-49 1.6 0.8 1.3
50-54 3.1 1.5 2.6
55-59 6.6 2.7 5.1
60-64 12.4 6.4 9.8
65-69 21.8 15.1 18.7
70-74 33.2 25.1 29.1
75-79 55.4 53.4 54.4
80+ 105.5 105.7 105.6
Source: Statistics Centre - Abu DhabiBased on Health Authority - Abu Dhabi preliminary data, May 2017
146 | Statistical Yearbook of Abu Dhabi 2017
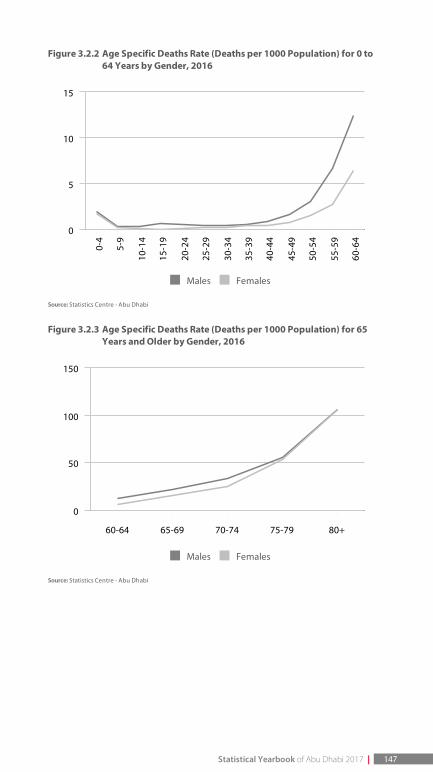
Figure 3.2.2 Age Specific Deaths Rate (Deaths per 1000 Population) for 0 to64 Years by Gender, 2016
. Males . Females
Source: Statistics Centre - Abu Dhabi
Figure 3.2.3 Age Specific Deaths Rate (Deaths per 1000 Population) for 65Years and Older by Gender, 2016
. Males . Females
Source: Statistics Centre - Abu Dhabi
0-4
5-9
10-1
4
15-1
9
20-2
4
25-2
9
30-3
4
35-3
9
40-4
4
45-4
9
50-5
4
55-5
9
60-6
4
0
5
10
15
60-64 65-69 70-74 75-79 80+
0
50
100
150
Statistical Yearbook of Abu Dhabi 2017 | 147
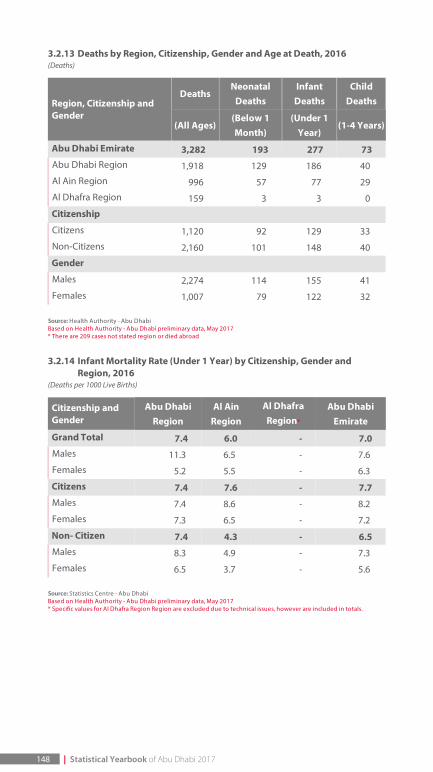
3.2.13 Deaths by Region, Citizenship, Gender and Age at Death, 2016(Deaths)
Region, Citizenship andGender
DeathsNeonatal
DeathsInfant
DeathsChild
Deaths
(All Ages)(Below 1Month)
(Under 1Year)
(1-4 Years)
Abu Dhabi Emirate 3,282 193 277 73 Abu Dhabi Region 1,918 129 186 40
Al Ain Region 996 57 77 29
Al Dhafra Region 159 3 3 0
Citizenship
Citizens 1,120 92 129 33
Non-Citizens 2,160 101 148 40
Gender
Males 2,274 114 155 41
Females 1,007 79 122 32
Source: Health Authority - Abu DhabiBased on Health Authority - Abu Dhabi preliminary data, May 2017* There are 209 cases not stated region or died abroad
3.2.14 Infant Mortality Rate (Under 1 Year) by Citizenship, Gender andRegion, 2016
(Deaths per 1000 Live Births)
Citizenship andGender
Abu DhabiRegion
Al AinRegion
Al DhafraRegion*
Abu DhabiEmirate
Grand Total 7.4 6.0 - 7.0 Males 11.3 6.5 - 7.6
Females 5.2 5.5 - 6.3
Citizens 7.4 7.6 - 7.7 Males 7.4 8.6 - 8.2
Females 7.3 6.5 - 7.2
Non- Citizen 7.4 4.3 - 6.5 Males 8.3 4.9 - 7.3
Females 6.5 3.7 - 5.6
Source: Statistics Centre - Abu DhabiBased on Health Authority - Abu Dhabi preliminary data, May 2017* Specific values for Al Dhafra Region Region are excluded due to technical issues, however are included in totals.
148 | Statistical Yearbook of Abu Dhabi 2017
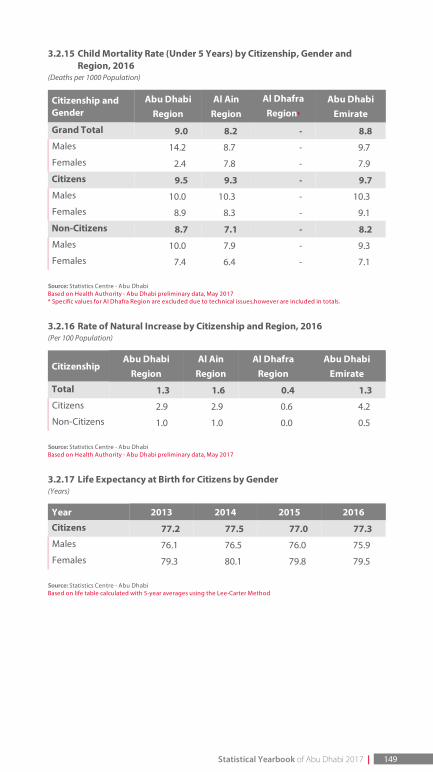
3.2.15 Child Mortality Rate (Under 5 Years) by Citizenship, Gender andRegion, 2016
(Deaths per 1000 Population)
Citizenship andGender
Abu DhabiRegion
Al AinRegion
Al DhafraRegion*
Abu DhabiEmirate
Grand Total 9.0 8.2 - 8.8 Males 14.2 8.7 - 9.7
Females 2.4 7.8 - 7.9
Citizens 9.5 9.3 - 9.7 Males 10.0 10.3 - 10.3
Females 8.9 8.3 - 9.1
Non-Citizens 8.7 7.1 - 8.2 Males 10.0 7.9 - 9.3
Females 7.4 6.4 - 7.1
Source: Statistics Centre - Abu DhabiBased on Health Authority - Abu Dhabi preliminary data, May 2017* Specific values for Al Dhafra Region are excluded due to technical issues,however are included in totals.
3.2.16 Rate of Natural Increase by Citizenship and Region, 2016(Per 100 Population)
CitizenshipAbu Dhabi
RegionAl Ain
RegionAl Dhafra
RegionAbu Dhabi
Emirate
Total 1.3 1.6 0.4 1.3 Citizens 2.9 2.9 0.6 4.2
Non-Citizens 1.0 1.0 0.0 0.5
Source: Statistics Centre - Abu DhabiBased on Health Authority - Abu Dhabi preliminary data, May 2017
3.2.17 Life Expectancy at Birth for Citizens by Gender(Years)
Year 2013 2014 2015 2016
Citizens 77.2 77.5 77.0 77.3 Males 76.1 76.5 76.0 75.9
Females 79.3 80.1 79.8 79.5
Source: Statistics Centre - Abu DhabiBased on life table calculated with 5-year averages using the Lee-Carter Method
Statistical Yearbook of Abu Dhabi 2017 | 149
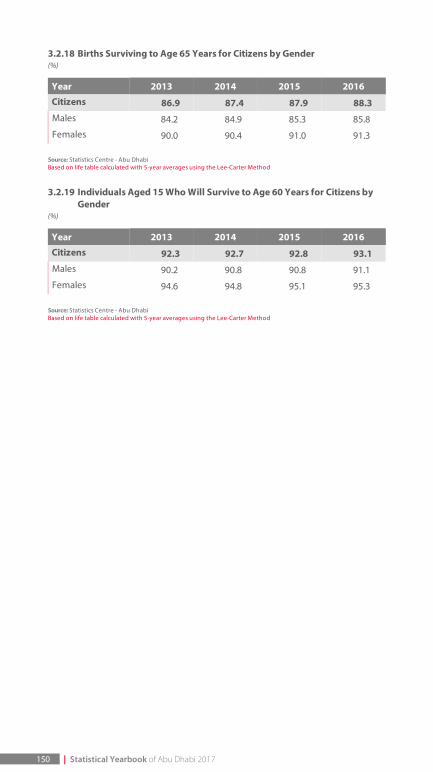
3.2.18 Births Surviving to Age 65 Years for Citizens by Gender(%)
Year 2013 2014 2015 2016
Citizens 86.9 87.4 87.9 88.3 Males 84.2 84.9 85.3 85.8
Females 90.0 90.4 91.0 91.3
Source: Statistics Centre - Abu DhabiBased on life table calculated with 5-year averages using the Lee-Carter Method
3.2.19 Individuals Aged 15 Who Will Survive to Age 60 Years for Citizens byGender
(%)
Year 2013 2014 2015 2016
Citizens 92.3 92.7 92.8 93.1 Males 90.2 90.8 90.8 91.1
Females 94.6 94.8 95.1 95.3
Source: Statistics Centre - Abu DhabiBased on life table calculated with 5-year averages using the Lee-Carter Method
150 | Statistical Yearbook of Abu Dhabi 2017
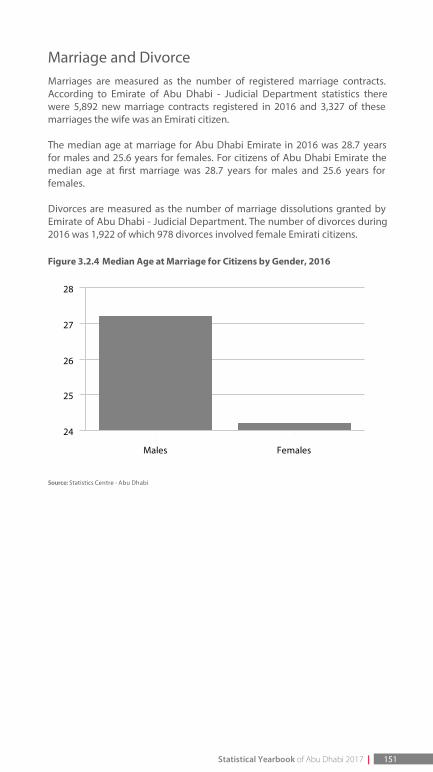
Marriage and DivorceMarriages are measured as the number of registered marriage contracts.According to Emirate of Abu Dhabi - Judicial Department statistics therewere 5,892 new marriage contracts registered in 2016 and 3,327 of thesemarriages the wife was an Emirati citizen.
The median age at marriage for Abu Dhabi Emirate in 2016 was 28.7 yearsfor males and 25.6 years for females. For citizens of Abu Dhabi Emirate themedian age at rst marriage was 28.7 years for males and 25.6 years forfemales.
Divorces are measured as the number of marriage dissolutions granted byEmirate of Abu Dhabi - Judicial Department. The number of divorces during2016 was 1,922 of which 978 divorces involved female Emirati citizens.
Figure 3.2.4 Median Age at Marriage for Citizens by Gender, 2016
Source: Statistics Centre - Abu Dhabi
Males Females
24
25
26
27
28
Statistical Yearbook of Abu Dhabi 2017 | 151
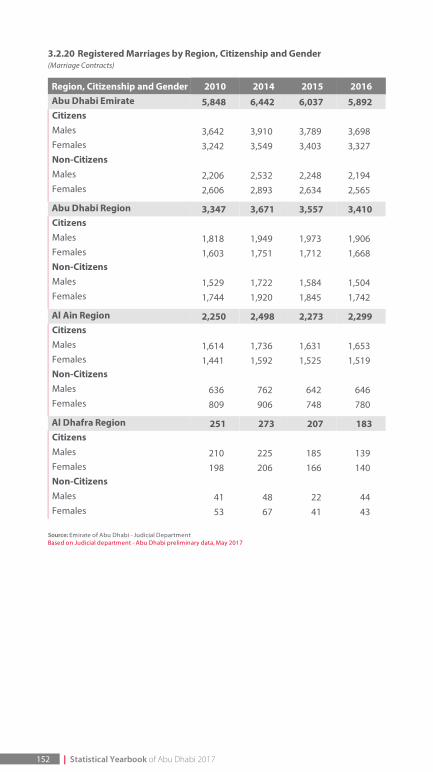
3.2.20 Registered Marriages by Region, Citizenship and Gender(Marriage Contracts)
Region, Citizenship and Gender 2010 2014 2015 2016Abu Dhabi Emirate 5,848 6,442 6,037 5,892 CitizensMales 3,642 3,910 3,789 3,698 Females 3,242 3,549 3,403 3,327 Non-CitizensMales 2,206 2,532 2,248 2,194 Females 2,606 2,893 2,634 2,565
Abu Dhabi Region 3,347 3,671 3,557 3,410 CitizensMales 1,818 1,949 1,973 1,906 Females 1,603 1,751 1,712 1,668 Non-CitizensMales 1,529 1,722 1,584 1,504 Females 1,744 1,920 1,845 1,742
Al Ain Region 2,250 2,498 2,273 2,299 CitizensMales 1,614 1,736 1,631 1,653 Females 1,441 1,592 1,525 1,519 Non-CitizensMales 636 762 642 646 Females 809 906 748 780
Al Dhafra Region 251 273 207 183 CitizensMales 210 225 185 139 Females 198 206 166 140 Non-CitizensMales 41 48 22 44 Females 53 67 41 43
Source: Emirate of Abu Dhabi - Judicial DepartmentBased on Judicial department - Abu Dhabi preliminary data, May 2017
152 | Statistical Yearbook of Abu Dhabi 2017
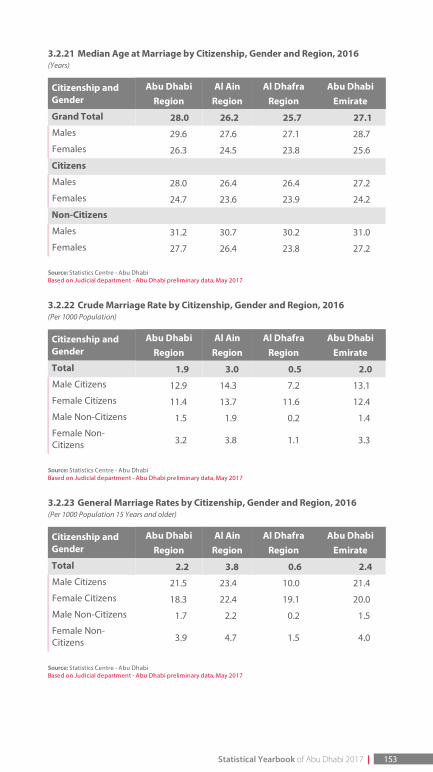
3.2.21 Median Age at Marriage by Citizenship, Gender and Region, 2016(Years)
Citizenship andGender
Abu DhabiRegion
Al AinRegion
Al DhafraRegion
Abu DhabiEmirate
Grand Total 28.0 26.2 25.7 27.1 Males 29.6 27.6 27.1 28.7
Females 26.3 24.5 23.8 25.6
Citizens
Males 28.0 26.4 26.4 27.2
Females 24.7 23.6 23.9 24.2
Non-Citizens
Males 31.2 30.7 30.2 31.0
Females 27.7 26.4 23.8 27.2
Source: Statistics Centre - Abu DhabiBased on Judicial department - Abu Dhabi preliminary data, May 2017
3.2.22 Crude Marriage Rate by Citizenship, Gender and Region, 2016(Per 1000 Population)
Citizenship andGender
Abu DhabiRegion
Al AinRegion
Al DhafraRegion
Abu DhabiEmirate
Total 1.9 3.0 0.5 2.0 Male Citizens 12.9 14.3 7.2 13.1
Female Citizens 11.4 13.7 11.6 12.4
Male Non-Citizens 1.5 1.9 0.2 1.4
Female Non-Citizens 3.2 3.8 1.1 3.3
Source: Statistics Centre - Abu DhabiBased on Judicial department - Abu Dhabi preliminary data, May 2017
3.2.23 General Marriage Rates by Citizenship, Gender and Region, 2016(Per 1000 Population 15 Years and older)
Citizenship andGender
Abu DhabiRegion
Al AinRegion
Al DhafraRegion
Abu DhabiEmirate
Total 2.2 3.8 0.6 2.4 Male Citizens 21.5 23.4 10.0 21.4
Female Citizens 18.3 22.4 19.1 20.0
Male Non-Citizens 1.7 2.2 0.2 1.5
Female Non-Citizens 3.9 4.7 1.5 4.0
Source: Statistics Centre - Abu DhabiBased on Judicial department - Abu Dhabi preliminary data, May 2017
Statistical Yearbook of Abu Dhabi 2017 | 153
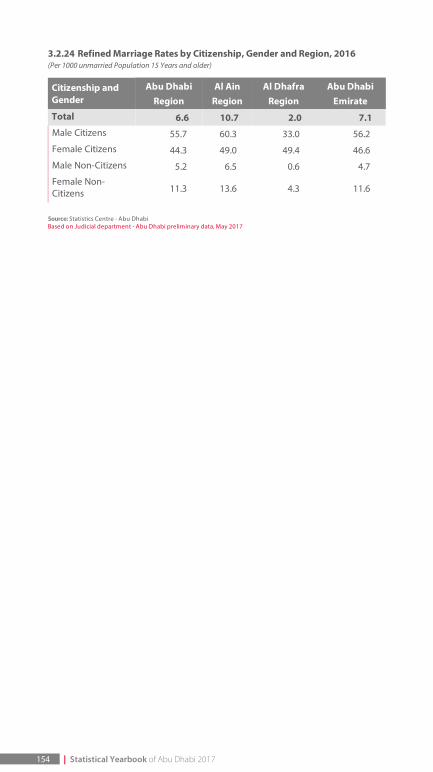
3.2.24 Refined Marriage Rates by Citizenship, Gender and Region, 2016(Per 1000 unmarried Population 15 Years and older)
Citizenship andGender
Abu DhabiRegion
Al AinRegion
Al DhafraRegion
Abu DhabiEmirate
Total 6.6 10.7 2.0 7.1 Male Citizens 55.7 60.3 33.0 56.2
Female Citizens 44.3 49.0 49.4 46.6
Male Non-Citizens 5.2 6.5 0.6 4.7
Female Non-Citizens 11.3 13.6 4.3 11.6
Source: Statistics Centre - Abu DhabiBased on Judicial department - Abu Dhabi preliminary data, May 2017
154 | Statistical Yearbook of Abu Dhabi 2017
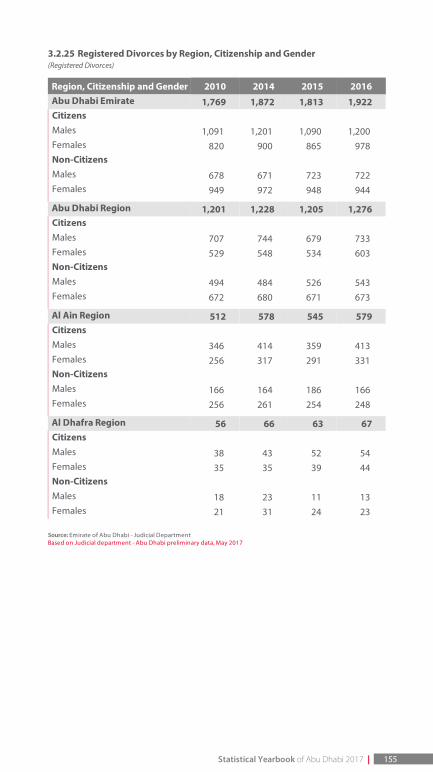
3.2.25 Registered Divorces by Region, Citizenship and Gender(Registered Divorces)
Region, Citizenship and Gender 2010 2014 2015 2016Abu Dhabi Emirate 1,769 1,872 1,813 1,922 CitizensMales 1,091 1,201 1,090 1,200 Females 820 900 865 978 Non-CitizensMales 678 671 723 722 Females 949 972 948 944
Abu Dhabi Region 1,201 1,228 1,205 1,276 CitizensMales 707 744 679 733 Females 529 548 534 603 Non-CitizensMales 494 484 526 543 Females 672 680 671 673
Al Ain Region 512 578 545 579 CitizensMales 346 414 359 413 Females 256 317 291 331 Non-CitizensMales 166 164 186 166 Females 256 261 254 248
Al Dhafra Region 56 66 63 67 CitizensMales 38 43 52 54 Females 35 35 39 44 Non-CitizensMales 18 23 11 13 Females 21 31 24 23
Source: Emirate of Abu Dhabi - Judicial DepartmentBased on Judicial department - Abu Dhabi preliminary data, May 2017
Statistical Yearbook of Abu Dhabi 2017 | 155
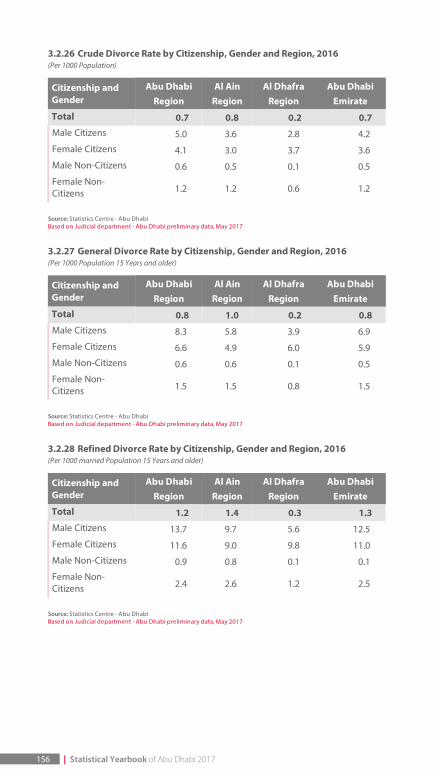
3.2.26 Crude Divorce Rate by Citizenship, Gender and Region, 2016(Per 1000 Population)
Citizenship andGender
Abu DhabiRegion
Al AinRegion
Al DhafraRegion
Abu DhabiEmirate
Total 0.7 0.8 0.2 0.7 Male Citizens 5.0 3.6 2.8 4.2
Female Citizens 4.1 3.0 3.7 3.6
Male Non-Citizens 0.6 0.5 0.1 0.5
Female Non-Citizens 1.2 1.2 0.6 1.2
Source: Statistics Centre - Abu DhabiBased on Judicial department - Abu Dhabi preliminary data, May 2017
3.2.27 General Divorce Rate by Citizenship, Gender and Region, 2016(Per 1000 Population 15 Years and older)
Citizenship andGender
Abu DhabiRegion
Al AinRegion
Al DhafraRegion
Abu DhabiEmirate
Total 0.8 1.0 0.2 0.8 Male Citizens 8.3 5.8 3.9 6.9
Female Citizens 6.6 4.9 6.0 5.9
Male Non-Citizens 0.6 0.6 0.1 0.5
Female Non-Citizens 1.5 1.5 0.8 1.5
Source: Statistics Centre - Abu DhabiBased on Judicial department - Abu Dhabi preliminary data, May 2017
3.2.28 Refined Divorce Rate by Citizenship, Gender and Region, 2016(Per 1000 married Population 15 Years and older)
Citizenship andGender
Abu DhabiRegion
Al AinRegion
Al DhafraRegion
Abu DhabiEmirate
Total 1.2 1.4 0.3 1.3 Male Citizens 13.7 9.7 5.6 12.5
Female Citizens 11.6 9.0 9.8 11.0
Male Non-Citizens 0.9 0.8 0.1 0.1
Female Non-Citizens 2.4 2.6 1.2 2.5
Source: Statistics Centre - Abu DhabiBased on Judicial department - Abu Dhabi preliminary data, May 2017
156 | Statistical Yearbook of Abu Dhabi 2017

162 Statistical Yearbook of Abu Dhabi 2016

163 Statistical Yearbook of Abu Dhabi 2016
4. Social
• Education
• Health
• Social Welfare
• Culture and Heritage
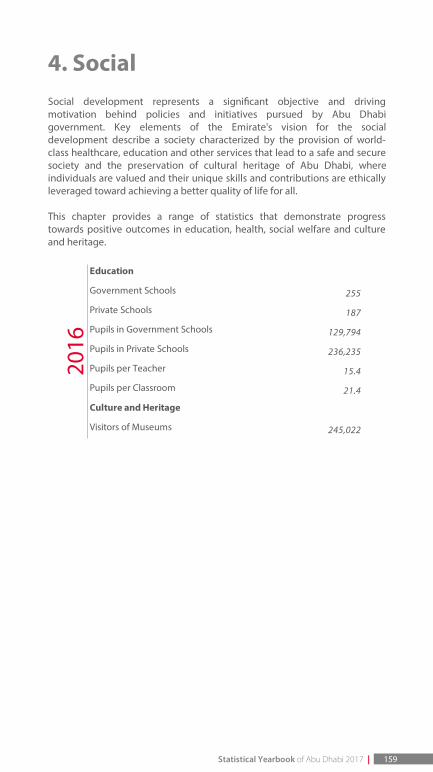
4. SocialSocial development represents a signi cant objective and drivingmotivation behind policies and initiatives pursued by Abu Dhabigovernment. Key elements of the Emirate's vision for the socialdevelopment describe a society characterized by the provision of world-class healthcare, education and other services that lead to a safe and securesociety and the preservation of cultural heritage of Abu Dhabi, whereindividuals are valued and their unique skills and contributions are ethicallyleveraged toward achieving a better quality of life for all.
This chapter provides a range of statistics that demonstrate progresstowards positive outcomes in education, health, social welfare and cultureand heritage.
Education
Government Schools 255
Private Schools 187
Pupils in Government Schools 129,794
Pupils in Private Schools 236,235
Pupils per Teacher 15.4
Pupils per Classroom 21.4
Culture and Heritage
Visitors of Museums 245,022
2016
Statistical Yearbook of Abu Dhabi 2017 | 159
4.1. EducationAbu Dhabi has made remarkable achievements in the education sector, andhas spared no effort in its endeavor to ensure the availability of high qualityeducational infrastructure of schools, colleges/institutes, adult educationcentres and universities and quali ed teachers in the government andprivate sectors.
This section provides detailed statistics on education for the academic year2015-16.
The total number of schools in Abu Dhabi Emirate was 442 of which 255were government schools and 187 were private schools, comprising 17,118classrooms. In these schools there were 366,029 pupils, 23,745 teachers and10,265 administrators. The number of pupils per teacher was 15.4 and thenumber of pupils per classroom was 21.4.
In the school year in 2015-16, 35.5% of pupils were enrolled in governmenteducation, while 64.5% of them were enrolled in private education, up from49.3% in 2005-06. The number of female pupils per 100 male pupils in alleducation stages for the Emirate was 96.2.
In 2015-16, the number of Emirati pupils enrolled in all stages of schoolingup to the secondary stage was 159,364, representing 43.5% of all pupils. Theschool gross enrolment ratio for 2015-16 was 102.7 in the rst educationcycle, 95.5 in the second cycle and 71.2 in secondary Stage. The 2015-16progression ratios to secondary school for males, females and both genderswere 96.5%, 97.5% and 97.0% respectively a total of 19,744 studentsprogressing to secondary school in 2015-16, up 3.6% compared with theprevious year.
In 2015-16, there were 9,134 students enrolled in literacy and adulteducation centres and home schooling, of whom 73.5% were citizens.
There were 244 teachers including 163 citizens. The academic year 2015-16witnessed the graduation of 8,082 students from higher education, of whom5,279 students graduated from the government universities and institutionsand 2,803 from the private universities and institutions with 60.5% beingcitizens. Total enrolments in higher education were 52,053, of whom 38,049were citizens.
160 | Statistical Yearbook of Abu Dhabi 2017
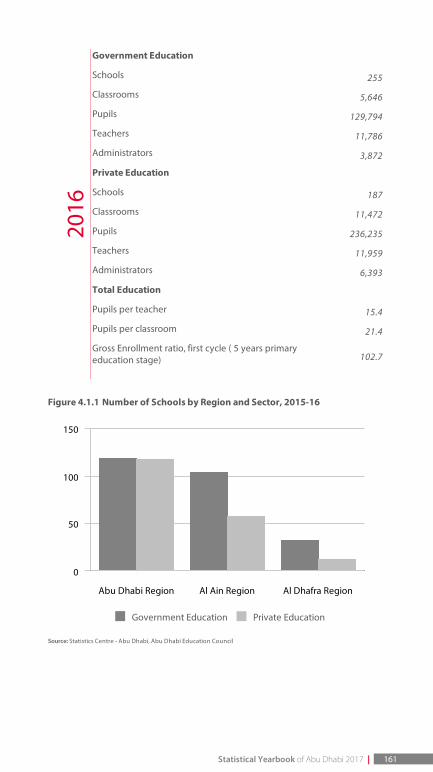
Government Education
Schools 255
Classrooms 5,646
Pupils 129,794
Teachers 11,786
Administrators 3,872
Private Education
Schools 187
Classrooms 11,472
Pupils 236,235
Teachers 11,959
Administrators 6,393
Total Education
Pupils per teacher 15.4
Pupils per classroom 21.4
Gross Enrollment ratio, first cycle ( 5 years primaryeducation stage) 102.7
Figure 4.1.1 Number of Schools by Region and Sector, 2015-16
. Government Education . Private Education
Source: Statistics Centre - Abu Dhabi, Abu Dhabi Education Council
2016
Abu Dhabi Region Al Ain Region Al Dhafra Region
0
50
100
150
Statistical Yearbook of Abu Dhabi 2017 | 161
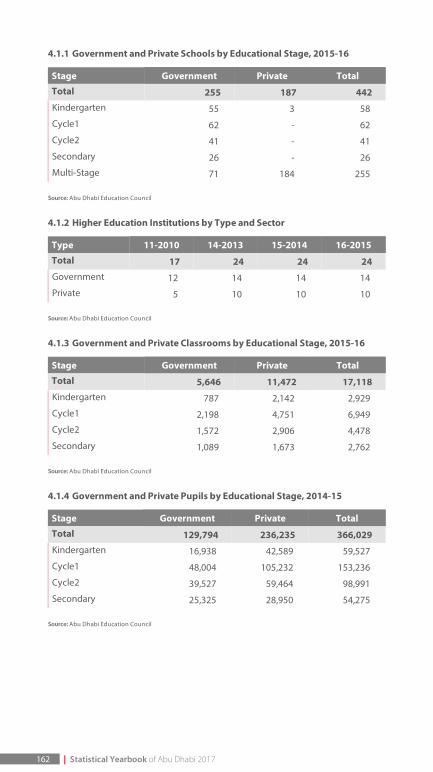
4.1.1 Government and Private Schools by Educational Stage, 2015-16
Stage Government Private Total
Total 255 187 442 Kindergarten 55 3 58
Cycle1 62 - 62
Cycle2 41 - 41
Secondary 26 - 26
Multi-Stage 71 184 255
Source: Abu Dhabi Education Council
4.1.2 Higher Education Institutions by Type and Sector
Type 11-2010 14-2013 15-2014 16-2015
Total 17 24 24 24 Government 12 14 14 14
Private 5 10 10 10
Source: Abu Dhabi Education Council
4.1.3 Government and Private Classrooms by Educational Stage, 2015-16
Stage Government Private Total
Total 5,646 11,472 17,118 Kindergarten 787 2,142 2,929
Cycle1 2,198 4,751 6,949
Cycle2 1,572 2,906 4,478
Secondary 1,089 1,673 2,762
Source: Abu Dhabi Education Council
4.1.4 Government and Private Pupils by Educational Stage, 2014-15
Stage Government Private Total
Total 129,794 236,235 366,029 Kindergarten 16,938 42,589 59,527
Cycle1 48,004 105,232 153,236
Cycle2 39,527 59,464 98,991
Secondary 25,325 28,950 54,275
Source: Abu Dhabi Education Council
162 | Statistical Yearbook of Abu Dhabi 2017
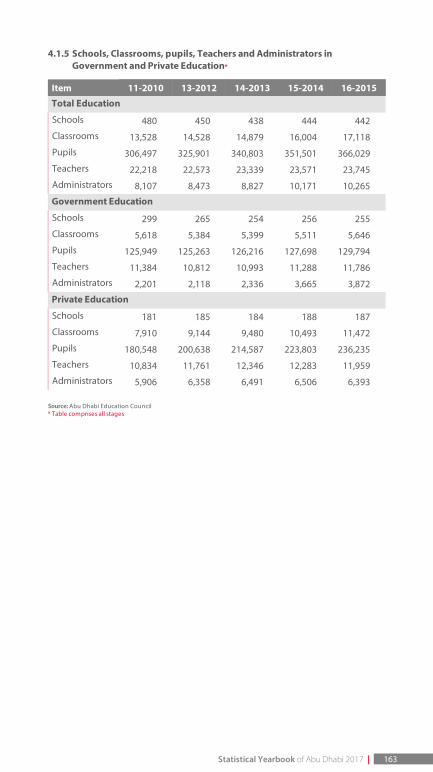
4.1.5 Schools, Classrooms, pupils, Teachers and Administrators inGovernment and Private Education*
Item 11-2010 13-2012 14-2013 15-2014 16-2015
Total Education
Schools 480 450 438 444 442
Classrooms 13,528 14,528 14,879 16,004 17,118
Pupils 306,497 325,901 340,803 351,501 366,029
Teachers 22,218 22,573 23,339 23,571 23,745
Administrators 8,107 8,473 8,827 10,171 10,265
Government Education
Schools 299 265 254 256 255
Classrooms 5,618 5,384 5,399 5,511 5,646
Pupils 125,949 125,263 126,216 127,698 129,794
Teachers 11,384 10,812 10,993 11,288 11,786
Administrators 2,201 2,118 2,336 3,665 3,872
Private Education
Schools 181 185 184 188 187
Classrooms 7,910 9,144 9,480 10,493 11,472
Pupils 180,548 200,638 214,587 223,803 236,235
Teachers 10,834 11,761 12,346 12,283 11,959
Administrators 5,906 6,358 6,491 6,506 6,393
Source: Abu Dhabi Education Council* Table comprises all stages
Statistical Yearbook of Abu Dhabi 2017 | 163
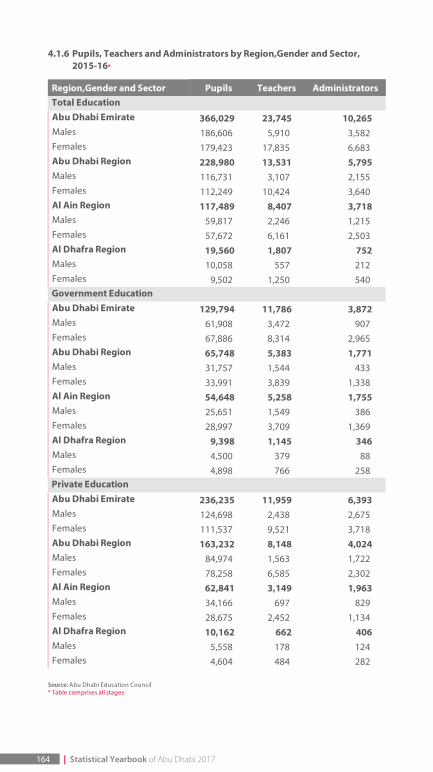
4.1.6 Pupils, Teachers and Administrators by Region,Gender and Sector,2015-16*
Region,Gender and Sector Pupils Teachers AdministratorsTotal EducationAbu Dhabi Emirate 366,029 23,745 10,265 Males 186,606 5,910 3,582 Females 179,423 17,835 6,683 Abu Dhabi Region 228,980 13,531 5,795 Males 116,731 3,107 2,155 Females 112,249 10,424 3,640 Al Ain Region 117,489 8,407 3,718 Males 59,817 2,246 1,215 Females 57,672 6,161 2,503 Al Dhafra Region 19,560 1,807 752 Males 10,058 557 212 Females 9,502 1,250 540 Government EducationAbu Dhabi Emirate 129,794 11,786 3,872 Males 61,908 3,472 907 Females 67,886 8,314 2,965 Abu Dhabi Region 65,748 5,383 1,771 Males 31,757 1,544 433 Females 33,991 3,839 1,338 Al Ain Region 54,648 5,258 1,755 Males 25,651 1,549 386 Females 28,997 3,709 1,369 Al Dhafra Region 9,398 1,145 346 Males 4,500 379 88 Females 4,898 766 258 Private EducationAbu Dhabi Emirate 236,235 11,959 6,393 Males 124,698 2,438 2,675 Females 111,537 9,521 3,718 Abu Dhabi Region 163,232 8,148 4,024 Males 84,974 1,563 1,722 Females 78,258 6,585 2,302 Al Ain Region 62,841 3,149 1,963 Males 34,166 697 829 Females 28,675 2,452 1,134 Al Dhafra Region 10,162 662 406 Males 5,558 178 124 Females 4,604 484 282
Source: Abu Dhabi Education Council* Table comprises all stages
164 | Statistical Yearbook of Abu Dhabi 2017
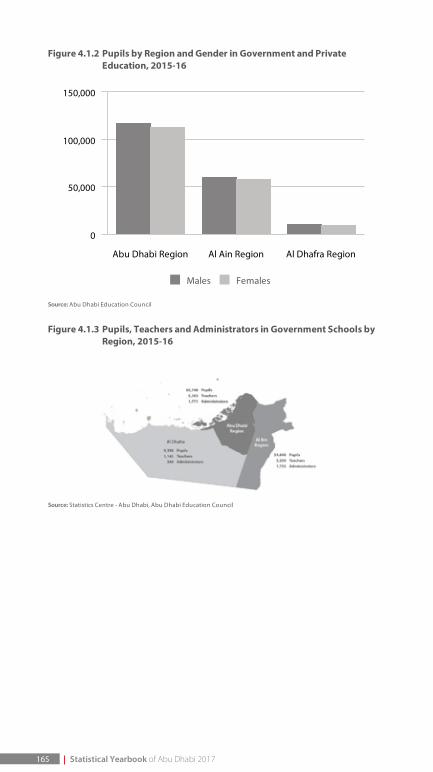
165
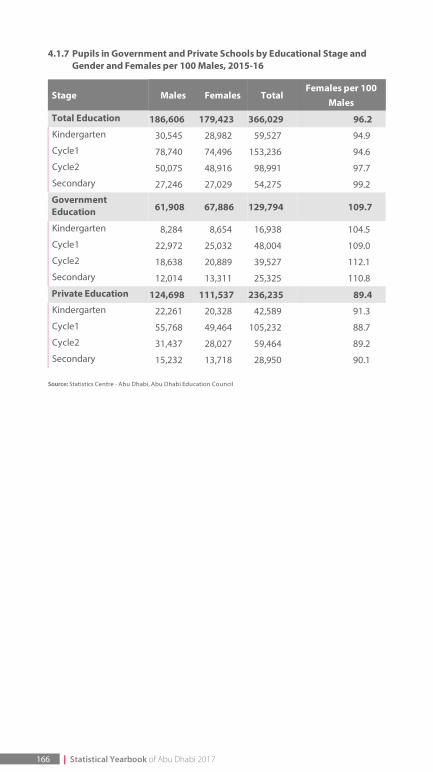
4.1.7 Pupils in Government and Private Schools by Educational Stage andGender and Females per 100 Males, 2015-16
Stage Males Females TotalFemales per 100
Males
Total Education 186,606 179,423 366,029 96.2 Kindergarten 30,545 28,982 59,527 94.9
Cycle1 78,740 74,496 153,236 94.6
Cycle2 50,075 48,916 98,991 97.7
Secondary 27,246 27,029 54,275 99.2
GovernmentEducation 61,908 67,886 129,794 109.7
Kindergarten 8,284 8,654 16,938 104.5
Cycle1 22,972 25,032 48,004 109.0
Cycle2 18,638 20,889 39,527 112.1
Secondary 12,014 13,311 25,325 110.8
Private Education 124,698 111,537 236,235 89.4 Kindergarten 22,261 20,328 42,589 91.3
Cycle1 55,768 49,464 105,232 88.7
Cycle2 31,437 28,027 59,464 89.2
Secondary 15,232 13,718 28,950 90.1
Source: Statistics Centre - Abu Dhabi, Abu Dhabi Education Council
166 | Statistical Yearbook of Abu Dhabi 2017
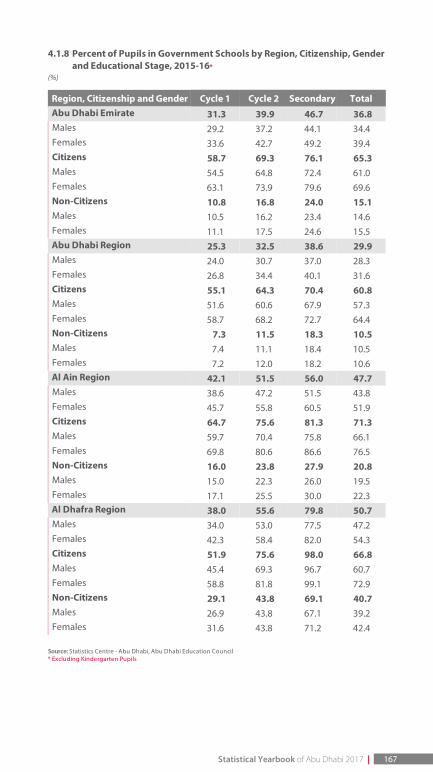
4.1.8 Percent of Pupils in Government Schools by Region, Citizenship, Genderand Educational Stage, 2015-16*
(%)
Region, Citizenship and Gender Cycle 1 Cycle 2 Secondary TotalAbu Dhabi Emirate 31.3 39.9 46.7 36.8 Males 29.2 37.2 44.1 34.4 Females 33.6 42.7 49.2 39.4 Citizens 58.7 69.3 76.1 65.3 Males 54.5 64.8 72.4 61.0 Females 63.1 73.9 79.6 69.6 Non-Citizens 10.8 16.8 24.0 15.1 Males 10.5 16.2 23.4 14.6 Females 11.1 17.5 24.6 15.5 Abu Dhabi Region 25.3 32.5 38.6 29.9 Males 24.0 30.7 37.0 28.3 Females 26.8 34.4 40.1 31.6 Citizens 55.1 64.3 70.4 60.8 Males 51.6 60.6 67.9 57.3 Females 58.7 68.2 72.7 64.4 Non-Citizens 7.3 11.5 18.3 10.5 Males 7.4 11.1 18.4 10.5 Females 7.2 12.0 18.2 10.6 Al Ain Region 42.1 51.5 56.0 47.7 Males 38.6 47.2 51.5 43.8 Females 45.7 55.8 60.5 51.9 Citizens 64.7 75.6 81.3 71.3 Males 59.7 70.4 75.8 66.1 Females 69.8 80.6 86.6 76.5 Non-Citizens 16.0 23.8 27.9 20.8 Males 15.0 22.3 26.0 19.5 Females 17.1 25.5 30.0 22.3 Al Dhafra Region 38.0 55.6 79.8 50.7 Males 34.0 53.0 77.5 47.2 Females 42.3 58.4 82.0 54.3 Citizens 51.9 75.6 98.0 66.8 Males 45.4 69.3 96.7 60.7 Females 58.8 81.8 99.1 72.9 Non-Citizens 29.1 43.8 69.1 40.7 Males 26.9 43.8 67.1 39.2 Females 31.6 43.8 71.2 42.4
Source: Statistics Centre - Abu Dhabi, Abu Dhabi Education Council* Excluding Kindergarten Pupils
Statistical Yearbook of Abu Dhabi 2017 | 167
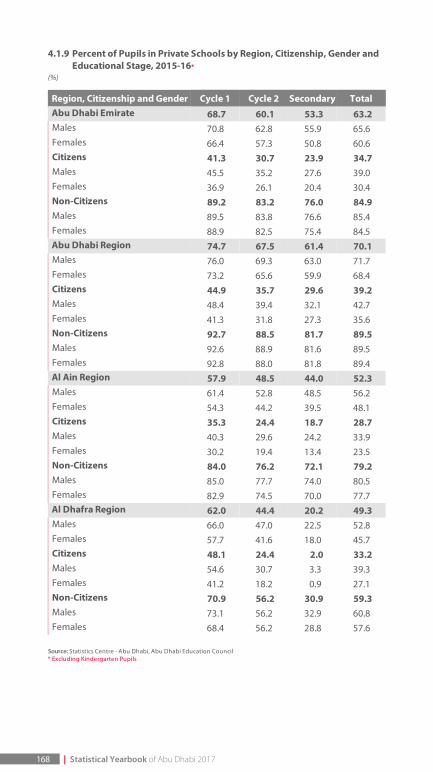
4.1.9 Percent of Pupils in Private Schools by Region, Citizenship, Gender andEducational Stage, 2015-16*
(%)
Region, Citizenship and Gender Cycle 1 Cycle 2 Secondary TotalAbu Dhabi Emirate 68.7 60.1 53.3 63.2 Males 70.8 62.8 55.9 65.6 Females 66.4 57.3 50.8 60.6 Citizens 41.3 30.7 23.9 34.7 Males 45.5 35.2 27.6 39.0 Females 36.9 26.1 20.4 30.4 Non-Citizens 89.2 83.2 76.0 84.9 Males 89.5 83.8 76.6 85.4 Females 88.9 82.5 75.4 84.5 Abu Dhabi Region 74.7 67.5 61.4 70.1 Males 76.0 69.3 63.0 71.7 Females 73.2 65.6 59.9 68.4 Citizens 44.9 35.7 29.6 39.2 Males 48.4 39.4 32.1 42.7 Females 41.3 31.8 27.3 35.6 Non-Citizens 92.7 88.5 81.7 89.5 Males 92.6 88.9 81.6 89.5 Females 92.8 88.0 81.8 89.4 Al Ain Region 57.9 48.5 44.0 52.3 Males 61.4 52.8 48.5 56.2 Females 54.3 44.2 39.5 48.1 Citizens 35.3 24.4 18.7 28.7 Males 40.3 29.6 24.2 33.9 Females 30.2 19.4 13.4 23.5 Non-Citizens 84.0 76.2 72.1 79.2 Males 85.0 77.7 74.0 80.5 Females 82.9 74.5 70.0 77.7 Al Dhafra Region 62.0 44.4 20.2 49.3 Males 66.0 47.0 22.5 52.8 Females 57.7 41.6 18.0 45.7 Citizens 48.1 24.4 2.0 33.2 Males 54.6 30.7 3.3 39.3 Females 41.2 18.2 0.9 27.1 Non-Citizens 70.9 56.2 30.9 59.3 Males 73.1 56.2 32.9 60.8 Females 68.4 56.2 28.8 57.6
Source: Statistics Centre - Abu Dhabi, Abu Dhabi Education Council* Excluding Kindergarten Pupils
168 | Statistical Yearbook of Abu Dhabi 2017
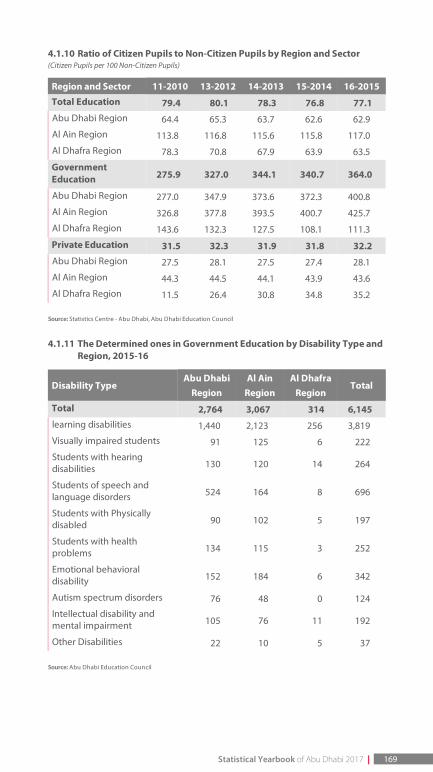
4.1.10 Ratio of Citizen Pupils to Non-Citizen Pupils by Region and Sector(Citizen Pupils per 100 Non-Citizen Pupils)
Region and Sector 11-2010 13-2012 14-2013 15-2014 16-2015
Total Education 79.4 80.1 78.3 76.8 77.1 Abu Dhabi Region 64.4 65.3 63.7 62.6 62.9
Al Ain Region 113.8 116.8 115.6 115.8 117.0
Al Dhafra Region 78.3 70.8 67.9 63.9 63.5
GovernmentEducation 275.9 327.0 344.1 340.7 364.0
Abu Dhabi Region 277.0 347.9 373.6 372.3 400.8
Al Ain Region 326.8 377.8 393.5 400.7 425.7
Al Dhafra Region 143.6 132.3 127.5 108.1 111.3
Private Education 31.5 32.3 31.9 31.8 32.2 Abu Dhabi Region 27.5 28.1 27.5 27.4 28.1
Al Ain Region 44.3 44.5 44.1 43.9 43.6
Al Dhafra Region 11.5 26.4 30.8 34.8 35.2
Source: Statistics Centre - Abu Dhabi, Abu Dhabi Education Council
4.1.11 The Determined ones in Government Education by Disability Type andRegion, 2015-16
Disability TypeAbu Dhabi
RegionAl Ain
RegionAl Dhafra
RegionTotal
Total 2,764 3,067 314 6,145 learning disabilities 1,440 2,123 256 3,819
Visually impaired students 91 125 6 222
Students with hearingdisabilities 130 120 14 264
Students of speech andlanguage disorders 524 164 8 696
Students with Physicallydisabled 90 102 5 197
Students with healthproblems 134 115 3 252
Emotional behavioraldisability 152 184 6 342
Autism spectrum disorders 76 48 0 124
Intellectual disability andmental impairment 105 76 11 192
Other Disabilities 22 10 5 37
Source: Abu Dhabi Education Council
Statistical Yearbook of Abu Dhabi 2017 | 169
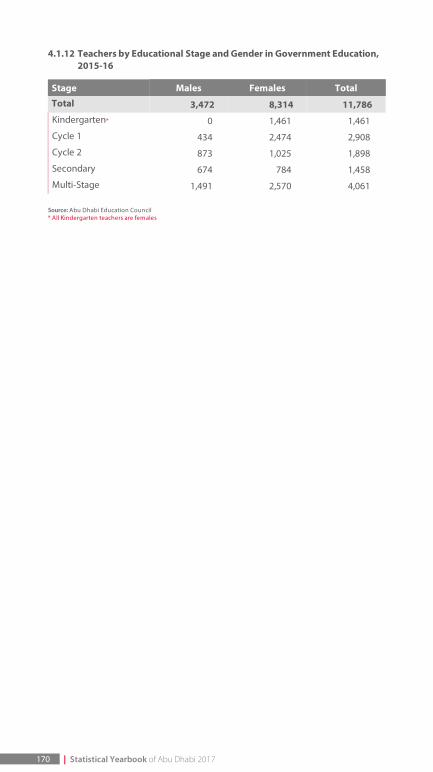
4.1.12 Teachers by Educational Stage and Gender in Government Education,2015-16
Stage Males Females Total
Total 3,472 8,314 11,786 Kindergarten* 0 1,461 1,461
Cycle 1 434 2,474 2,908
Cycle 2 873 1,025 1,898
Secondary 674 784 1,458
Multi-Stage 1,491 2,570 4,061
Source: Abu Dhabi Education Council* All Kindergarten teachers are females
170 | Statistical Yearbook of Abu Dhabi 2017
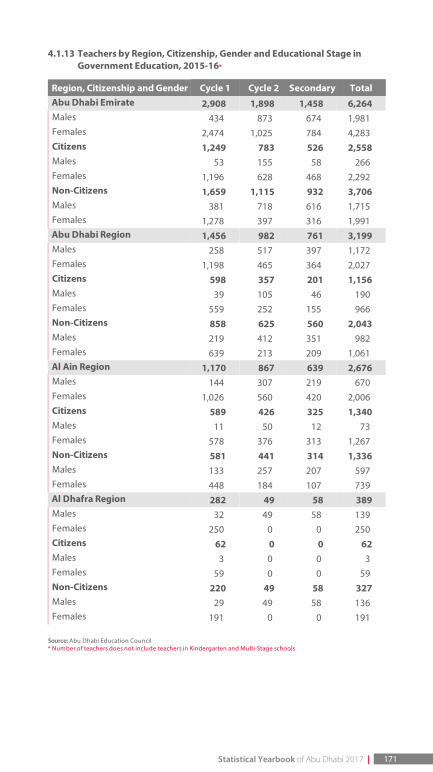
4.1.13 Teachers by Region, Citizenship, Gender and Educational Stage inGovernment Education, 2015-16*
Region, Citizenship and Gender Cycle 1 Cycle 2 Secondary TotalAbu Dhabi Emirate 2,908 1,898 1,458 6,264 Males 434 873 674 1,981 Females 2,474 1,025 784 4,283 Citizens 1,249 783 526 2,558 Males 53 155 58 266 Females 1,196 628 468 2,292 Non-Citizens 1,659 1,115 932 3,706 Males 381 718 616 1,715 Females 1,278 397 316 1,991 Abu Dhabi Region 1,456 982 761 3,199 Males 258 517 397 1,172 Females 1,198 465 364 2,027 Citizens 598 357 201 1,156 Males 39 105 46 190 Females 559 252 155 966 Non-Citizens 858 625 560 2,043 Males 219 412 351 982 Females 639 213 209 1,061 Al Ain Region 1,170 867 639 2,676 Males 144 307 219 670 Females 1,026 560 420 2,006 Citizens 589 426 325 1,340 Males 11 50 12 73 Females 578 376 313 1,267 Non-Citizens 581 441 314 1,336 Males 133 257 207 597 Females 448 184 107 739 Al Dhafra Region 282 49 58 389 Males 32 49 58 139 Females 250 0 0 250 Citizens 62 0 0 62 Males 3 0 0 3 Females 59 0 0 59 Non-Citizens 220 49 58 327 Males 29 49 58 136 Females 191 0 0 191
Source: Abu Dhabi Education Council* Number of teachers does not include teachers in Kindergarten and Multi-Stage schools
Statistical Yearbook of Abu Dhabi 2017 | 171
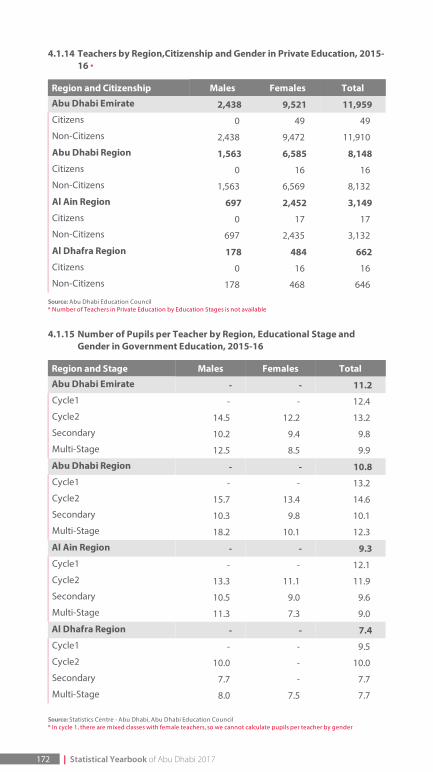
4.1.14 Teachers by Region,Citizenship and Gender in Private Education, 2015-16 *
Region and Citizenship Males Females Total
Abu Dhabi Emirate 2,438 9,521 11,959 Citizens 0 49 49
Non-Citizens 2,438 9,472 11,910
Abu Dhabi Region 1,563 6,585 8,148 Citizens 0 16 16
Non-Citizens 1,563 6,569 8,132
Al Ain Region 697 2,452 3,149 Citizens 0 17 17
Non-Citizens 697 2,435 3,132
Al Dhafra Region 178 484 662 Citizens 0 16 16
Non-Citizens 178 468 646
Source: Abu Dhabi Education Council* Number of Teachers in Private Education by Education Stages is not available
4.1.15 Number of Pupils per Teacher by Region, Educational Stage andGender in Government Education, 2015-16
Region and Stage Males Females Total
Abu Dhabi Emirate - - 11.2 Cycle1 - - 12.4
Cycle2 14.5 12.2 13.2
Secondary 10.2 9.4 9.8
Multi-Stage 12.5 8.5 9.9
Abu Dhabi Region - - 10.8 Cycle1 - - 13.2
Cycle2 15.7 13.4 14.6
Secondary 10.3 9.8 10.1
Multi-Stage 18.2 10.1 12.3
Al Ain Region - - 9.3 Cycle1 - - 12.1
Cycle2 13.3 11.1 11.9
Secondary 10.5 9.0 9.6
Multi-Stage 11.3 7.3 9.0
Al Dhafra Region - - 7.4 Cycle1 - - 9.5
Cycle2 10.0 - 10.0
Secondary 7.7 - 7.7
Multi-Stage 8.0 7.5 7.7
Source: Statistics Centre - Abu Dhabi, Abu Dhabi Education Council* In cycle 1, there are mixed classes with female teachers, so we cannot calculate pupils per teacher by gender
172 | Statistical Yearbook of Abu Dhabi 2017
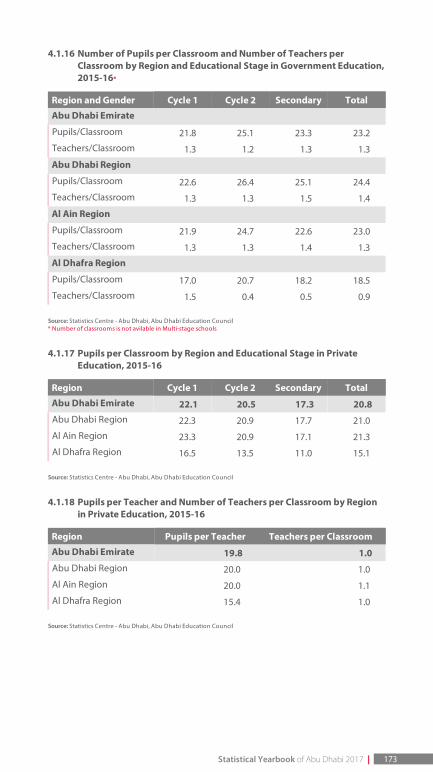
4.1.16 Number of Pupils per Classroom and Number of Teachers perClassroom by Region and Educational Stage in Government Education,2015-16*
Region and Gender Cycle 1 Cycle 2 Secondary Total
Abu Dhabi Emirate
Pupils/Classroom 21.8 25.1 23.3 23.2
Teachers/Classroom 1.3 1.2 1.3 1.3
Abu Dhabi Region
Pupils/Classroom 22.6 26.4 25.1 24.4
Teachers/Classroom 1.3 1.3 1.5 1.4
Al Ain Region
Pupils/Classroom 21.9 24.7 22.6 23.0
Teachers/Classroom 1.3 1.3 1.4 1.3
Al Dhafra Region
Pupils/Classroom 17.0 20.7 18.2 18.5
Teachers/Classroom 1.5 0.4 0.5 0.9
Source: Statistics Centre - Abu Dhabi, Abu Dhabi Education Council* Number of classrooms is not avilable in Multi-stage schools
4.1.17 Pupils per Classroom by Region and Educational Stage in PrivateEducation, 2015-16
Region Cycle 1 Cycle 2 Secondary Total
Abu Dhabi Emirate 22.1 20.5 17.3 20.8 Abu Dhabi Region 22.3 20.9 17.7 21.0
Al Ain Region 23.3 20.9 17.1 21.3
Al Dhafra Region 16.5 13.5 11.0 15.1
Source: Statistics Centre - Abu Dhabi, Abu Dhabi Education Council
4.1.18 Pupils per Teacher and Number of Teachers per Classroom by Regionin Private Education, 2015-16
Region Pupils per Teacher Teachers per Classroom
Abu Dhabi Emirate 19.8 1.0 Abu Dhabi Region 20.0 1.0
Al Ain Region 20.0 1.1
Al Dhafra Region 15.4 1.0
Source: Statistics Centre - Abu Dhabi, Abu Dhabi Education Council
Statistical Yearbook of Abu Dhabi 2017 | 173
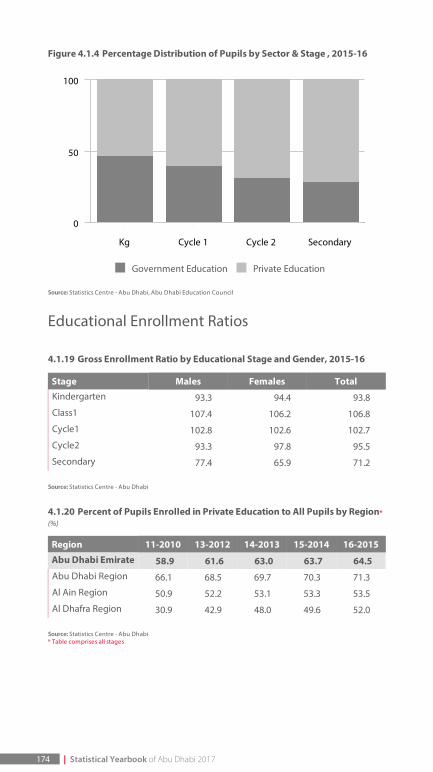
Figure 4.1.4 Percentage Distribution of Pupils by Sector & Stage , 2015-16
. Government Education . Private Education
Source: Statistics Centre - Abu Dhabi, Abu Dhabi Education Council
Educational Enrollment Ratios
4.1.19 Gross Enrollment Ratio by Educational Stage and Gender, 2015-16
Stage Males Females TotalKindergarten 93.3 94.4 93.8
Class1 107.4 106.2 106.8
Cycle1 102.8 102.6 102.7
Cycle2 93.3 97.8 95.5
Secondary 77.4 65.9 71.2
Source: Statistics Centre - Abu Dhabi
4.1.20 Percent of Pupils Enrolled in Private Education to All Pupils by Region*
(%)
Region 11-2010 13-2012 14-2013 15-2014 16-2015
Abu Dhabi Emirate 58.9 61.6 63.0 63.7 64.5 Abu Dhabi Region 66.1 68.5 69.7 70.3 71.3
Al Ain Region 50.9 52.2 53.1 53.3 53.5
Al Dhafra Region 30.9 42.9 48.0 49.6 52.0
Source: Statistics Centre - Abu Dhabi* Table comprises all stages
Kg Cycle 1 Cycle 2 Secondary
0
50
100
174 | Statistical Yearbook of Abu Dhabi 2017
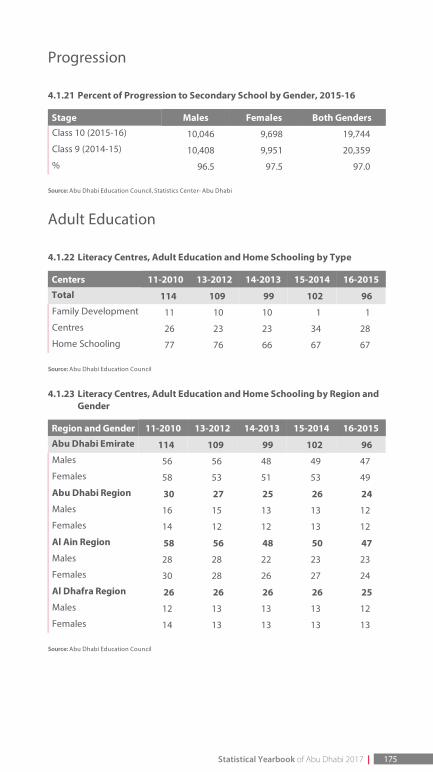
Progression
4.1.21 Percent of Progression to Secondary School by Gender, 2015-16
Stage Males Females Both GendersClass 10 (2015-16) 10,046 9,698 19,744
Class 9 (2014-15) 10,408 9,951 20,359
% 96.5 97.5 97.0
Source: Abu Dhabi Education Council, Statistics Center- Abu Dhabi
Adult Education
4.1.22 Literacy Centres, Adult Education and Home Schooling by Type
Centers 11-2010 13-2012 14-2013 15-2014 16-2015
Total 114 109 99 102 96 Family Development 11 10 10 1 1
Centres 26 23 23 34 28
Home Schooling 77 76 66 67 67
Source: Abu Dhabi Education Council
4.1.23 Literacy Centres, Adult Education and Home Schooling by Region andGender
Region and Gender 11-2010 13-2012 14-2013 15-2014 16-2015
Abu Dhabi Emirate 114 109 99 102 96 Males 56 56 48 49 47
Females 58 53 51 53 49
Abu Dhabi Region 30 27 25 26 24 Males 16 15 13 13 12
Females 14 12 12 13 12
Al Ain Region 58 56 48 50 47 Males 28 28 22 23 23
Females 30 28 26 27 24
Al Dhafra Region 26 26 26 26 25 Males 12 13 13 13 12
Females 14 13 13 13 13
Source: Abu Dhabi Education Council
Statistical Yearbook of Abu Dhabi 2017 | 175
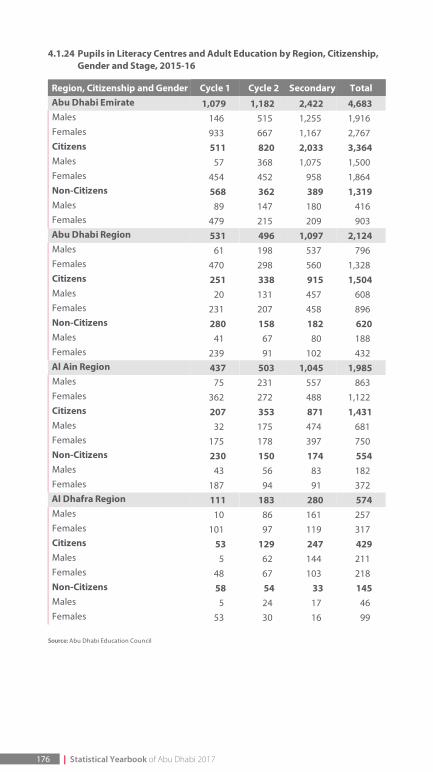
4.1.24 Pupils in Literacy Centres and Adult Education by Region, Citizenship,Gender and Stage, 2015-16
Region, Citizenship and Gender Cycle 1 Cycle 2 Secondary TotalAbu Dhabi Emirate 1,079 1,182 2,422 4,683 Males 146 515 1,255 1,916 Females 933 667 1,167 2,767 Citizens 511 820 2,033 3,364 Males 57 368 1,075 1,500 Females 454 452 958 1,864 Non-Citizens 568 362 389 1,319 Males 89 147 180 416 Females 479 215 209 903 Abu Dhabi Region 531 496 1,097 2,124 Males 61 198 537 796 Females 470 298 560 1,328 Citizens 251 338 915 1,504 Males 20 131 457 608 Females 231 207 458 896 Non-Citizens 280 158 182 620 Males 41 67 80 188 Females 239 91 102 432 Al Ain Region 437 503 1,045 1,985 Males 75 231 557 863 Females 362 272 488 1,122 Citizens 207 353 871 1,431 Males 32 175 474 681 Females 175 178 397 750 Non-Citizens 230 150 174 554 Males 43 56 83 182 Females 187 94 91 372 Al Dhafra Region 111 183 280 574 Males 10 86 161 257 Females 101 97 119 317 Citizens 53 129 247 429 Males 5 62 144 211 Females 48 67 103 218 Non-Citizens 58 54 33 145 Males 5 24 17 46 Females 53 30 16 99
Source: Abu Dhabi Education Council
176 | Statistical Yearbook of Abu Dhabi 2017
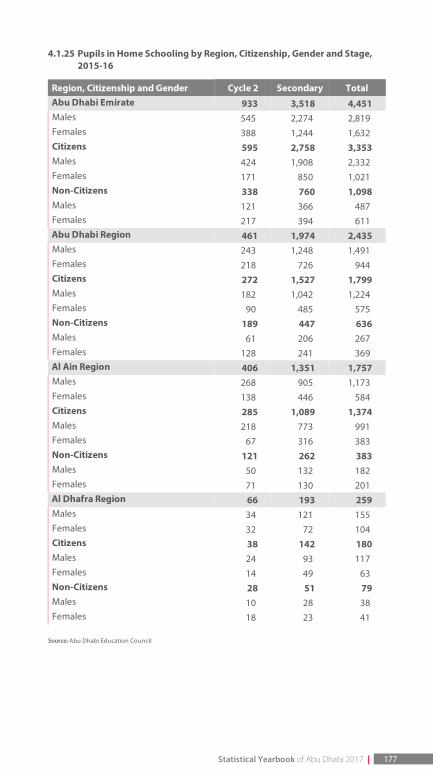
4.1.25 Pupils in Home Schooling by Region, Citizenship, Gender and Stage,2015-16
Region, Citizenship and Gender Cycle 2 Secondary TotalAbu Dhabi Emirate 933 3,518 4,451 Males 545 2,274 2,819 Females 388 1,244 1,632 Citizens 595 2,758 3,353 Males 424 1,908 2,332 Females 171 850 1,021 Non-Citizens 338 760 1,098 Males 121 366 487 Females 217 394 611 Abu Dhabi Region 461 1,974 2,435 Males 243 1,248 1,491 Females 218 726 944 Citizens 272 1,527 1,799 Males 182 1,042 1,224 Females 90 485 575 Non-Citizens 189 447 636 Males 61 206 267 Females 128 241 369 Al Ain Region 406 1,351 1,757 Males 268 905 1,173 Females 138 446 584 Citizens 285 1,089 1,374 Males 218 773 991 Females 67 316 383 Non-Citizens 121 262 383 Males 50 132 182 Females 71 130 201 Al Dhafra Region 66 193 259 Males 34 121 155 Females 32 72 104 Citizens 38 142 180 Males 24 93 117 Females 14 49 63 Non-Citizens 28 51 79 Males 10 28 38 Females 18 23 41
Source: Abu Dhabi Education Council
Statistical Yearbook of Abu Dhabi 2017 | 177
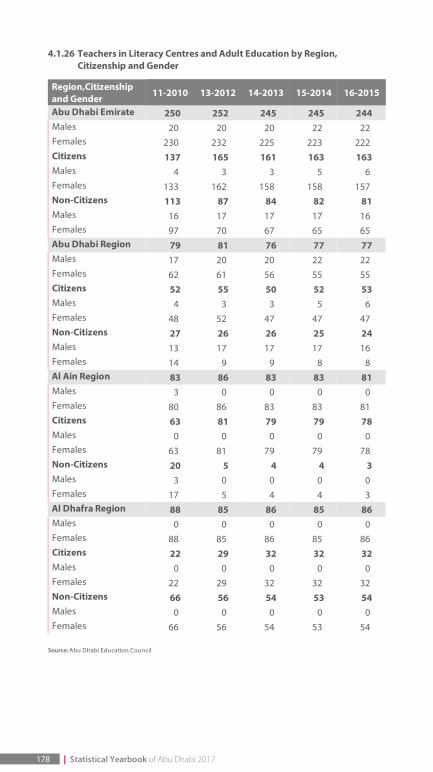
4.1.26 Teachers in Literacy Centres and Adult Education by Region,Citizenship and Gender
Region,Citizenshipand Gender 11-2010 13-2012 14-2013 15-2014 16-2015
Abu Dhabi Emirate 250 252 245 245 244 Males 20 20 20 22 22 Females 230 232 225 223 222 Citizens 137 165 161 163 163 Males 4 3 3 5 6 Females 133 162 158 158 157 Non-Citizens 113 87 84 82 81 Males 16 17 17 17 16 Females 97 70 67 65 65 Abu Dhabi Region 79 81 76 77 77 Males 17 20 20 22 22 Females 62 61 56 55 55 Citizens 52 55 50 52 53 Males 4 3 3 5 6 Females 48 52 47 47 47 Non-Citizens 27 26 26 25 24 Males 13 17 17 17 16 Females 14 9 9 8 8 Al Ain Region 83 86 83 83 81 Males 3 0 0 0 0 Females 80 86 83 83 81 Citizens 63 81 79 79 78 Males 0 0 0 0 0 Females 63 81 79 79 78 Non-Citizens 20 5 4 4 3 Males 3 0 0 0 0 Females 17 5 4 4 3 Al Dhafra Region 88 85 86 85 86 Males 0 0 0 0 0 Females 88 85 86 85 86 Citizens 22 29 32 32 32 Males 0 0 0 0 0 Females 22 29 32 32 32 Non-Citizens 66 56 54 53 54 Males 0 0 0 0 0 Females 66 56 54 53 54
Source: Abu Dhabi Education Council
178 | Statistical Yearbook of Abu Dhabi 2017
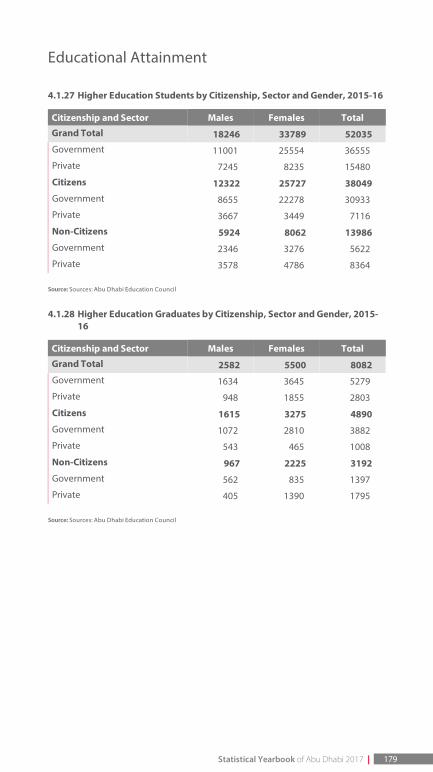
Educational Attainment
4.1.27 Higher Education Students by Citizenship, Sector and Gender, 2015-16
Citizenship and Sector Males Females Total
Grand Total 18246 33789 52035 Government 11001 25554 36555
Private 7245 8235 15480
Citizens 12322 25727 38049 Government 8655 22278 30933
Private 3667 3449 7116
Non-Citizens 5924 8062 13986 Government 2346 3276 5622
Private 3578 4786 8364
Source: Sources: Abu Dhabi Education Council
4.1.28 Higher Education Graduates by Citizenship, Sector and Gender, 2015-16
Citizenship and Sector Males Females Total
Grand Total 2582 5500 8082 Government 1634 3645 5279
Private 948 1855 2803
Citizens 1615 3275 4890 Government 1072 2810 3882
Private 543 465 1008
Non-Citizens 967 2225 3192 Government 562 835 1397
Private 405 1390 1795
Source: Sources: Abu Dhabi Education Council
Statistical Yearbook of Abu Dhabi 2017 | 179
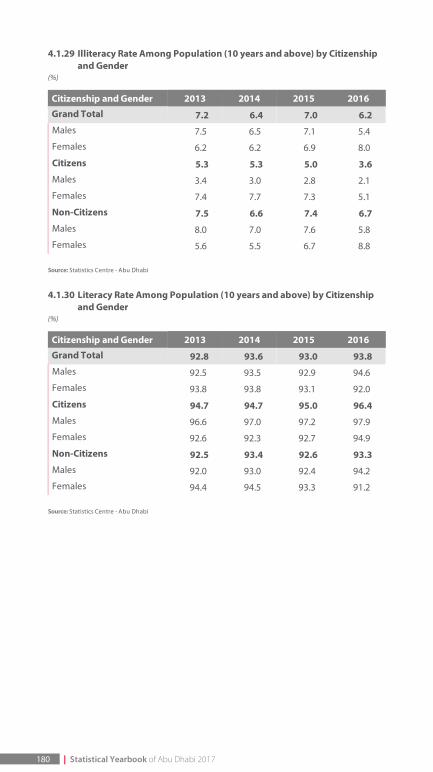
4.1.29 Illiteracy Rate Among Population (10 years and above) by Citizenshipand Gender
(%)
Citizenship and Gender 2013 2014 2015 2016
Grand Total 7.2 6.4 7.0 6.2 Males 7.5 6.5 7.1 5.4
Females 6.2 6.2 6.9 8.0
Citizens 5.3 5.3 5.0 3.6 Males 3.4 3.0 2.8 2.1
Females 7.4 7.7 7.3 5.1
Non-Citizens 7.5 6.6 7.4 6.7 Males 8.0 7.0 7.6 5.8
Females 5.6 5.5 6.7 8.8
Source: Statistics Centre - Abu Dhabi
4.1.30 Literacy Rate Among Population (10 years and above) by Citizenshipand Gender
(%)
Citizenship and Gender 2013 2014 2015 2016
Grand Total 92.8 93.6 93.0 93.8 Males 92.5 93.5 92.9 94.6
Females 93.8 93.8 93.1 92.0
Citizens 94.7 94.7 95.0 96.4 Males 96.6 97.0 97.2 97.9
Females 92.6 92.3 92.7 94.9
Non-Citizens 92.5 93.4 92.6 93.3 Males 92.0 93.0 92.4 94.2
Females 94.4 94.5 93.3 91.2
Source: Statistics Centre - Abu Dhabi
180 | Statistical Yearbook of Abu Dhabi 2017
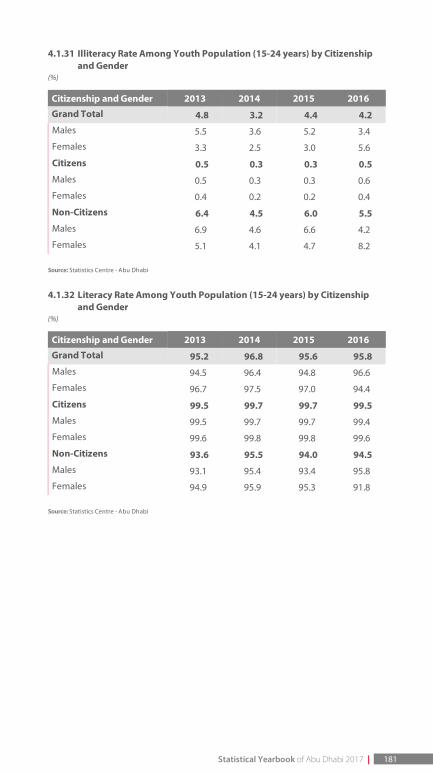
4.1.31 Illiteracy Rate Among Youth Population (15-24 years) by Citizenshipand Gender
(%)
Citizenship and Gender 2013 2014 2015 2016
Grand Total 4.8 3.2 4.4 4.2 Males 5.5 3.6 5.2 3.4
Females 3.3 2.5 3.0 5.6
Citizens 0.5 0.3 0.3 0.5 Males 0.5 0.3 0.3 0.6
Females 0.4 0.2 0.2 0.4
Non-Citizens 6.4 4.5 6.0 5.5 Males 6.9 4.6 6.6 4.2
Females 5.1 4.1 4.7 8.2
Source: Statistics Centre - Abu Dhabi
4.1.32 Literacy Rate Among Youth Population (15-24 years) by Citizenshipand Gender
(%)
Citizenship and Gender 2013 2014 2015 2016
Grand Total 95.2 96.8 95.6 95.8 Males 94.5 96.4 94.8 96.6
Females 96.7 97.5 97.0 94.4
Citizens 99.5 99.7 99.7 99.5 Males 99.5 99.7 99.7 99.4
Females 99.6 99.8 99.8 99.6
Non-Citizens 93.6 95.5 94.0 94.5 Males 93.1 95.4 93.4 95.8
Females 94.9 95.9 95.3 91.8
Source: Statistics Centre - Abu Dhabi
Statistical Yearbook of Abu Dhabi 2017 | 181
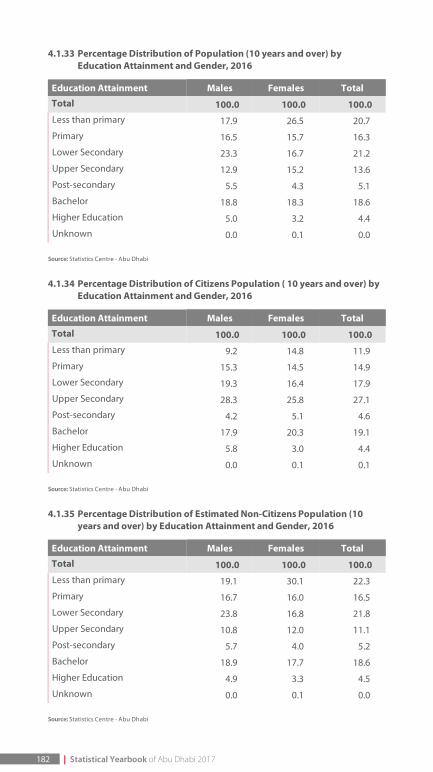
4.1.33 Percentage Distribution of Population (10 years and over) byEducation Attainment and Gender, 2016
Education Attainment Males Females Total
Total 100.0 100.0 100.0 Less than primary 17.9 26.5 20.7
Primary 16.5 15.7 16.3
Lower Secondary 23.3 16.7 21.2
Upper Secondary 12.9 15.2 13.6
Post-secondary 5.5 4.3 5.1
Bachelor 18.8 18.3 18.6
Higher Education 5.0 3.2 4.4
Unknown 0.0 0.1 0.0
Source: Statistics Centre - Abu Dhabi
4.1.34 Percentage Distribution of Citizens Population ( 10 years and over) byEducation Attainment and Gender, 2016
Education Attainment Males Females Total
Total 100.0 100.0 100.0 Less than primary 9.2 14.8 11.9
Primary 15.3 14.5 14.9
Lower Secondary 19.3 16.4 17.9
Upper Secondary 28.3 25.8 27.1
Post-secondary 4.2 5.1 4.6
Bachelor 17.9 20.3 19.1
Higher Education 5.8 3.0 4.4
Unknown 0.0 0.1 0.1
Source: Statistics Centre - Abu Dhabi
4.1.35 Percentage Distribution of Estimated Non-Citizens Population (10years and over) by Education Attainment and Gender, 2016
Education Attainment Males Females Total
Total 100.0 100.0 100.0 Less than primary 19.1 30.1 22.3
Primary 16.7 16.0 16.5
Lower Secondary 23.8 16.8 21.8
Upper Secondary 10.8 12.0 11.1
Post-secondary 5.7 4.0 5.2
Bachelor 18.9 17.7 18.6
Higher Education 4.9 3.3 4.5
Unknown 0.0 0.1 0.0
Source: Statistics Centre - Abu Dhabi
182 | Statistical Yearbook of Abu Dhabi 2017
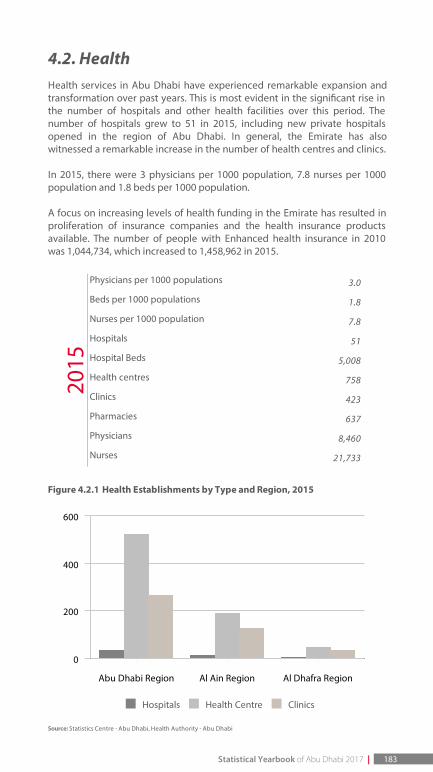
4.2. HealthHealth services in Abu Dhabi have experienced remarkable expansion andtransformation over past years. This is most evident in the signi cant rise inthe number of hospitals and other health facilities over this period. Thenumber of hospitals grew to 51 in 2015, including new private hospitalsopened in the region of Abu Dhabi. In general, the Emirate has alsowitnessed a remarkable increase in the number of health centres and clinics.
In 2015, there were 3 physicians per 1000 population, 7.8 nurses per 1000population and 1.8 beds per 1000 population.
A focus on increasing levels of health funding in the Emirate has resulted inproliferation of insurance companies and the health insurance productsavailable. The number of people with Enhanced health insurance in 2010was 1,044,734, which increased to 1,458,962 in 2015.
Physicians per 1000 populations 3.0
Beds per 1000 populations 1.8
Nurses per 1000 population 7.8
Hospitals 51
Hospital Beds 5,008
Health centres 758
Clinics 423
Pharmacies 637
Physicians 8,460
Nurses 21,733
Figure 4.2.1 Health Establishments by Type and Region, 2015
. Hospitals . Health Centre . Clinics
Source: Statistics Centre - Abu Dhabi, Health Authority - Abu Dhabi
2015
Abu Dhabi Region Al Ain Region Al Dhafra Region
0
200
400
600
Statistical Yearbook of Abu Dhabi 2017 | 183
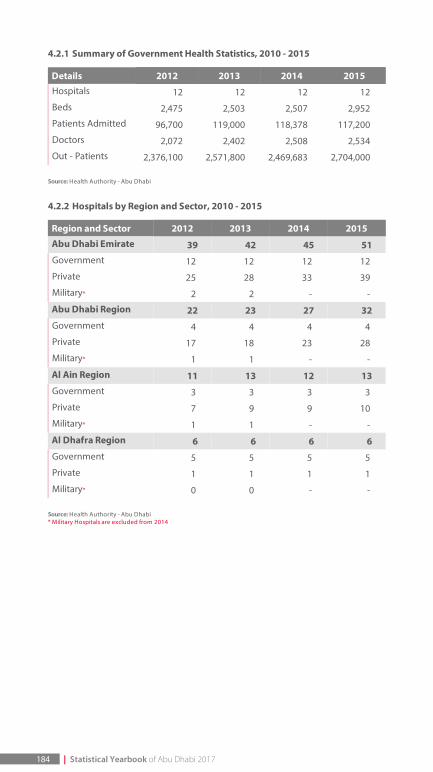
4.2.1 Summary of Government Health Statistics, 2010 - 2015
Details 2012 2013 2014 2015Hospitals 12 12 12 12
Beds 2,475 2,503 2,507 2,952
Patients Admitted 96,700 119,000 118,378 117,200
Doctors 2,072 2,402 2,508 2,534
Out - Patients 2,376,100 2,571,800 2,469,683 2,704,000
Source: Health Authority - Abu Dhabi
4.2.2 Hospitals by Region and Sector, 2010 - 2015
Region and Sector 2012 2013 2014 2015
Abu Dhabi Emirate 39 42 45 51 Government 12 12 12 12
Private 25 28 33 39
Military* 2 2 - -
Abu Dhabi Region 22 23 27 32 Government 4 4 4 4
Private 17 18 23 28
Military* 1 1 - -
Al Ain Region 11 13 12 13 Government 3 3 3 3
Private 7 9 9 10
Military* 1 1 - -
Al Dhafra Region 6 6 6 6 Government 5 5 5 5
Private 1 1 1 1
Military* 0 0 - -
Source: Health Authority - Abu Dhabi* Military Hospitals are excluded from 2014
184 | Statistical Yearbook of Abu Dhabi 2017
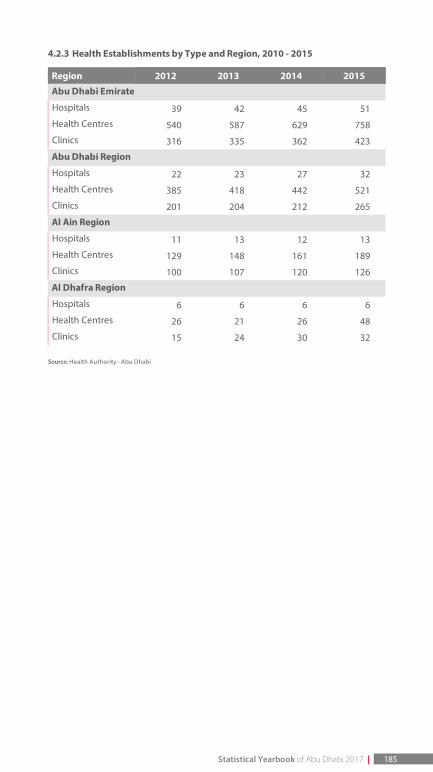
4.2.3 Health Establishments by Type and Region, 2010 - 2015
Region 2012 2013 2014 2015
Abu Dhabi Emirate
Hospitals 39 42 45 51
Health Centres 540 587 629 758
Clinics 316 335 362 423
Abu Dhabi Region
Hospitals 22 23 27 32
Health Centres 385 418 442 521
Clinics 201 204 212 265
Al Ain Region
Hospitals 11 13 12 13
Health Centres 129 148 161 189
Clinics 100 107 120 126
Al Dhafra Region
Hospitals 6 6 6 6
Health Centres 26 21 26 48
Clinics 15 24 30 32
Source: Health Authority - Abu Dhabi
Statistical Yearbook of Abu Dhabi 2017 | 185
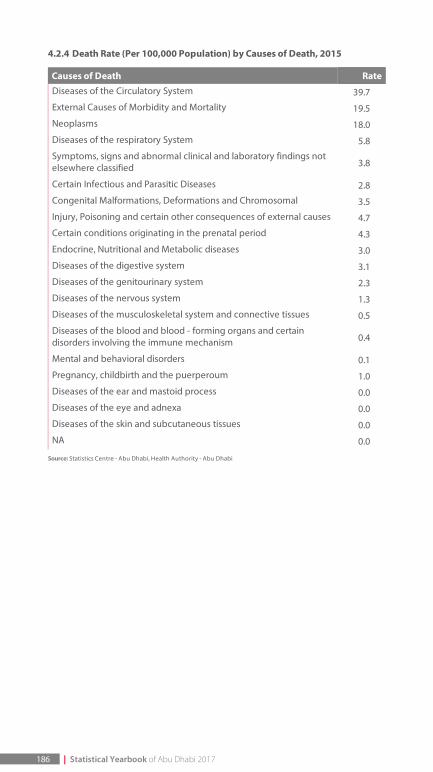
4.2.4 Death Rate (Per 100,000 Population) by Causes of Death, 2015
Causes of Death RateDiseases of the Circulatory System 39.7
External Causes of Morbidity and Mortality 19.5
Neoplasms 18.0
Diseases of the respiratory System 5.8
Symptoms, signs and abnormal clinical and laboratory findings notelsewhere classified 3.8
Certain Infectious and Parasitic Diseases 2.8
Congenital Malformations, Deformations and Chromosomal 3.5
Injury, Poisoning and certain other consequences of external causes 4.7
Certain conditions originating in the prenatal period 4.3
Endocrine, Nutritional and Metabolic diseases 3.0
Diseases of the digestive system 3.1
Diseases of the genitourinary system 2.3
Diseases of the nervous system 1.3
Diseases of the musculoskeletal system and connective tissues 0.5
Diseases of the blood and blood - forming organs and certaindisorders involving the immune mechanism 0.4
Mental and behavioral disorders 0.1
Pregnancy, childbirth and the puerperoum 1.0
Diseases of the ear and mastoid process 0.0
Diseases of the eye and adnexa 0.0
Diseases of the skin and subcutaneous tissues 0.0
NA 0.0
Source: Statistics Centre - Abu Dhabi, Health Authority - Abu Dhabi
186 | Statistical Yearbook of Abu Dhabi 2017
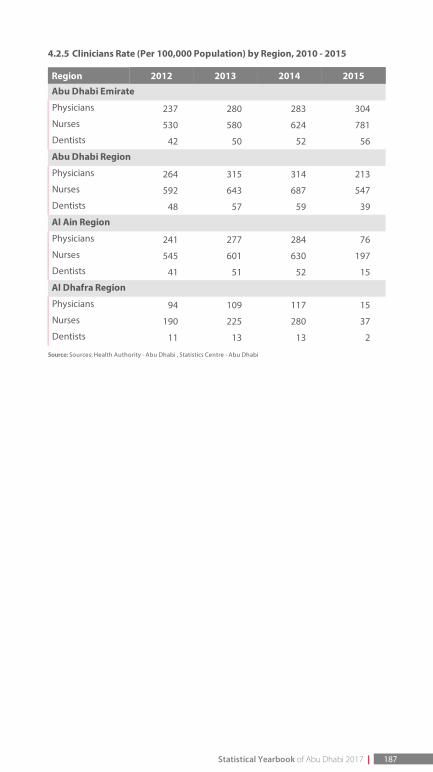
4.2.5 Clinicians Rate (Per 100,000 Population) by Region, 2010 - 2015
Region 2012 2013 2014 2015
Abu Dhabi Emirate
Physicians 237 280 283 304
Nurses 530 580 624 781
Dentists 42 50 52 56
Abu Dhabi Region
Physicians 264 315 314 213
Nurses 592 643 687 547
Dentists 48 57 59 39
Al Ain Region
Physicians 241 277 284 76
Nurses 545 601 630 197
Dentists 41 51 52 15
Al Dhafra Region
Physicians 94 109 117 15
Nurses 190 225 280 37
Dentists 11 13 13 2
Source: Sources: Health Authority - Abu Dhabi , Statistics Centre - Abu Dhabi
Statistical Yearbook of Abu Dhabi 2017 | 187
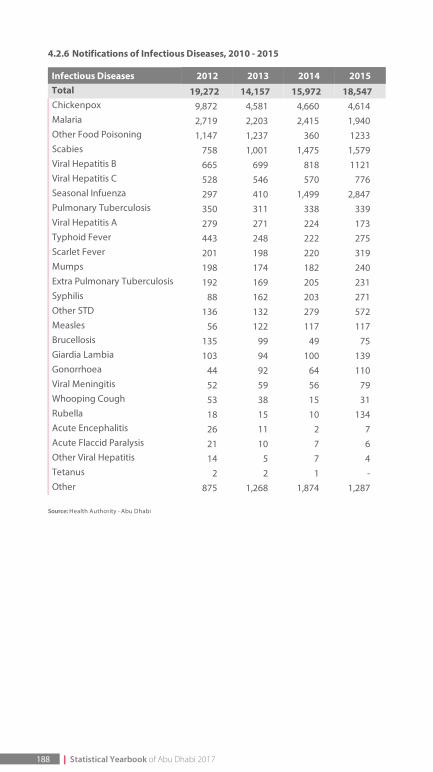
4.2.6 Notifications of Infectious Diseases, 2010 - 2015
Infectious Diseases 2012 2013 2014 2015Total 19,272 14,157 15,972 18,547 Chickenpox 9,872 4,581 4,660 4,614 Malaria 2,719 2,203 2,415 1,940 Other Food Poisoning 1,147 1,237 360 1233 Scabies 758 1,001 1,475 1,579 Viral Hepatitis B 665 699 818 1121 Viral Hepatitis C 528 546 570 776 Seasonal Infuenza 297 410 1,499 2,847 Pulmonary Tuberculosis 350 311 338 339 Viral Hepatitis A 279 271 224 173 Typhoid Fever 443 248 222 275 Scarlet Fever 201 198 220 319 Mumps 198 174 182 240 Extra Pulmonary Tuberculosis 192 169 205 231 Syphilis 88 162 203 271 Other STD 136 132 279 572 Measles 56 122 117 117 Brucellosis 135 99 49 75 Giardia Lambia 103 94 100 139 Gonorrhoea 44 92 64 110 Viral Meningitis 52 59 56 79 Whooping Cough 53 38 15 31 Rubella 18 15 10 134 Acute Encephalitis 26 11 2 7 Acute Flaccid Paralysis 21 10 7 6 Other Viral Hepatitis 14 5 7 4 Tetanus 2 2 1 - Other 875 1,268 1,874 1,287
Source: Health Authority - Abu Dhabi
188 | Statistical Yearbook of Abu Dhabi 2017
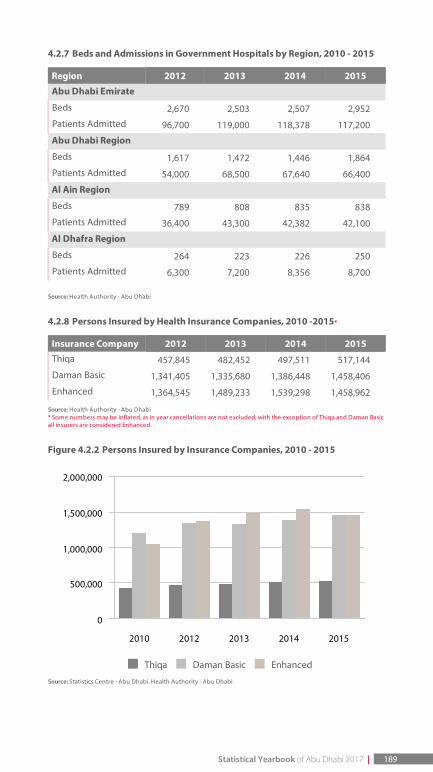
4.2.7 Beds and Admissions in Government Hospitals by Region, 2010 - 2015
Region 2012 2013 2014 2015
Abu Dhabi Emirate
Beds 2,670 2,503 2,507 2,952
Patients Admitted 96,700 119,000 118,378 117,200
Abu Dhabi Region
Beds 1,617 1,472 1,446 1,864
Patients Admitted 54,000 68,500 67,640 66,400
Al Ain Region
Beds 789 808 835 838
Patients Admitted 36,400 43,300 42,382 42,100
Al Dhafra Region
Beds 264 223 226 250
Patients Admitted 6,300 7,200 8,356 8,700
Source: Health Authority - Abu Dhabi
4.2.8 Persons Insured by Health Insurance Companies, 2010 -2015*
Insurance Company 2012 2013 2014 2015Thiqa 457,845 482,452 497,511 517,144
Daman Basic 1,341,405 1,335,680 1,386,448 1,458,406
Enhanced 1,364,545 1,489,233 1,539,298 1,458,962
Source: Health Authority - Abu Dhabi* Some numbers may be inflated, as in year cancellations are not excluded, with the exception of Thiqa and Daman Basicall insurers are considered Enhanced.
Figure 4.2.2 Persons Insured by Insurance Companies, 2010 - 2015
. Thiqa . Daman Basic . Enhanced
Source: Statistics Centre - Abu Dhabi, Health Authority - Abu Dhabi
2010 2012 2013 2014 2015
0
500,000
1,000,000
1,500,000
2,000,000
Statistical Yearbook of Abu Dhabi 2017 | 189
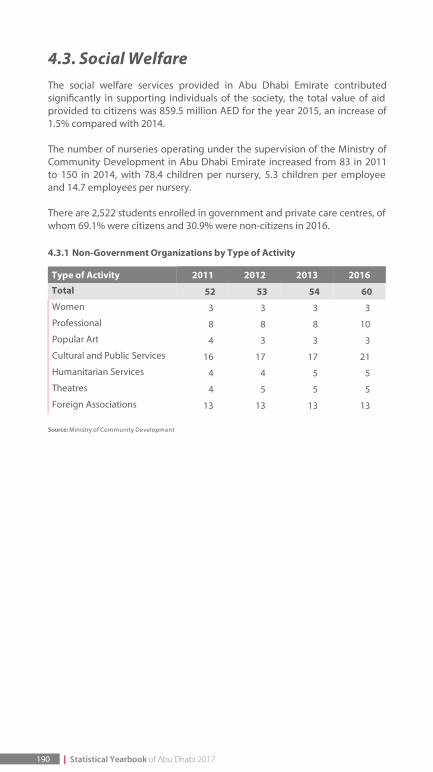
4.3. Social WelfareThe social welfare services provided in Abu Dhabi Emirate contributedsigni cantly in supporting individuals of the society, the total value of aidprovided to citizens was 859.5 million AED for the year 2015, an increase of1.5% compared with 2014.
The number of nurseries operating under the supervision of the Ministry ofCommunity Development in Abu Dhabi Emirate increased from 83 in 2011to 150 in 2014, with 78.4 children per nursery, 5.3 children per employeeand 14.7 employees per nursery.
There are 2,522 students enrolled in government and private care centres, ofwhom 69.1% were citizens and 30.9% were non-citizens in 2016.
4.3.1 Non-Government Organizations by Type of Activity
Type of Activity 2011 2012 2013 2016
Total 52 53 54 60 Women 3 3 3 3
Professional 8 8 8 10
Popular Art 4 3 3 3
Cultural and Public Services 16 17 17 21
Humanitarian Services 4 4 5 5
Theatres 4 5 5 5
Foreign Associations 13 13 13 13
Source: Ministry of Community Development
190 | Statistical Yearbook of Abu Dhabi 2017
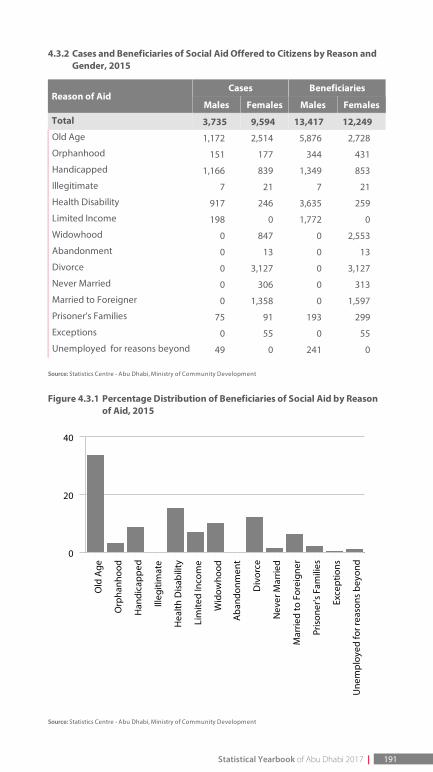
4.3.2 Cases and Beneficiaries of Social Aid Offered to Citizens by Reason andGender, 2015
Reason of AidCases Beneficiaries
Males Females Males Females
Total 3,735 9,594 13,417 12,249 Old Age 1,172 2,514 5,876 2,728
Orphanhood 151 177 344 431
Handicapped 1,166 839 1,349 853
Illegitimate 7 21 7 21
Health Disability 917 246 3,635 259
Limited Income 198 0 1,772 0
Widowhood 0 847 0 2,553
Abandonment 0 13 0 13
Divorce 0 3,127 0 3,127
Never Married 0 306 0 313
Married to Foreigner 0 1,358 0 1,597
Prisoner's Families 75 91 193 299
Exceptions 0 55 0 55
Unemployed for reasons beyond 49 0 241 0
Source: Statistics Centre - Abu Dhabi, Ministry of Community Development
Figure 4.3.1 Percentage Distribution of Beneficiaries of Social Aid by Reasonof Aid, 2015
Source: Statistics Centre - Abu Dhabi, Ministry of Community Development
Old
Age
Orp
hanh
ood
Han
dica
pped
Illeg
itim
ate
Hea
lth D
isab
ility
Lim
ited
Inco
me
Wid
owho
od
Aba
ndon
men
t
Div
orce
Nev
er M
arrie
d
Mar
ried
to F
orei
gner
Pris
oner
's Fa
mili
es
Exce
ptio
ns
Une
mpl
oyed
for r
easo
ns b
eyon
d
0
20
40
Statistical Yearbook of Abu Dhabi 2017 | 191
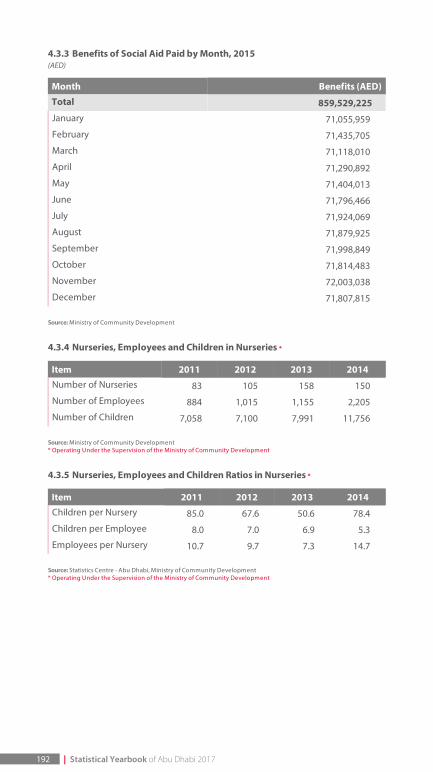
4.3.3 Benefits of Social Aid Paid by Month, 2015(AED)
Month Benefits (AED)
Total 859,529,225 January 71,055,959
February 71,435,705
March 71,118,010
April 71,290,892
May 71,404,013
June 71,796,466
July 71,924,069
August 71,879,925
September 71,998,849
October 71,814,483
November 72,003,038
December 71,807,815
Source: Ministry of Community Development
4.3.4 Nurseries, Employees and Children in Nurseries *
Item 2011 2012 2013 2014Number of Nurseries 83 105 158 150
Number of Employees 884 1,015 1,155 2,205
Number of Children 7,058 7,100 7,991 11,756
Source: Ministry of Community Development* Operating Under the Supervision of the Ministry of Community Development
4.3.5 Nurseries, Employees and Children Ratios in Nurseries *
Item 2011 2012 2013 2014Children per Nursery 85.0 67.6 50.6 78.4
Children per Employee 8.0 7.0 6.9 5.3
Employees per Nursery 10.7 9.7 7.3 14.7
Source: Statistics Centre - Abu Dhabi, Ministry of Community Development* Operating Under the Supervision of the Ministry of Community Development
192 | Statistical Yearbook of Abu Dhabi 2017

4.3.6 Children in Nurseries by Citizenship, Gender and Age*
Items 2010 2011 2012 2013
Citizenship 6,225 7,058 7,100 7,991 Citizens 1,755 2,390 2,578 3,008
Non-Citizens 4,470 4,668 4,522 4,983
Gender
Males 3,262 3,702 3,809 4,300
Females 2,963 3,356 3,291 3,691
Age
Infants 565 1,066 1,163 1,259
Non-Infants 5,660 5,992 5,937 6,732
Source: Ministry of Community Development* Operating Under the Supervision of the Ministry of Community Development
4.3.7 The determined ones in Government and Private Care Centres byCitizenship and Gender, 2016
Citizenship Males Females Total
Total 1,679 843 2,522 Citizens 1,113 629 1,742
Non-Citizens 566 214 780
Source: Ministry of Community Development
Statistical Yearbook of Abu Dhabi 2017 | 193
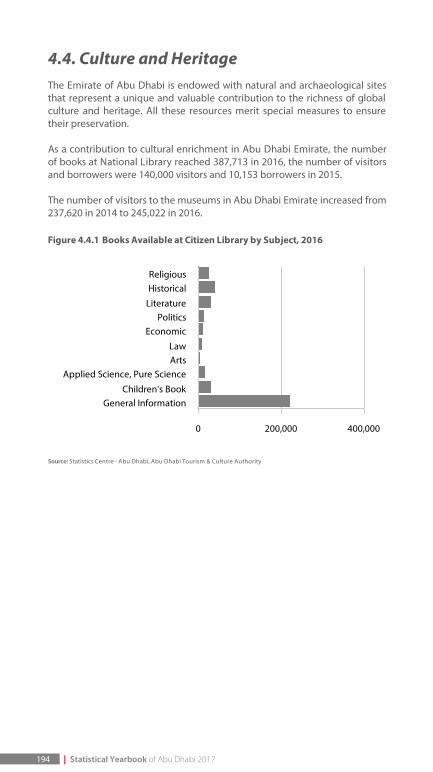
4.4. Culture and HeritageThe Emirate of Abu Dhabi is endowed with natural and archaeological sitesthat represent a unique and valuable contribution to the richness of globalculture and heritage. All these resources merit special measures to ensuretheir preservation.
As a contribution to cultural enrichment in Abu Dhabi Emirate, the numberof books at National Library reached 387,713 in 2016, the number of visitorsand borrowers were 140,000 visitors and 10,153 borrowers in 2015.
The number of visitors to the museums in Abu Dhabi Emirate increased from237,620 in 2014 to 245,022 in 2016.
Figure 4.4.1 Books Available at Citizen Library by Subject, 2016
Source: Statistics Centre - Abu Dhabi, Abu Dhabi Tourism & Culture Authority
ReligiousHistorical
LiteraturePolitics
Economic
LawArts
Applied Science, Pure Science
Children's BookGeneral Information
0 200,000 400,000
194 | Statistical Yearbook of Abu Dhabi 2017
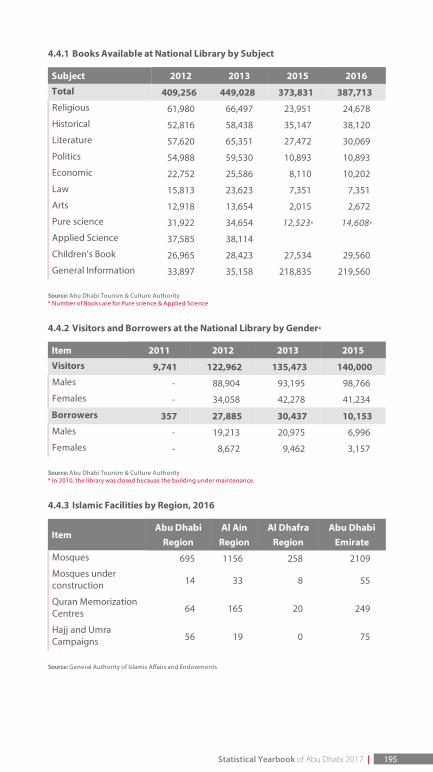
4.4.1 Books Available at National Library by Subject
Subject 2012 2013 2015 2016
Total 409,256 449,028 373,831 387,713 Religious 61,980 66,497 23,951 24,678
Historical 52,816 58,438 35,147 38,120
Literature 57,620 65,351 27,472 30,069
Politics 54,988 59,530 10,893 10,893
Economic 22,752 25,586 8,110 10,202
Law 15,813 23,623 7,351 7,351
Arts 12,918 13,654 2,015 2,672
Pure science 31,922 34,654 12,523* 14,608*
Applied Science 37,585 38,114
Children's Book 26,965 28,423 27,534 29,560
General Information 33,897 35,158 218,835 219,560
Source: Abu Dhabi Tourism & Culture Authority* Number of Books are for Pure science & Applied Science
4.4.2 Visitors and Borrowers at the National Library by Gender*
Item 2011 2012 2013 2015
Visitors 9,741 122,962 135,473 140,000 Males - 88,904 93,195 98,766
Females - 34,058 42,278 41,234
Borrowers 357 27,885 30,437 10,153 Males - 19,213 20,975 6,996
Females - 8,672 9,462 3,157
Source: Abu Dhabi Tourism & Culture Authority* In 2010, the library was closed because the building under maintenance.
4.4.3 Islamic Facilities by Region, 2016
ItemAbu Dhabi
RegionAl Ain
RegionAl Dhafra
RegionAbu Dhabi
EmirateMosques 695 1156 258 2109
Mosques underconstruction 14 33 8 55
Quran MemorizationCentres 64 165 20 249
Hajj and UmraCampaigns 56 19 0 75
Source: General Authority of Islamic Affairs and Endowments
Statistical Yearbook of Abu Dhabi 2017 | 195
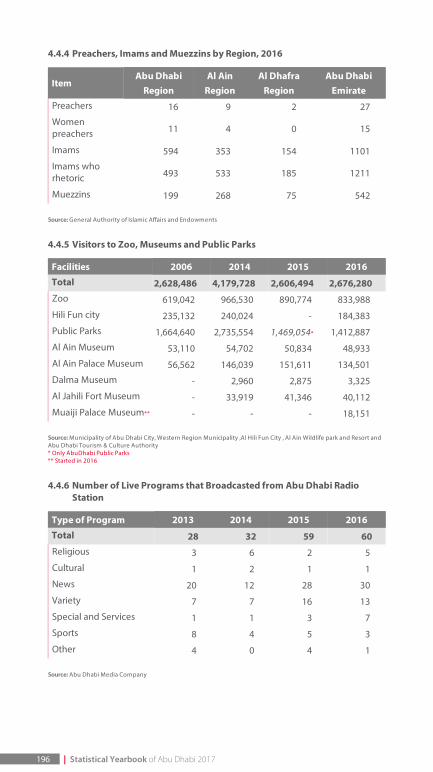
4.4.4 Preachers, Imams and Muezzins by Region, 2016
ItemAbu Dhabi
RegionAl Ain
RegionAl Dhafra
RegionAbu Dhabi
EmiratePreachers 16 9 2 27
Womenpreachers 11 4 0 15
Imams 594 353 154 1101
Imams whorhetoric 493 533 185 1211
Muezzins 199 268 75 542
Source: General Authority of Islamic Affairs and Endowments
4.4.5 Visitors to Zoo, Museums and Public Parks
Facilities 2006 2014 2015 2016
Total 2,628,486 4,179,728 2,606,494 2,676,280 Zoo 619,042 966,530 890,774 833,988
Hili Fun city 235,132 240,024 - 184,383
Public Parks 1,664,640 2,735,554 1,469,054* 1,412,887
Al Ain Museum 53,110 54,702 50,834 48,933
Al Ain Palace Museum 56,562 146,039 151,611 134,501
Dalma Museum - 2,960 2,875 3,325
Al Jahili Fort Museum - 33,919 41,346 40,112
Muaiji Palace Museum** - - - 18,151
Source: Municipality of Abu Dhabi City, Western Region Municipality ,Al Hili Fun City , Al Ain Wildlife park and Resort andAbu Dhabi Tourism & Culture Authority* Only AbuDhabi Public Parks** Started in 2016
4.4.6 Number of Live Programs that Broadcasted from Abu Dhabi RadioStation
Type of Program 2013 2014 2015 2016
Total 28 32 59 60 Religious 3 6 2 5
Cultural 1 2 1 1
News 20 12 28 30
Variety 7 7 16 13
Special and Services 1 1 3 7
Sports 8 4 5 3
Other 4 0 4 1
Source: Abu Dhabi Media Company
196 | Statistical Yearbook of Abu Dhabi 2017
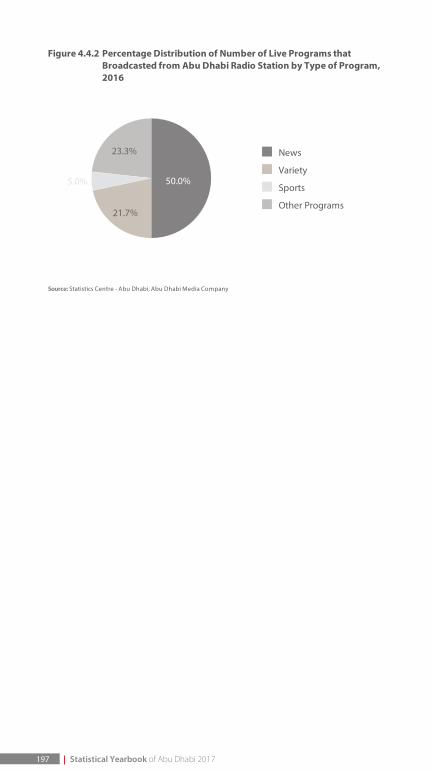
197
210 Statistical Yearbook of Abu Dhabi 2016
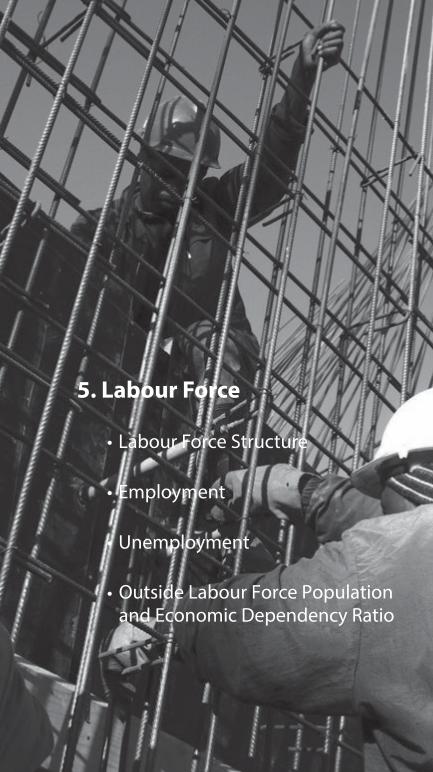
211 Statistical Yearbook of Abu Dhabi 2016
5 . Labour Force
• Labour Force Structure
• Employment
• Unemployment
• Outside Labour Force Population and Economic Dependency Ratio
5. Merchandise Foreign TradeAccording to estimates based on the labour force survey covering the fourthquarter of 2016, the labour force constitutes 68.1% as a percentage of thetotal population and 81.5% as a percentage of the population aged 15+.Females made up 23.5% of the total labour force. The economicdependency ratio was of 46.9%
Percentage of Employed to Total Population Aged 15Years and Above 78.0
Unemployment Rate 4.4
Crude Participation Rate 68.1
Refined Participation Rate 81.5
Females as a percentage of total labour force 23.5
Economic Dependency Ratio 46.9
2016
200 | Statistical Yearbook of Abu Dhabi 2017
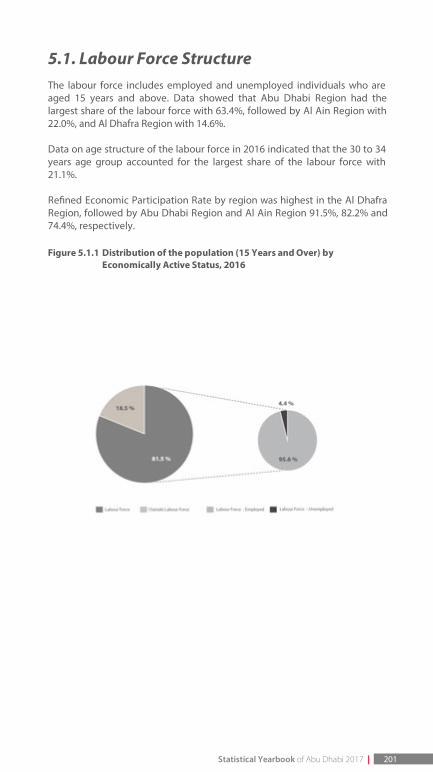
5.1. Labour Force StructureThe labour force includes employed and unemployed individuals who areaged 15 years and above. Data showed that Abu Dhabi Region had thelargest share of the labour force with 63.4%, followed by Al Ain Region with22.0%, and Al Dhafra Region with 14.6%.
Data on age structure of the labour force in 2016 indicated that the 30 to 34years age group accounted for the largest share of the labour force with21.1%.
Re ned Economic Participation Rate by region was highest in the Al DhafraRegion, followed by Abu Dhabi Region and Al Ain Region 91.5%, 82.2% and74.4%, respectively.
Figure 5.1.1 Distribution of the population (15 Years and Over) byEconomically Active Status, 2016
Statistical Yearbook of Abu Dhabi 2017 | 201
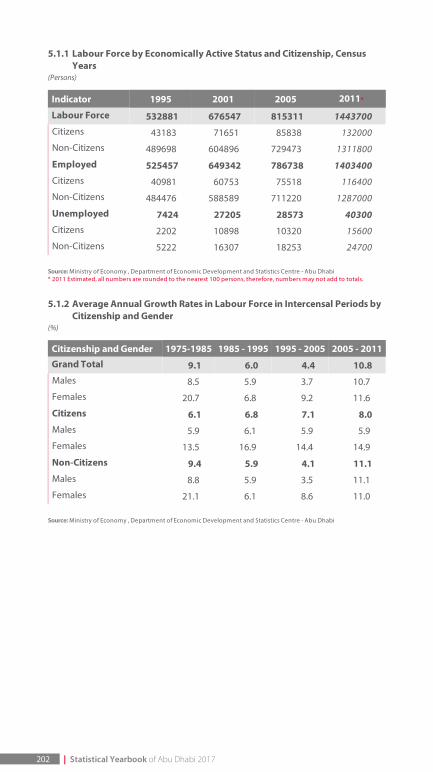
5.1.1 Labour Force by Economically Active Status and Citizenship, CensusYears
(Persons)
Indicator 1995 2001 2005 2011*
Labour Force 532881 676547 815311 1443700 Citizens 43183 71651 85838 132000
Non-Citizens 489698 604896 729473 1311800
Employed 525457 649342 786738 1403400 Citizens 40981 60753 75518 116400
Non-Citizens 484476 588589 711220 1287000
Unemployed 7424 27205 28573 40300 Citizens 2202 10898 10320 15600
Non-Citizens 5222 16307 18253 24700
Source: Ministry of Economy , Department of Economic Development and Statistics Centre - Abu Dhabi* 2011 Estimated, all numbers are rounded to the nearest 100 persons, therefore, numbers may not add to totals.
5.1.2 Average Annual Growth Rates in Labour Force in Intercensal Periods byCitizenship and Gender
(%)
Citizenship and Gender 1975-1985 1985 - 1995 1995 - 2005 2005 - 2011
Grand Total 9.1 6.0 4.4 10.8 Males 8.5 5.9 3.7 10.7
Females 20.7 6.8 9.2 11.6
Citizens 6.1 6.8 7.1 8.0 Males 5.9 6.1 5.9 5.9
Females 13.5 16.9 14.4 14.9
Non-Citizens 9.4 5.9 4.1 11.1 Males 8.8 5.9 3.5 11.1
Females 21.1 6.1 8.6 11.0
Source: Ministry of Economy , Department of Economic Development and Statistics Centre - Abu Dhabi
202 | Statistical Yearbook of Abu Dhabi 2017
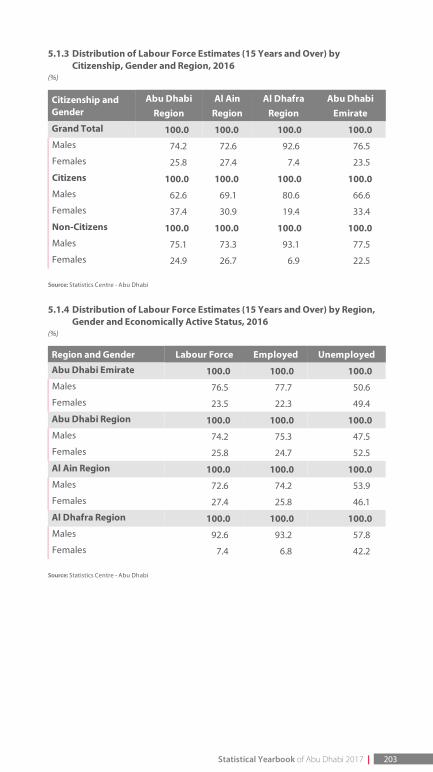
5.1.3 Distribution of Labour Force Estimates (15 Years and Over) byCitizenship, Gender and Region, 2016
(%)
Citizenship andGender
Abu DhabiRegion
Al AinRegion
Al DhafraRegion
Abu DhabiEmirate
Grand Total 100.0 100.0 100.0 100.0 Males 74.2 72.6 92.6 76.5
Females 25.8 27.4 7.4 23.5
Citizens 100.0 100.0 100.0 100.0 Males 62.6 69.1 80.6 66.6
Females 37.4 30.9 19.4 33.4
Non-Citizens 100.0 100.0 100.0 100.0 Males 75.1 73.3 93.1 77.5
Females 24.9 26.7 6.9 22.5
Source: Statistics Centre - Abu Dhabi
5.1.4 Distribution of Labour Force Estimates (15 Years and Over) by Region,Gender and Economically Active Status, 2016
(%)
Region and Gender Labour Force Employed Unemployed
Abu Dhabi Emirate 100.0 100.0 100.0 Males 76.5 77.7 50.6
Females 23.5 22.3 49.4
Abu Dhabi Region 100.0 100.0 100.0 Males 74.2 75.3 47.5
Females 25.8 24.7 52.5
Al Ain Region 100.0 100.0 100.0 Males 72.6 74.2 53.9
Females 27.4 25.8 46.1
Al Dhafra Region 100.0 100.0 100.0 Males 92.6 93.2 57.8
Females 7.4 6.8 42.2
Source: Statistics Centre - Abu Dhabi
Statistical Yearbook of Abu Dhabi 2017 | 203
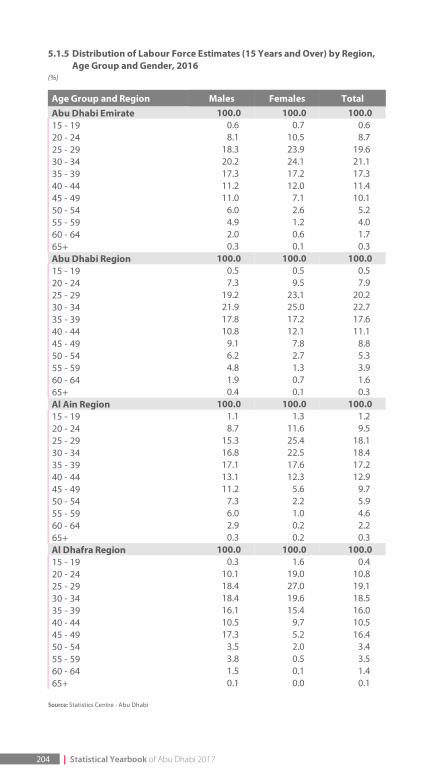
5.1.5 Distribution of Labour Force Estimates (15 Years and Over) by Region,Age Group and Gender, 2016
(%)
Age Group and Region Males Females TotalAbu Dhabi Emirate 100.0 100.0 100.0 15 - 19 0.6 0.7 0.6 20 - 24 8.1 10.5 8.7 25 - 29 18.3 23.9 19.6 30 - 34 20.2 24.1 21.1 35 - 39 17.3 17.2 17.3 40 - 44 11.2 12.0 11.4 45 - 49 11.0 7.1 10.1 50 - 54 6.0 2.6 5.2 55 - 59 4.9 1.2 4.0 60 - 64 2.0 0.6 1.7 65+ 0.3 0.1 0.3 Abu Dhabi Region 100.0 100.0 100.0 15 - 19 0.5 0.5 0.5 20 - 24 7.3 9.5 7.9 25 - 29 19.2 23.1 20.2 30 - 34 21.9 25.0 22.7 35 - 39 17.8 17.2 17.6 40 - 44 10.8 12.1 11.1 45 - 49 9.1 7.8 8.8 50 - 54 6.2 2.7 5.3 55 - 59 4.8 1.3 3.9 60 - 64 1.9 0.7 1.6 65+ 0.4 0.1 0.3 Al Ain Region 100.0 100.0 100.0 15 - 19 1.1 1.3 1.2 20 - 24 8.7 11.6 9.5 25 - 29 15.3 25.4 18.1 30 - 34 16.8 22.5 18.4 35 - 39 17.1 17.6 17.2 40 - 44 13.1 12.3 12.9 45 - 49 11.2 5.6 9.7 50 - 54 7.3 2.2 5.9 55 - 59 6.0 1.0 4.6 60 - 64 2.9 0.2 2.2 65+ 0.3 0.2 0.3 Al Dhafra Region 100.0 100.0 100.0 15 - 19 0.3 1.6 0.4 20 - 24 10.1 19.0 10.8 25 - 29 18.4 27.0 19.1 30 - 34 18.4 19.6 18.5 35 - 39 16.1 15.4 16.0 40 - 44 10.5 9.7 10.5 45 - 49 17.3 5.2 16.4 50 - 54 3.5 2.0 3.4 55 - 59 3.8 0.5 3.5 60 - 64 1.5 0.1 1.4 65+ 0.1 0.0 0.1
Source: Statistics Centre - Abu Dhabi
204 | Statistical Yearbook of Abu Dhabi 2017
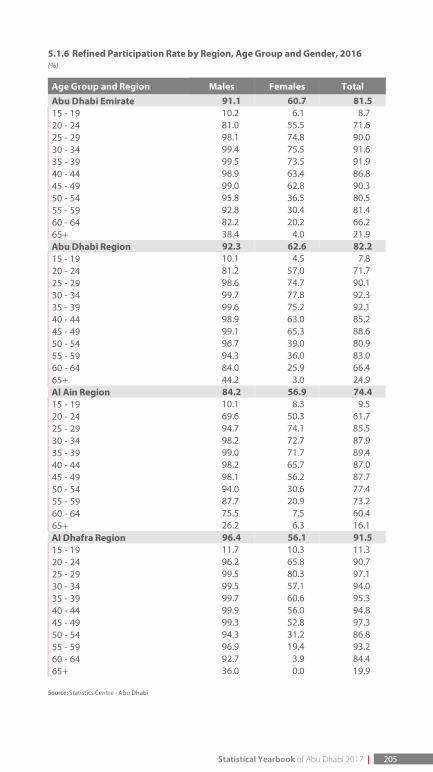
5.1.6 Refined Participation Rate by Region, Age Group and Gender, 2016(%)
Age Group and Region Males Females TotalAbu Dhabi Emirate 91.1 60.7 81.5 15 - 19 10.2 6.1 8.7 20 - 24 81.0 55.5 71.6 25 - 29 98.1 74.8 90.0 30 - 34 99.4 75.5 91.6 35 - 39 99.5 73.5 91.9 40 - 44 98.9 63.4 86.8 45 - 49 99.0 62.8 90.3 50 - 54 95.8 36.5 80.5 55 - 59 92.8 30.4 81.4 60 - 64 82.2 20.2 66.2 65+ 38.4 4.0 21.9 Abu Dhabi Region 92.3 62.6 82.2 15 - 19 10.1 4.5 7.8 20 - 24 81.2 57.0 71.7 25 - 29 98.6 74.7 90.1 30 - 34 99.7 77.8 92.3 35 - 39 99.6 75.2 92.1 40 - 44 98.9 63.0 85.2 45 - 49 99.1 65.3 88.6 50 - 54 96.7 39.0 80.9 55 - 59 94.3 36.0 83.0 60 - 64 84.0 25.9 66.4 65+ 44.2 3.0 24.9 Al Ain Region 84.2 56.9 74.4 15 - 19 10.1 8.3 9.5 20 - 24 69.6 50.3 61.7 25 - 29 94.7 74.1 85.5 30 - 34 98.2 72.7 87.9 35 - 39 99.0 71.7 89.4 40 - 44 98.2 65.7 87.0 45 - 49 98.1 56.2 87.7 50 - 54 94.0 30.6 77.4 55 - 59 87.7 20.9 73.2 60 - 64 75.5 7.5 60.4 65+ 26.2 6.3 16.1 Al Dhafra Region 96.4 56.1 91.5 15 - 19 11.7 10.3 11.3 20 - 24 96.2 65.8 90.7 25 - 29 99.5 80.3 97.1 30 - 34 99.5 57.1 94.0 35 - 39 99.7 60.6 95.3 40 - 44 99.9 56.0 94.8 45 - 49 99.3 52.8 97.3 50 - 54 94.3 31.2 86.8 55 - 59 96.9 19.4 93.2 60 - 64 92.7 3.9 84.4 65+ 36.0 0.0 19.9
Source: Statistics Centre - Abu Dhabi
Statistical Yearbook of Abu Dhabi 2017 | 205
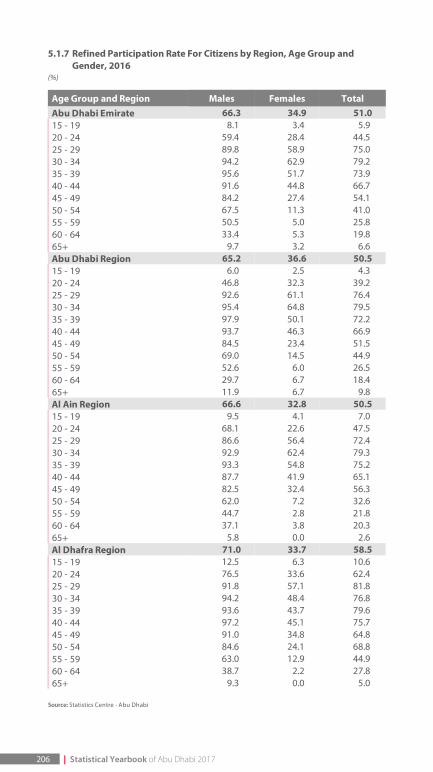
5.1.7 Refined Participation Rate For Citizens by Region, Age Group andGender, 2016
(%)
Age Group and Region Males Females TotalAbu Dhabi Emirate 66.3 34.9 51.0 15 - 19 8.1 3.4 5.9 20 - 24 59.4 28.4 44.5 25 - 29 89.8 58.9 75.0 30 - 34 94.2 62.9 79.2 35 - 39 95.6 51.7 73.9 40 - 44 91.6 44.8 66.7 45 - 49 84.2 27.4 54.1 50 - 54 67.5 11.3 41.0 55 - 59 50.5 5.0 25.8 60 - 64 33.4 5.3 19.8 65+ 9.7 3.2 6.6 Abu Dhabi Region 65.2 36.6 50.5 15 - 19 6.0 2.5 4.3 20 - 24 46.8 32.3 39.2 25 - 29 92.6 61.1 76.4 30 - 34 95.4 64.8 79.5 35 - 39 97.9 50.1 72.2 40 - 44 93.7 46.3 66.9 45 - 49 84.5 23.4 51.5 50 - 54 69.0 14.5 44.9 55 - 59 52.6 6.0 26.5 60 - 64 29.7 6.7 18.4 65+ 11.9 6.7 9.8 Al Ain Region 66.6 32.8 50.5 15 - 19 9.5 4.1 7.0 20 - 24 68.1 22.6 47.5 25 - 29 86.6 56.4 72.4 30 - 34 92.9 62.4 79.3 35 - 39 93.3 54.8 75.2 40 - 44 87.7 41.9 65.1 45 - 49 82.5 32.4 56.3 50 - 54 62.0 7.2 32.6 55 - 59 44.7 2.8 21.8 60 - 64 37.1 3.8 20.3 65+ 5.8 0.0 2.6 Al Dhafra Region 71.0 33.7 58.5 15 - 19 12.5 6.3 10.6 20 - 24 76.5 33.6 62.4 25 - 29 91.8 57.1 81.8 30 - 34 94.2 48.4 76.8 35 - 39 93.6 43.7 79.6 40 - 44 97.2 45.1 75.7 45 - 49 91.0 34.8 64.8 50 - 54 84.6 24.1 68.8 55 - 59 63.0 12.9 44.9 60 - 64 38.7 2.2 27.8 65+ 9.3 0.0 5.0
Source: Statistics Centre - Abu Dhabi
206 | Statistical Yearbook of Abu Dhabi 2017
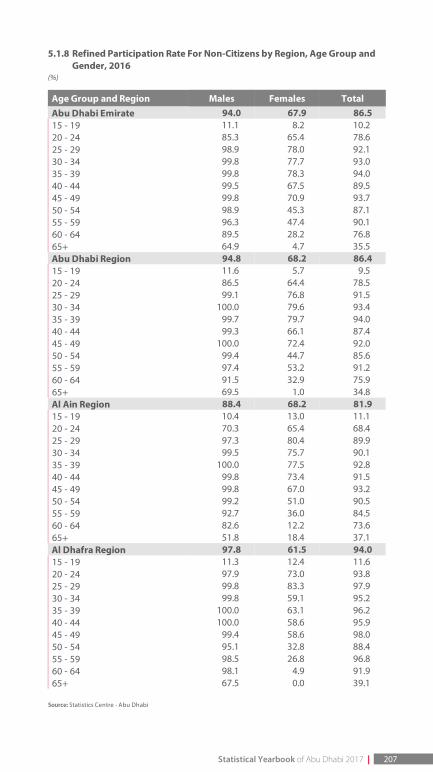
5.1.8 Refined Participation Rate For Non-Citizens by Region, Age Group andGender, 2016
(%)
Age Group and Region Males Females TotalAbu Dhabi Emirate 94.0 67.9 86.5 15 - 19 11.1 8.2 10.2 20 - 24 85.3 65.4 78.6 25 - 29 98.9 78.0 92.1 30 - 34 99.8 77.7 93.0 35 - 39 99.8 78.3 94.0 40 - 44 99.5 67.5 89.5 45 - 49 99.8 70.9 93.7 50 - 54 98.9 45.3 87.1 55 - 59 96.3 47.4 90.1 60 - 64 89.5 28.2 76.8 65+ 64.9 4.7 35.5 Abu Dhabi Region 94.8 68.2 86.4 15 - 19 11.6 5.7 9.5 20 - 24 86.5 64.4 78.5 25 - 29 99.1 76.8 91.5 30 - 34 100.0 79.6 93.4 35 - 39 99.7 79.7 94.0 40 - 44 99.3 66.1 87.4 45 - 49 100.0 72.4 92.0 50 - 54 99.4 44.7 85.6 55 - 59 97.4 53.2 91.2 60 - 64 91.5 32.9 75.9 65+ 69.5 1.0 34.8 Al Ain Region 88.4 68.2 81.9 15 - 19 10.4 13.0 11.1 20 - 24 70.3 65.4 68.4 25 - 29 97.3 80.4 89.9 30 - 34 99.5 75.7 90.1 35 - 39 100.0 77.5 92.8 40 - 44 99.8 73.4 91.5 45 - 49 99.8 67.0 93.2 50 - 54 99.2 51.0 90.5 55 - 59 92.7 36.0 84.5 60 - 64 82.6 12.2 73.6 65+ 51.8 18.4 37.1 Al Dhafra Region 97.8 61.5 94.0 15 - 19 11.3 12.4 11.6 20 - 24 97.9 73.0 93.8 25 - 29 99.8 83.3 97.9 30 - 34 99.8 59.1 95.2 35 - 39 100.0 63.1 96.2 40 - 44 100.0 58.6 95.9 45 - 49 99.4 58.6 98.0 50 - 54 95.1 32.8 88.4 55 - 59 98.5 26.8 96.8 60 - 64 98.1 4.9 91.9 65+ 67.5 0.0 39.1
Source: Statistics Centre - Abu Dhabi
Statistical Yearbook of Abu Dhabi 2017 | 207
5.2. EmploymentLabour force estimates indicate that the largest proportion (63.8%) of theemployed population was in Abu Dhabi Region.
The distribution by status in employment revealed that the majority ofemployed persons in the Emirate of Abu Dhabi were paid employees(97.9%), while 1.6% were own-account workers.
A distribution by educational attainment, indicates that the largestproportion (22.4%) of the employed population had less than primaryeducation, followed by lower secondary education (21.0%).
Among citizen's, a bachelor's degree was most common (35.7%). Aclassi cation by main occupation indicates that Elementary occupations hadthe largest percentage of the employed population with 26.3%, followed byProfessionals with 16.4%. Among employed citizens, Professionalsaccounted for the largest share, making up 37.1% of this segment, while thelargest share (28.6%) of employed non-citizens was in the Elementaryoccupations.
The largest proportion of the employed population was in the 'Activities ofhouseholds as employers undifferentiated goods and services activity' with27.6%, followed by Construction activity with 20.5%. 'Public administrationand defense'; Compulsory Social security activities accounted for the largestproportion (56.7%) of employed citizens, while 'Activities of households asemployers undifferentiated goods and services' activity accounted for thelargest proportion (30.0%) of employed non-citizens. As labour force dataindicates, the private sector engaged the largest proportion (50.5%) of theemployed population, while 12.2% worked for the government sector. As foremployed citizen, 74.8% worked in the government sector and 5.5% in theprivate sector.
Labour Force Survey data also showed that the majority of the employed inthe Emirate of Abu Dhabi are married (75.6%), while 22.8% of the employednever married. The survey data also showed that 50.4% of the totalemployed population in the Emirate of Abu Dhabi were working more than48 hours per week.
208 | Statistical Yearbook of Abu Dhabi 2017
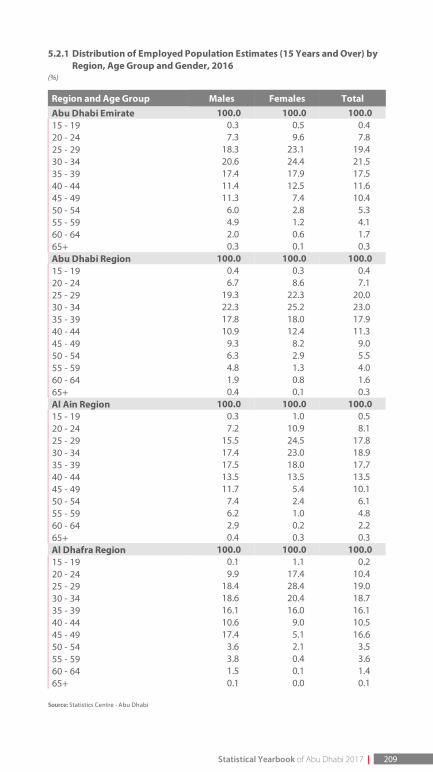
5.2.1 Distribution of Employed Population Estimates (15 Years and Over) byRegion, Age Group and Gender, 2016
(%)
Region and Age Group Males Females TotalAbu Dhabi Emirate 100.0 100.0 100.0 15 - 19 0.3 0.5 0.4 20 - 24 7.3 9.6 7.8 25 - 29 18.3 23.1 19.4 30 - 34 20.6 24.4 21.5 35 - 39 17.4 17.9 17.5 40 - 44 11.4 12.5 11.6 45 - 49 11.3 7.4 10.4 50 - 54 6.0 2.8 5.3 55 - 59 4.9 1.2 4.1 60 - 64 2.0 0.6 1.7 65+ 0.3 0.1 0.3 Abu Dhabi Region 100.0 100.0 100.0 15 - 19 0.4 0.3 0.4 20 - 24 6.7 8.6 7.1 25 - 29 19.3 22.3 20.0 30 - 34 22.3 25.2 23.0 35 - 39 17.8 18.0 17.9 40 - 44 10.9 12.4 11.3 45 - 49 9.3 8.2 9.0 50 - 54 6.3 2.9 5.5 55 - 59 4.8 1.3 4.0 60 - 64 1.9 0.8 1.6 65+ 0.4 0.1 0.3 Al Ain Region 100.0 100.0 100.0 15 - 19 0.3 1.0 0.5 20 - 24 7.2 10.9 8.1 25 - 29 15.5 24.5 17.8 30 - 34 17.4 23.0 18.9 35 - 39 17.5 18.0 17.7 40 - 44 13.5 13.5 13.5 45 - 49 11.7 5.4 10.1 50 - 54 7.4 2.4 6.1 55 - 59 6.2 1.0 4.8 60 - 64 2.9 0.2 2.2 65+ 0.4 0.3 0.3 Al Dhafra Region 100.0 100.0 100.0 15 - 19 0.1 1.1 0.2 20 - 24 9.9 17.4 10.4 25 - 29 18.4 28.4 19.0 30 - 34 18.6 20.4 18.7 35 - 39 16.1 16.0 16.1 40 - 44 10.6 9.0 10.5 45 - 49 17.4 5.1 16.6 50 - 54 3.6 2.1 3.5 55 - 59 3.8 0.4 3.6 60 - 64 1.5 0.1 1.4 65+ 0.1 0.0 0.1
Source: Statistics Centre - Abu Dhabi
Statistical Yearbook of Abu Dhabi 2017 | 209
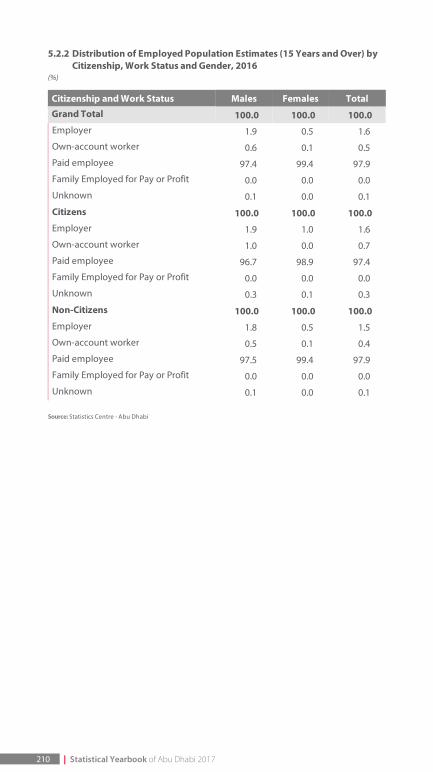
5.2.2 Distribution of Employed Population Estimates (15 Years and Over) byCitizenship, Work Status and Gender, 2016
(%)
Citizenship and Work Status Males Females Total
Grand Total 100.0 100.0 100.0 Employer 1.9 0.5 1.6
Own-account worker 0.6 0.1 0.5
Paid employee 97.4 99.4 97.9
Family Employed for Pay or Profit 0.0 0.0 0.0
Unknown 0.1 0.0 0.1
Citizens 100.0 100.0 100.0 Employer 1.9 1.0 1.6
Own-account worker 1.0 0.0 0.7
Paid employee 96.7 98.9 97.4
Family Employed for Pay or Profit 0.0 0.0 0.0
Unknown 0.3 0.1 0.3
Non-Citizens 100.0 100.0 100.0 Employer 1.8 0.5 1.5
Own-account worker 0.5 0.1 0.4
Paid employee 97.5 99.4 97.9
Family Employed for Pay or Profit 0.0 0.0 0.0
Unknown 0.1 0.0 0.1
Source: Statistics Centre - Abu Dhabi
210 | Statistical Yearbook of Abu Dhabi 2017
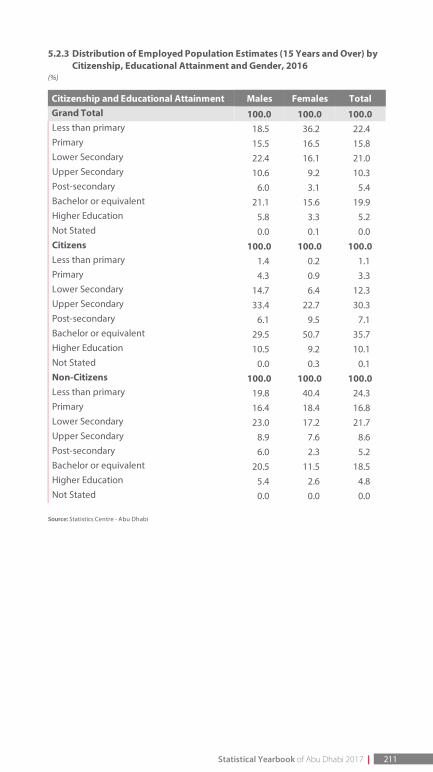
5.2.3 Distribution of Employed Population Estimates (15 Years and Over) byCitizenship, Educational Attainment and Gender, 2016
(%)
Citizenship and Educational Attainment Males Females TotalGrand Total 100.0 100.0 100.0 Less than primary 18.5 36.2 22.4 Primary 15.5 16.5 15.8 Lower Secondary 22.4 16.1 21.0 Upper Secondary 10.6 9.2 10.3 Post-secondary 6.0 3.1 5.4 Bachelor or equivalent 21.1 15.6 19.9 Higher Education 5.8 3.3 5.2 Not Stated 0.0 0.1 0.0 Citizens 100.0 100.0 100.0 Less than primary 1.4 0.2 1.1 Primary 4.3 0.9 3.3 Lower Secondary 14.7 6.4 12.3 Upper Secondary 33.4 22.7 30.3 Post-secondary 6.1 9.5 7.1 Bachelor or equivalent 29.5 50.7 35.7 Higher Education 10.5 9.2 10.1 Not Stated 0.0 0.3 0.1 Non-Citizens 100.0 100.0 100.0 Less than primary 19.8 40.4 24.3 Primary 16.4 18.4 16.8 Lower Secondary 23.0 17.2 21.7 Upper Secondary 8.9 7.6 8.6 Post-secondary 6.0 2.3 5.2 Bachelor or equivalent 20.5 11.5 18.5 Higher Education 5.4 2.6 4.8 Not Stated 0.0 0.0 0.0
Source: Statistics Centre - Abu Dhabi
Statistical Yearbook of Abu Dhabi 2017 | 211
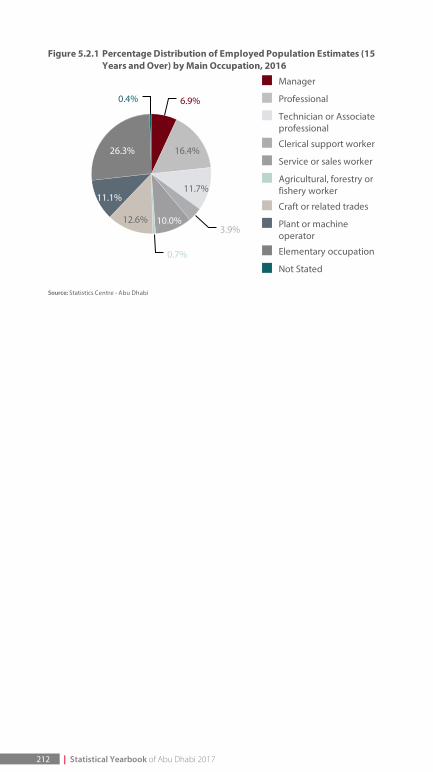
Figure 5.2.1 Percentage Distribution of Employed Population Estimates (15Years and Over) by Main Occupation, 2016
. Manager
. Professional
. Technician or Associateprofessional
. Clerical support worker
. Service or sales worker
. Agricultural, forestry orfishery worker
. Craft or related trades
. Plant or machineoperator
. Elementary occupation
. Not Stated
Source: Statistics Centre - Abu Dhabi
6.9%
16.4%
11.7%
3.9%10.0%
0.7%
12.6%
11.1%
26.3%
0.4%
212 | Statistical Yearbook of Abu Dhabi 2017
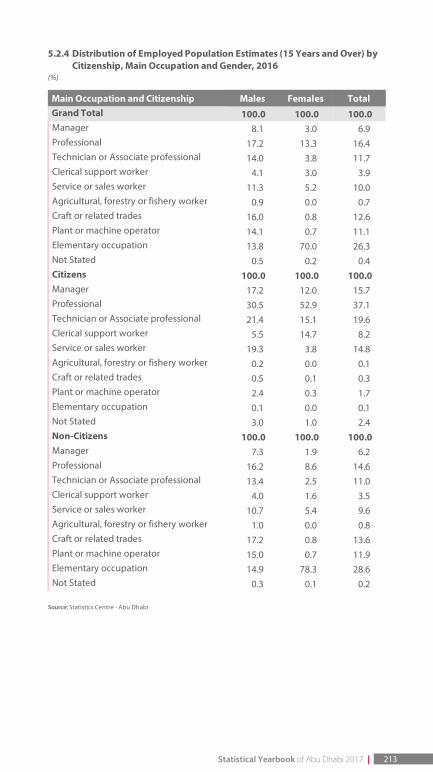
5.2.4 Distribution of Employed Population Estimates (15 Years and Over) byCitizenship, Main Occupation and Gender, 2016
(%)
Main Occupation and Citizenship Males Females TotalGrand Total 100.0 100.0 100.0 Manager 8.1 3.0 6.9 Professional 17.2 13.3 16.4 Technician or Associate professional 14.0 3.8 11.7 Clerical support worker 4.1 3.0 3.9 Service or sales worker 11.3 5.2 10.0 Agricultural, forestry or fishery worker 0.9 0.0 0.7 Craft or related trades 16.0 0.8 12.6 Plant or machine operator 14.1 0.7 11.1 Elementary occupation 13.8 70.0 26.3 Not Stated 0.5 0.2 0.4 Citizens 100.0 100.0 100.0 Manager 17.2 12.0 15.7 Professional 30.5 52.9 37.1 Technician or Associate professional 21.4 15.1 19.6 Clerical support worker 5.5 14.7 8.2 Service or sales worker 19.3 3.8 14.8 Agricultural, forestry or fishery worker 0.2 0.0 0.1 Craft or related trades 0.5 0.1 0.3 Plant or machine operator 2.4 0.3 1.7 Elementary occupation 0.1 0.0 0.1 Not Stated 3.0 1.0 2.4 Non-Citizens 100.0 100.0 100.0 Manager 7.3 1.9 6.2 Professional 16.2 8.6 14.6 Technician or Associate professional 13.4 2.5 11.0 Clerical support worker 4.0 1.6 3.5 Service or sales worker 10.7 5.4 9.6 Agricultural, forestry or fishery worker 1.0 0.0 0.8 Craft or related trades 17.2 0.8 13.6 Plant or machine operator 15.0 0.7 11.9 Elementary occupation 14.9 78.3 28.6 Not Stated 0.3 0.1 0.2
Source: Statistics Centre - Abu Dhabi
Statistical Yearbook of Abu Dhabi 2017 | 213
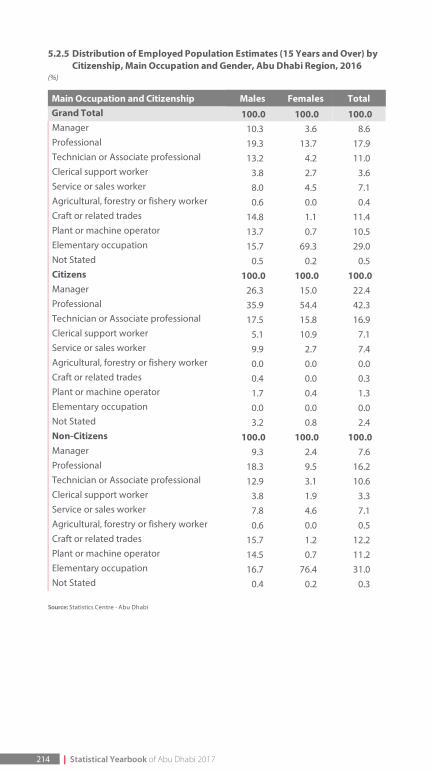
5.2.5 Distribution of Employed Population Estimates (15 Years and Over) byCitizenship, Main Occupation and Gender, Abu Dhabi Region, 2016
(%)
Main Occupation and Citizenship Males Females TotalGrand Total 100.0 100.0 100.0 Manager 10.3 3.6 8.6 Professional 19.3 13.7 17.9 Technician or Associate professional 13.2 4.2 11.0 Clerical support worker 3.8 2.7 3.6 Service or sales worker 8.0 4.5 7.1 Agricultural, forestry or fishery worker 0.6 0.0 0.4 Craft or related trades 14.8 1.1 11.4 Plant or machine operator 13.7 0.7 10.5 Elementary occupation 15.7 69.3 29.0 Not Stated 0.5 0.2 0.5 Citizens 100.0 100.0 100.0 Manager 26.3 15.0 22.4 Professional 35.9 54.4 42.3 Technician or Associate professional 17.5 15.8 16.9 Clerical support worker 5.1 10.9 7.1 Service or sales worker 9.9 2.7 7.4 Agricultural, forestry or fishery worker 0.0 0.0 0.0 Craft or related trades 0.4 0.0 0.3 Plant or machine operator 1.7 0.4 1.3 Elementary occupation 0.0 0.0 0.0 Not Stated 3.2 0.8 2.4 Non-Citizens 100.0 100.0 100.0 Manager 9.3 2.4 7.6 Professional 18.3 9.5 16.2 Technician or Associate professional 12.9 3.1 10.6 Clerical support worker 3.8 1.9 3.3 Service or sales worker 7.8 4.6 7.1 Agricultural, forestry or fishery worker 0.6 0.0 0.5 Craft or related trades 15.7 1.2 12.2 Plant or machine operator 14.5 0.7 11.2 Elementary occupation 16.7 76.4 31.0 Not Stated 0.4 0.2 0.3
Source: Statistics Centre - Abu Dhabi
214 | Statistical Yearbook of Abu Dhabi 2017
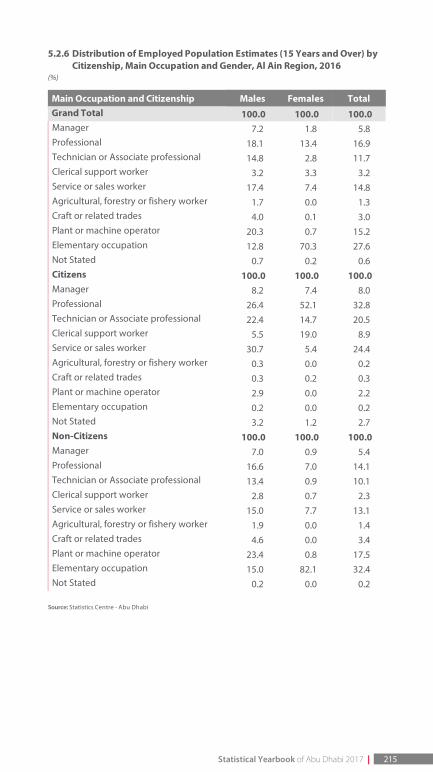
5.2.6 Distribution of Employed Population Estimates (15 Years and Over) byCitizenship, Main Occupation and Gender, Al Ain Region, 2016
(%)
Main Occupation and Citizenship Males Females TotalGrand Total 100.0 100.0 100.0 Manager 7.2 1.8 5.8 Professional 18.1 13.4 16.9 Technician or Associate professional 14.8 2.8 11.7 Clerical support worker 3.2 3.3 3.2 Service or sales worker 17.4 7.4 14.8 Agricultural, forestry or fishery worker 1.7 0.0 1.3 Craft or related trades 4.0 0.1 3.0 Plant or machine operator 20.3 0.7 15.2 Elementary occupation 12.8 70.3 27.6 Not Stated 0.7 0.2 0.6 Citizens 100.0 100.0 100.0 Manager 8.2 7.4 8.0 Professional 26.4 52.1 32.8 Technician or Associate professional 22.4 14.7 20.5 Clerical support worker 5.5 19.0 8.9 Service or sales worker 30.7 5.4 24.4 Agricultural, forestry or fishery worker 0.3 0.0 0.2 Craft or related trades 0.3 0.2 0.3 Plant or machine operator 2.9 0.0 2.2 Elementary occupation 0.2 0.0 0.2 Not Stated 3.2 1.2 2.7 Non-Citizens 100.0 100.0 100.0 Manager 7.0 0.9 5.4 Professional 16.6 7.0 14.1 Technician or Associate professional 13.4 0.9 10.1 Clerical support worker 2.8 0.7 2.3 Service or sales worker 15.0 7.7 13.1 Agricultural, forestry or fishery worker 1.9 0.0 1.4 Craft or related trades 4.6 0.0 3.4 Plant or machine operator 23.4 0.8 17.5 Elementary occupation 15.0 82.1 32.4 Not Stated 0.2 0.0 0.2
Source: Statistics Centre - Abu Dhabi
Statistical Yearbook of Abu Dhabi 2017 | 215

5.2.7 Distribution of Employed Population Estimates (15 Years and Over) byCitizenship, Main Occupation and Gender, Al Dhafra Region, 2016
(%)
Main Occupation and Citizenship Males Females TotalGrand Total 100.0 100.0 100.0 Manager 1.4 0.4 1.3 Professional 9.1 6.4 8.9 Technician or Associate professional 15.8 3.0 14.9 Clerical support worker 6.1 4.8 6.0 Service or sales worker 16.2 5.1 15.4 Agricultural, forestry or fishery worker 1.2 0.0 1.1 Craft or related trades 33.6 0.0 31.3 Plant or machine operator 8.2 0.3 7.7 Elementary occupation 8.3 79.9 13.2 Not Stated 0.0 0.2 0.0 Citizens 100.0 100.0 100.0 Manager 9.5 4.0 8.7 Professional 20.3 36.0 22.7 Technician or Associate professional 38.2 9.4 33.8 Clerical support worker 7.5 39.8 12.4 Service or sales worker 17.0 8.7 15.7 Agricultural, forestry or fishery worker 0.9 0.0 0.8 Craft or related trades 1.6 0.0 1.4 Plant or machine operator 3.7 0.0 3.1 Elementary occupation 0.5 0.0 0.4 Not Stated 0.9 2.1 1.1 Non-Citizens 100.0 100.0 100.0 Manager 1.1 0.0 1.0 Professional 8.7 3.5 8.4 Technician or Associate professional 15.0 2.4 14.2 Clerical support worker 6.0 1.4 5.7 Service or sales worker 16.2 4.8 15.4 Agricultural, forestry or fishery worker 1.2 0.0 1.1 Craft or related trades 34.8 0.0 32.5 Plant or machine operator 8.4 0.3 7.9 Elementary occupation 8.6 87.7 13.7 Not Stated 0.0 0.0 0.0
Source: Statistics Centre - Abu Dhabi
216 | Statistical Yearbook of Abu Dhabi 2017
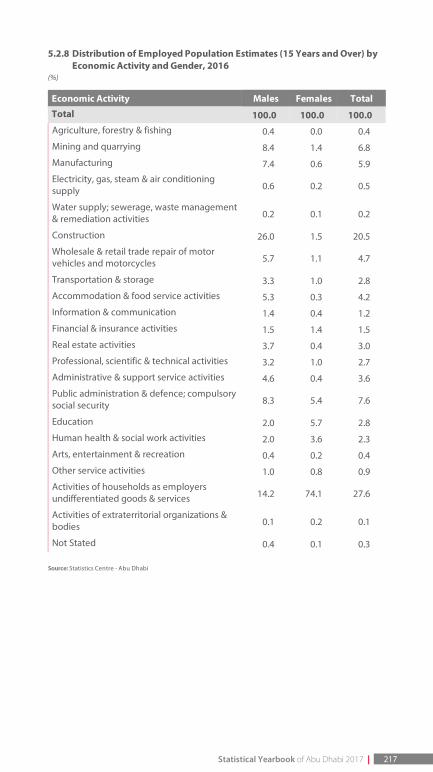
5.2.8 Distribution of Employed Population Estimates (15 Years and Over) byEconomic Activity and Gender, 2016
(%)
Economic Activity Males Females Total
Total 100.0 100.0 100.0 Agriculture, forestry & fishing 0.4 0.0 0.4
Mining and quarrying 8.4 1.4 6.8
Manufacturing 7.4 0.6 5.9
Electricity, gas, steam & air conditioningsupply 0.6 0.2 0.5
Water supply; sewerage, waste management& remediation activities 0.2 0.1 0.2
Construction 26.0 1.5 20.5
Wholesale & retail trade repair of motorvehicles and motorcycles 5.7 1.1 4.7
Transportation & storage 3.3 1.0 2.8
Accommodation & food service activities 5.3 0.3 4.2
Information & communication 1.4 0.4 1.2
Financial & insurance activities 1.5 1.4 1.5
Real estate activities 3.7 0.4 3.0
Professional, scientific & technical activities 3.2 1.0 2.7
Administrative & support service activities 4.6 0.4 3.6
Public administration & defence; compulsorysocial security 8.3 5.4 7.6
Education 2.0 5.7 2.8
Human health & social work activities 2.0 3.6 2.3
Arts, entertainment & recreation 0.4 0.2 0.4
Other service activities 1.0 0.8 0.9
Activities of households as employersundifferentiated goods & services 14.2 74.1 27.6
Activities of extraterritorial organizations &bodies 0.1 0.2 0.1
Not Stated 0.4 0.1 0.3
Source: Statistics Centre - Abu Dhabi
Statistical Yearbook of Abu Dhabi 2017 | 217
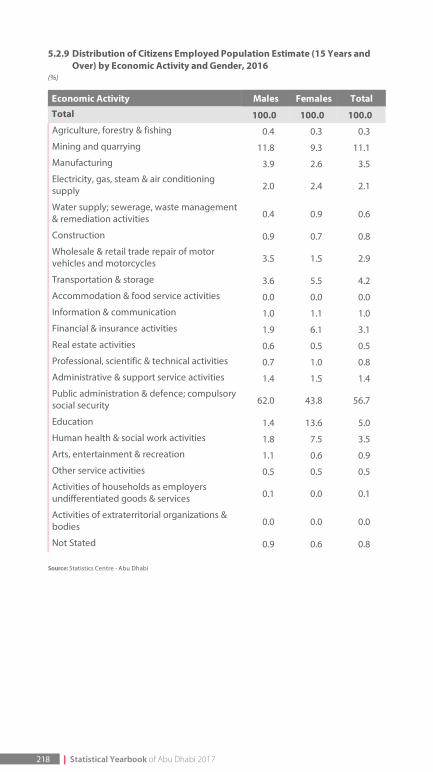
5.2.9 Distribution of Citizens Employed Population Estimate (15 Years andOver) by Economic Activity and Gender, 2016
(%)
Economic Activity Males Females Total
Total 100.0 100.0 100.0 Agriculture, forestry & fishing 0.4 0.3 0.3
Mining and quarrying 11.8 9.3 11.1
Manufacturing 3.9 2.6 3.5
Electricity, gas, steam & air conditioningsupply 2.0 2.4 2.1
Water supply; sewerage, waste management& remediation activities 0.4 0.9 0.6
Construction 0.9 0.7 0.8
Wholesale & retail trade repair of motorvehicles and motorcycles 3.5 1.5 2.9
Transportation & storage 3.6 5.5 4.2
Accommodation & food service activities 0.0 0.0 0.0
Information & communication 1.0 1.1 1.0
Financial & insurance activities 1.9 6.1 3.1
Real estate activities 0.6 0.5 0.5
Professional, scientific & technical activities 0.7 1.0 0.8
Administrative & support service activities 1.4 1.5 1.4
Public administration & defence; compulsorysocial security 62.0 43.8 56.7
Education 1.4 13.6 5.0
Human health & social work activities 1.8 7.5 3.5
Arts, entertainment & recreation 1.1 0.6 0.9
Other service activities 0.5 0.5 0.5
Activities of households as employersundifferentiated goods & services 0.1 0.0 0.1
Activities of extraterritorial organizations &bodies 0.0 0.0 0.0
Not Stated 0.9 0.6 0.8
Source: Statistics Centre - Abu Dhabi
218 | Statistical Yearbook of Abu Dhabi 2017
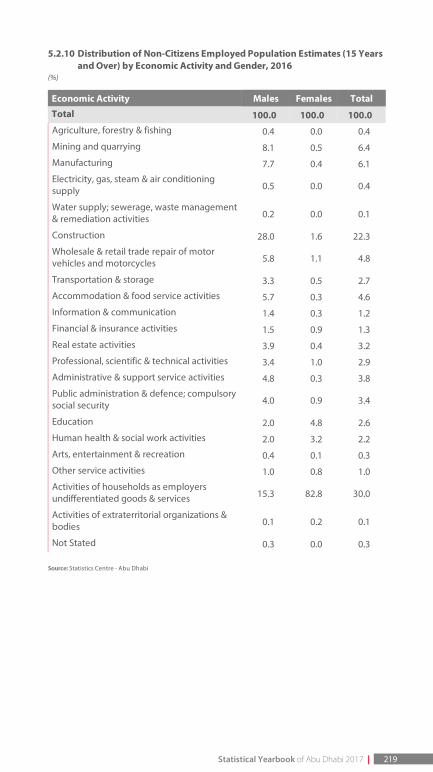
5.2.10 Distribution of Non-Citizens Employed Population Estimates (15 Yearsand Over) by Economic Activity and Gender, 2016
(%)
Economic Activity Males Females Total
Total 100.0 100.0 100.0 Agriculture, forestry & fishing 0.4 0.0 0.4
Mining and quarrying 8.1 0.5 6.4
Manufacturing 7.7 0.4 6.1
Electricity, gas, steam & air conditioningsupply 0.5 0.0 0.4
Water supply; sewerage, waste management& remediation activities 0.2 0.0 0.1
Construction 28.0 1.6 22.3
Wholesale & retail trade repair of motorvehicles and motorcycles 5.8 1.1 4.8
Transportation & storage 3.3 0.5 2.7
Accommodation & food service activities 5.7 0.3 4.6
Information & communication 1.4 0.3 1.2
Financial & insurance activities 1.5 0.9 1.3
Real estate activities 3.9 0.4 3.2
Professional, scientific & technical activities 3.4 1.0 2.9
Administrative & support service activities 4.8 0.3 3.8
Public administration & defence; compulsorysocial security 4.0 0.9 3.4
Education 2.0 4.8 2.6
Human health & social work activities 2.0 3.2 2.2
Arts, entertainment & recreation 0.4 0.1 0.3
Other service activities 1.0 0.8 1.0
Activities of households as employersundifferentiated goods & services 15.3 82.8 30.0
Activities of extraterritorial organizations &bodies 0.1 0.2 0.1
Not Stated 0.3 0.0 0.3
Source: Statistics Centre - Abu Dhabi
Statistical Yearbook of Abu Dhabi 2017 | 219
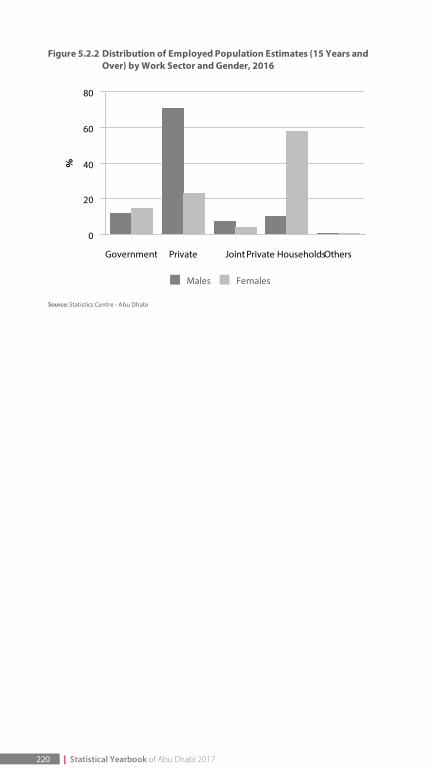
Figure 5.2.2 Distribution of Employed Population Estimates (15 Years andOver) by Work Sector and Gender, 2016
. Males . Females
Source: Statistics Centre - Abu Dhabi
Government Private Joint Private HouseholdsOthers
0
20
40
60
80
%
220 | Statistical Yearbook of Abu Dhabi 2017
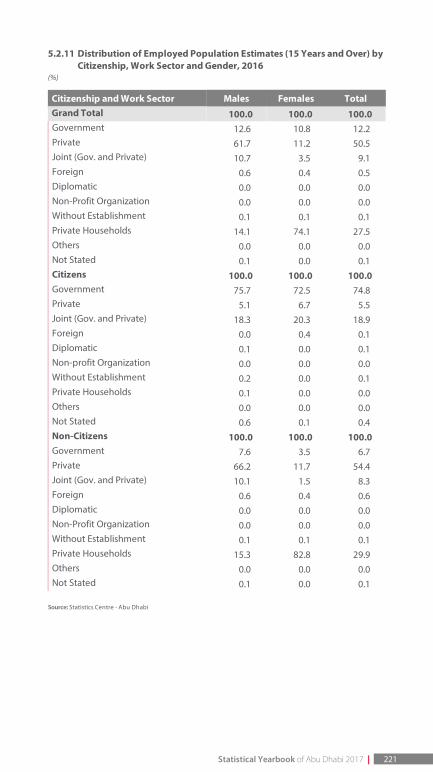
5.2.11 Distribution of Employed Population Estimates (15 Years and Over) byCitizenship, Work Sector and Gender, 2016
(%)
Citizenship and Work Sector Males Females TotalGrand Total 100.0 100.0 100.0 Government 12.6 10.8 12.2 Private 61.7 11.2 50.5 Joint (Gov. and Private) 10.7 3.5 9.1 Foreign 0.6 0.4 0.5 Diplomatic 0.0 0.0 0.0 Non-Profit Organization 0.0 0.0 0.0 Without Establishment 0.1 0.1 0.1 Private Households 14.1 74.1 27.5 Others 0.0 0.0 0.0 Not Stated 0.1 0.0 0.1 Citizens 100.0 100.0 100.0 Government 75.7 72.5 74.8 Private 5.1 6.7 5.5 Joint (Gov. and Private) 18.3 20.3 18.9 Foreign 0.0 0.4 0.1 Diplomatic 0.1 0.0 0.1 Non-profit Organization 0.0 0.0 0.0 Without Establishment 0.2 0.0 0.1 Private Households 0.1 0.0 0.0 Others 0.0 0.0 0.0 Not Stated 0.6 0.1 0.4 Non-Citizens 100.0 100.0 100.0 Government 7.6 3.5 6.7 Private 66.2 11.7 54.4 Joint (Gov. and Private) 10.1 1.5 8.3 Foreign 0.6 0.4 0.6 Diplomatic 0.0 0.0 0.0 Non-Profit Organization 0.0 0.0 0.0 Without Establishment 0.1 0.1 0.1 Private Households 15.3 82.8 29.9 Others 0.0 0.0 0.0 Not Stated 0.1 0.0 0.1
Source: Statistics Centre - Abu Dhabi
Statistical Yearbook of Abu Dhabi 2017 | 221
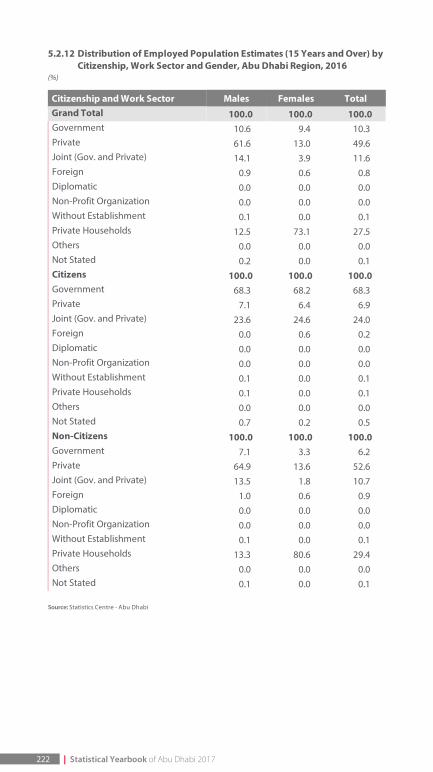
5.2.12 Distribution of Employed Population Estimates (15 Years and Over) byCitizenship, Work Sector and Gender, Abu Dhabi Region, 2016
(%)
Citizenship and Work Sector Males Females TotalGrand Total 100.0 100.0 100.0 Government 10.6 9.4 10.3 Private 61.6 13.0 49.6 Joint (Gov. and Private) 14.1 3.9 11.6 Foreign 0.9 0.6 0.8 Diplomatic 0.0 0.0 0.0 Non-Profit Organization 0.0 0.0 0.0 Without Establishment 0.1 0.0 0.1 Private Households 12.5 73.1 27.5 Others 0.0 0.0 0.0 Not Stated 0.2 0.0 0.1 Citizens 100.0 100.0 100.0 Government 68.3 68.2 68.3 Private 7.1 6.4 6.9 Joint (Gov. and Private) 23.6 24.6 24.0 Foreign 0.0 0.6 0.2 Diplomatic 0.0 0.0 0.0 Non-Profit Organization 0.0 0.0 0.0 Without Establishment 0.1 0.0 0.1 Private Households 0.1 0.0 0.1 Others 0.0 0.0 0.0 Not Stated 0.7 0.2 0.5 Non-Citizens 100.0 100.0 100.0 Government 7.1 3.3 6.2 Private 64.9 13.6 52.6 Joint (Gov. and Private) 13.5 1.8 10.7 Foreign 1.0 0.6 0.9 Diplomatic 0.0 0.0 0.0 Non-Profit Organization 0.0 0.0 0.0 Without Establishment 0.1 0.0 0.1 Private Households 13.3 80.6 29.4 Others 0.0 0.0 0.0 Not Stated 0.1 0.0 0.1
Source: Statistics Centre - Abu Dhabi
222 | Statistical Yearbook of Abu Dhabi 2017
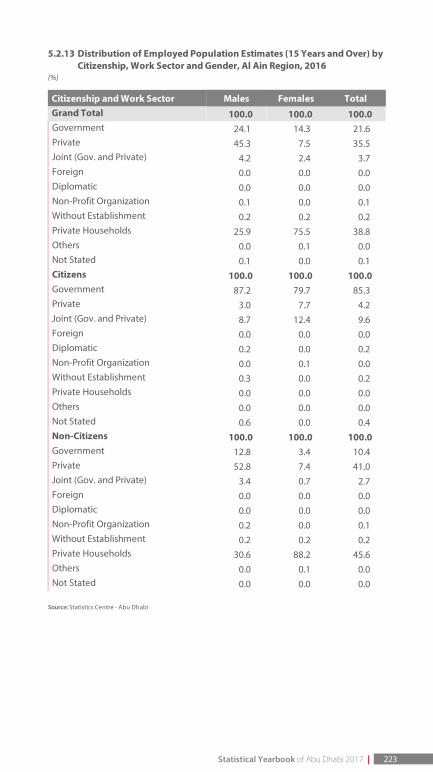
5.2.13 Distribution of Employed Population Estimates (15 Years and Over) byCitizenship, Work Sector and Gender, Al Ain Region, 2016
(%)
Citizenship and Work Sector Males Females TotalGrand Total 100.0 100.0 100.0 Government 24.1 14.3 21.6 Private 45.3 7.5 35.5 Joint (Gov. and Private) 4.2 2.4 3.7 Foreign 0.0 0.0 0.0 Diplomatic 0.0 0.0 0.0 Non-Profit Organization 0.1 0.0 0.1 Without Establishment 0.2 0.2 0.2 Private Households 25.9 75.5 38.8 Others 0.0 0.1 0.0 Not Stated 0.1 0.0 0.1 Citizens 100.0 100.0 100.0 Government 87.2 79.7 85.3 Private 3.0 7.7 4.2 Joint (Gov. and Private) 8.7 12.4 9.6 Foreign 0.0 0.0 0.0 Diplomatic 0.2 0.0 0.2 Non-Profit Organization 0.0 0.1 0.0 Without Establishment 0.3 0.0 0.2 Private Households 0.0 0.0 0.0 Others 0.0 0.0 0.0 Not Stated 0.6 0.0 0.4 Non-Citizens 100.0 100.0 100.0 Government 12.8 3.4 10.4 Private 52.8 7.4 41.0 Joint (Gov. and Private) 3.4 0.7 2.7 Foreign 0.0 0.0 0.0 Diplomatic 0.0 0.0 0.0 Non-Profit Organization 0.2 0.0 0.1 Without Establishment 0.2 0.2 0.2 Private Households 30.6 88.2 45.6 Others 0.0 0.1 0.0 Not Stated 0.0 0.0 0.0
Source: Statistics Centre - Abu Dhabi
Statistical Yearbook of Abu Dhabi 2017 | 223
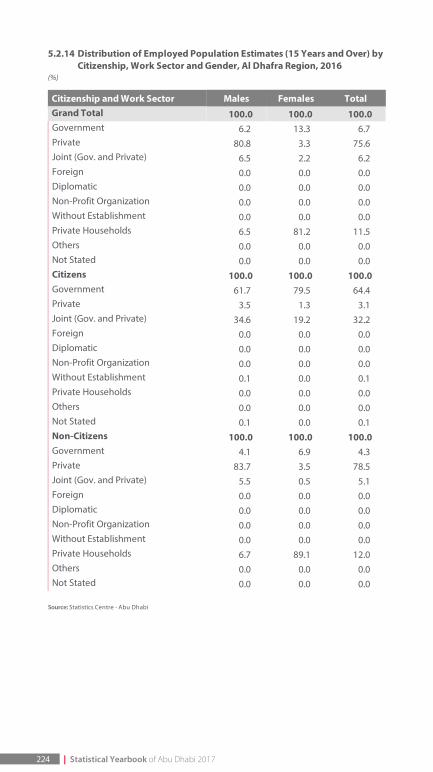
5.2.14 Distribution of Employed Population Estimates (15 Years and Over) byCitizenship, Work Sector and Gender, Al Dhafra Region, 2016
(%)
Citizenship and Work Sector Males Females TotalGrand Total 100.0 100.0 100.0 Government 6.2 13.3 6.7 Private 80.8 3.3 75.6 Joint (Gov. and Private) 6.5 2.2 6.2 Foreign 0.0 0.0 0.0 Diplomatic 0.0 0.0 0.0 Non-Profit Organization 0.0 0.0 0.0 Without Establishment 0.0 0.0 0.0 Private Households 6.5 81.2 11.5 Others 0.0 0.0 0.0 Not Stated 0.0 0.0 0.0 Citizens 100.0 100.0 100.0 Government 61.7 79.5 64.4 Private 3.5 1.3 3.1 Joint (Gov. and Private) 34.6 19.2 32.2 Foreign 0.0 0.0 0.0 Diplomatic 0.0 0.0 0.0 Non-Profit Organization 0.0 0.0 0.0 Without Establishment 0.1 0.0 0.1 Private Households 0.0 0.0 0.0 Others 0.0 0.0 0.0 Not Stated 0.1 0.0 0.1 Non-Citizens 100.0 100.0 100.0 Government 4.1 6.9 4.3 Private 83.7 3.5 78.5 Joint (Gov. and Private) 5.5 0.5 5.1 Foreign 0.0 0.0 0.0 Diplomatic 0.0 0.0 0.0 Non-Profit Organization 0.0 0.0 0.0 Without Establishment 0.0 0.0 0.0 Private Households 6.7 89.1 12.0 Others 0.0 0.0 0.0 Not Stated 0.0 0.0 0.0
Source: Statistics Centre - Abu Dhabi
224 | Statistical Yearbook of Abu Dhabi 2017
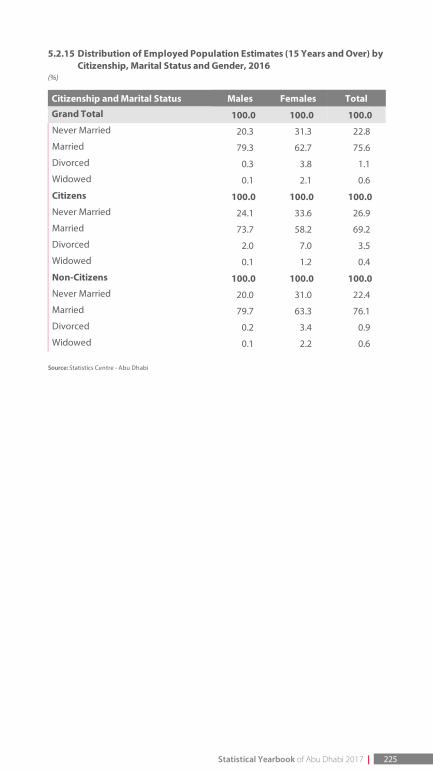
5.2.15 Distribution of Employed Population Estimates (15 Years and Over) byCitizenship, Marital Status and Gender, 2016
(%)
Citizenship and Marital Status Males Females Total
Grand Total 100.0 100.0 100.0 Never Married 20.3 31.3 22.8
Married 79.3 62.7 75.6
Divorced 0.3 3.8 1.1
Widowed 0.1 2.1 0.6
Citizens 100.0 100.0 100.0 Never Married 24.1 33.6 26.9
Married 73.7 58.2 69.2
Divorced 2.0 7.0 3.5
Widowed 0.1 1.2 0.4
Non-Citizens 100.0 100.0 100.0 Never Married 20.0 31.0 22.4
Married 79.7 63.3 76.1
Divorced 0.2 3.4 0.9
Widowed 0.1 2.2 0.6
Source: Statistics Centre - Abu Dhabi
Statistical Yearbook of Abu Dhabi 2017 | 225

5.2.16 Distribution of Employed Population Estimates (15 Years and Over) byCitizenship, Actual Weekly Working Hours and Gender, 2016
(%)
Citizenship and Actual Working Hours Males Females Total
Grand Total 100.0 100.0 100.0 0* 0.4 0.2 0.4
1 - 20 0.1 0.3 0.2
21 -40 21.0 23.3 21.5
41 - 48 29.7 18.0 27.1
49+ 48.4 57.6 50.4
Not Stated 0.3 0.6 0.4
Citizens 100.0 100.0 100.0 0* 4.9 0.3 3.6
1 - 20 0.4 0.5 0.4
21 -40 72.1 85.4 76.0
41 - 48 16.2 12.4 15.1
49+ 5.5 1.3 4.3
Not Stated 0.8 0.1 0.6
Non-Citizens 100.0 100.0 100.0 0* 0.1 0.2 0.1
1 - 20 0.1 0.2 0.1
21 -40 17.0 16.0 16.8
41 - 48 30.8 18.7 28.1
49+ 51.8 64.2 54.5
Not Stated 0.3 0.7 0.4
Source: Statistics Centre - Abu Dhabi* 0: Employed Persons who were absent from a work during the previous seven days.
226 | Statistical Yearbook of Abu Dhabi 2017
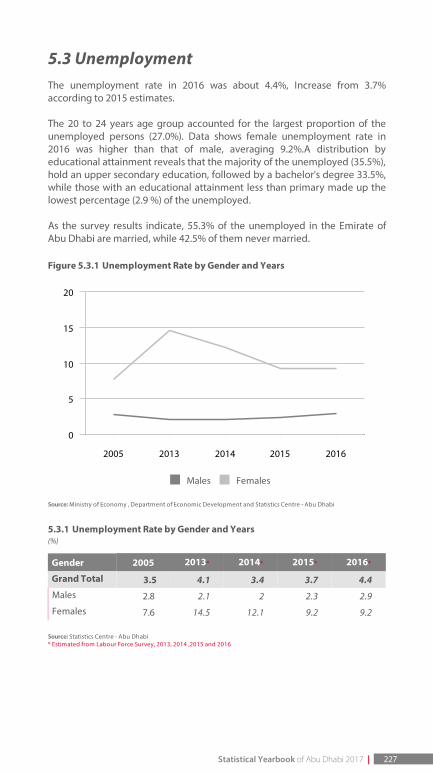
5.3 UnemploymentThe unemployment rate in 2016 was about 4.4%, Increase from 3.7%according to 2015 estimates.
The 20 to 24 years age group accounted for the largest proportion of theunemployed persons (27.0%). Data shows female unemployment rate in2016 was higher than that of male, averaging 9.2%.A distribution byeducational attainment reveals that the majority of the unemployed (35.5%),hold an upper secondary education, followed by a bachelor's degree 33.5%,while those with an educational attainment less than primary made up thelowest percentage (2.9 %) of the unemployed.
As the survey results indicate, 55.3% of the unemployed in the Emirate ofAbu Dhabi are married, while 42.5% of them never married.
Figure 5.3.1 Unemployment Rate by Gender and Years
. Males . Females
Source: Ministry of Economy , Department of Economic Development and Statistics Centre - Abu Dhabi
5.3.1 Unemployment Rate by Gender and Years(%)
Gender 2005 2013* 2014* 2015* 2016*
Grand Total 3.5 4.1 3.4 3.7 4.4 Males 2.8 2.1 2 2.3 2.9
Females 7.6 14.5 12.1 9.2 9.2
Source: Statistics Centre - Abu Dhabi* Estimated from Labour Force Survey, 2013, 2014 ,2015 and 2016
2005 2013 2014 2015 2016
0
5
10
15
20
Statistical Yearbook of Abu Dhabi 2017 | 227
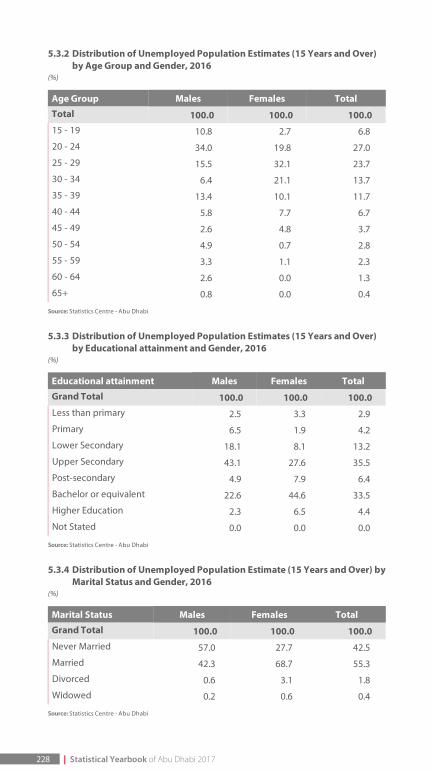
5.3.2 Distribution of Unemployed Population Estimates (15 Years and Over)by Age Group and Gender, 2016
(%)
Age Group Males Females Total
Total 100.0 100.0 100.0 15 - 19 10.8 2.7 6.8
20 - 24 34.0 19.8 27.0
25 - 29 15.5 32.1 23.7
30 - 34 6.4 21.1 13.7
35 - 39 13.4 10.1 11.7
40 - 44 5.8 7.7 6.7
45 - 49 2.6 4.8 3.7
50 - 54 4.9 0.7 2.8
55 - 59 3.3 1.1 2.3
60 - 64 2.6 0.0 1.3
65+ 0.8 0.0 0.4
Source: Statistics Centre - Abu Dhabi
5.3.3 Distribution of Unemployed Population Estimates (15 Years and Over)by Educational attainment and Gender, 2016
(%)
Educational attainment Males Females Total
Grand Total 100.0 100.0 100.0 Less than primary 2.5 3.3 2.9
Primary 6.5 1.9 4.2
Lower Secondary 18.1 8.1 13.2
Upper Secondary 43.1 27.6 35.5
Post-secondary 4.9 7.9 6.4
Bachelor or equivalent 22.6 44.6 33.5
Higher Education 2.3 6.5 4.4
Not Stated 0.0 0.0 0.0
Source: Statistics Centre - Abu Dhabi
5.3.4 Distribution of Unemployed Population Estimate (15 Years and Over) byMarital Status and Gender, 2016
(%)
Marital Status Males Females Total
Grand Total 100.0 100.0 100.0 Never Married 57.0 27.7 42.5
Married 42.3 68.7 55.3
Divorced 0.6 3.1 1.8
Widowed 0.2 0.6 0.4
Source: Statistics Centre - Abu Dhabi
228 | Statistical Yearbook of Abu Dhabi 2017
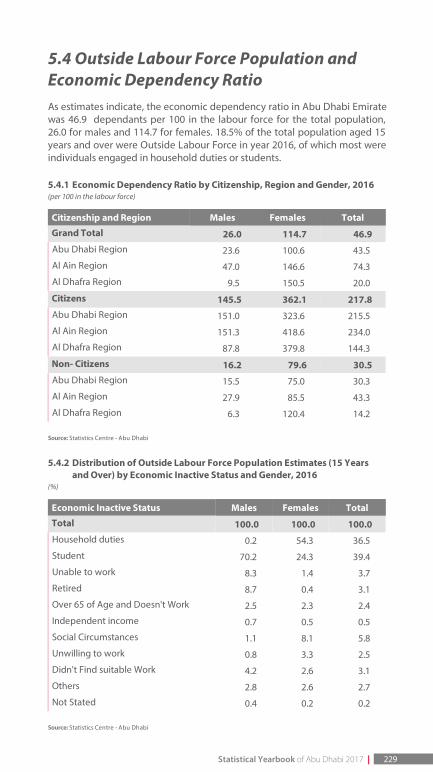
5.4 Outside Labour Force Population andEconomic Dependency RatioAs estimates indicate, the economic dependency ratio in Abu Dhabi Emiratewas 46.9 dependants per 100 in the labour force for the total population,26.0 for males and 114.7 for females. 18.5% of the total population aged 15years and over were Outside Labour Force in year 2016, of which most wereindividuals engaged in household duties or students.
5.4.1 Economic Dependency Ratio by Citizenship, Region and Gender, 2016(per 100 in the labour force)
Citizenship and Region Males Females Total
Grand Total 26.0 114.7 46.9 Abu Dhabi Region 23.6 100.6 43.5
Al Ain Region 47.0 146.6 74.3
Al Dhafra Region 9.5 150.5 20.0
Citizens 145.5 362.1 217.8 Abu Dhabi Region 151.0 323.6 215.5
Al Ain Region 151.3 418.6 234.0
Al Dhafra Region 87.8 379.8 144.3
Non- Citizens 16.2 79.6 30.5 Abu Dhabi Region 15.5 75.0 30.3
Al Ain Region 27.9 85.5 43.3
Al Dhafra Region 6.3 120.4 14.2
Source: Statistics Centre - Abu Dhabi
5.4.2 Distribution of Outside Labour Force Population Estimates (15 Yearsand Over) by Economic Inactive Status and Gender, 2016
(%)
Economic Inactive Status Males Females Total
Total 100.0 100.0 100.0 Household duties 0.2 54.3 36.5
Student 70.2 24.3 39.4
Unable to work 8.3 1.4 3.7
Retired 8.7 0.4 3.1
Over 65 of Age and Doesn't Work 2.5 2.3 2.4
Independent income 0.7 0.5 0.5
Social Circumstances 1.1 8.1 5.8
Unwilling to work 0.8 3.3 2.5
Didn't Find suitable Work 4.2 2.6 3.1
Others 2.8 2.6 2.7
Not Stated 0.4 0.2 0.2
Source: Statistics Centre - Abu Dhabi
Statistical Yearbook of Abu Dhabi 2017 | 229
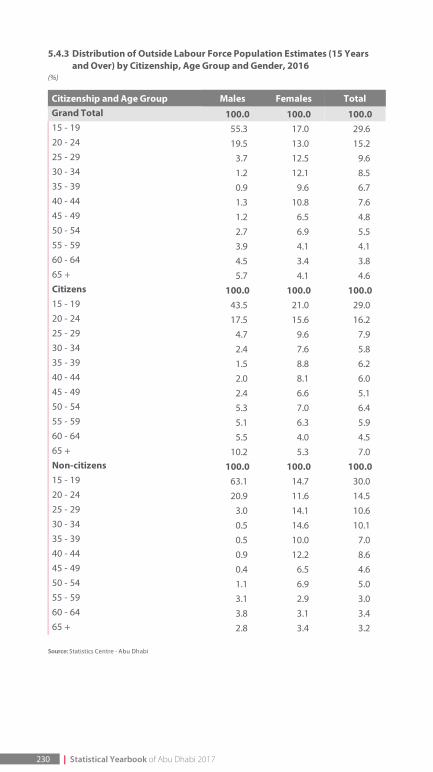
5.4.3 Distribution of Outside Labour Force Population Estimates (15 Yearsand Over) by Citizenship, Age Group and Gender, 2016
(%)
Citizenship and Age Group Males Females TotalGrand Total 100.0 100.0 100.0 15 - 19 55.3 17.0 29.6 20 - 24 19.5 13.0 15.2 25 - 29 3.7 12.5 9.6 30 - 34 1.2 12.1 8.5 35 - 39 0.9 9.6 6.7 40 - 44 1.3 10.8 7.6 45 - 49 1.2 6.5 4.8 50 - 54 2.7 6.9 5.5 55 - 59 3.9 4.1 4.1 60 - 64 4.5 3.4 3.8 65 + 5.7 4.1 4.6 Citizens 100.0 100.0 100.0 15 - 19 43.5 21.0 29.0 20 - 24 17.5 15.6 16.2 25 - 29 4.7 9.6 7.9 30 - 34 2.4 7.6 5.8 35 - 39 1.5 8.8 6.2 40 - 44 2.0 8.1 6.0 45 - 49 2.4 6.6 5.1 50 - 54 5.3 7.0 6.4 55 - 59 5.1 6.3 5.9 60 - 64 5.5 4.0 4.5 65 + 10.2 5.3 7.0 Non-citizens 100.0 100.0 100.0 15 - 19 63.1 14.7 30.0 20 - 24 20.9 11.6 14.5 25 - 29 3.0 14.1 10.6 30 - 34 0.5 14.6 10.1 35 - 39 0.5 10.0 7.0 40 - 44 0.9 12.2 8.6 45 - 49 0.4 6.5 4.6 50 - 54 1.1 6.9 5.0 55 - 59 3.1 2.9 3.0 60 - 64 3.8 3.1 3.4 65 + 2.8 3.4 3.2
Source: Statistics Centre - Abu Dhabi
230 | Statistical Yearbook of Abu Dhabi 2017
244 Statistical Yearbook of Abu Dhabi 2016
245 Statistical Yearbook of Abu Dhabi 2016
6. Agriculture and Environment
• Agriculture
• Environment
• Energy and Water
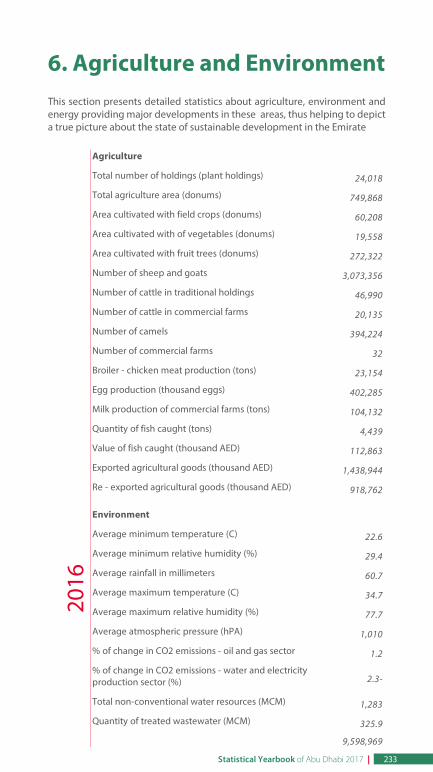
6. Agriculture and EnvironmentThis section presents detailed statistics about agriculture, environment andenergy providing major developments in these areas, thus helping to depicta true picture about the state of sustainable development in the Emirate
Agriculture
Total number of holdings (plant holdings) 24,018
Total agriculture area (donums) 749,868
Area cultivated with field crops (donums) 60,208
Area cultivated with of vegetables (donums) 19,558
Area cultivated with fruit trees (donums) 272,322
Number of sheep and goats 3,073,356
Number of cattle in traditional holdings 46,990
Number of cattle in commercial farms 20,135
Number of camels 394,224
Number of commercial farms 32
Broiler - chicken meat production (tons) 23,154
Egg production (thousand eggs) 402,285
Milk production of commercial farms (tons) 104,132
Quantity of fish caught (tons) 4,439
Value of fish caught (thousand AED) 112,863
Exported agricultural goods (thousand AED) 1,438,944
Re - exported agricultural goods (thousand AED) 918,762
Environment
Average minimum temperature (C) 22.6
Average minimum relative humidity (%) 29.4
Average rainfall in millimeters 60.7
Average maximum temperature (C) 34.7
Average maximum relative humidity (%) 77.7
Average atmospheric pressure (hPA) 1,010
% of change in CO2 emissions - oil and gas sector 1.2
% of change in CO2 emissions - water and electricityproduction sector (%) 2.3-
Total non-conventional water resources (MCM) 1,283
Quantity of treated wastewater (MCM) 325.9
9,598,969
2016
Statistical Yearbook of Abu Dhabi 2017 | 233
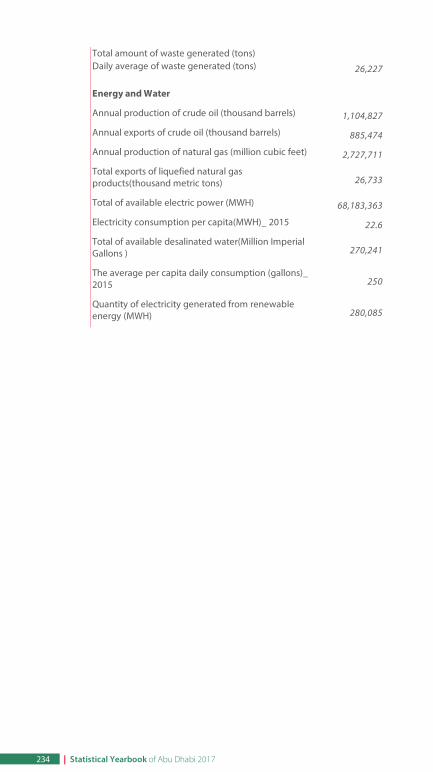
Total amount of waste generated (tons)Daily average of waste generated (tons) 26,227
Energy and Water
Annual production of crude oil (thousand barrels) 1,104,827
Annual exports of crude oil (thousand barrels) 885,474
Annual production of natural gas (million cubic feet) 2,727,711
Total exports of liquefied natural gasproducts(thousand metric tons) 26,733
Total of available electric power (MWH) 68,183,363
Electricity consumption per capita(MWH)_ 2015 22.6
Total of available desalinated water(Million ImperialGallons ) 270,241
The average per capita daily consumption (gallons)_2015 250
Quantity of electricity generated from renewableenergy (MWH) 280,085
234 | Statistical Yearbook of Abu Dhabi 2017
6.1. AgricultureAgriculture is of key importance in the achievement of food security andrepresents a central activity for related economic activities. Abu DhabiEmirate has made vast strides in the eld of agriculture, setting a worldwideexample in overcoming the dry conditions of the desert and converting itsarid terrain into green farms producing a variety of vegetables and fruits forthe consumer market.
Over the course of the past four decade, the number of plant holdingsincreased 38-folds from 634 in 1971 to 24,018 in 2016. Meanwhile the size ofarable land expanded by 33-fold from 22,377 donum to 749,868 donumduring the same period.
Thanks to the wise policies of the emirate's government, Abu Dhabimanaged to overcome with tough arid conditions and high temperaturesand establish a successful agricultural sector that re ects the emirate'sambitious pursuit of sustainable development. The agricultural sector nowmanifests one of the aspects of social and economic development AbuDhabi is currently experiencing in various fields.
Economic development is affected by all economic activities, includingagricultural activity, which is a cornerstone for achieving the objectives ofthe overall development. Agricultural sector is one of the key productivesectors and a major component of GDP, in addition to being the mainsupplier of food commodities and raw materials for many of the foodindustry in the Emirate. It is of crucial importance, therefore, to have anextensive and accurate database of agricultural statistics to support fact-based planning in this area of economic activity.
The Statistical Yearbook includes quantitative and qualitative statisticsintended to support planning and decision-making. The book includes dataon the numbers of farms, size of agricultural area, indicators of crop area andagricultural production quantities and values.
The total number of sheep and goats in the Emirate of Abu Dhabi totalled 3million heads, with the majority of them (64%) in Al Ain. Meanwhile, the totalnumber of camels was 394,224 heads, mostly (55%) in Al Ain.
The statistical Yearbook present data on the commercial farms specialized inthe production of poultry meat (broilers), table eggs, cow milk in the Emirateof Abu Dhabi, which supply large quantities of food, with poultry meatproduction amounting to 23,154 tons, while layers' farms produced 602.3million eggs, and dairy farms 104 thousand tons of cow's milk in 2016.
Statistical Yearbook of Abu Dhabi 2017 | 235
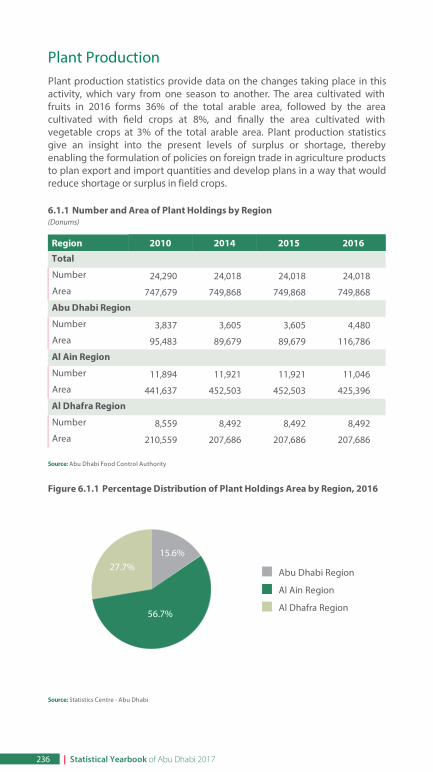
Plant ProductionPlant production statistics provide data on the changes taking place in thisactivity, which vary from one season to another. The area cultivated withfruits in 2016 forms 36% of the total arable area, followed by the areacultivated with eld crops at 8%, and nally the area cultivated withvegetable crops at 3% of the total arable area. Plant production statisticsgive an insight into the present levels of surplus or shortage, therebyenabling the formulation of policies on foreign trade in agriculture productsto plan export and import quantities and develop plans in a way that wouldreduce shortage or surplus in field crops.
6.1.1 Number and Area of Plant Holdings by Region(Donums)
Region 2010 2014 2015 2016
Total
Number 24,290 24,018 24,018 24,018
Area 747,679 749,868 749,868 749,868
Abu Dhabi Region
Number 3,837 3,605 3,605 4,480
Area 95,483 89,679 89,679 116,786
Al Ain Region
Number 11,894 11,921 11,921 11,046
Area 441,637 452,503 452,503 425,396
Al Dhafra Region
Number 8,559 8,492 8,492 8,492
Area 210,559 207,686 207,686 207,686
Source: Abu Dhabi Food Control Authority
Figure 6.1.1 Percentage Distribution of Plant Holdings Area by Region, 2016
. Abu Dhabi Region
. Al Ain Region
. Al Dhafra Region
Source: Statistics Centre - Abu Dhabi
15.6%
56.7%
27.7%
236 | Statistical Yearbook of Abu Dhabi 2017
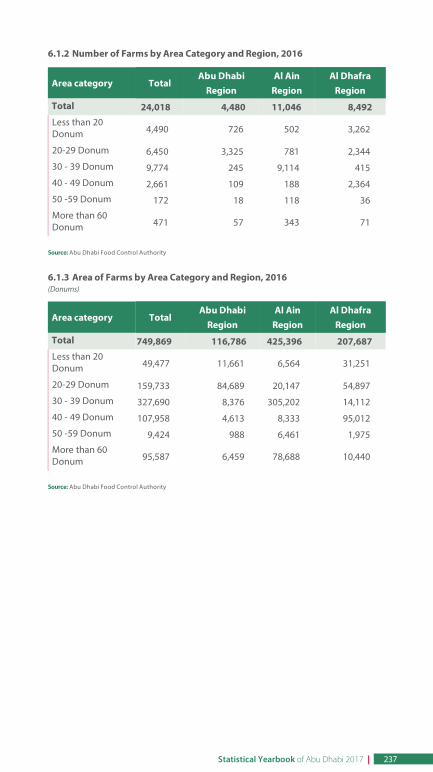
6.1.2 Number of Farms by Area Category and Region, 2016
Area category TotalAbu Dhabi
RegionAl Ain
RegionAl Dhafra
Region
Total 24,018 4,480 11,046 8,492 Less than 20Donum 4,490 726 502 3,262
20-29 Donum 6,450 3,325 781 2,344
30 - 39 Donum 9,774 245 9,114 415
40 - 49 Donum 2,661 109 188 2,364
50 -59 Donum 172 18 118 36
More than 60Donum 471 57 343 71
Source: Abu Dhabi Food Control Authority
6.1.3 Area of Farms by Area Category and Region, 2016(Donums)
Area category TotalAbu Dhabi
RegionAl Ain
RegionAl Dhafra
Region
Total 749,869 116,786 425,396 207,687 Less than 20Donum 49,477 11,661 6,564 31,251
20-29 Donum 159,733 84,689 20,147 54,897
30 - 39 Donum 327,690 8,376 305,202 14,112
40 - 49 Donum 107,958 4,613 8,333 95,012
50 -59 Donum 9,424 988 6,461 1,975
More than 60Donum 95,587 6,459 78,688 10,440
Source: Abu Dhabi Food Control Authority
Statistical Yearbook of Abu Dhabi 2017 | 237
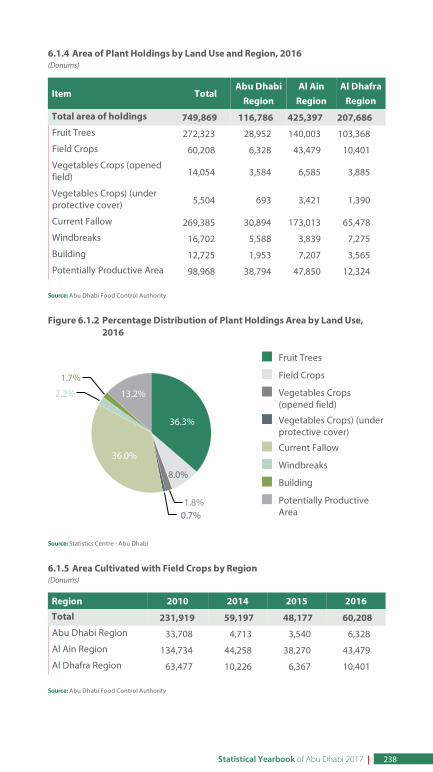
238
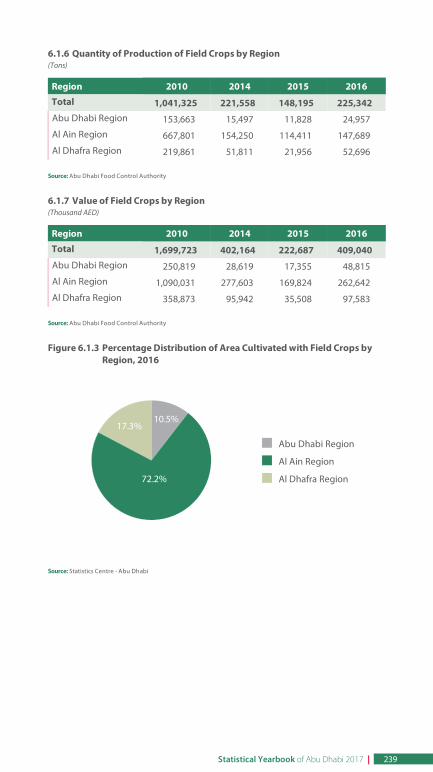
6.1.6 Quantity of Production of Field Crops by Region(Tons)
Region 2010 2014 2015 2016
Total 1,041,325 221,558 148,195 225,342 Abu Dhabi Region 153,663 15,497 11,828 24,957
Al Ain Region 667,801 154,250 114,411 147,689
Al Dhafra Region 219,861 51,811 21,956 52,696
Source: Abu Dhabi Food Control Authority
6.1.7 Value of Field Crops by Region(Thousand AED)
Region 2010 2014 2015 2016
Total 1,699,723 402,164 222,687 409,040 Abu Dhabi Region 250,819 28,619 17,355 48,815
Al Ain Region 1,090,031 277,603 169,824 262,642
Al Dhafra Region 358,873 95,942 35,508 97,583
Source: Abu Dhabi Food Control Authority
Figure 6.1.3 Percentage Distribution of Area Cultivated with Field Crops byRegion, 2016
. Abu Dhabi Region
. Al Ain Region
. Al Dhafra Region
Source: Statistics Centre - Abu Dhabi
10.5%
72.2%
17.3%
Statistical Yearbook of Abu Dhabi 2017 | 239
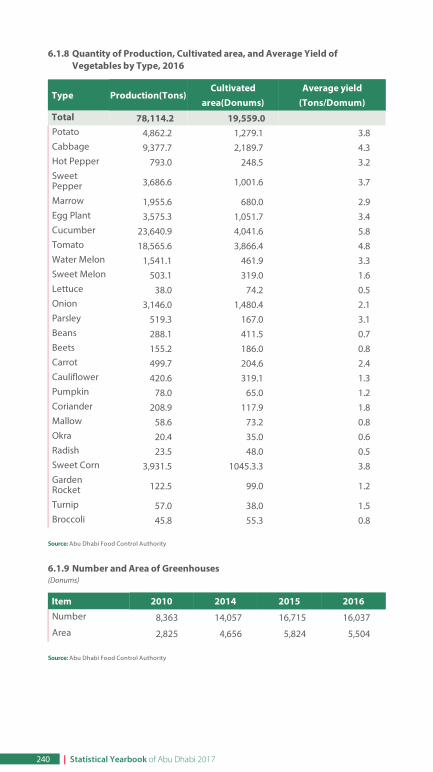
6.1.8 Quantity of Production, Cultivated area, and Average Yield ofVegetables by Type, 2016
Type Production(Tons)Cultivated
area(Donums)Average yield
(Tons/Domum)Total 78,114.2 19,559.0 Potato 4,862.2 1,279.1 3.8 Cabbage 9,377.7 2,189.7 4.3 Hot Pepper 793.0 248.5 3.2 SweetPepper 3,686.6 1,001.6 3.7
Marrow 1,955.6 680.0 2.9 Egg Plant 3,575.3 1,051.7 3.4 Cucumber 23,640.9 4,041.6 5.8 Tomato 18,565.6 3,866.4 4.8 Water Melon 1,541.1 461.9 3.3 Sweet Melon 503.1 319.0 1.6 Lettuce 38.0 74.2 0.5 Onion 3,146.0 1,480.4 2.1 Parsley 519.3 167.0 3.1 Beans 288.1 411.5 0.7 Beets 155.2 186.0 0.8 Carrot 499.7 204.6 2.4 Cauliflower 420.6 319.1 1.3 Pumpkin 78.0 65.0 1.2 Coriander 208.9 117.9 1.8 Mallow 58.6 73.2 0.8 Okra 20.4 35.0 0.6 Radish 23.5 48.0 0.5 Sweet Corn 3,931.5 1045.3.3 3.8 GardenRocket 122.5 99.0 1.2
Turnip 57.0 38.0 1.5 Broccoli 45.8 55.3 0.8
Source: Abu Dhabi Food Control Authority
6.1.9 Number and Area of Greenhouses(Donums)
Item 2010 2014 2015 2016Number 8,363 14,057 16,715 16,037
Area 2,825 4,656 5,824 5,504
Source: Abu Dhabi Food Control Authority
240 | Statistical Yearbook of Abu Dhabi 2017
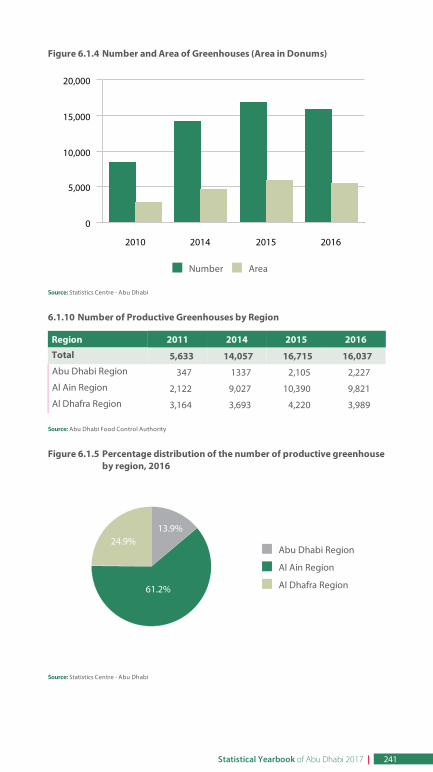
Figure 6.1.4 Number and Area of Greenhouses (Area in Donums)
. Number . Area
Source: Statistics Centre - Abu Dhabi
6.1.10 Number of Productive Greenhouses by Region
Region 2011 2014 2015 2016
Total 5,633 14,057 16,715 16,037 Abu Dhabi Region 347 1337 2,105 2,227
Al Ain Region 2,122 9,027 10,390 9,821
Al Dhafra Region 3,164 3,693 4,220 3,989
Source: Abu Dhabi Food Control Authority
Figure 6.1.5 Percentage distribution of the number of productive greenhouseby region, 2016
. Abu Dhabi Region
. Al Ain Region
. Al Dhafra Region
Source: Statistics Centre - Abu Dhabi
2010 2014 2015 2016
0
5,000
10,000
15,000
20,000
13.9%
61.2%
24.9%
Statistical Yearbook of Abu Dhabi 2017 | 241
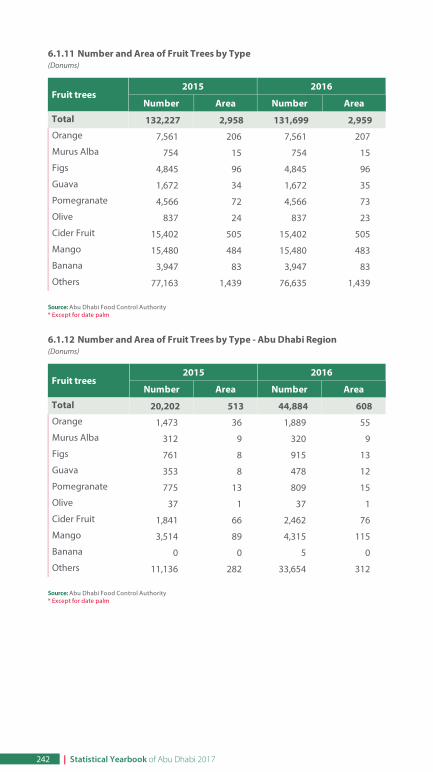
6.1.11 Number and Area of Fruit Trees by Type(Donums)
Fruit trees2015 2016
Number Area Number Area
Total 132,227 2,958 131,699 2,959 Orange 7,561 206 7,561 207
Murus Alba 754 15 754 15
Figs 4,845 96 4,845 96
Guava 1,672 34 1,672 35
Pomegranate 4,566 72 4,566 73
Olive 837 24 837 23
Cider Fruit 15,402 505 15,402 505
Mango 15,480 484 15,480 483
Banana 3,947 83 3,947 83
Others 77,163 1,439 76,635 1,439
Source: Abu Dhabi Food Control Authority* Except for date palm
6.1.12 Number and Area of Fruit Trees by Type - Abu Dhabi Region(Donums)
Fruit trees2015 2016
Number Area Number Area
Total 20,202 513 44,884 608 Orange 1,473 36 1,889 55
Murus Alba 312 9 320 9
Figs 761 8 915 13
Guava 353 8 478 12
Pomegranate 775 13 809 15
Olive 37 1 37 1
Cider Fruit 1,841 66 2,462 76
Mango 3,514 89 4,315 115
Banana 0 0 5 0
Others 11,136 282 33,654 312
Source: Abu Dhabi Food Control Authority* Except for date palm
242 | Statistical Yearbook of Abu Dhabi 2017
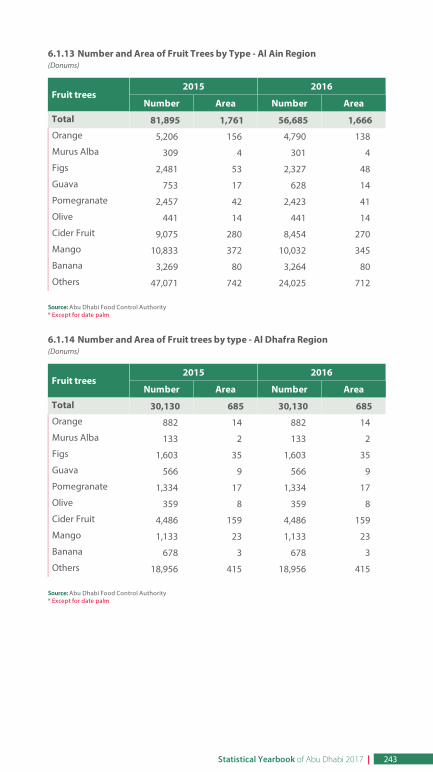
6.1.13 Number and Area of Fruit Trees by Type - Al Ain Region(Donums)
Fruit trees2015 2016
Number Area Number Area
Total 81,895 1,761 56,685 1,666 Orange 5,206 156 4,790 138
Murus Alba 309 4 301 4
Figs 2,481 53 2,327 48
Guava 753 17 628 14
Pomegranate 2,457 42 2,423 41
Olive 441 14 441 14
Cider Fruit 9,075 280 8,454 270
Mango 10,833 372 10,032 345
Banana 3,269 80 3,264 80
Others 47,071 742 24,025 712
Source: Abu Dhabi Food Control Authority* Except for date palm
6.1.14 Number and Area of Fruit trees by type - Al Dhafra Region(Donums)
Fruit trees2015 2016
Number Area Number Area
Total 30,130 685 30,130 685 Orange 882 14 882 14
Murus Alba 133 2 133 2
Figs 1,603 35 1,603 35
Guava 566 9 566 9
Pomegranate 1,334 17 1,334 17
Olive 359 8 359 8
Cider Fruit 4,486 159 4,486 159
Mango 1,133 23 1,133 23
Banana 678 3 678 3
Others 18,956 415 18,956 415
Source: Abu Dhabi Food Control Authority* Except for date palm
Statistical Yearbook of Abu Dhabi 2017 | 243
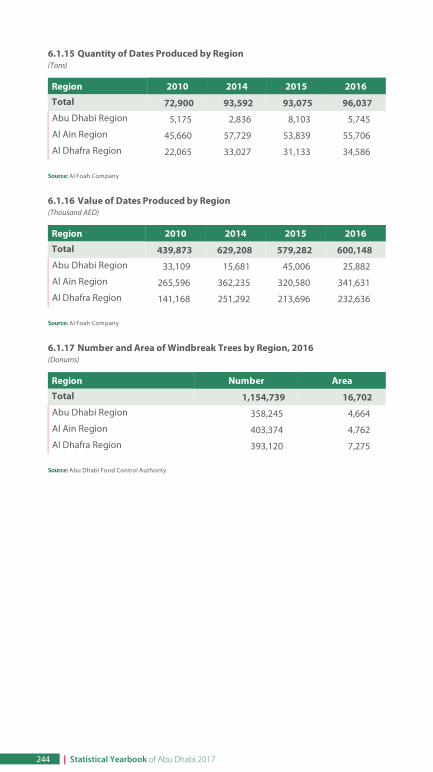
6.1.15 Quantity of Dates Produced by Region(Tons)
Region 2010 2014 2015 2016
Total 72,900 93,592 93,075 96,037 Abu Dhabi Region 5,175 2,836 8,103 5,745
Al Ain Region 45,660 57,729 53,839 55,706
Al Dhafra Region 22,065 33,027 31,133 34,586
Source: Al Foah Company
6.1.16 Value of Dates Produced by Region(Thousand AED)
Region 2010 2014 2015 2016
Total 439,873 629,208 579,282 600,148 Abu Dhabi Region 33,109 15,681 45,006 25,882
Al Ain Region 265,596 362,235 320,580 341,631
Al Dhafra Region 141,168 251,292 213,696 232,636
Source: Al Foah Company
6.1.17 Number and Area of Windbreak Trees by Region, 2016(Donums)
Region Number Area
Total 1,154,739 16,702 Abu Dhabi Region 358,245 4,664
Al Ain Region 403,374 4,762
Al Dhafra Region 393,120 7,275
Source: Abu Dhabi Food Control Authority
244 | Statistical Yearbook of Abu Dhabi 2017
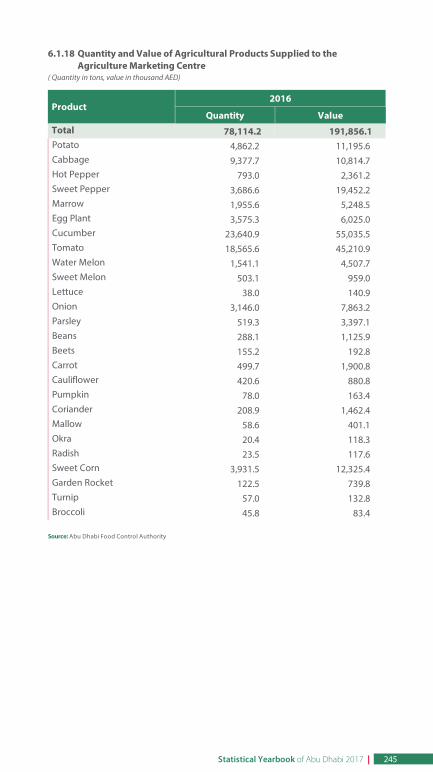
6.1.18 Quantity and Value of Agricultural Products Supplied to theAgriculture Marketing Centre
( Quantity in tons, value in thousand AED)
Product2016
Quantity ValueTotal 78,114.2 191,856.1 Potato 4,862.2 11,195.6 Cabbage 9,377.7 10,814.7 Hot Pepper 793.0 2,361.2 Sweet Pepper 3,686.6 19,452.2 Marrow 1,955.6 5,248.5 Egg Plant 3,575.3 6,025.0 Cucumber 23,640.9 55,035.5 Tomato 18,565.6 45,210.9 Water Melon 1,541.1 4,507.7 Sweet Melon 503.1 959.0 Lettuce 38.0 140.9 Onion 3,146.0 7,863.2 Parsley 519.3 3,397.1 Beans 288.1 1,125.9 Beets 155.2 192.8 Carrot 499.7 1,900.8 Cauliflower 420.6 880.8 Pumpkin 78.0 163.4 Coriander 208.9 1,462.4 Mallow 58.6 401.1 Okra 20.4 118.3 Radish 23.5 117.6 Sweet Corn 3,931.5 12,325.4 Garden Rocket 122.5 739.8 Turnip 57.0 132.8 Broccoli 45.8 83.4
Source: Abu Dhabi Food Control Authority
Statistical Yearbook of Abu Dhabi 2017 | 245
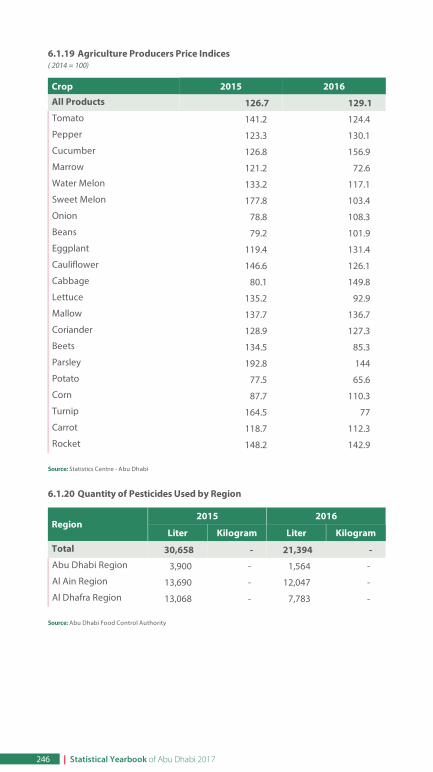
6.1.19 Agriculture Producers Price Indices( 2014 = 100)
Crop 2015 2016
All Products 126.7 129.1 Tomato 141.2 124.4
Pepper 123.3 130.1
Cucumber 126.8 156.9
Marrow 121.2 72.6
Water Melon 133.2 117.1
Sweet Melon 177.8 103.4
Onion 78.8 108.3
Beans 79.2 101.9
Eggplant 119.4 131.4
Cauliflower 146.6 126.1
Cabbage 80.1 149.8
Lettuce 135.2 92.9
Mallow 137.7 136.7
Coriander 128.9 127.3
Beets 134.5 85.3
Parsley 192.8 144
Potato 77.5 65.6
Corn 87.7 110.3
Turnip 164.5 77
Carrot 118.7 112.3
Rocket 148.2 142.9
Source: Statistics Centre - Abu Dhabi
6.1.20 Quantity of Pesticides Used by Region
Region2015 2016
Liter Kilogram Liter Kilogram
Total 30,658 - 21,394 - Abu Dhabi Region 3,900 - 1,564 -
Al Ain Region 13,690 - 12,047 -
Al Dhafra Region 13,068 - 7,783 -
Source: Abu Dhabi Food Control Authority
246 | Statistical Yearbook of Abu Dhabi 2017
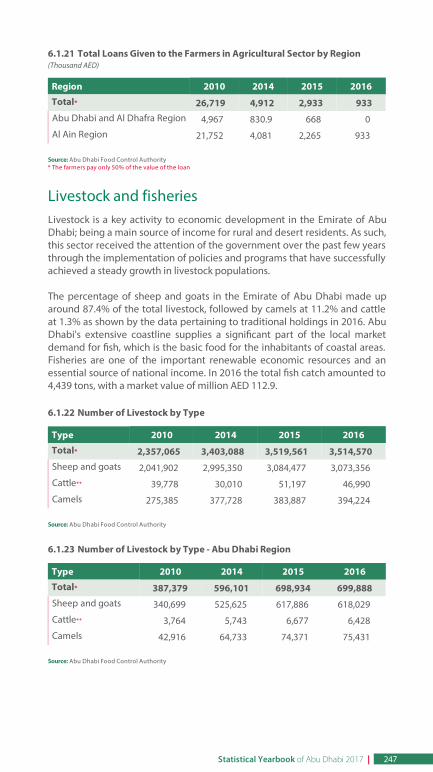
6.1.21 Total Loans Given to the Farmers in Agricultural Sector by Region(Thousand AED)
Region 2010 2014 2015 2016
Total* 26,719 4,912 2,933 933 Abu Dhabi and Al Dhafra Region 4,967 830.9 668 0
Al Ain Region 21,752 4,081 2,265 933
Source: Abu Dhabi Food Control Authority* The farmers pay only 50% of the value of the loan
Livestock and fisheriesLivestock is a key activity to economic development in the Emirate of AbuDhabi; being a main source of income for rural and desert residents. As such,this sector received the attention of the government over the past few yearsthrough the implementation of policies and programs that have successfullyachieved a steady growth in livestock populations.
The percentage of sheep and goats in the Emirate of Abu Dhabi made uparound 87.4% of the total livestock, followed by camels at 11.2% and cattleat 1.3% as shown by the data pertaining to traditional holdings in 2016. AbuDhabi's extensive coastline supplies a signi cant part of the local marketdemand for sh, which is the basic food for the inhabitants of coastal areas.Fisheries are one of the important renewable economic resources and anessential source of national income. In 2016 the total sh catch amounted to4,439 tons, with a market value of million AED 112.9.
6.1.22 Number of Livestock by Type
Type 2010 2014 2015 2016
Total* 2,357,065 3,403,088 3,519,561 3,514,570 Sheep and goats 2,041,902 2,995,350 3,084,477 3,073,356
Cattle** 39,778 30,010 51,197 46,990
Camels 275,385 377,728 383,887 394,224
Source: Abu Dhabi Food Control Authority
6.1.23 Number of Livestock by Type - Abu Dhabi Region
Type 2010 2014 2015 2016
Total* 387,379 596,101 698,934 699,888 Sheep and goats 340,699 525,625 617,886 618,029
Cattle** 3,764 5,743 6,677 6,428
Camels 42,916 64,733 74,371 75,431
Source: Abu Dhabi Food Control Authority
Statistical Yearbook of Abu Dhabi 2017 | 247
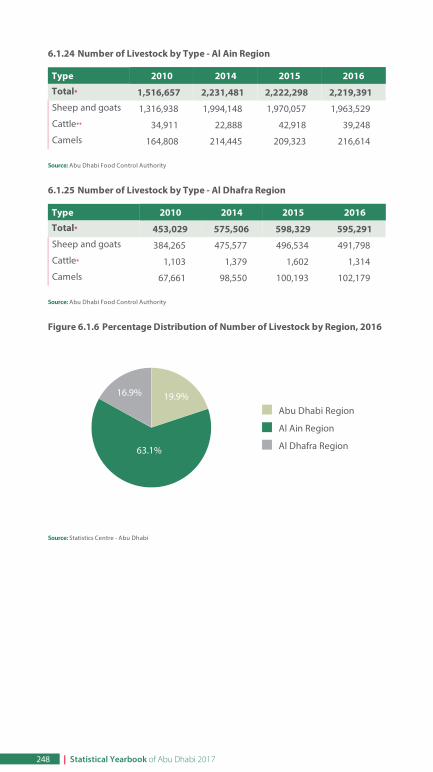
6.1.24 Number of Livestock by Type - Al Ain Region
Type 2010 2014 2015 2016
Total* 1,516,657 2,231,481 2,222,298 2,219,391 Sheep and goats 1,316,938 1,994,148 1,970,057 1,963,529
Cattle** 34,911 22,888 42,918 39,248
Camels 164,808 214,445 209,323 216,614
Source: Abu Dhabi Food Control Authority
6.1.25 Number of Livestock by Type - Al Dhafra Region
Type 2010 2014 2015 2016
Total* 453,029 575,506 598,329 595,291 Sheep and goats 384,265 475,577 496,534 491,798
Cattle* 1,103 1,379 1,602 1,314
Camels 67,661 98,550 100,193 102,179
Source: Abu Dhabi Food Control Authority
Figure 6.1.6 Percentage Distribution of Number of Livestock by Region, 2016
. Abu Dhabi Region
. Al Ain Region
. Al Dhafra Region
Source: Statistics Centre - Abu Dhabi
19.9%
63.1%
16.9%
248 | Statistical Yearbook of Abu Dhabi 2017
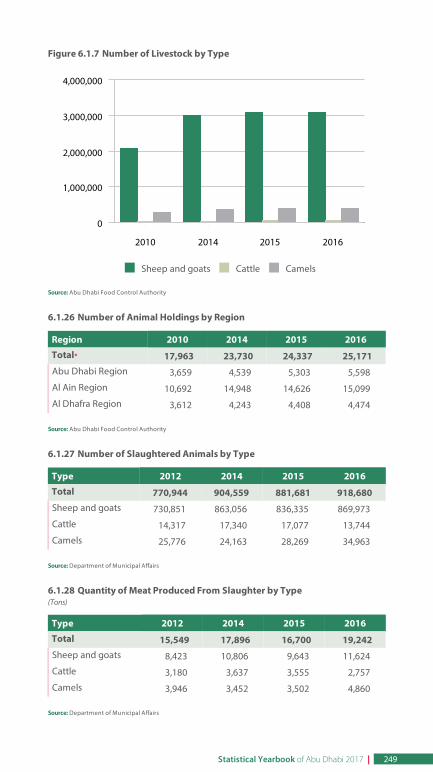
Figure 6.1.7 Number of Livestock by Type
. Sheep and goats . Cattle . Camels
Source: Abu Dhabi Food Control Authority
6.1.26 Number of Animal Holdings by Region
Region 2010 2014 2015 2016
Total* 17,963 23,730 24,337 25,171 Abu Dhabi Region 3,659 4,539 5,303 5,598
Al Ain Region 10,692 14,948 14,626 15,099
Al Dhafra Region 3,612 4,243 4,408 4,474
Source: Abu Dhabi Food Control Authority
6.1.27 Number of Slaughtered Animals by Type
Type 2012 2014 2015 2016
Total 770,944 904,559 881,681 918,680 Sheep and goats 730,851 863,056 836,335 869,973
Cattle 14,317 17,340 17,077 13,744
Camels 25,776 24,163 28,269 34,963
Source: Department of Municipal Affairs
6.1.28 Quantity of Meat Produced From Slaughter by Type(Tons)
Type 2012 2014 2015 2016
Total 15,549 17,896 16,700 19,242 Sheep and goats 8,423 10,806 9,643 11,624
Cattle 3,180 3,637 3,555 2,757
Camels 3,946 3,452 3,502 4,860
Source: Department of Municipal Affairs
2010 2014 2015 2016
0
1,000,000
2,000,000
3,000,000
4,000,000
Statistical Yearbook of Abu Dhabi 2017 | 249
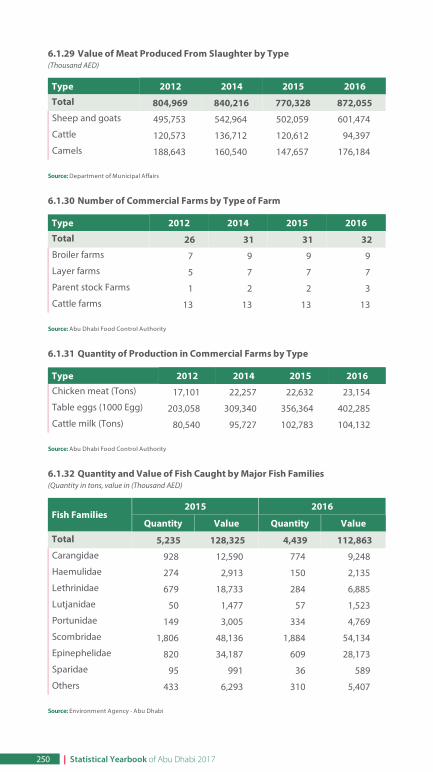
6.1.29 Value of Meat Produced From Slaughter by Type(Thousand AED)
Type 2012 2014 2015 2016
Total 804,969 840,216 770,328 872,055 Sheep and goats 495,753 542,964 502,059 601,474
Cattle 120,573 136,712 120,612 94,397
Camels 188,643 160,540 147,657 176,184
Source: Department of Municipal Affairs
6.1.30 Number of Commercial Farms by Type of Farm
Type 2012 2014 2015 2016
Total 26 31 31 32 Broiler farms 7 9 9 9
Layer farms 5 7 7 7
Parent stock Farms 1 2 2 3
Cattle farms 13 13 13 13
Source: Abu Dhabi Food Control Authority
6.1.31 Quantity of Production in Commercial Farms by Type
Type 2012 2014 2015 2016Chicken meat (Tons) 17,101 22,257 22,632 23,154
Table eggs (1000 Egg) 203,058 309,340 356,364 402,285
Cattle milk (Tons) 80,540 95,727 102,783 104,132
Source: Abu Dhabi Food Control Authority
6.1.32 Quantity and Value of Fish Caught by Major Fish Families(Quantity in tons, value in (Thousand AED)
Fish Families2015 2016
Quantity Value Quantity Value
Total 5,235 128,325 4,439 112,863 Carangidae 928 12,590 774 9,248
Haemulidae 274 2,913 150 2,135
Lethrinidae 679 18,733 284 6,885
Lutjanidae 50 1,477 57 1,523
Portunidae 149 3,005 334 4,769
Scombridae 1,806 48,136 1,884 54,134
Epinephelidae 820 34,187 609 28,173
Sparidae 95 991 36 589
Others 433 6,293 310 5,407
Source: Environment Agency - Abu Dhabi
250 | Statistical Yearbook of Abu Dhabi 2017
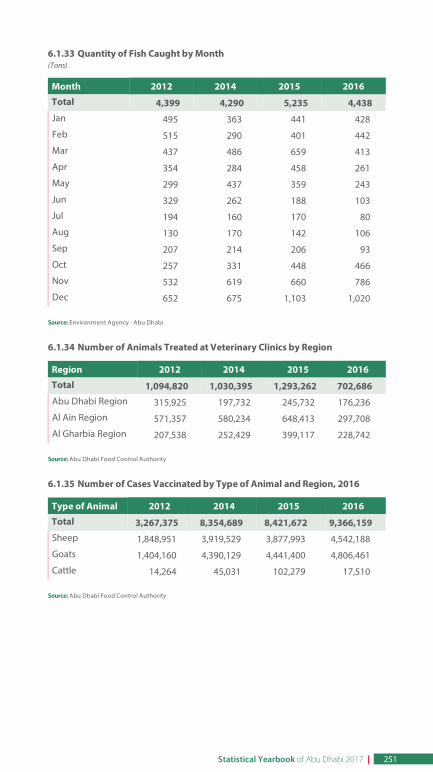
6.1.33 Quantity of Fish Caught by Month(Tons)
Month 2012 2014 2015 2016
Total 4,399 4,290 5,235 4,438 Jan 495 363 441 428
Feb 515 290 401 442
Mar 437 486 659 413
Apr 354 284 458 261
May 299 437 359 243
Jun 329 262 188 103
Jul 194 160 170 80
Aug 130 170 142 106
Sep 207 214 206 93
Oct 257 331 448 466
Nov 532 619 660 786
Dec 652 675 1,103 1,020
Source: Environment Agency - Abu Dhabi
6.1.34 Number of Animals Treated at Veterinary Clinics by Region
Region 2012 2014 2015 2016
Total 1,094,820 1,030,395 1,293,262 702,686 Abu Dhabi Region 315,925 197,732 245,732 176,236
Al Ain Region 571,357 580,234 648,413 297,708
Al Gharbia Region 207,538 252,429 399,117 228,742
Source: Abu Dhabi Food Control Authority
6.1.35 Number of Cases Vaccinated by Type of Animal and Region, 2016
Type of Animal 2012 2014 2015 2016
Total 3,267,375 8,354,689 8,421,672 9,366,159 Sheep 1,848,951 3,919,529 3,877,993 4,542,188
Goats 1,404,160 4,390,129 4,441,400 4,806,461
Cattle 14,264 45,031 102,279 17,510
Source: Abu Dhabi Food Control Authority
Statistical Yearbook of Abu Dhabi 2017 | 251
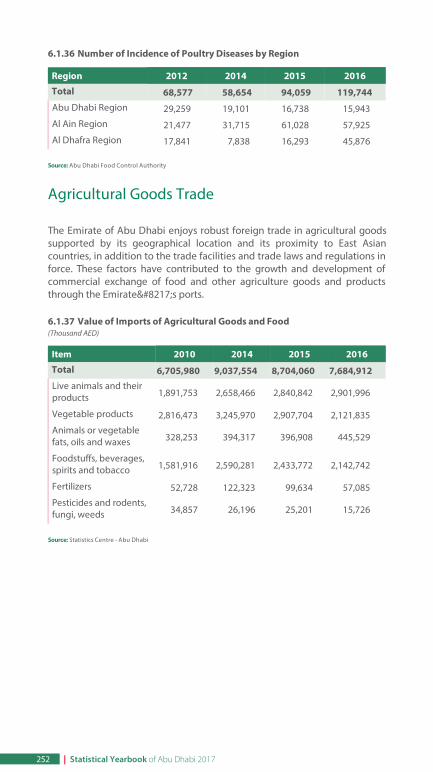
6.1.36 Number of Incidence of Poultry Diseases by Region
Region 2012 2014 2015 2016
Total 68,577 58,654 94,059 119,744 Abu Dhabi Region 29,259 19,101 16,738 15,943
Al Ain Region 21,477 31,715 61,028 57,925
Al Dhafra Region 17,841 7,838 16,293 45,876
Source: Abu Dhabi Food Control Authority
Agricultural Goods Trade
The Emirate of Abu Dhabi enjoys robust foreign trade in agricultural goodssupported by its geographical location and its proximity to East Asiancountries, in addition to the trade facilities and trade laws and regulations inforce. These factors have contributed to the growth and development ofcommercial exchange of food and other agriculture goods and productsthrough the Emirate’s ports.
6.1.37 Value of Imports of Agricultural Goods and Food(Thousand AED)
Item 2010 2014 2015 2016
Total 6,705,980 9,037,554 8,704,060 7,684,912 Live animals and theirproducts 1,891,753 2,658,466 2,840,842 2,901,996
Vegetable products 2,816,473 3,245,970 2,907,704 2,121,835
Animals or vegetablefats, oils and waxes 328,253 394,317 396,908 445,529
Foodstuffs, beverages,spirits and tobacco 1,581,916 2,590,281 2,433,772 2,142,742
Fertilizers 52,728 122,323 99,634 57,085
Pesticides and rodents,fungi, weeds 34,857 26,196 25,201 15,726
Source: Statistics Centre - Abu Dhabi
252 | Statistical Yearbook of Abu Dhabi 2017
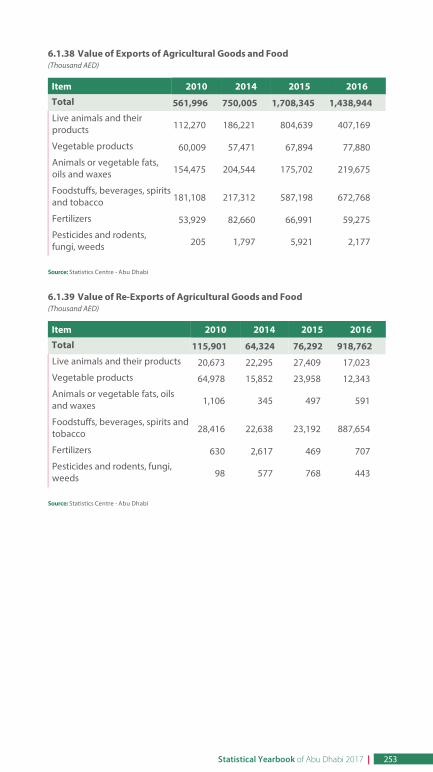
6.1.38 Value of Exports of Agricultural Goods and Food(Thousand AED)
Item 2010 2014 2015 2016
Total 561,996 750,005 1,708,345 1,438,944 Live animals and theirproducts 112,270 186,221 804,639 407,169
Vegetable products 60,009 57,471 67,894 77,880
Animals or vegetable fats,oils and waxes 154,475 204,544 175,702 219,675
Foodstuffs, beverages, spiritsand tobacco 181,108 217,312 587,198 672,768
Fertilizers 53,929 82,660 66,991 59,275
Pesticides and rodents,fungi, weeds 205 1,797 5,921 2,177
Source: Statistics Centre - Abu Dhabi
6.1.39 Value of Re-Exports of Agricultural Goods and Food(Thousand AED)
Item 2010 2014 2015 2016
Total 115,901 64,324 76,292 918,762 Live animals and their products 20,673 22,295 27,409 17,023
Vegetable products 64,978 15,852 23,958 12,343
Animals or vegetable fats, oilsand waxes 1,106 345 497 591
Foodstuffs, beverages, spirits andtobacco 28,416 22,638 23,192 887,654
Fertilizers 630 2,617 469 707
Pesticides and rodents, fungi,weeds 98 577 768 443
Source: Statistics Centre - Abu Dhabi
Statistical Yearbook of Abu Dhabi 2017 | 253
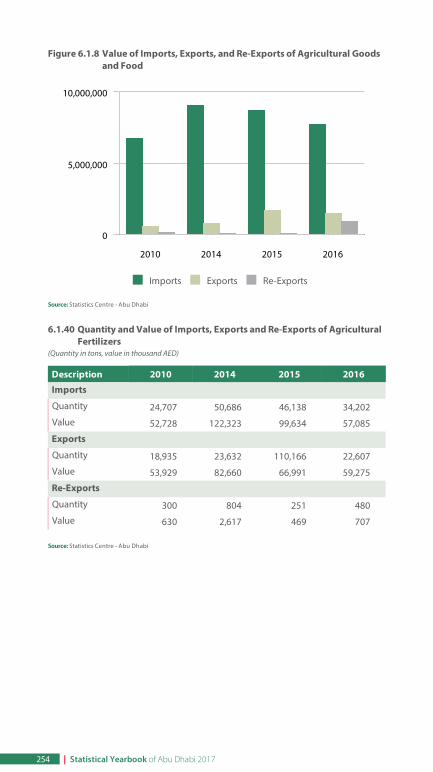
Figure 6.1.8 Value of Imports, Exports, and Re-Exports of Agricultural Goodsand Food
. Imports . Exports . Re-Exports
Source: Statistics Centre - Abu Dhabi
6.1.40 Quantity and Value of Imports, Exports and Re-Exports of AgriculturalFertilizers
(Quantity in tons, value in thousand AED)
Description 2010 2014 2015 2016
Imports
Quantity 24,707 50,686 46,138 34,202
Value 52,728 122,323 99,634 57,085
Exports
Quantity 18,935 23,632 110,166 22,607
Value 53,929 82,660 66,991 59,275
Re-Exports
Quantity 300 804 251 480
Value 630 2,617 469 707
Source: Statistics Centre - Abu Dhabi
2010 2014 2015 2016
0
5,000,000
10,000,000
254 | Statistical Yearbook of Abu Dhabi 2017
6.2. EnvironmentIn light of the rapid economic and urban development and parallelpopulation growth, environment protection acquires a special signi cancein the agenda and strategic vision of Abu Dhabi Government as it becomesmore profoundly recognized as an indispensable requirement if asustainable, balanced and comprehensive social development is to beachieved.
Large-scale landscaping and tree plantation attest to the formidable effortbeing made and the achievements attained in this regard. Although theEmirate of Abu Dhabi is one of the largest exporters of oil worldwide, AbuDhabi was fast to adopt clean, renewable energy sources, emerging as oneof the countries at the forefront of the move towards reducing reliance onconventional energy sources, the underlying cause of increasing carbondioxide emissions, global warming and climate change. The attention paidto environmental issues by the Emirate of Abu Dhabi has raised theemirate's international pro le, especially in the elds of nature conservation,deserti cation control, protection of land and sea wildlife, establishment ofnature reserves and international promotion of research to preserve variousspecies of endangered animals and birds.
As a result, there is an increasing interest on the part of SCAD in providingenvironmental statistics covering various areas such as climate, air quality,pollutant emissions, water statistics, health and occupational safety andwaste statistics. These statistics support policy makers to achieve asustainable environment in the Emirate of Abu Dhabi.
In 2016, the average minimum temperature of Abu Dhabi Emirate was 22.6C°, while the average maximum temperature was 34.7 C°. Average annualrainfall decreased from 87.4 mm in 2015 to 60.7 mm in 2016. Averageminimum relative humidity was 29% while average maximum relativehumidity was 77%. Average atmospheric pressure was 1,010 hPA. Themaximum daily solar radiation exceeded 9,560 Watt /m²/h during summermonths.
Regarding air quality, the concentrations of air pollutants in 2016 werewithin their permissible limits. Annual average concentration of particulatematter, with a diameter of 10 micron, ranged between 90.8 and 155 mcg/m³in the urban areas of the Emirate.
The quantity of treated wastewater in 2016 was 325.9 MCM, of which AbuDhabi region accounted for approximately 76%, where Al Dhafra region didnot exceed 4% of the total.
In 2015, more than 1800 people were diagnosed with transmitted diseasesthrough food and food poisoning, caused by eating food or beveragescontaminated with bacteria or viruses. People diagnosed with foodpoisoning accounted for the largest percentage 43% of the total number ofpatients, followed by Typhoid fever at 9.7%. Regarding waste statistics, theEmirate of Abu Dhabi generated a daily average up to26 thousand tons ofwaste in 2016, which is up to approximately 9.5 million tons of non-hazardous waste annually. Construction and demolition waste accounted forthe largest percentage 47% of the total amount of waste generated in the
Statistical Yearbook of Abu Dhabi 2017 | 255
Emirate.
Location and AreaThe Emirate of Abu Dhabi is located in the far west and southwest part of theUnited Arab Emirates along the southern cost of the Arabian Gulf betweenlatitudes 22°40' and around 25° north and longitudes 51° and around 56°east. The total area of the Emirate is 67,340 square kilometers, occupyingabout 87% of the total area of the UAE, excluding islands. The territorialwaters of the Emirate embrace about 200 islands off its 700 kilometerscoastline.
The topography of the Emirate is dominated by low-lying sandy terraindotted with sand dunes exceeding 300 meters in height in some areassouthwards. The eastern part of the Emirate borders the western fringes ofAl-Hajar Mountains.
Hafeet Mountain, Abu Dhabi's highest elevation, rising about 1,300 meters,is located south of Al Ain city.
6.2.1 Area of the United Arab Emirates *
Emirate Sq. mile Sq. kilometre %
Total 30,000 77,700 100 Abu Dhabi Region 26,000 67,340 86.7
Dubai 1,500 3,885 5.0
Sharjah 1,000 2,590 3.3
Ras Al-Khaimah 650.2 1,684 2.2
Fujairah 449.8 1,165 1.5
Umm Al Qiwain 300.0 777.0 1.0
Ajman 100 259.0 0.3
Source: Ministry of Economy* Excluding islands
256 | Statistical Yearbook of Abu Dhabi 2017
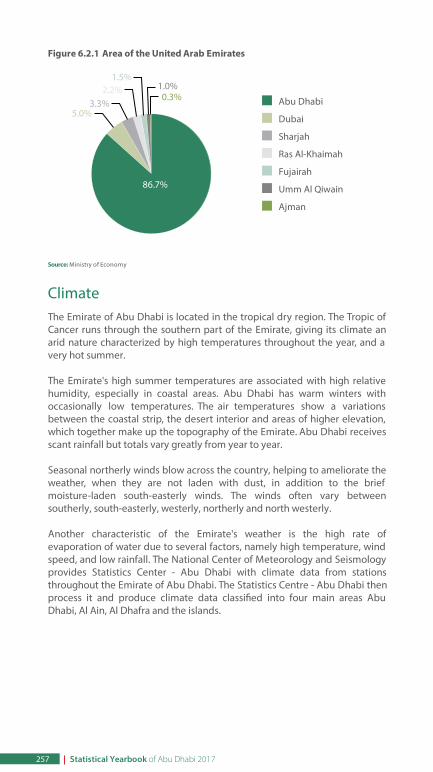
257
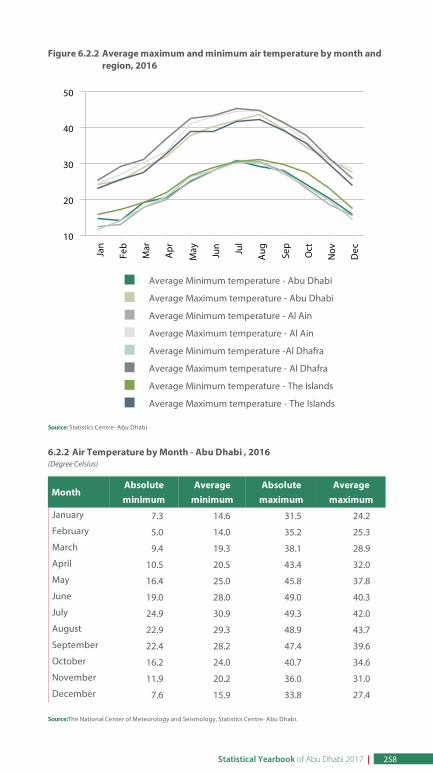
258
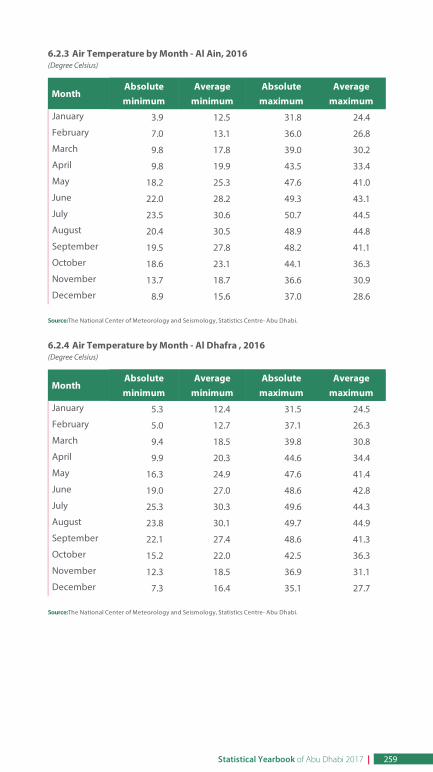
6.2.3 Air Temperature by Month - Al Ain, 2016(Degree Celsius)
MonthAbsoluteminimum
Averageminimum
Absolutemaximum
Averagemaximum
January 3.9 12.5 31.8 24.4
February 7.0 13.1 36.0 26.8
March 9.8 17.8 39.0 30.2
April 9.8 19.9 43.5 33.4
May 18.2 25.3 47.6 41.0
June 22.0 28.2 49.3 43.1
July 23.5 30.6 50.7 44.5
August 20.4 30.5 48.9 44.8
September 19.5 27.8 48.2 41.1
October 18.6 23.1 44.1 36.3
November 13.7 18.7 36.6 30.9
December 8.9 15.6 37.0 28.6
Source:The National Center of Meteorology and Seismology, Statistics Centre- Abu Dhabi.
6.2.4 Air Temperature by Month - Al Dhafra , 2016(Degree Celsius)
MonthAbsoluteminimum
Averageminimum
Absolutemaximum
Averagemaximum
January 5.3 12.4 31.5 24.5
February 5.0 12.7 37.1 26.3
March 9.4 18.5 39.8 30.8
April 9.9 20.3 44.6 34.4
May 16.3 24.9 47.6 41.4
June 19.0 27.0 48.6 42.8
July 25.3 30.3 49.6 44.3
August 23.8 30.1 49.7 44.9
September 22.1 27.4 48.6 41.3
October 15.2 22.0 42.5 36.3
November 12.3 18.5 36.9 31.1
December 7.3 16.4 35.1 27.7
Source:The National Center of Meteorology and Seismology, Statistics Centre- Abu Dhabi.
Statistical Yearbook of Abu Dhabi 2017 | 259
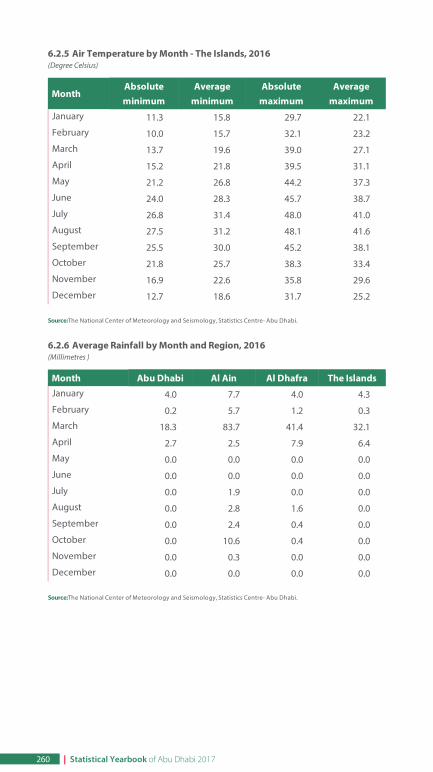
6.2.5 Air Temperature by Month - The Islands, 2016(Degree Celsius)
MonthAbsoluteminimum
Averageminimum
Absolutemaximum
Averagemaximum
January 11.3 15.8 29.7 22.1
February 10.0 15.7 32.1 23.2
March 13.7 19.6 39.0 27.1
April 15.2 21.8 39.5 31.1
May 21.2 26.8 44.2 37.3
June 24.0 28.3 45.7 38.7
July 26.8 31.4 48.0 41.0
August 27.5 31.2 48.1 41.6
September 25.5 30.0 45.2 38.1
October 21.8 25.7 38.3 33.4
November 16.9 22.6 35.8 29.6
December 12.7 18.6 31.7 25.2
Source:The National Center of Meteorology and Seismology, Statistics Centre- Abu Dhabi.
6.2.6 Average Rainfall by Month and Region, 2016(Millimetres )
Month Abu Dhabi Al Ain Al Dhafra The IslandsJanuary 4.0 7.7 4.0 4.3
February 0.2 5.7 1.2 0.3
March 18.3 83.7 41.4 32.1
April 2.7 2.5 7.9 6.4
May 0.0 0.0 0.0 0.0
June 0.0 0.0 0.0 0.0
July 0.0 1.9 0.0 0.0
August 0.0 2.8 1.6 0.0
September 0.0 2.4 0.4 0.0
October 0.0 10.6 0.4 0.0
November 0.0 0.3 0.0 0.0
December 0.0 0.0 0.0 0.0
Source:The National Center of Meteorology and Seismology, Statistics Centre- Abu Dhabi.
260 | Statistical Yearbook of Abu Dhabi 2017
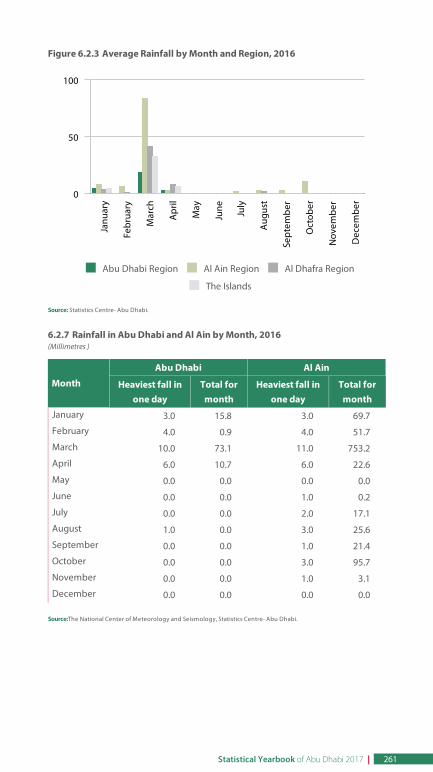
Figure 6.2.3 Average Rainfall by Month and Region, 2016
. Abu Dhabi Region . Al Ain Region . Al Dhafra Region
. The Islands
Source: Statistics Centre- Abu Dhabi.
6.2.7 Rainfall in Abu Dhabi and Al Ain by Month, 2016(Millimetres )
Month
Abu Dhabi Al Ain
Heaviest fall inone day
Total formonth
Heaviest fall inone day
Total formonth
January 3.0 15.8 3.0 69.7
February 4.0 0.9 4.0 51.7
March 10.0 73.1 11.0 753.2
April 6.0 10.7 6.0 22.6
May 0.0 0.0 0.0 0.0
June 0.0 0.0 1.0 0.2
July 0.0 0.0 2.0 17.1
August 1.0 0.0 3.0 25.6
September 0.0 0.0 1.0 21.4
October 0.0 0.0 3.0 95.7
November 0.0 0.0 1.0 3.1
December 0.0 0.0 0.0 0.0
Source:The National Center of Meteorology and Seismology, Statistics Centre- Abu Dhabi.
Janu
ary
Febr
uary
Mar
ch
Apr
il
May
June July
Aug
ust
Sept
embe
r
Oct
ober
Nov
embe
r
Dec
embe
r
0
50
100
Statistical Yearbook of Abu Dhabi 2017 | 261
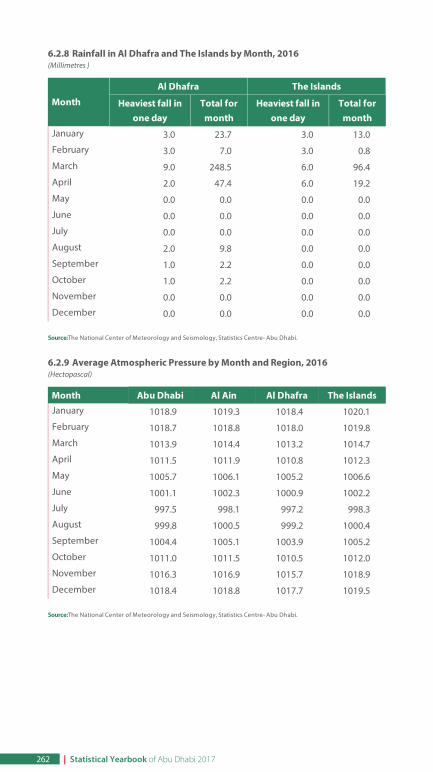
6.2.8 Rainfall in Al Dhafra and The Islands by Month, 2016(Millimetres )
Month
Al Dhafra The Islands
Heaviest fall inone day
Total formonth
Heaviest fall inone day
Total formonth
January 3.0 23.7 3.0 13.0
February 3.0 7.0 3.0 0.8
March 9.0 248.5 6.0 96.4
April 2.0 47.4 6.0 19.2
May 0.0 0.0 0.0 0.0
June 0.0 0.0 0.0 0.0
July 0.0 0.0 0.0 0.0
August 2.0 9.8 0.0 0.0
September 1.0 2.2 0.0 0.0
October 1.0 2.2 0.0 0.0
November 0.0 0.0 0.0 0.0
December 0.0 0.0 0.0 0.0
Source:The National Center of Meteorology and Seismology, Statistics Centre- Abu Dhabi.
6.2.9 Average Atmospheric Pressure by Month and Region, 2016(Hectopascal)
Month Abu Dhabi Al Ain Al Dhafra The IslandsJanuary 1018.9 1019.3 1018.4 1020.1
February 1018.7 1018.8 1018.0 1019.8
March 1013.9 1014.4 1013.2 1014.7
April 1011.5 1011.9 1010.8 1012.3
May 1005.7 1006.1 1005.2 1006.6
June 1001.1 1002.3 1000.9 1002.2
July 997.5 998.1 997.2 998.3
August 999.8 1000.5 999.2 1000.4
September 1004.4 1005.1 1003.9 1005.2
October 1011.0 1011.5 1010.5 1012.0
November 1016.3 1016.9 1015.7 1018.9
December 1018.4 1018.8 1017.7 1019.5
Source:The National Center of Meteorology and Seismology, Statistics Centre- Abu Dhabi.
262 | Statistical Yearbook of Abu Dhabi 2017
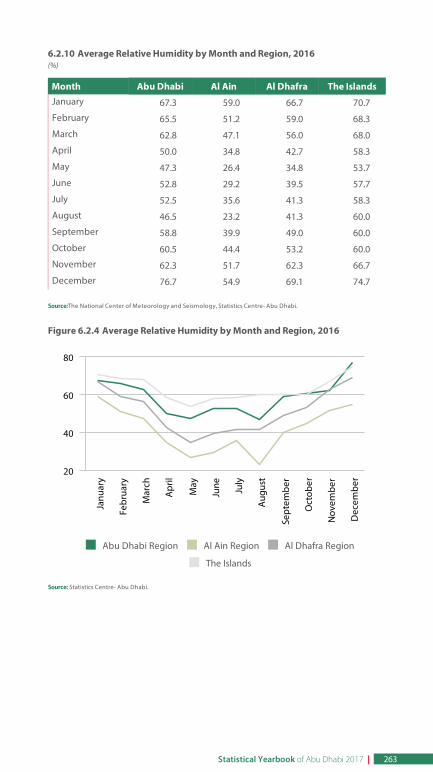
6.2.10 Average Relative Humidity by Month and Region, 2016(%)
Month Abu Dhabi Al Ain Al Dhafra The IslandsJanuary 67.3 59.0 66.7 70.7
February 65.5 51.2 59.0 68.3
March 62.8 47.1 56.0 68.0
April 50.0 34.8 42.7 58.3
May 47.3 26.4 34.8 53.7
June 52.8 29.2 39.5 57.7
July 52.5 35.6 41.3 58.3
August 46.5 23.2 41.3 60.0
September 58.8 39.9 49.0 60.0
October 60.5 44.4 53.2 60.0
November 62.3 51.7 62.3 66.7
December 76.7 54.9 69.1 74.7
Source:The National Center of Meteorology and Seismology, Statistics Centre- Abu Dhabi.
Figure 6.2.4 Average Relative Humidity by Month and Region, 2016
. Abu Dhabi Region . Al Ain Region . Al Dhafra Region
. The Islands
Source: Statistics Centre- Abu Dhabi.
Janu
ary
Febr
uary
Mar
ch
Apr
il
May
June July
Aug
ust
Sept
embe
r
Oct
ober
Nov
embe
r
Dec
embe
r
20
40
60
80
Statistical Yearbook of Abu Dhabi 2017 | 263
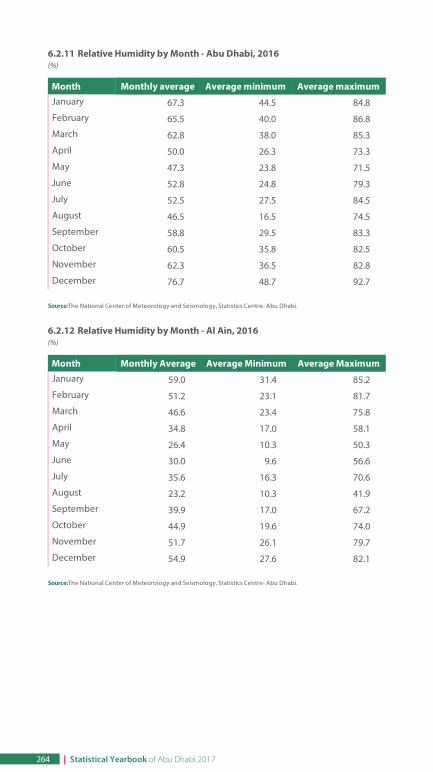
6.2.11 Relative Humidity by Month - Abu Dhabi, 2016(%)
Month Monthly average Average minimum Average maximumJanuary 67.3 44.5 84.8
February 65.5 40.0 86.8
March 62.8 38.0 85.3
April 50.0 26.3 73.3
May 47.3 23.8 71.5
June 52.8 24.8 79.3
July 52.5 27.5 84.5
August 46.5 16.5 74.5
September 58.8 29.5 83.3
October 60.5 35.8 82.5
November 62.3 36.5 82.8
December 76.7 48.7 92.7
Source:The National Center of Meteorology and Seismology, Statistics Centre- Abu Dhabi.
6.2.12 Relative Humidity by Month - Al Ain, 2016(%)
Month Monthly Average Average Minimum Average MaximumJanuary 59.0 31.4 85.2
February 51.2 23.1 81.7
March 46.6 23.4 75.8
April 34.8 17.0 58.1
May 26.4 10.3 50.3
June 30.0 9.6 56.6
July 35.6 16.3 70.6
August 23.2 10.3 41.9
September 39.9 17.0 67.2
October 44.9 19.6 74.0
November 51.7 26.1 79.7
December 54.9 27.6 82.1
Source:The National Center of Meteorology and Seismology, Statistics Centre- Abu Dhabi.
264 | Statistical Yearbook of Abu Dhabi 2017
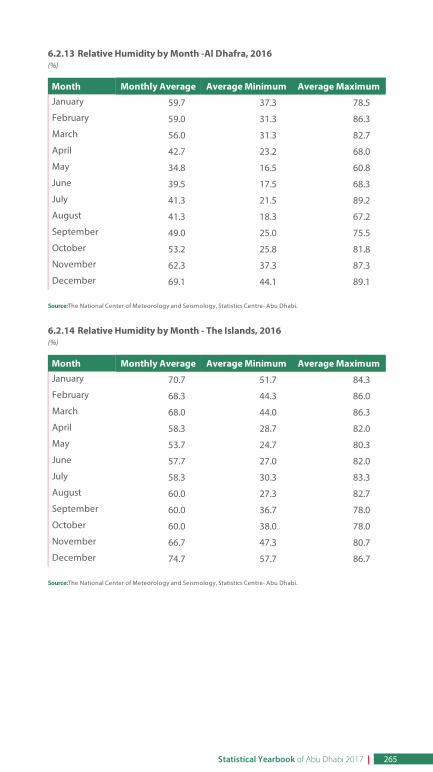
6.2.13 Relative Humidity by Month -Al Dhafra, 2016(%)
Month Monthly Average Average Minimum Average MaximumJanuary 59.7 37.3 78.5
February 59.0 31.3 86.3
March 56.0 31.3 82.7
April 42.7 23.2 68.0
May 34.8 16.5 60.8
June 39.5 17.5 68.3
July 41.3 21.5 89.2
August 41.3 18.3 67.2
September 49.0 25.0 75.5
October 53.2 25.8 81.8
November 62.3 37.3 87.3
December 69.1 44.1 89.1
Source:The National Center of Meteorology and Seismology, Statistics Centre- Abu Dhabi.
6.2.14 Relative Humidity by Month - The Islands, 2016(%)
Month Monthly Average Average Minimum Average MaximumJanuary 70.7 51.7 84.3
February 68.3 44.3 86.0
March 68.0 44.0 86.3
April 58.3 28.7 82.0
May 53.7 24.7 80.3
June 57.7 27.0 82.0
July 58.3 30.3 83.3
August 60.0 27.3 82.7
September 60.0 36.7 78.0
October 60.0 38.0 78.0
November 66.7 47.3 80.7
December 74.7 57.7 86.7
Source:The National Center of Meteorology and Seismology, Statistics Centre- Abu Dhabi.
Statistical Yearbook of Abu Dhabi 2017 | 265
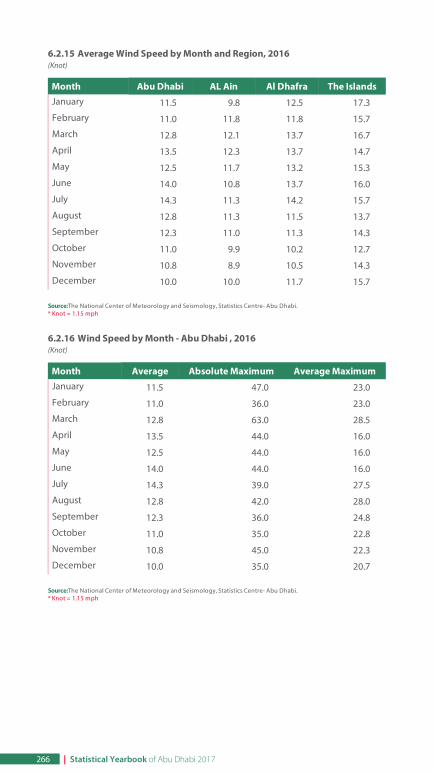
6.2.15 Average Wind Speed by Month and Region, 2016(Knot)
Month Abu Dhabi AL Ain Al Dhafra The IslandsJanuary 11.5 9.8 12.5 17.3
February 11.0 11.8 11.8 15.7
March 12.8 12.1 13.7 16.7
April 13.5 12.3 13.7 14.7
May 12.5 11.7 13.2 15.3
June 14.0 10.8 13.7 16.0
July 14.3 11.3 14.2 15.7
August 12.8 11.3 11.5 13.7
September 12.3 11.0 11.3 14.3
October 11.0 9.9 10.2 12.7
November 10.8 8.9 10.5 14.3
December 10.0 10.0 11.7 15.7
Source:The National Center of Meteorology and Seismology, Statistics Centre- Abu Dhabi.* Knot = 1.15 mph
6.2.16 Wind Speed by Month - Abu Dhabi , 2016(Knot)
Month Average Absolute Maximum Average MaximumJanuary 11.5 47.0 23.0
February 11.0 36.0 23.0
March 12.8 63.0 28.5
April 13.5 44.0 16.0
May 12.5 44.0 16.0
June 14.0 44.0 16.0
July 14.3 39.0 27.5
August 12.8 42.0 28.0
September 12.3 36.0 24.8
October 11.0 35.0 22.8
November 10.8 45.0 22.3
December 10.0 35.0 20.7
Source:The National Center of Meteorology and Seismology, Statistics Centre- Abu Dhabi.* Knot = 1.15 mph
266 | Statistical Yearbook of Abu Dhabi 2017
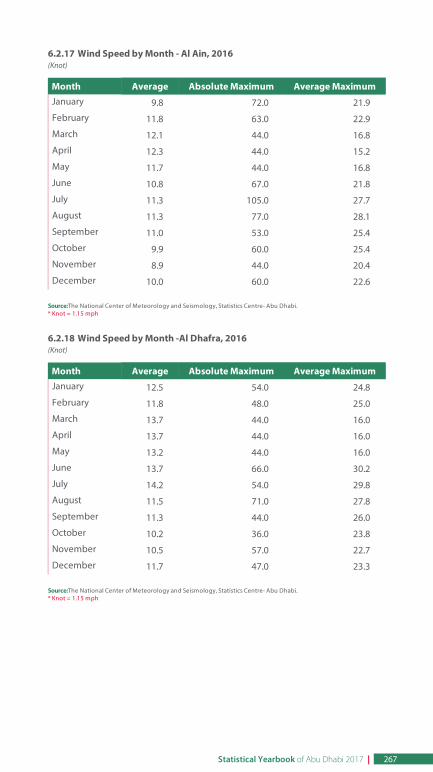
6.2.17 Wind Speed by Month - Al Ain, 2016(Knot)
Month Average Absolute Maximum Average MaximumJanuary 9.8 72.0 21.9
February 11.8 63.0 22.9
March 12.1 44.0 16.8
April 12.3 44.0 15.2
May 11.7 44.0 16.8
June 10.8 67.0 21.8
July 11.3 105.0 27.7
August 11.3 77.0 28.1
September 11.0 53.0 25.4
October 9.9 60.0 25.4
November 8.9 44.0 20.4
December 10.0 60.0 22.6
Source:The National Center of Meteorology and Seismology, Statistics Centre- Abu Dhabi.* Knot = 1.15 mph
6.2.18 Wind Speed by Month -Al Dhafra, 2016(Knot)
Month Average Absolute Maximum Average MaximumJanuary 12.5 54.0 24.8
February 11.8 48.0 25.0
March 13.7 44.0 16.0
April 13.7 44.0 16.0
May 13.2 44.0 16.0
June 13.7 66.0 30.2
July 14.2 54.0 29.8
August 11.5 71.0 27.8
September 11.3 44.0 26.0
October 10.2 36.0 23.8
November 10.5 57.0 22.7
December 11.7 47.0 23.3
Source:The National Center of Meteorology and Seismology, Statistics Centre- Abu Dhabi.* Knot = 1.15 mph
Statistical Yearbook of Abu Dhabi 2017 | 267
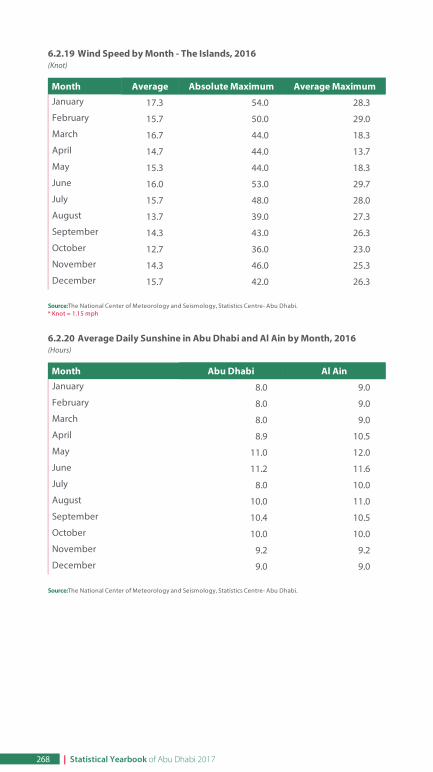
6.2.19 Wind Speed by Month - The Islands, 2016(Knot)
Month Average Absolute Maximum Average MaximumJanuary 17.3 54.0 28.3
February 15.7 50.0 29.0
March 16.7 44.0 18.3
April 14.7 44.0 13.7
May 15.3 44.0 18.3
June 16.0 53.0 29.7
July 15.7 48.0 28.0
August 13.7 39.0 27.3
September 14.3 43.0 26.3
October 12.7 36.0 23.0
November 14.3 46.0 25.3
December 15.7 42.0 26.3
Source:The National Center of Meteorology and Seismology, Statistics Centre- Abu Dhabi.* Knot = 1.15 mph
6.2.20 Average Daily Sunshine in Abu Dhabi and Al Ain by Month, 2016(Hours)
Month Abu Dhabi Al AinJanuary 8.0 9.0
February 8.0 9.0
March 8.0 9.0
April 8.9 10.5
May 11.0 12.0
June 11.2 11.6
July 8.0 10.0
August 10.0 11.0
September 10.4 10.5
October 10.0 10.0
November 9.2 9.2
December 9.0 9.0
Source:The National Center of Meteorology and Seismology, Statistics Centre- Abu Dhabi.
268 | Statistical Yearbook of Abu Dhabi 2017
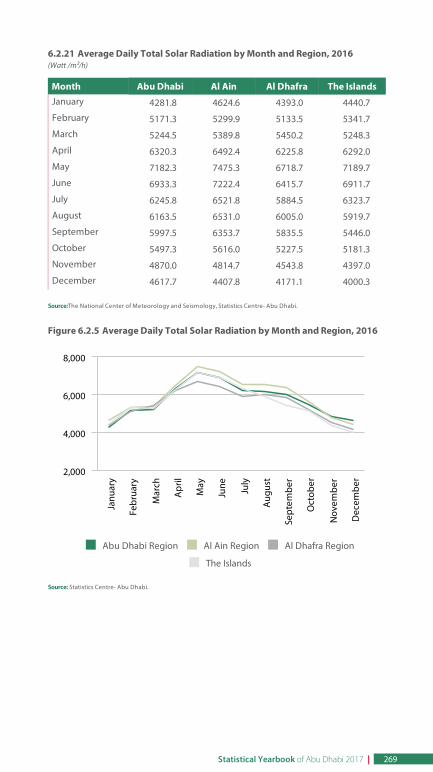
6.2.21 Average Daily Total Solar Radiation by Month and Region, 2016(Watt /m²/h)
Month Abu Dhabi Al Ain Al Dhafra The IslandsJanuary 4281.8 4624.6 4393.0 4440.7
February 5171.3 5299.9 5133.5 5341.7
March 5244.5 5389.8 5450.2 5248.3
April 6320.3 6492.4 6225.8 6292.0
May 7182.3 7475.3 6718.7 7189.7
June 6933.3 7222.4 6415.7 6911.7
July 6245.8 6521.8 5884.5 6323.7
August 6163.5 6531.0 6005.0 5919.7
September 5997.5 6353.7 5835.5 5446.0
October 5497.3 5616.0 5227.5 5181.3
November 4870.0 4814.7 4543.8 4397.0
December 4617.7 4407.8 4171.1 4000.3
Source:The National Center of Meteorology and Seismology, Statistics Centre- Abu Dhabi.
Figure 6.2.5 Average Daily Total Solar Radiation by Month and Region, 2016
. Abu Dhabi Region . Al Ain Region . Al Dhafra Region
. The Islands
Source: Statistics Centre- Abu Dhabi.
Janu
ary
Febr
uary
Mar
ch
Apr
il
May
June July
Aug
ust
Sept
embe
r
Oct
ober
Nov
embe
r
Dec
embe
r
2,000
4,000
6,000
8,000
Statistical Yearbook of Abu Dhabi 2017 | 269
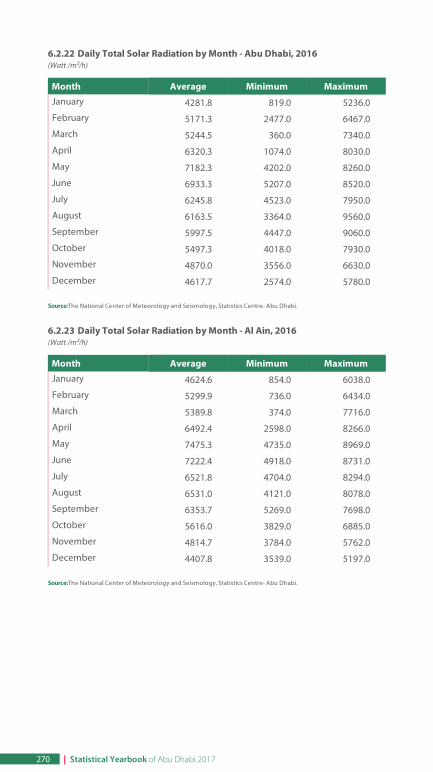
6.2.22 Daily Total Solar Radiation by Month - Abu Dhabi, 2016(Watt /m²/h)
Month Average Minimum MaximumJanuary 4281.8 819.0 5236.0
February 5171.3 2477.0 6467.0
March 5244.5 360.0 7340.0
April 6320.3 1074.0 8030.0
May 7182.3 4202.0 8260.0
June 6933.3 5207.0 8520.0
July 6245.8 4523.0 7950.0
August 6163.5 3364.0 9560.0
September 5997.5 4447.0 9060.0
October 5497.3 4018.0 7930.0
November 4870.0 3556.0 6630.0
December 4617.7 2574.0 5780.0
Source:The National Center of Meteorology and Seismology, Statistics Centre- Abu Dhabi.
6.2.23 Daily Total Solar Radiation by Month - Al Ain, 2016(Watt /m²/h)
Month Average Minimum MaximumJanuary 4624.6 854.0 6038.0
February 5299.9 736.0 6434.0
March 5389.8 374.0 7716.0
April 6492.4 2598.0 8266.0
May 7475.3 4735.0 8969.0
June 7222.4 4918.0 8731.0
July 6521.8 4704.0 8294.0
August 6531.0 4121.0 8078.0
September 6353.7 5269.0 7698.0
October 5616.0 3829.0 6885.0
November 4814.7 3784.0 5762.0
December 4407.8 3539.0 5197.0
Source:The National Center of Meteorology and Seismology, Statistics Centre- Abu Dhabi.
270 | Statistical Yearbook of Abu Dhabi 2017
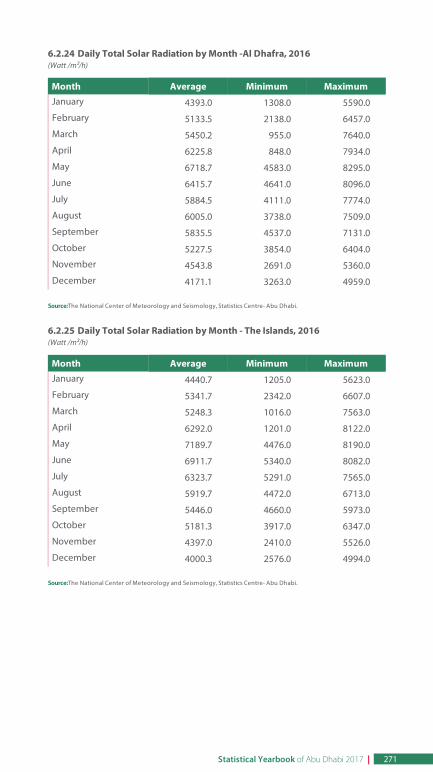
6.2.24 Daily Total Solar Radiation by Month -Al Dhafra, 2016(Watt /m²/h)
Month Average Minimum MaximumJanuary 4393.0 1308.0 5590.0
February 5133.5 2138.0 6457.0
March 5450.2 955.0 7640.0
April 6225.8 848.0 7934.0
May 6718.7 4583.0 8295.0
June 6415.7 4641.0 8096.0
July 5884.5 4111.0 7774.0
August 6005.0 3738.0 7509.0
September 5835.5 4537.0 7131.0
October 5227.5 3854.0 6404.0
November 4543.8 2691.0 5360.0
December 4171.1 3263.0 4959.0
Source:The National Center of Meteorology and Seismology, Statistics Centre- Abu Dhabi.
6.2.25 Daily Total Solar Radiation by Month - The Islands, 2016(Watt /m²/h)
Month Average Minimum MaximumJanuary 4440.7 1205.0 5623.0
February 5341.7 2342.0 6607.0
March 5248.3 1016.0 7563.0
April 6292.0 1201.0 8122.0
May 7189.7 4476.0 8190.0
June 6911.7 5340.0 8082.0
July 6323.7 5291.0 7565.0
August 5919.7 4472.0 6713.0
September 5446.0 4660.0 5973.0
October 5181.3 3917.0 6347.0
November 4397.0 2410.0 5526.0
December 4000.3 2576.0 4994.0
Source:The National Center of Meteorology and Seismology, Statistics Centre- Abu Dhabi.
Statistical Yearbook of Abu Dhabi 2017 | 271
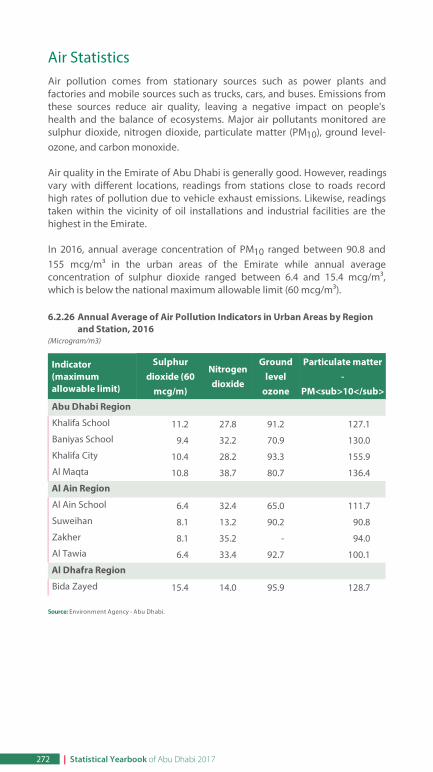
Air StatisticsAir pollution comes from stationary sources such as power plants andfactories and mobile sources such as trucks, cars, and buses. Emissions fromthese sources reduce air quality, leaving a negative impact on people'shealth and the balance of ecosystems. Major air pollutants monitored aresulphur dioxide, nitrogen dioxide, particulate matter (PM10), ground level-ozone, and carbon monoxide.
Air quality in the Emirate of Abu Dhabi is generally good. However, readingsvary with different locations, readings from stations close to roads recordhigh rates of pollution due to vehicle exhaust emissions. Likewise, readingstaken within the vicinity of oil installations and industrial facilities are thehighest in the Emirate.
In 2016, annual average concentration of PM10 ranged between 90.8 and155 mcg/m³ in the urban areas of the Emirate while annual averageconcentration of sulphur dioxide ranged between 6.4 and 15.4 mcg/m³,which is below the national maximum allowable limit (60 mcg/m³).
6.2.26 Annual Average of Air Pollution Indicators in Urban Areas by Regionand Station, 2016
(Microgram/m3)
Indicator(maximumallowable limit)
Sulphurdioxide (60
mcg/m)
Nitrogendioxide
Groundlevel
ozone
Particulate matter-
PM<sub>10</sub>
Abu Dhabi Region
Khalifa School 11.2 27.8 91.2 127.1
Baniyas School 9.4 32.2 70.9 130.0
Khalifa City 10.4 28.2 93.3 155.9
Al Maqta 10.8 38.7 80.7 136.4
Al Ain Region
Al Ain School 6.4 32.4 65.0 111.7
Suweihan 8.1 13.2 90.2 90.8
Zakher 8.1 35.2 - 94.0
Al Tawia 6.4 33.4 92.7 100.1
Al Dhafra Region
Bida Zayed 15.4 14.0 95.9 128.7
Source: Environment Agency - Abu Dhabi.
272 | Statistical Yearbook of Abu Dhabi 2017
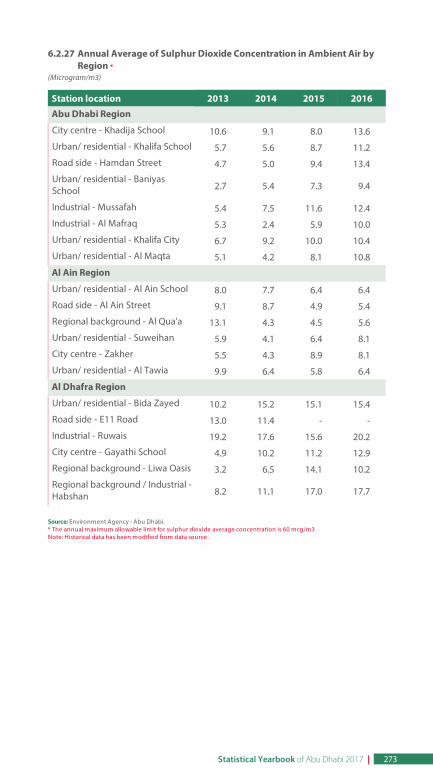
6.2.27 Annual Average of Sulphur Dioxide Concentration in Ambient Air byRegion *
(Microgram/m3)
Station location 2013 2014 2015 2016
Abu Dhabi Region
City centre - Khadija School 10.6 9.1 8.0 13.6
Urban/ residential - Khalifa School 5.7 5.6 8.7 11.2
Road side - Hamdan Street 4.7 5.0 9.4 13.4
Urban/ residential - BaniyasSchool 2.7 5.4 7.3 9.4
Industrial - Mussafah 5.4 7.5 11.6 12.4
Industrial - Al Mafraq 5.3 2.4 5.9 10.0
Urban/ residential - Khalifa City 6.7 9.2 10.0 10.4
Urban/ residential - Al Maqta 5.1 4.2 8.1 10.8
Al Ain Region
Urban/ residential - Al Ain School 8.0 7.7 6.4 6.4
Road side - Al Ain Street 9.1 8.7 4.9 5.4
Regional background - Al Qua'a 13.1 4.3 4.5 5.6
Urban/ residential - Suweihan 5.9 4.1 6.4 8.1
City centre - Zakher 5.5 4.3 8.9 8.1
Urban/ residential - Al Tawia 9.9 6.4 5.8 6.4
Al Dhafra Region
Urban/ residential - Bida Zayed 10.2 15.2 15.1 15.4
Road side - E11 Road 13.0 11.4 - -
Industrial - Ruwais 19.2 17.6 15.6 20.2
City centre - Gayathi School 4.9 10.2 11.2 12.9
Regional background - Liwa Oasis 3.2 6.5 14.1 10.2
Regional background / Industrial -Habshan 8.2 11.1 17.0 17.7
Source: Environment Agency - Abu Dhabi.* The annual maximum allowable limit for sulphur dioxide average concentration is 60 mcg/m3Note: Historical data has been modified from data source .
Statistical Yearbook of Abu Dhabi 2017 | 273
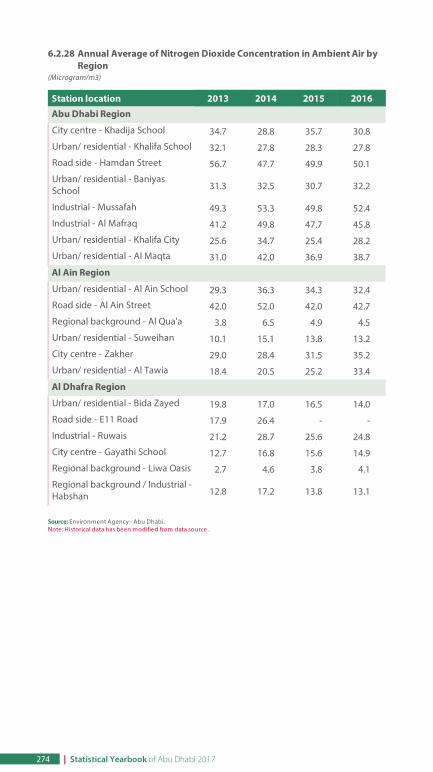
6.2.28 Annual Average of Nitrogen Dioxide Concentration in Ambient Air byRegion
(Microgram/m3)
Station location 2013 2014 2015 2016
Abu Dhabi Region
City centre - Khadija School 34.7 28.8 35.7 30.8
Urban/ residential - Khalifa School 32.1 27.8 28.3 27.8
Road side - Hamdan Street 56.7 47.7 49.9 50.1
Urban/ residential - BaniyasSchool 31.3 32.5 30.7 32.2
Industrial - Mussafah 49.3 53.3 49.8 52.4
Industrial - Al Mafraq 41.2 49.8 47.7 45.8
Urban/ residential - Khalifa City 25.6 34.7 25.4 28.2
Urban/ residential - Al Maqta 31.0 42.0 36.9 38.7
Al Ain Region
Urban/ residential - Al Ain School 29.3 36.3 34.3 32.4
Road side - Al Ain Street 42.0 52.0 42.0 42.7
Regional background - Al Qua'a 3.8 6.5 4.9 4.5
Urban/ residential - Suweihan 10.1 15.1 13.8 13.2
City centre - Zakher 29.0 28.4 31.5 35.2
Urban/ residential - Al Tawia 18.4 20.5 25.2 33.4
Al Dhafra Region
Urban/ residential - Bida Zayed 19.8 17.0 16.5 14.0
Road side - E11 Road 17.9 26.4 - -
Industrial - Ruwais 21.2 28.7 25.6 24.8
City centre - Gayathi School 12.7 16.8 15.6 14.9
Regional background - Liwa Oasis 2.7 4.6 3.8 4.1
Regional background / Industrial -Habshan 12.8 17.2 13.8 13.1
Source: Environment Agency - Abu Dhabi.Note: Historical data has been modified from data source .
274 | Statistical Yearbook of Abu Dhabi 2017
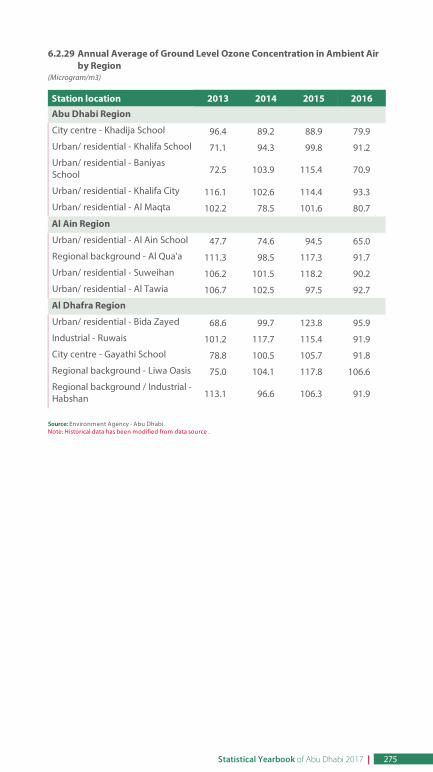
6.2.29 Annual Average of Ground Level Ozone Concentration in Ambient Airby Region
(Microgram/m3)
Station location 2013 2014 2015 2016
Abu Dhabi Region
City centre - Khadija School 96.4 89.2 88.9 79.9
Urban/ residential - Khalifa School 71.1 94.3 99.8 91.2
Urban/ residential - BaniyasSchool 72.5 103.9 115.4 70.9
Urban/ residential - Khalifa City 116.1 102.6 114.4 93.3
Urban/ residential - Al Maqta 102.2 78.5 101.6 80.7
Al Ain Region
Urban/ residential - Al Ain School 47.7 74.6 94.5 65.0
Regional background - Al Qua'a 111.3 98.5 117.3 91.7
Urban/ residential - Suweihan 106.2 101.5 118.2 90.2
Urban/ residential - Al Tawia 106.7 102.5 97.5 92.7
Al Dhafra Region
Urban/ residential - Bida Zayed 68.6 99.7 123.8 95.9
Industrial - Ruwais 101.2 117.7 115.4 91.9
City centre - Gayathi School 78.8 100.5 105.7 91.8
Regional background - Liwa Oasis 75.0 104.1 117.8 106.6
Regional background / Industrial -Habshan 113.1 96.6 106.3 91.9
Source: Environment Agency - Abu Dhabi.Note: Historical data has been modified from data source .
Statistical Yearbook of Abu Dhabi 2017 | 275
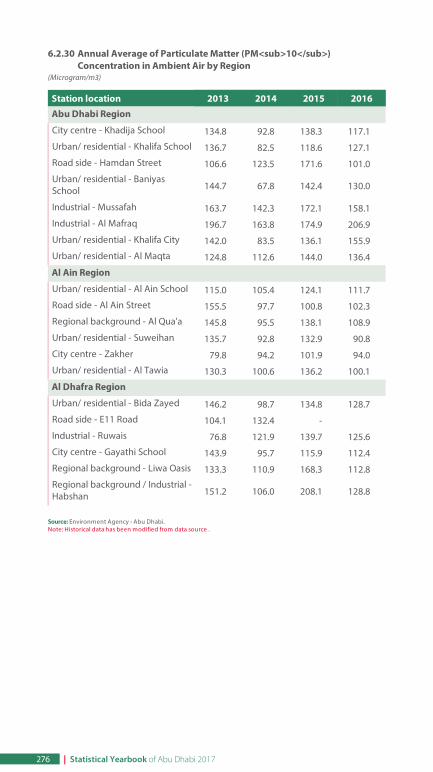
6.2.30 Annual Average of Particulate Matter (PM<sub>10</sub>)Concentration in Ambient Air by Region
(Microgram/m3)
Station location 2013 2014 2015 2016
Abu Dhabi Region
City centre - Khadija School 134.8 92.8 138.3 117.1
Urban/ residential - Khalifa School 136.7 82.5 118.6 127.1
Road side - Hamdan Street 106.6 123.5 171.6 101.0
Urban/ residential - BaniyasSchool 144.7 67.8 142.4 130.0
Industrial - Mussafah 163.7 142.3 172.1 158.1
Industrial - Al Mafraq 196.7 163.8 174.9 206.9
Urban/ residential - Khalifa City 142.0 83.5 136.1 155.9
Urban/ residential - Al Maqta 124.8 112.6 144.0 136.4
Al Ain Region
Urban/ residential - Al Ain School 115.0 105.4 124.1 111.7
Road side - Al Ain Street 155.5 97.7 100.8 102.3
Regional background - Al Qua'a 145.8 95.5 138.1 108.9
Urban/ residential - Suweihan 135.7 92.8 132.9 90.8
City centre - Zakher 79.8 94.2 101.9 94.0
Urban/ residential - Al Tawia 130.3 100.6 136.2 100.1
Al Dhafra Region
Urban/ residential - Bida Zayed 146.2 98.7 134.8 128.7
Road side - E11 Road 104.1 132.4 -
Industrial - Ruwais 76.8 121.9 139.7 125.6
City centre - Gayathi School 143.9 95.7 115.9 112.4
Regional background - Liwa Oasis 133.3 110.9 168.3 112.8
Regional background / Industrial -Habshan 151.2 106.0 208.1 128.8
Source: Environment Agency - Abu Dhabi.Note: Historical data has been modified from data source .
276 | Statistical Yearbook of Abu Dhabi 2017
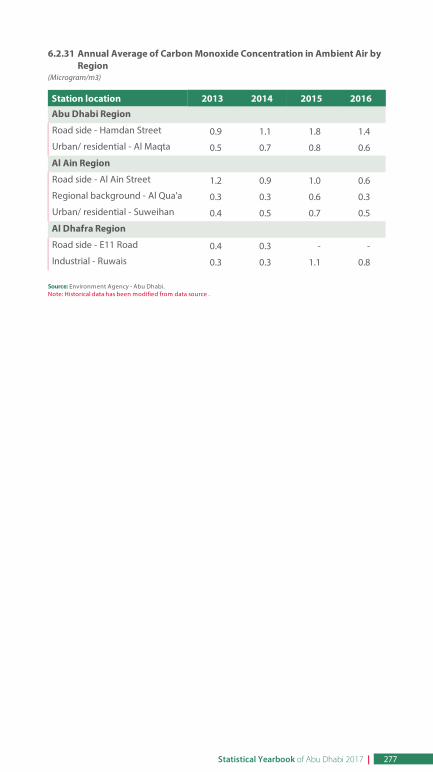
6.2.31 Annual Average of Carbon Monoxide Concentration in Ambient Air byRegion
(Microgram/m3)
Station location 2013 2014 2015 2016
Abu Dhabi Region
Road side - Hamdan Street 0.9 1.1 1.8 1.4
Urban/ residential - Al Maqta 0.5 0.7 0.8 0.6
Al Ain Region
Road side - Al Ain Street 1.2 0.9 1.0 0.6
Regional background - Al Qua'a 0.3 0.3 0.6 0.3
Urban/ residential - Suweihan 0.4 0.5 0.7 0.5
Al Dhafra Region
Road side - E11 Road 0.4 0.3 - -
Industrial - Ruwais 0.3 0.3 1.1 0.8
Source: Environment Agency - Abu Dhabi.Note: Historical data has been modified from data source .
Statistical Yearbook of Abu Dhabi 2017 | 277
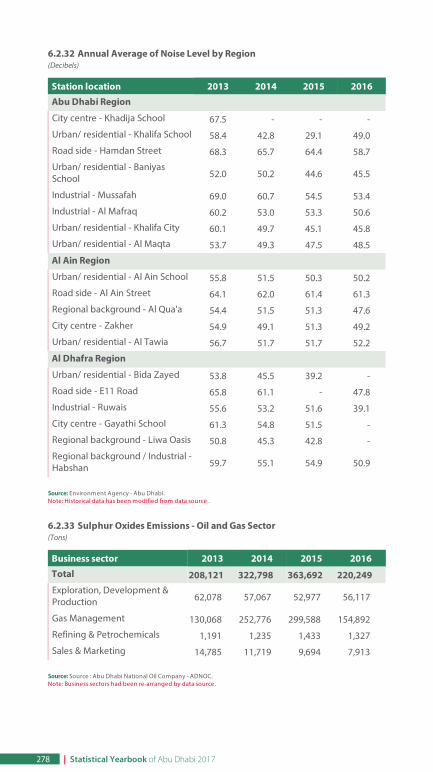
6.2.32 Annual Average of Noise Level by Region(Decibels)
Station location 2013 2014 2015 2016
Abu Dhabi Region
City centre - Khadija School 67.5 - - -
Urban/ residential - Khalifa School 58.4 42.8 29.1 49.0
Road side - Hamdan Street 68.3 65.7 64.4 58.7
Urban/ residential - BaniyasSchool 52.0 50.2 44.6 45.5
Industrial - Mussafah 69.0 60.7 54.5 53.4
Industrial - Al Mafraq 60.2 53.0 53.3 50.6
Urban/ residential - Khalifa City 60.1 49.7 45.1 45.8
Urban/ residential - Al Maqta 53.7 49.3 47.5 48.5
Al Ain Region
Urban/ residential - Al Ain School 55.8 51.5 50.3 50.2
Road side - Al Ain Street 64.1 62.0 61.4 61.3
Regional background - Al Qua'a 54.4 51.5 51.3 47.6
City centre - Zakher 54.9 49.1 51.3 49.2
Urban/ residential - Al Tawia 56.7 51.7 51.7 52.2
Al Dhafra Region
Urban/ residential - Bida Zayed 53.8 45.5 39.2 -
Road side - E11 Road 65.8 61.1 - 47.8
Industrial - Ruwais 55.6 53.2 51.6 39.1
City centre - Gayathi School 61.3 54.8 51.5 -
Regional background - Liwa Oasis 50.8 45.3 42.8 -
Regional background / Industrial -Habshan 59.7 55.1 54.9 50.9
Source: Environment Agency - Abu Dhabi.Note: Historical data has been modified from data source .
6.2.33 Sulphur Oxides Emissions - Oil and Gas Sector(Tons)
Business sector 2013 2014 2015 2016
Total 208,121 322,798 363,692 220,249 Exploration, Development &Production 62,078 57,067 52,977 56,117
Gas Management 130,068 252,776 299,588 154,892
Refining & Petrochemicals 1,191 1,235 1,433 1,327
Sales & Marketing 14,785 11,719 9,694 7,913
Source: Source : Abu Dhabi National Oil Company - ADNOC.Note: Business sectors had been re-arranged by data source.
278 | Statistical Yearbook of Abu Dhabi 2017
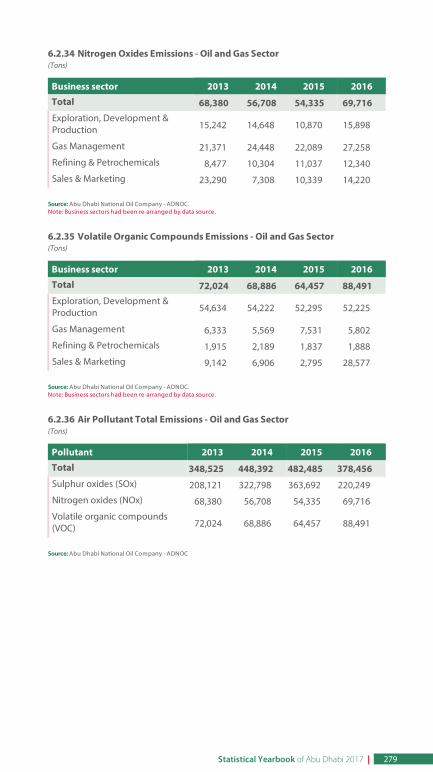
6.2.34 Nitrogen Oxides Emissions - Oil and Gas Sector(Tons)
Business sector 2013 2014 2015 2016
Total 68,380 56,708 54,335 69,716 Exploration, Development &Production 15,242 14,648 10,870 15,898
Gas Management 21,371 24,448 22,089 27,258
Refining & Petrochemicals 8,477 10,304 11,037 12,340
Sales & Marketing 23,290 7,308 10,339 14,220
Source: Abu Dhabi National Oil Company - ADNOC.Note: Business sectors had been re-arranged by data source.
6.2.35 Volatile Organic Compounds Emissions - Oil and Gas Sector(Tons)
Business sector 2013 2014 2015 2016
Total 72,024 68,886 64,457 88,491 Exploration, Development &Production 54,634 54,222 52,295 52,225
Gas Management 6,333 5,569 7,531 5,802
Refining & Petrochemicals 1,915 2,189 1,837 1,888
Sales & Marketing 9,142 6,906 2,795 28,577
Source: Abu Dhabi National Oil Company - ADNOC.Note: Business sectors had been re-arranged by data source.
6.2.36 Air Pollutant Total Emissions - Oil and Gas Sector(Tons)
Pollutant 2013 2014 2015 2016
Total 348,525 448,392 482,485 378,456 Sulphur oxides (SOx) 208,121 322,798 363,692 220,249
Nitrogen oxides (NOx) 68,380 56,708 54,335 69,716
Volatile organic compounds(VOC) 72,024 68,886 64,457 88,491
Source: Abu Dhabi National Oil Company - ADNOC
Statistical Yearbook of Abu Dhabi 2017 | 279
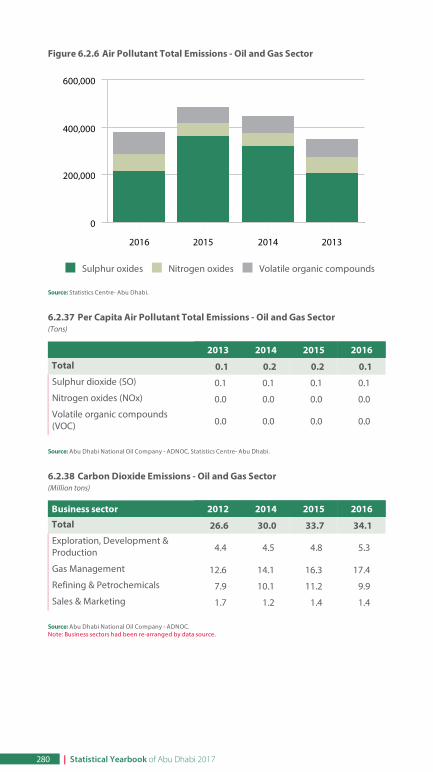
Figure 6.2.6 Air Pollutant Total Emissions - Oil and Gas Sector
. Sulphur oxides . Nitrogen oxides . Volatile organic compounds
Source: Statistics Centre- Abu Dhabi.
6.2.37 Per Capita Air Pollutant Total Emissions - Oil and Gas Sector(Tons)
2013 2014 2015 2016
Total 0.1 0.2 0.2 0.1 Sulphur dioxide (SO) 0.1 0.1 0.1 0.1
Nitrogen oxides (NOx) 0.0 0.0 0.0 0.0
Volatile organic compounds(VOC) 0.0 0.0 0.0 0.0
Source: Abu Dhabi National Oil Company - ADNOC, Statistics Centre- Abu Dhabi.
6.2.38 Carbon Dioxide Emissions - Oil and Gas Sector(Million tons)
Business sector 2012 2014 2015 2016
Total 26.6 30.0 33.7 34.1 Exploration, Development &Production 4.4 4.5 4.8 5.3
Gas Management 12.6 14.1 16.3 17.4
Refining & Petrochemicals 7.9 10.1 11.2 9.9
Sales & Marketing 1.7 1.2 1.4 1.4
Source: Abu Dhabi National Oil Company - ADNOC.Note: Business sectors had been re-arranged by data source.
2016 2015 2014 2013
0
200,000
400,000
600,000
280 | Statistical Yearbook of Abu Dhabi 2017
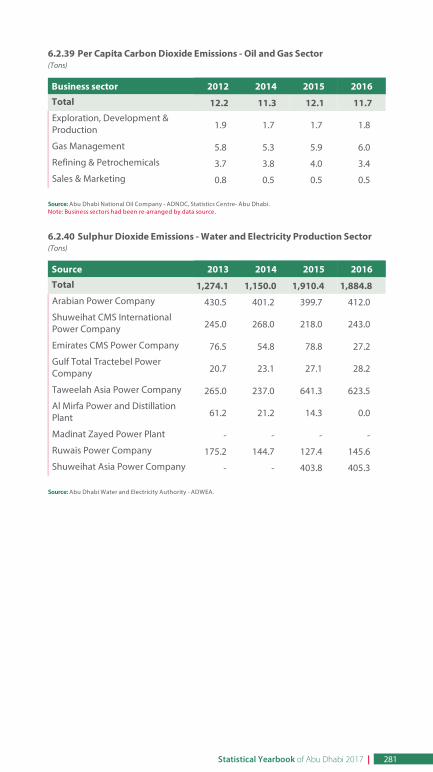
6.2.39 Per Capita Carbon Dioxide Emissions - Oil and Gas Sector(Tons)
Business sector 2012 2014 2015 2016
Total 12.2 11.3 12.1 11.7 Exploration, Development &Production 1.9 1.7 1.7 1.8
Gas Management 5.8 5.3 5.9 6.0
Refining & Petrochemicals 3.7 3.8 4.0 3.4
Sales & Marketing 0.8 0.5 0.5 0.5
Source: Abu Dhabi National Oil Company - ADNOC, Statistics Centre- Abu Dhabi.Note: Business sectors had been re-arranged by data source.
6.2.40 Sulphur Dioxide Emissions - Water and Electricity Production Sector(Tons)
Source 2013 2014 2015 2016
Total 1,274.1 1,150.0 1,910.4 1,884.8 Arabian Power Company 430.5 401.2 399.7 412.0
Shuweihat CMS InternationalPower Company 245.0 268.0 218.0 243.0
Emirates CMS Power Company 76.5 54.8 78.8 27.2
Gulf Total Tractebel PowerCompany 20.7 23.1 27.1 28.2
Taweelah Asia Power Company 265.0 237.0 641.3 623.5
Al Mirfa Power and DistillationPlant 61.2 21.2 14.3 0.0
Madinat Zayed Power Plant - - - -
Ruwais Power Company 175.2 144.7 127.4 145.6
Shuweihat Asia Power Company - - 403.8 405.3
Source: Abu Dhabi Water and Electricity Authority - ADWEA.
Statistical Yearbook of Abu Dhabi 2017 | 281
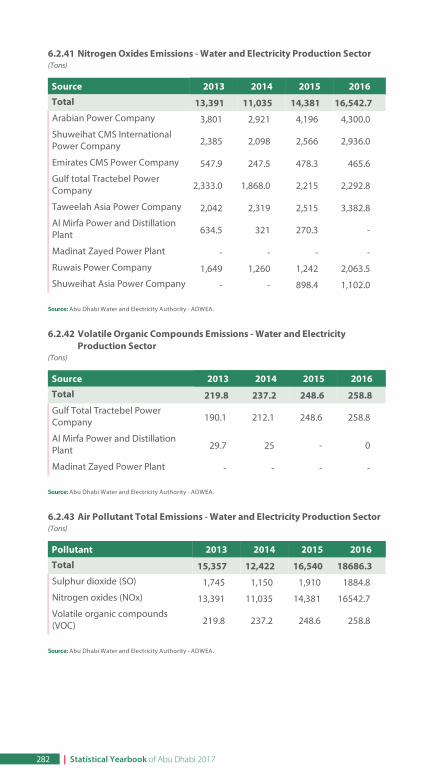
6.2.41 Nitrogen Oxides Emissions - Water and Electricity Production Sector(Tons)
Source 2013 2014 2015 2016
Total 13,391 11,035 14,381 16,542.7 Arabian Power Company 3,801 2,921 4,196 4,300.0
Shuweihat CMS InternationalPower Company 2,385 2,098 2,566 2,936.0
Emirates CMS Power Company 547.9 247.5 478.3 465.6
Gulf total Tractebel PowerCompany 2,333.0 1,868.0 2,215 2,292.8
Taweelah Asia Power Company 2,042 2,319 2,515 3,382.8
Al Mirfa Power and DistillationPlant 634.5 321 270.3 -
Madinat Zayed Power Plant - - - -
Ruwais Power Company 1,649 1,260 1,242 2,063.5
Shuweihat Asia Power Company - - 898.4 1,102.0
Source: Abu Dhabi Water and Electricity Authority - ADWEA.
6.2.42 Volatile Organic Compounds Emissions - Water and ElectricityProduction Sector
(Tons)
Source 2013 2014 2015 2016
Total 219.8 237.2 248.6 258.8 Gulf Total Tractebel PowerCompany 190.1 212.1 248.6 258.8
Al Mirfa Power and DistillationPlant 29.7 25 - 0
Madinat Zayed Power Plant - - - -
Source: Abu Dhabi Water and Electricity Authority - ADWEA.
6.2.43 Air Pollutant Total Emissions - Water and Electricity Production Sector(Tons)
Pollutant 2013 2014 2015 2016
Total 15,357 12,422 16,540 18686.3 Sulphur dioxide (SO) 1,745 1,150 1,910 1884.8
Nitrogen oxides (NOx) 13,391 11,035 14,381 16542.7
Volatile organic compounds(VOC) 219.8 237.2 248.6 258.8
Source: Abu Dhabi Water and Electricity Authority - ADWEA.
282 | Statistical Yearbook of Abu Dhabi 2017
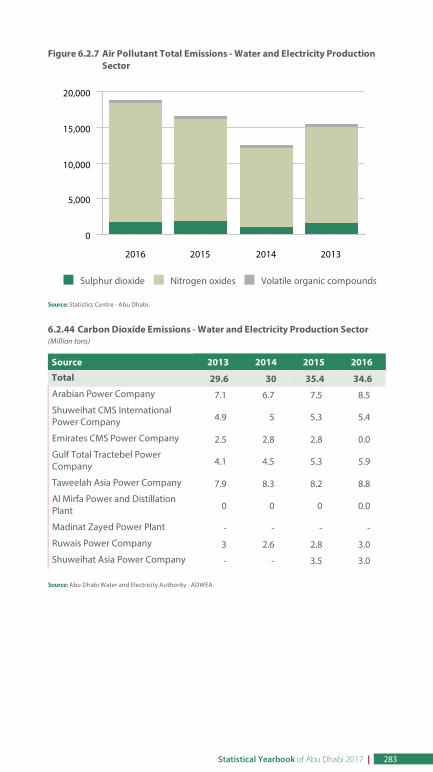
Figure 6.2.7 Air Pollutant Total Emissions - Water and Electricity ProductionSector
. Sulphur dioxide . Nitrogen oxides . Volatile organic compounds
Source: Statistics Centre - Abu Dhabi.
6.2.44 Carbon Dioxide Emissions - Water and Electricity Production Sector(Million tons)
Source 2013 2014 2015 2016
Total 29.6 30 35.4 34.6 Arabian Power Company 7.1 6.7 7.5 8.5
Shuweihat CMS InternationalPower Company 4.9 5 5.3 5.4
Emirates CMS Power Company 2.5 2.8 2.8 0.0
Gulf Total Tractebel PowerCompany 4.1 4.5 5.3 5.9
Taweelah Asia Power Company 7.9 8.3 8.2 8.8
Al Mirfa Power and DistillationPlant 0 0 0 0.0
Madinat Zayed Power Plant - - - -
Ruwais Power Company 3 2.6 2.8 3.0
Shuweihat Asia Power Company - - 3.5 3.0
Source: Abu Dhabi Water and Electricity Authority - ADWEA.
2016 2015 2014 2013
0
5,000
10,000
15,000
20,000
Statistical Yearbook of Abu Dhabi 2017 | 283
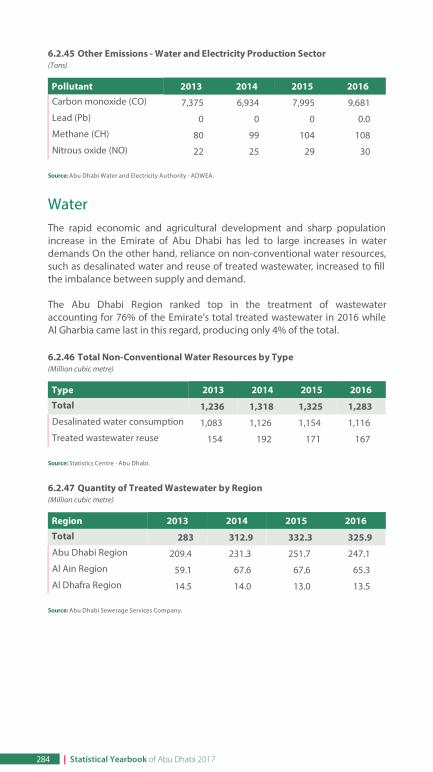
6.2.45 Other Emissions - Water and Electricity Production Sector(Tons)
Pollutant 2013 2014 2015 2016Carbon monoxide (CO) 7,375 6,934 7,995 9,681
Lead (Pb) 0 0 0 0.0
Methane (CH) 80 99 104 108
Nitrous oxide (NO) 22 25 29 30
Source: Abu Dhabi Water and Electricity Authority - ADWEA.
WaterThe rapid economic and agricultural development and sharp populationincrease in the Emirate of Abu Dhabi has led to large increases in waterdemands On the other hand, reliance on non-conventional water resources,such as desalinated water and reuse of treated wastewater, increased to llthe imbalance between supply and demand.
The Abu Dhabi Region ranked top in the treatment of wastewateraccounting for 76% of the Emirate's total treated wastewater in 2016 whileAl Gharbia came last in this regard, producing only 4% of the total.
6.2.46 Total Non-Conventional Water Resources by Type(Million cubic metre)
Type 2013 2014 2015 2016
Total 1,236 1,318 1,325 1,283 Desalinated water consumption 1,083 1,126 1,154 1,116
Treated wastewater reuse 154 192 171 167
Source: Statistics Centre - Abu Dhabi.
6.2.47 Quantity of Treated Wastewater by Region(Million cubic metre)
Region 2013 2014 2015 2016
Total 283 312.9 332.3 325.9 Abu Dhabi Region 209.4 231.3 251.7 247.1
Al Ain Region 59.1 67.6 67.6 65.3
Al Dhafra Region 14.5 14.0 13.0 13.5
Source: Abu Dhabi Sewerage Services Company.
284 | Statistical Yearbook of Abu Dhabi 2017
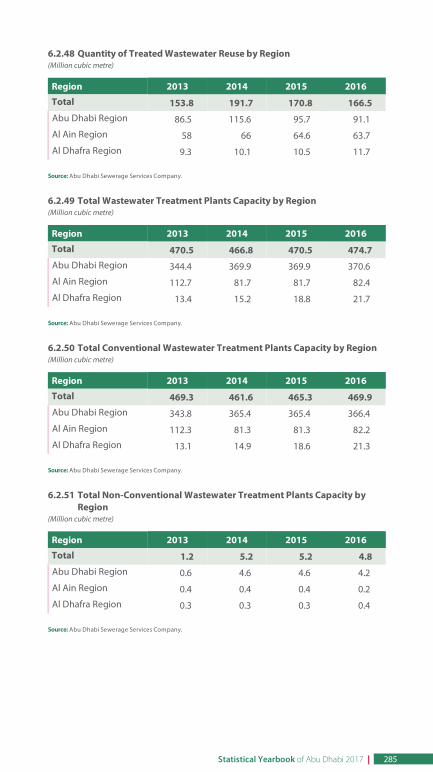
6.2.48 Quantity of Treated Wastewater Reuse by Region(Million cubic metre)
Region 2013 2014 2015 2016
Total 153.8 191.7 170.8 166.5 Abu Dhabi Region 86.5 115.6 95.7 91.1
Al Ain Region 58 66 64.6 63.7
Al Dhafra Region 9.3 10.1 10.5 11.7
Source: Abu Dhabi Sewerage Services Company.
6.2.49 Total Wastewater Treatment Plants Capacity by Region(Million cubic metre)
Region 2013 2014 2015 2016
Total 470.5 466.8 470.5 474.7 Abu Dhabi Region 344.4 369.9 369.9 370.6
Al Ain Region 112.7 81.7 81.7 82.4
Al Dhafra Region 13.4 15.2 18.8 21.7
Source: Abu Dhabi Sewerage Services Company.
6.2.50 Total Conventional Wastewater Treatment Plants Capacity by Region(Million cubic metre)
Region 2013 2014 2015 2016
Total 469.3 461.6 465.3 469.9 Abu Dhabi Region 343.8 365.4 365.4 366.4
Al Ain Region 112.3 81.3 81.3 82.2
Al Dhafra Region 13.1 14.9 18.6 21.3
Source: Abu Dhabi Sewerage Services Company.
6.2.51 Total Non-Conventional Wastewater Treatment Plants Capacity byRegion
(Million cubic metre)
Region 2013 2014 2015 2016
Total 1.2 5.2 5.2 4.8 Abu Dhabi Region 0.6 4.6 4.6 4.2
Al Ain Region 0.4 0.4 0.4 0.2
Al Dhafra Region 0.3 0.3 0.3 0.4
Source: Abu Dhabi Sewerage Services Company.
Statistical Yearbook of Abu Dhabi 2017 | 285
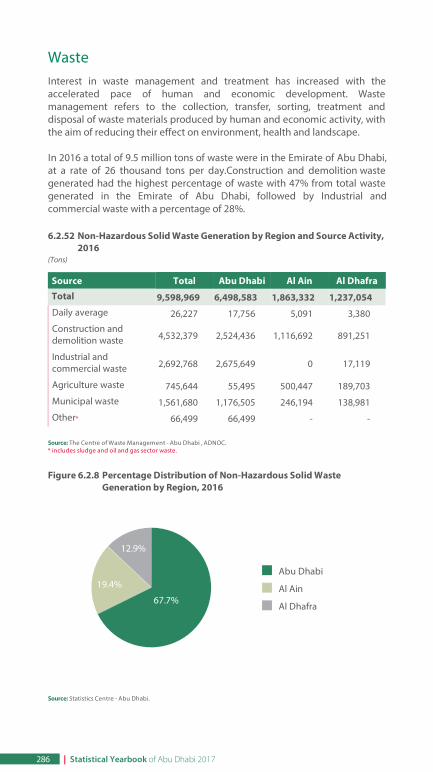
WasteInterest in waste management and treatment has increased with theaccelerated pace of human and economic development. Wastemanagement refers to the collection, transfer, sorting, treatment anddisposal of waste materials produced by human and economic activity, withthe aim of reducing their effect on environment, health and landscape.
In 2016 a total of 9.5 million tons of waste were in the Emirate of Abu Dhabi,at a rate of 26 thousand tons per day.Construction and demolition wastegenerated had the highest percentage of waste with 47% from total wastegenerated in the Emirate of Abu Dhabi, followed by Industrial andcommercial waste with a percentage of 28%.
6.2.52 Non-Hazardous Solid Waste Generation by Region and Source Activity,2016
(Tons)
Source Total Abu Dhabi Al Ain Al Dhafra
Total 9,598,969 6,498,583 1,863,332 1,237,054 Daily average 26,227 17,756 5,091 3,380
Construction anddemolition waste 4,532,379 2,524,436 1,116,692 891,251
Industrial andcommercial waste 2,692,768 2,675,649 0 17,119
Agriculture waste 745,644 55,495 500,447 189,703
Municipal waste 1,561,680 1,176,505 246,194 138,981
Other* 66,499 66,499 - -
Source: The Centre of Waste Management - Abu Dhabi , ADNOC.* includes sludge and oil and gas sector waste.
Figure 6.2.8 Percentage Distribution of Non-Hazardous Solid WasteGeneration by Region, 2016
. Abu Dhabi
. Al Ain
. Al Dhafra
Source: Statistics Centre - Abu Dhabi.
67.7%
19.4%
12.9%
286 | Statistical Yearbook of Abu Dhabi 2017
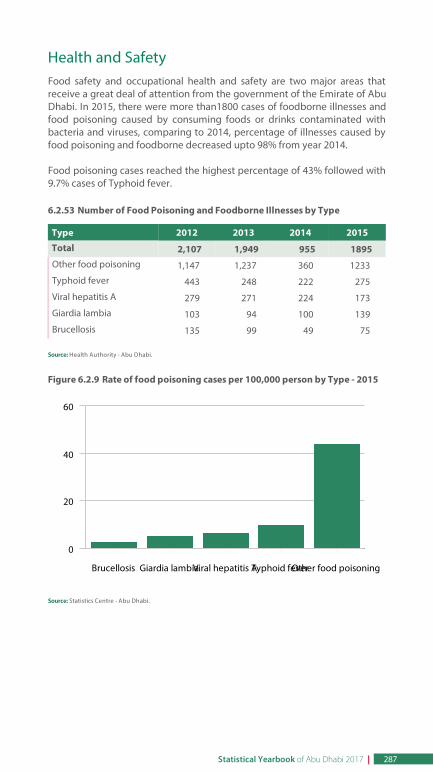
Health and SafetyFood safety and occupational health and safety are two major areas thatreceive a great deal of attention from the government of the Emirate of AbuDhabi. In 2015, there were more than1800 cases of foodborne illnesses andfood poisoning caused by consuming foods or drinks contaminated withbacteria and viruses, comparing to 2014, percentage of illnesses caused byfood poisoning and foodborne decreased upto 98% from year 2014.
Food poisoning cases reached the highest percentage of 43% followed with9.7% cases of Typhoid fever.
6.2.53 Number of Food Poisoning and Foodborne Illnesses by Type
Type 2012 2013 2014 2015
Total 2,107 1,949 955 1895 Other food poisoning 1,147 1,237 360 1233
Typhoid fever 443 248 222 275
Viral hepatitis A 279 271 224 173
Giardia lambia 103 94 100 139
Brucellosis 135 99 49 75
Source: Health Authority - Abu Dhabi.
Figure 6.2.9 Rate of food poisoning cases per 100,000 person by Type - 2015
Source: Statistics Centre - Abu Dhabi.
Brucellosis Giardia lambiaViral hepatitis ATyphoid feverOther food poisoning
0
20
40
60
Statistical Yearbook of Abu Dhabi 2017 | 287
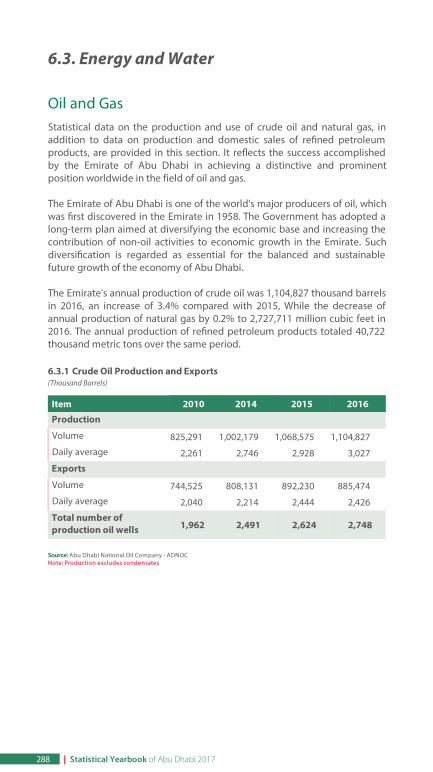
6.3. Energy and Water
Oil and GasStatistical data on the production and use of crude oil and natural gas, inaddition to data on production and domestic sales of re ned petroleumproducts, are provided in this section. It re ects the success accomplishedby the Emirate of Abu Dhabi in achieving a distinctive and prominentposition worldwide in the field of oil and gas.
The Emirate of Abu Dhabi is one of the world's major producers of oil, whichwas rst discovered in the Emirate in 1958. The Government has adopted along-term plan aimed at diversifying the economic base and increasing thecontribution of non-oil activities to economic growth in the Emirate. Suchdiversi cation is regarded as essential for the balanced and sustainablefuture growth of the economy of Abu Dhabi.
The Emirate's annual production of crude oil was 1,104,827 thousand barrelsin 2016, an increase of 3.4% compared with 2015, While the decrease ofannual production of natural gas by 0.2% to 2,727,711 million cubic feet in2016. The annual production of re ned petroleum products totaled 40,722thousand metric tons over the same period.
6.3.1 Crude Oil Production and Exports(Thousand Barrels)
Item 2010 2014 2015 2016
Production
Volume 825,291 1,002,179 1,068,575 1,104,827
Daily average 2,261 2,746 2,928 3,027
Exports
Volume 744,525 808,131 892,230 885,474
Daily average 2,040 2,214 2,444 2,426
Total number ofproduction oil wells 1,962 2,491 2,624 2,748
Source: Abu Dhabi National Oil Company - ADNOCNote: Production excludes condensates
288 | Statistical Yearbook of Abu Dhabi 2017
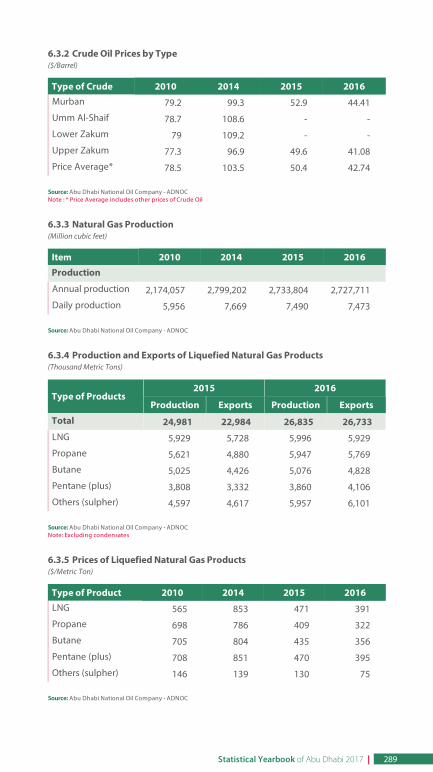
6.3.2 Crude Oil Prices by Type($/Barrel)
Type of Crude 2010 2014 2015 2016Murban 79.2 99.3 52.9 44.41
Umm Al-Shaif 78.7 108.6 - -
Lower Zakum 79 109.2 - -
Upper Zakum 77.3 96.9 49.6 41.08
Price Average* 78.5 103.5 50.4 42.74
Source: Abu Dhabi National Oil Company - ADNOCNote : * Price Average includes other prices of Crude Oil
6.3.3 Natural Gas Production(Million cubic feet)
Item 2010 2014 2015 2016
Production
Annual production 2,174,057 2,799,202 2,733,804 2,727,711
Daily production 5,956 7,669 7,490 7,473
Source: Abu Dhabi National Oil Company - ADNOC
6.3.4 Production and Exports of Liquefied Natural Gas Products(Thousand Metric Tons)
Type of Products2015 2016
Production Exports Production Exports
Total 24,981 22,984 26,835 26,733 LNG 5,929 5,728 5,996 5,929
Propane 5,621 4,880 5,947 5,769
Butane 5,025 4,426 5,076 4,828
Pentane (plus) 3,808 3,332 3,860 4,106
Others (sulpher) 4,597 4,617 5,957 6,101
Source: Abu Dhabi National Oil Company - ADNOCNote: Excluding condensates
6.3.5 Prices of Liquefied Natural Gas Products($/Metric Ton)
Type of Product 2010 2014 2015 2016LNG 565 853 471 391
Propane 698 786 409 322
Butane 705 804 435 356
Pentane (plus) 708 851 470 395
Others (sulpher) 146 139 130 75
Source: Abu Dhabi National Oil Company - ADNOC
Statistical Yearbook of Abu Dhabi 2017 | 289
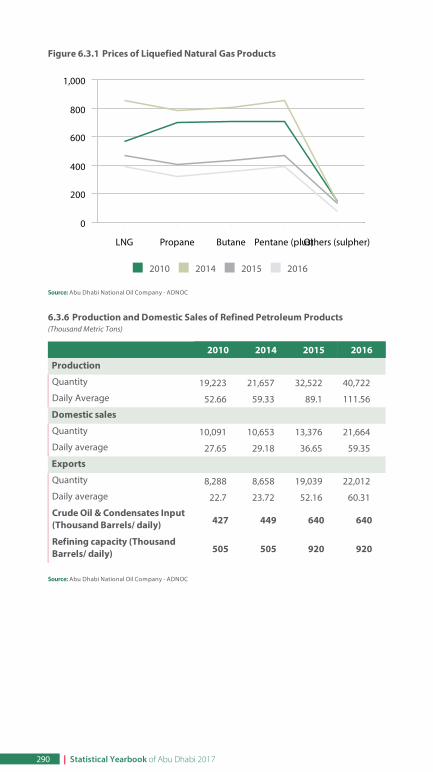
Figure 6.3.1 Prices of Liquefied Natural Gas Products
. 2010 . 2014 . 2015 . 2016
Source: Abu Dhabi National Oil Company - ADNOC
6.3.6 Production and Domestic Sales of Refined Petroleum Products(Thousand Metric Tons)
2010 2014 2015 2016
Production
Quantity 19,223 21,657 32,522 40,722
Daily Average 52.66 59.33 89.1 111.56
Domestic sales
Quantity 10,091 10,653 13,376 21,664
Daily average 27.65 29.18 36.65 59.35
Exports
Quantity 8,288 8,658 19,039 22,012
Daily average 22.7 23.72 52.16 60.31
Crude Oil & Condensates Input(Thousand Barrels/ daily) 427 449 640 640
Refining capacity (ThousandBarrels/ daily) 505 505 920 920
Source: Abu Dhabi National Oil Company - ADNOC
LNG Propane Butane Pentane (plus)Others (sulpher)
0
200
400
600
800
1,000
290 | Statistical Yearbook of Abu Dhabi 2017
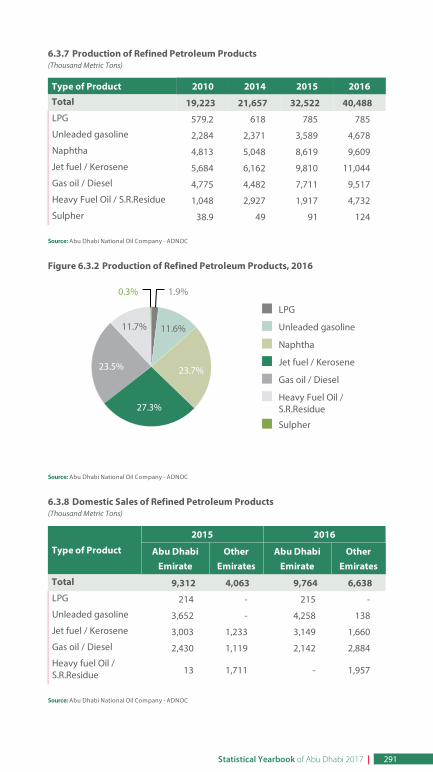
6.3.7 Production of Refined Petroleum Products(Thousand Metric Tons)
Type of Product 2010 2014 2015 2016
Total 19,223 21,657 32,522 40,488 LPG 579.2 618 785 785
Unleaded gasoline 2,284 2,371 3,589 4,678
Naphtha 4,813 5,048 8,619 9,609
Jet fuel / Kerosene 5,684 6,162 9,810 11,044
Gas oil / Diesel 4,775 4,482 7,711 9,517
Heavy Fuel Oil / S.R.Residue 1,048 2,927 1,917 4,732
Sulpher 38.9 49 91 124
Source: Abu Dhabi National Oil Company - ADNOC
Figure 6.3.2 Production of Refined Petroleum Products, 2016
. LPG
. Unleaded gasoline
. Naphtha
. Jet fuel / Kerosene
. Gas oil / Diesel
. Heavy Fuel Oil /S.R.Residue
. Sulpher
Source: Abu Dhabi National Oil Company - ADNOC
6.3.8 Domestic Sales of Refined Petroleum Products(Thousand Metric Tons)
Type of Product
2015 2016
Abu DhabiEmirate
OtherEmirates
Abu DhabiEmirate
OtherEmirates
Total 9,312 4,063 9,764 6,638 LPG 214 - 215 -
Unleaded gasoline 3,652 - 4,258 138
Jet fuel / Kerosene 3,003 1,233 3,149 1,660
Gas oil / Diesel 2,430 1,119 2,142 2,884
Heavy fuel Oil /S.R.Residue 13 1,711 - 1,957
Source: Abu Dhabi National Oil Company - ADNOC
1.9%
11.6%
23.7%
27.3%
23.5%
11.7%
0.3%
Statistical Yearbook of Abu Dhabi 2017 | 291
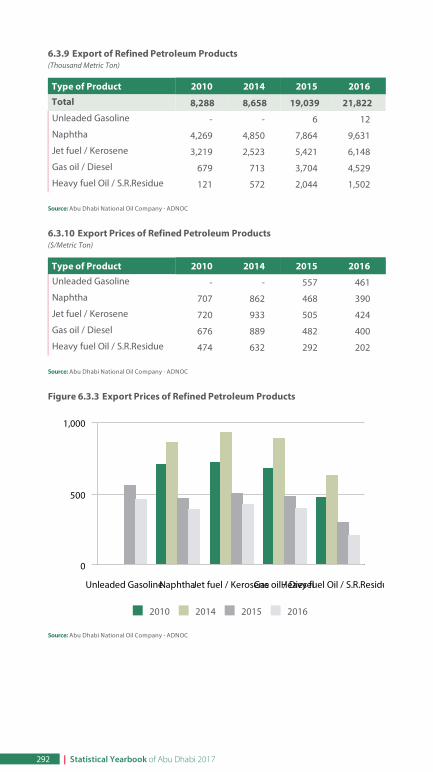
6.3.9 Export of Refined Petroleum Products(Thousand Metric Ton)
Type of Product 2010 2014 2015 2016
Total 8,288 8,658 19,039 21,822 Unleaded Gasoline - - 6 12
Naphtha 4,269 4,850 7,864 9,631
Jet fuel / Kerosene 3,219 2,523 5,421 6,148
Gas oil / Diesel 679 713 3,704 4,529
Heavy fuel Oil / S.R.Residue 121 572 2,044 1,502
Source: Abu Dhabi National Oil Company - ADNOC
6.3.10 Export Prices of Refined Petroleum Products($/Metric Ton)
Type of Product 2010 2014 2015 2016Unleaded Gasoline - - 557 461
Naphtha 707 862 468 390
Jet fuel / Kerosene 720 933 505 424
Gas oil / Diesel 676 889 482 400
Heavy fuel Oil / S.R.Residue 474 632 292 202
Source: Abu Dhabi National Oil Company - ADNOC
Figure 6.3.3 Export Prices of Refined Petroleum Products
. 2010 . 2014 . 2015 . 2016
Source: Abu Dhabi National Oil Company - ADNOC
Unleaded GasolineNaphthaJet fuel / KeroseneGas oil / DieselHeavy fuel Oil / S.R.Residue
0
500
1,000
292 | Statistical Yearbook of Abu Dhabi 2017
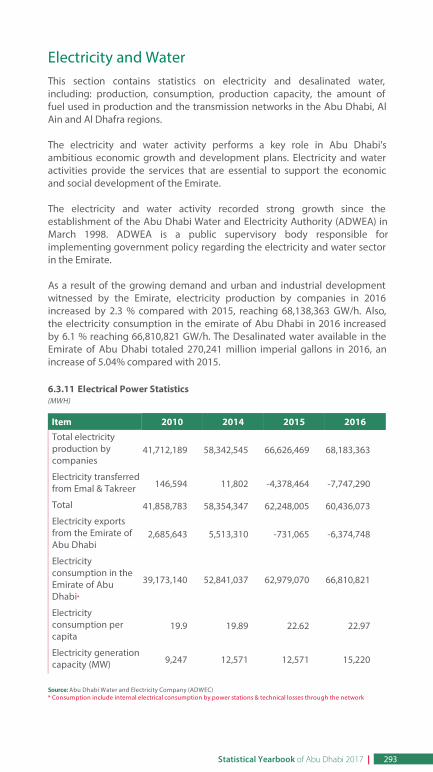
Electricity and WaterThis section contains statistics on electricity and desalinated water,including: production, consumption, production capacity, the amount offuel used in production and the transmission networks in the Abu Dhabi, AlAin and Al Dhafra regions.
The electricity and water activity performs a key role in Abu Dhabi'sambitious economic growth and development plans. Electricity and wateractivities provide the services that are essential to support the economicand social development of the Emirate.
The electricity and water activity recorded strong growth since theestablishment of the Abu Dhabi Water and Electricity Authority (ADWEA) inMarch 1998. ADWEA is a public supervisory body responsible forimplementing government policy regarding the electricity and water sectorin the Emirate.
As a result of the growing demand and urban and industrial developmentwitnessed by the Emirate, electricity production by companies in 2016increased by 2.3 % compared with 2015, reaching 68,138,363 GW/h. Also,the electricity consumption in the emirate of Abu Dhabi in 2016 increasedby 6.1 % reaching 66,810,821 GW/h. The Desalinated water available in theEmirate of Abu Dhabi totaled 270,241 million imperial gallons in 2016, anincrease of 5.04% compared with 2015.
6.3.11 Electrical Power Statistics(MWH)
Item 2010 2014 2015 2016Total electricityproduction bycompanies
41,712,189 58,342,545 66,626,469 68,183,363
Electricity transferredfrom Emal & Takreer 146,594 11,802 -4,378,464 -7,747,290
Total 41,858,783 58,354,347 62,248,005 60,436,073
Electricity exportsfrom the Emirate ofAbu Dhabi
2,685,643 5,513,310 -731,065 -6,374,748
Electricityconsumption in theEmirate of AbuDhabi*
39,173,140 52,841,037 62,979,070 66,810,821
Electricityconsumption percapita
19.9 19.89 22.62 22.97
Electricity generationcapacity (MW) 9,247 12,571 12,571 15,220
Source: Abu Dhabi Water and Electricity Company (ADWEC)* Consumption include internal electrical consumption by power stations & technical losses through the network
Statistical Yearbook of Abu Dhabi 2017 | 293
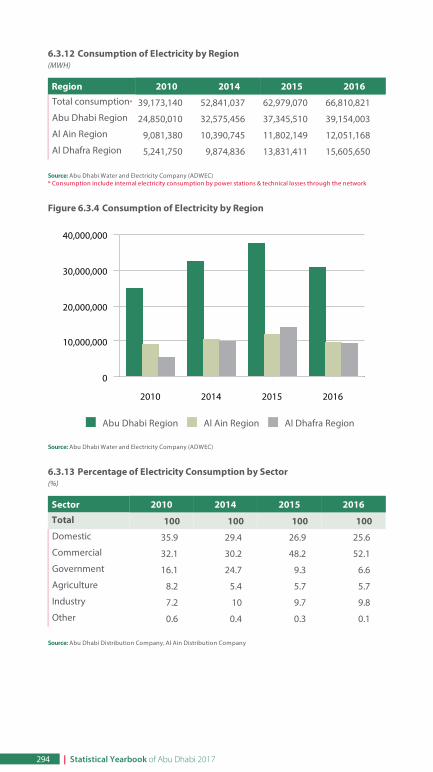
6.3.12 Consumption of Electricity by Region(MWH)
Region 2010 2014 2015 2016Total consumption* 39,173,140 52,841,037 62,979,070 66,810,821
Abu Dhabi Region 24,850,010 32,575,456 37,345,510 39,154,003
Al Ain Region 9,081,380 10,390,745 11,802,149 12,051,168
Al Dhafra Region 5,241,750 9,874,836 13,831,411 15,605,650
Source: Abu Dhabi Water and Electricity Company (ADWEC)* Consumption include internal electricity consumption by power stations & technical losses through the network
Figure 6.3.4 Consumption of Electricity by Region
. Abu Dhabi Region . Al Ain Region . Al Dhafra Region
Source: Abu Dhabi Water and Electricity Company (ADWEC)
6.3.13 Percentage of Electricity Consumption by Sector(%)
Sector 2010 2014 2015 2016
Total 100 100 100 100 Domestic 35.9 29.4 26.9 25.6
Commercial 32.1 30.2 48.2 52.1
Government 16.1 24.7 9.3 6.6
Agriculture 8.2 5.4 5.7 5.7
Industry 7.2 10 9.7 9.8
Other 0.6 0.4 0.3 0.1
Source: Abu Dhabi Distribution Company, Al Ain Distribution Company
2010 2014 2015 2016
0
10,000,000
20,000,000
30,000,000
40,000,000
294 | Statistical Yearbook of Abu Dhabi 2017
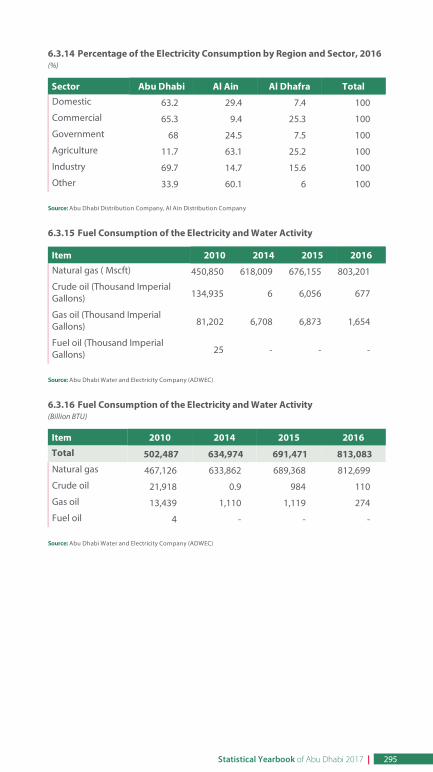
6.3.14 Percentage of the Electricity Consumption by Region and Sector, 2016(%)
Sector Abu Dhabi Al Ain Al Dhafra TotalDomestic 63.2 29.4 7.4 100
Commercial 65.3 9.4 25.3 100
Government 68 24.5 7.5 100
Agriculture 11.7 63.1 25.2 100
Industry 69.7 14.7 15.6 100
Other 33.9 60.1 6 100
Source: Abu Dhabi Distribution Company, Al Ain Distribution Company
6.3.15 Fuel Consumption of the Electricity and Water Activity
Item 2010 2014 2015 2016Natural gas ( Mscft) 450,850 618,009 676,155 803,201
Crude oil (Thousand ImperialGallons) 134,935 6 6,056 677
Gas oil (Thousand ImperialGallons) 81,202 6,708 6,873 1,654
Fuel oil (Thousand ImperialGallons) 25 - - -
Source: Abu Dhabi Water and Electricity Company (ADWEC)
6.3.16 Fuel Consumption of the Electricity and Water Activity(Billion BTU)
Item 2010 2014 2015 2016
Total 502,487 634,974 691,471 813,083 Natural gas 467,126 633,862 689,368 812,699
Crude oil 21,918 0.9 984 110
Gas oil 13,439 1,110 1,119 274
Fuel oil 4 - - -
Source: Abu Dhabi Water and Electricity Company (ADWEC)
Statistical Yearbook of Abu Dhabi 2017 | 295
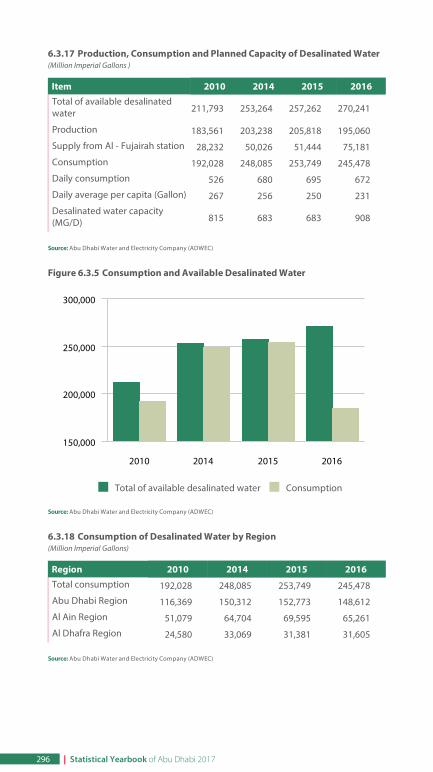
6.3.17 Production, Consumption and Planned Capacity of Desalinated Water(Million Imperial Gallons )
Item 2010 2014 2015 2016Total of available desalinatedwater 211,793 253,264 257,262 270,241
Production 183,561 203,238 205,818 195,060
Supply from Al - Fujairah station 28,232 50,026 51,444 75,181
Consumption 192,028 248,085 253,749 245,478
Daily consumption 526 680 695 672
Daily average per capita (Gallon) 267 256 250 231
Desalinated water capacity(MG/D) 815 683 683 908
Source: Abu Dhabi Water and Electricity Company (ADWEC)
Figure 6.3.5 Consumption and Available Desalinated Water
. Total of available desalinated water . Consumption
Source: Abu Dhabi Water and Electricity Company (ADWEC)
6.3.18 Consumption of Desalinated Water by Region(Million Imperial Gallons)
Region 2010 2014 2015 2016Total consumption 192,028 248,085 253,749 245,478
Abu Dhabi Region 116,369 150,312 152,773 148,612
Al Ain Region 51,079 64,704 69,595 65,261
Al Dhafra Region 24,580 33,069 31,381 31,605
Source: Abu Dhabi Water and Electricity Company (ADWEC)
2010 2014 2015 2016
150,000
200,000
250,000
300,000
296 | Statistical Yearbook of Abu Dhabi 2017
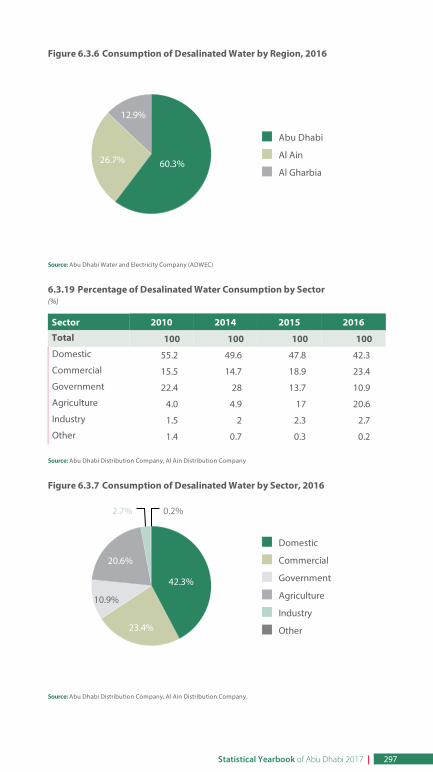
Figure 6.3.6 Consumption of Desalinated Water by Region, 2016
. Abu Dhabi
. Al Ain
. Al Gharbia
Source: Abu Dhabi Water and Electricity Company (ADWEC)
6.3.19 Percentage of Desalinated Water Consumption by Sector(%)
Sector 2010 2014 2015 2016
Total 100 100 100 100 Domestic 55.2 49.6 47.8 42.3
Commercial 15.5 14.7 18.9 23.4
Government 22.4 28 13.7 10.9
Agriculture 4.0 4.9 17 20.6
Industry 1.5 2 2.3 2.7
Other 1.4 0.7 0.3 0.2
Source: Abu Dhabi Distribution Company, Al Ain Distribution Company
Figure 6.3.7 Consumption of Desalinated Water by Sector, 2016
. Domestic
. Commercial
. Government
. Agriculture
. Industry
. Other
Source: Abu Dhabi Distribution Company, Al Ain Distribution Company.
60.3%26.7%
12.9%
42.3%
23.4%
10.9%
20.6%
2.7% 0.2%
Statistical Yearbook of Abu Dhabi 2017 | 297
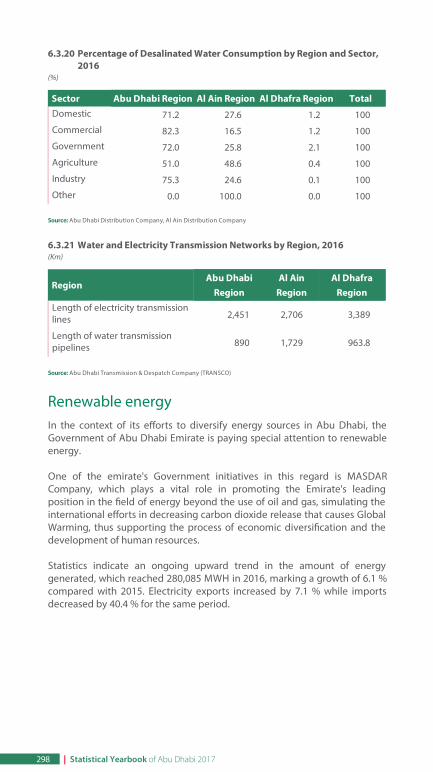
6.3.20 Percentage of Desalinated Water Consumption by Region and Sector,2016
(%)
Sector Abu Dhabi Region Al Ain Region Al Dhafra Region TotalDomestic 71.2 27.6 1.2 100
Commercial 82.3 16.5 1.2 100
Government 72.0 25.8 2.1 100
Agriculture 51.0 48.6 0.4 100
Industry 75.3 24.6 0.1 100
Other 0.0 100.0 0.0 100
Source: Abu Dhabi Distribution Company, Al Ain Distribution Company
6.3.21 Water and Electricity Transmission Networks by Region, 2016(Km)
RegionAbu Dhabi
RegionAl Ain
RegionAl Dhafra
RegionLength of electricity transmissionlines 2,451 2,706 3,389
Length of water transmissionpipelines 890 1,729 963.8
Source: Abu Dhabi Transmission & Despatch Company (TRANSCO)
Renewable energyIn the context of its efforts to diversify energy sources in Abu Dhabi, theGovernment of Abu Dhabi Emirate is paying special attention to renewableenergy.
One of the emirate's Government initiatives in this regard is MASDARCompany, which plays a vital role in promoting the Emirate's leadingposition in the eld of energy beyond the use of oil and gas, simulating theinternational efforts in decreasing carbon dioxide release that causes GlobalWarming, thus supporting the process of economic diversi cation and thedevelopment of human resources.
Statistics indicate an ongoing upward trend in the amount of energygenerated, which reached 280,085 MWH in 2016, marking a growth of 6.1 %compared with 2015. Electricity exports increased by 7.1 % while importsdecreased by 40.4 % for the same period.
298 | Statistical Yearbook of Abu Dhabi 2017
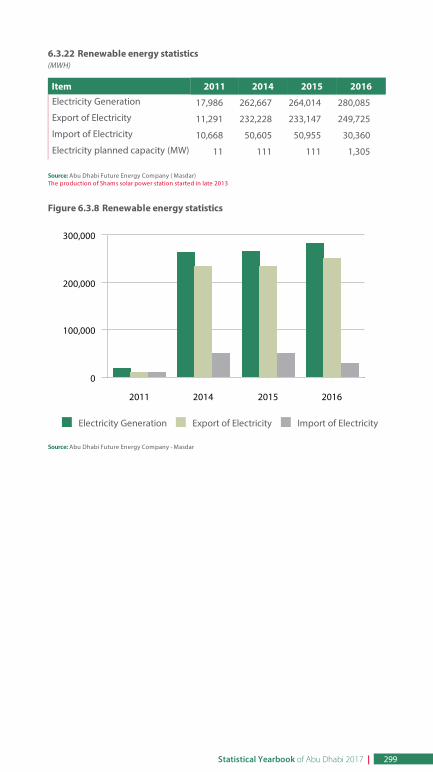
6.3.22 Renewable energy statistics(MWH)
Item 2011 2014 2015 2016Electricity Generation 17,986 262,667 264,014 280,085
Export of Electricity 11,291 232,228 233,147 249,725
Import of Electricity 10,668 50,605 50,955 30,360
Electricity planned capacity (MW) 11 111 111 1,305
Source: Abu Dhabi Future Energy Company ( Masdar)The production of Shams solar power station started in late 2013
Figure 6.3.8 Renewable energy statistics
. Electricity Generation . Export of Electricity . Import of Electricity
Source: Abu Dhabi Future Energy Company - Masdar
2011 2014 2015 2016
0
100,000
200,000
300,000
Statistical Yearbook of Abu Dhabi 2017 | 299


![Presentazione standard di PowerPoint€¦ · %Scad C] TOT portafC] Scad C] Scad 120 A Scad 120 C] Scad 150 A Scad 150 72468 261 618 45 go 188 527 C] Scad 180 A Scad 180 C] Scad 30](https://img.pdfslide.us/doc/110x75/60aafa6f3697c86f175cace5/presentazione-standard-di-scad-c-tot-portafc-scad-c-scad-120-a-scad-120-c-scad.jpg)