Embed Size (px)
Citation preview
VOL. 13, NO. 20, OCTOBER 2018 ISSN 1819-6608
ARPN Journal of Engineering and Applied Sciences ©2006-2018 Asian Research Publishing Network (ARPN). All rights reserved.
www.arpnjournals.com
8257
STATISTICAL VALIDATION OF PATIENT VITAL SIGNS BASED ON
ENERGY-EFFICIENT WIRELESS SENSOR NETWORK
MONITORING SYSTEM
Ahmed Bashar Fakhri, Sadik Kamel Gharghan and Saleem Latteef Mohammed
Department of Medical Instrumentation Techniques Engineering, Electrical Engineering Technical College, Middle Technical
University, Baghdad, Iraq
E-Mail: [email protected]
ABSTRACT
Vital signs taken from the patient's body has gained significant interest among researchers studying disease
diagnosis. To achieve accurate diagnoses, the performance metrics of any proposed system must be satisfied. Two
essential metrics can be found in such a system; the first metric is the measurement accuracy and the second one is the
power efficiency. This paper aims to introduce accurate measurements and improve the power consumption of the
proposed system. This study introduced a prototype of wireless vital signs monitoring system (WVSMS) for monitoring
three vital parameters (i.e. heart rate, Spo2 and temperature) of patients inside/outside hospitals. A ZigBee wireless
protocol was interfaced with the Arduino Pro mini based on ATmega 328p microcontroller to alert doctors in real time via
a wireless sensor network (WSN) in emergency cases when a patient’s vital signs rise to a critical level. The measurement
accuracies of the heart rate, Spo2 and temperature are achieved relative to the consumer-ready devices based on statistical
analyses, such as mean error, Bland-Altman and histogram. The power consumption of the WVSMS is improved by using
duty cycle for the sleep/wake scheme. The experimental results revealed that the three vital parameters can be measured
with high accuracy of 99.4%. In addition, the power savings of 84.5 % is achieved. Moreover, the WVSMS outperformed
a similar system in terms of accuracy and power consumption.
Keywords: measurement accuracy, sensor, statistical analysis, wireless sensor network, ZigBee.
1. INTRODUCTION Vital signs from patients are crucial in disease
diagnosis. Medical parameters of patients, particularly
temperature, heart rate, blood oxygen level (SpO2),
electrocardiogram (ECG), and breathing rate can be
monitored by using sensors. These parameters can be
transmitted wirelessly by using wireless sensor network
(WSN) technologies. Thus, power consumption must be
as small as possible for robust data delivery. In this study,
we proposed wearable vital signs monitoring system
(WVSMS) based on the ZigBee wireless technology. This
device measure and monitor vital signals wirelessly. The
ZigBee wireless technology is widely used for monitoring
medical signals [1-3]because it has an efficient power
consumption mechanism and is inexpensive[4, 5]. Vital
signs can be measured and sent to caregivers by
employing a wireless protocol for real-time patient
monitoring, thereby enabling the caregivers to assist
patients during risk cases.
Vital signs have been extensively researched.
However, most studies [6-14] did not consider
measurement accuracy. Megalingam et al. [15] designed a
wheeled patient monitoring system that monitors multi
health parameters, such as body temperature, heart rate,
and oxygen level, and notifies healthcare professionals via
a communication GSM module. The system can be
implemented in hospitals and rehabilitation centers and is
easily connected to a wheelchair. Miramontes et al. [4]
developed and executed a health-monitoring system
called PlaIMoS for receiving vital signals (i.e., ECG,
temperature, heart rate, blood oxygen, skin response, fall
detection, and respiration rate) from old people
noninvasively in real time. The system uses Bluetooth,
ZigBee, and Wi-Fi to send data in real-time on mobile
operating systems. The system is small and inexpensive
and has long battery life. However, the galvanic skin
response lacks effectiveness. Watthanawisuth et al. [16]
proposed implementation of WSN for real-time health
monitoring systems based on ZigBee wireless technology.
The system is implemented to monitor the pulse and
SpO2. The system is low cost, small, noninvasive, and
comfortable for daily use and has low power
consumption. However, the number of adopted sensors
are few in their experiment. Yuce [17] designed and
implemented a complete wireless body-area network
platform to measure pulse rate, temperature, ECG, and
electroencephalogram(EEG). The platform is extensively
used in medical centers because it has a wide range, is
cost-effective, has low power consumption, is flexible to
the patients, improves quality of life, is highly efficient,
and removes external interferences. However, the system
is large and the sensor node uses wired connections with a
central control unit.
Roh et al. [18] proposed a wearable wireless
monitoring system that can evaluate the degree of
depression on the basis of physiological signs via
Smartphones. The system consists of a planner board with
three electrodes, 16 registers for data management, low
power front end, and nonlinear accelerometer. The system
depends on certain filters to reduce heart rate signal noise.
Experimental results compared the proposed system with
commercial standard signals and indicated that the
proposed system is lighter than commercial products. The
proposed system did not consider any power reduction
VOL. 13, NO. 20, OCTOBER 2018 ISSN 1819-6608
ARPN Journal of Engineering and Applied Sciences ©2006-2018 Asian Research Publishing Network (ARPN). All rights reserved.
www.arpnjournals.com
8258
technique to reduce its power consumption. However, the
proposed system consumes 100 mA. The system was
convenient because of using android smart phone and
depression scale accuracy of 71% is achieved.
Zhou et al. [19] used a modern low-power
wearable small instrument for monitoring fall detection
and heart rate. The device comprises a microcontroller
(MSP430), three-axes digital accelerometer, filters, and a
Bluetooth wireless module (CC2540). Experimental
results extracted the standard deviation of adjacent peak-
to-peak spacing and adjacent peak-to-peak amplitude as
well as it shows a good consistency relative to Polar
Electro. The power consumption of the proposed system
is reduced to 290 μA based on standby power mode. The
measurement accuracy of the system is 93.75%.
Advantages: small size, detectsheartbeat
problems in old people, more effective than POLAR
RS100, and low cost and power consumption.
Disadvantages: the system generates some errors
in measurements during movement.
Ngu et al. [20] designed a Smart watch system
that can establish communication with Smartphones to
evolve a fall detection internet-of-things application. The
system provides a reliable detection accuracy of 93.8%.
The system consists of a Smart watch equipped with an
accelerometer, Bluetooth Low Energy (BLE), and storage
unit and is capable of data analysis. They used Weka (a
Java package using for training and prediction of falls).
Moreover, Java is used for the support of the Android
access or host. Experimental results showed that the
system has shortcomings between unexpected arm signals
and real falls. Their proposed system draws 83.33 mA
from the battery of the system and has no power reduction
mechanisms. The measurement accuracy of the system is
93.8%.
Advantages: the system can work anywhere
(easy to use), lightweight, noninvasive, and private.
Disadvantage: the system is incapable of
distinguishing unexpected arm gestures from real falls.
Rosa et al. [21] proposed a prototype to set
walking weakness and fall risk of the elderly at home.
They used a fall risk index based on various pattern
recognition and gait parameters. The study used the BLE
protocol to transfer data from the monitoring system to
the smartphone. The system consists of a pressure sensor
matrix, 6D accelerometer and gyroscope, flexible battery,
and inductive charging. The data are transmitted via Wi-
Fi or 3G to a PC or smartphone. The experimental results
indicated that a similarity occurred between the risk of
falls with maintained accuracy (i.e., 93.9%) and normal
performance-based tests. The proposed project can
decrease the current consumption to 50 mA (i.e., 20 h
lifetime). However, the system has no power reduction
mechanism.
Advantages: flexible, easy to use, and scalable.
Disadvantages: (i) the data are not collected from
all subjects because of limited multifunctioning of the
prototype, (ii) transition and obstacle situations are not
adopted in the work because the proposed system
measurement emphasized steady-state gait positions, and
(iii) a low number of volunteers tested the system.
He et al. [22] proposed an efficient framework
based on tri-axial acceleration and gyroscope to test the
variation between fall and normal activities. They used
the Bluetooth WSN technology. The noise of
accelerometer measurements was reduced by using
Kalman filter. The framework consists of a Bluetooth
device, tri-axial accelerometer, gyroscope sensors, and
Android smartphone. The fall detection accuracy of
95.67% was estimated with Kalman filter. The entire
system consumes approximately 142 mA and has no
power reduction mechanism.
Advantages: lightweight, low cost, and suitable
for elderly usage.
Disadvantage: the proposed system consumes
high power compared with other related work.
Magno et al. [23] presented a modified efficient
power strategy for wearable wireless sensor node. The
authors used the sleep/wake scheme with maintained
activity recognition. The main components of the system
are the processing-sensor unit, BLE (i.e., AMS002), RF
868 MHz radio (CC1110), accelerometer (BMC150),
microcontroller (NXP LPC54102), nano power wake-up
radio, and batteries of 200 mAh for slave node and 1000
mAh for master node. The experimental results proved the
power consumption and system accuracy. The proposed
system increases the lifetime of the sensor node to four
times relative to that of a traditional one. Consequently,
the power consumption can be minimized to 7.878 mA by
using a specific technique, such as sleep/wake strategy.
An accuracy of 97% was obtained.
Advantages: efficient battery life and integration between
hardware and software techniques.
Gharghan [24] designed and implemented a real-
time remote monitoring system(RTRMS) for measuring
the patient's temperature in/out hospitals by using a GSM
modem and microcontroller. Their system is capable of
sending warnings to caregivers via short message service
when the temperatures of patients rise. The system
consists of a GSM modem (SmartG100), microcontroller
(PIC16F877A), temperature sensor (LM35), LCD, buzzer,
power unit (rechargeable battery 7.2 V/1,000 mA).
Experimental results indicated a close agreement between
the proposed system and benchmark. The RTRMS
reduced the current consumption to 3.087 mA. In this
case, the RTRMS lifetime can be prolonged to 324 h prior
to the charging cycle based on a sleep/wake scheme. The
accuracy of the system is 99%.The proposed system
provided surveillance for patients who are located in far
places. In addition, the system can be used for patient
monitoring in real-time when he/she is located at home.
Moreover, the system was low cost because it uses the
infrastructure mobile network. The system is also
movable and power efficient, with high measurement
accuracy. However, the system is slightly large.
Previous studies introduced certain limitations
related to measurement that pose challenges in vital signs
monitoring systems such as low measurement accuracy of
VOL. 13, NO. 20, OCTOBER 2018 ISSN 1819-6608
ARPN Journal of Engineering and Applied Sciences ©2006-2018 Asian Research Publishing Network (ARPN). All rights reserved.
www.arpnjournals.com
8259
the heart rate, SpO2, and temperature parameters. In
addition, some of these studies did not consider
measurement accuracy. Moreover, some of them are
presented a wired connection system that led to a
restricted patient movement. These drawbacks motivated
us to develop a prototype wireless sensor network
measurement system with high accuracy.
The most significant vital signs that can be
observed are temperature, heart rate, acceleration, ECG,
and SpO2 [2, 4, 16]. Among these vital signs, temperature,
heart rate, and SpO2 are three significant signals
considered in the present work. Consumer-ready devices
such as the Pic solution, Rossmax, and Finger Tip devices
can measure temperature, heart rate, and oxygen level,
respectively, by employing two sensors. One sensor
detects heart rate and Spo2, and the other detects
temperature. In this study, the WVSMS measurement
accuracies were validated relative to the aforementioned
benchmark devices. Validation was performed by using
statistical analysis, such as error calculations (mean
absolute percentage error [MAPE], mean absolute error
[MAE], root mean square error [RMSE], and mean square
error [MSE]), Bland-Altman test, and histogram test. The
WVSMS consists of two transmitter and receiver nodes.
The transmitter node includes two sensors (heart rate and
SpO2 embedded in one sensor and temperature sensor),
Arduino Pro mini board, and ZigBee wireless standard
(XBee S2C). The receiver node comprises an Arduino
Uno board and ZigBee (XBee S2). The Arduino Uno
board was interfaced with a laptop, where measured
parameters can be viewed and process by using the Maker
Plot software [25].
The contributions of the paper can be
summarized as follows:
a) The paper presents a novel portable device (i.e.,
WVSMS) based on a wireless sensor network with
low power consumption.
b) The paper compares the results that were obtained
with consumer-ready devices that were used for
patient monitoring system.
c) The performance validation of the proposed WVSMS
is achieved through statistical analysis.
d) The accuracy of the proposed WVSMS is verified.
2. SYSTEM ARCHITECTURE
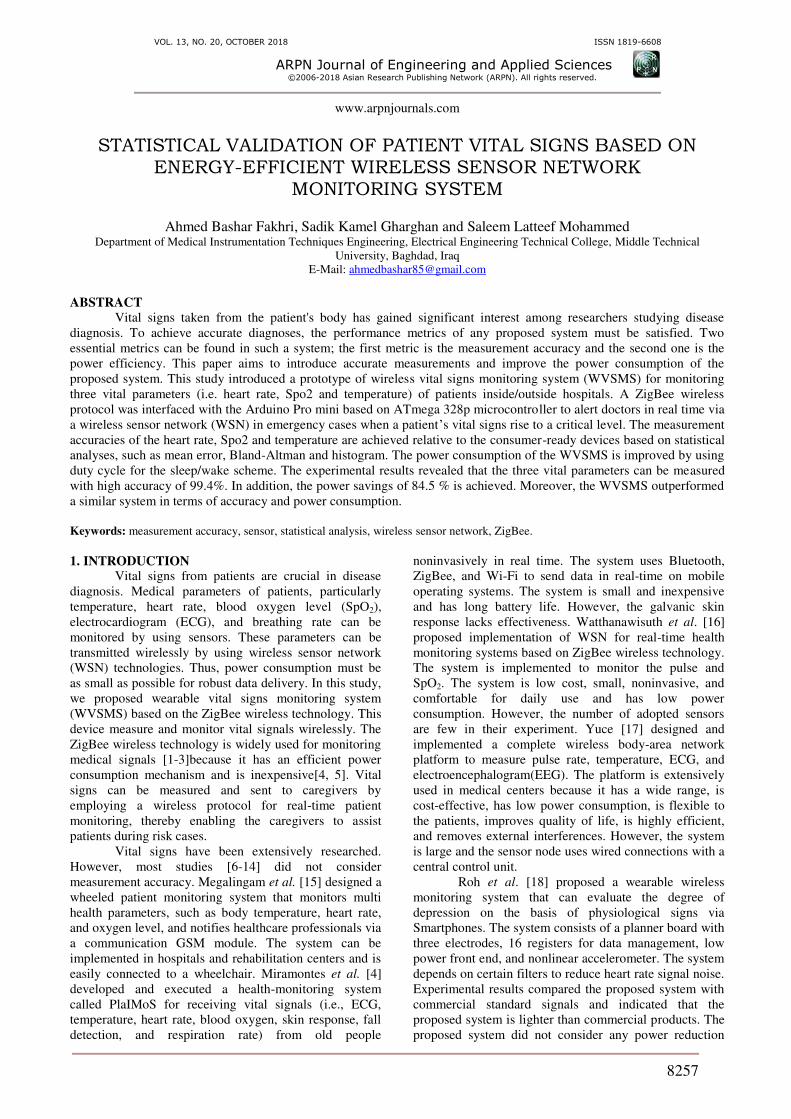
The proposed WVSMS is illustrated in Figure 1a.
The system consists of a transmitter sensor node (sensor
node) and a receiver node (coordinator node), as shown in
Figures 1b and c. The transmitter sensor node comprises
several components, as follows: a temperature sensor,
heart rate sensor, and SpO2sensor, Arduino Pro mini
board, ZigBee module (XBee S2C), and two lithium
batteries (3.7 V/2200 mAh). The receiver node consists of
an Arduino Uno board, an XBee S2 module, and a laptop
for the monitoring of vital parameter data in real time.
The measured data were compared with those obtained
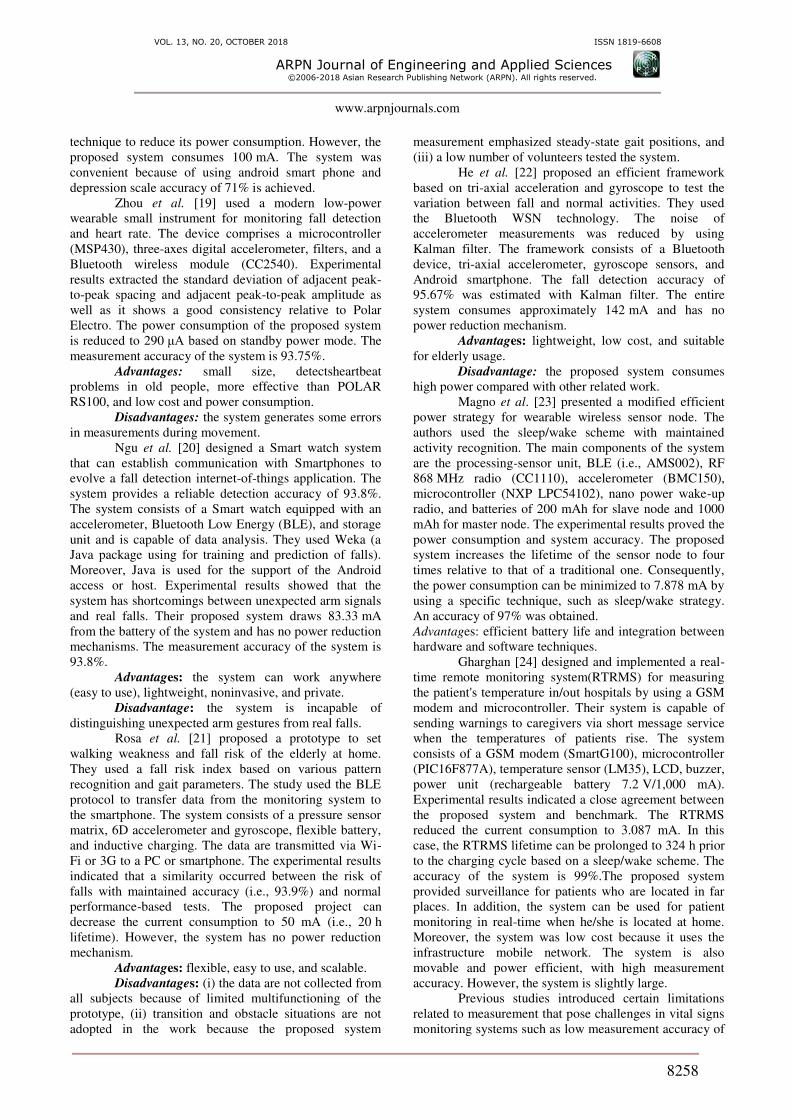
through the benchmark system. Figures 2a, b, and c show
the benchmark devices of temperature, heart rate, and
SpO2, respectively. The accuracies of the benchmark
devices are ±0.2°C (temperature) [26], ±5 (heart rate)[27],
and ±2% (Spo2)[28].
Figure-1. Proposed WVSMS (a) block diagram of the
whole system, (b) hardware ofthe sensor node, and (c)
hardware of receiver node.
Figure-2. Benchmark devices of (a) temperature, (b) heart
rate, and (c) SpO2.
3. HARDWARE IMPLEMENTATION
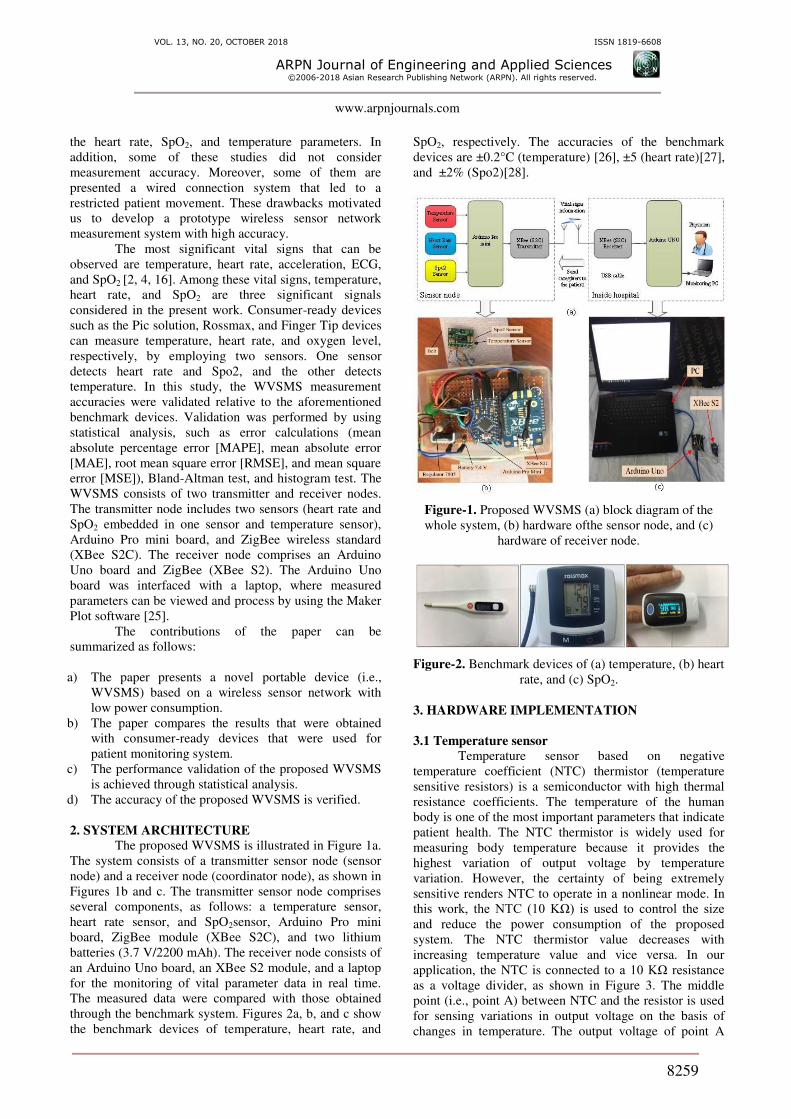
3.1 Temperature sensor
Temperature sensor based on negative
temperature coefficient (NTC) thermistor (temperature
sensitive resistors) is a semiconductor with high thermal
resistance coefficients. The temperature of the human
body is one of the most important parameters that indicate
patient health. The NTC thermistor is widely used for
measuring body temperature because it provides the
highest variation of output voltage by temperature
variation. However, the certainty of being extremely
sensitive renders NTC to operate in a nonlinear mode. In
this work, the NTC (10 KΩ) is used to control the size and reduce the power consumption of the proposed
system. The NTC thermistor value decreases with
increasing temperature value and vice versa. In our
application, the NTC is connected to a 10 KΩ resistance as a voltage divider, as shown in Figure 3. The middle
point (i.e., point A) between NTC and the resistor is used
for sensing variations in output voltage on the basis of
changes in temperature. The output voltage of point A
VOL. 13, NO. 20, OCTOBER 2018 ISSN 1819-6608
ARPN Journal of Engineering and Applied Sciences ©2006-2018 Asian Research Publishing Network (ARPN). All rights reserved.
www.arpnjournals.com
8260
(Vout) is changed between 0 and 5 depending on the
temperature of the patient. The temperature corresponds
to the A/D converter of the Arduino microcontroller 0-
1023 (10-bit resolution). The output voltage of the voltage
divider can be translated to temperature in Celsius
through Equation (1)[29].
Temperature (°C) = 𝑉𝑜𝑢𝑡 ∗ (100 °𝐶 𝑉⁄ ) (1)
Figure-3. Circuit diagram of the NTC thermistor.
3.2 Pulse oximeter and heart rate
sensor
The saturation percentage of oxygen in the blood
(SpO2) can be measured by a noninvasive method called
pulse oximetry. The pulse oximetry principle is based on
the blood absorption characteristics of light. A blood
oxygen sensor (MAX30100) is used to obtain the blood
oxygen value. This sensor consists of two LEDs (red and
infrared) that emit light at different wavelengths. The light
measured by a photodiode after it passes through the
user’s finger. The absorption of deoxyhemoglobin and
oxyhemoglobin red and infrared light differently. The
MAX 30100 can calculate the value of Spo2 based on
Equation (2).
Spo2 = 10.0002𝑅3 − 52.887𝑅2 + 26.817𝑅 + 98.293, (2)
where R is the ratio between infrared and red light [16].In
addition, this sensor also can be used to measure the heart
rate based on Equations 3 and4.
𝐹𝑟𝑒𝑞𝑢𝑒𝑛𝑐𝑦 = 106/(𝐵𝑃𝑀𝑇_𝑇_𝐶𝑂𝑈𝑁𝑇 ∗ 10) (3)
Heart Rate = Frequency/60 (4)
Where BPM_T_COUNT represents total tick count.
Therefore, the frequency can be measured by
applying Equation (3), and the heart rate can be computed
based on Equation (4) [2].
3.3 Microcontroller
An 8-bit 16 MHz Arduino Pro Mini
microcontroller is used in this study. The unit uses
32 Kbyte flash memory [30]. An analog to digital
converter (A/C) is used, with seven-channel 10-bit
resolution, 14 digital input/output pins with 6 that provide
pulse width modulation, and an SPI interface. The
converter operates at 5 V from a battery[31]. The Arduino
can be programmed in a language, such as C++, with
some simplifications and modifications, and the essential
libraries of Arduino have been written in C and C++ [32].
In this study, the Arduino Pro Mini based on ATmega
328p microcontroller was programmed to forward the
data from the three sensors to the XBee S2C module. The
microcontroller transmits the data via the serial port to the
XBee module at 9,600 bps. By contrast, the XBee S2C in
the receiver circuit is used to receive data and send it to
the laptop via Arduino Uno, as shown in Figure-1. The
output of the microcontroller is displayed on the laptop
using graphical user interface (GUI) software
(MakerPlot).
3.4 Wireless protocol
ZigBee wireless protocol is a technology created
for control and sensor networks based on the IEEE
802.15.4. The protocol can be used globally and is
reliable and secure. ZigBee supports up to 65,000 nodes.
ZigBee is easy to deploy with extremely long battery life
and low cost. The data rate of ZigBee is 250 kbps, with 6
or 10 ms latency. Three basic types of XBee are available,
namely, S1, S2, and S2C. Among these types, XBee S2C
was selected in this study because of its low power
consumption of 33 mA and long communication distance
(1,200 m outdoors and 60 m indoors[33]) compared with
XBee S1 and XBee S2. By contrast, S1 and S2 consume
50 and 40 mA, respectively. In addition, the S1 can cover
a communication distance up to 100 m outdoors and 30 m
indoors[34]. XBee S2 can reach 120 m outdoors and 40 m
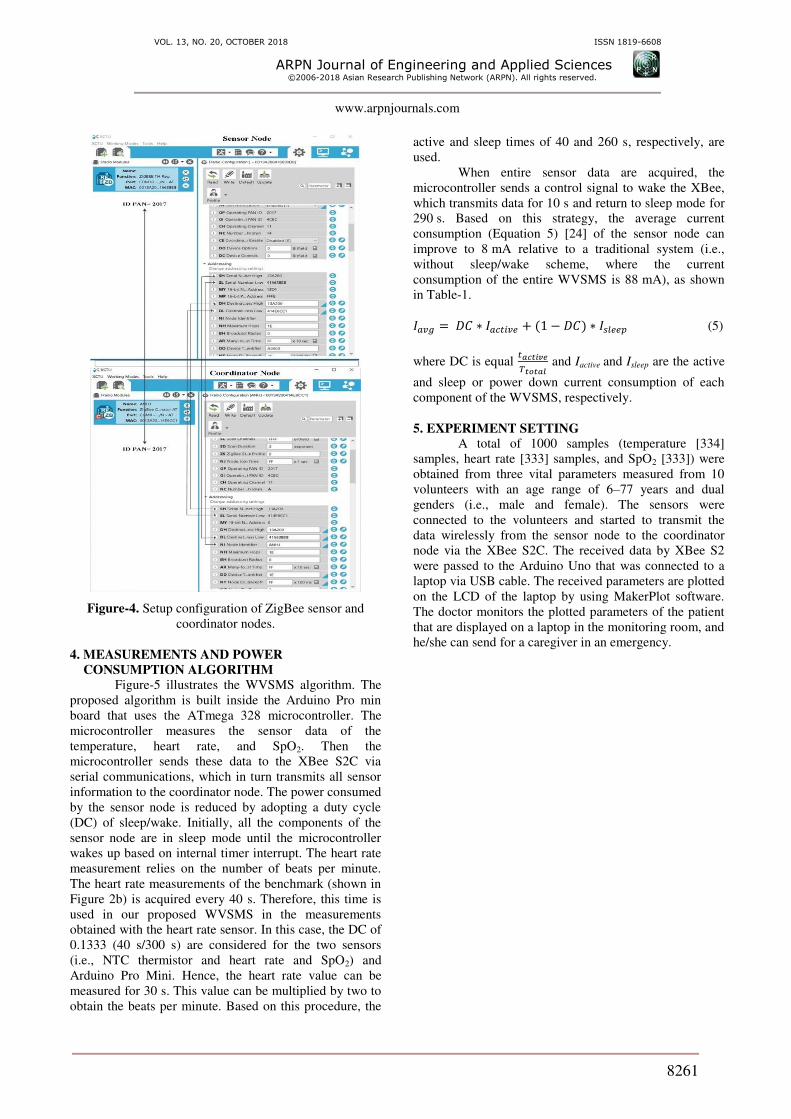
indoors[35]. The setup configuration of the ZigBee sensor
node and coordinator node of the proposed system are
shown in Figure-4.
VOL. 13, NO. 20, OCTOBER 2018 ISSN 1819-6608
ARPN Journal of Engineering and Applied Sciences ©2006-2018 Asian Research Publishing Network (ARPN). All rights reserved.
www.arpnjournals.com
8261
Figure-4. Setup configuration of ZigBee sensor and
coordinator nodes.
4. MEASUREMENTS AND POWER
CONSUMPTION ALGORITHM
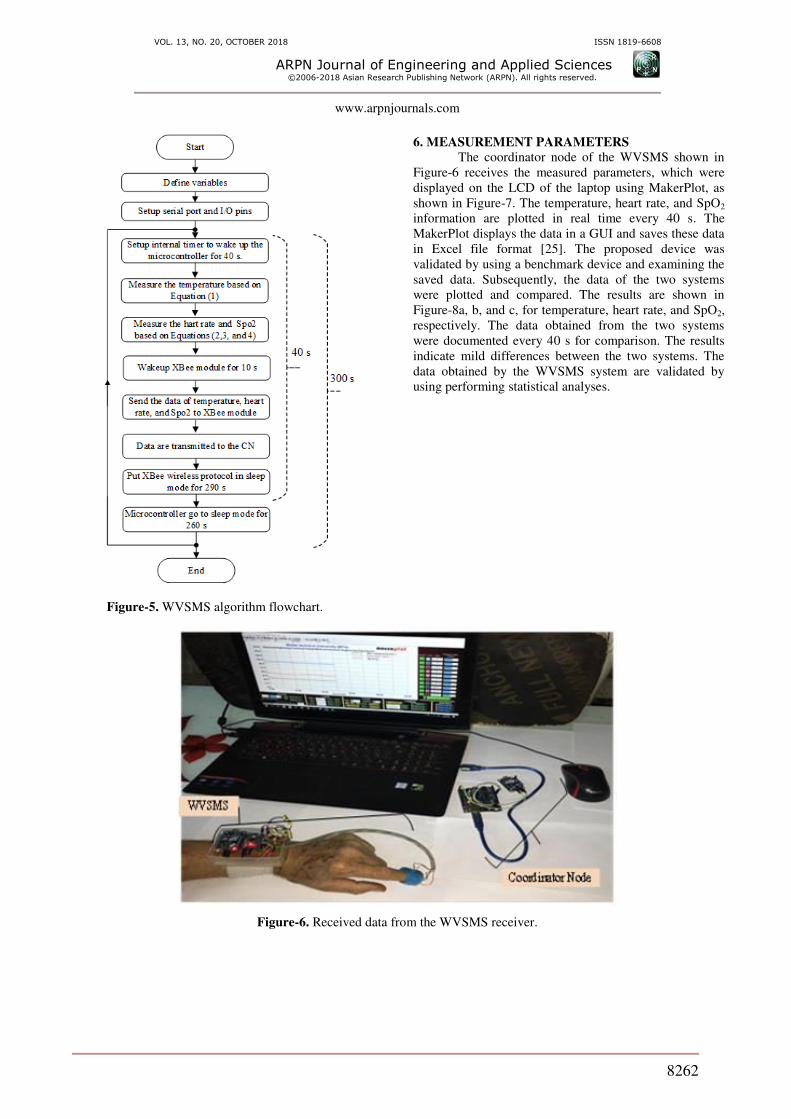
Figure-5 illustrates the WVSMS algorithm. The
proposed algorithm is built inside the Arduino Pro min
board that uses the ATmega 328 microcontroller. The
microcontroller measures the sensor data of the
temperature, heart rate, and SpO2. Then the
microcontroller sends these data to the XBee S2C via
serial communications, which in turn transmits all sensor
information to the coordinator node. The power consumed
by the sensor node is reduced by adopting a duty cycle
(DC) of sleep/wake. Initially, all the components of the
sensor node are in sleep mode until the microcontroller
wakes up based on internal timer interrupt. The heart rate
measurement relies on the number of beats per minute.
The heart rate measurements of the benchmark (shown in
Figure 2b) is acquired every 40 s. Therefore, this time is
used in our proposed WVSMS in the measurements
obtained with the heart rate sensor. In this case, the DC of
0.1333 (40 s/300 s) are considered for the two sensors
(i.e., NTC thermistor and heart rate and SpO2) and
Arduino Pro Mini. Hence, the heart rate value can be
measured for 30 s. This value can be multiplied by two to
obtain the beats per minute. Based on this procedure, the
active and sleep times of 40 and 260 s, respectively, are
used.
When entire sensor data are acquired, the
microcontroller sends a control signal to wake the XBee,
which transmits data for 10 s and return to sleep mode for
290 s. Based on this strategy, the average current
consumption (Equation 5) [24] of the sensor node can
improve to 8 mA relative to a traditional system (i.e.,
without sleep/wake scheme, where the current
consumption of the entire WVSMS is 88 mA), as shown
in Table-1.
𝐼𝑎𝑣𝑔 = 𝐷𝐶 ∗ 𝐼𝑎𝑐𝑡𝑖𝑣𝑒 + (1 − 𝐷𝐶) ∗ 𝐼𝑠𝑙𝑒𝑒𝑝 (5)
where DC is equal 𝑡𝑎𝑐𝑡𝑖𝑣𝑒𝑇𝑡𝑜𝑡𝑎𝑙 and Iactive and Isleep are the active
and sleep or power down current consumption of each
component of the WVSMS, respectively.
5. EXPERIMENT SETTING
A total of 1000 samples (temperature [334]
samples, heart rate [333] samples, and SpO2 [333]) were
obtained from three vital parameters measured from 10
volunteers with an age range of 6–77 years and dual
genders (i.e., male and female). The sensors were
connected to the volunteers and started to transmit the
data wirelessly from the sensor node to the coordinator
node via the XBee S2C. The received data by XBee S2
were passed to the Arduino Uno that was connected to a
laptop via USB cable. The received parameters are plotted
on the LCD of the laptop by using MakerPlot software.
The doctor monitors the plotted parameters of the patient
that are displayed on a laptop in the monitoring room, and
he/she can send for a caregiver in an emergency.
VOL. 13, NO. 20, OCTOBER 2018 ISSN 1819-6608
ARPN Journal of Engineering and Applied Sciences ©2006-2018 Asian Research Publishing Network (ARPN). All rights reserved.
www.arpnjournals.com
8262
6. MEASUREMENT PARAMETERS
The coordinator node of the WVSMS shown in
Figure-6 receives the measured parameters, which were
displayed on the LCD of the laptop using MakerPlot, as
shown in Figure-7. The temperature, heart rate, and SpO2
information are plotted in real time every 40 s. The
MakerPlot displays the data in a GUI and saves these data
in Excel file format [25]. The proposed device was
validated by using a benchmark device and examining the
saved data. Subsequently, the data of the two systems
were plotted and compared. The results are shown in
Figure-8a, b, and c, for temperature, heart rate, and SpO2,
respectively. The data obtained from the two systems
were documented every 40 s for comparison. The results
indicate mild differences between the two systems. The
data obtained by the WVSMS system are validated by
using performing statistical analyses.
Figure-5. WVSMS algorithm flowchart.
Figure-6. Received data from the WVSMS receiver.
VOL. 13, NO. 20, OCTOBER 2018 ISSN 1819-6608
ARPN Journal of Engineering and Applied Sciences ©2006-2018 Asian Research Publishing Network (ARPN). All rights reserved.
www.arpnjournals.com
8263
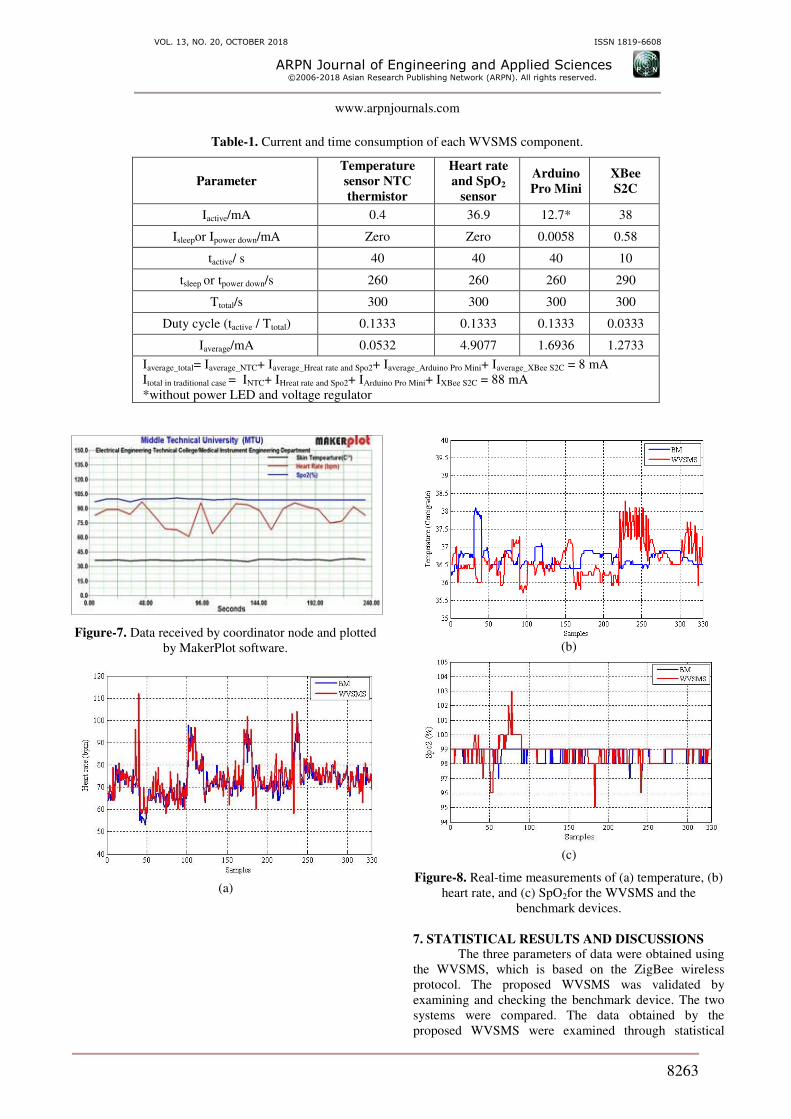
Table-1. Current and time consumption of each WVSMS component.
Parameter
Temperature
sensor NTC
thermistor
Heart rate
and SpO2
sensor
Arduino
Pro Mini
XBee
S2C
Iactive/mA 0.4 36.9 12.7* 38
Isleepor Ipower down/mA Zero Zero 0.0058 0.58
tactive/ s 40 40 40 10
tsleep or tpower down/s 260 260 260 290
Ttotal/s 300 300 300 300
Duty cycle (tactive / Ttotal) 0.1333 0.1333 0.1333 0.0333
Iaverage/mA 0.0532 4.9077 1.6936 1.2733
Iaverage_total= Iaverage_NTC+ Iaverage_Hreat rate and Spo2+ Iaverage_Arduino Pro Mini+ Iaverage_XBee S2C = 8 mA
Itotal in traditional case = INTC+ IHreat rate and Spo2+ IArduino Pro Mini+ IXBee S2C = 88 mA
*without power LED and voltage regulator
Figure-7. Data received by coordinator node and plotted
by MakerPlot software.
(a)
(b)
(c)
Figure-8. Real-time measurements of (a) temperature, (b)
heart rate, and (c) SpO2for the WVSMS and the
benchmark devices.
7. STATISTICAL RESULTS AND DISCUSSIONS The three parameters of data were obtained using
the WVSMS, which is based on the ZigBee wireless
protocol. The proposed WVSMS was validated by
examining and checking the benchmark device. The two
systems were compared. The data obtained by the
proposed WVSMS were examined through statistical
VOL. 13, NO. 20, OCTOBER 2018 ISSN 1819-6608
ARPN Journal of Engineering and Applied Sciences ©2006-2018 Asian Research Publishing Network (ARPN). All rights reserved.
www.arpnjournals.com
8264
analysis (i.e., error test, Bland-Altman test, histogram
test).
7.1 Error test
The error, mean absolute error (MAE), absolute
percentage error (APE), and mean absolute percentage
error (MAPE) in the temperature, heart rate, and SpO2
measurements of the WVSMS with respect to those of the
Benchmark are examined. Figures 9a and b, 10a and b,
and 11a and b show the error and absolute percentage
error for temperature, heart rate, and SpO2, respectively.
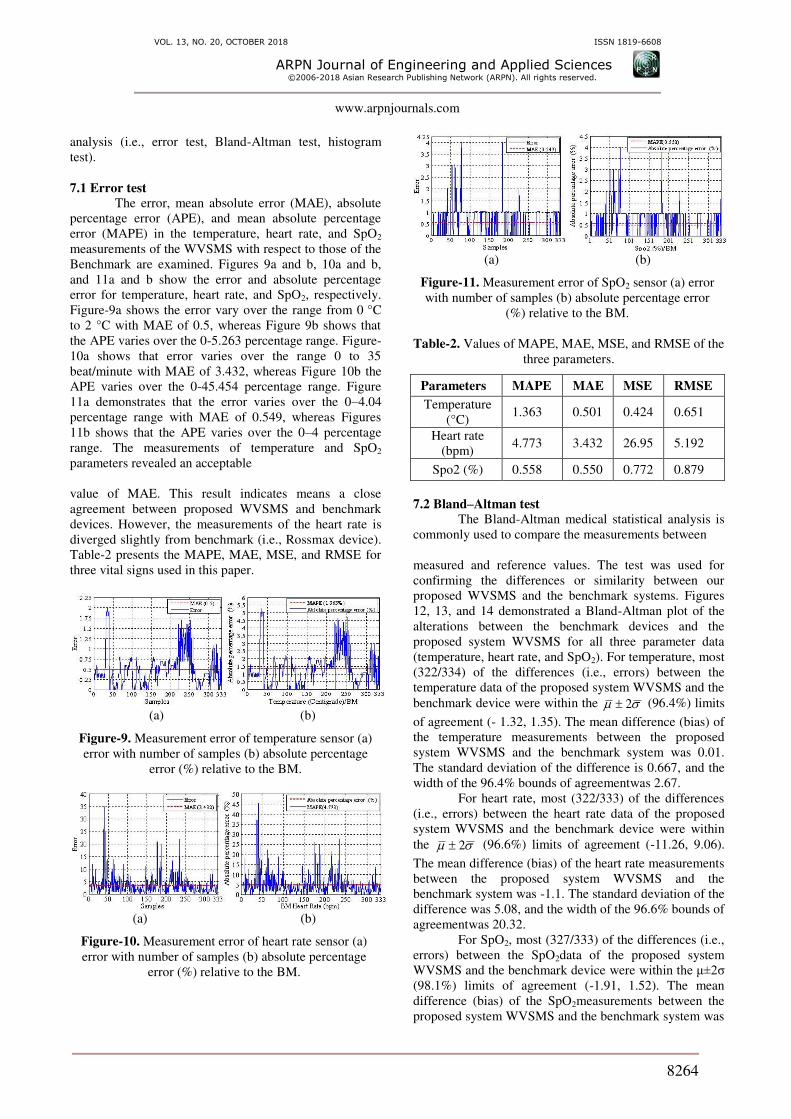
Figure-9a shows the error vary over the range from 0 °C
to 2 °C with MAE of 0.5, whereas Figure 9b shows that
the APE varies over the 0-5.263 percentage range. Figure-
10a shows that error varies over the range 0 to 35
beat/minute with MAE of 3.432, whereas Figure 10b the
APE varies over the 0-45.454 percentage range. Figure
11a demonstrates that the error varies over the 0–4.04
percentage range with MAE of 0.549, whereas Figures
11b shows that the APE varies over the 0–4 percentage
range. The measurements of temperature and SpO2
parameters revealed an acceptable
value of MAE. This result indicates means a close
agreement between proposed WVSMS and benchmark
devices. However, the measurements of the heart rate is
diverged slightly from benchmark (i.e., Rossmax device).
Table-2 presents the MAPE, MAE, MSE, and RMSE for
three vital signs used in this paper.
(a) (b)
Figure-9. Measurement error of temperature sensor (a)
error with number of samples (b) absolute percentage
error (%) relative to the BM.
(a) (b)
Figure-10. Measurement error of heart rate sensor (a)
error with number of samples (b) absolute percentage
error (%) relative to the BM.
(a) (b)
Figure-11. Measurement error of SpO2 sensor (a) error
with number of samples (b) absolute percentage error
(%) relative to the BM.
Table-2. Values of MAPE, MAE, MSE, and RMSE of the
three parameters.
Parameters MAPE MAE MSE RMSE
Temperature
(°C) 1.363 0.501 0.424 0.651
Heart rate
(bpm) 4.773 3.432 26.95 5.192
Spo2 (%) 0.558 0.550 0.772 0.879
7.2 Bland–Altman test
The Bland-Altman medical statistical analysis is
commonly used to compare the measurements between
measured and reference values. The test was used for
confirming the differences or similarity between our
proposed WVSMS and the benchmark systems. Figures
12, 13, and 14 demonstrated a Bland-Altman plot of the
alterations between the benchmark devices and the
proposed system WVSMS for all three parameter data
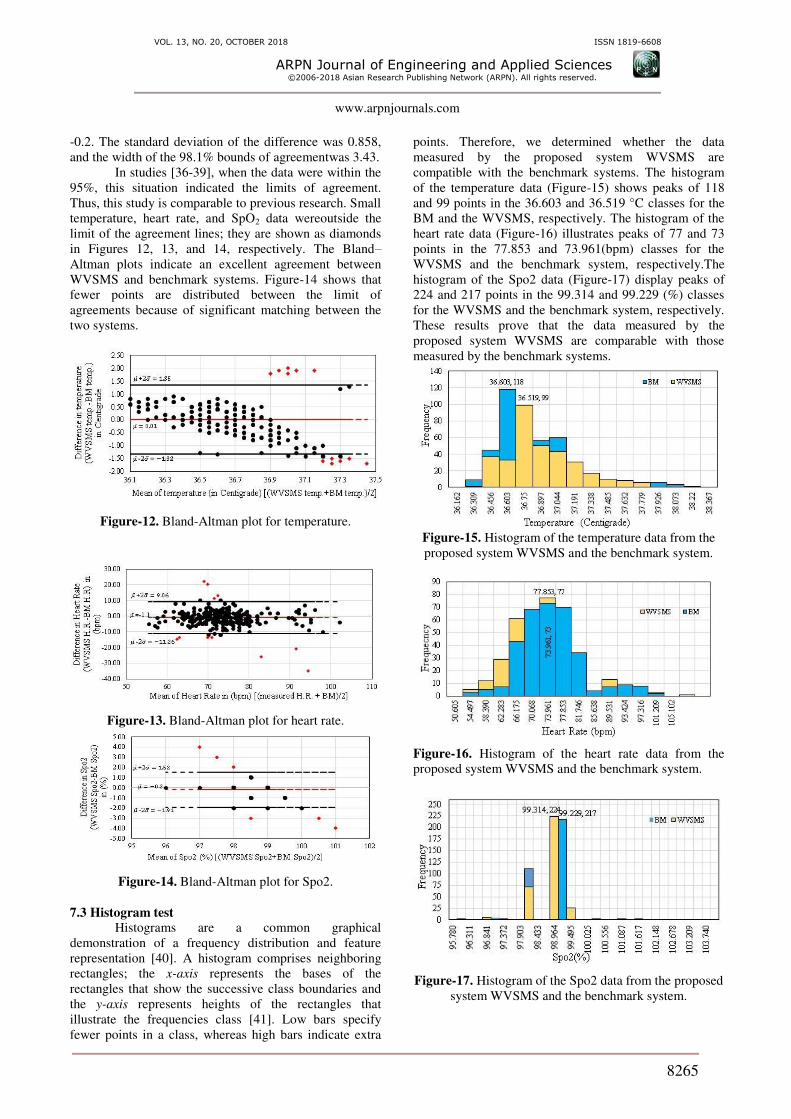
(temperature, heart rate, and SpO2). For temperature, most
(322/334) of the differences (i.e., errors) between the
temperature data of the proposed system WVSMS and the
benchmark device were within the 2 (96.4%) limits
of agreement (- 1.32, 1.35). The mean difference (bias) of
the temperature measurements between the proposed
system WVSMS and the benchmark system was 0.01.
The standard deviation of the difference is 0.667, and the
width of the 96.4% bounds of agreementwas 2.67.
For heart rate, most (322/333) of the differences
(i.e., errors) between the heart rate data of the proposed
system WVSMS and the benchmark device were within
the 2 (96.6%) limits of agreement (-11.26, 9.06).
The mean difference (bias) of the heart rate measurements
between the proposed system WVSMS and the
benchmark system was -1.1. The standard deviation of the
difference was 5.08, and the width of the 96.6% bounds of
agreementwas 20.32.
For SpO2, most (327/333) of the differences (i.e.,
errors) between the SpO2data of the proposed system
WVSMS and the benchmark device were within the μ±2σ
(98.1%) limits of agreement (-1.91, 1.52). The mean
difference (bias) of the SpO2measurements between the
proposed system WVSMS and the benchmark system was
VOL. 13, NO. 20, OCTOBER 2018 ISSN 1819-6608
ARPN Journal of Engineering and Applied Sciences ©2006-2018 Asian Research Publishing Network (ARPN). All rights reserved.
www.arpnjournals.com
8265
-0.2. The standard deviation of the difference was 0.858,
and the width of the 98.1% bounds of agreementwas 3.43.
In studies [36-39], when the data were within the
95%, this situation indicated the limits of agreement.
Thus, this study is comparable to previous research. Small
temperature, heart rate, and SpO2 data wereoutside the
limit of the agreement lines; they are shown as diamonds
in Figures 12, 13, and 14, respectively. The Bland–Altman plots indicate an excellent agreement between
WVSMS and benchmark systems. Figure-14 shows that
fewer points are distributed between the limit of
agreements because of significant matching between the
two systems.
Figure-12. Bland-Altman plot for temperature.
Figure-13. Bland-Altman plot for heart rate.
Figure-14. Bland-Altman plot for Spo2.
7.3 Histogram test
Histograms are a common graphical
demonstration of a frequency distribution and feature
representation [40]. A histogram comprises neighboring
rectangles; the x-axis represents the bases of the
rectangles that show the successive class boundaries and
the y-axis represents heights of the rectangles that
illustrate the frequencies class [41]. Low bars specify
fewer points in a class, whereas high bars indicate extra
points. Therefore, we determined whether the data
measured by the proposed system WVSMS are
compatible with the benchmark systems. The histogram
of the temperature data (Figure-15) shows peaks of 118
and 99 points in the 36.603 and 36.519 °C classes for the
BM and the WVSMS, respectively. The histogram of the
heart rate data (Figure-16) illustrates peaks of 77 and 73
points in the 77.853 and 73.961(bpm) classes for the
WVSMS and the benchmark system, respectively.The
histogram of the Spo2 data (Figure-17) display peaks of
224 and 217 points in the 99.314 and 99.229 (%) classes
for the WVSMS and the benchmark system, respectively.
These results prove that the data measured by the
proposed system WVSMS are comparable with those
measured by the benchmark systems.
Figure-15. Histogram of the temperature data from the
proposed system WVSMS and the benchmark system.
Figure-16. Histogram of the heart rate data from the
proposed system WVSMS and the benchmark system.
Figure-17. Histogram of the Spo2 data from the proposed
system WVSMS and the benchmark system.
VOL. 13, NO. 20, OCTOBER 2018 ISSN 1819-6608
ARPN Journal of Engineering and Applied Sciences ©2006-2018 Asian Research Publishing Network (ARPN). All rights reserved.
www.arpnjournals.com
8266
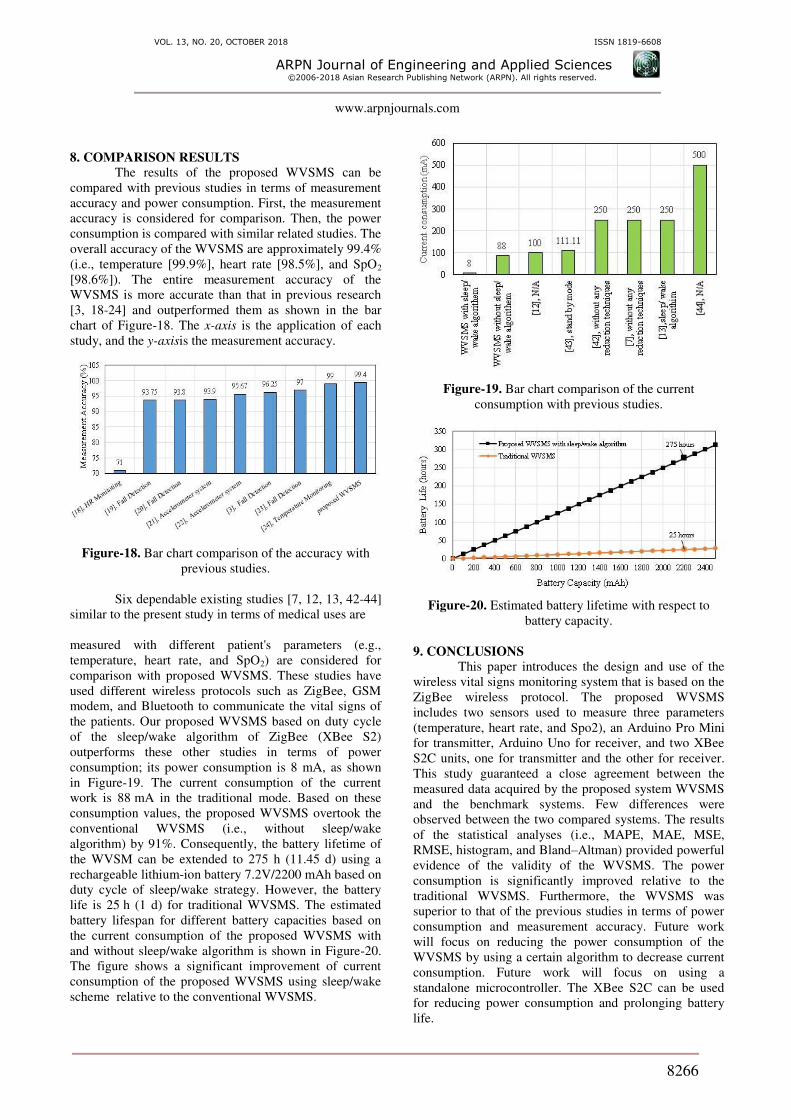
8. COMPARISON RESULTS
The results of the proposed WVSMS can be
compared with previous studies in terms of measurement
accuracy and power consumption. First, the measurement
accuracy is considered for comparison. Then, the power
consumption is compared with similar related studies. The
overall accuracy of the WVSMS are approximately 99.4%
(i.e., temperature [99.9%], heart rate [98.5%], and SpO2
[98.6%]). The entire measurement accuracy of the
WVSMS is more accurate than that in previous research
[3, 18-24] and outperformed them as shown in the bar
chart of Figure-18. The x-axis is the application of each
study, and the y-axisis the measurement accuracy.
Figure-18. Bar chart comparison of the accuracy with
previous studies.
Six dependable existing studies [7, 12, 13, 42-44]
similar to the present study in terms of medical uses are
measured with different patient's parameters (e.g.,
temperature, heart rate, and SpO2) are considered for
comparison with proposed WVSMS. These studies have
used different wireless protocols such as ZigBee, GSM
modem, and Bluetooth to communicate the vital signs of
the patients. Our proposed WVSMS based on duty cycle
of the sleep/wake algorithm of ZigBee (XBee S2)
outperforms these other studies in terms of power
consumption; its power consumption is 8 mA, as shown
in Figure-19. The current consumption of the current
work is 88 mA in the traditional mode. Based on these
consumption values, the proposed WVSMS overtook the
conventional WVSMS (i.e., without sleep/wake
algorithm) by 91%. Consequently, the battery lifetime of
the WVSM can be extended to 275 h (11.45 d) using a
rechargeable lithium-ion battery 7.2V/2200 mAh based on
duty cycle of sleep/wake strategy. However, the battery
life is 25 h (1 d) for traditional WVSMS. The estimated
battery lifespan for different battery capacities based on
the current consumption of the proposed WVSMS with
and without sleep/wake algorithm is shown in Figure-20.
The figure shows a significant improvement of current
consumption of the proposed WVSMS using sleep/wake
scheme relative to the conventional WVSMS.
Figure-19. Bar chart comparison of the current
consumption with previous studies.
Figure-20. Estimated battery lifetime with respect to
battery capacity.
9. CONCLUSIONS
This paper introduces the design and use of the
wireless vital signs monitoring system that is based on the
ZigBee wireless protocol. The proposed WVSMS
includes two sensors used to measure three parameters
(temperature, heart rate, and Spo2), an Arduino Pro Mini
for transmitter, Arduino Uno for receiver, and two XBee
S2C units, one for transmitter and the other for receiver.
This study guaranteed a close agreement between the
measured data acquired by the proposed system WVSMS
and the benchmark systems. Few differences were
observed between the two compared systems. The results
of the statistical analyses (i.e., MAPE, MAE, MSE,
RMSE, histogram, and Bland–Altman) provided powerful
evidence of the validity of the WVSMS. The power
consumption is significantly improved relative to the
traditional WVSMS. Furthermore, the WVSMS was
superior to that of the previous studies in terms of power
consumption and measurement accuracy. Future work
will focus on reducing the power consumption of the
WVSMS by using a certain algorithm to decrease current
consumption. Future work will focus on using a
standalone microcontroller. The XBee S2C can be used
for reducing power consumption and prolonging battery
life.
VOL. 13, NO. 20, OCTOBER 2018 ISSN 1819-6608
ARPN Journal of Engineering and Applied Sciences ©2006-2018 Asian Research Publishing Network (ARPN). All rights reserved.
www.arpnjournals.com
8267
REFERENCES
[1] S.-K. Chen, T. Kao, C.-T. Chan, C.-N. Huang, C.-Y.
Chiang, C.-Y. Lai, et al. 2012. A reliable transmission
protocol for zigbee-based wireless patient monitoring.
IEEE Transactions on Information Technology in
Biomedicine. 16: 6-16.
[2] K. Malhi, S. C. Mukhopadhyay, J. Schnepper, M.
Haefke and H. Ewald. 2012. A zigbee-based wearable
physiological parameters monitoring system. IEEE
sensors journal. 12: 423-430.
[3] L. Ren, Q. Zhang and W. Shi. 2012. Low-power fall
detection in home-based environments. in
Proceedings of the 2nd ACM international workshop
on Pervasive Wireless Healthcare. pp. 39-44.
[4] R. Miramontes, R. Aquino, A. Flores, G. Rodríguez,
R. Anguiano, A. Ríos, et al. 2017. PlaIMoS: a remote
mobile healthcare platform to monitor cardiovascular
and respiratory variables. Sensors. 17: 176.
[5] S. Pinto, J. Cabral and T. Gomes. 2017. We-care: An
IoT-based health care system for elderly people. in
Industrial Technology (ICIT), 2017 IEEE
International Conference on. pp. 1378-1383.
[6] T. N. Gia, V. K. Sarker, I. Tcarenko, A. M. Rahmani,
T. Westerlund, P. Liljeberg, et al. 2017. Energy
Efficient Wearable Sensor Node for IoT-based Fall
Detection Systems. Microprocessors and
Microsystems.
[7] A. Ilyas and A. Ijaz. 2017. E-health acquisition,
transmission & monitoring system. in Recent Trends
in Telecommunications Research (RTTR), Workshop
on. pp. 1-4.
[8] S. Tarapiah, M. Daadoo and S. Atalla. 2017. Android-
based real-time healthcare system. International
Journal of Medical Engineering and Informatics. 9:
253-268.
[9] E. Kantoch, D. Grochala and M. Kajor. 2017. Bio-
inspired Topology of Wearable Sensor Fusion for
Telemedical Application. in International Conference
on Artificial Intelligence and Soft Computing. pp.
658-667.
[10] M. Chen, Y. Ma, J. Song, C.-F. Lai and B. Hu. 2016.
Smart clothing: Connecting human with clouds and
big data for sustainable health monitoring. Mobile
Networks and Applications. 21: 825-845.
[11] E. Spanò, S. Di Pascoli and G. Iannaccone. 2016.
Low-power wearable ECG monitoring system for
multiple-patient remote monitoring. IEEE Sensors
Journal. 16: 5452-5462.
[12] K. Aziz, S. Tarapiah, S. H. Ismail and S. Atalla. 2016.
Smart real-time healthcare monitoring and tracking
system using GSM/GPS technologies. in Big Data and
Smart City (ICBDSC), 2016 3rd MEC International
Conference on. pp. 1-7.
[13] R. Prakash, A. B. Ganesh and S. V. Girish. 2016.
Cooperative wireless network control based health
and activity monitoring system. Journal of medical
systems. 40: 216.
[14] C. Wang, W. Lu, M. R. Narayanan, D. C. W. Chang,
S. R. Lord, S. J. Redmond, et al. 2016. Low-Power
Fall Detector Using Triaxial Accelerometers and
Barometric Pressure Sensing. IEEE Transactions on
Industrial Informatics. 12: 2302-2311.
[15] R. K. Megalingam, P. S. Veliyara, R. M. Prabhu, R.
R. Krishna and R. Katoch. 2015. Wheeled Patient
Monitoring System. in Intelligent Computing,
Communication and Devices, ed: Springer. pp. 779-
786.
[16] N. Watthanawisuth, T. Lomas, A. Wisitsoraat, and A.
Tuantranont. 2010. Wireless wearable pulse oximeter
[17] for health monitoring using ZigBee wireless sensor
network. in Electrical Engineering/Electronics
Computer Telecommunications and Information
Technology (ECTI-CON), 2010 International
Conference on. pp. 575-579.
[18] M. R. Yuce. 2010. Implementation of wireless body
area networks for healthcare systems. Sensors and
Actuators A: Physical. 162: 116-129.
[19] T. Roh, S. Hong and H.-J. Yoo. 2014. Wearable
depression monitoring system with heart-rate
variability. in Engineering in Medicine and Biology
Society (EMBC), 2014 36th Annual International
Conference of the IEEE. pp. 562-565.
[20] C.-C. Zhou, C.-L. Tu, Y. Gao, F.-X. Wang, H.-W.
Gong, P. Lian, et al. 2014. A low-power, wireless,
VOL. 13, NO. 20, OCTOBER 2018 ISSN 1819-6608
ARPN Journal of Engineering and Applied Sciences ©2006-2018 Asian Research Publishing Network (ARPN). All rights reserved.
www.arpnjournals.com
8268
wrist-worn device for long time heart rate monitoring
and fall detection. in Orange Technologies (ICOT),
2014 IEEE International Conference on. pp. 33-36.
[21] A. Ngu, Y. Wu, H. Zare, A. Polican, B. Yarbrough
and L. Yao. 2017. Fall Detection Using Smartwatch
Sensor Data with Accessor Architecture. in
International Conference on Smart Health. pp. 81-93.
[22] M. Di Rosa, J. M. Hausdorff, V. Stara, L. Rossi, L.
Glynn, M. Casey, et al. 2017. Concurrent validation
of an index to estimate fall risk in community
dwelling seniors through a wireless sensor insole
system: A pilot study. Gait & Posture, vol. 55, pp. 6-
11.
[23] J. He, S. Bai and X. Wang. 2017. An Unobtrusive Fall
Detection and Alerting System Based on Kalman
Filter and Bayes Network Classifier. Sensors. 17:
1393.
[24] M. Magno, T. Polonelli, F. Casamassima, A. Gomez,
E. Farella and L. Benini. 2016. Energy-Efficient
Context Aware Power Management with
Asynchronous Protocol for Body Sensor Network.
Mobile Networks and Applications. pp. 1-11.
[25] S. K. Gharghan. 2017. Energy-Efficient Remote
Temperature Monitoring System for Patients Based
on GSM Modem and Microcontroller. Journal of
Communications. 12: 10.
[26] P. Bhuvaneswari, V. Vaidehi and M. A. Saranya.
2010. Distance based transmission power control
scheme for indoor wireless sensor network. in
Transactions on computational science XI, ed:
Springer. pp. 207-222.
[27] A simple digital thermometer for the whole family.
Available:
http://www.picsolution.com/en/products/for-fever-
measurement/digital-thermometers/vedofamily.html
(accessed on 6 January 2018).
[28] BLOOD PRESSURE MONITORS. Available:
http://www.rossmax.com/en/products/monitoring/bloo
d-pressure-monitors.html (accessed on 6 January
2018).
[29] FingerTip Pulse Oximeter Blood Oxygen Saturation
SPO2 PR Monitor Oxymeter. Available:
https://www.lazada.com.ph/products/fingertip-pulse-
oximeter-blood-oxygen-saturation-spo2-pr-monitor-
oxymeter-intl-i114566273-s118431099.html
(accessed on 6 January 2018).
[30] Y. Xu, J. Zhou and P. Zhang. 2014. RSS-based source
localization when path-loss model parameters are
unknown. IEEE communications letters. 18: 1055-
1058.
[31] D. Djenouri, N. Merabtine, F. Z. Mekahlia and M.
Doudou. 2013. Fast distributed multi-hop relative
time synchronization protocol and estimators for
wireless sensor networks. Ad Hoc Networks. 11:
2329-2344.
[32] Arduino Pro Mini (DEV-11113), Available:
https://cdn.sparkfun.com/datasheets/Dev/Arduino/Boa
rds/ProMini16MHzv1.pdf (accessed on 27 March
2018).
[33] V. Georgitzikis, O. Akribopoulos, and I.
Chatzigiannakis, 2012, "Controlling physical objects
via the internet using the Arduino platform over
802.15. 4 networks. IEEE Latin America
Transactions, vol. 10, pp. 1686-1689.
[34] D. I. Inc. XBee®/XBee-PRO S2C Zigbee, Available:
https://www.digi.com/resources/documentation/digido
cs/pdfs/90002002.pdf (accessed on 21 March 2018).
[35] Digi International Inc. DIGI XBEE® S1 802.15.4 RF
MODULES, Available:
https://www.digi.com/pdf/ds_xbeemultipointmodules.
pdf (accessed on 21 March 2018).
[36] MaxStream, Inc. - a Digi International brand,
XBee™ Series 2 OEM RF Modules. Available: http://www.farnell.com/datasheets/27606.pdf
(accessed on 21 March 2018).
[37] L.-T. Yang, Y. Nagata, K. Otani, Y. Kado, Y. Otsuji
and M. Takeuchi. 2016. Feasibility of one-beat real-
time full-volume three-dimensional echocardiography
for assessing left ventricular volumes and deformation
parameters. Journal of the American Society of
Echocardiography. 29: 853-860. e2.
[38] A. Ferrari, P. Ginis, M. Hardegger, F. Casamassima,
L. Rocchi and L. Chiari. 2016. A mobile Kalman-
filter based solution for the real-time estimation of
spatio-temporal gait parameters. IEEE transactions on
neural systems and rehabilitation engineering. 24:
764-773.
VOL. 13, NO. 20, OCTOBER 2018 ISSN 1819-6608
ARPN Journal of Engineering and Applied Sciences ©2006-2018 Asian Research Publishing Network (ARPN). All rights reserved.
www.arpnjournals.com
8269
[39] S. K. Gharghan, R. Nordin and M. Ismail. 2015.
Statistical validation of performance of ZigBee-based
wireless sensor network for track cycling. in Smart
Sensors and Application (ICSSA), 2015 International
Conference on. pp. 44-49.
[40] S. M. Rodger, D. J. Plews, J. McQuillan, and M. W.
Driller. 2016. Evaluation of the Cyclus cycle
ergometer and the Stages power meter for
measurement of power output in cycling. Journal of
Science and Cycling. 5: 16.
[41] C. Lee, H. C. Shin, S. Kang, and J.-B. Lee. 2015.
Measurement of desirable minimum one-way bike
lane width. KSCE Journal of Civil Engineering. 20:
881-889.
[42] R. A. Johnson. 2001. Miller & Freund's Probability
and Statistics for Engineers. Iie Transactions. 33: 823-
825.
[43] D. Sunehra and P. Ramakrishna. 2016. Web based
patient health monitoring system using Raspberry Pi.
in Contemporary Computing and Informatics (IC3I),
2016 2nd International Conference on. pp. 568-574.
[44] G. López, V. Custodio, and J. I. Moreno. 2010.
LOBIN: E-textile and wireless-sensor-network-based
platform for healthcare monitoring in future hospital
environments. IEEE Transactions on Information
Technology in Biomedicine. 14: 1446-1458.
[45] M. Li and Y. T. Kim. 2012. Development of patch-
type sensor module for wireless monitoring of heart
rate and movement index. Sensors and Actuators A:
Physical. 173: 277-283.