Embed Size (px)
Citation preview

StatiStical Study of BiocompatiBle HyBrid feed Stock filament of recycled nylon-tio2
Jatender Pal Singh1 and ruPinder Singh2
1Department of Defence Production, DGQA New Delhi-110011. Email: [email protected] of Production Engineering, Guru Nanak Dev Engineering College, Gill Road Ludhiana (Punjab). Email: [email protected]
Abstract: The optimised process parameters of twin extruder for peak strength of a biocompatible hybrid feed stock filament drawn from recycled nylon-Tio2 (70-30% wt.) were studied for statistical control. The fabricated wires were measured dimensionally and tensile tests were performed. The results were analysed statistically and predicted that the process to have higher probability to lie under statistical control.
Keywords: Fused Deposition Modelling, Hybrid Feed Stock Filament, Biocompatible, Probability, Statistical Control.
terms of velocity and vertorcity [6-8]. Biocompatible materials like nylon, titanium oxide (TiO2), Polylectic acid (PLA), Poly Glycolic Acid (PGA), Poly Metha Methyl Acrilate (PMMA) are used in the field of biomedical and tissue engineering. The blend of recycled Nylon-TiO2 (70-30% Wt) was prepared using twin extruder. The process parameters of twin extruder were optimised to enhance mechanical properties like peak strength, break strength, peak elongation and break elongation [9]. The present work is the extension of the recycled Nylon-TiO2 (70-30% Wt) study, wherein an attempt has been made to study the process outcomes at the optimised process parameters to ascertain probability of statistical control on the process.
experimentation2.
Biocompatible material is used in wire form in FDM, for fabrication of desired part. Dimensional control of hybrid feed stock filament and peak strength play an important role in fabrication process and facilitate designed strength to the part. The optimised process parameters of twin extruder for hybrid feed stock filament of recycled nylon-Tio2, as worked out by Thakur et. al., [9] is presented in Table 1.
introduction1.
Fused Deposition Modelling (FDM) is one of the Rapid Prototyping (RP) process that utilizes spool of polymer, polymer-ceramic, metal-polymer and other composites, based on the specifications of the machine, for fabrication of designed Computer Aided Design (CAD) part. For fulfilling the current need of the industry, process parameters of FDM process was studied to assess the quality of the product using taguchi technique[1]. Composite material of Acrylonitrile Butadiene Styrene (ABS) and metal was developed for FDM process. The process parameters including temperature, pressure drop and velocity were studied for better quality of product [2]. The study to use recycled polyethylene in FDM process was also done to check deterioration in its mechanical properties. It was estimated that low viscosity and low melt flow index pose problem in wire drawing [3]. Extruder is used to fabricate spool of wire of desired material. Two grades of ABS (low and high) were reprocessed with different set of temperature and shear stress using twin extruder [4]. A study was conducted for ascertaining feasibility of producing and processing of antibacterial nano-composite polypropylene fibre through twin extruder [5]. The dimensionless equations of three dimensional flow through single extruder were developed in
I J M S E © Serials Publications
8(2) 2017 : July-December • pp. 173-177

174 Jatender Pal Singh and Rupinder Singh
table 1 optimised parameters for peak Strength
Temp(oC)
Speed(Rev/min)
Load(Kg)
Peak Strength(MPa)
250 70 15 50.11
In order to ascertain the process statics, nine specimens of nylon-Tio2 (70-30 %Wt.) were fabricated with the above parameters using twin extruder (HAAK, Mini CTW, Germany). The same is shown in Figure 1.
figure 1: twin extruder
The fabricated specimens using the optimised parameters are shown in Figure 2.
figure 2: fabricated Specimens
The specimens were measured thrice at different locations using outside digital micrometer (Mitutoyo, Japan) with least count 0.001mm. Thereafter the specimens were tested thrice for peak strength using universal testing machine and average was considered for analysis. Figure 3 shows tensile testing of specimen.
figure 3: tensile testing
reSultS and analSiS3.
The data of diameter and peak strength have to be analysed statistically for randomness and normality. Software MINITAB 17 was used for this analysis. The existence of abnormalities like clustering, mixture, trends, oscillation can be ascertained by the p-value. The p-value greater than equal to 0.05 specifies the randomness of data for the each abnormality. For probability density function of normal distribution, the function f(x) is represented as:
f(x) 1
21 2
2
ps
mr
lx
/ ;-Ê
ËÁˆ¯̃
-• < x < • (1)
where, m is the mean of random variable x,
s is the standard deviation of x.
l = 2.71828 and p = 3.14159.
The standard normal deviate Z can be defined as:
Z = Xi - m
s (2)
where, Xi is the variable data. The standard normal deviate, Z follows a normal distribution that has mean m = 0 and standard deviation s = 1.
The probability density function for normal distribution with Zvariable, f(z) is represented as:
Statistical Study of Biocompatible Hybrid Feed Stock Filament of Recycled Nylon-Tio2 175
f(z) 1
2
2
2
psl
z
(3)
The measured data of the diameter of the the wire and its mean are shown in the Table 2.
table 2 measurement of Wire diameter
S.No. Dia. 1 Dia. 2 Dia. 3 Mean Dia. (mm)
1 1.823 1.821 1.822 1.822
2 1.824 1.826 1.826 1.825
3 1.832 1.831 1.830 1.831
4 1.835 1.833 1.833 1.834
5 1.821 1.820 1.822 1.821
6 1.832 1.831 1.830 1.831
7 1.825 1.824 1.820 1.823
8 1.840 1.838 1.836 1.838
9 1.827 1.830 1.830 1.829
The run chart of mean diameter was drawn. The same is shown in Figure 4.
figure 4: run chart for mean diameter
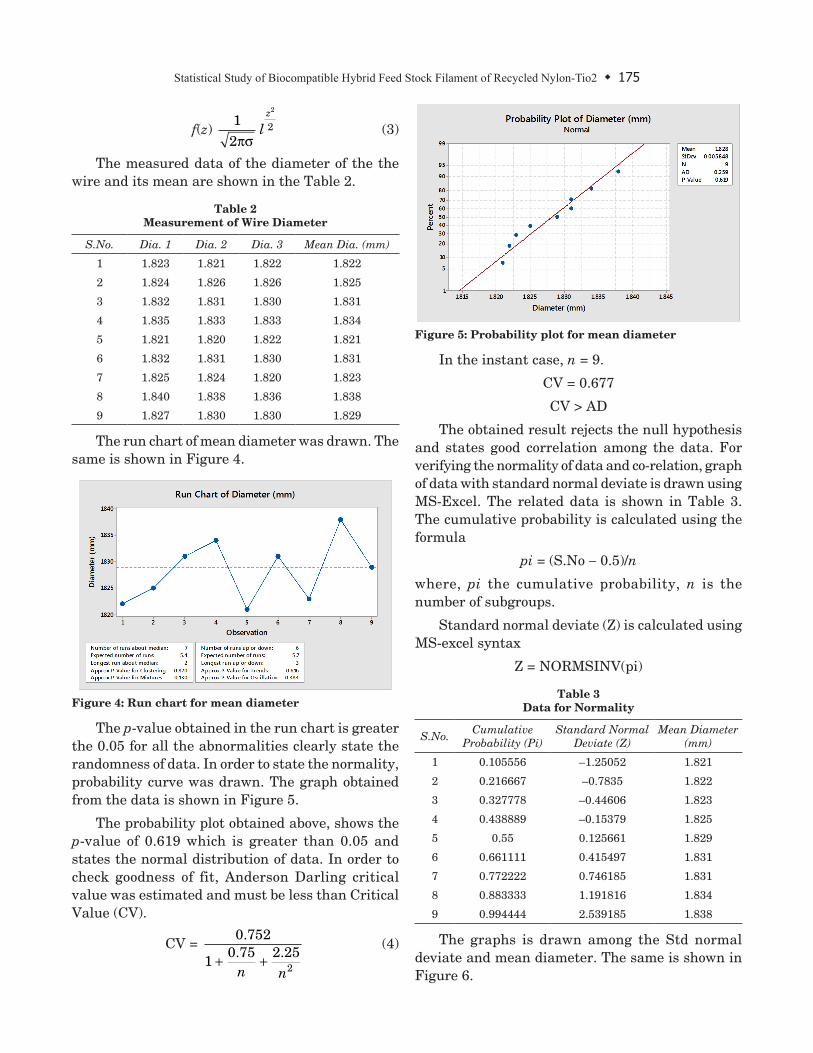
The p-value obtained in the run chart is greater the 0.05 for all the abnormalities clearly state the randomness of data. In order to state the normality, probability curve was drawn. The graph obtained from the data is shown in Figure 5.
The probability plot obtained above, shows the p-value of 0.619 which is greater than 0.05 and states the normal distribution of data. In order to check goodness of fit, Anderson Darling critical value was estimated and must be less than Critical Value (CV).
CV = 0 752
10 75 2 25
2
.. .+ +n n
(4)
figure 5: probability plot for mean diameter
In the instant case, n = 9.
CV = 0.677
CV > AD
The obtained result rejects the null hypothesis and states good correlation among the data. For verifying the normality of data and co-relation, graph of data with standard normal deviate is drawn using MS-Excel. The related data is shown in Table 3. The cumulative probability is calculated using the formula
pi = (S.No - 0.5)/n
where, pi the cumulative probability, n is the number of subgroups.
Standard normal deviate (Z) is calculated using MS-excel syntax
Z = NORMSINV(pi)
table 3 data for normality
S.No. Cumulative Probability (Pi)
Standard Normal Deviate (Z)
Mean Diameter(mm)
1 0.105556 –1.25052 1.821
2 0.216667 –0.7835 1.822
3 0.327778 –0.44606 1.823
4 0.438889 –0.15379 1.825
5 0.55 0.125661 1.829
6 0.661111 0.415497 1.831
7 0.772222 0.746185 1.831
8 0.883333 1.191816 1.834
9 0.994444 2.539185 1.838
The graphs is drawn among the Std normal deviate and mean diameter. The same is shown in Figure 6.

176 Jatender Pal Singh and Rupinder Singh
figure 6: normality curve for mean diameter
The graph shows that trend line is in conformity with the data points. The value of determination i,e R2 is 0.943. It shows good co-relation of trend line having equation y = 0.005x + 1.826 with the data points. The analysis shows the randomness of data which has been distributed normally and has a greater probability of process to lie under statistical control. From measured data of peak strength, mean value is calculated and shown in the Table 4.
Run chart of the mean peak strength was drawn and is shown in Figure 7.
figure 7: run chart for mean peak strength
The probability plot for mean peak strength was also plotted and is shown in Figure 8.
From the analysis of p-value which is greater than 0.05 shows that there exists a random pattern and data points are normally distributed. The Critical value of the group has been calculated (CV) in accordance witheq.(4)
In the instant case, n = 9
CV = 0.677.
The value of AD is less than CV. It shows that the data is normally distributed. In order to further verify the data for normality, standard normal
figure 8: probability plot for mean peak strength
deviate was calculated and drawn with the mean peak strength using Ms-Excel. The same is shown in Table 5 and Figure 9 respectively.
table 5 data for normality
S.No. Cumulative Probability (Pi)
Standard Normal Deviate (Z)
Mean Peak Strength (MPa)
1 0.105556 –1.25052 48.75
2 0.216667 –0.7835 48.89
3 0.327778 –0.44606 49.25
4 0.438889 –0.15379 49.95
5 0.55 0.125661 50.25
6 0.661111 0.415497 50.45
7 0.772222 0.746185 50.45
8 0.883333 1.191816 50.47
9 0.994444 2.539185 51.21
figure 9: normality curve for mean peak strength
The analysis of mean peak strength shows that the data is random and normally distributed. The value of co-efficient of determination also shows that there is a good co-relation among the data points with the trend line.

Statistical Study of Biocompatible Hybrid Feed Stock Filament of Recycled Nylon-Tio2 177
concluSion4.
From the statistical analysis of mean diameter and mean peak strength of hybrid feed stock filament of recycled nylon-Tio2 fabricated at optimised parameters of twin extruder, the following conclusions are drawn:
∑ The data of measurement of mean diameter and mean peak strength are found random and normally distributed.
∑ The variations of data among themselves have the probability to contain only chance causes instead of assignable causes.
∑ The process at the optimized parameters has the probability on the higher side to lie under statistical control.
acknowledgment
The author is highly Prof. (Dr.) Rupinder Singh of Department of Production Engineering, Guru Nanak Dev Engineering College Ludhiana for giving access of Manufacturing Research Lab and carrying out this research work.
referenceSR. Anitha and S. Arunachalam, “Critical parameters [1] influencing the quality of prototypes in fused deposition modeling”, Journal of Material Processing Technology, Vol. 113, issue 1-3, 2001, pp. 385-388.
N. Mostafa, H.M. Syed, S. Igor, G. Andrew,” A study of melt [2] flow analysis of an ABS-Iron composite in fused deposition
modeling process”, Tsinghhua science and Technology, Vol. 68, 2009, pp. 29-37.
Mohammed Alzahrani, “Modification of Recycled [3] Poly(ethylene terephthalate) for FDM 3D-Printing” thesis in Master of Sciences in Chemical Engineering, University of Waterloo Ontario, Canada, 2017, pp. 1-81.
T. Borona[4] t, V.J. Segui, M.A. Peydro, M.J. Reig, “Influence of temperature and shear rate on the rheology and processability of reprocessed ABS in injection molding process”, Journal of Materials Processing Technology, Vol. 209, issue 5, 2009, pp. 2735-2745.
R. Dasterdi, M.R.M. Mojtahedi, A.M. Shoshtari and A. [5] Khosroshahi, “Investigating the production and properties of Ag/Tio2/pp antibacterial nanocomposite filament yarns”, The Journal of the Textile Institute, Vol. 101, 3, 2010, pp. 204-213.
Xu Baiping, M. Wang, L. He, P. Kong, “Unsteady mixing [6] performance in single screw extrudes”, Electrical and Control Engineering International Conference, 2010, pp. 4518-4522.
N. Singh, D. Hui, R. Singh, I.P.S. Ahuja, L. Feo, & F. [7] Fraternali, “Recycling of plastic solid waste: A state of art review and future applications” Composites Part B: Engineering, Vol 115, 2017, pp. 409-422.
R. Kumar., R. Singh, D. Hui, L. Feo, & F. Fraternali. (2017). [8] Graphene as biomedical sensing element: State of art review and potential engineering applications. Composites Part B: Engineering, Vol. 134, 2018, pp. 193-206.
Robin Thakur, “Experimental investigation for [9] development of hybrid feed stock filament of fused deposition modeling from recycled nylon-Tio2(70-30%wt.)blend”, thesis of Master in Technology, Production Engineering, 2017, I.K.G. Punjab Technical University, Jalandhar (Punjab).