Embed Size (px)
DESCRIPTION
Statistical Report 2011
Citation preview
STATISTICAL REPORT
STATISTICAL REPORT
AES DominicAnA
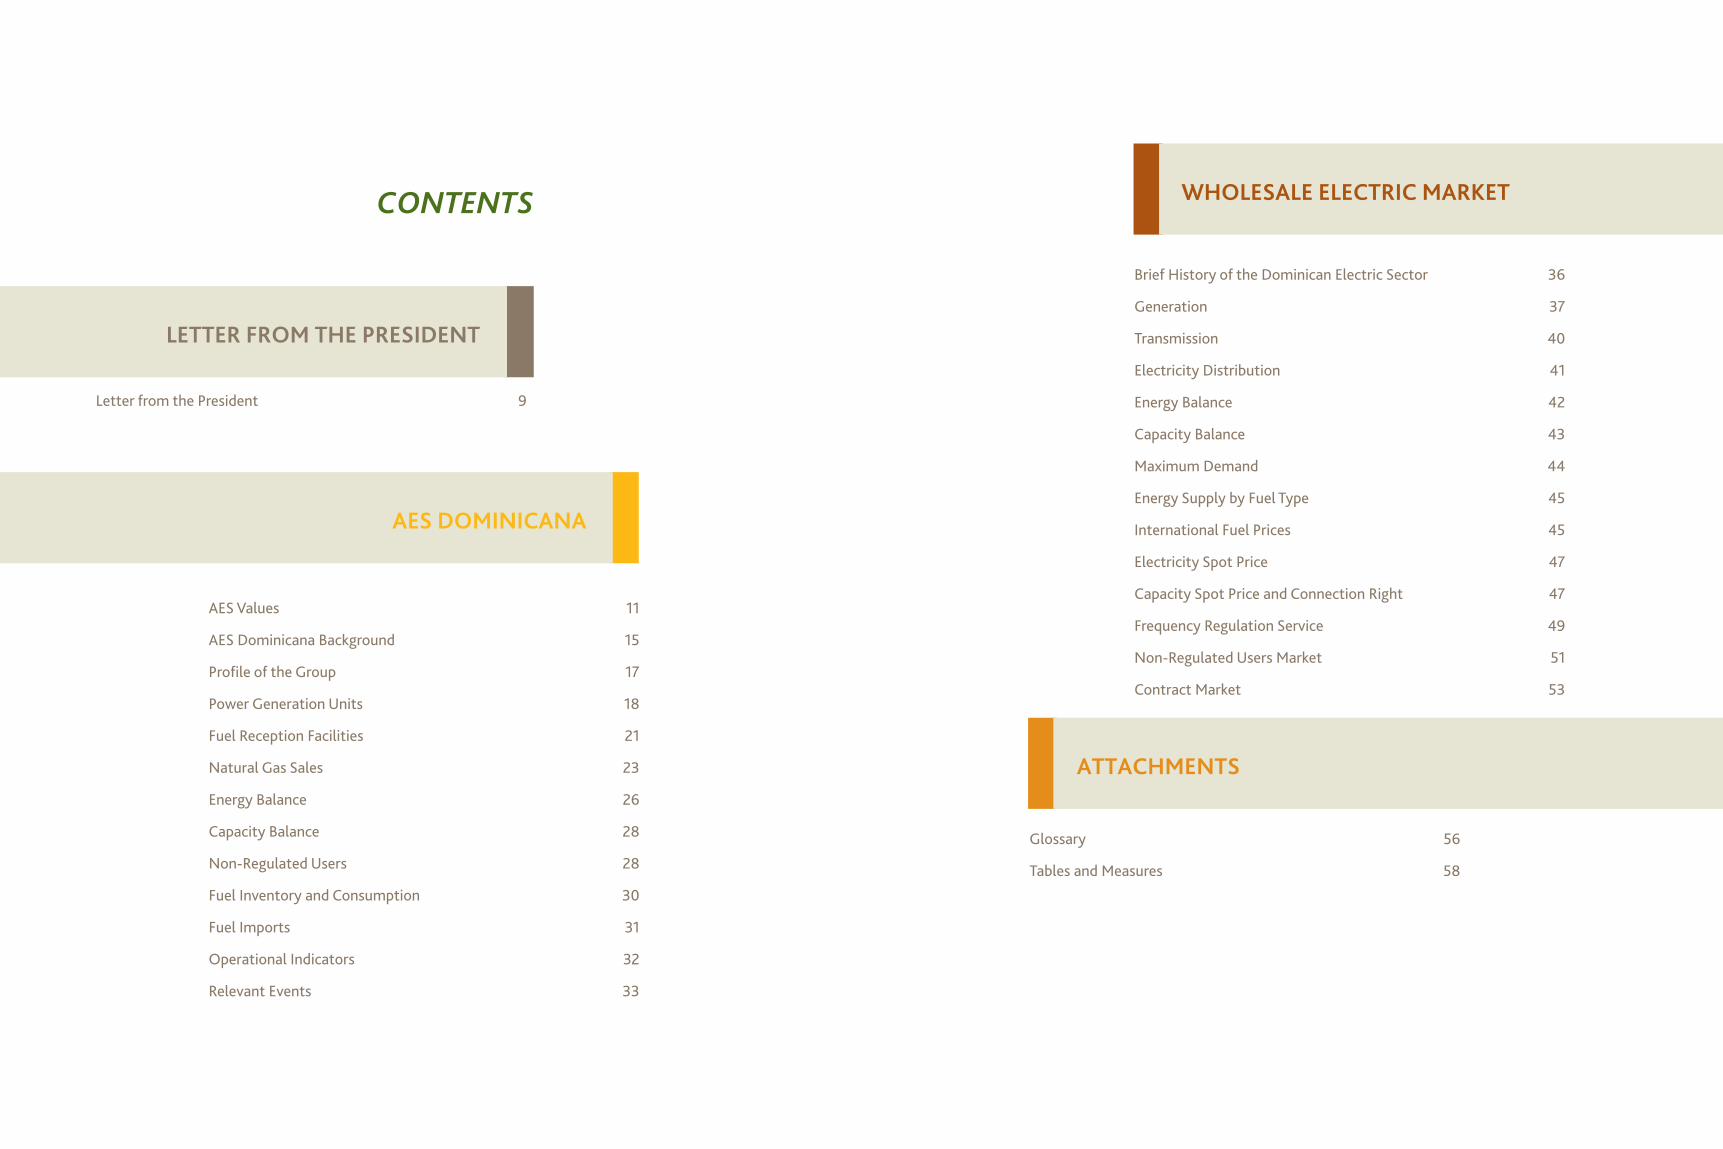
WholESAlE ElEctric mArkEt
Letter from the President 9
AES Values 11
AES Dominicana Background 15
Profile of the Group 17
Power Generation Units 18
Fuel Reception Facilities 21
Natural Gas Sales 23
Energy Balance 26
Capacity Balance 28
Non-Regulated Users 28
Fuel Inventory and Consumption 30
Fuel Imports 31
Operational Indicators 32
Relevant Events 33
Brief History of the Dominican Electric Sector 36
Generation 37
Transmission 40
Electricity Distribution 41
Energy Balance 42
Capacity Balance 43
Maximum Demand 44
Energy Supply by Fuel Type 45
International Fuel Prices 45
Electricity Spot Price 47
Capacity Spot Price and Connection Right 47
Frequency Regulation Service 49
Non-Regulated Users Market 51
Contract Market 53
AttAchmEntS
Glossary 56
Tables and Measures 58
CONTENTS
lEttEr from thE PrESiDEnt

9
2011 STATISTICAL REPORT
lEttEr from thE PrESiDEnt
It's with great pleasure that we present you the 2011 AES Dominicana Statistical Report, highlighting its main assets, operational performance, other lines of business and the electricity market overall. At the end of 2011, AES Dominicana contributed an average of 39% of all the energy that was demanded by the National Electric Interconnected System (SENI) with a total of 4.913 GWh injected, demonstrating to be the leader in the national electricity market. 71% of this energy was traded in the Contract Market to Distribution Companies, causing significant savings to the Dominican government by providing the cheapest energy in the National System. The remaining 29% of the energy injected was traded in the Non-Regulated Users Market (20%) and the Spot Market (9%). Our units reached operational milestones, among those were Los Mina V and VI which generated 1.361 GWh with natural gas, exceeding an annual record high as well as a high rate equivalent availability factor, which AES ANDRES also accomplished; and lastly ITABO decreased its equivalent outage factor to 4% due to the preventive work carried out on its units. These are just some examples of what we would call a successful year for AES Dominicana, improving the quality of life for Dominicans. AES Dominicana has been a key instrument in the diversification process of the fuel matrix in the power sector and the energy matrix of the Dominican Republic, mitigating the country's dependence on petroleum based fuels. During 2011, natural gas registered record sales and showed continuous growth, causing AES Dominicana for the first time since the terminal initiated its operations, to purchase a spot LNG cargo in the international market to meet the growing demand. AES Dominicana shows its commitment to the country by strengthening its position using natural gas and efficiently restoring the use of coal. Our culture of operational excellence and asset management allows AES Dominicana to contribute to the sustainable development of the country, the environment and communities we serve.
Marco De la Rosa President AES Dominicana
At the end of 2011, AES Dominicana contributed an average of 39% of all the energy that was demanded by the National Electric Interconnected System.
11
2011 STATISTICAL REPORT
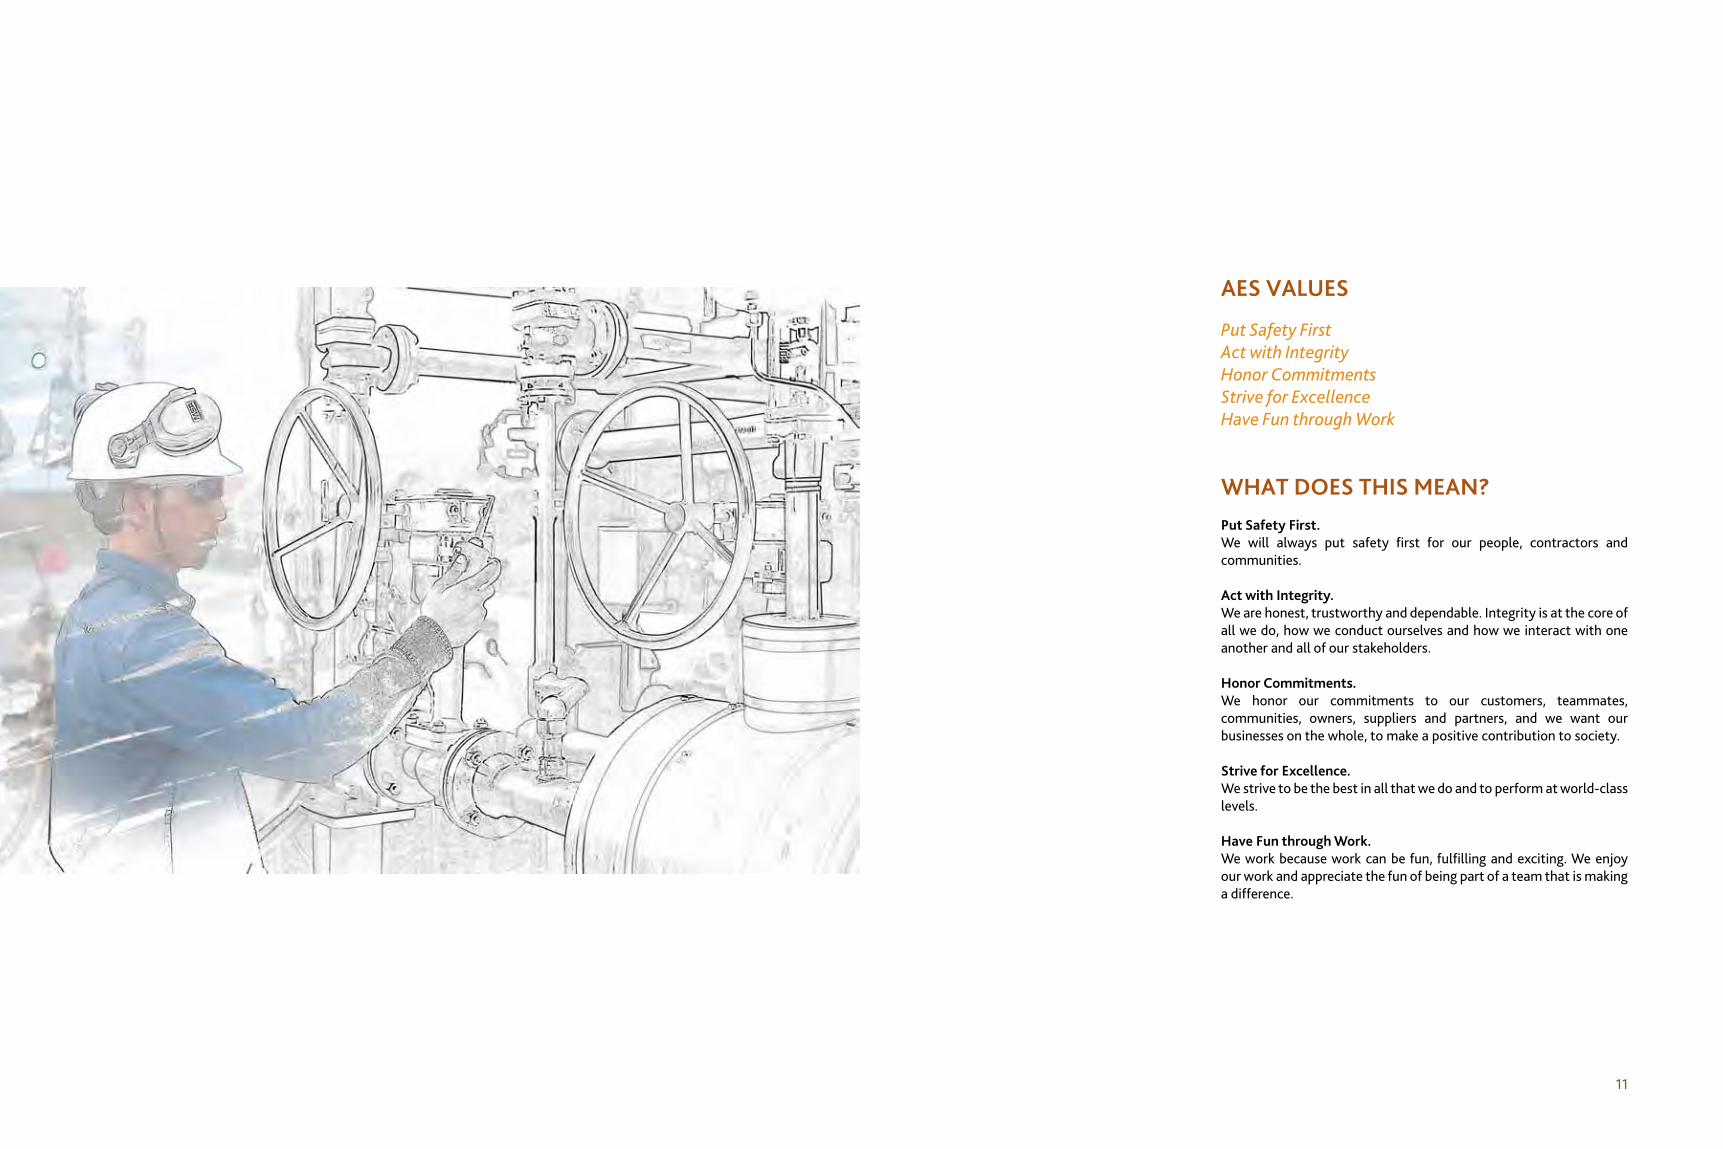
WhAt DoES thiS mEAn?Put Safety first. We will always put safety first for our people, contractors and communities.
Act with integrity. We are honest, trustworthy and dependable. Integrity is at the core of all we do, how we conduct ourselves and how we interact with one another and all of our stakeholders.
honor commitments. We honor our commitments to our customers, teammates, communities, owners, suppliers and partners, and we want our businesses on the whole, to make a positive contribution to society.
Strive for Excellence. We strive to be the best in all that we do and to perform at world-class levels.
have fun through Work. We work because work can be fun, fulfilling and exciting. We enjoy our work and appreciate the fun of being part of a team that is making a difference.
AES VAlUES
Put Safety FirstAct with IntegrityHonor CommitmentsStrive for ExcellenceHave Fun through Work

AES DominicAnA

AES DominicAnA BAckgroUnD The first investment of AES in the Dominican Republic was the purchase of DPP in 1997 from NGC, an asset that was in their power as a result of their merger with Destec companies. DPP is the owner of Los Mina V and Los Mina VI, two open cycle gas turbines of 118 MW each.
From May of 1996 until August of 2001, DPP operated under the Independent Private Producer scheme, selling all of its production to La Corporación Dominicana de Electricidad (CDE). Then, after an agreement between DPP and CDE, the contract between both parties was cancelled and a new electricity sale arrangement was established between DPP and EDEESTE, which included a back-up contract with the CDE.
In 2000, AES confirmed its commitment to the long term development of the Dominican Republic by constructing AES ANDRES. The project included a combined cycle of 319 MW, a liquefied natural gas terminal and a gas pipeline connecting to the DPP power station.
In December of 2000, AES takes another important step when it acquires the assets of GENER, obtaining a participation of 25% in the ITABO, S.A. power plant.
Since May 1st, 2003, Dominican Power Partners operates to supply its electricity sales contract with EDEESTE, selling its excess generation and buying what it needs in the spot market.
Also in 2003, AES ANDRES began its operations and became the most efficient power station of Latin America, representing a jump towards sustainable development for the country using clean energy. This new investment improved the strategic position of the country that formerly depended 90% on petroleum derivatives to supply its electricity needs.
In 2006, AES Dominicana acquires another 25% of the ITABO, S.A. equity, formerly owned by El Paso. AES, now with 50% of ITABO’s equity, takes control of the operative and administrative areas.

16 17
AES Dominicana 2011 STATISTICAL REPORT
ProfilE of thE groUPAES began operations in the Dominican Republic with the intent to provide value to the national energy market and contribute to the development of the communities where it serves.
Today, AES Dominicana is positioned as the principal investment group in the Dominican Electric Sector, with modern facilities for energy production and with the most competitive fuels for power generation in the system.
AES Dominicana has two deep-sea port infrastructures: Itabo’s and Andres’s International Piers, used to discharge the coal and liquefied natural gas used for electricity production. It also has, in its AES Andres’ facilities, the first terminal intended for the distribution of liquefied natural gas in specialized trucks.
As a business group, AES Dominicana combines a global perspective with deep local knowledge and a relentless commitment to operational excellence. There has been a consistent pattern of improvement year after year in generation and efficiency. AES serves as a model to the rest of the players in the electric sector by displaying the best practices of corporate governance within the industry in the Dominican Republic.
AES Dominicana supports the growth of its business by standing upon a strong foundation consisting of its code of conduct, corporate social responsibility, environmental care and its people, which are the most valuable resources.
As a business group, AES Dominicana combines a global perspective with deep local knowledge and a relentless commitment to operational excellence.
18 19
AES Dominicana 2011 STATISTICAL REPORT
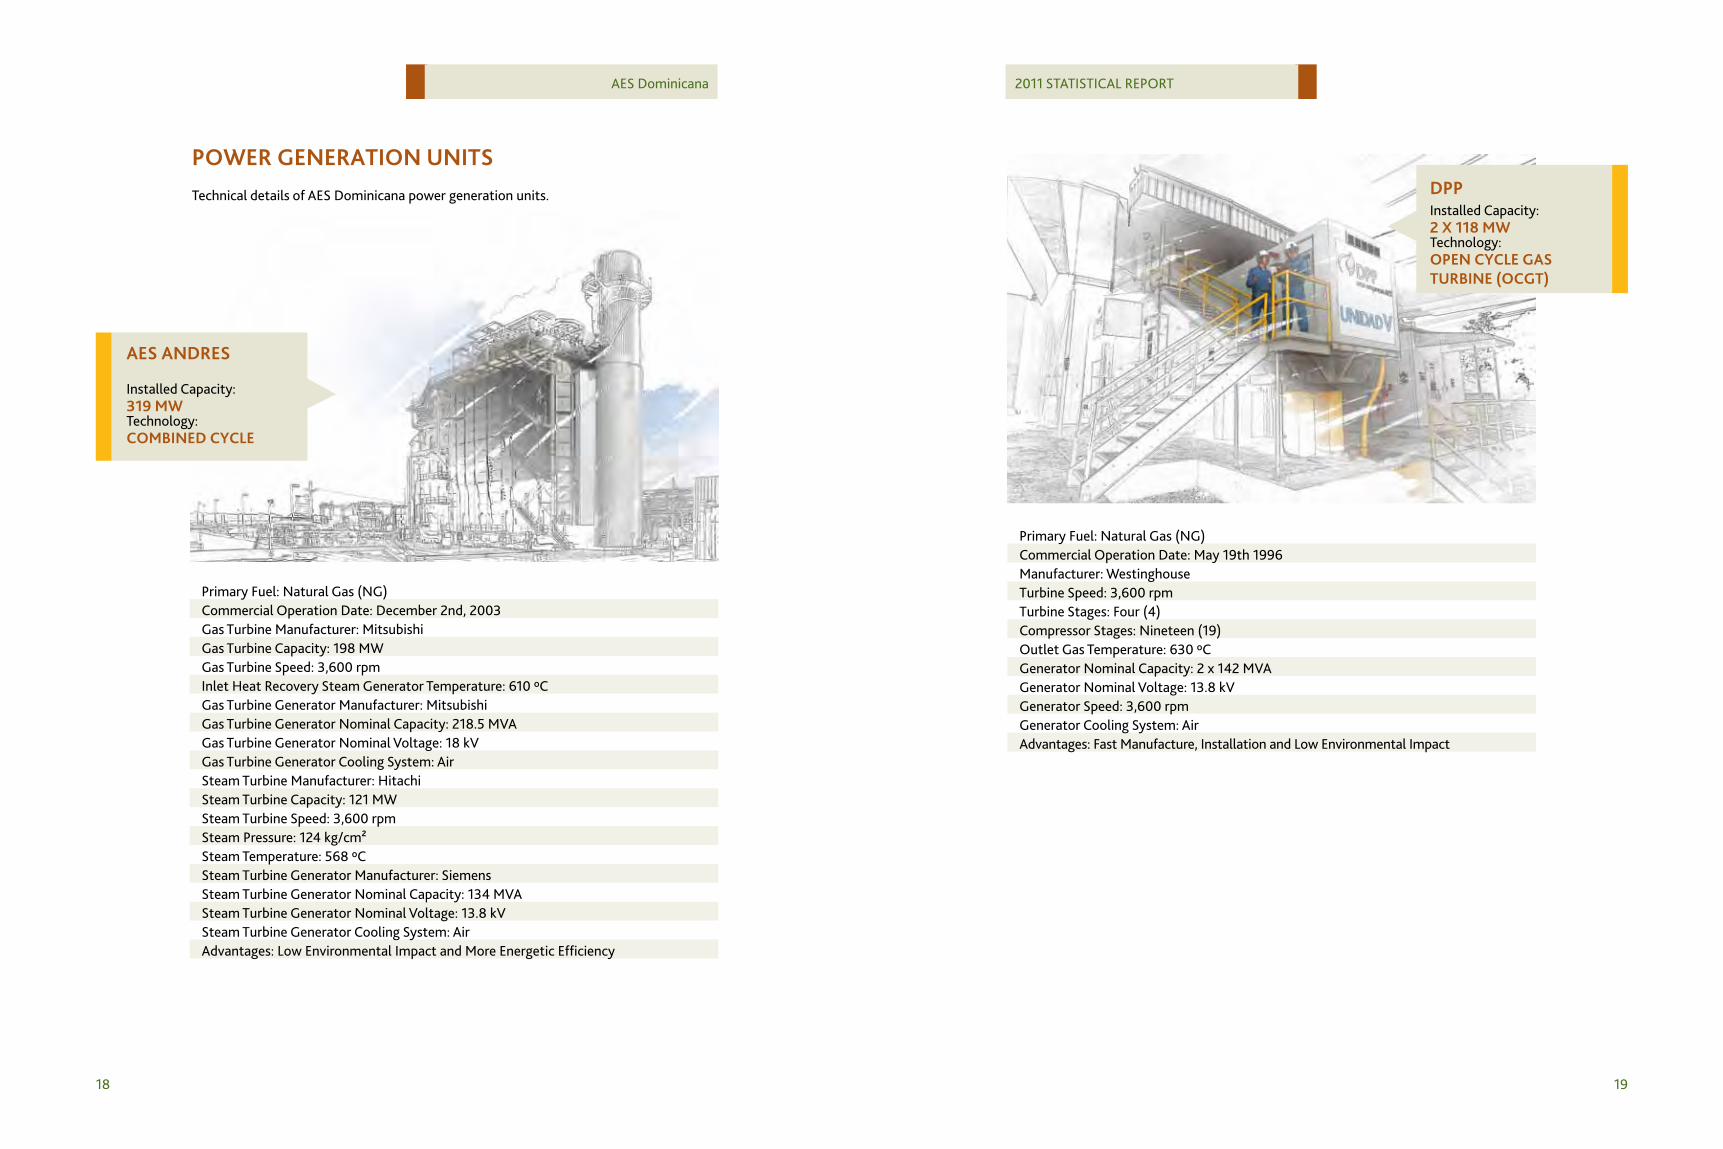
PoWEr gEnErAtion UnitSTechnical details of AES Dominicana power generation units.
AES AnDrES
Installed Capacity:
Technology: 319 mW
comBinED cyclE
Primary Fuel: Natural Gas (NG)Commercial Operation Date: December 2nd, 2003Gas Turbine Manufacturer: MitsubishiGas Turbine Capacity: 198 MWGas Turbine Speed: 3,600 rpmInlet Heat Recovery Steam Generator Temperature: 610 ºCGas Turbine Generator Manufacturer: MitsubishiGas Turbine Generator Nominal Capacity: 218.5 MVAGas Turbine Generator Nominal Voltage: 18 kVGas Turbine Generator Cooling System: AirSteam Turbine Manufacturer: HitachiSteam Turbine Capacity: 121 MWSteam Turbine Speed: 3,600 rpmSteam Pressure: 124 kg/cm²Steam Temperature: 568 ºCSteam Turbine Generator Manufacturer: SiemensSteam Turbine Generator Nominal Capacity: 134 MVASteam Turbine Generator Nominal Voltage: 13.8 kVSteam Turbine Generator Cooling System: AirAdvantages: Low Environmental Impact and More Energetic Efficiency
Primary Fuel: Natural Gas (NG)Commercial Operation Date: May 19th 1996Manufacturer: WestinghouseTurbine Speed: 3,600 rpmTurbine Stages: Four (4)Compressor Stages: Nineteen (19)Outlet Gas Temperature: 630 ºCGenerator Nominal Capacity: 2 x 142 MVAGenerator Nominal Voltage: 13.8 kVGenerator Speed: 3,600 rpmGenerator Cooling System: AirAdvantages: Fast Manufacture, Installation and Low Environmental Impact
DPPInstalled Capacity:
Technology:2 x 118 mW
oPEn cyclE gAS tUrBinE (ocgt)
20 21
AES Dominicana 2011 STATISTICAL REPORT
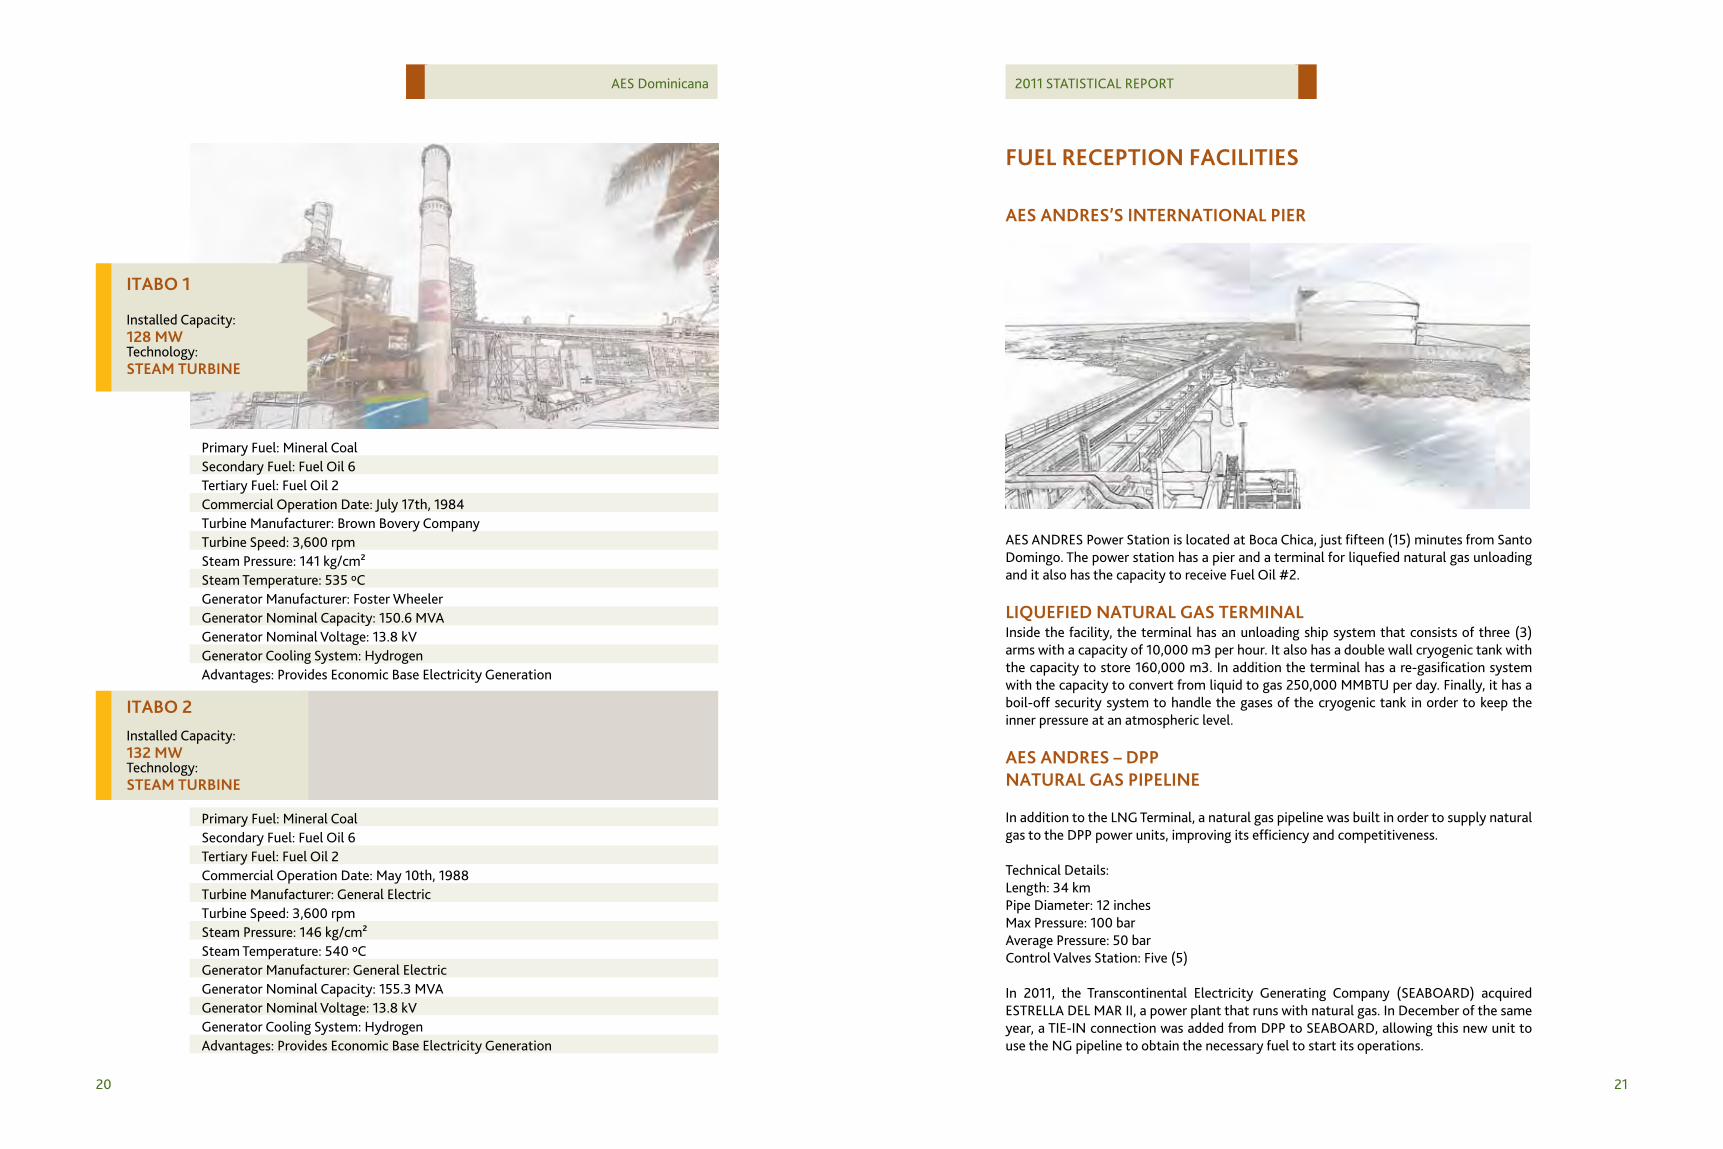
itABo 1
itABo 2
Installed Capacity:
Installed Capacity:
Technology:
Technology:
128 mW
132 mW
StEAm tUrBinE
StEAm tUrBinE
Primary Fuel: Mineral CoalSecondary Fuel: Fuel Oil 6Tertiary Fuel: Fuel Oil 2Commercial Operation Date: July 17th, 1984Turbine Manufacturer: Brown Bovery CompanyTurbine Speed: 3,600 rpmSteam Pressure: 141 kg/cm²Steam Temperature: 535 ºCGenerator Manufacturer: Foster WheelerGenerator Nominal Capacity: 150.6 MVAGenerator Nominal Voltage: 13.8 kVGenerator Cooling System: HydrogenAdvantages: Provides Economic Base Electricity Generation
Primary Fuel: Mineral CoalSecondary Fuel: Fuel Oil 6Tertiary Fuel: Fuel Oil 2Commercial Operation Date: May 10th, 1988Turbine Manufacturer: General ElectricTurbine Speed: 3,600 rpmSteam Pressure: 146 kg/cm²Steam Temperature: 540 ºCGenerator Manufacturer: General ElectricGenerator Nominal Capacity: 155.3 MVAGenerator Nominal Voltage: 13.8 kVGenerator Cooling System: HydrogenAdvantages: Provides Economic Base Electricity Generation
fUEl rEcEPtion fAcilitiES
AES AnDrES’S intErnAtionAl PiEr
AES ANDRES Power Station is located at Boca Chica, just fifteen (15) minutes from Santo Domingo. The power station has a pier and a terminal for liquefied natural gas unloading and it also has the capacity to receive Fuel Oil #2.
liqUEfiED nAtUrAl gAS tErminAlInside the facility, the terminal has an unloading ship system that consists of three (3) arms with a capacity of 10,000 m3 per hour. It also has a double wall cryogenic tank with the capacity to store 160,000 m3. In addition the terminal has a re-gasification system with the capacity to convert from liquid to gas 250,000 MMBTU per day. Finally, it has a boil-off security system to handle the gases of the cryogenic tank in order to keep the inner pressure at an atmospheric level.
AES AnDrES – DPP nAtUrAl gAS PiPElinE
In addition to the LNG Terminal, a natural gas pipeline was built in order to supply natural gas to the DPP power units, improving its efficiency and competitiveness.
Technical Details:Length: 34 kmPipe Diameter: 12 inchesMax Pressure: 100 barAverage Pressure: 50 barControl Valves Station: Five (5)
In 2011, the Transcontinental Electricity Generating Company (SEABOARD) acquired ESTRELLA DEL MAR II, a power plant that runs with natural gas. In December of the same year, a TIE-IN connection was added from DPP to SEABOARD, allowing this new unit to use the NG pipeline to obtain the necessary fuel to start its operations.
22 23
AES Dominicana 2011 STATISTICAL REPORT
cryogEnic DiStriBUtion tErminAlIn 2009, AES Dominicana decided to invest in the first LNG tank loading terminal in Latin America, for the distribution of liquefied natural gas directly to other customers who are not AES. The advantage of using liquefied natural gas is the ability to carry higher energy content to distant locations without incurring in losses during transportation.
The LNG tank loading terminal has two loading bays (with the possibility of doubling the capacity) and a loading rate of 68 m3 / h, which means that the average customer service time (from admission to the complex to the departure) is approximately one hour.
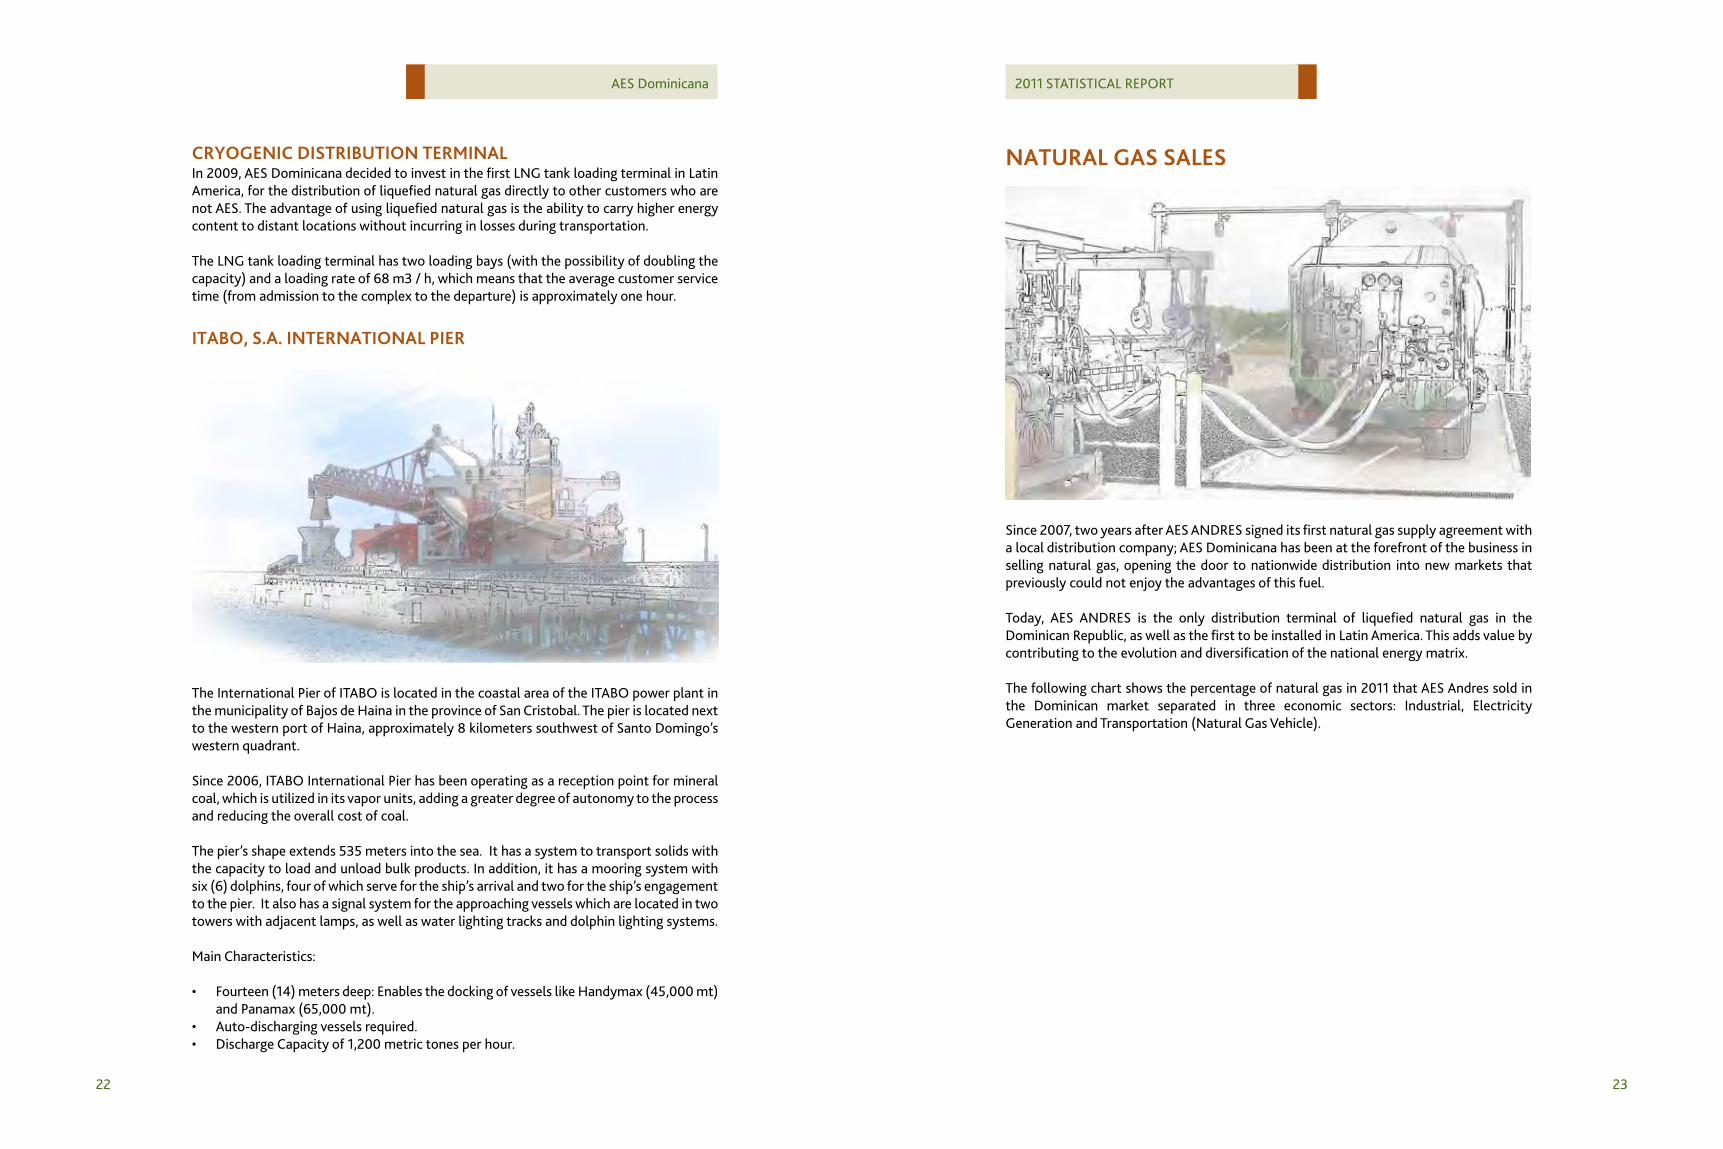
itABo, S.A. intErnAtionAl PiEr
The International Pier of ITABO is located in the coastal area of the ITABO power plant in the municipality of Bajos de Haina in the province of San Cristobal. The pier is located next to the western port of Haina, approximately 8 kilometers southwest of Santo Domingo’s western quadrant.
Since 2006, ITABO International Pier has been operating as a reception point for mineral coal, which is utilized in its vapor units, adding a greater degree of autonomy to the process and reducing the overall cost of coal.
The pier’s shape extends 535 meters into the sea. It has a system to transport solids with the capacity to load and unload bulk products. In addition, it has a mooring system with six (6) dolphins, four of which serve for the ship’s arrival and two for the ship’s engagement to the pier. It also has a signal system for the approaching vessels which are located in two towers with adjacent lamps, as well as water lighting tracks and dolphin lighting systems.
Main Characteristics:
• Fourteen (14) meters deep: Enables the docking of vessels like Handymax (45,000 mt) and Panamax (65,000 mt).
• Auto-discharging vessels required.• Discharge Capacity of 1,200 metric tones per hour.
nAtUrAl gAS SAlES
Since 2007, two years after AES ANDRES signed its first natural gas supply agreement with a local distribution company; AES Dominicana has been at the forefront of the business in selling natural gas, opening the door to nationwide distribution into new markets that previously could not enjoy the advantages of this fuel.
Today, AES ANDRES is the only distribution terminal of liquefied natural gas in the Dominican Republic, as well as the first to be installed in Latin America. This adds value by contributing to the evolution and diversification of the national energy matrix.
The following chart shows the percentage of natural gas in 2011 that AES Andres sold in the Dominican market separated in three economic sectors: Industrial, Electricity Generation and Transportation (Natural Gas Vehicle).

24 25
AES Dominicana 2011 STATISTICAL REPORT
nAtUrAl gAS SAlES to thirD PArtiES [tBtU]
2007 2008 2009 2010 2011
4.54.03.53.02.52.01.51.00.5
0
In the chart above we can see the huge take-off that the natural gas market had in 2011. According to the projected outcome of the nomination process for 2012, it is expected that third parties demand will increase by more than double compared to 2011.
2011 nAtUrAl gAS SAlES By USE 4,459,796.77 mmBtU
ElectricityGeneration
GNV
Industrial
5%
5%
90%
The following graph shows the monthly natural gas sales by economic sector during 2011.
2011 monthly nAtUrAl gAS SAlES By finAl conSUmPtion [mmBtU]
generación EléctricangV industrial
500,000
400,000
300,000
200,000
100,000
0Jan feb mar Apr may Jun Jul Aug Sep oct nov Dec
AES Dominicana continues its commercial relationships with different local distributors which are responsible for the physical distribution of LNG throughout the country. These are: LINEA CLAVE, SOLUCIONES DE GAS NATURAL, PLATERGAS, PROPAGAS and TROPIGAS.
26 27
AES Dominicana 2011 STATISTICAL REPORT
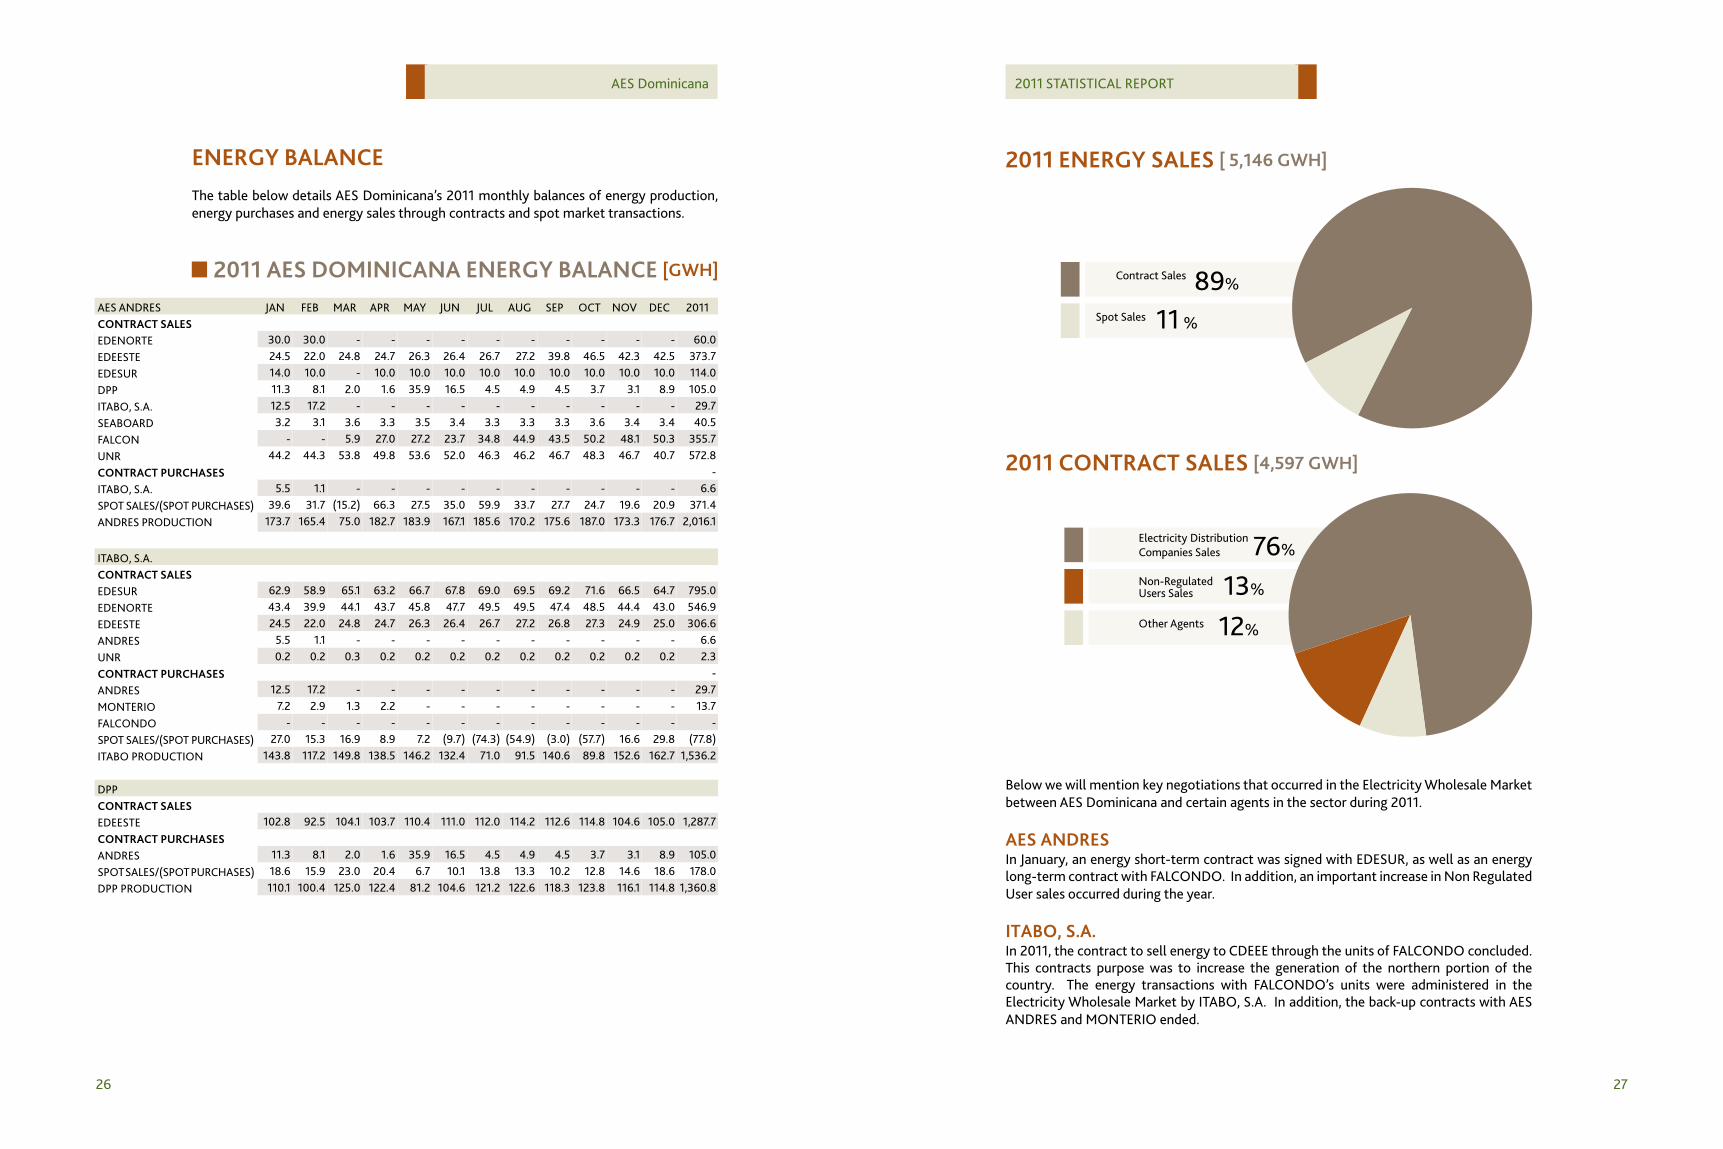
2011 EnErgy SAlES [ 5,146 gWh]
Spot Sales
Contract Sales
11 %
%89
2011 contrAct SAlES [4,597 gWh]
Non-RegulatedUsers Sales
Other Agents
Electricity Distribution Companies Sales
13%
12%
76%
Below we will mention key negotiations that occurred in the Electricity Wholesale Market between AES Dominicana and certain agents in the sector during 2011.
AES AnDrESIn January, an energy short-term contract was signed with EDESUR, as well as an energy long-term contract with FALCONDO. In addition, an important increase in Non Regulated User sales occurred during the year.
itABo, S.A.In 2011, the contract to sell energy to CDEEE through the units of FALCONDO concluded. This contracts purpose was to increase the generation of the northern portion of the country. The energy transactions with FALCONDO’s units were administered in the Electricity Wholesale Market by ITABO, S.A. In addition, the back-up contracts with AES ANDRES and MONTERIO ended.
EnErgy BAlAncEThe table below details AES Dominicana’s 2011 monthly balances of energy production, energy purchases and energy sales through contracts and spot market transactions.
2011 AES DominicAnA EnErgy BAlAncE [gWh]
AES ANDRES JAN FEB MAR APR MAY JUN JUL AUG SEP OCT NOV DEC 2011contrAct SAlESEDENORTE 30.0 30.0 - - - - - - - - - - 60.0 EDEESTE 24.5 22.0 24.8 24.7 26.3 26.4 26.7 27.2 39.8 46.5 42.3 42.5 373.7 EDESUR 14.0 10.0 - 10.0 10.0 10.0 10.0 10.0 10.0 10.0 10.0 10.0 114.0 DPP 11.3 8.1 2.0 1.6 35.9 16.5 4.5 4.9 4.5 3.7 3.1 8.9 105.0 ITABO, S.A. 12.5 17.2 - - - - - - - - - - 29.7 SEABOARD 3.2 3.1 3.6 3.3 3.5 3.4 3.3 3.3 3.3 3.6 3.4 3.4 40.5 FALCON - - 5.9 27.0 27.2 23.7 34.8 44.9 43.5 50.2 48.1 50.3 355.7 UNR 44.2 44.3 53.8 49.8 53.6 52.0 46.3 46.2 46.7 48.3 46.7 40.7 572.8 contrAct PUrchASES - ITABO, S.A. 5.5 1.1 - - - - - - - - - - 6.6 SPOT SALES/(SPOT PURCHASES) 39.6 31.7 (15.2) 66.3 27.5 35.0 59.9 33.7 27.7 24.7 19.6 20.9 371.4 ANDRES PRODUCTION 173.7 165.4 75.0 182.7 183.9 167.1 185.6 170.2 175.6 187.0 173.3 176.7 2,016.1
ITABO, S.A.contrAct SAlESEDESUR 62.9 58.9 65.1 63.2 66.7 67.8 69.0 69.5 69.2 71.6 66.5 64.7 795.0 EDENORTE 43.4 39.9 44.1 43.7 45.8 47.7 49.5 49.5 47.4 48.5 44.4 43.0 546.9 EDEESTE 24.5 22.0 24.8 24.7 26.3 26.4 26.7 27.2 26.8 27.3 24.9 25.0 306.6 ANDRES 5.5 1.1 - - - - - - - - - - 6.6 UNR 0.2 0.2 0.3 0.2 0.2 0.2 0.2 0.2 0.2 0.2 0.2 0.2 2.3 contrAct PUrchASES - ANDRES 12.5 17.2 - - - - - - - - - - 29.7 MONTERIO 7.2 2.9 1.3 2.2 - - - - - - - - 13.7 FALCONDO - - - - - - - - - - - - - SPOT SALES/(SPOT PURCHASES) 27.0 15.3 16.9 8.9 7.2 (9.7) (74.3) (54.9) (3.0) (57.7) 16.6 29.8 (77.8)ITABO PRODUCTION 143.8 117.2 149.8 138.5 146.2 132.4 71.0 91.5 140.6 89.8 152.6 162.7 1,536.2
DPPcontrAct SAlESEDEESTE 102.8 92.5 104.1 103.7 110.4 111.0 112.0 114.2 112.6 114.8 104.6 105.0 1,287.7 contrAct PUrchASESANDRES 11.3 8.1 2.0 1.6 35.9 16.5 4.5 4.9 4.5 3.7 3.1 8.9 105.0 SPOT SALES/(SPOT PURCHASES) 18.6 15.9 23.0 20.4 6.7 10.1 13.8 13.3 10.2 12.8 14.6 18.6 178.0 DPP PRODUCTION 110.1 100.4 125.0 122.4 81.2 104.6 121.2 122.6 118.3 123.8 116.1 114.8 1,360.8
28 29
AES Dominicana 2011 STATISTICAL REPORT
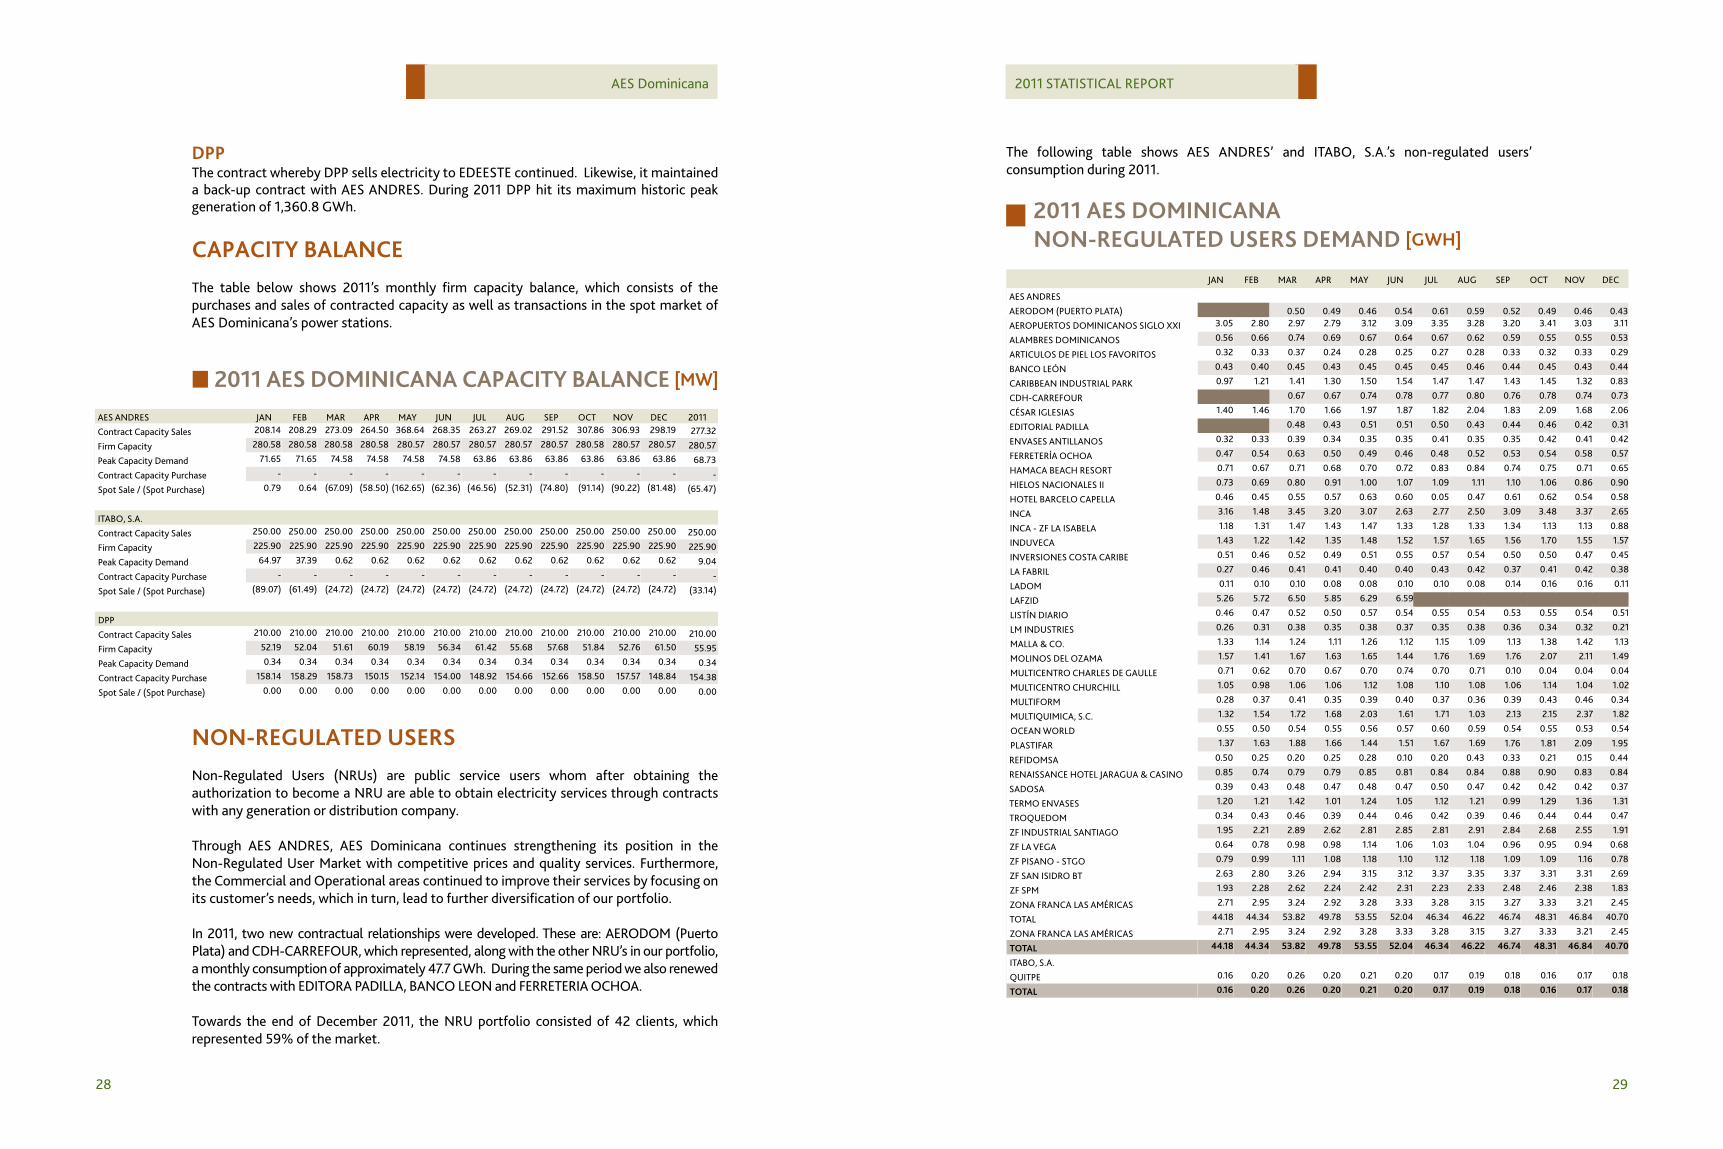
The following table shows AES ANDRES’ and ITABO, S.A.’s non-regulated users’ consumption during 2011.
2011 AES DominicAnAnon-rEgUlAtED USErS DEmAnD [gWh]
JAN FEB MAR APR MAY JUN JUL AUG SEP OCT NOV DEC
AES ANDRES
AERODOM (PUERTO PLATA) 0.50 0.49 0.46 0.54 0.61 0.59 0.52 0.49 0.46 0.43
AEROPUERTOS DOMINICANOS SIGLO XXI 3.05 2.80 2.97 2.79 3.12 3.09 3.35 3.28 3.20 3.41 3.03 3.11
ALAMBRES DOMINICANOS 0.56 0.66 0.74 0.69 0.67 0.64 0.67 0.62 0.59 0.55 0.55 0.53
ARTICULOS DE PIEL LOS FAVORITOS 0.32 0.33 0.37 0.24 0.28 0.25 0.27 0.28 0.33 0.32 0.33 0.29
BANCO LEÓN 0.43 0.40 0.45 0.43 0.45 0.45 0.45 0.46 0.44 0.45 0.43 0.44
CARIBBEAN INDUSTRIAL PARK 0.97 1.21 1.41 1.30 1.50 1.54 1.47 1.47 1.43 1.45 1.32 0.83
CDH-CARREFOUR 0.67 0.67 0.74 0.78 0.77 0.80 0.76 0.78 0.74 0.73
CÉSAR IGLESIAS 1.40 1.46 1.70 1.66 1.97 1.87 1.82 2.04 1.83 2.09 1.68 2.06
EDITORIAL PADILLA 0.48 0.43 0.51 0.51 0.50 0.43 0.44 0.46 0.42 0.31
ENVASES ANTILLANOS 0.32 0.33 0.39 0.34 0.35 0.35 0.41 0.35 0.35 0.42 0.41 0.42
FERRETERÍA OCHOA 0.47 0.54 0.63 0.50 0.49 0.46 0.48 0.52 0.53 0.54 0.58 0.57
HAMACA BEACH RESORT 0.71 0.67 0.71 0.68 0.70 0.72 0.83 0.84 0.74 0.75 0.71 0.65
HIELOS NACIONALES II 0.73 0.69 0.80 0.91 1.00 1.07 1.09 1.11 1.10 1.06 0.86 0.90
HOTEL BARCELO CAPELLA 0.46 0.45 0.55 0.57 0.63 0.60 0.05 0.47 0.61 0.62 0.54 0.58
INCA 3.16 1.48 3.45 3.20 3.07 2.63 2.77 2.50 3.09 3.48 3.37 2.65
INCA - ZF LA ISABELA 1.18 1.31 1.47 1.43 1.47 1.33 1.28 1.33 1.34 1.13 1.13 0.88
INDUVECA 1.43 1.22 1.42 1.35 1.48 1.52 1.57 1.65 1.56 1.70 1.55 1.57
INVERSIONES COSTA CARIBE 0.51 0.46 0.52 0.49 0.51 0.55 0.57 0.54 0.50 0.50 0.47 0.45
LA FABRIL 0.27 0.46 0.41 0.41 0.40 0.40 0.43 0.42 0.37 0.41 0.42 0.38
LADOM 0.11 0.10 0.10 0.08 0.08 0.10 0.10 0.08 0.14 0.16 0.16 0.11
LAFZID 5.26 5.72 6.50 5.85 6.29 6.59
LISTÍN DIARIO 0.46 0.47 0.52 0.50 0.57 0.54 0.55 0.54 0.53 0.55 0.54 0.51
LM INDUSTRIES 0.26 0.31 0.38 0.35 0.38 0.37 0.35 0.38 0.36 0.34 0.32 0.21
MALLA & CO. 1.33 1.14 1.24 1.11 1.26 1.12 1.15 1.09 1.13 1.38 1.42 1.13
MOLINOS DEL OZAMA 1.57 1.41 1.67 1.63 1.65 1.44 1.76 1.69 1.76 2.07 2.11 1.49
MULTICENTRO CHARLES DE GAULLE 0.71 0.62 0.70 0.67 0.70 0.74 0.70 0.71 0.10 0.04 0.04 0.04
MULTICENTRO CHURCHILL 1.05 0.98 1.06 1.06 1.12 1.08 1.10 1.08 1.06 1.14 1.04 1.02
MULTIFORM 0.28 0.37 0.41 0.35 0.39 0.40 0.37 0.36 0.39 0.43 0.46 0.34
MULTIQUIMICA, S.C. 1.32 1.54 1.72 1.68 2.03 1.61 1.71 1.03 2.13 2.15 2.37 1.82
OCEAN WORLD 0.55 0.50 0.54 0.55 0.56 0.57 0.60 0.59 0.54 0.55 0.53 0.54
PLASTIFAR 1.37 1.63 1.88 1.66 1.44 1.51 1.67 1.69 1.76 1.81 2.09 1.95
REFIDOMSA 0.50 0.25 0.20 0.25 0.28 0.10 0.20 0.43 0.33 0.21 0.15 0.44
RENAISSANCE HOTEL JARAGUA & CASINO 0.85 0.74 0.79 0.79 0.85 0.81 0.84 0.84 0.88 0.90 0.83 0.84
SADOSA 0.39 0.43 0.48 0.47 0.48 0.47 0.50 0.47 0.42 0.42 0.42 0.37
TERMO ENVASES 1.20 1.21 1.42 1.01 1.24 1.05 1.12 1.21 0.99 1.29 1.36 1.31
TROQUEDOM 0.34 0.43 0.46 0.39 0.44 0.46 0.42 0.39 0.46 0.44 0.44 0.47
ZF INDUSTRIAL SANTIAGO 1.95 2.21 2.89 2.62 2.81 2.85 2.81 2.91 2.84 2.68 2.55 1.91
ZF LA VEGA 0.64 0.78 0.98 0.98 1.14 1.06 1.03 1.04 0.96 0.95 0.94 0.68
ZF PISANO - STGO 0.79 0.99 1.11 1.08 1.18 1.10 1.12 1.18 1.09 1.09 1.16 0.78
ZF SAN ISIDRO BT 2.63 2.80 3.26 2.94 3.15 3.12 3.37 3.35 3.37 3.31 3.31 2.69
ZF SPM 1.93 2.28 2.62 2.24 2.42 2.31 2.23 2.33 2.48 2.46 2.38 1.83
ZONA FRANCA LAS AMÉRICAS 2.71 2.95 3.24 2.92 3.28 3.33 3.28 3.15 3.27 3.33 3.21 2.45
TOTAL 44.18 44.34 53.82 49.78 53.55 52.04 46.34 46.22 46.74 48.31 46.84 40.70
ZONA FRANCA LAS AMÉRICAS 2.71 2.95 3.24 2.92 3.28 3.33 3.28 3.15 3.27 3.33 3.21 2.45
totAl 44.18 44.34 53.82 49.78 53.55 52.04 46.34 46.22 46.74 48.31 46.84 40.70
ITABO, S.A.
QUITPE 0.16 0.20 0.26 0.20 0.21 0.20 0.17 0.19 0.18 0.16 0.17 0.18
totAl 0.16 0.20 0.26 0.20 0.21 0.20 0.17 0.19 0.18 0.16 0.17 0.18
DPPThe contract whereby DPP sells electricity to EDEESTE continued. Likewise, it maintained a back-up contract with AES ANDRES. During 2011 DPP hit its maximum historic peak generation of 1,360.8 GWh.
cAPAcity BAlAncEThe table below shows 2011’s monthly firm capacity balance, which consists of the purchases and sales of contracted capacity as well as transactions in the spot market of AES Dominicana’s power stations.
2011 AES DominicAnA cAPAcity BAlAncE [mW]
AES ANDRES JAN FEB MAR APR MAY JUN JUL AUG SEP OCT NOV DEC 2011
Contract Capacity Sales 208.14 208.29 273.09 264.50 368.64 268.35 263.27 269.02 291.52 307.86 306.93 298.19 277.32
Firm Capacity 280.58 280.58 280.58 280.58 280.57 280.57 280.57 280.57 280.57 280.58 280.57 280.57 280.57
Peak Capacity Demand 71.65 71.65 74.58 74.58 74.58 74.58 63.86 63.86 63.86 63.86 63.86 63.86 68.73
Contract Capacity Purchase - - - - - - - - - - - - -
Spot Sale / (Spot Purchase) 0.79 0.64 (67.09) (58.50) (162.65) (62.36) (46.56) (52.31) (74.80) (91.14) (90.22) (81.48) (65.47)
ITABO, S.A.
Contract Capacity Sales 250.00 250.00 250.00 250.00 250.00 250.00 250.00 250.00 250.00 250.00 250.00 250.00 250.00
Firm Capacity 225.90 225.90 225.90 225.90 225.90 225.90 225.90 225.90 225.90 225.90 225.90 225.90 225.90
Peak Capacity Demand 64.97 37.39 0.62 0.62 0.62 0.62 0.62 0.62 0.62 0.62 0.62 0.62 9.04
Contract Capacity Purchase - - - - - - - - - - - - -
Spot Sale / (Spot Purchase) (89.07) (61.49) (24.72) (24.72) (24.72) (24.72) (24.72) (24.72) (24.72) (24.72) (24.72) (24.72) (33.14)
DPP
Contract Capacity Sales 210.00 210.00 210.00 210.00 210.00 210.00 210.00 210.00 210.00 210.00 210.00 210.00 210.00
Firm Capacity 52.19 52.04 51.61 60.19 58.19 56.34 61.42 55.68 57.68 51.84 52.76 61.50 55.95
Peak Capacity Demand 0.34 0.34 0.34 0.34 0.34 0.34 0.34 0.34 0.34 0.34 0.34 0.34 0.34
Contract Capacity Purchase 158.14 158.29 158.73 150.15 152.14 154.00 148.92 154.66 152.66 158.50 157.57 148.84 154.38
Spot Sale / (Spot Purchase) 0.00 0.00 0.00 0.00 0.00 0.00 0.00 0.00 0.00 0.00 0.00 0.00 0.00
non-rEgUlAtED USErSNon-Regulated Users (NRUs) are public service users whom after obtaining the authorization to become a NRU are able to obtain electricity services through contracts with any generation or distribution company.
Through AES ANDRES, AES Dominicana continues strengthening its position in the Non-Regulated User Market with competitive prices and quality services. Furthermore, the Commercial and Operational areas continued to improve their services by focusing on its customer’s needs, which in turn, lead to further diversification of our portfolio.
In 2011, two new contractual relationships were developed. These are: AERODOM (Puerto Plata) and CDH-CARREFOUR, which represented, along with the other NRU’s in our portfolio, a monthly consumption of approximately 47.7 GWh. During the same period we also renewed the contracts with EDITORA PADILLA, BANCO LEON and FERRETERIA OCHOA.
Towards the end of December 2011, the NRU portfolio consisted of 42 clients, which represented 59% of the market.

30 31
AES Dominicana 2011 STATISTICAL REPORT
fUEl inVEntory AnD conSUmPtion
nAtUrAl gASDuring 2011, AES ANDRES and DPP consumed a total of 32,352,697 MMBTU and purchased a sum of 36,108,429 MMBTU of natural gas.
The next table shows 2011’s monthly natural gas inventory and consumption. This includes purchases, consumptions and sales to third parties.
nAtUrAl gAS inVEntory AnD conSUmPtionS [mmBtU]
AES ANDRES & DPP JAN FEB MAR APR MAY JUN JUL AUG SEP OCT NOV DEC TotalBeginning Inventory 1,822,279 1,962,776 1,959,449 2,488,069 2,242,496 2,495,957 2,579,614 2,176,353 1,959,150 1,744,409 1,310,846 1,104,154
Purchases 3,134,775 2,830,516 3,005,058 3,019,250 3,026,887 3,038,103 2,951,845 3,073,145 3,039,222 2,981,214 3,057,585 2,950,829 36,108,429
ANDRES Consumptions 1,362,106 1,293,071 591,963 1,397,695 1,426,893 1,311,559 1,421,899 1,313,503 1,338,586 1,431,099 1,330,244 1,354,205 15,572,823
DPP Consumptions 1,346,462 1,231,858 1,530,389 1,496,687 982,860 1,275,478 1,505,533 1,524,074 1,475,544 1,542,098 1,458,595 1,410,296 16,779,874
BOG Consumptions 16,577 13,848 19,391 19,403 19,447 16,423 20,486 18,568 13,193 7,038 6,601 264 171,239
Third Partie Sales 251,175 283,879 326,558 343,192 341,786 345,066 406,447 433,732 421,503 434,187 459,995 418,571 4,466,091
Losses 17,958 11,187 8,137 7,845 2,440 5,920 741 471 5,138 355 8,842 126 69,160
final inventory 1,962,776 1,959,449 2,488,069 2,242,496 2,495,957 2,579,614 2,176,353 1,959,150 1,744,409 1,310,846 1,104,154 871,521
coAlIn 2011, ITABO, S.A. registered a consumption of 632,920 metric tons of coal and 798 metric tons of petcoke.
The table below shows the monthly evolution in the inventories and the consumptions of both coal and petcoke.
2011 coAl inVEntory AnD conSUmPtionS [mEtric ton]
ITABO, S.A. JAN FEB MAR APR MAY JUN JUL AUG SEP OCT NOV DEC TotalBeginning Inventory 49,476 20,189 19,081 72,742 89,170 73,249 56,462 64,083 61,970 92,727 55,299 68,824 723,270 Purchases 31,235 42,464 116,390 75,122 47,786 41,038 38,112 37,855 90,019 - 76,382 104,293 700,697 Consumptions 51,121 43,573 62,999 57,610 63,707 57,825 29,217 39,949 59,262 37,428 62,857 67,371 632,920 Third Partie Sales - - - - - - - - - - - - - Losses 9,400 - - 1,084 - - 1,274 13 - - - - 11,771 Final Inventory 20,189 19,081 72,472 89,170 73,249 56,462 64,083 61,976 92,727 55,299 68,824 105,746 779,277
Subtotal consumo 60,521 43,573 62,999 58,693 63,707 57,825 30,491 39,963 59,262 37,428 62,857 67,371 644,691
2011 PEtcokE inVEntory AnD conSUmPtionS [mEtric ton]
ITABO, S.A. JAN FEB MAR APR MAY JUN JUL AUG SEP OCT NOV DEC TotalBeginning Inventory 3,981 - - - - - - - - - - - 3,981
Purchases - - - - - - - - - - - - - Consumptions 798 - - - - - - - - - - - 798 Third Partie Sales - - - - - - - - - - - - - Losses 3,183 - - - - - - - - - - - 3,183 Final Inventory - - - - - - - - - - - - - Subtotal consumo 798 - - - - - - - - - - - 798 total consumo 61,319 43,573 62,999 58,693 63,707 57,825 30,491 39,963 59,262 37,428 62,857 67,371 633,718
During this year, ITABO, S.A. purchased 700,697 metric tons of coal from various suppliers.
fUEl imPortS
nAtUrAl gASThroughout 2011, the AES ANDRES terminal received eleven (11) vessels under our long-term contract and one (1) from the spot market, the first in the history of AES Dominicana, for a total of 36,108,429 MMBTU, equivalent to 1,606,658 M3 of liquefied Natural Gas. The table below shows the relevant details.
2011 AES AnDrES nAtUrAl gAS imPortS no. Date Supplier Vessel Discharge Port mmBtU m3
1 January 14, 2011 BPGM Bristish Diamond AES ANDRES 3,134,775 139,773 2 February 18, 2011 BPGM Express AES ANDRES 2,830,516 125,992 3 March 22, 2011 BPGM British Trader AES ANDRES 3,005,058 134,035 4 April 20, 2011 BPGM Golar Arctic AES ANDRES 3,019,250 134,827 5 May 23, 2011 BPGM Gaslog Singapore AES ANDRES 3,026,887 135,009 6 June 22, 2011 BPGM British Merchant AES ANDRES 3,038,103 135,488 7 July 19, 2011 BPGM Arctic Princess AES ANDRES 2,951,845 131,731 8 August 14, 2011 BPGM Bristish Diamond AES ANDRES 3,073,145 136,979 9 September 14, 2011 BPGM Golar Arctic AES ANDRES 3,039,222 135,536 10 October 11, 2011 BPGM British Ruby AES ANDRES 2,981,214 133,073 11 November 8, 2011 BPGM British Sapphire AES ANDRES 3,057,585 136,629 12 December 4, 2011 BPGM Arctic Discoverer (Spot Ship) AES ANDRES 2,950,829 127,586
36,108,429 1,606,658
coAlIn 2011, ITABO, S.A. received a total of sixteen (16) vessels of coal, fifteen (15) of which were received at the International pier of ITABO, S.A. and one (1) at the port of HAINA. The total cargo of these vessels combined represented a sum of 700,697 metric tons. These details are found in the following table.
2011 itABo, S.A. coAl imPortS
no. Date Supplier Vessel Discharge Port metric tons mmBtU1 January 23, 2011 INTERAMERICAN/GLENCORE UBC TILSBURY HAINA 31,235 854,153 2 February 9, 2011 INTERAMERICAN COAL BALDER ITABO 42,464 1,183,229 3 March 3, 2011 BULKTRADING BALDOCK ITABO 61,362 1,589,674 4 March 15, 2011 GLENCORE INTERNATIONAL BALDOCK ITABO 55,028 1,482,601 5 April 1, 2011 INTERAMERICAN COAL ANTWERPEN ITABO 38,122 1,011,728 6 April 12, 2011 INTERAMERICAN COAL ANTWERPEN ITABO 37,000 1,017,026 7 May 4, 2011 GLENCORE INTERNATIONAL BALDER ITABO 47,786 1,310,554 8 June 18, 2011 GLENCORE INTERNATIONAL CSL METIS ITABO 41,038 1,113,725 9 July 17, 2011 INTERAMERICAN COAL ANTWERPEN ITABO 38,112 1,048,096 10 August 24, 2011 INTERAMERICAN COAL ANTWERPEN ITABO 37,855 1,036,105 11 September 5, 2011 INTERAMERICAN COAL ANTWERPEN ITABO 38,040 1,017,770 12 September 11, 2011 GLENCORE INTERNATIONAL SOPHIE OLDENDORFF ITABO 51,979 1,395,296 13 November 1, 2011 INTERAMERICAN COAL ANTWERPEN ITABO 38,124 1,050,864 14 November 11, 2011 INTERAMERICAN COAL ANTWERPEN ITABO 38,258 1,058,943 15 December 3, 2011 GLENCORE INTERNATIONAL SOPHIE OLDENDORFF ITABO 52,460 1,398,836 16 December 27, 2011 MACQUAIRE BANK HARMEN OLDENDORFF ITABO 51,832 1,339,928 17 December 27, 2011 MACQUAIRE BANK HARMEN OLDENDORFF ITABO 51,832 1,339,928
700,697 18,908,529
32 33
AES Dominicana 2011 STATISTICAL REPORT
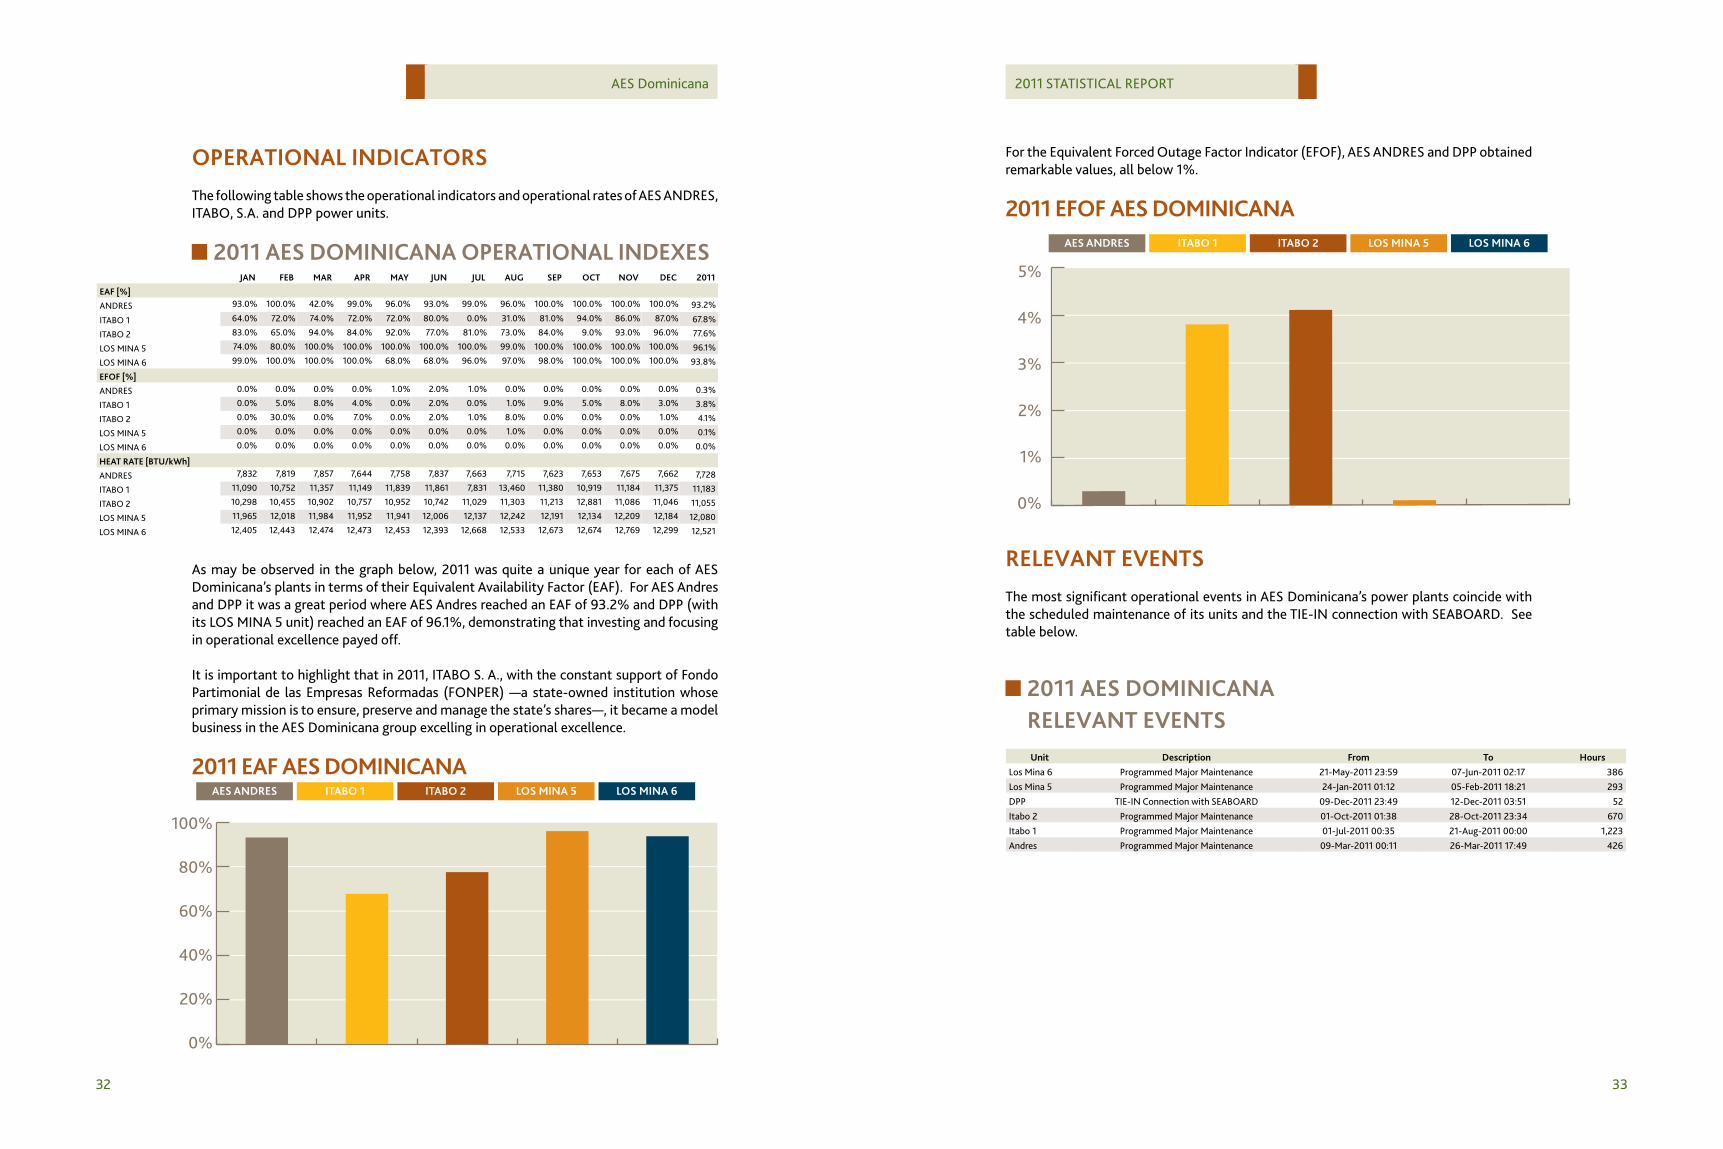
oPErAtionAl inDicAtorSThe following table shows the operational indicators and operational rates of AES ANDRES, ITABO, S.A. and DPP power units.
2011 AES DominicAnA oPErAtionAl inDExESJAn fEB mAr APr mAy JUn JUl AUg SEP oct noV DEc 2011
EAf [%]
ANDRES 93.0% 100.0% 42.0% 99.0% 96.0% 93.0% 99.0% 96.0% 100.0% 100.0% 100.0% 100.0% 93.2%
ITABO 1 64.0% 72.0% 74.0% 72.0% 72.0% 80.0% 0.0% 31.0% 81.0% 94.0% 86.0% 87.0% 67.8%
ITABO 2 83.0% 65.0% 94.0% 84.0% 92.0% 77.0% 81.0% 73.0% 84.0% 9.0% 93.0% 96.0% 77.6%
LOS MINA 5 74.0% 80.0% 100.0% 100.0% 100.0% 100.0% 100.0% 99.0% 100.0% 100.0% 100.0% 100.0% 96.1%
LOS MINA 6 99.0% 100.0% 100.0% 100.0% 68.0% 68.0% 96.0% 97.0% 98.0% 100.0% 100.0% 100.0% 93.8%
Efof [%]
ANDRES 0.0% 0.0% 0.0% 0.0% 1.0% 2.0% 1.0% 0.0% 0.0% 0.0% 0.0% 0.0% 0.3%
ITABO 1 0.0% 5.0% 8.0% 4.0% 0.0% 2.0% 0.0% 1.0% 9.0% 5.0% 8.0% 3.0% 3.8%
ITABO 2 0.0% 30.0% 0.0% 7.0% 0.0% 2.0% 1.0% 8.0% 0.0% 0.0% 0.0% 1.0% 4.1%
LOS MINA 5 0.0% 0.0% 0.0% 0.0% 0.0% 0.0% 0.0% 1.0% 0.0% 0.0% 0.0% 0.0% 0.1%
LOS MINA 6 0.0% 0.0% 0.0% 0.0% 0.0% 0.0% 0.0% 0.0% 0.0% 0.0% 0.0% 0.0% 0.0%
hEAt rAtE [BtU/kWh]
ANDRES 7,832 7,819 7,857 7,644 7,758 7,837 7,663 7,715 7,623 7,653 7,675 7,662 7,728
ITABO 1 11,090 10,752 11,357 11,149 11,839 11,861 7,831 13,460 11,380 10,919 11,184 11,375 11,183
ITABO 2 10,298 10,455 10,902 10,757 10,952 10,742 11,029 11,303 11,213 12,881 11,086 11,046 11,055
LOS MINA 5 11,965 12,018 11,984 11,952 11,941 12,006 12,137 12,242 12,191 12,134 12,209 12,184 12,080
LOS MINA 6 12,405 12,443 12,474 12,473 12,453 12,393 12,668 12,533 12,673 12,674 12,769 12,299 12,521
As may be observed in the graph below, 2011 was quite a unique year for each of AES Dominicana’s plants in terms of their Equivalent Availability Factor (EAF). For AES Andres and DPP it was a great period where AES Andres reached an EAF of 93.2% and DPP (with its LOS MINA 5 unit) reached an EAF of 96.1%, demonstrating that investing and focusing in operational excellence payed off.
It is important to highlight that in 2011, ITABO S. A., with the constant support of Fondo Partimonial de las Empresas Reformadas (FONPER) —a state-owned institution whose primary mission is to ensure, preserve and manage the state’s shares—, it became a model business in the AES Dominicana group excelling in operational excellence.
2011 EAf AES DominicAnAitABo 1 loS minA 5 loS minA 6AES AnDrES itABo 2
100%
80%
60%
40%
20%
0%
For the Equivalent Forced Outage Factor Indicator (EFOF), AES ANDRES and DPP obtained remarkable values, all below 1%.
2011 Efof AES DominicAnAitABo 1 loS minA 5 loS minA 6AES AnDrES itABo 2
5%
4%
3%
2%
1%
0%
rElEVAnt EVEntSThe most significant operational events in AES Dominicana’s power plants coincide with the scheduled maintenance of its units and the TIE-IN connection with SEABOARD. See table below.
2011 AES DominicAnArElEVAnt EVEntSUnit Description from to hours
Los Mina 6 Programmed Major Maintenance 21-May-2011 23:59 07-Jun-2011 02:17 386 Los Mina 5 Programmed Major Maintenance 24-Jan-2011 01:12 05-Feb-2011 18:21 293 DPP TIE-IN Connection with SEABOARD 09-Dec-2011 23:49 12-Dec-2011 03:51 52 Itabo 2 Programmed Major Maintenance 01-Oct-2011 01:38 28-Oct-2011 23:34 670 Itabo 1 Programmed Major Maintenance 01-Jul-2011 00:35 21-Aug-2011 00:00 1,223 Andres Programmed Major Maintenance 09-Mar-2011 00:11 26-Mar-2011 17:49 426
34 35
AES Dominicana 2011 STATISTICAL REPORT
WholESAlE ElEctric mArkEt

36 37
AES Dominicana 2011 STATISTICAL REPORT
BriEf hiStory of thE DominicAn ElEctric SEctor
In 1997 the capitalization process began. It was instituted due to serious problems in the electricity market caused by a deficit in energy generation, poor quality service and a lack of capital investment for the development of the electricity sector.
The capitalization process was formalized in June 24, 1997, with the publication of the State Companies Reform Law. Before this process, generation, transmission and distribution assets in the Dominican Republic were owned by CDE, who by law, was the only entity authorized to operate in the electricity sector.
In the mid 90s, CDE subscribed several power purchase agreements with independent power producers; increasing the systems installed capacity with private capital. During this period, the sector was regulated by a series of administrative resolutions issued by the Industry and Commerce Ministry.
Through the different stages of the capitalization process, the assets held by CDE were divided into eight state-owned companies: CDEEE, a parent holding company, three distribution companies: EDENORTE, EDESUR and EDEESTE, three generation companies: HAINA, ITABO and HIDRO and the power transmission company: ETED.
In 1999, the three distribution companies and the two thermal generation companies were capitalized through the sale of 50% of the stocks to private investors. The Dominican Government remained with 49% of the stocks and the last 1% was sold to the employees of these companies.
In July 2001, the Electricity General Law was issued, establishing the institutions of the sector and the rules under which it will operate. In July 2002, the Electricity General Law Rulebook was issued, completing the electrical sector’s new legislation.
During 2007, the Electricity General Law and its Rulebook were modified by the law number 186-07. The new law’s goal was to penalize electrical fraud and establish other measures to obtain the electrical sector’s financial viability.
gEnErAtion
The electricity generation park of the Dominican Republic is mainly composed of 83.5% of thermoelectric units while the other 16.5% is composed by hydro electrical units.
In 2011 a new power plant was installed to the SENI (National Electric Interconnected System), PIMENTEL III; however, there were two units that went out of commercial operation, these were, Sultana del Este I, which belonged to the company EGE Haina, and Estrella del Norte, which belonged to the Transcontinental Electricity Generating Company (SEABOARD).
The following graph allows us to view the installed capacity of the system by technology.
inStAllED cAPAcity By tEchnology[3,068.2 mW AS of DEcEmBEr 2011]
Gas Turbine
Combined Cycle
Diesel Engine
Hydro Turbine
Steam Turbine
11.0%
26.2%
19.7%
17.1%
26.1%
38 39
AES Dominicana 2011 STATISTICAL REPORT
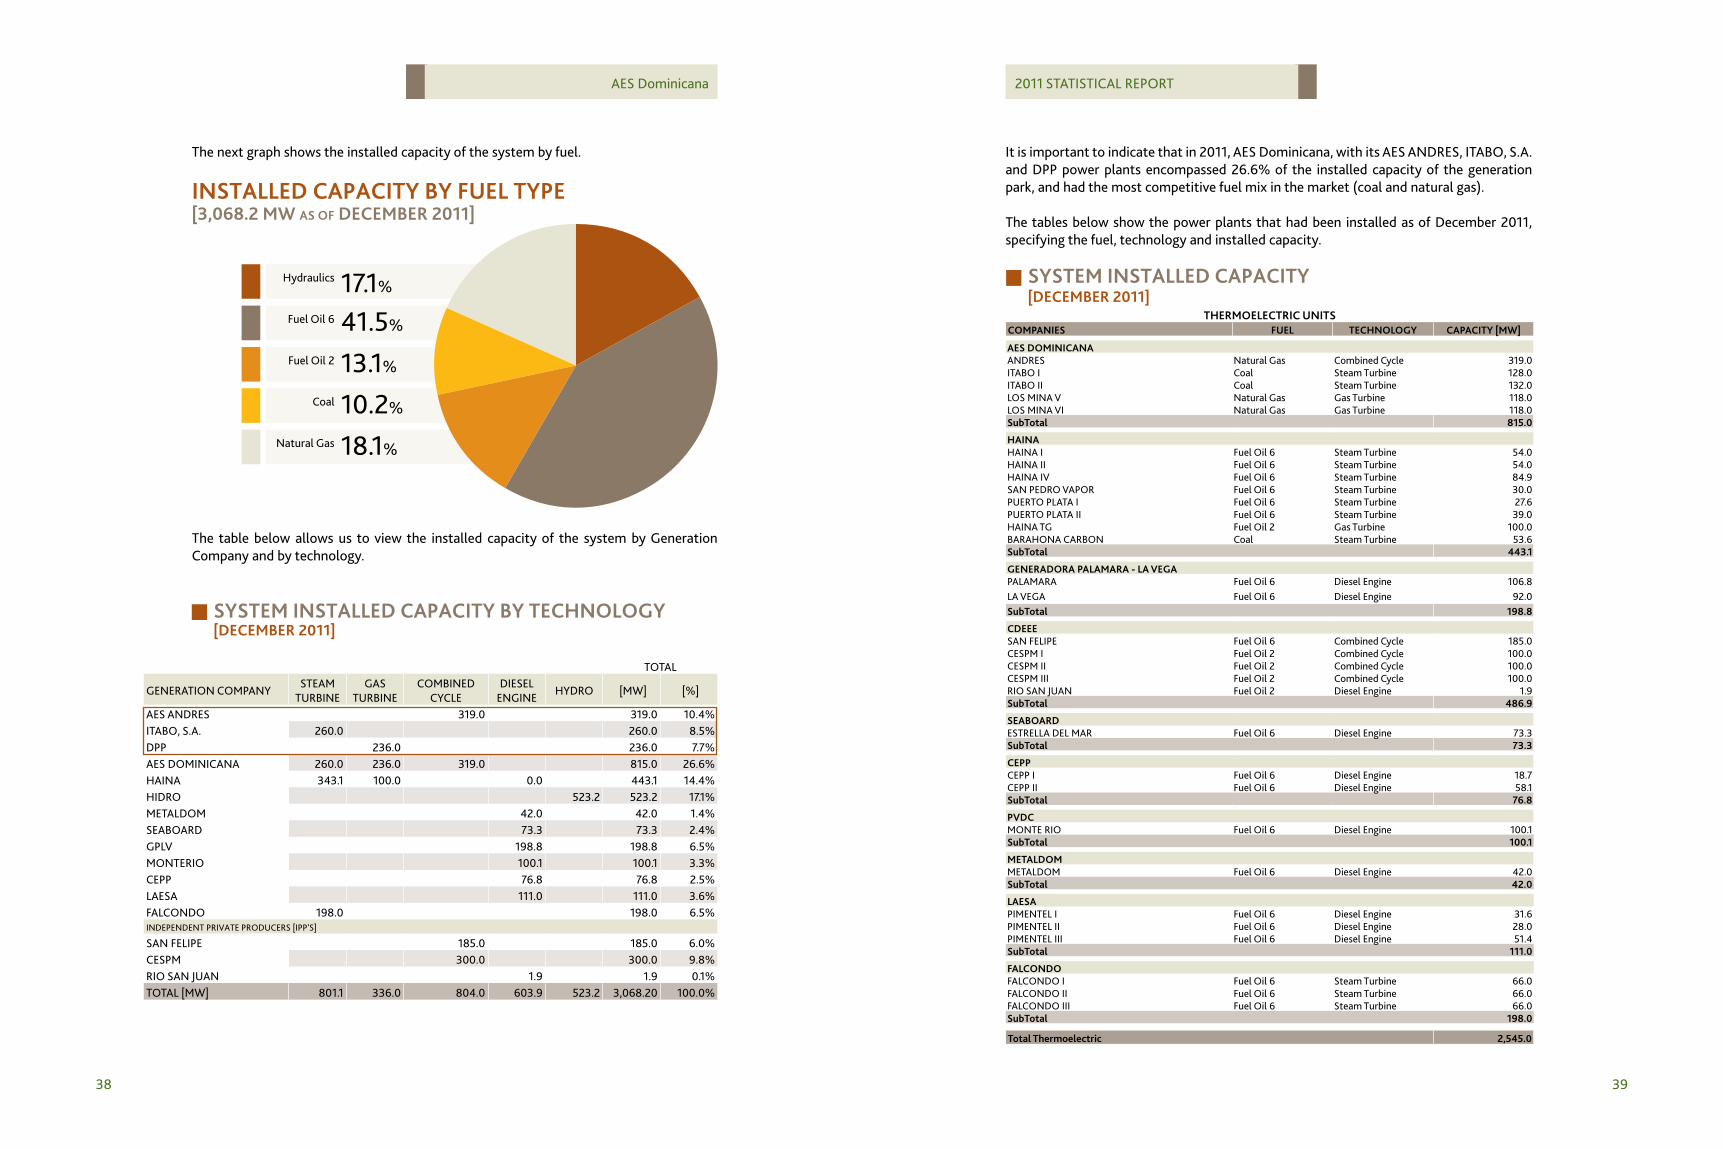
The next graph shows the installed capacity of the system by fuel.
inStAllED cAPAcity By fUEl tyPE[3,068.2 mW AS of DEcEmBEr 2011]
Fuel Oil 6
Coal
Fuel Oil 2
Natural Gas
Hydraulics
41.5%
10.2%
13.1%
18.1%
17.1%
The table below allows us to view the installed capacity of the system by Generation Company and by technology.
SyStEm inStAllED cAPAcity By tEchnology[DEcEmBEr 2011]
TOTAL
GENERATION COMPANYSTEAM
TURBINEGAS
TURBINECOMBINED
CYCLEDIESEL
ENGINEHYDRO [MW] [%]
AES ANDRES 319.0 319.0 10.4%ITABO, S.A. 260.0 260.0 8.5%DPP 236.0 236.0 7.7%AES DOMINICANA 260.0 236.0 319.0 815.0 26.6%HAINA 343.1 100.0 0.0 443.1 14.4%HIDRO 523.2 523.2 17.1%METALDOM 42.0 42.0 1.4%SEABOARD 73.3 73.3 2.4%GPLV 198.8 198.8 6.5%MONTERIO 100.1 100.1 3.3%CEPP 76.8 76.8 2.5%LAESA 111.0 111.0 3.6%FALCONDO 198.0 198.0 6.5%INDEPENDENT PRIVATE PRODUCERS [IPP'S]
SAN FELIPE 185.0 185.0 6.0%CESPM 300.0 300.0 9.8%RIO SAN JUAN 1.9 1.9 0.1%TOTAL [MW] 801.1 336.0 804.0 603.9 523.2 3,068.20 100.0%
It is important to indicate that in 2011, AES Dominicana, with its AES ANDRES, ITABO, S.A. and DPP power plants encompassed 26.6% of the installed capacity of the generation park, and had the most competitive fuel mix in the market (coal and natural gas).
The tables below show the power plants that had been installed as of December 2011, specifying the fuel, technology and installed capacity.
thErmoElEctric UnitScomPAniES fUEl tEchnology cAPAcity [mW]
AES DominicAnAANDRES Natural Gas Combined Cycle 319.0ITABO I Coal Steam Turbine 128.0ITABO II Coal Steam Turbine 132.0LOS MINA V Natural Gas Gas Turbine 118.0LOS MINA VI Natural Gas Gas Turbine 118.0Subtotal 815.0
hAinAHAINA I Fuel Oil 6 Steam Turbine 54.0HAINA II Fuel Oil 6 Steam Turbine 54.0HAINA IV Fuel Oil 6 Steam Turbine 84.9SAN PEDRO VAPOR Fuel Oil 6 Steam Turbine 30.0PUERTO PLATA I Fuel Oil 6 Steam Turbine 27.6PUERTO PLATA II Fuel Oil 6 Steam Turbine 39.0HAINA TG Fuel Oil 2 Gas Turbine 100.0BARAHONA CARBON Coal Steam Turbine 53.6Subtotal 443.1
gEnErADorA PAlAmArA - lA VEgAPALAMARA Fuel Oil 6 Diesel Engine 106.8LA VEGA Fuel Oil 6 Diesel Engine 92.0Subtotal 198.8
cDEEESAN FELIPE Fuel Oil 6 Combined Cycle 185.0CESPM I Fuel Oil 2 Combined Cycle 100.0CESPM II Fuel Oil 2 Combined Cycle 100.0CESPM III Fuel Oil 2 Combined Cycle 100.0RIO SAN JUAN Fuel Oil 2 Diesel Engine 1.9Subtotal 486.9
SEABoArDESTRELLA DEL MAR Fuel Oil 6 Diesel Engine 73.3Subtotal 73.3
cEPP CEPP I Fuel Oil 6 Diesel Engine 18.7CEPP II Fuel Oil 6 Diesel Engine 58.1Subtotal 76.8
PVDcMONTE RIO Fuel Oil 6 Diesel Engine 100.1Subtotal 100.1
mEtAlDomMETALDOM Fuel Oil 6 Diesel Engine 42.0Subtotal 42.0
lAESAPIMENTEL I Fuel Oil 6 Diesel Engine 31.6PIMENTEL II Fuel Oil 6 Diesel Engine 28.0PIMENTEL III Fuel Oil 6 Diesel Engine 51.4Subtotal 111.0
fAlconDoFALCONDO I Fuel Oil 6 Steam Turbine 66.0FALCONDO II Fuel Oil 6 Steam Turbine 66.0FALCONDO III Fuel Oil 6 Steam Turbine 66.0Subtotal 198.0
total thermoelectric 2,545.0
SyStEm inStAllED cAPAcity[DEcEmBEr 2011]
40 41
AES Dominicana 2011 STATISTICAL REPORT
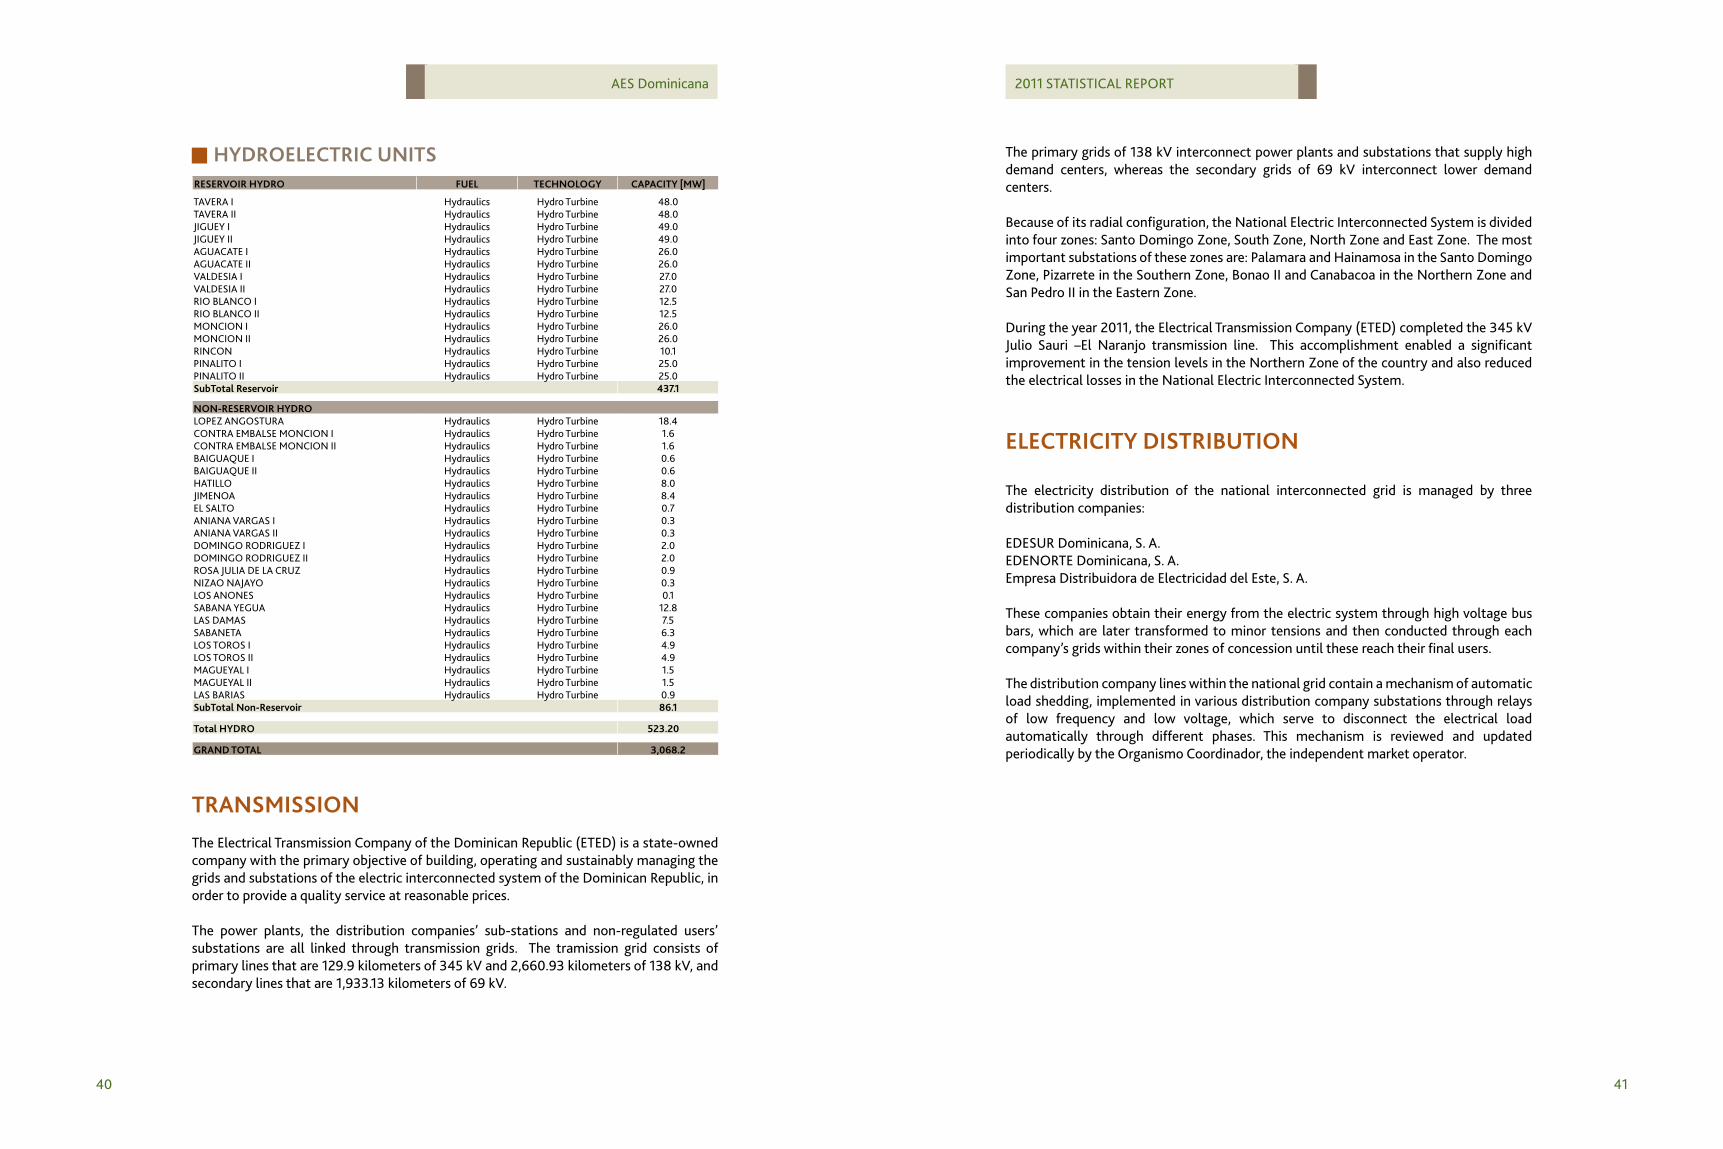
rESErVoir hyDro fUEl tEchnology cAPAcity [mW]
TAVERA I Hydraulics Hydro Turbine 48.0TAVERA II Hydraulics Hydro Turbine 48.0JIGUEY I Hydraulics Hydro Turbine 49.0JIGUEY II Hydraulics Hydro Turbine 49.0AGUACATE I Hydraulics Hydro Turbine 26.0AGUACATE II Hydraulics Hydro Turbine 26.0VALDESIA I Hydraulics Hydro Turbine 27.0VALDESIA II Hydraulics Hydro Turbine 27.0RIO BLANCO I Hydraulics Hydro Turbine 12.5RIO BLANCO II Hydraulics Hydro Turbine 12.5MONCION I Hydraulics Hydro Turbine 26.0MONCION II Hydraulics Hydro Turbine 26.0RINCON Hydraulics Hydro Turbine 10.1PINALITO I Hydraulics Hydro Turbine 25.0PINALITO II Hydraulics Hydro Turbine 25.0Subtotal reservoir 437.1
non-rESErVoir hyDroLOPEZ ANGOSTURA Hydraulics Hydro Turbine 18.4CONTRA EMBALSE MONCION I Hydraulics Hydro Turbine 1.6CONTRA EMBALSE MONCION II Hydraulics Hydro Turbine 1.6BAIGUAQUE I Hydraulics Hydro Turbine 0.6BAIGUAQUE II Hydraulics Hydro Turbine 0.6HATILLO Hydraulics Hydro Turbine 8.0JIMENOA Hydraulics Hydro Turbine 8.4EL SALTO Hydraulics Hydro Turbine 0.7ANIANA VARGAS I Hydraulics Hydro Turbine 0.3ANIANA VARGAS II Hydraulics Hydro Turbine 0.3DOMINGO RODRIGUEZ I Hydraulics Hydro Turbine 2.0DOMINGO RODRIGUEZ II Hydraulics Hydro Turbine 2.0ROSA JULIA DE LA CRUZ Hydraulics Hydro Turbine 0.9NIZAO NAJAYO Hydraulics Hydro Turbine 0.3LOS ANONES Hydraulics Hydro Turbine 0.1SABANA YEGUA Hydraulics Hydro Turbine 12.8LAS DAMAS Hydraulics Hydro Turbine 7.5SABANETA Hydraulics Hydro Turbine 6.3LOS TOROS I Hydraulics Hydro Turbine 4.9LOS TOROS II Hydraulics Hydro Turbine 4.9MAGUEYAL I Hydraulics Hydro Turbine 1.5MAGUEYAL II Hydraulics Hydro Turbine 1.5LAS BARIAS Hydraulics Hydro Turbine 0.9Subtotal non-reservoir 86.1
total hyDro 523.20
grAnD totAl 3,068.2
hyDroElEctric UnitS
trAnSmiSSionThe Electrical Transmission Company of the Dominican Republic (ETED) is a state-owned company with the primary objective of building, operating and sustainably managing the grids and substations of the electric interconnected system of the Dominican Republic, in order to provide a quality service at reasonable prices.
The power plants, the distribution companies’ sub-stations and non-regulated users’ substations are all linked through transmission grids. The tramission grid consists of primary lines that are 129.9 kilometers of 345 kV and 2,660.93 kilometers of 138 kV, and secondary lines that are 1,933.13 kilometers of 69 kV.
The primary grids of 138 kV interconnect power plants and substations that supply high demand centers, whereas the secondary grids of 69 kV interconnect lower demand centers.
Because of its radial configuration, the National Electric Interconnected System is divided into four zones: Santo Domingo Zone, South Zone, North Zone and East Zone. The most important substations of these zones are: Palamara and Hainamosa in the Santo Domingo Zone, Pizarrete in the Southern Zone, Bonao II and Canabacoa in the Northern Zone and San Pedro II in the Eastern Zone.
During the year 2011, the Electrical Transmission Company (ETED) completed the 345 kV Julio Sauri –El Naranjo transmission line. This accomplishment enabled a significant improvement in the tension levels in the Northern Zone of the country and also reduced the electrical losses in the National Electric Interconnected System.
ElEctricity DiStriBUtion
The electricity distribution of the national interconnected grid is managed by three distribution companies:
EDESUR Dominicana, S. A.EDENORTE Dominicana, S. A.Empresa Distribuidora de Electricidad del Este, S. A.
These companies obtain their energy from the electric system through high voltage bus bars, which are later transformed to minor tensions and then conducted through each company’s grids within their zones of concession until these reach their final users.
The distribution company lines within the national grid contain a mechanism of automatic load shedding, implemented in various distribution company substations through relays of low frequency and low voltage, which serve to disconnect the electrical load automatically through different phases. This mechanism is reviewed and updated periodically by the Organismo Coordinador, the independent market operator.
42 43
AES Dominicana 2011 STATISTICAL REPORT
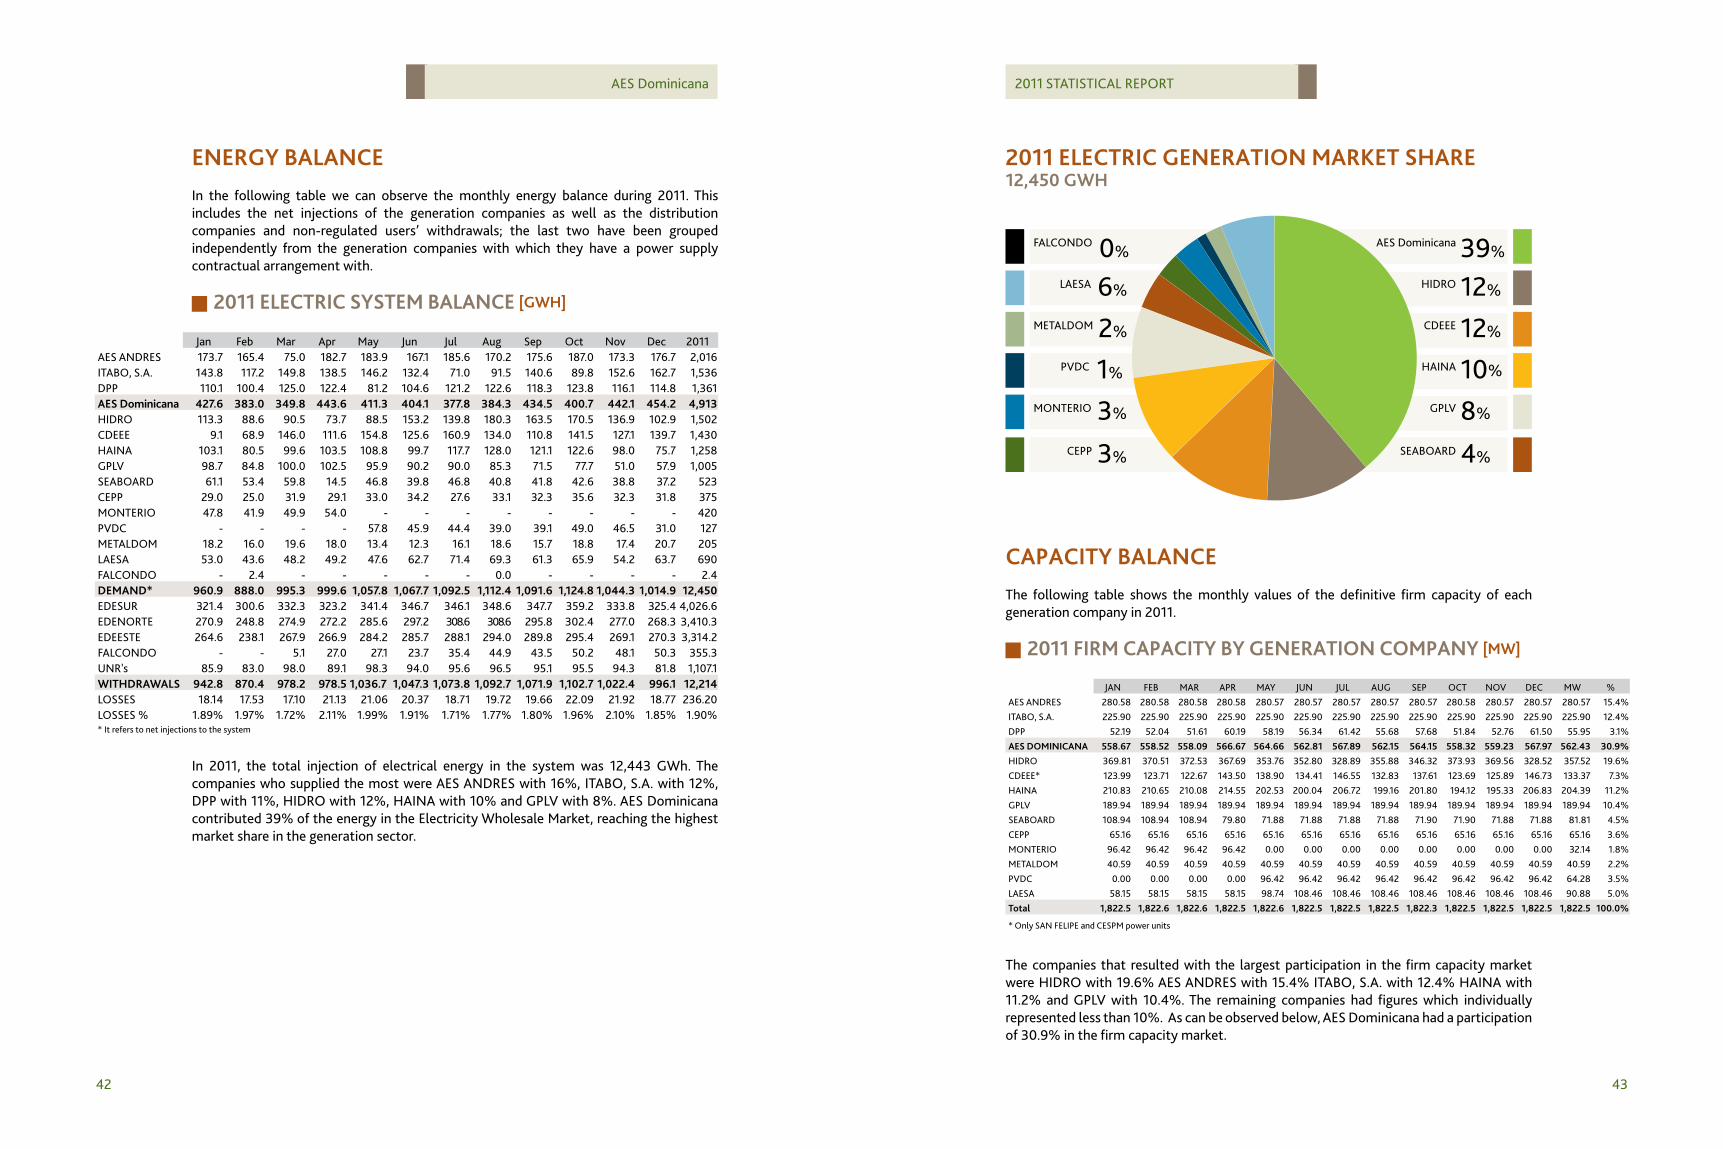
EnErgy BAlAncEIn the following table we can observe the monthly energy balance during 2011. This includes the net injections of the generation companies as well as the distribution companies and non-regulated users’ withdrawals; the last two have been grouped independently from the generation companies with which they have a power supply contractual arrangement with.
2011 ElEctric SyStEm BAlAncE [gWh]
Jan Feb Mar Apr May Jun Jul Aug Sep Oct Nov Dec 2011AES ANDRES 173.7 165.4 75.0 182.7 183.9 167.1 185.6 170.2 175.6 187.0 173.3 176.7 2,016 ITABO, S.A. 143.8 117.2 149.8 138.5 146.2 132.4 71.0 91.5 140.6 89.8 152.6 162.7 1,536 DPP 110.1 100.4 125.0 122.4 81.2 104.6 121.2 122.6 118.3 123.8 116.1 114.8 1,361 AES Dominicana 427.6 383.0 349.8 443.6 411.3 404.1 377.8 384.3 434.5 400.7 442.1 454.2 4,913 HIDRO 113.3 88.6 90.5 73.7 88.5 153.2 139.8 180.3 163.5 170.5 136.9 102.9 1,502 CDEEE 9.1 68.9 146.0 111.6 154.8 125.6 160.9 134.0 110.8 141.5 127.1 139.7 1,430 HAINA 103.1 80.5 99.6 103.5 108.8 99.7 117.7 128.0 121.1 122.6 98.0 75.7 1,258 GPLV 98.7 84.8 100.0 102.5 95.9 90.2 90.0 85.3 71.5 77.7 51.0 57.9 1,005 SEABOARD 61.1 53.4 59.8 14.5 46.8 39.8 46.8 40.8 41.8 42.6 38.8 37.2 523 CEPP 29.0 25.0 31.9 29.1 33.0 34.2 27.6 33.1 32.3 35.6 32.3 31.8 375 MONTERIO 47.8 41.9 49.9 54.0 - - - - - - - - 420 PVDC - - - - 57.8 45.9 44.4 39.0 39.1 49.0 46.5 31.0 127 METALDOM 18.2 16.0 19.6 18.0 13.4 12.3 16.1 18.6 15.7 18.8 17.4 20.7 205 LAESA 53.0 43.6 48.2 49.2 47.6 62.7 71.4 69.3 61.3 65.9 54.2 63.7 690 FALCONDO - 2.4 - - - - - 0.0 - - - - 2.4 DEmAnD* 960.9 888.0 995.3 999.6 1,057.8 1,067.7 1,092.5 1,112.4 1,091.6 1,124.8 1,044.3 1,014.9 12,450 EDESUR 321.4 300.6 332.3 323.2 341.4 346.7 346.1 348.6 347.7 359.2 333.8 325.4 4,026.6 EDENORTE 270.9 248.8 274.9 272.2 285.6 297.2 308.6 308.6 295.8 302.4 277.0 268.3 3,410.3 EDEESTE 264.6 238.1 267.9 266.9 284.2 285.7 288.1 294.0 289.8 295.4 269.1 270.3 3,314.2 FALCONDO - - 5.1 27.0 27.1 23.7 35.4 44.9 43.5 50.2 48.1 50.3 355.3 UNR's 85.9 83.0 98.0 89.1 98.3 94.0 95.6 96.5 95.1 95.5 94.3 81.8 1,107.1 WithDrAWAlS 942.8 870.4 978.2 978.5 1,036.7 1,047.3 1,073.8 1,092.7 1,071.9 1,102.7 1,022.4 996.1 12,214 LOSSES 18.14 17.53 17.10 21.13 21.06 20.37 18.71 19.72 19.66 22.09 21.92 18.77 236.20LOSSES % 1.89% 1.97% 1.72% 2.11% 1.99% 1.91% 1.71% 1.77% 1.80% 1.96% 2.10% 1.85% 1.90%* It refers to net injections to the system
In 2011, the total injection of electrical energy in the system was 12,443 GWh. The companies who supplied the most were AES ANDRES with 16%, ITABO, S.A. with 12%, DPP with 11%, HIDRO with 12%, HAINA with 10% and GPLV with 8%. AES Dominicana contributed 39% of the energy in the Electricity Wholesale Market, reaching the highest market share in the generation sector.
2011 ElEctric gEnErAtion mArkEt ShArE12,450 gWh
LAESA
PVDC
METALDOM
MONTERIO
CEPP
FALCONDO
6%
1%
2%
3%
3%
0%
HIDRO
HAINA
CDEEE
GPLV
SEABOARD
AES Dominicana
12%
10%
12%
8%
4%
39%
cAPAcity BAlAncEThe following table shows the monthly values of the definitive firm capacity of each generation company in 2011.
2011 firm cAPAcity By gEnErAtion comPAny [mW]
JAN FEB MAR APR MAY JUN JUL AUG SEP OCT NOV DEC MW %AES ANDRES 280.58 280.58 280.58 280.58 280.57 280.57 280.57 280.57 280.57 280.58 280.57 280.57 280.57 15.4%ITABO, S.A. 225.90 225.90 225.90 225.90 225.90 225.90 225.90 225.90 225.90 225.90 225.90 225.90 225.90 12.4%DPP 52.19 52.04 51.61 60.19 58.19 56.34 61.42 55.68 57.68 51.84 52.76 61.50 55.95 3.1%AES DominicAnA 558.67 558.52 558.09 566.67 564.66 562.81 567.89 562.15 564.15 558.32 559.23 567.97 562.43 30.9%HIDRO 369.81 370.51 372.53 367.69 353.76 352.80 328.89 355.88 346.32 373.93 369.56 328.52 357.52 19.6%CDEEE* 123.99 123.71 122.67 143.50 138.90 134.41 146.55 132.83 137.61 123.69 125.89 146.73 133.37 7.3%HAINA 210.83 210.65 210.08 214.55 202.53 200.04 206.72 199.16 201.80 194.12 195.33 206.83 204.39 11.2%GPLV 189.94 189.94 189.94 189.94 189.94 189.94 189.94 189.94 189.94 189.94 189.94 189.94 189.94 10.4%SEABOARD 108.94 108.94 108.94 79.80 71.88 71.88 71.88 71.88 71.90 71.90 71.88 71.88 81.81 4.5%CEPP 65.16 65.16 65.16 65.16 65.16 65.16 65.16 65.16 65.16 65.16 65.16 65.16 65.16 3.6%MONTERIO 96.42 96.42 96.42 96.42 0.00 0.00 0.00 0.00 0.00 0.00 0.00 0.00 32.14 1.8%METALDOM 40.59 40.59 40.59 40.59 40.59 40.59 40.59 40.59 40.59 40.59 40.59 40.59 40.59 2.2%PVDC 0.00 0.00 0.00 0.00 96.42 96.42 96.42 96.42 96.42 96.42 96.42 96.42 64.28 3.5%LAESA 58.15 58.15 58.15 58.15 98.74 108.46 108.46 108.46 108.46 108.46 108.46 108.46 90.88 5.0%total 1,822.5 1,822.6 1,822.6 1,822.5 1,822.6 1,822.5 1,822.5 1,822.5 1,822.3 1,822.5 1,822.5 1,822.5 1,822.5 100.0%
* Only SAN FELIPE and CESPM power units
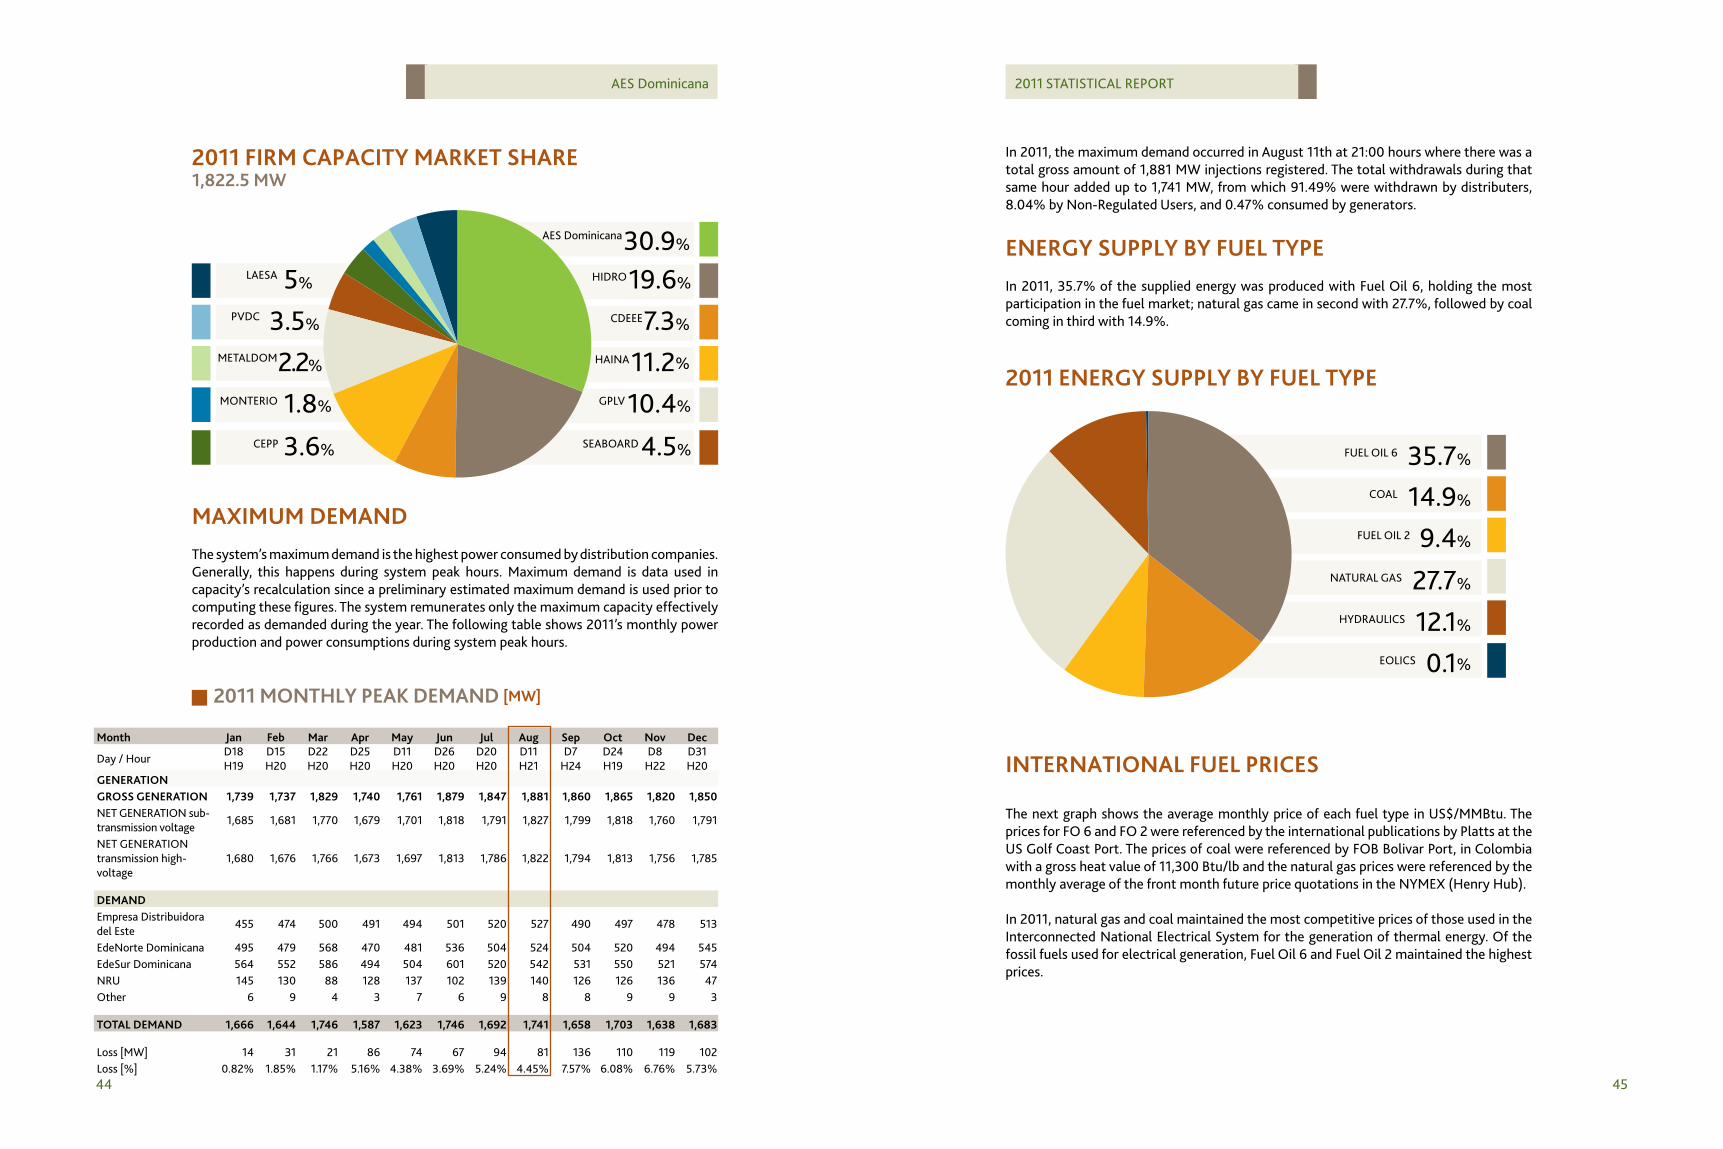
The companies that resulted with the largest participation in the firm capacity market were HIDRO with 19.6% AES ANDRES with 15.4% ITABO, S.A. with 12.4% HAINA with 11.2% and GPLV with 10.4%. The remaining companies had figures which individually represented less than 10%. As can be observed below, AES Dominicana had a participation of 30.9% in the firm capacity market.
44 45
AES Dominicana 2011 STATISTICAL REPORT
2011 firm cAPAcity mArkEt ShArE 1,822.5 mW
PVDC
LAESA
METALDOM
MONTERIO
CEPP
5%
2.2%
3.5%
1.8%
3.6%
HIDRO
HAINA
CDEEE
GPLV
SEABOARD
AES Dominicana
19.6%
11.2%
7.3%
10.4%
4.5%
30.9%
mAximUm DEmAnDThe system’s maximum demand is the highest power consumed by distribution companies. Generally, this happens during system peak hours. Maximum demand is data used in capacity’s recalculation since a preliminary estimated maximum demand is used prior to computing these figures. The system remunerates only the maximum capacity effectively recorded as demanded during the year. The following table shows 2011’s monthly power production and power consumptions during system peak hours.
2011 monthly PEAk DEmAnD [mW]
month Jan feb mar Apr may Jun Jul Aug Sep oct nov Dec
Day / HourD18 H19
D15 H20
D22 H20
D25 H20
D11 H20
D26 H20
D20 H20
D11 H21
D7 H24
D24 H19
D8 H22
D31 H20
gEnErAtiongroSS gEnErAtion 1,739 1,737 1,829 1,740 1,761 1,879 1,847 1,881 1,860 1,865 1,820 1,850 NET GENERATION sub-transmission voltage
1,685 1,681 1,770 1,679 1,701 1,818 1,791 1,827 1,799 1,818 1,760 1,791
NET GENERATION transmission high-voltage
1,680 1,676 1,766 1,673 1,697 1,813 1,786 1,822 1,794 1,813 1,756 1,785
DEmAnDEmpresa Distribuidora del Este
455 474 500 491 494 501 520 527 490 497 478 513
EdeNorte Dominicana 495 479 568 470 481 536 504 524 504 520 494 545 EdeSur Dominicana 564 552 586 494 504 601 520 542 531 550 521 574 NRU 145 130 88 128 137 102 139 140 126 126 136 47 Other 6 9 4 3 7 6 9 8 8 9 9 3
totAl DEmAnD 1,666 1,644 1,746 1,587 1,623 1,746 1,692 1,741 1,658 1,703 1,638 1,683
Loss [MW] 14 31 21 86 74 67 94 81 136 110 119 102 Loss [%] 0.82% 1.85% 1.17% 5.16% 4.38% 3.69% 5.24% 4.45% 7.57% 6.08% 6.76% 5.73%
In 2011, the maximum demand occurred in August 11th at 21:00 hours where there was a total gross amount of 1,881 MW injections registered. The total withdrawals during that same hour added up to 1,741 MW, from which 91.49% were withdrawn by distributers, 8.04% by Non-Regulated Users, and 0.47% consumed by generators.
EnErgy SUPPly By fUEl tyPEIn 2011, 35.7% of the supplied energy was produced with Fuel Oil 6, holding the most participation in the fuel market; natural gas came in second with 27.7%, followed by coal coming in third with 14.9%.
2011 EnErgy SUPPly By fUEl tyPE
FUEL OIL 6
FUEL OIL 2
COAL
35.7%
9.4%
14.9%
NATURAL GAS
EOLICS
HYDRAULICS
27.7%
0.1%
12.1%
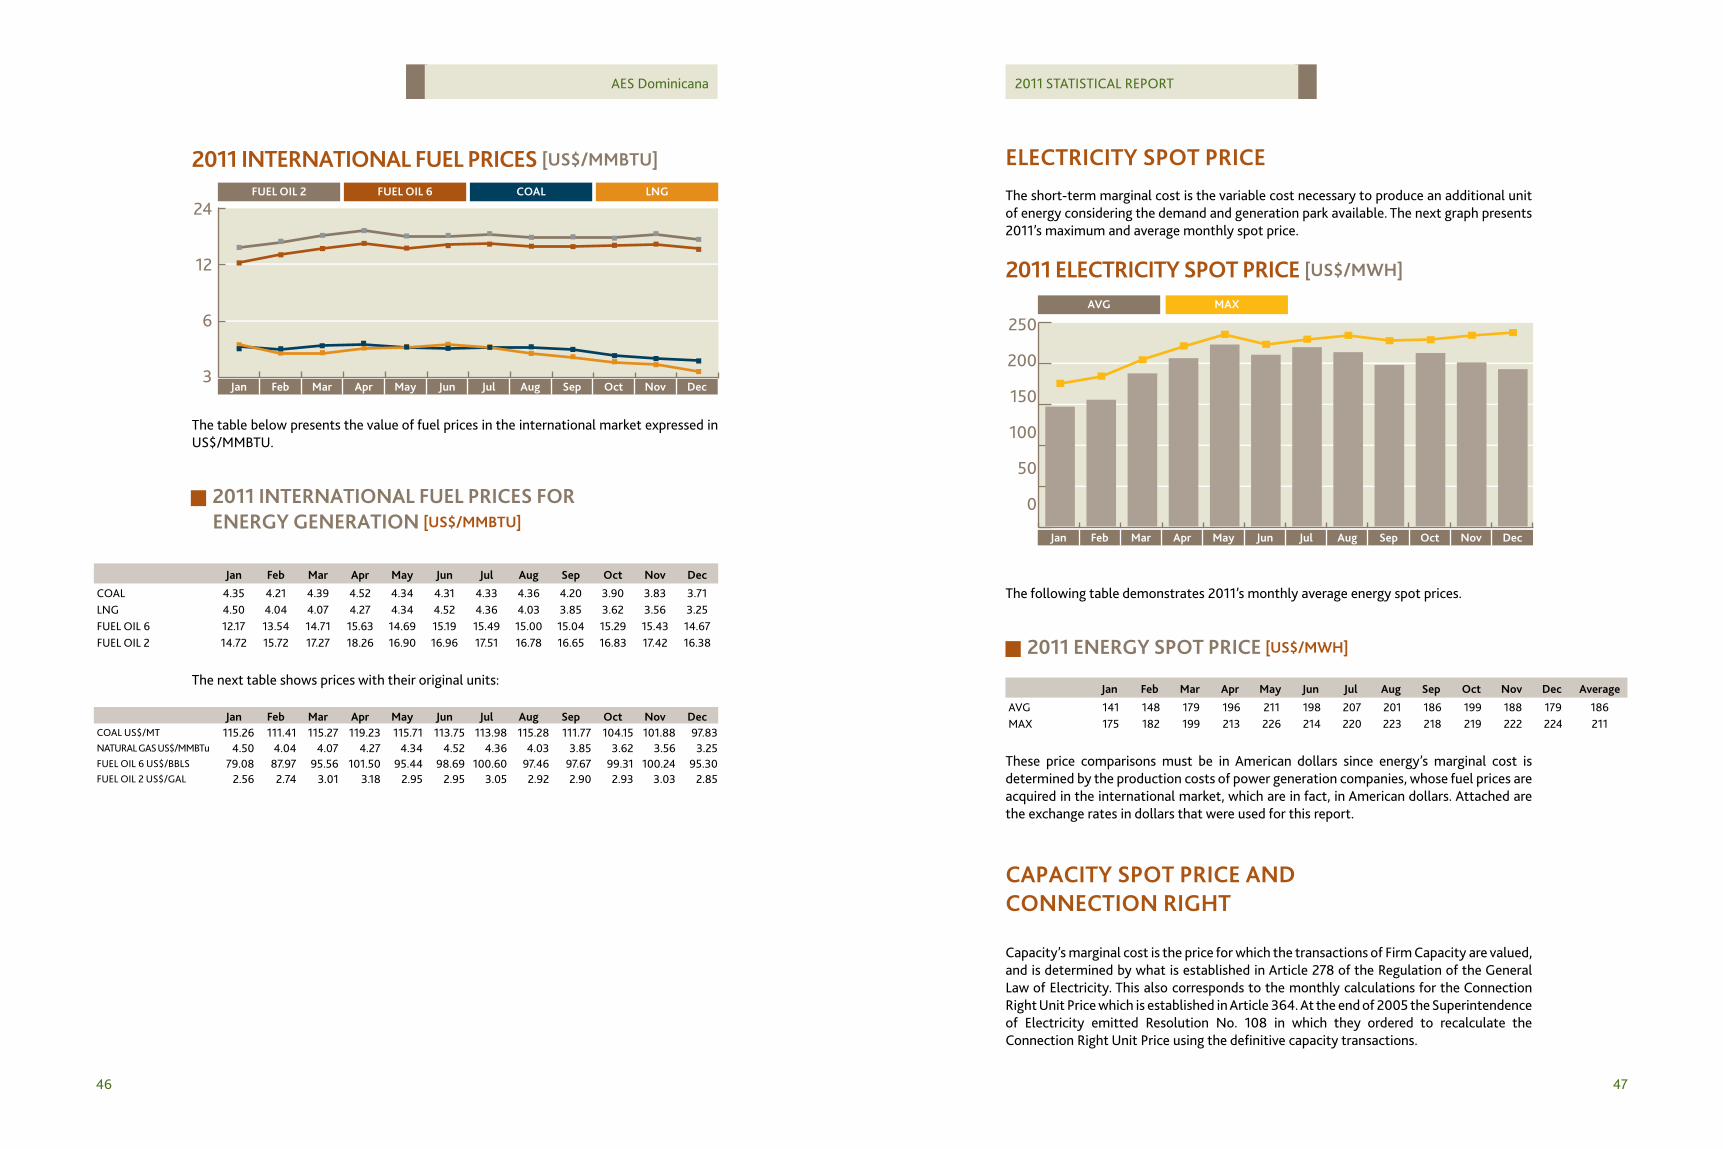
intErnAtionAl fUEl PricES
The next graph shows the average monthly price of each fuel type in US$/MMBtu. The prices for FO 6 and FO 2 were referenced by the international publications by Platts at the US Golf Coast Port. The prices of coal were referenced by FOB Bolivar Port, in Colombia with a gross heat value of 11,300 Btu/lb and the natural gas prices were referenced by the monthly average of the front month future price quotations in the NYMEX (Henry Hub).
In 2011, natural gas and coal maintained the most competitive prices of those used in the Interconnected National Electrical System for the generation of thermal energy. Of the fossil fuels used for electrical generation, Fuel Oil 6 and Fuel Oil 2 maintained the highest prices.
46 47
AES Dominicana 2011 STATISTICAL REPORT
24
12
6
3
2011 intErnAtionAl fUEl PricES [US$/mmBtU]
Jan feb mar Apr may Jun Jul Aug Sep oct nov Dec
coAl lngfUEl oil 2 fUEl oil 6
The table below presents the value of fuel prices in the international market expressed in US$/MMBTU.
2011 intErnAtionAl fUEl PricES for EnErgy gEnErAtion [US$/mmBtU]
Jan feb mar Apr may Jun Jul Aug Sep oct nov Dec
COAL 4.35 4.21 4.39 4.52 4.34 4.31 4.33 4.36 4.20 3.90 3.83 3.71LNG 4.50 4.04 4.07 4.27 4.34 4.52 4.36 4.03 3.85 3.62 3.56 3.25FUEL OIL 6 12.17 13.54 14.71 15.63 14.69 15.19 15.49 15.00 15.04 15.29 15.43 14.67FUEL OIL 2 14.72 15.72 17.27 18.26 16.90 16.96 17.51 16.78 16.65 16.83 17.42 16.38
The next table shows prices with their original units:
Jan feb mar Apr may Jun Jul Aug Sep oct nov DecCOAL US$/MT 115.26 111.41 115.27 119.23 115.71 113.75 113.98 115.28 111.77 104.15 101.88 97.83 NATURAL GAS US$/MMBTu 4.50 4.04 4.07 4.27 4.34 4.52 4.36 4.03 3.85 3.62 3.56 3.25 FUEL OIL 6 US$/BBLS 79.08 87.97 95.56 101.50 95.44 98.69 100.60 97.46 97.67 99.31 100.24 95.30 FUEL OIL 2 US$/GAL 2.56 2.74 3.01 3.18 2.95 2.95 3.05 2.92 2.90 2.93 3.03 2.85
ElEctricity SPot PricEThe short-term marginal cost is the variable cost necessary to produce an additional unit of energy considering the demand and generation park available. The next graph presents 2011’s maximum and average monthly spot price.
2011 ElEctricity SPot PricE [US$/mWh]
Jan feb mar Apr may Jun Jul Aug Sep oct nov Dec
mAxAVg
250
200
150
100
50
0
The following table demonstrates 2011’s monthly average energy spot prices.
2011 EnErgy SPot PricE [US$/mWh]
Jan feb mar Apr may Jun Jul Aug Sep oct nov Dec Average
AVG 141 148 179 196 211 198 207 201 186 199 188 179 186MAX 175 182 199 213 226 214 220 223 218 219 222 224 211
These price comparisons must be in American dollars since energy’s marginal cost is determined by the production costs of power generation companies, whose fuel prices are acquired in the international market, which are in fact, in American dollars. Attached are the exchange rates in dollars that were used for this report.
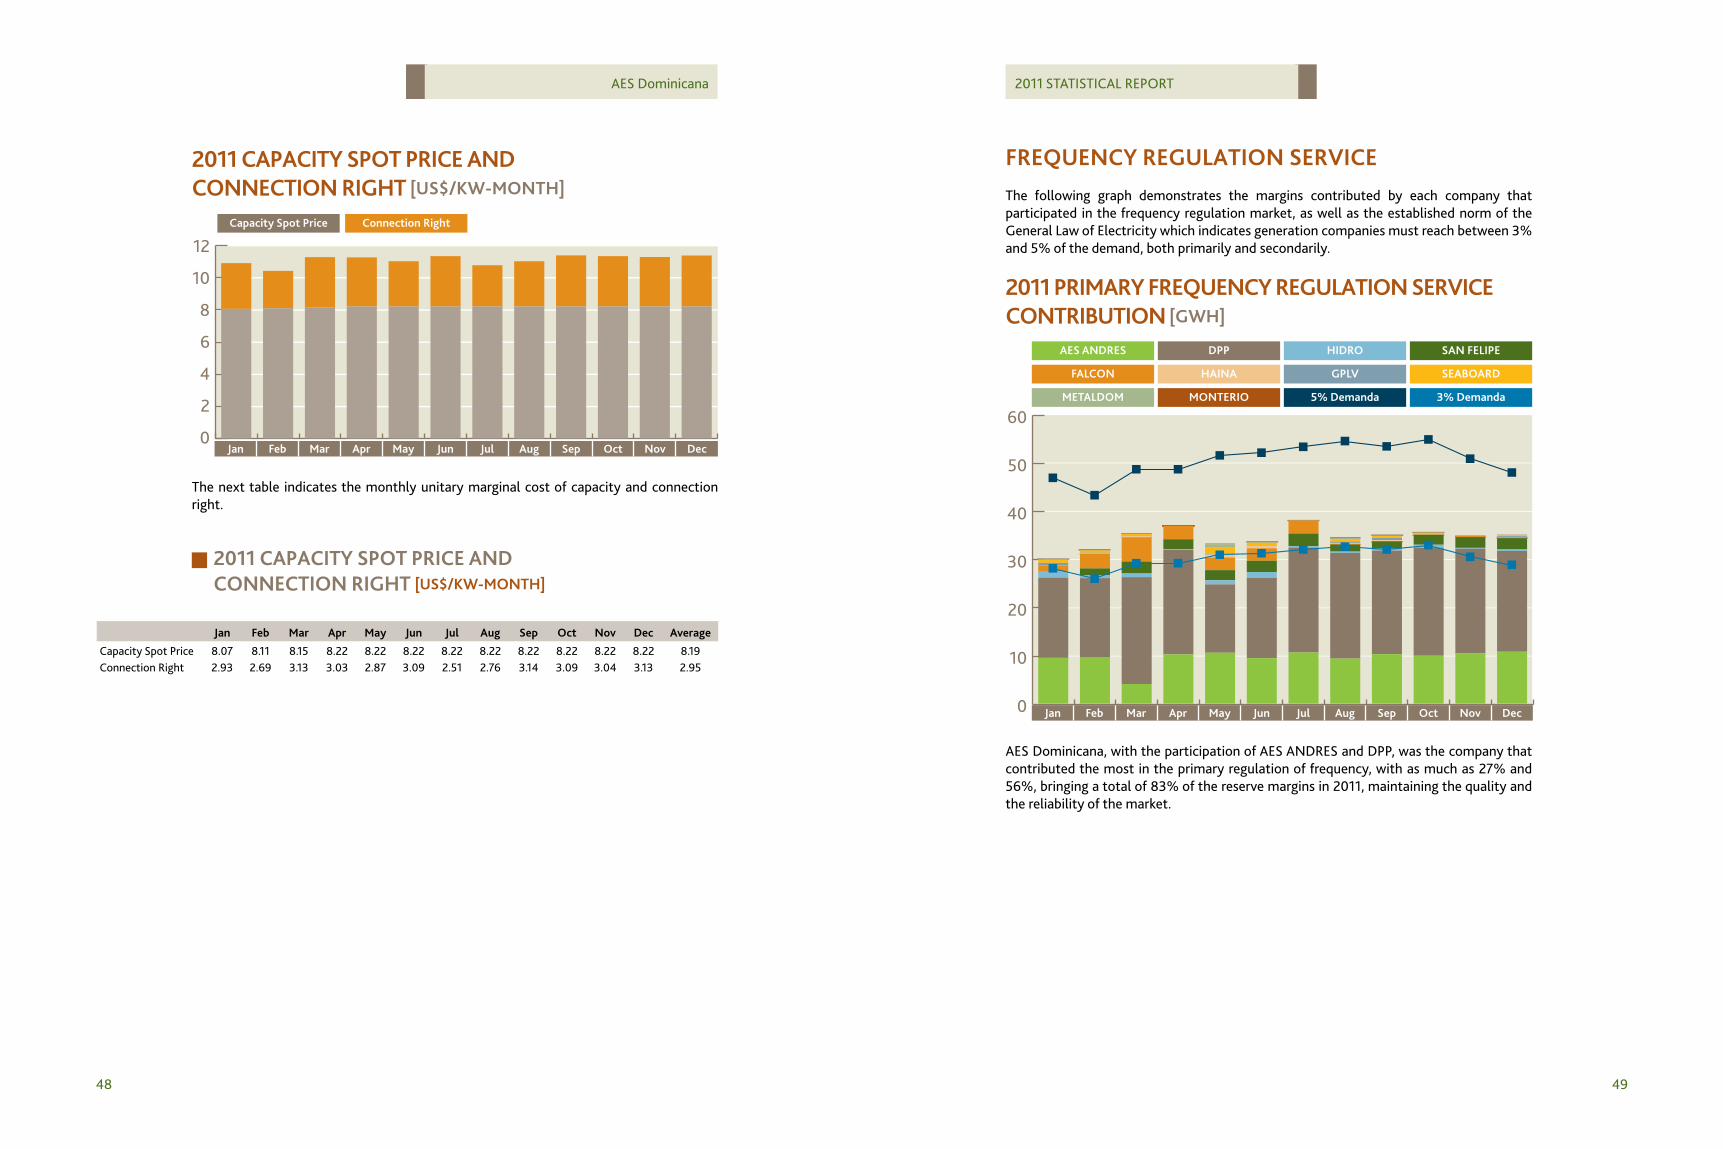
cAPAcity SPot PricE AnD connEction right
Capacity’s marginal cost is the price for which the transactions of Firm Capacity are valued, and is determined by what is established in Article 278 of the Regulation of the General Law of Electricity. This also corresponds to the monthly calculations for the Connection Right Unit Price which is established in Article 364. At the end of 2005 the Superintendence of Electricity emitted Resolution No. 108 in which they ordered to recalculate the Connection Right Unit Price using the definitive capacity transactions.
48 49
AES Dominicana 2011 STATISTICAL REPORT
2011 cAPAcity SPot PricE AnD connEction right [US$/kW-month]
Jan feb mar Apr may Jun Jul Aug Sep oct nov Dec
connection rightcapacity Spot Price
12
10
8
6
4
2
0
The next table indicates the monthly unitary marginal cost of capacity and connection right.
2011 cAPAcity SPot PricE AnD connEction right [US$/kW-month]
Jan feb mar Apr may Jun Jul Aug Sep oct nov Dec Average
Capacity Spot Price 8.07 8.11 8.15 8.22 8.22 8.22 8.22 8.22 8.22 8.22 8.22 8.22 8.19Connection Right 2.93 2.69 3.13 3.03 2.87 3.09 2.51 2.76 3.14 3.09 3.04 3.13 2.95
frEqUEncy rEgUlAtion SErVicEThe following graph demonstrates the margins contributed by each company that participated in the frequency regulation market, as well as the established norm of the General Law of Electricity which indicates generation companies must reach between 3% and 5% of the demand, both primarily and secondarily.
60
50
40
30
20
10
0 Jan feb mar Apr may Jun Jul Aug Sep oct nov Dec
2011 PrimAry frEqUEncy rEgUlAtion SErVicEcontriBUtion [gWh]
5% Demanda 3% DemandamEtAlDom montErio
gPlV SEABoArDfAlcon hAinA
hiDro SAn fEliPEAES AnDrES DPP
AES Dominicana, with the participation of AES ANDRES and DPP, was the company that contributed the most in the primary regulation of frequency, with as much as 27% and 56%, bringing a total of 83% of the reserve margins in 2011, maintaining the quality and the reliability of the market.
50 51
AES Dominicana 2011 STATISTICAL REPORT
60
50
40
30
20
10
0 Jan feb mar Apr may Jun Jul Aug Sep oct nov Dec
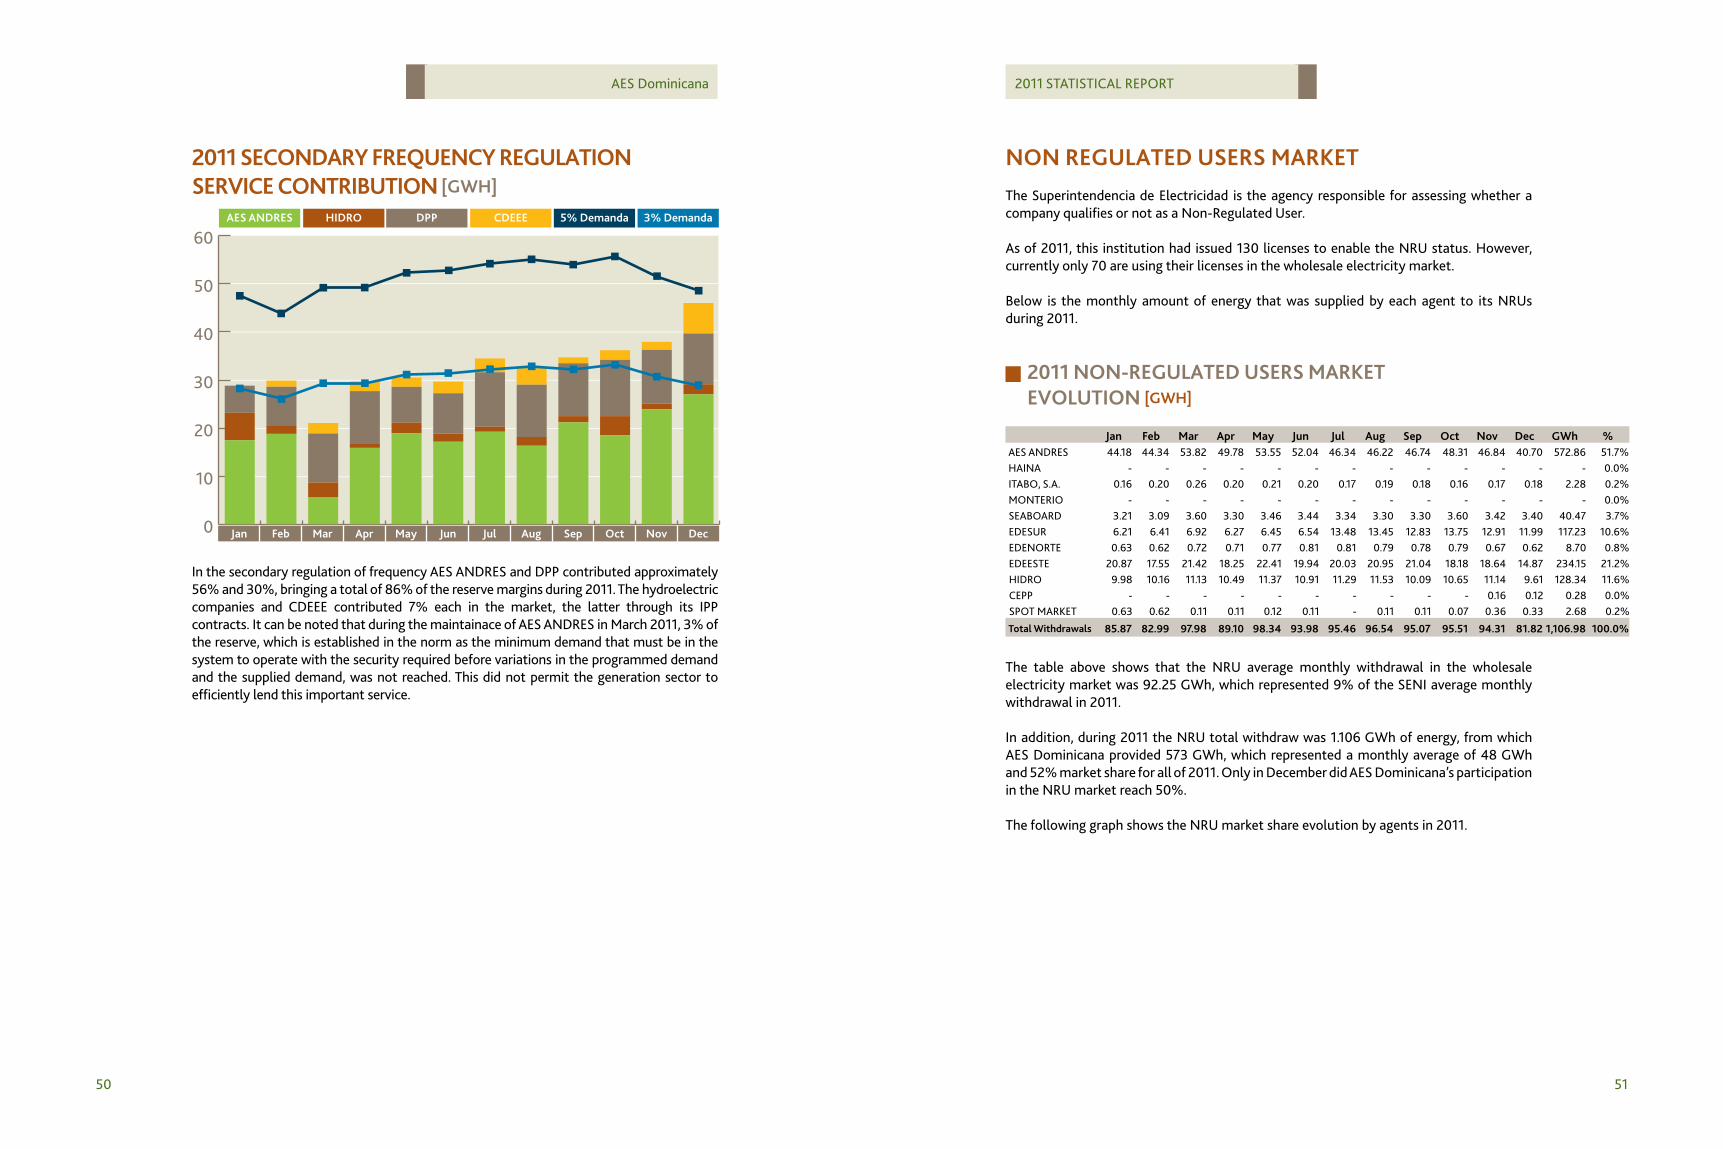
2011 SEconDAry frEqUEncy rEgUlAtion SErVicE contriBUtion [gWh]
5% Demanda 3% DemandahiDro cDEEEAES AnDrES DPP
In the secondary regulation of frequency AES ANDRES and DPP contributed approximately 56% and 30%, bringing a total of 86% of the reserve margins during 2011. The hydroelectric companies and CDEEE contributed 7% each in the market, the latter through its IPP contracts. It can be noted that during the maintainace of AES ANDRES in March 2011, 3% of the reserve, which is established in the norm as the minimum demand that must be in the system to operate with the security required before variations in the programmed demand and the supplied demand, was not reached. This did not permit the generation sector to efficiently lend this important service.
non rEgUlAtED USErS mArkEtThe Superintendencia de Electricidad is the agency responsible for assessing whether a company qualifies or not as a Non-Regulated User.
As of 2011, this institution had issued 130 licenses to enable the NRU status. However, currently only 70 are using their licenses in the wholesale electricity market. Below is the monthly amount of energy that was supplied by each agent to its NRUs during 2011.
2011 non-rEgUlAtED USErS mArkEt EVolUtion [gWh]
Jan feb mar Apr may Jun Jul Aug Sep oct nov Dec gWh %AES ANDRES 44.18 44.34 53.82 49.78 53.55 52.04 46.34 46.22 46.74 48.31 46.84 40.70 572.86 51.7%HAINA - - - - - - - - - - - - - 0.0%ITABO, S.A. 0.16 0.20 0.26 0.20 0.21 0.20 0.17 0.19 0.18 0.16 0.17 0.18 2.28 0.2%MONTERIO - - - - - - - - - - - - - 0.0%SEABOARD 3.21 3.09 3.60 3.30 3.46 3.44 3.34 3.30 3.30 3.60 3.42 3.40 40.47 3.7%EDESUR 6.21 6.41 6.92 6.27 6.45 6.54 13.48 13.45 12.83 13.75 12.91 11.99 117.23 10.6%EDENORTE 0.63 0.62 0.72 0.71 0.77 0.81 0.81 0.79 0.78 0.79 0.67 0.62 8.70 0.8%EDEESTE 20.87 17.55 21.42 18.25 22.41 19.94 20.03 20.95 21.04 18.18 18.64 14.87 234.15 21.2%HIDRO 9.98 10.16 11.13 10.49 11.37 10.91 11.29 11.53 10.09 10.65 11.14 9.61 128.34 11.6%CEPP - - - - - - - - - - 0.16 0.12 0.28 0.0%SPOT MARKET 0.63 0.62 0.11 0.11 0.12 0.11 - 0.11 0.11 0.07 0.36 0.33 2.68 0.2%
total Withdrawals 85.87 82.99 97.98 89.10 98.34 93.98 95.46 96.54 95.07 95.51 94.31 81.82 1,106.98 100.0%
The table above shows that the NRU average monthly withdrawal in the wholesale electricity market was 92.25 GWh, which represented 9% of the SENI average monthly withdrawal in 2011.
In addition, during 2011 the NRU total withdraw was 1.106 GWh of energy, from which AES Dominicana provided 573 GWh, which represented a monthly average of 48 GWh and 52% market share for all of 2011. Only in December did AES Dominicana’s participation in the NRU market reach 50%.
The following graph shows the NRU market share evolution by agents in 2011.
52 53
AES Dominicana 2011 STATISTICAL REPORT
100%
90%
80%
70%
60%
50%
40%
30%
20%
10%
0%Jan feb mar Apr may Jun Jul Aug Sep oct nov Dec
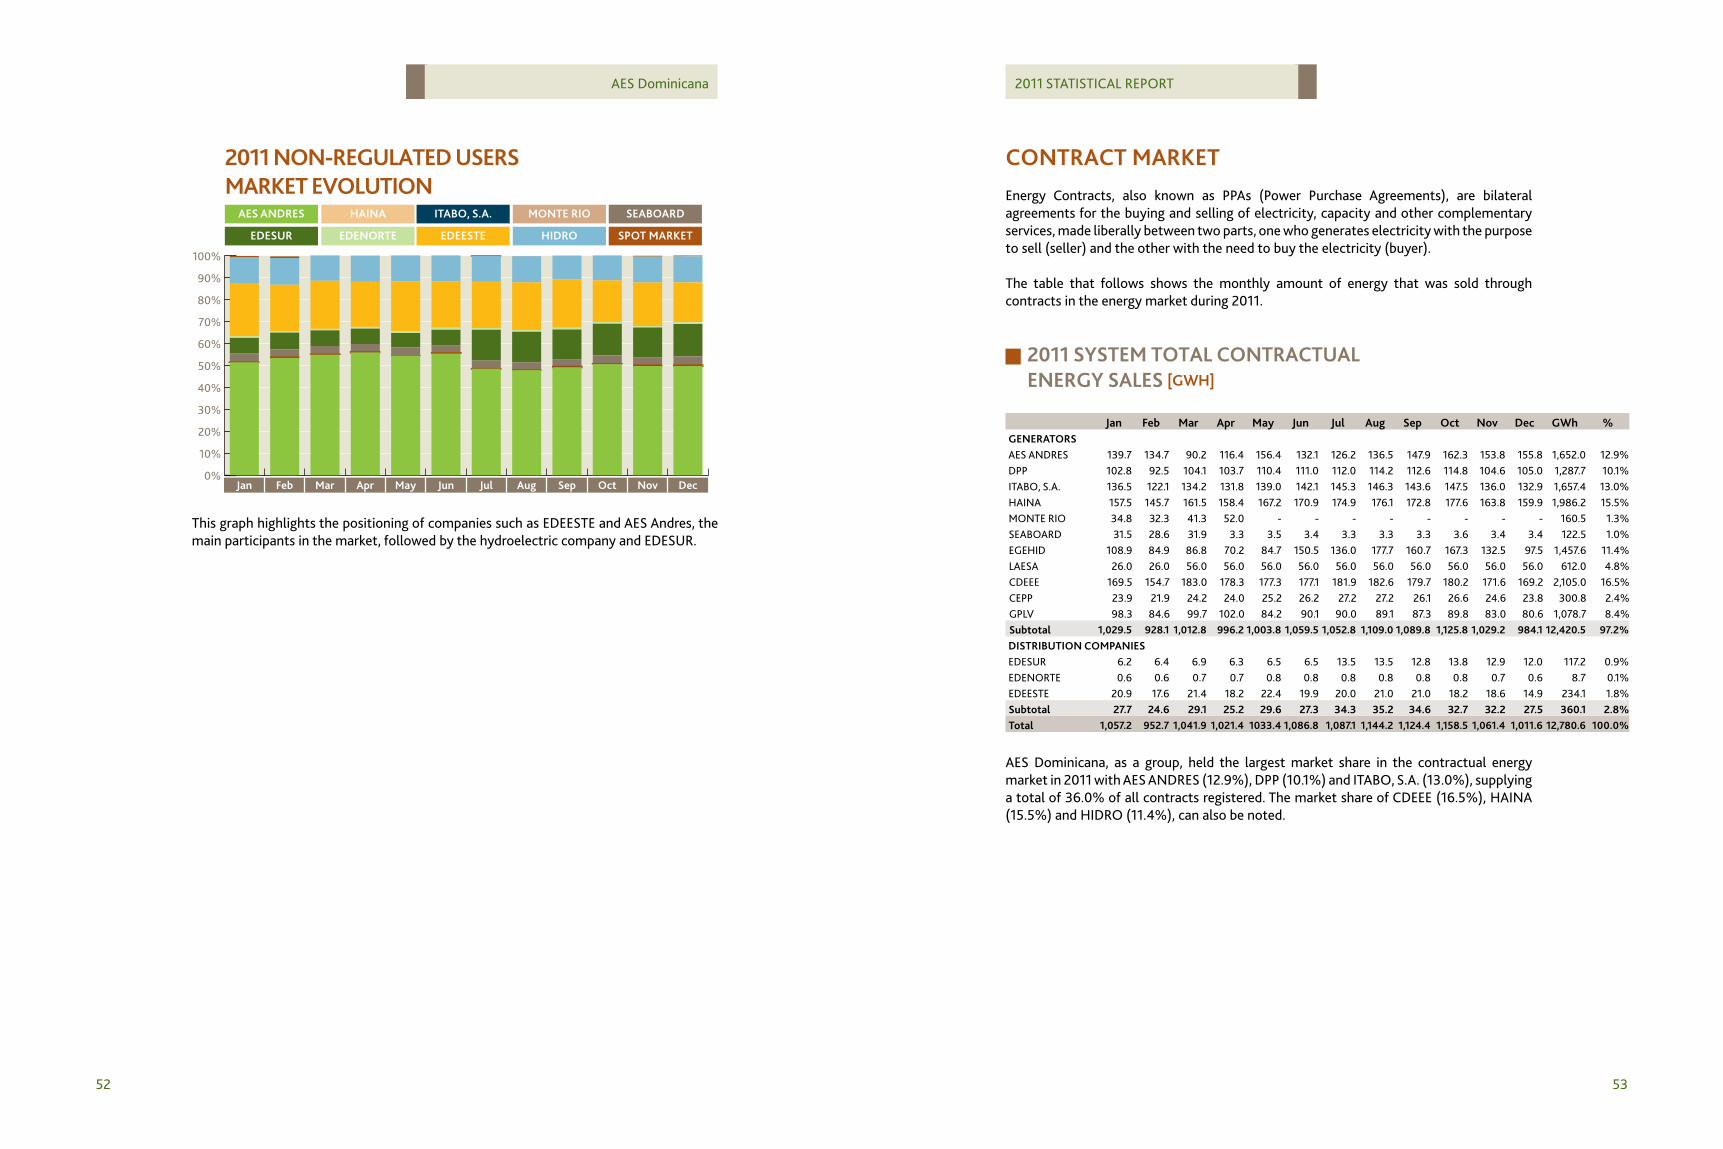
2011 non-rEgUlAtED USErS mArkEt EVolUtion
SPot mArkEtEDEnortE hiDroEDESUr EDEEStE
SEABoArDhAinA montE rioAES AnDrES itABo, S.A.
This graph highlights the positioning of companies such as EDEESTE and AES Andres, the main participants in the market, followed by the hydroelectric company and EDESUR.
contrAct mArkEtEnergy Contracts, also known as PPAs (Power Purchase Agreements), are bilateral agreements for the buying and selling of electricity, capacity and other complementary services, made liberally between two parts, one who generates electricity with the purpose to sell (seller) and the other with the need to buy the electricity (buyer).
The table that follows shows the monthly amount of energy that was sold through contracts in the energy market during 2011.
2011 SyStEm totAl contrActUAl EnErgy SAlES [gWh]
Jan feb mar Apr may Jun Jul Aug Sep oct nov Dec gWh %gEnErAtorSAES ANDRES 139.7 134.7 90.2 116.4 156.4 132.1 126.2 136.5 147.9 162.3 153.8 155.8 1,652.0 12.9%DPP 102.8 92.5 104.1 103.7 110.4 111.0 112.0 114.2 112.6 114.8 104.6 105.0 1,287.7 10.1%ITABO, S.A. 136.5 122.1 134.2 131.8 139.0 142.1 145.3 146.3 143.6 147.5 136.0 132.9 1,657.4 13.0%HAINA 157.5 145.7 161.5 158.4 167.2 170.9 174.9 176.1 172.8 177.6 163.8 159.9 1,986.2 15.5%MONTE RIO 34.8 32.3 41.3 52.0 - - - - - - - - 160.5 1.3%SEABOARD 31.5 28.6 31.9 3.3 3.5 3.4 3.3 3.3 3.3 3.6 3.4 3.4 122.5 1.0%EGEHID 108.9 84.9 86.8 70.2 84.7 150.5 136.0 177.7 160.7 167.3 132.5 97.5 1,457.6 11.4%LAESA 26.0 26.0 56.0 56.0 56.0 56.0 56.0 56.0 56.0 56.0 56.0 56.0 612.0 4.8%CDEEE 169.5 154.7 183.0 178.3 177.3 177.1 181.9 182.6 179.7 180.2 171.6 169.2 2,105.0 16.5%CEPP 23.9 21.9 24.2 24.0 25.2 26.2 27.2 27.2 26.1 26.6 24.6 23.8 300.8 2.4%GPLV 98.3 84.6 99.7 102.0 84.2 90.1 90.0 89.1 87.3 89.8 83.0 80.6 1,078.7 8.4%Subtotal 1,029.5 928.1 1,012.8 996.2 1,003.8 1,059.5 1,052.8 1,109.0 1,089.8 1,125.8 1,029.2 984.1 12,420.5 97.2%DiStriBUtion comPAniESEDESUR 6.2 6.4 6.9 6.3 6.5 6.5 13.5 13.5 12.8 13.8 12.9 12.0 117.2 0.9%EDENORTE 0.6 0.6 0.7 0.7 0.8 0.8 0.8 0.8 0.8 0.8 0.7 0.6 8.7 0.1%EDEESTE 20.9 17.6 21.4 18.2 22.4 19.9 20.0 21.0 21.0 18.2 18.6 14.9 234.1 1.8%Subtotal 27.7 24.6 29.1 25.2 29.6 27.3 34.3 35.2 34.6 32.7 32.2 27.5 360.1 2.8%total 1,057.2 952.7 1,041.9 1,021.4 1033.4 1,086.8 1,087.1 1,144.2 1,124.4 1,158.5 1,061.4 1,011.6 12,780.6 100.0%
AES Dominicana, as a group, held the largest market share in the contractual energy market in 2011 with AES ANDRES (12.9%), DPP (10.1%) and ITABO, S.A. (13.0%), supplying a total of 36.0% of all contracts registered. The market share of CDEEE (16.5%), HAINA (15.5%) and HIDRO (11.4%), can also be noted.
54 55
AES Dominicana 2011 STATISTICAL REPORT
AttAchmEntS
56 57
AES Dominicana 2011 STATISTICAL REPORT
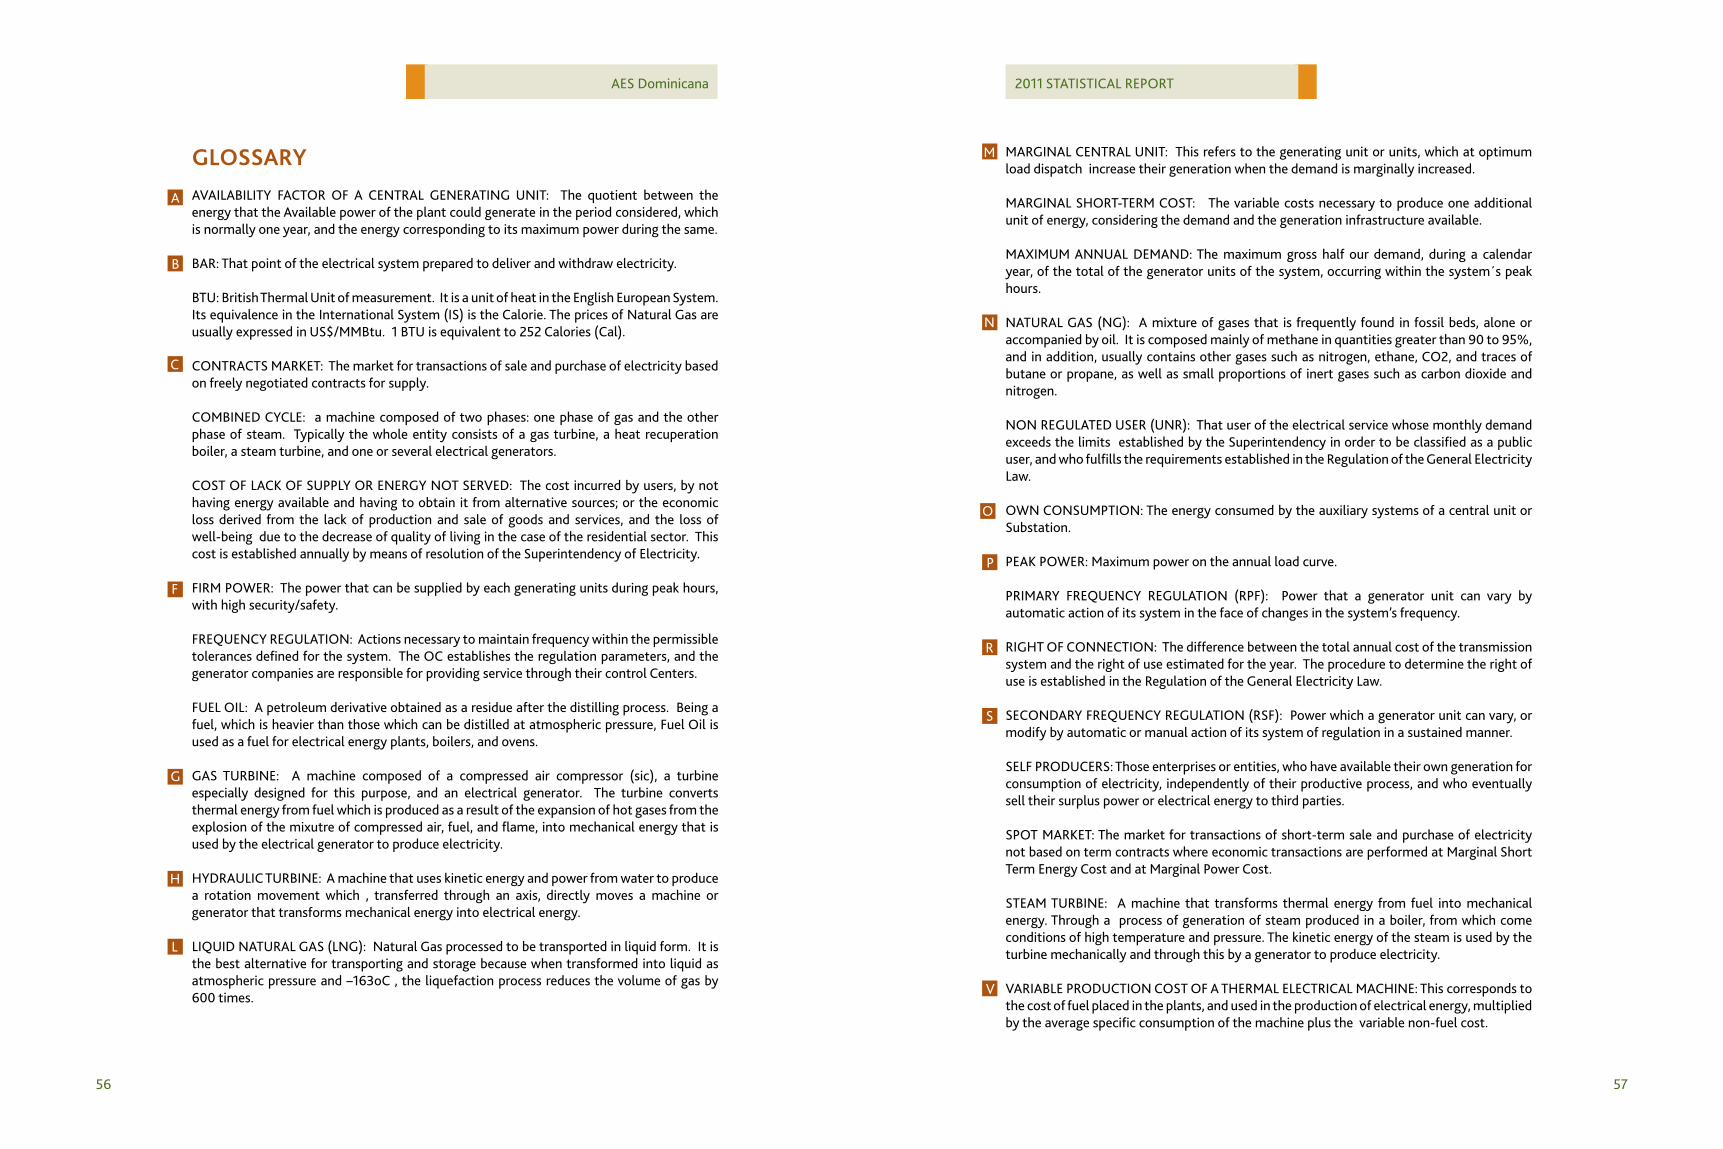
gloSSAryAVAILABILITY FACTOR OF A CENTRAL GENERATING UNIT: The quotient between the energy that the Available power of the plant could generate in the period considered, which is normally one year, and the energy corresponding to its maximum power during the same.
BAR: That point of the electrical system prepared to deliver and withdraw electricity.
BTU: British Thermal Unit of measurement. It is a unit of heat in the English European System. Its equivalence in the International System (IS) is the Calorie. The prices of Natural Gas are usually expressed in US$/MMBtu. 1 BTU is equivalent to 252 Calories (Cal).
CONTRACTS MARKET: The market for transactions of sale and purchase of electricity based on freely negotiated contracts for supply.
COMBINED CYCLE: a machine composed of two phases: one phase of gas and the other phase of steam. Typically the whole entity consists of a gas turbine, a heat recuperation boiler, a steam turbine, and one or several electrical generators.
COST OF LACK OF SUPPLY OR ENERGY NOT SERVED: The cost incurred by users, by not having energy available and having to obtain it from alternative sources; or the economic loss derived from the lack of production and sale of goods and services, and the loss of well-being due to the decrease of quality of living in the case of the residential sector. This cost is established annually by means of resolution of the Superintendency of Electricity.
FIRM POWER: The power that can be supplied by each generating units during peak hours, with high security/safety.
FREQUENCY REGULATION: Actions necessary to maintain frequency within the permissible tolerances defined for the system. The OC establishes the regulation parameters, and the generator companies are responsible for providing service through their control Centers.
FUEL OIL: A petroleum derivative obtained as a residue after the distilling process. Being a fuel, which is heavier than those which can be distilled at atmospheric pressure, Fuel Oil is used as a fuel for electrical energy plants, boilers, and ovens.
GAS TURBINE: A machine composed of a compressed air compressor (sic), a turbine especially designed for this purpose, and an electrical generator. The turbine converts thermal energy from fuel which is produced as a result of the expansion of hot gases from the explosion of the mixutre of compressed air, fuel, and flame, into mechanical energy that is used by the electrical generator to produce electricity.
HYDRAULIC TURBINE: A machine that uses kinetic energy and power from water to produce a rotation movement which , transferred through an axis, directly moves a machine or generator that transforms mechanical energy into electrical energy.
LIQUID NATURAL GAS (LNG): Natural Gas processed to be transported in liquid form. It is the best alternative for transporting and storage because when transformed into liquid as atmospheric pressure and –163oC , the liquefaction process reduces the volume of gas by 600 times.
MARGINAL CENTRAL UNIT: This refers to the generating unit or units, which at optimum load dispatch increase their generation when the demand is marginally increased.
MARGINAL SHORT-TERM COST: The variable costs necessary to produce one additional unit of energy, considering the demand and the generation infrastructure available.
MAXIMUM ANNUAL DEMAND: The maximum gross half our demand, during a calendar year, of the total of the generator units of the system, occurring within the system´s peak hours.
NATURAL GAS (NG): A mixture of gases that is frequently found in fossil beds, alone or accompanied by oil. It is composed mainly of methane in quantities greater than 90 to 95%, and in addition, usually contains other gases such as nitrogen, ethane, CO2, and traces of butane or propane, as well as small proportions of inert gases such as carbon dioxide and nitrogen.
NON REGULATED USER (UNR): That user of the electrical service whose monthly demand exceeds the limits established by the Superintendency in order to be classified as a public user, and who fulfills the requirements established in the Regulation of the General Electricity Law.
OWN CONSUMPTION: The energy consumed by the auxiliary systems of a central unit or Substation.
PEAK POWER: Maximum power on the annual load curve.
PRIMARY FREQUENCY REGULATION (RPF): Power that a generator unit can vary by automatic action of its system in the face of changes in the system’s frequency.
RIGHT OF CONNECTION: The difference between the total annual cost of the transmission system and the right of use estimated for the year. The procedure to determine the right of use is established in the Regulation of the General Electricity Law.
SECONDARY FREQUENCY REGULATION (RSF): Power which a generator unit can vary, or modify by automatic or manual action of its system of regulation in a sustained manner.
SELF PRODUCERS: Those enterprises or entities, who have available their own generation for consumption of electricity, independently of their productive process, and who eventually sell their surplus power or electrical energy to third parties.
SPOT MARKET: The market for transactions of short-term sale and purchase of electricity not based on term contracts where economic transactions are performed at Marginal Short Term Energy Cost and at Marginal Power Cost.
STEAM TURBINE: A machine that transforms thermal energy from fuel into mechanical energy. Through a process of generation of steam produced in a boiler, from which come conditions of high temperature and pressure. The kinetic energy of the steam is used by the turbine mechanically and through this by a generator to produce electricity.
VARIABLE PRODUCTION COST OF A THERMAL ELECTRICAL MACHINE: This corresponds to the cost of fuel placed in the plants, and used in the production of electrical energy, multiplied by the average specific consumption of the machine plus the variable non-fuel cost.
A
B
C
F
G
H
L
M
N
O
P
R
S
V
58 59
AES Dominicana 2011 STATISTICAL REPORT
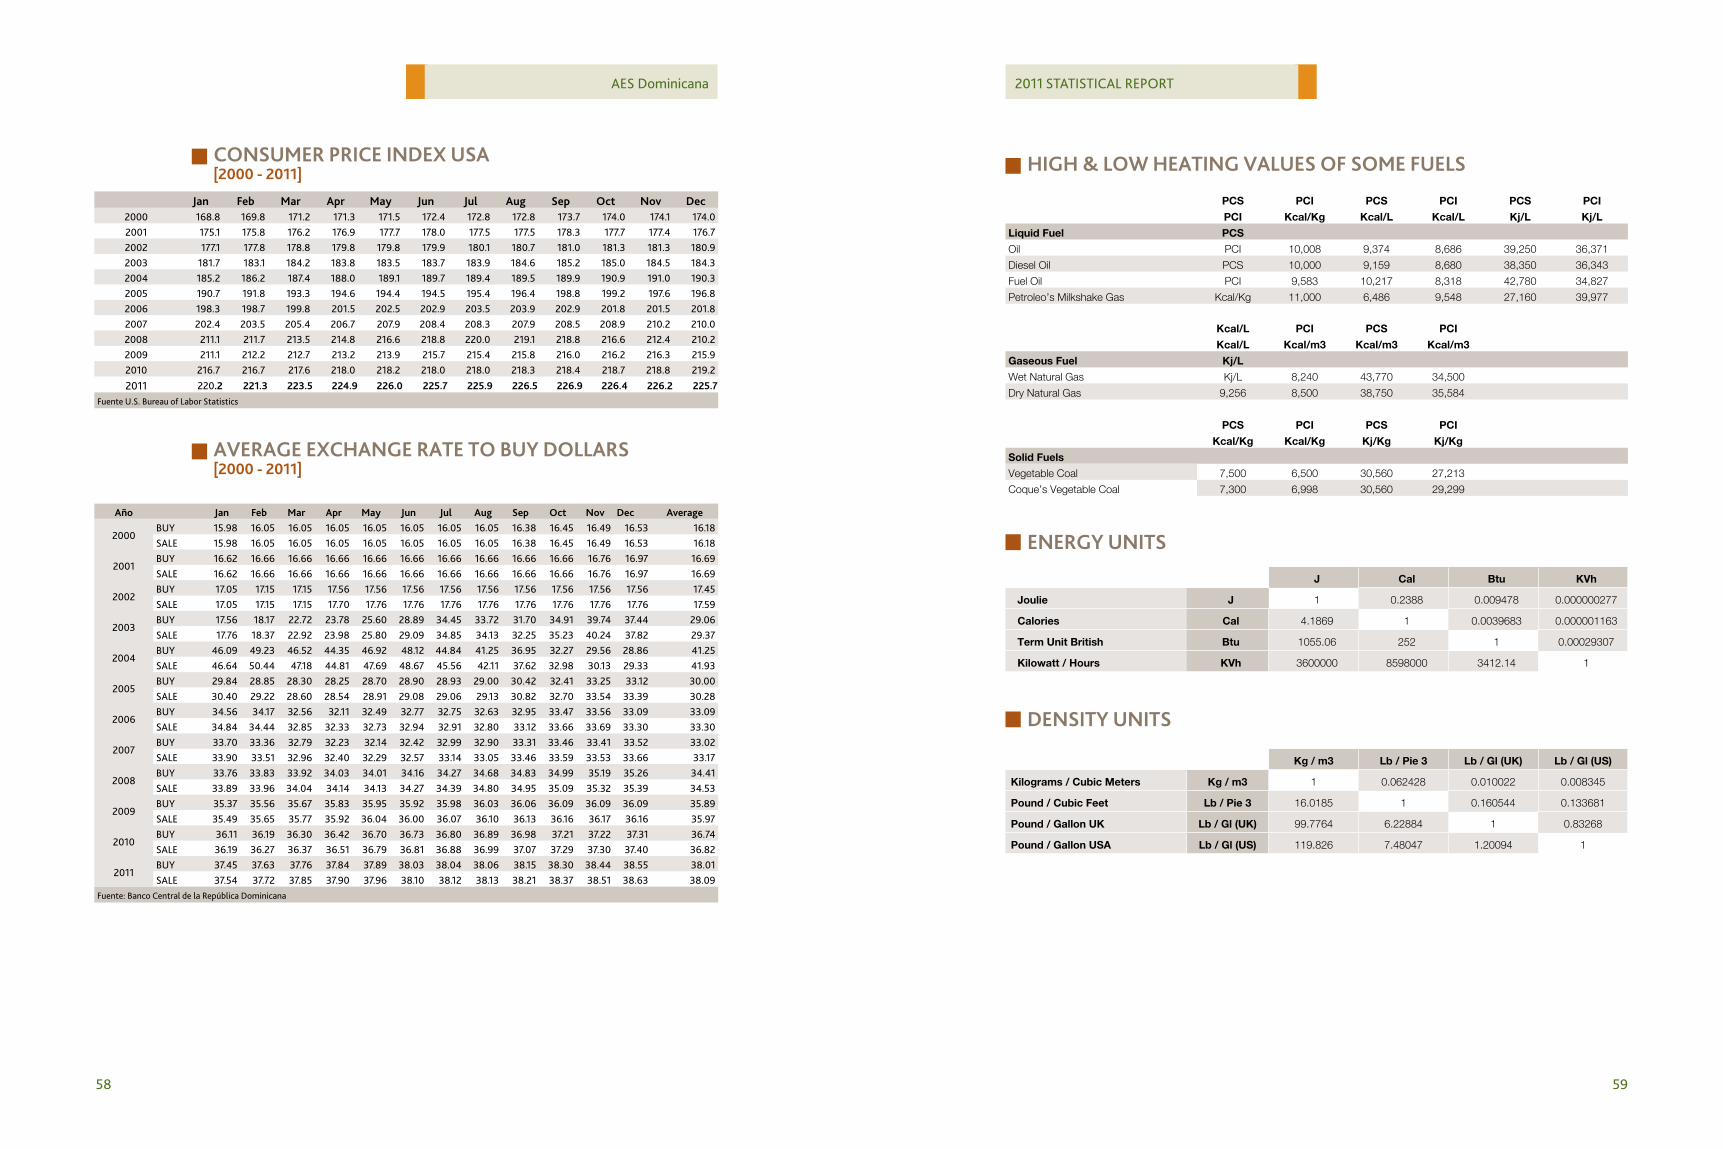
Jan feb mar Apr may Jun Jul Aug Sep oct nov Dec2000 168.8 169.8 171.2 171.3 171.5 172.4 172.8 172.8 173.7 174.0 174.1 174.0 2001 175.1 175.8 176.2 176.9 177.7 178.0 177.5 177.5 178.3 177.7 177.4 176.7 2002 177.1 177.8 178.8 179.8 179.8 179.9 180.1 180.7 181.0 181.3 181.3 180.9 2003 181.7 183.1 184.2 183.8 183.5 183.7 183.9 184.6 185.2 185.0 184.5 184.3 2004 185.2 186.2 187.4 188.0 189.1 189.7 189.4 189.5 189.9 190.9 191.0 190.3 2005 190.7 191.8 193.3 194.6 194.4 194.5 195.4 196.4 198.8 199.2 197.6 196.8 2006 198.3 198.7 199.8 201.5 202.5 202.9 203.5 203.9 202.9 201.8 201.5 201.8 2007 202.4 203.5 205.4 206.7 207.9 208.4 208.3 207.9 208.5 208.9 210.2 210.0 2008 211.1 211.7 213.5 214.8 216.6 218.8 220.0 219.1 218.8 216.6 212.4 210.2 2009 211.1 212.2 212.7 213.2 213.9 215.7 215.4 215.8 216.0 216.2 216.3 215.9 2010 216.7 216.7 217.6 218.0 218.2 218.0 218.0 218.3 218.4 218.7 218.8 219.2
2011 220.2 221.3 223.5 224.9 226.0 225.7 225.9 226.5 226.9 226.4 226.2 225.7Fuente U.S. Bureau of Labor Statistics
Año Jan feb mar Apr may Jun Jul Aug Sep oct nov Dec Average
2000BUY 15.98 16.05 16.05 16.05 16.05 16.05 16.05 16.05 16.38 16.45 16.49 16.53 16.18 SALE 15.98 16.05 16.05 16.05 16.05 16.05 16.05 16.05 16.38 16.45 16.49 16.53 16.18
2001BUY 16.62 16.66 16.66 16.66 16.66 16.66 16.66 16.66 16.66 16.66 16.76 16.97 16.69 SALE 16.62 16.66 16.66 16.66 16.66 16.66 16.66 16.66 16.66 16.66 16.76 16.97 16.69
2002BUY 17.05 17.15 17.15 17.56 17.56 17.56 17.56 17.56 17.56 17.56 17.56 17.56 17.45 SALE 17.05 17.15 17.15 17.70 17.76 17.76 17.76 17.76 17.76 17.76 17.76 17.76 17.59
2003BUY 17.56 18.17 22.72 23.78 25.60 28.89 34.45 33.72 31.70 34.91 39.74 37.44 29.06 SALE 17.76 18.37 22.92 23.98 25.80 29.09 34.85 34.13 32.25 35.23 40.24 37.82 29.37
2004BUY 46.09 49.23 46.52 44.35 46.92 48.12 44.84 41.25 36.95 32.27 29.56 28.86 41.25 SALE 46.64 50.44 47.18 44.81 47.69 48.67 45.56 42.11 37.62 32.98 30.13 29.33 41.93
2005BUY 29.84 28.85 28.30 28.25 28.70 28.90 28.93 29.00 30.42 32.41 33.25 33.12 30.00 SALE 30.40 29.22 28.60 28.54 28.91 29.08 29.06 29.13 30.82 32.70 33.54 33.39 30.28
2006BUY 34.56 34.17 32.56 32.11 32.49 32.77 32.75 32.63 32.95 33.47 33.56 33.09 33.09 SALE 34.84 34.44 32.85 32.33 32.73 32.94 32.91 32.80 33.12 33.66 33.69 33.30 33.30
2007BUY 33.70 33.36 32.79 32.23 32.14 32.42 32.99 32.90 33.31 33.46 33.41 33.52 33.02 SALE 33.90 33.51 32.96 32.40 32.29 32.57 33.14 33.05 33.46 33.59 33.53 33.66 33.17
2008BUY 33.76 33.83 33.92 34.03 34.01 34.16 34.27 34.68 34.83 34.99 35.19 35.26 34.41 SALE 33.89 33.96 34.04 34.14 34.13 34.27 34.39 34.80 34.95 35.09 35.32 35.39 34.53
2009BUY 35.37 35.56 35.67 35.83 35.95 35.92 35.98 36.03 36.06 36.09 36.09 36.09 35.89 SALE 35.49 35.65 35.77 35.92 36.04 36.00 36.07 36.10 36.13 36.16 36.17 36.16 35.97
2010BUY 36.11 36.19 36.30 36.42 36.70 36.73 36.80 36.89 36.98 37.21 37.22 37.31 36.74 SALE 36.19 36.27 36.37 36.51 36.79 36.81 36.88 36.99 37.07 37.29 37.30 37.40 36.82
2011BUY 37.45 37.63 37.76 37.84 37.89 38.03 38.04 38.06 38.15 38.30 38.44 38.55 38.01 SALE 37.54 37.72 37.85 37.90 37.96 38.10 38.12 38.13 38.21 38.37 38.51 38.63 38.09
Fuente: Banco Central de la República Dominicana
conSUmEr PricE inDEx USA [2000 - 2011]
AVErAgE ExchAngE rAtE to BUy DollArS[2000 - 2011]
J Cal Btu KVh
Joulie J 1 0.2388 0.009478 0.000000277
Calories Cal 4.1869 1 0.0039683 0.000001163
Term Unit British Btu 1055.06 252 1 0.00029307
Kilowatt / Hours KVh 3600000 8598000 3412.14 1
Kg / m3 Lb / Pie 3 Lb / Gl (UK) Lb / Gl (US)
Kilograms / Cubic Meters Kg / m3 1 0.062428 0.010022 0.008345
Pound / Cubic Feet Lb / Pie 3 16.0185 1 0.160544 0.133681
Pound / Gallon UK Lb / Gl (UK) 99.7764 6.22884 1 0.83268
Pound / Gallon USA Lb / Gl (US) 119.826 7.48047 1.20094 1
PCS PCI PCS PCI PCS PCI
PCI Kcal/Kg Kcal/L Kcal/L Kj/L Kj/L
Liquid Fuel PCS
Oil PCI 10,008 9,374 8,686 39,250 36,371
Diesel Oil PCS 10,000 9,159 8,680 38,350 36,343
Fuel Oil PCI 9,583 10,217 8,318 42,780 34,827
Petroleo’s Milkshake Gas Kcal/Kg 11,000 6,486 9,548 27,160 39,977
Kcal/L PCI PCS PCI
Kcal/L Kcal/m3 Kcal/m3 Kcal/m3
Gaseous Fuel Kj/L
Wet Natural Gas Kj/L 8,240 43,770 34,500
Dry Natural Gas 9,256 8,500 38,750 35,584
PCS PCI PCS PCI
Kcal/Kg Kcal/Kg Kj/Kg Kj/Kg
Solid Fuels
Vegetable Coal 7,500 6,500 30,560 27,213
Coque’s Vegetable Coal 7,300 6,998 30,560 29,299
high & loW hEAting VAlUES of SomE fUElS
EnErgy UnitS
DEnSity UnitS
60
AES Dominicana
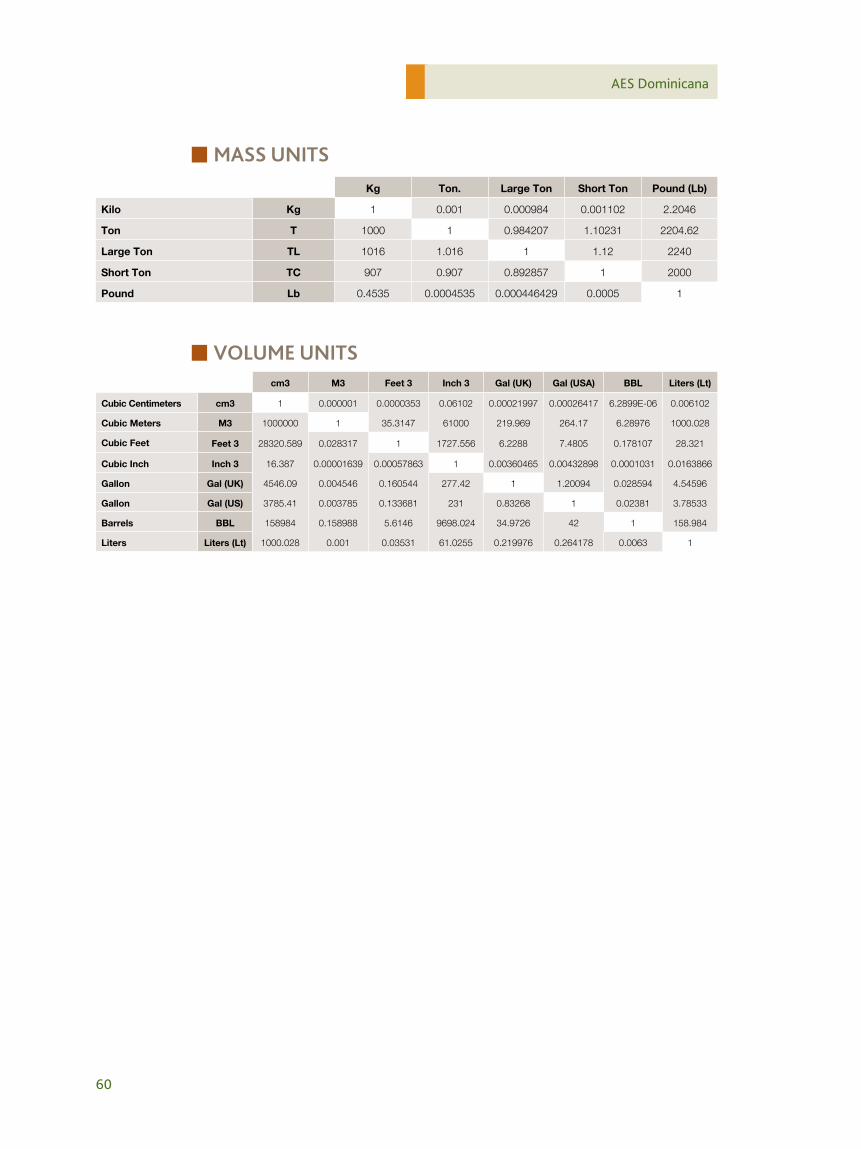
mASS UnitS
VolUmE UnitS
Kg Ton. Large Ton Short Ton Pound (Lb)
Kilo Kg 1 0.001 0.000984 0.001102 2.2046
Ton T 1000 1 0.984207 1.10231 2204.62
Large Ton TL 1016 1.016 1 1.12 2240
Short Ton TC 907 0.907 0.892857 1 2000
Pound Lb 0.4535 0.0004535 0.000446429 0.0005 1
cm3 M3 Feet 3 Inch 3 Gal (UK) Gal (USA) BBL Liters (Lt)
Cubic Centimeters cm3 1 0.000001 0.0000353 0.06102 0.00021997 0.00026417 6.2899E-06 0.006102
Cubic Meters M3 1000000 1 35.3147 61000 219.969 264.17 6.28976 1000.028
Cubic Feet Feet 3 28320.589 0.028317 1 1727.556 6.2288 7.4805 0.178107 28.321
Cubic Inch Inch 3 16.387 0.00001639 0.00057863 1 0.00360465 0.00432898 0.0001031 0.0163866
Gallon Gal (UK) 4546.09 0.004546 0.160544 277.42 1 1.20094 0.028594 4.54596
Gallon Gal (US) 3785.41 0.003785 0.133681 231 0.83268 1 0.02381 3.78533
Barrels BBL 158984 0.158988 5.6146 9698.024 34.9726 42 1 158.984
Liters Liters (Lt) 1000.028 0.001 0.03531 61.0255 0.219976 0.264178 0.0063 1