Embed Size (px)
Citation preview
The Social Insurance Organiz
Statistical Report 2011 Quarter 4
Civil & Private Sector
Social Insurance Organization
Kingdom of Bahrain
Statistical Report 2011 - Quarter 4
Page 2 of 42
The Social Insurance Organization
Page
No. Table of Contents
3Summary Table
4Chapter 1 : Civil Sector
5Section 1: Contributors Statistics
11Section 2: Pensioners Statistics
317Section : Beneficiaries Statistics
22Chapter 2 : Private Sector
23Section 1: Contributors Statistics
30Section 2: Pensioners Statistics
336Section : Beneficiaries Statistics
41 Terms of reference
Statistical Report 2011 - Quarter 4
Page 3 of 42
The Social Insurance Organization
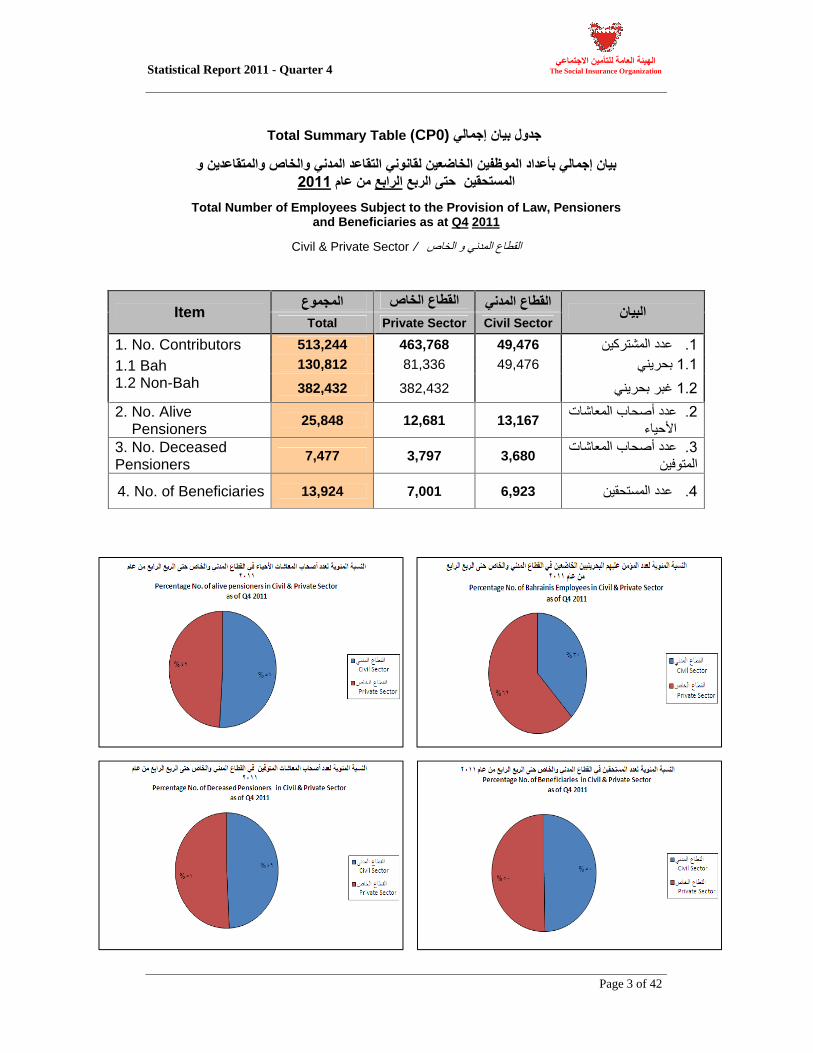
CP0)Table Total Summary
Total Number of Employees Subject to the Provision of Law, Pensioners
and Beneficiaries as at Q4
2011
Civil & Private Sector
Civil Sector Private Sector Total Item
49,476 463,768 513,244 1. No. Contributors
49,476 81,336 130,812 1.1 Bah
382,432 382,432 1.2 Non-Bah
13,167 12,681 25,848 2. No. Alive Pensioners
3,680 3,797 7,477 3. No. Deceased Pensioners
6,923 7,001 13,924 4. No. of Beneficiaries
Statistical Report 2011 - Quarter 4
Page 4 of 42
The Social Insurance Organization
Chapter 1 : Civil Sector
Statistical Report 2011 - Quarter 4
Page 5 of 42
The Social Insurance Organization
Contents
Table No Title
Page No
C1
Contributors Data
5
C1.1
No of Employees by sex and Nationality 6
C1.2
Total & Average Monthly Salary of Employees by sex and Nationality 7
C1.3
No of Employees Classified by Age Group 8
C1.4
Average Monthly Salary of Employees Classified by Age Group 9
C1.5
No of Employees Classified By Monthly Salary 10
Section C1 Contributors' Statistics in the Civil Sector
Statistical Report 2011 - Quarter 4
Page 6 of 42
The Social Insurance Organization
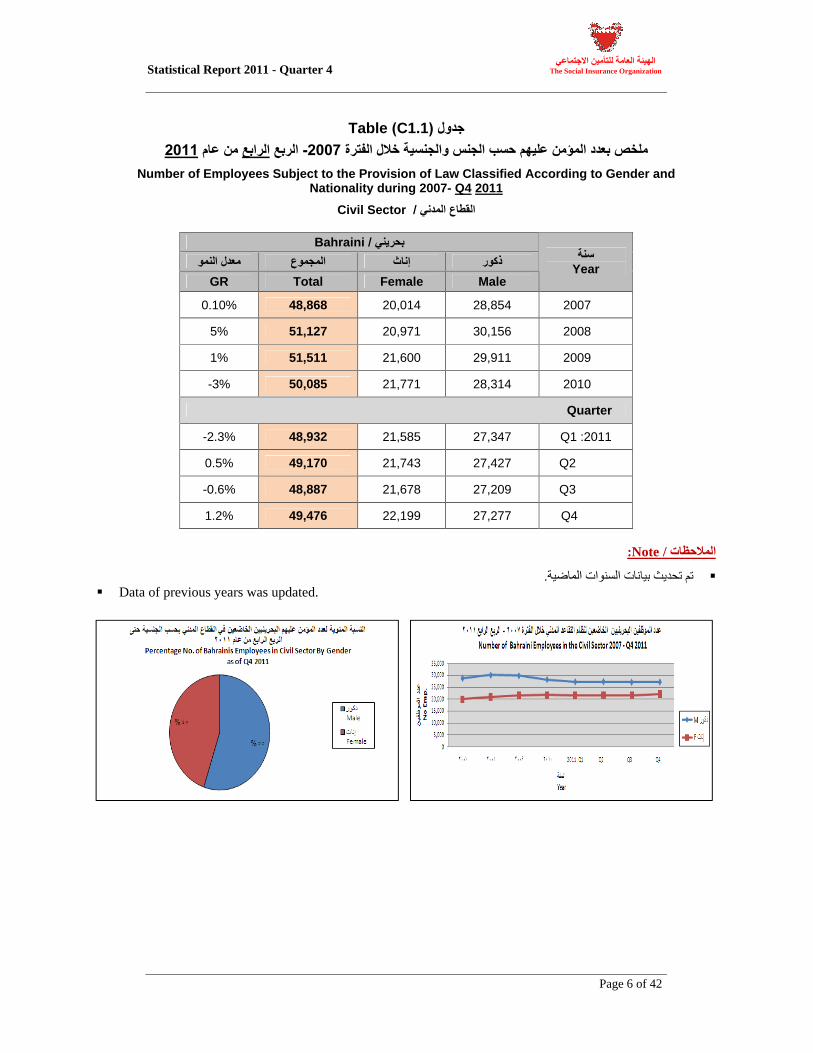
C1.1Table
Number of Employees Subject to the Provision of Law Classified According to Gender and
Nationality during 2007- Q4
2011
SectorCivil
Bahraini
Year Male Female Total GR
2007 28,854 20,014 48,868 0.10%
2008 30,156 20,971 51,127 5%
2009 29,911 21,600 51,511 1%
2010 28,314 21,771 50,085 -3%
Quarter
2011Q1 27,347 21,585 48,932 -2.3%
Q2 27,427 21,743 49,170 0.5%
Q3 27,209 21,678 48,887 -0.6%
Q4 27,277 22,199 49,476 1.2%
Note
Data of previous years was updated.
Statistical Report 2011 - Quarter 4
Page 7 of 42
The Social Insurance Organization
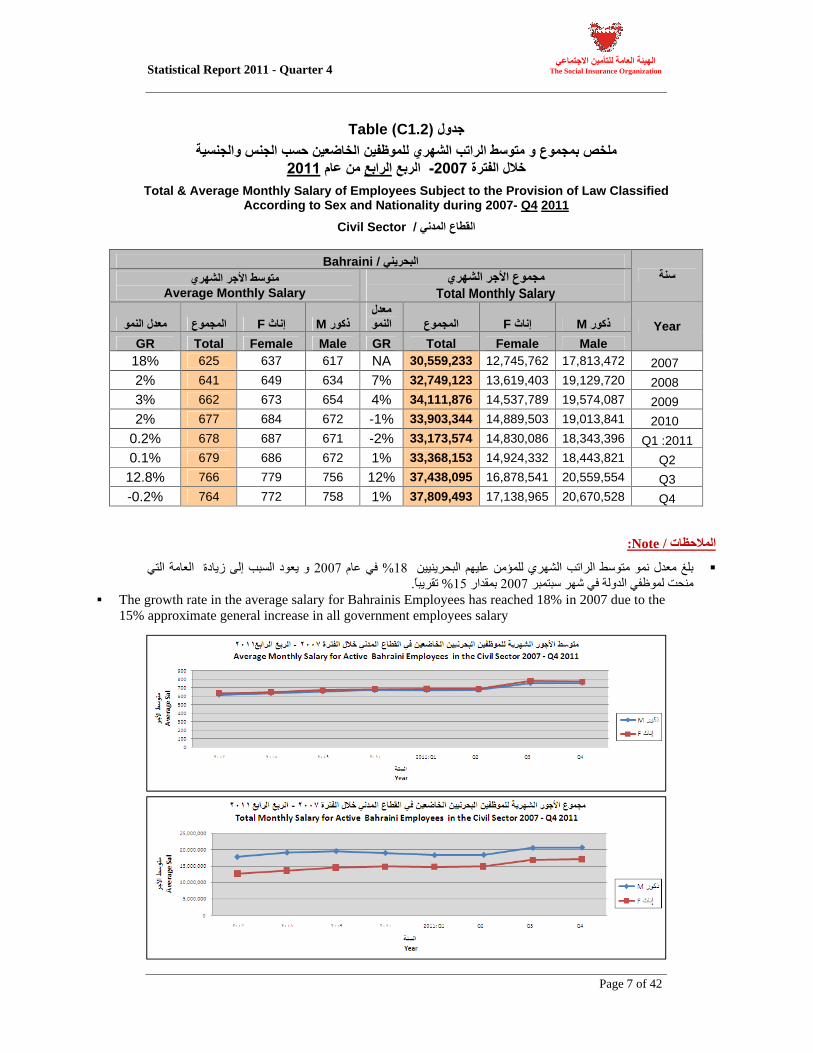
C1.2Table
Total & Average Monthly Salary of Employees Subject to the Provision of Law Classified
According to Sex and Nationality during 2007- Q4
2011
SectorCivil
Bahraini
Total Monthly Salary
Average Monthly Salary
M F
M F
Year Male Female Total GR Male Female Total GR
2007 17,813,472
12,745,762
30,559,233
NA 617 637 625 18%
2008 19,129,720
13,619,403
32,749,123
7% 634 649 641 2%
2009 19,574,087
14,537,789
34,111,876
4% 654 673 662 3%
2010 19,013,841
14,889,503
33,903,344
-1% 672 684 677 2%
2011Q1 18,343,396
14,830,086
33,173,574
-2% 671 687 678 0.2%
Q2
18,443,821
14,924,332
33,368,153
1% 672 686 679 0.1%
Q3
20,559,554
16,878,541
37,438,095
12%
756 779 766 12.8%
Q4
20,670,528
17,138,965
37,809,493
1% 758 772 764 -0.2%
Note
%
The growth rate in the average salary for Bahrainis Employees has reached 18% in 2007 due to the 15% approximate general increase in all government employees salary
Statistical Report 2011 - Quarter 4
Page 8 of 42
The Social Insurance Organization
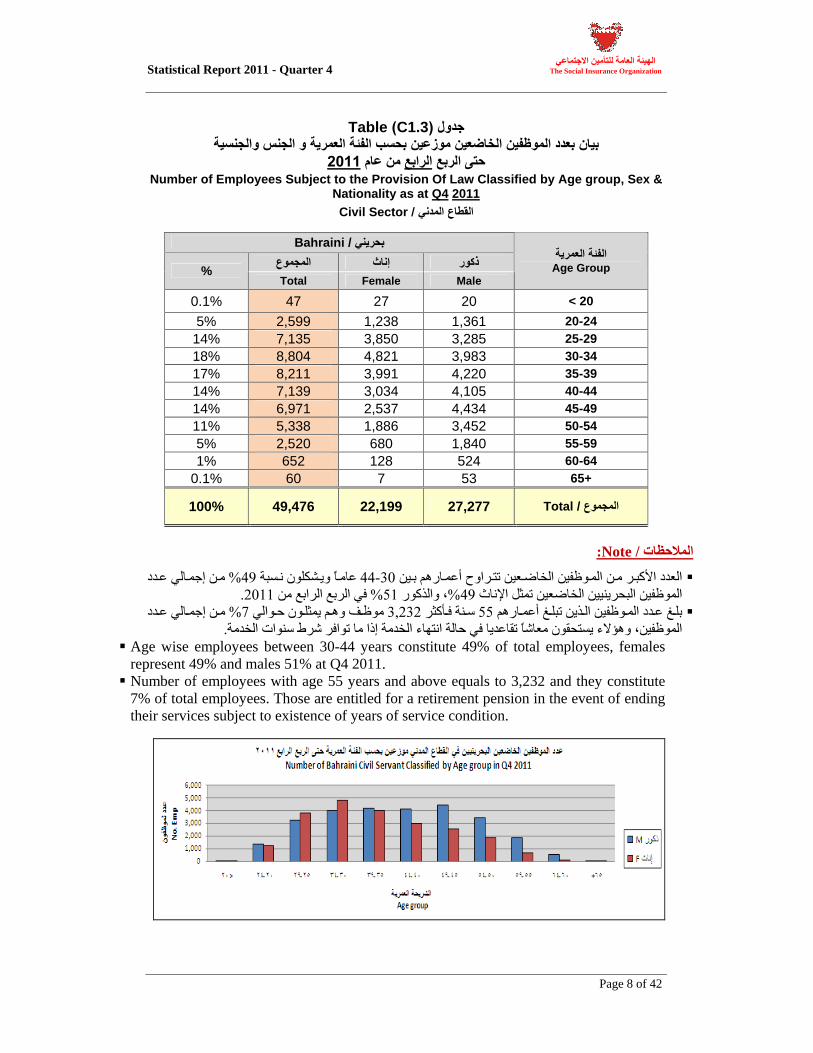
C1.3Table
Number of Employees Subject to the Provision Of Law Classified by Age group, Sex &
Nationality as at Q4
2011
Civil Sector
Bahraini /
Age Group Male Female Total
%
< 20 20 27 47 0.1% 20-24 1,361 1,238 2,599 5% 25-29 3,285 3,850 7,135 14% 30-34 3,983 4,821 8,804 18% 35-39 4,220 3,991 8,211 17% 40-44 4,105 3,034 7,139 14% 45-49 4,434 2,537 6,971 14% 50-54 3,452 1,886 5,338 11% 55-59 1,840 680 2,520 5% 60-64 524 128 652 1% 65+ 53 7 60 0.1%
/Total 27,277 22,199 49,476 100%
Note
Age wise employees between 30-44 years constitute 49% of total employees, females represent 49% and males 51% at Q4 2011.
Number of employees with age 55 years and above equals to 3,232 and they constitute 7% of total employees. Those are entitled for a retirement pension in the event of ending their services subject to existence of years of service condition.
Statistical Report 2011 - Quarter 4
Page 9 of 42
The Social Insurance Organization
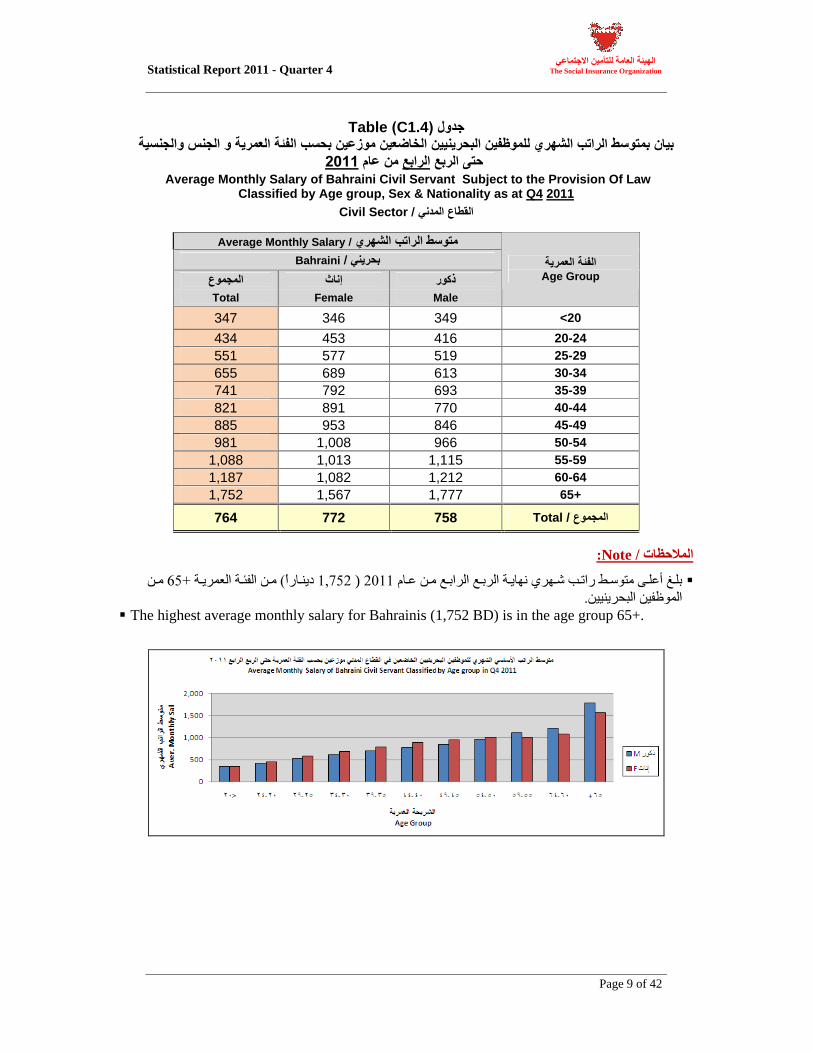
C1.4Table
Average Monthly Salary of Bahraini Civil Servant Subject to the Provision Of Law
Classified by Age group, Sex & Nationality as at Q4
2011
Civil Sector
Average Monthly Salary
Bahraini
Age Group
Male Female Total
<20 349 346 347 20-24 416 453 434 25-29 519 577 551 30-34 613 689 655 35-39 693 792 741 40-44 770 891 821 45-49 846 953 885 50-54 966 1,008 981 55-59 1,115 1,013 1,088 60-64 1,212 1,082 1,187 65+ 1,777 1,567 1,752
/Total 758 772 764
Note
)
The highest average monthly salary for Bahrainis (1,752 BD) is in the age group 65+.
Statistical Report 2011 - Quarter 4
Page 10 of 42
The Social Insurance Organization
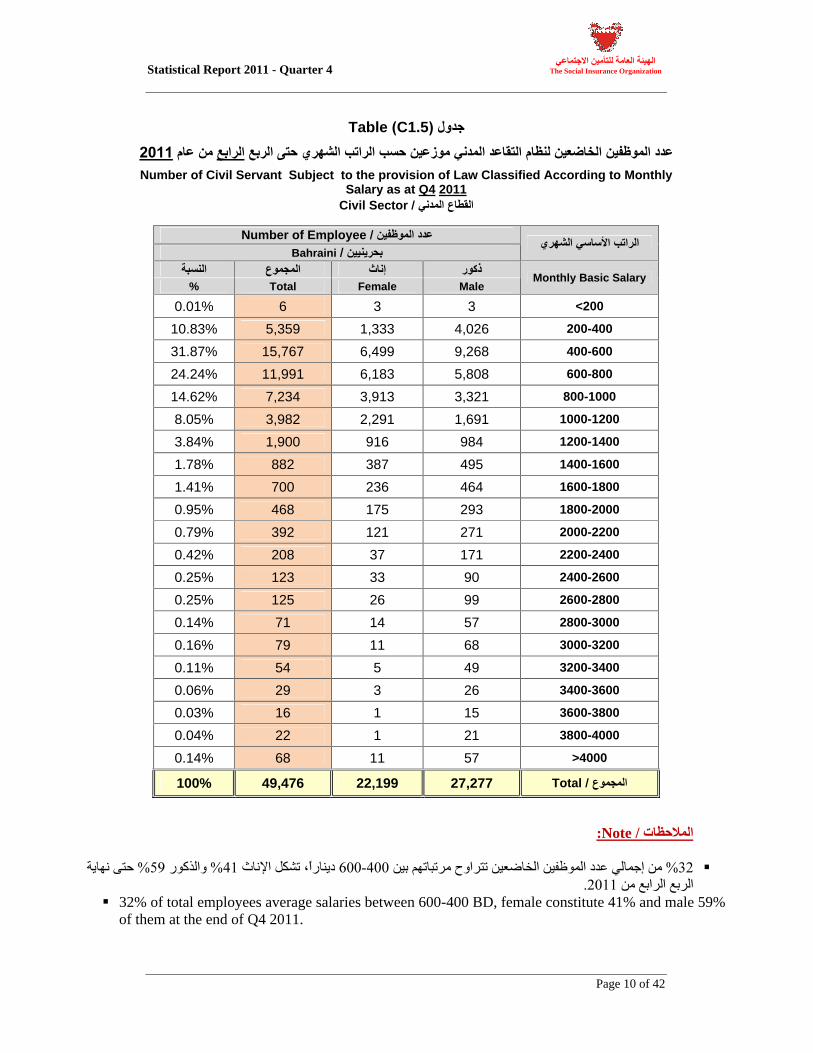
C1.5Table
Number of Civil Servant Subject to the provision of Law Classified According to Monthly
Salary as at Q4
2011
Civil Sector
Number of Employee
Bahraini
Monthly Basic Salary Male Female Total %
<200 3 3 6 0.01%
200-400 4,026 1,333 5,359 10.83%
400-600 9,268 6,499 15,767 31.87%
600-800 5,808 6,183 11,991 24.24%
800-1000 3,321 3,913 7,234 14.62%
1000-1200 1,691 2,291 3,982 8.05%
1200-1400 984 916 1,900 3.84%
1400-1600 495 387 882 1.78%
1600-1800 464 236 700 1.41%
1800-2000 293 175 468 0.95%
2000-2200 271 121 392 0.79%
2200-2400 171 37 208 0.42%
2400-2600 90 33 123 0.25%
2600-2800 99 26 125 0.25%
2800-3000 57 14 71 0.14%
3000-3200 68 11 79 0.16%
3200-3400 49 5 54 0.11%
3400-3600 26 3 29 0.06%
3600-3800 15 1 16 0.03%
3800-4000 21 1 22 0.04%
>4000 57 11 68 0.14%
Total 27,277 22,199 49,476 100%
Note
32% of total employees average salaries between 600-400 BD, female constitute 41% and male 59% of them at the end of Q4 2011.
Statistical Report 2011 - Quarter 4
Page 11 of 42
The Social Insurance Organization
Section C
Pensioners Statistics in the Civil Sector
Contents
Table No Title
Page No
C2
Live Pensioners Data
11
C2.1
Number of Alive Pensioners & Dead Pensioners by Gender 12
C2.2
Total & Average Monthly Pension of Alive and Dead Pensioners by Gender
13
C2.3
Number of Alive Pensioners & Average Monthly Pension by Age Group
15
C2.4
Number of Alive Pensioners by Monthly Pension 16
Statistical Report 2011 - Quarter 4
Page 12 of 42
The Social Insurance Organization
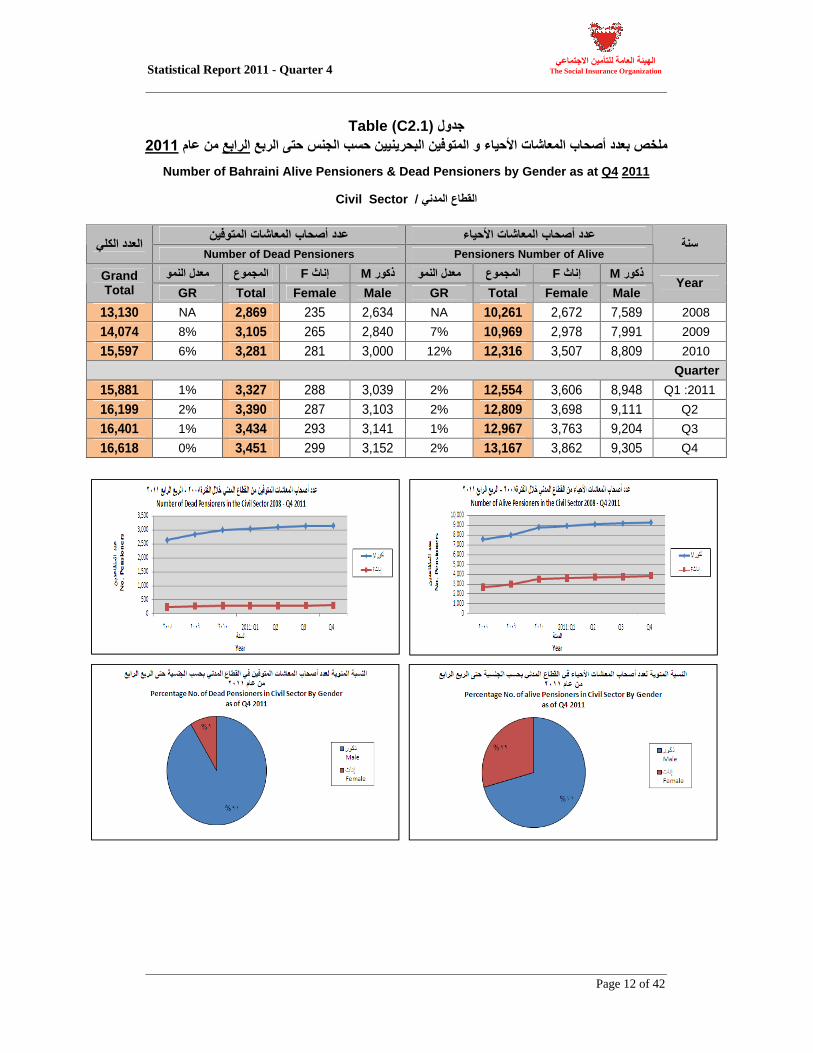
C2.1Table
Number of Bahraini Alive Pensioners & Dead Pensioners by Gender as at Q4
2011
SectorCivil
Number of AlivePensioners Number of Dead Pensioners
M F
M F
Year Male Female Total GR Male Female Total GR
Grand Total
2008 7,589
2,672
10,261
NA 2,634
235
2,869
NA 13,130
2009 7,991
2,978
10,969
7% 2,840
265
3,105
8% 14,074
2010 8,809
3,507
12,316
12% 3,000
281
3,281
6% 15,597
Quarter
2011Q1 8,948
3,606
12,554
2% 3,039
288
3,327
1% 15,881
Q2 9,111
3,698
12,809
2% 3,103
287
3,390
2% 16,199
Q3 9,204
3,763
12,967
1% 3,141
293
3,434
1% 16,401
Q4 9,305
3,862
13,167
2% 3,152
299
3,451
0% 16,618
Statistical Report 2011 - Quarter 4
Page 13 of 42
The Social Insurance Organization
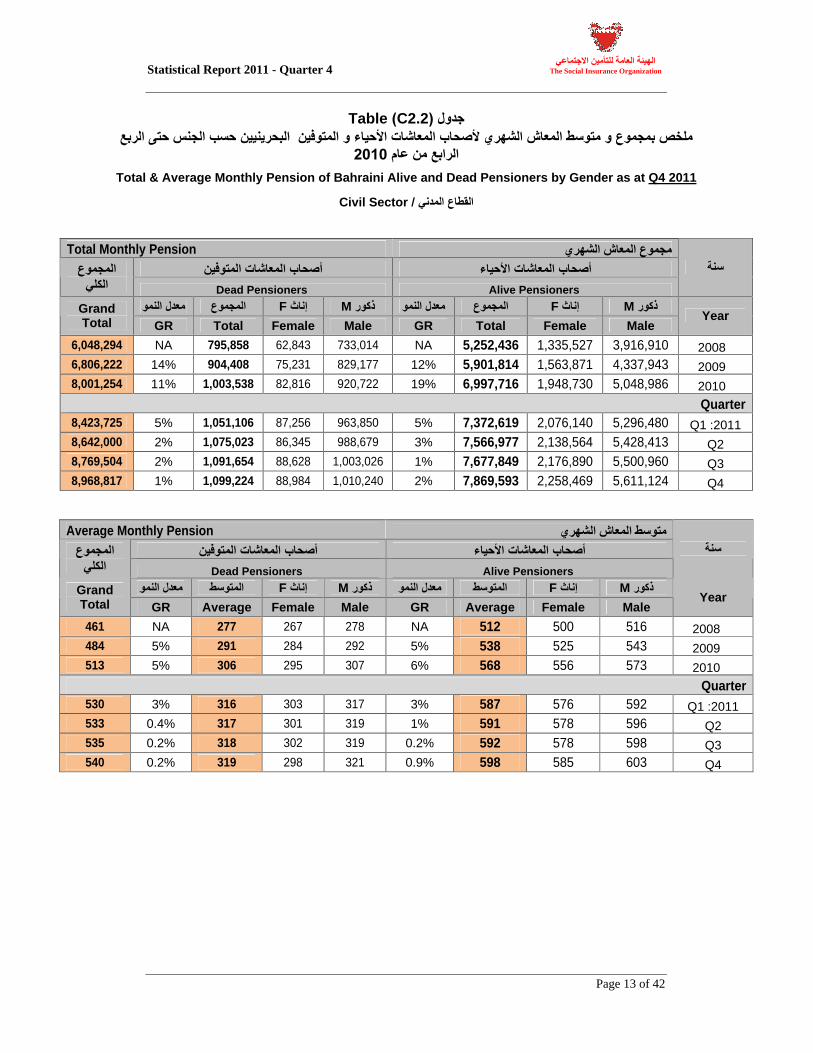
C2.2Table
Total & Average Monthly Pension of Bahraini Alive and Dead Pensioners by Gender as at Q4 2011
Civil Sector
Total Monthly Pension
Alive Pensioners Dead Pensioners
M F
M F
Year Male Female Total GR Male Female Total GR
Grand Total
2008 3,916,910
1,335,527
5,252,436
NA 733,014
62,843
795,858
NA 6,048,294
2009 4,337,943
1,563,871
5,901,814
12% 829,177
75,231
904,408
14% 6,806,222
2010 5,048,986
1,948,730
6,997,716
19% 920,722
82,816
1,003,538
11% 8,001,254
Quarter
2011Q1 5,296,480
2,076,140
7,372,619
5% 963,850
87,256
1,051,106
5% 8,423,725
Q2
5,428,413
2,138,564
7,566,977
3% 988,679
86,345
1,075,023
2% 8,642,000
Q3
5,500,960
2,176,890
7,677,849
1% 1,003,026
88,628
1,091,654
2% 8,769,504
Q4
5,611,124
2,258,469
7,869,593
2% 1,010,240
88,984
1,099,224
1% 8,968,817
Average Monthly Pension
Alive Pensioners Dead Pensioners
M F
M F
Year Male Female Average GR Male Female Average GR
Grand Total
2008 516
500
512
NA 278
267
277
NA 461
2009 543
525
538
5% 292
284
291
5% 484
2010 573
556
568
6% 307
295
306
5% 513
Quarter
2011Q1 592
576
587
3% 317
303
316
3% 530
Q2
596
578
591
1% 319
301
317
0.4% 533
Q3598
578
592
0.2% 319
302
318
0.2% 535
Q4
603
585
598
0.9% 321
298
319
0.2% 540
Statistical Report 2011 - Quarter 4
Page 14 of 42
The Social Insurance Organization
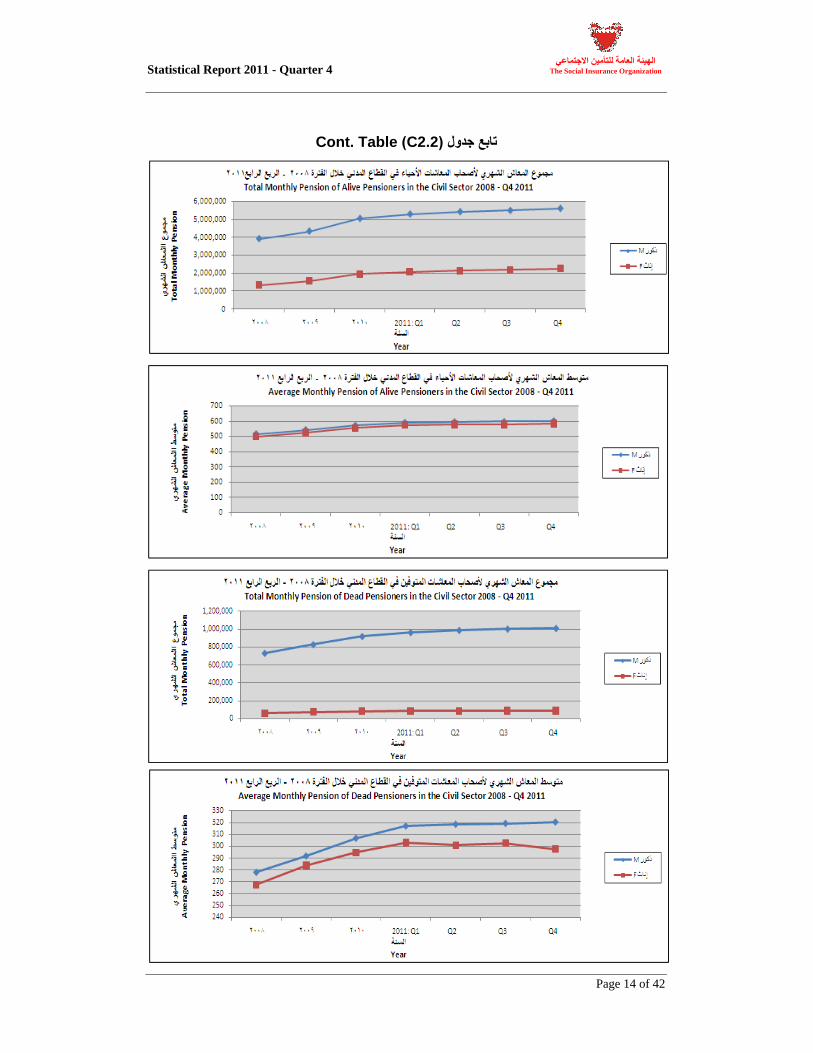
C2.2Cont. Table
Statistical Report 2011 - Quarter 4
Page 15 of 42
The Social Insurance Organization
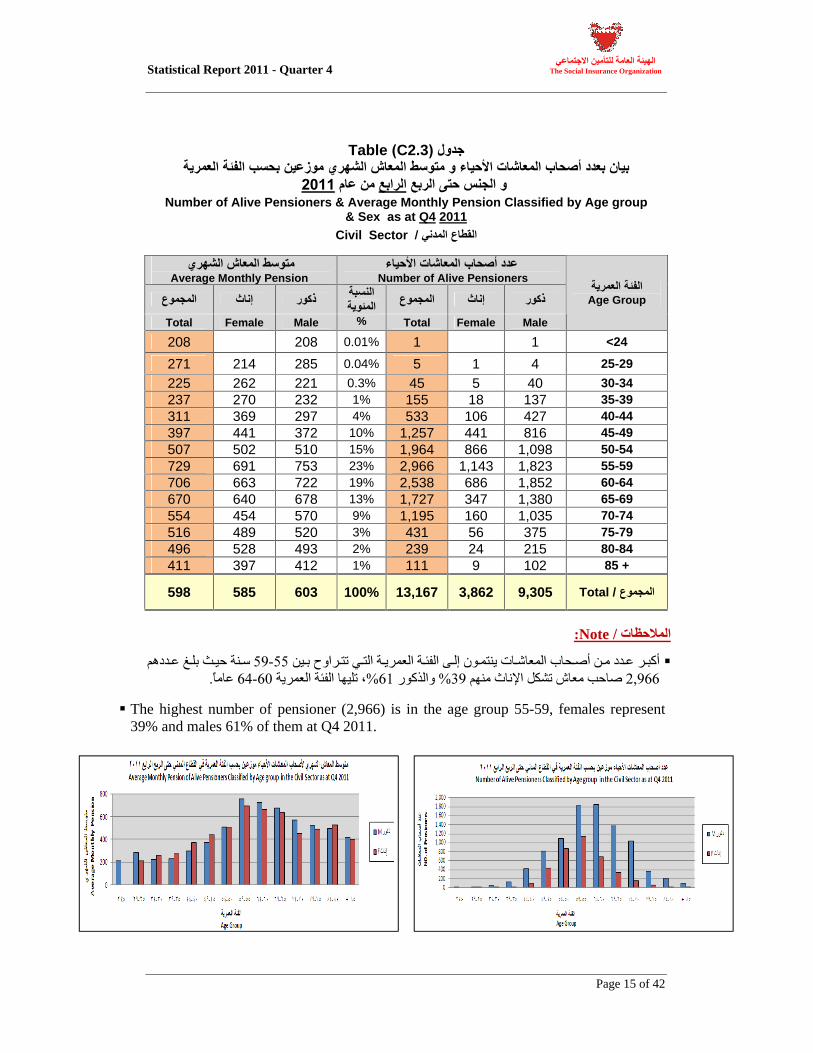
C2.3Table
Number of Alive Pensioners & Average Monthly Pension Classified by Age group
& Sex as at Q4
2011
SectorCivil
Number of Alive Pensioners
Average Monthly Pension
Age Group
Male Female Total % Male Female Total
<24 1 1 0.01%
208 208
25-29 4 1 5 0.04%
285 214 271 30-34 40 5 45 0.3% 221 262 225 35-39 137 18 155 1% 232 270 237 40-44 427 106 533 4% 297 369 311 45-49 816 441 1,257 10% 372 441 397 50-54 1,098 866 1,964 15% 510 502 507 55-59 1,823 1,143 2,966 23% 753 691 729 60-64 1,852 686 2,538 19% 722 663 706 65-69 1,380 347 1,727 13% 678 640 670 70-74 1,035 160 1,195 9% 570 454 554 75-79 375 56 431 3% 520 489 516 80-84 215 24 239 2% 493 528 496 85 + 102 9 111 1% 412 397 411
/Total 9,305 3,862 13,167 100%
603 585 598
Note
The highest number of pensioner (2,966) is in the age group 55-59, females represent 39% and males 61% of them at Q4 2011.
Statistical Report 2011 - Quarter 4
Page 16 of 42
The Social Insurance Organization
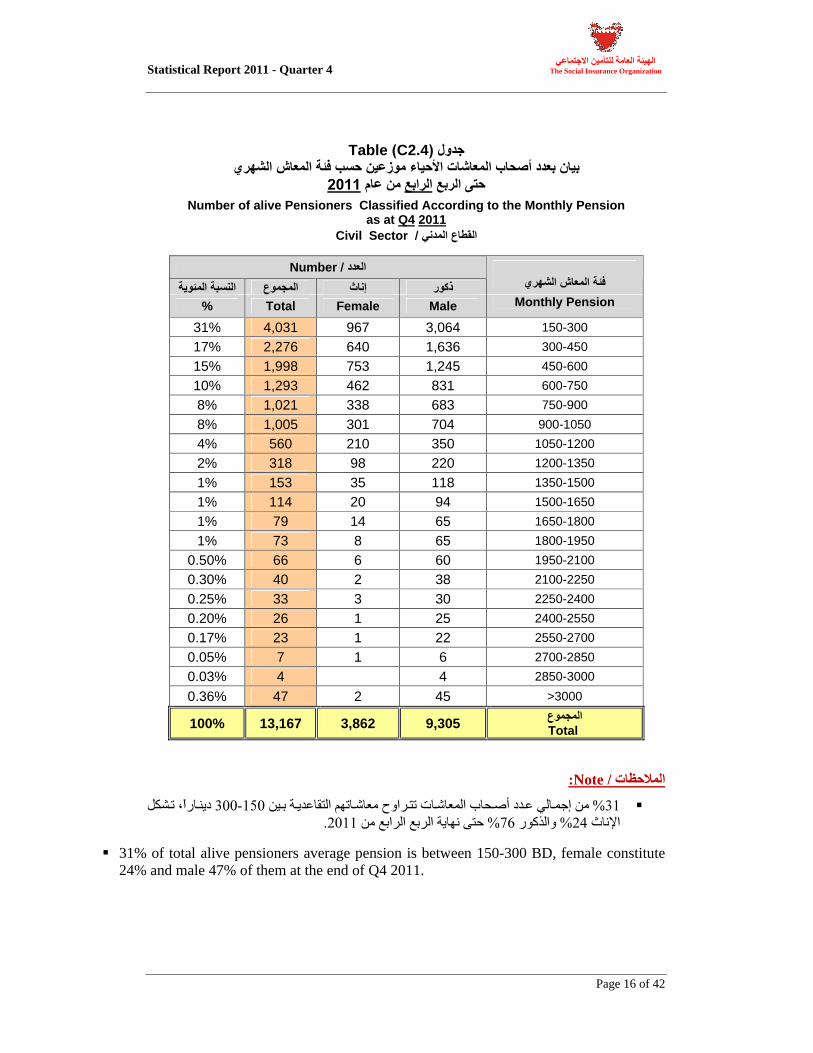
C2.4Table
Number of alive Pensioners Classified According to the Monthly Pension
as at Q4
2011
SectorCivil
Number
Monthly Pension Male Female Total %
150-300 3,064 967 4,031 31% 300-450 1,636 640 2,276 17% 450-600 1,245 753 1,998 15% 600-750 831 462 1,293 10% 750-900 683 338 1,021 8% 900-1050 704 301 1,005 8%
1050-1200 350 210 560 4% 1200-1350 220 98 318 2% 1350-1500 118 35 153 1% 1500-1650 94 20 114 1% 1650-1800 65 14 79 1% 1800-1950 65 8 73 1% 1950-2100 60 6 66 0.50% 2100-2250 38 2 40 0.30% 2250-2400 30 3 33 0.25% 2400-2550 25 1 26 0.20% 2550-2700 22 1 23 0.17% 2700-2850 6 1 7 0.05% 2850-3000 4 4 0.03%
>3000 45 2 47 0.36%
Total 9,305 3,862 13,167 100%
Note
31% of total alive pensioners average pension is between 150-300 BD, female constitute 24% and male 47% of them at the end of Q4 2011.
Statistical Report 2011 - Quarter 4
Page 17 of 42
The Social Insurance Organization
Section C 3 Beneficiaries Statistics in the Civil Sector
Contents
Table No Title
Page No
3
Beneficiaries Data
17
C3.1
Number, Total & average Monthly Pension of Beneficiaries by Gender 18
C3.2
Number of Beneficiaries Classified By Age Wise 20
C3.3
Number of Beneficiaries Classified By Monthly Pension 21
Statistical Report 2011 - Quarter 4
Page 18 of 42
The Social Insurance Organization
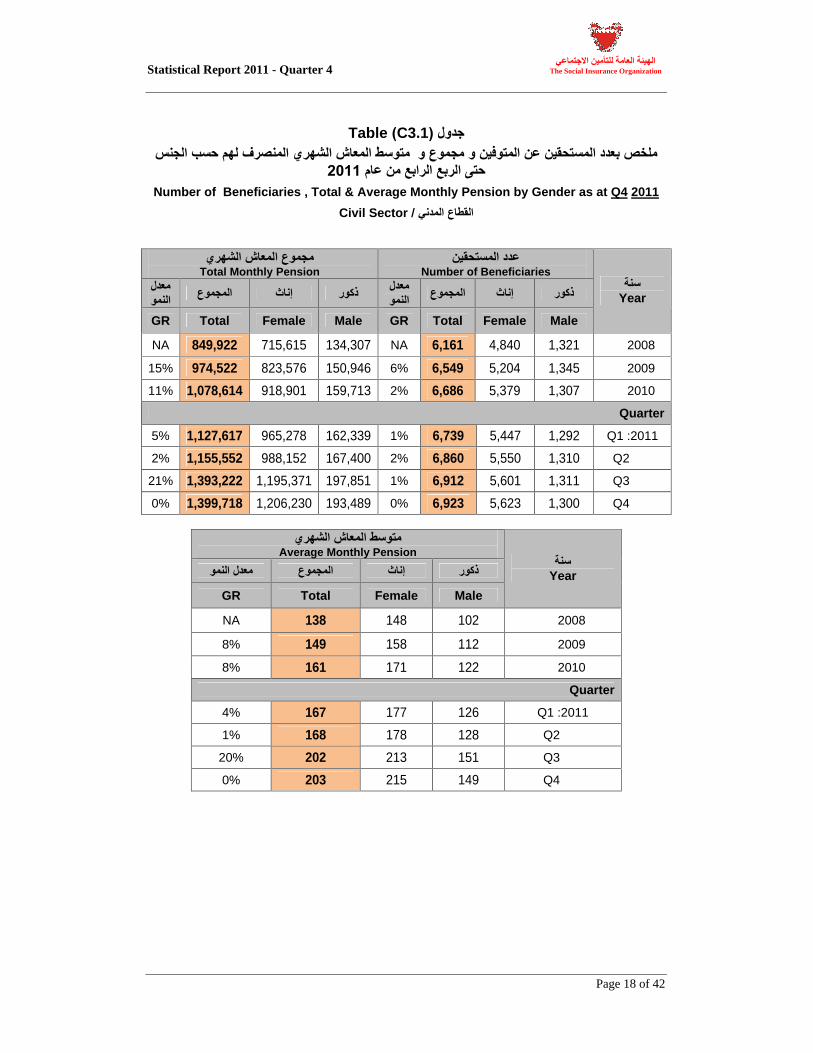
C3.1Table
Number of Beneficiaries , Total & Average Monthly Pension by Gender as at Q4
2011
Civil Sector
Number of Beneficiaries
Total Monthly Pension
Year
Male Female Total GR Male Female Total GR
2008 1,321
4,840
6,161
NA 134,307
715,615
849,922
NA
2009 1,345
5,204
6,549
6% 150,946
823,576
974,522
15%
2010 1,307
5,379
6,686
2% 159,713
918,901
1,078,614
11%
Quarter
2011Q1 1,292
5,447
6,739
1% 162,339
965,278
1,127,617
5%
Q2 1,310
5,550
6,860
2% 167,400
988,152
1,155,552
2%
Q3 1,311
5,601
6,912
1% 197,851
1,195,371
1,393,222
21%
Q4 1,300
5,623
6,923
0% 193,489
1,206,230
1,399,718
0%
Average Monthly Pension
Year
Male Female Total GR
2008 102
148
138
NA
2009 112
158
149
8%
2010 122
171
161
8%
Quarter
2011Q1 126
177
167
4%
Q2 128
178
168
1%
Q3 151
213
202
20%
Q4 149
215
203
0%
Statistical Report 2011 - Quarter 4
Page 19 of 42
The Social Insurance Organization
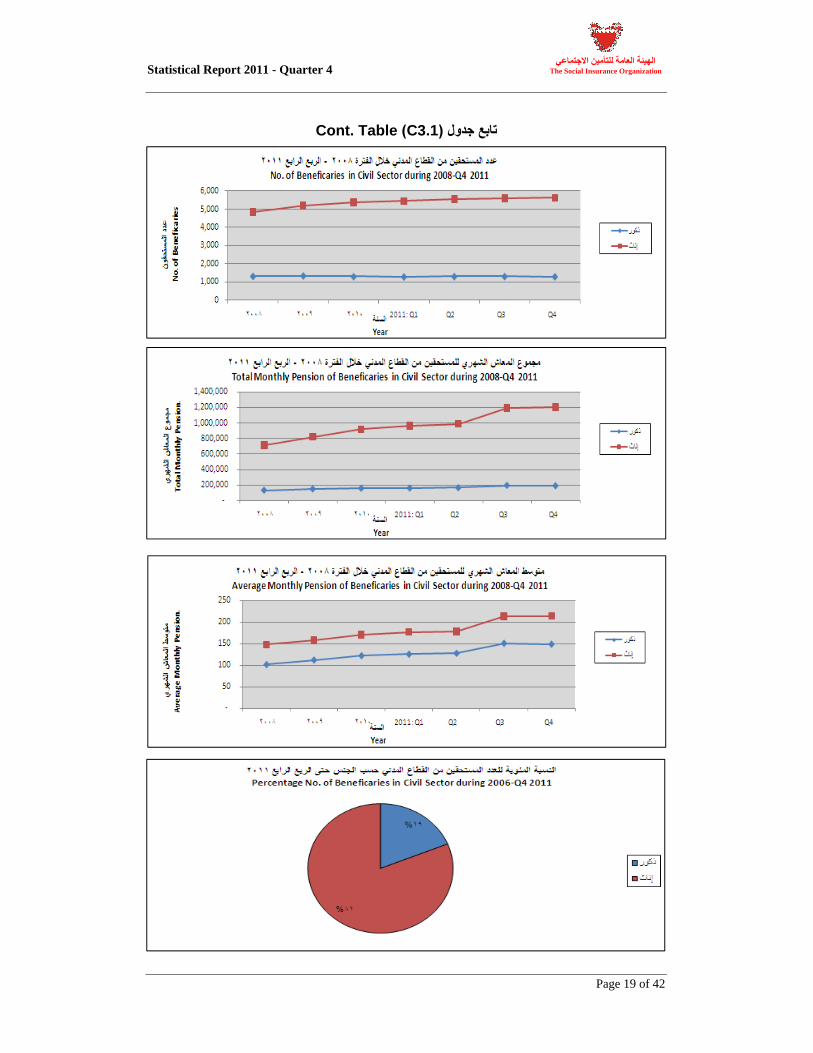
C3.1Cont. Table
Statistical Report 2011 - Quarter 4
Page 20 of 42
The Social Insurance Organization
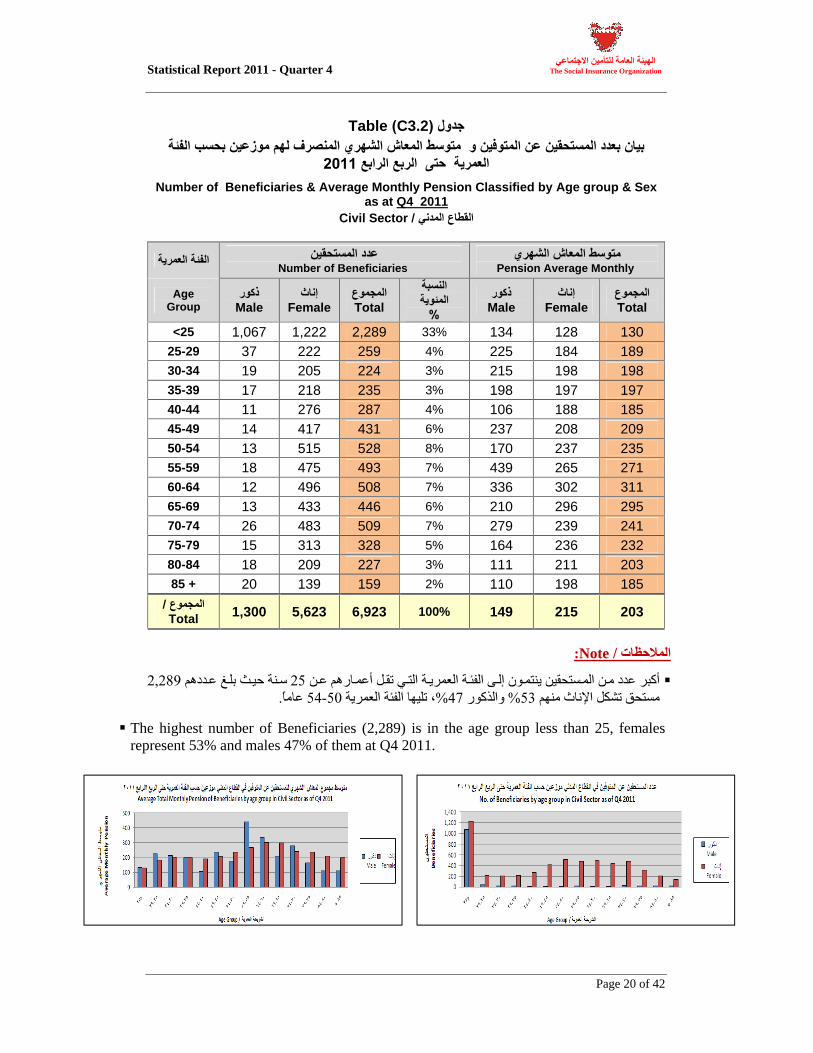
C3.2Table
Number of Beneficiaries & Average Monthly Pension Classified by Age group & Sex
as at Q4 2011
Civil Sector
Number of Beneficiaries Average MonthlyPension
Age Group Male Female Total
Male Female Total
<25 1,067 1,222 2,289 33% 134 128 130 25-29 37 222 259 4% 225 184 189 30-34 19 205 224 3% 215 198 198 35-39 17 218 235 3% 198 197 197 40-44 11 276 287 4% 106 188 185 45-49 14 417 431 6% 237 208 209 50-54 13 515 528 8% 170 237 235 55-59 18 475 493 7% 439 265 271 60-64 12 496 508 7% 336 302 311 65-69 13 433 446 6% 210 296 295 70-74 26 483 509 7% 279 239 241 75-79 15 313 328 5% 164 236 232 80-84 18 209 227 3% 111 211 203 85 + 20 139 159 2% 110 198 185
Total 1,300 5,623 6,923 100% 149 215 203
Note
The highest number of Beneficiaries (2,289) is in the age group less than 25, females represent 53% and males 47% of them at Q4 2011.
Statistical Report 2011 - Quarter 4
Page 21 of 42
The Social Insurance Organization
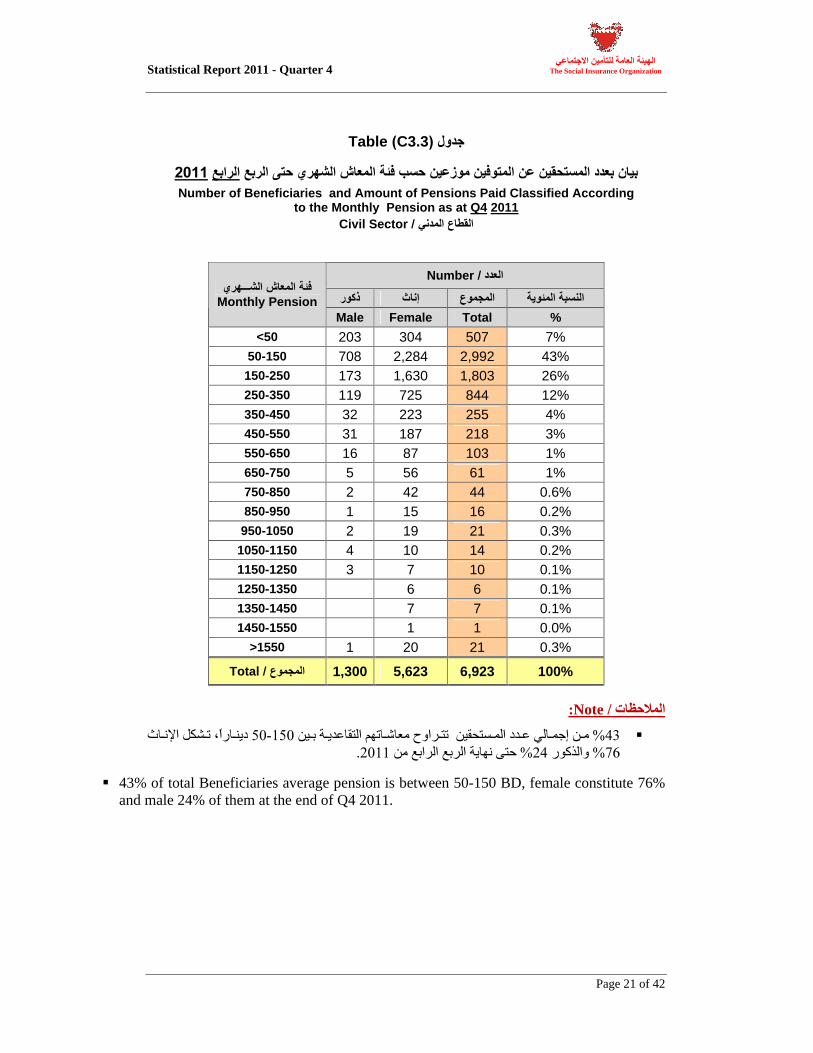
C3.3Table
Number of Beneficiaries and Amount of Pensions Paid Classified According
to the Monthly Pension as at Q4
2011
Civil Sector
Number
Monthly Pension Male Female Total %
<50 203 304 507 7% 50-150 708 2,284 2,992 43% 150-250 173 1,630 1,803 26% 250-350 119 725 844 12% 350-450 32 223 255 4% 450-550 31 187 218 3% 550-650 16 87 103 1% 650-750 5 56 61 1% 750-850 2 42 44 0.6% 850-950 1 15 16 0.2% 950-1050 2 19 21 0.3%
1050-1150 4 10 14 0.2% 1150-1250 3 7 10 0.1% 1250-1350 6 6 0.1% 1350-1450 7 7 0.1% 1450-1550 1 1 0.0%
>1550 1 20 21 0.3%
Total 1,300
5,623 6,923 100%
Note
43% of total Beneficiaries average pension is between 50-150 BD, female constitute 76% and male 24% of them at the end of Q4 2011.
Statistical Report 2011 - Quarter 4
Page 22 of 42
The Social Insurance Organization
Chapter 2 : Private Sector
Statistical Report 2011 - Quarter 4
Page 23 of 42
The Social Insurance Organization
Contents
Table No Title
Page No
P1
Contributors Data
23
P1.1
No of Employees by sex and Nationality 24
P1.2
Total & Average Monthly Salary of Employees by sex and Nationality 25
P1.3
No of Employees Classified by Age Group 27
P1.4
Average Monthly Salary of Employees Classified by Age Group 28
P1.5
No of Employees Classified By Monthly Salary 29
Section P1 Contributors' Statistics in the Private Sector
Statistical Report 2011 - Quarter 4
Page 24 of 42
The Social Insurance Organization
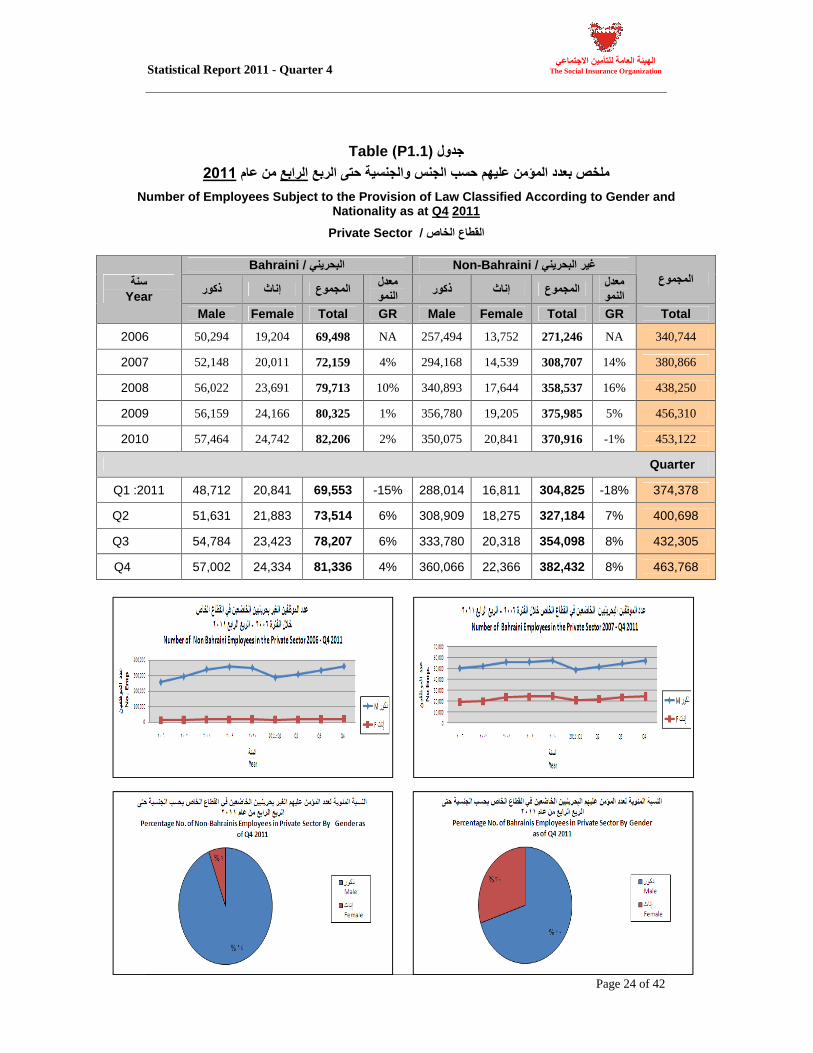
P1.1Table
Number of Employees Subject to the Provision of Law Classified According to Gender and
Nationality as at Q4
2011
SectorPrivate
Bahraini Non-Bahraini
Year Male Female Total GR Male Female Total GR Total
2006 50,294 19,204 69,498 NA 257,494 13,752 271,246 NA 340,744
2007 52,148 20,011 72,159 4% 294,168 14,539 308,707 14% 380,866
2008 56,022 23,691 79,713 10% 340,893 17,644 358,537 16% 438,250
2009 56,159 24,166 80,325 1% 356,780 19,205 375,985 5% 456,310
2010 57,464 24,742 82,206 2% 350,075 20,841 370,916 -1% 453,122
Quarter
2011Q1 48,712 20,841 69,553 -15% 288,014
16,811 304,825 -18% 374,378
Q2 51,631 21,883 73,514 6% 308,909
18,275 327,184 7% 400,698
Q3 54,784 23,423 78,207 6% 333,780
20,318 354,098 8% 432,305
Q4 57,002 24,334 81,336 4% 360,066
22,366 382,432 8% 463,768
Statistical Report 2011 - Quarter 4
Page 25 of 42
The Social Insurance Organization
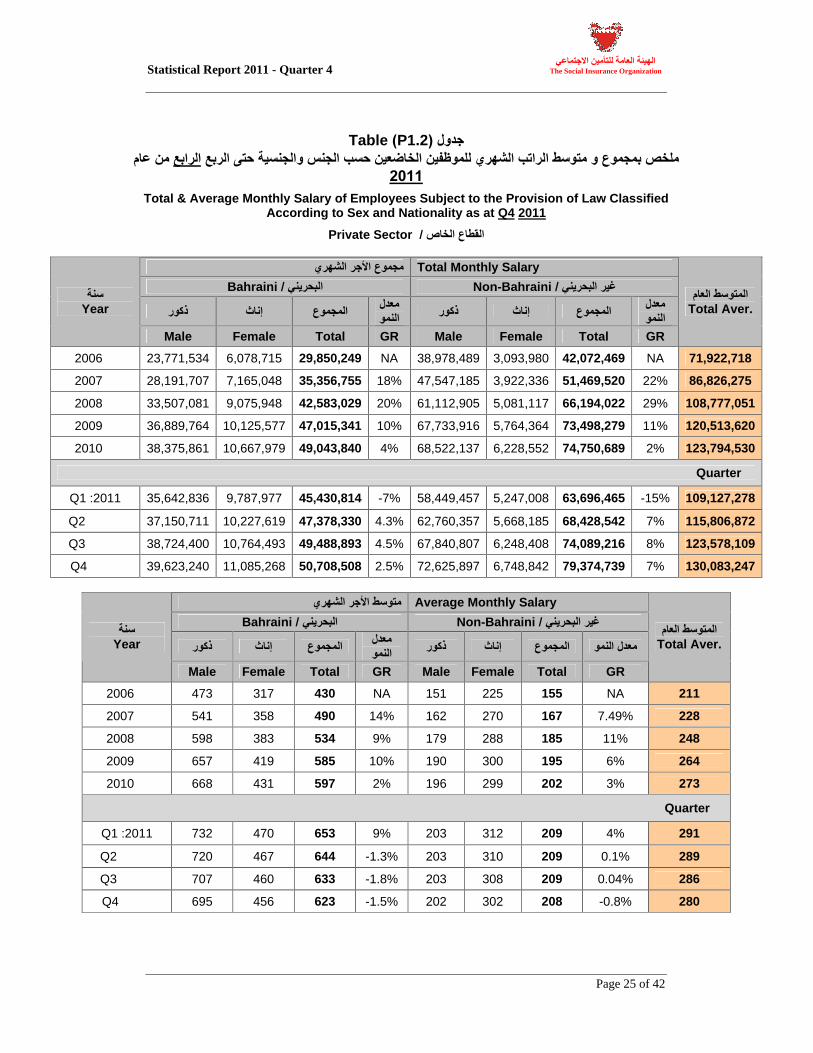
P1.2Table
Total & Average Monthly Salary of Employees Subject to the Provision of Law Classified
According to Sex and Nationality as at Q4
2011
SectorPrivate
Total Monthly Salary
Bahraini Non-Bahraini
Year
Male Female Total GR Male Female Total GR
Total Aver.
2006 23,771,534
6,078,715 29,850,249
NA 38,978,489
3,093,980
42,072,469
NA 71,922,718
2007 28,191,707
7,165,048 35,356,755
18% 47,547,185
3,922,336
51,469,520
22% 86,826,275
2008 33,507,081
9,075,948 42,583,029
20% 61,112,905
5,081,117
66,194,022
29% 108,777,051
2009 36,889,764
10,125,577
47,015,341
10% 67,733,916
5,764,364
73,498,279
11% 120,513,620
2010 38,375,861
10,667,979
49,043,840
4% 68,522,137
6,228,552
74,750,689
2% 123,794,530
Quarter
2011Q1 35,642,836
9,787,977 45,430,814
-7% 58,449,457
5,247,008
63,696,465
-15% 109,127,278
Q2 37,150,711
10,227,619
47,378,330
4.3%
62,760,357
5,668,185
68,428,542
7% 115,806,872
Q3 38,724,400
10,764,493
49,488,893
4.5%
67,840,807
6,248,408
74,089,216
8% 123,578,109
Q4 39,623,240
11,085,268
50,708,508
2.5%
72,625,897
6,748,842
79,374,739
7% 130,083,247
Average Monthly Salary
Bahraini Non-Bahraini
Year
Male Female Total GR Male Female
Total GR
Total Aver.
2006 473 317 430 NA 151 225 155 NA 211
2007 541 358 490 14% 162 270 167 7.49% 228
2008 598 383 534 9% 179 288 185 11% 248
2009 657 419 585 10% 190 300 195 6% 264
2010 668 431 597 2% 196 299 202 3% 273
Quarter
2011Q1 732 470 653 9% 203 312 209 4% 291
Q2 720 467 644 -1.3% 203 310 209 0.1% 289
Q3 707 460 633 -1.8% 203 308 209 0.04% 286
Q4 695 456 623 -1.5% 202 302 208 -0.8% 280
Statistical Report 2011 - Quarter 4
Page 26 of 42
The Social Insurance Organization
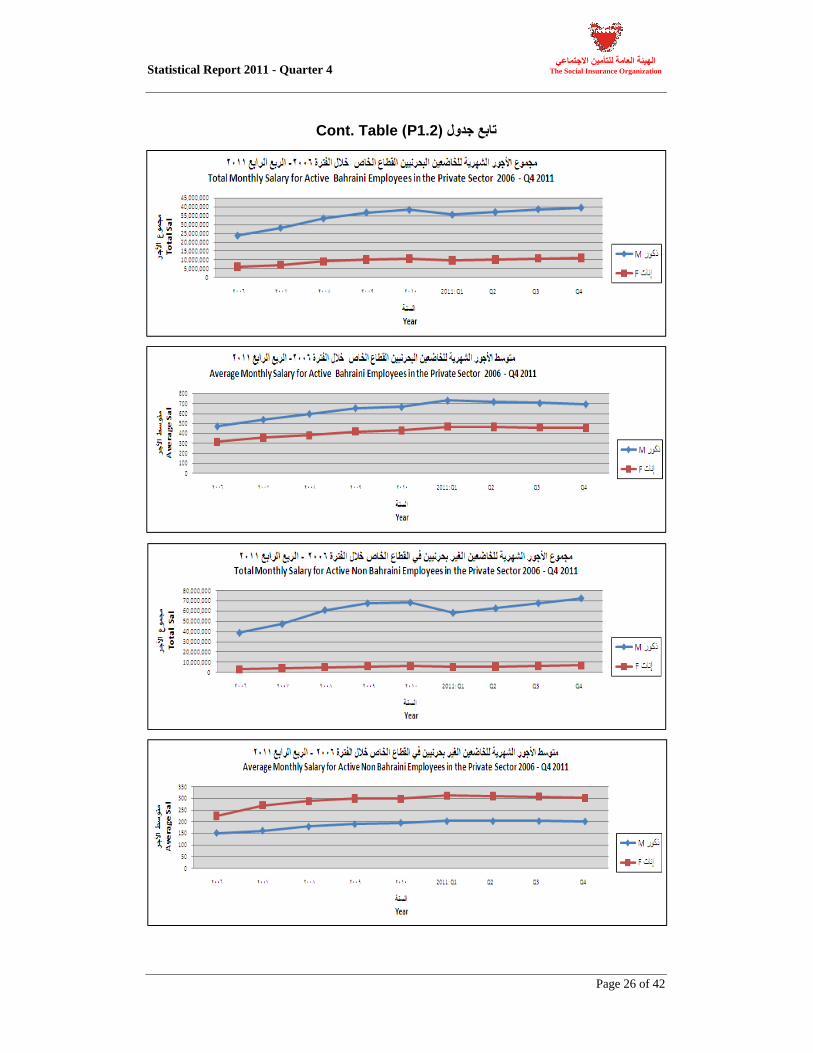
P1.2Cont. Table

Statistical Report 2011 - Quarter 4
Page 27 of 42
The Social Insurance Organization
P1.3Table
Number of Employees Subject to the Provision Of Law Classified by Age group, Sex &
Nationality as at Q4
2011
SectorPrivate
Number of Employee
Bahraini Non-Bahraini
Age Group
Male Female Total Male Female Total Total %
< 20 1,170 283 1,453 859 81 940 2,393 0.5% 20-24 9,600 3,508 13,108 26,973 2,114 29,087 42,195 9.1% 25-29 11,926 5,815 17,741 82,282 5,501 87,783 105,524
22.8% 30-34 9,993 5,038 15,031 77,480 5,165 82,645 97,676 21.1% 35-39 7,324 3,495 10,819 61,557 3,504 65,061 75,880 16.4% 40-44 5,255 2,433 7,688 47,299 2,485 49,784 57,472 12.4% 45-49 4,524 2,010 6,534 29,320 1,760 31,080 37,614 8.1% 50-54 3,682 1,186 4,868 19,795 1,049 20,844 25,712 5.5% 55-59 2,378 438 2,816 10,915 534 11,449 14,265 3.1% 60-64 854 102 956 2,890 142 3,032 3,988 0.9% 65+ 296 26 322 696 31 727 1,049 0.2%
Total 57,002 24,334 81,336 360,066 22,366
382,432 463,768
100%
Note
Age wise employees between 25-39 years constitute 54% of total employees, females represent 33% and males 67% at Q4 2011.
Number of employees with age 55 years and above equals to 4,094 and they constitute 5% of total employees. Those are entitled for a retirement pension in the event of ending their services subject to existence of years of service condition.
Statistical Report 2011 - Quarter 4
Page 28 of 42
The Social Insurance Organization
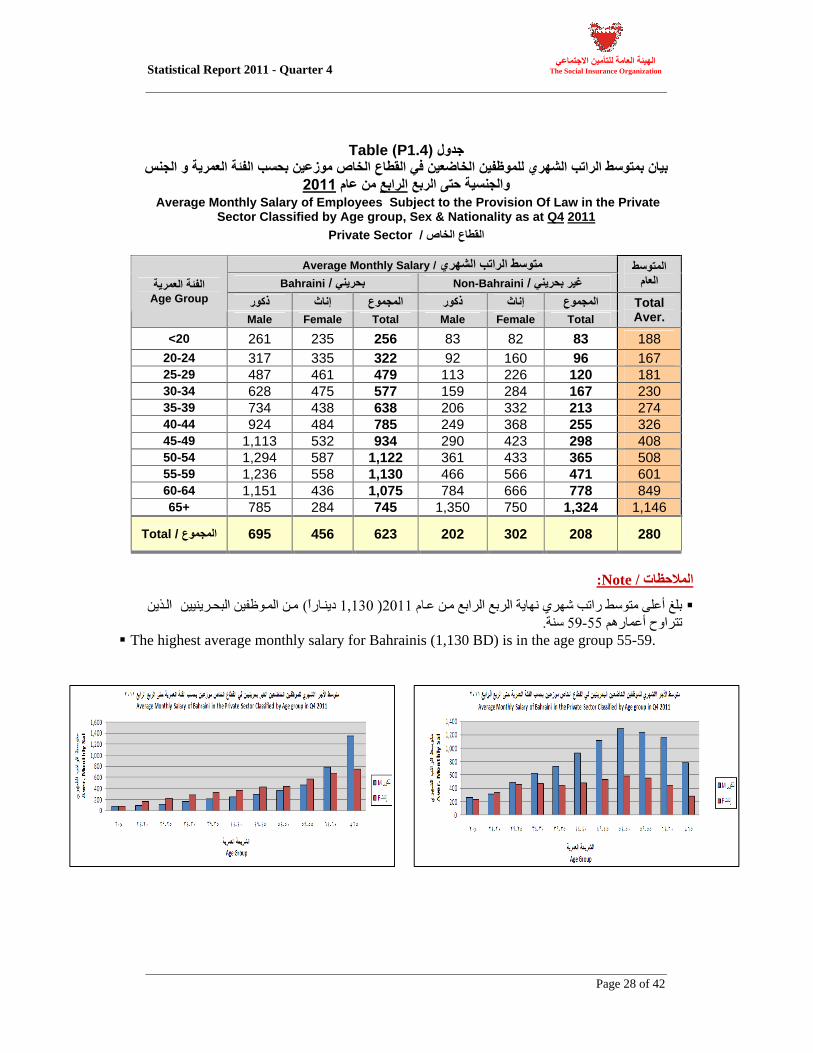
P1.4Table
Average Monthly Salary of Employees Subject to the Provision Of Law in the Private
Sector Classified by Age group, Sex & Nationality as at Q4
2011
SectorPrivate
Average Monthly Salary
Bahraini Non-Bahraini
Age Group
Male Female Total Male Female Total Total Aver.
<20 261 235 256 83 82 83 188 20-24 317 335 322 92 160 96 167 25-29 487 461 479 113 226 120 181 30-34 628 475 577 159 284 167 230 35-39 734 438 638 206 332 213 274 40-44 924 484 785 249 368 255 326 45-49 1,113 532 934 290 423 298 408 50-54 1,294 587 1,122 361 433 365 508 55-59 1,236 558 1,130 466 566 471 601 60-64 1,151 436 1,075 784 666 778 849 65+ 785 284 745 1,350 750 1,324 1,146
/Total 695 456 623 202 302 208 280
Note
)
The highest average monthly salary for Bahrainis (1,130 BD) is in the age group 55-59.
Statistical Report 2011 - Quarter 4
Page 29 of 42
The Social Insurance Organization
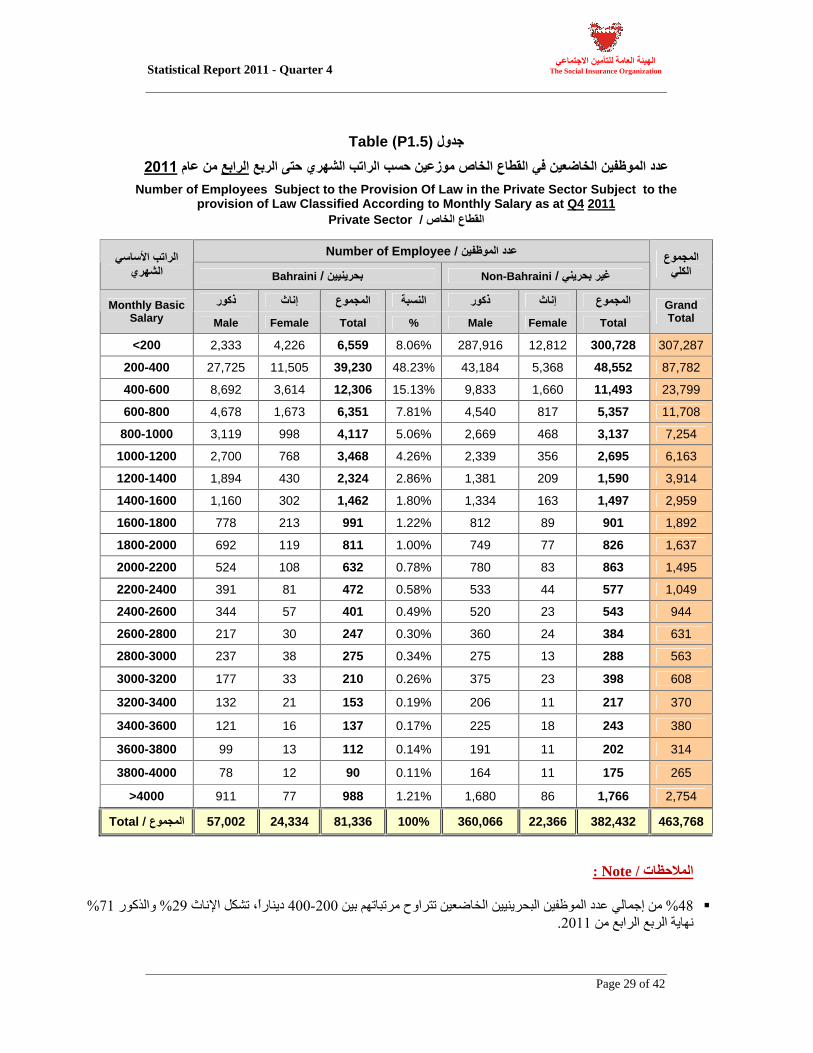
P1.5Table
Number of Employees Subject to the Provision Of Law in the Private Sector Subject to the
provision of Law Classified According to Monthly Salary as at Q4
2011
SectorPrivate
Number of Employee
Bahraini Non-Bahraini
Monthly Basic Salary Male Female Total % Male Female Total
Grand Total
<200 2,333 4,226 6,559 8.06% 287,916 12,812 300,728 307,287
200-400 27,725 11,505 39,230 48.23%
43,184 5,368 48,552 87,782
400-600 8,692 3,614 12,306 15.13%
9,833 1,660 11,493 23,799
600-800 4,678 1,673 6,351 7.81% 4,540 817 5,357 11,708
800-1000 3,119 998 4,117 5.06% 2,669 468 3,137 7,254
1000-1200 2,700 768 3,468 4.26% 2,339 356 2,695 6,163
1200-1400 1,894 430 2,324 2.86% 1,381 209 1,590 3,914
1400-1600 1,160 302 1,462 1.80% 1,334 163 1,497 2,959
1600-1800 778 213 991 1.22% 812 89 901 1,892
1800-2000 692 119 811 1.00% 749 77 826 1,637
2000-2200 524 108 632 0.78% 780 83 863 1,495
2200-2400 391 81 472 0.58% 533 44 577 1,049
2400-2600 344 57 401 0.49% 520 23 543 944
2600-2800 217 30 247 0.30% 360 24 384 631
2800-3000 237 38 275 0.34% 275 13 288 563
3000-3200 177 33 210 0.26% 375 23 398 608
3200-3400 132 21 153 0.19% 206 11 217 370
3400-3600 121 16 137 0.17% 225 18 243 380
3600-3800 99 13 112 0.14% 191 11 202 314
3800-4000 78 12 90 0.11% 164 11 175 265
>4000 911 77 988 1.21% 1,680 86 1,766 2,754
Total 57,002 24,334 81,336 100% 360,066 22,366 382,432 463,768
Note
Statistical Report 2011 - Quarter 4
Page 30 of 42
The Social Insurance Organization
48% of total Bahraini employees average salaries between 200-400 BD, female constitute 29% and male 71% of them at the end of Q4 2011.
Section
Pensioners Statistics in the Private Sector
Contents
Table No Title
Page No
P2.1
Live Pensioners Data
30
P2.1
Number of Alive Pensioners & Dead Pensioners by Gender 31
P2.2
Total & Average Monthly Pension of Alive and Dead Pensioners by Gender
32
P2.3
Number of Alive Pensioners & Average Monthly Pension by Age Group
34
P2.4
Number of Alive Pensioners by Monthly Pension 35
Statistical Report 2011 - Quarter 4
Page 31 of 42
The Social Insurance Organization
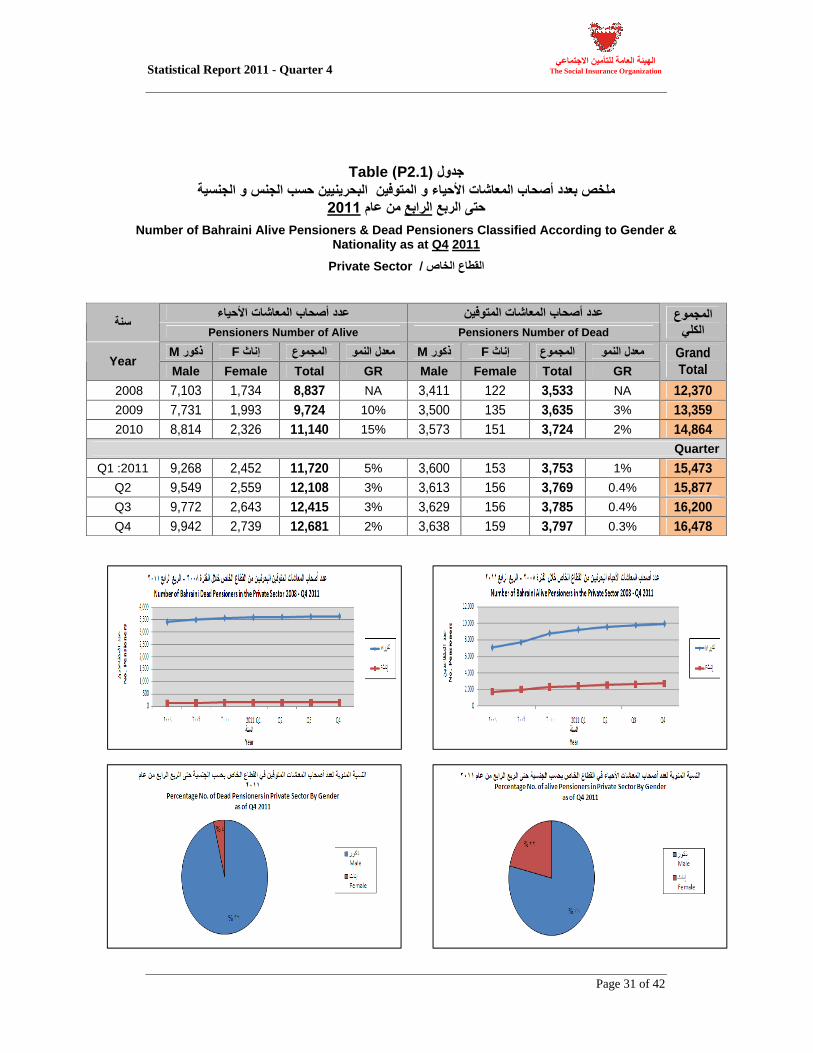
P2.1Table
Number of Bahraini Alive Pensioners & Dead Pensioners Classified According to Gender &
Nationality as at Q4
2011
SectorPrivate
Number of AlivePensioners Number of DeadPensioners
M F
M F
Year Male Female Total GR Male Female Total GR
Grand Total
2008 7,103
1,734
8,837
NA 3,411
122
3,533
NA 12,370
2009 7,731
1,993
9,724
10% 3,500
135
3,635
3% 13,359
2010 8,814
2,326
11,140
15% 3,573
151
3,724
2% 14,864
Quarter
2011Q1 9,268
2,452
11,720
5% 3,600
153
3,753
1% 15,473
Q2 9,549
2,559
12,108
3% 3,613
156
3,769
0.4% 15,877
Q3 9,772
2,643
12,415
3% 3,629
156
3,785
0.4% 16,200
Q4 9,942
2,739
12,681
2% 3,638
159
3,797
0.3% 16,478
Statistical Report 2011 - Quarter 4
Page 32 of 42
The Social Insurance Organization
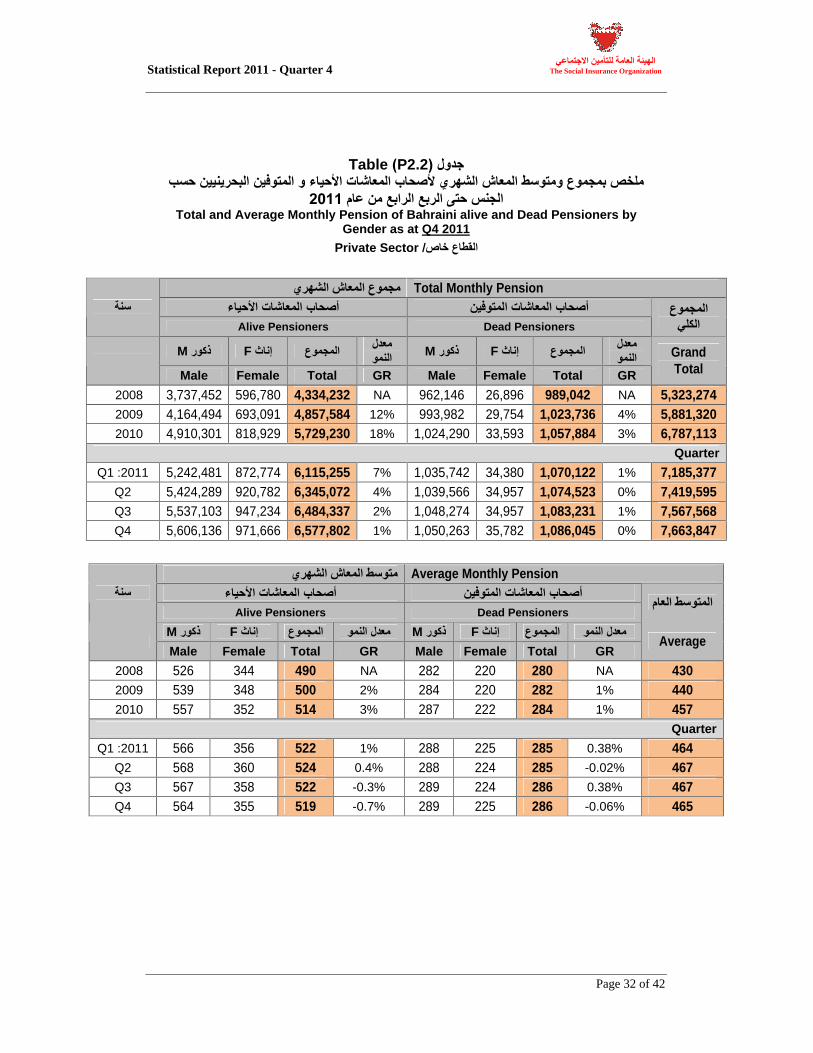
P2.2Table
Total and Average Monthly Pension of Bahraini alive and Dead Pensioners by
Gender as at Q4 2011
Private Sector
Total Monthly Pension
Alive Pensioners Dead Pensioners
M F
M F
Male Female Total GR Male Female
Total GR
Grand Total
2008 3,737,452
596,780
4,334,232
NA 962,146
26,896
989,042
NA 5,323,274
2009 4,164,494
693,091
4,857,584
12% 993,982
29,754
1,023,736
4% 5,881,320
2010 4,910,301
818,929
5,729,230
18% 1,024,290
33,593
1,057,884
3% 6,787,113
Quarter
2011Q1 5,242,481
872,774
6,115,255
7% 1,035,742
34,380
1,070,122
1% 7,185,377
Q2 5,424,289
920,782
6,345,072
4% 1,039,566
34,957
1,074,523
0% 7,419,595
Q3 5,537,103
947,234
6,484,337
2% 1,048,274
34,957
1,083,231
1% 7,567,568
Q4 5,606,136
971,666
6,577,802
1% 1,050,263
35,782
1,086,045
0% 7,663,847
Average Monthly Pension
Alive Pensioners Dead Pensioners
M F
M F
Male Female Total GR Male Female Total GR Average
2008 526
344
490
NA 282
220
280
NA 430
2009 539
348
500
2% 284
220
282
1% 440
2010 557
352
514
3% 287
222
284
1% 457
Quarter
2011Q1 566
356
522
1% 288
225
285
0.38% 464
Q2 568
360
524
0.4% 288
224
285
-0.02% 467
Q3 567
358
522
-0.3% 289
224
286
0.38% 467
Q4 564
355
519
-0.7% 289
225
286
-0.06% 465
Statistical Report 2011 - Quarter 4
Page 33 of 42
The Social Insurance Organization
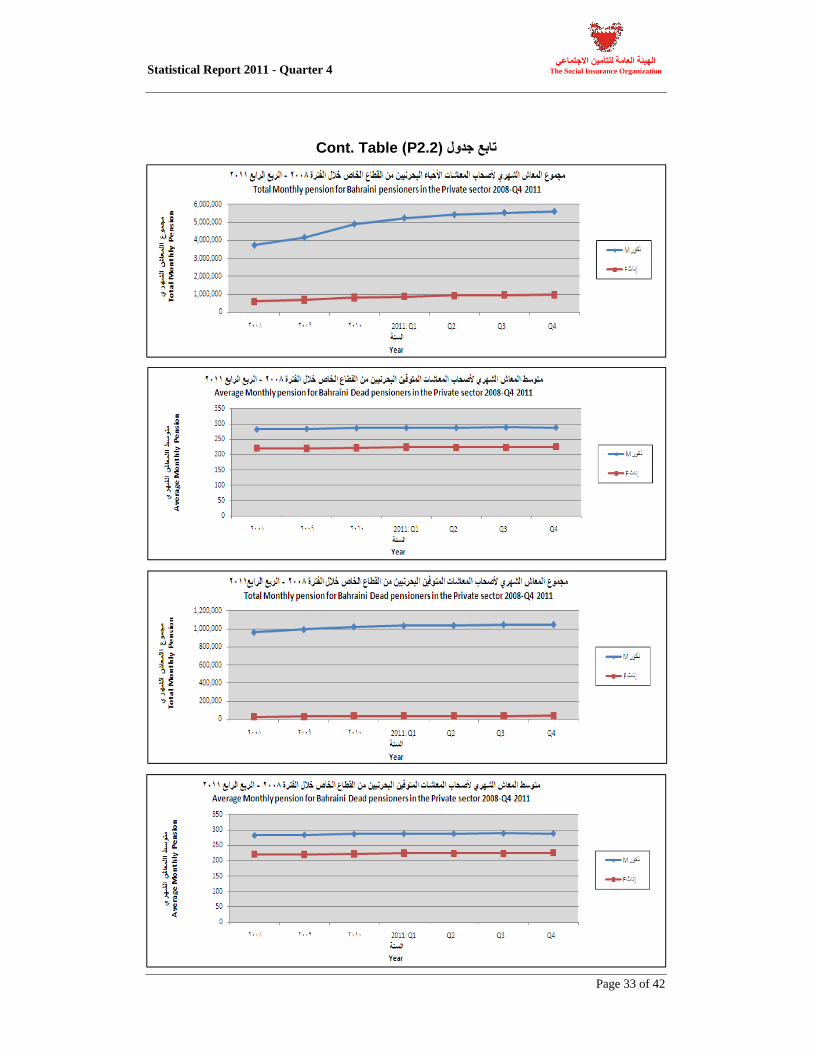
P2.2Cont. Table
Statistical Report 2011 - Quarter 4
Page 34 of 42
The Social Insurance Organization
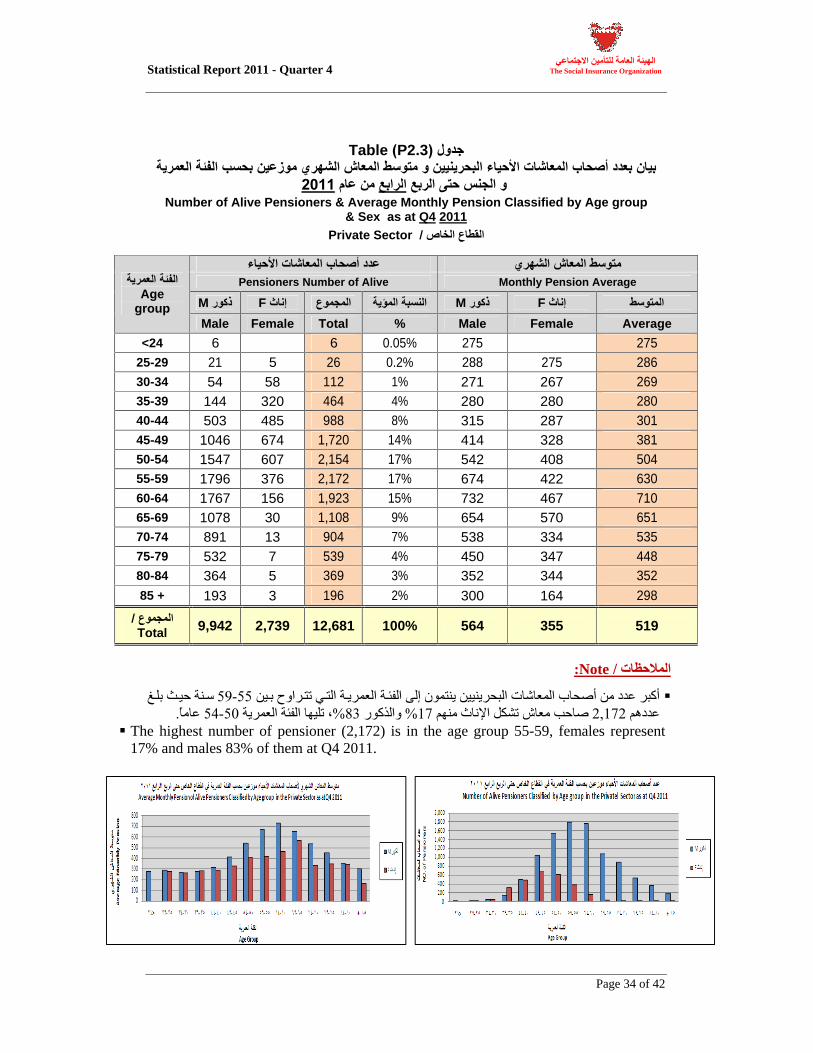
P2.3Table
Number of Alive Pensioners & Average Monthly Pension Classified by Age group
& Sex as at Q4
2011
SectorPrivate
Number of AlivePensioners AverageMonthly Pension
M F
M F
Age group
Male Female Total % Male Female Average
<24 6
6
0.05%
275
275
25-29 21
5
26
0.2%
288
275
286
30-34 54 58 112
1%
271 267 269
35-39 144 320 464
4%
280 280 280
40-44 503 485 988
8%
315 287 301
45-49 1046 674 1,720
14%
414 328 381
50-54 1547 607 2,154
17%
542 408 504
55-59 1796 376 2,172
17%
674 422 630
60-64 1767 156 1,923
15%
732 467 710
65-69 1078 30 1,108
9%
654 570 651
70-74 891 13 904
7%
538 334 535
75-79 532 7 539
4%
450 347 448
80-84 364 5 369
3%
352 344 352
85 + 193 3 196
2%
300 164 298
Total 9,942 2,739 12,681
100% 564 355 519
Note
The highest number of pensioner (2,172) is in the age group 55-59, females represent 17% and males 83% of them at Q4 2011.
Statistical Report 2011 - Quarter 4
Page 35 of 42
The Social Insurance Organization
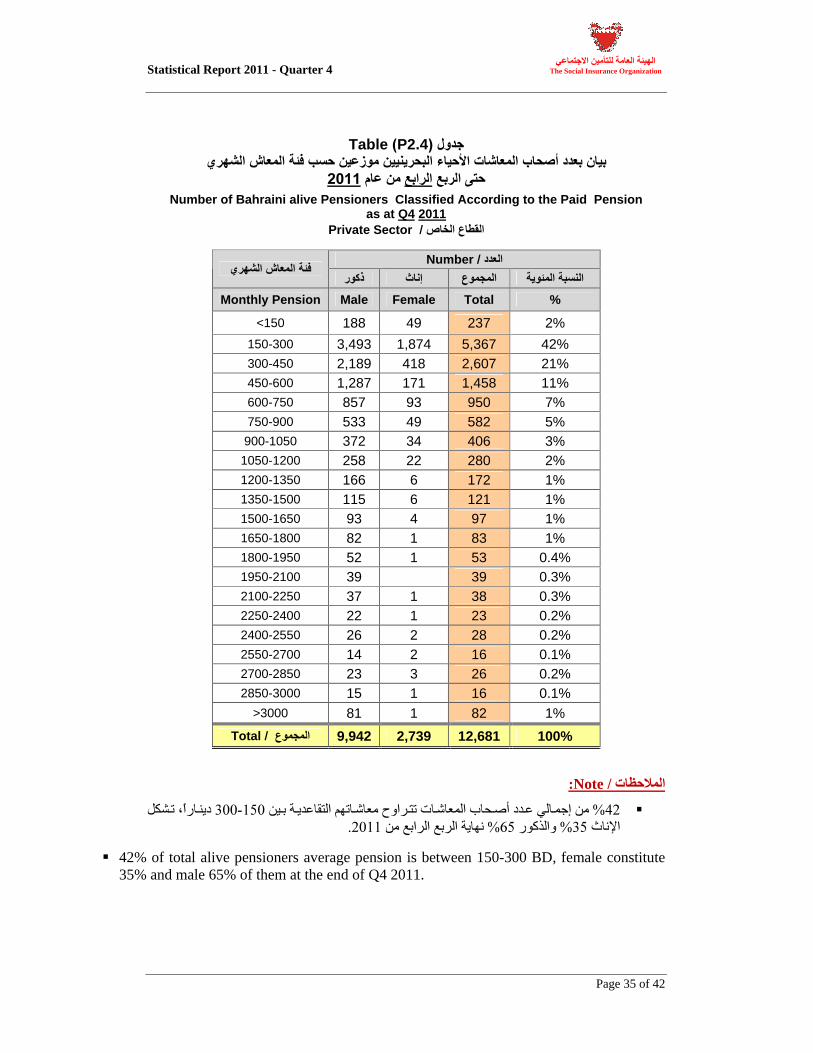
P2.4Table
Number of Bahraini alive Pensioners Classified According to the Paid Pension
as at Q4
2011
SectorPrivate
Number
Monthly Pension Male Female Total %
<150 188 49 237 2%
150-300 3,493 1,874 5,367 42% 300-450 2,189 418 2,607 21% 450-600 1,287 171 1,458 11% 600-750 857 93 950 7% 750-900 533 49 582 5% 900-1050 372 34 406 3% 1050-1200 258 22 280 2% 1200-1350 166 6 172 1% 1350-1500 115 6 121 1% 1500-1650 93 4 97 1% 1650-1800 82 1 83 1% 1800-1950 52 1 53 0.4% 1950-2100 39 39 0.3% 2100-2250 37 1 38 0.3% 2250-2400 22 1 23 0.2% 2400-2550 26 2 28 0.2% 2550-2700 14 2 16 0.1% 2700-2850 23 3 26 0.2% 2850-3000 15 1 16 0.1%
>3000 81 1 82 1%
Total 9,942 2,739 12,681 100%
Note
42% of total alive pensioners average pension is between 150-300 BD, female constitute 35% and male 65% of them at the end of Q4 2011.
Statistical Report 2011 - Quarter 4
Page 36 of 42
The Social Insurance Organization
Section P 3 Beneficiaries Statistics in the Private Sector
Contents
Table No Title
Page No
3
Beneficiaries Data
36
P3.1
Number, Total & average Monthly Pension of Beneficiaries by Gender 37
P3.2
Number of Beneficiaries Classified By Age Wise 39
P3.3
Number of Beneficiaries Classified By Monthly Pension 40
Statistical Report 2011 - Quarter 4
Page 37 of 42
The Social Insurance Organization
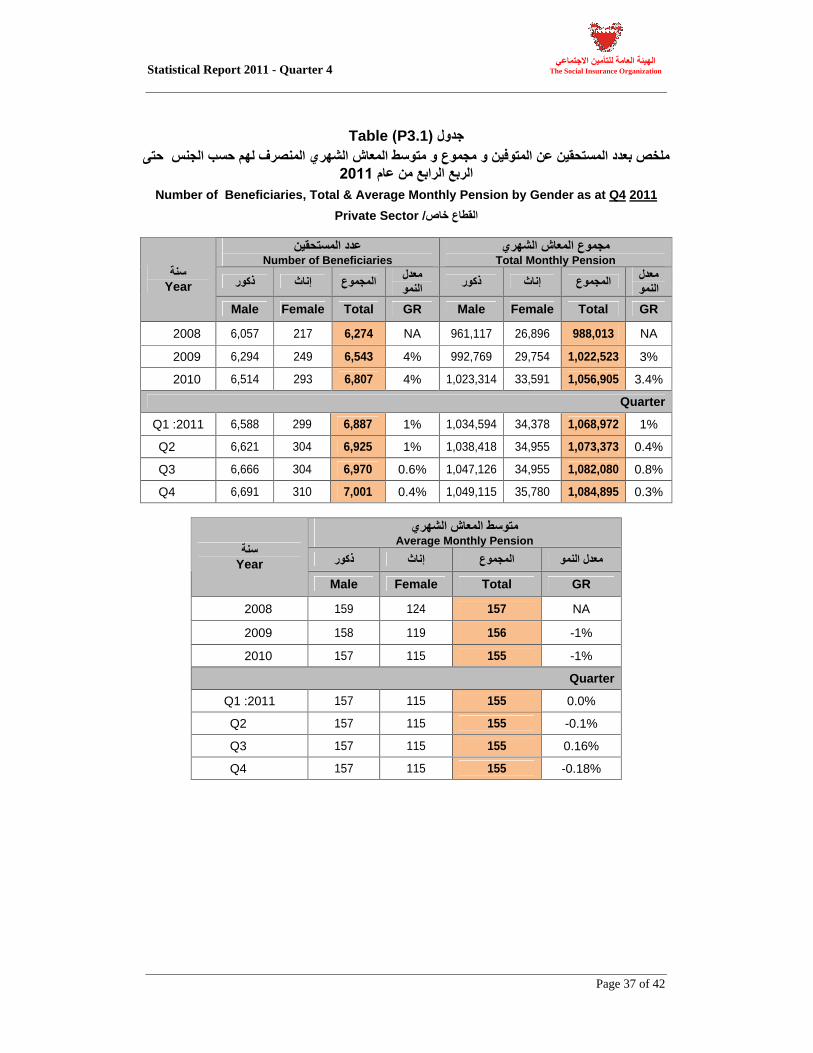
P3.1Table
Number of Beneficiaries, Total & Average Monthly Pension by Gender as at Q4
2011
Private Sector
Number of Beneficiaries
Total Monthly Pension
Year
Male Female Total GR Male Female Total GR
2008 6,057
217
6,274
NA 961,117
26,896
988,013
NA
2009 6,294
249
6,543
4% 992,769
29,754
1,022,523
3%
2010 6,514
293
6,807
4% 1,023,314
33,591
1,056,905
3.4%
Quarter
2011Q1 6,588
299
6,887
1% 1,034,594
34,378
1,068,972
1%
Q2 6,621
304
6,925
1% 1,038,418
34,955
1,073,373
0.4%
Q3 6,666
304
6,970
0.6% 1,047,126
34,955
1,082,080
0.8%
Q4 6,691
310
7,001
0.4% 1,049,115
35,780
1,084,895
0.3%
Average Monthly Pension
Year
Male Female Total GR
2008 159
124
157
NA
2009 158
119
156
-1%
2010 157
115
155
-1%
Quarter
2011Q1 157
115
155
0.0%
Q2 157
115
155
-0.1%
Q3 157
115
155
0.16%
Q4 157
115
155
-0.18%

Statistical Report 2011 - Quarter 4
Page 38 of 42
The Social Insurance Organization
P3.1Cont. Table
Statistical Report 2011 - Quarter 4
Page 39 of 42
The Social Insurance Organization
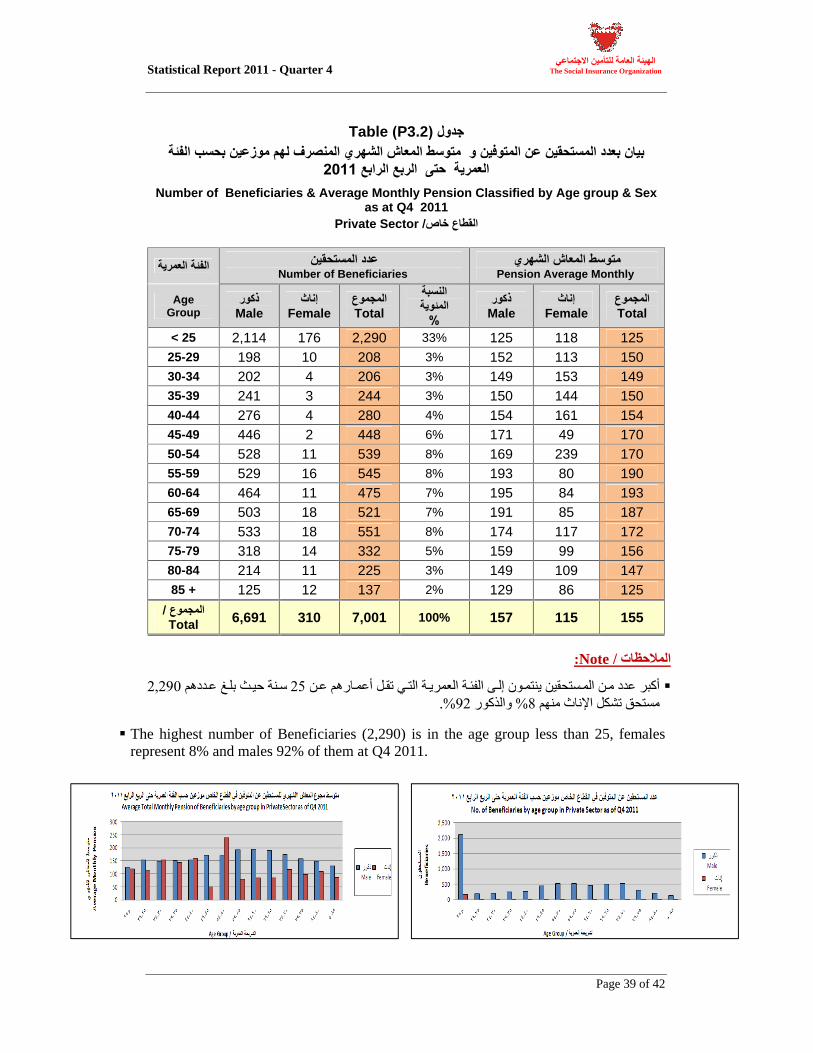
P3.2Table
Number of Beneficiaries & Average Monthly Pension Classified by Age group & Sex
as at Q4 2011 Private Sector
Number of Beneficiaries Average MonthlyPension
Age Group Male Female Total
Male Female Total
< 25 2,114 176 2,290 33% 125 118 125 25-29 198 10 208 3% 152 113 150 30-34 202 4 206 3% 149 153 149 35-39 241 3 244 3% 150 144 150 40-44 276 4 280 4% 154 161 154 45-49 446 2 448 6% 171 49 170 50-54 528 11 539 8% 169 239 170 55-59 529 16 545 8% 193 80 190 60-64 464 11 475 7% 195 84 193 65-69 503 18 521 7% 191 85 187 70-74 533 18 551 8% 174 117 172 75-79 318 14 332 5% 159 99 156 80-84 214 11 225 3% 149 109 147 85 + 125 12 137 2% 129 86 125
Total 6,691 310 7,001 100% 157 115 155
Note
.
The highest number of Beneficiaries (2,290) is in the age group less than 25, females represent 8% and males 92% of them at Q4 2011.
Statistical Report 2011 - Quarter 4
Page 40 of 42
The Social Insurance Organization
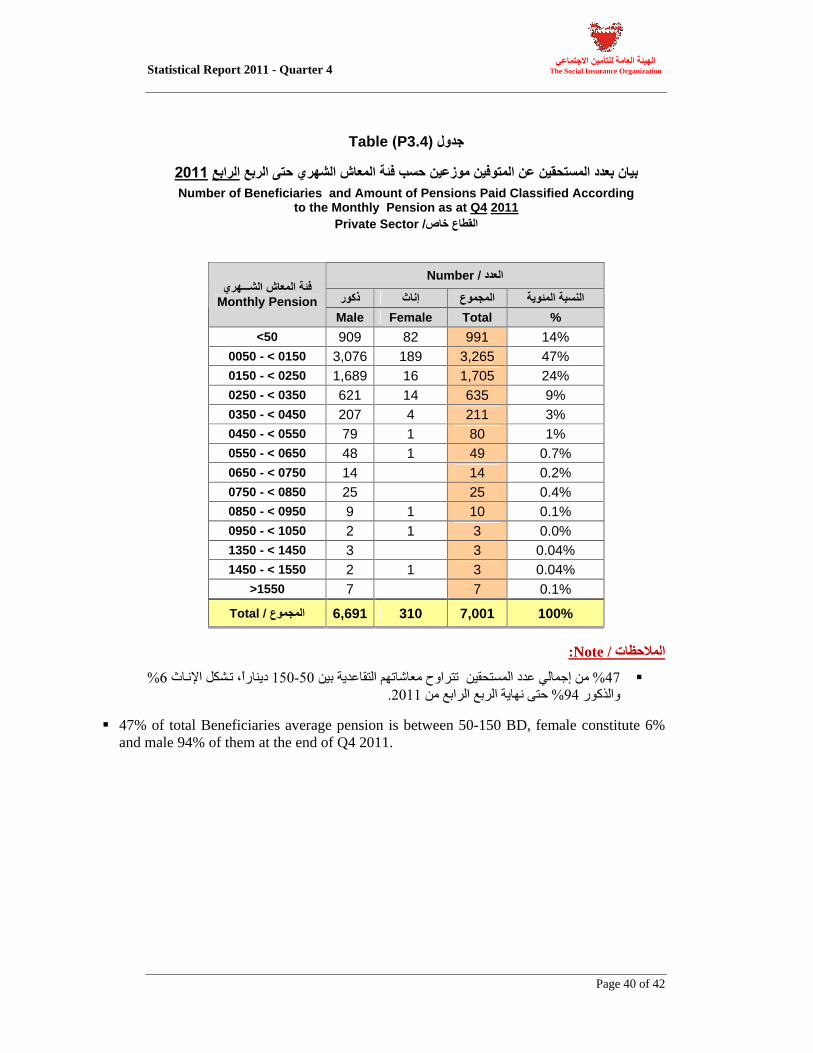
P3.4Table
Number of Beneficiaries and Amount of Pensions Paid Classified According
to the Monthly Pension as at Q4
2011
Private Sector
Number
Monthly Pension Male Female Total %
<50 909 82 991 14% 0050 - < 0150 3,076
189 3,265 47% 0150 - < 0250 1,689
16 1,705 24% 0250 - < 0350 621 14 635 9% 0350 - < 0450 207 4 211 3% 0450 - < 0550 79 1 80 1% 0550 - < 0650 48 1 49 0.7% 0650 - < 0750 14 14 0.2% 0750 - < 0850 25 25 0.4% 0850 - < 0950 9 1 10 0.1% 0950 - < 1050 2 1 3 0.0% 1350 - < 1450 3 3 0.04% 1450 - < 1550 2 1 3 0.04%
>1550 7 7 0.1%
Total 6,691
310 7,001 100%
Note
47% of total Beneficiaries average pension is between 50-150 BD, female constitute 6% and male 94% of them at the end of Q4 2011.
Statistical Report 2011 - Quarter 4
Page 41 of 42
The Social Insurance Organization
Statistical Report 2011 - Quarter 4
Page 42 of 42
The Social Insurance Organization
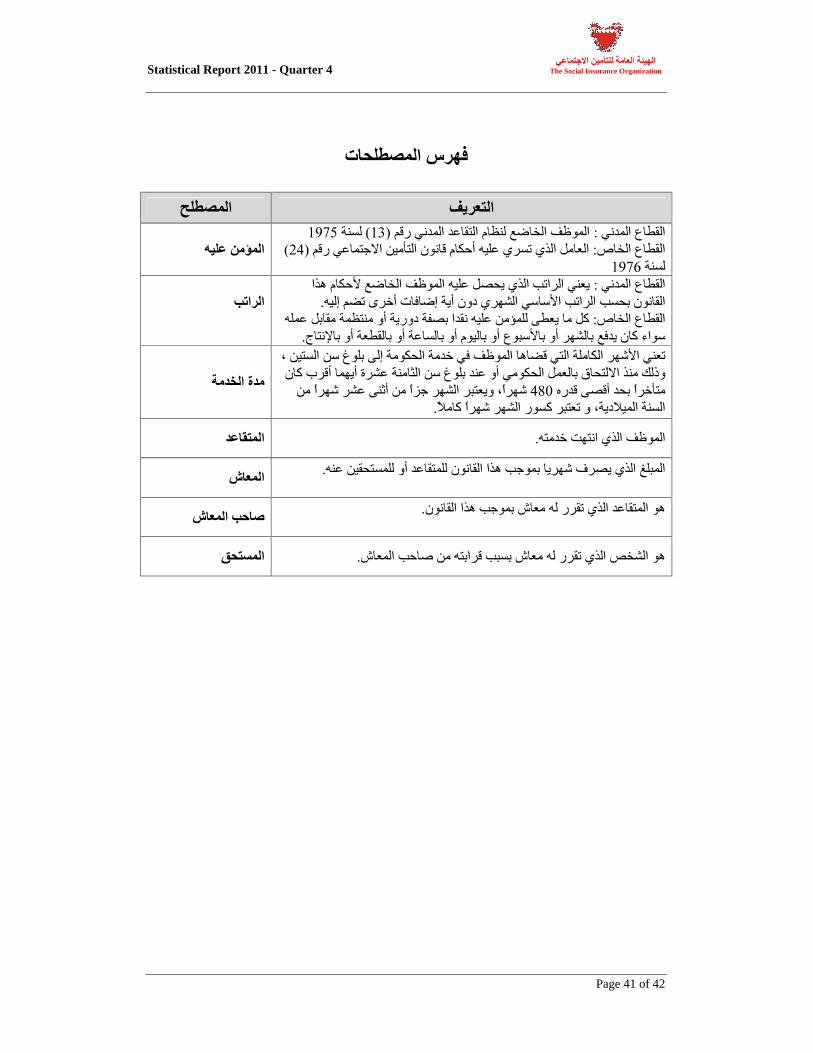
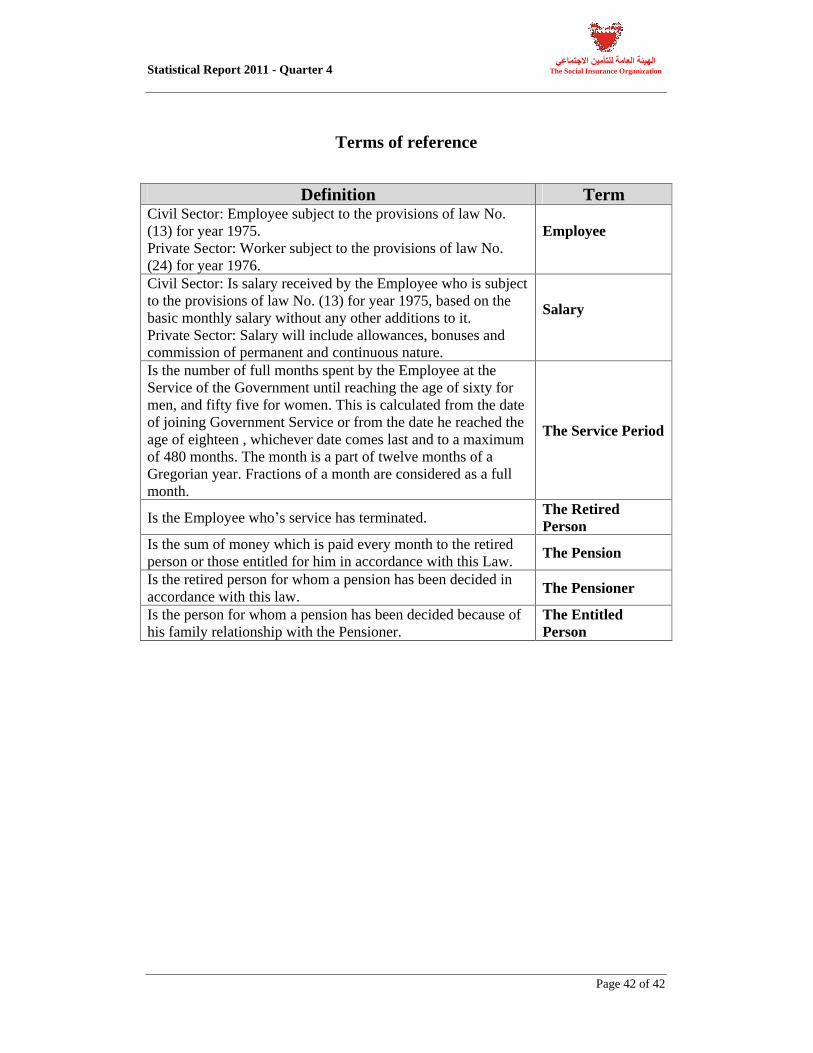
Terms of reference
Definition Term Civil Sector: Employee subject to the provisions of law No. (13) for year 1975.
Private Sector: Worker subject to the provisions of law No. (24) for year 1976.
Employee
Civil Sector: Is salary received by the Employee who is subject to the provisions of law No. (13) for year 1975, based on the basic monthly salary without any other additions to it.
Private Sector: Salary will include allowances, bonuses and commission of permanent and continuous nature.
Salary
Is the number of full months spent by the Employee at the Service of the Government until reaching the age of sixty for men, and fifty five for women. This is calculated from the date of joining Government Service or from the date he reached the age of eighteen , whichever date comes last and to a maximum of 480 months. The month is a part of twelve months of a Gregorian year. Fractions of a month are considered as a full month.
The Service Period
Is the Employee who s service has terminated.
The Retired Person
Is the sum of money which is paid every month to the retired person or those entitled for him in accordance with this Law.
The Pension
Is the retired person for whom a pension has been decided in accordance with this law.
The Pensioner
Is the person for whom a pension has been decided because of his family relationship with the Pensioner.
The Entitled Person