Embed Size (px)
Citation preview

Journal of Sedimentary Research, 2010, v. 80, 184–192
Research Article
DOI: 10.2110/jsr.2010.020
STATISTICAL CHARACTERIZATION OF GRAIN-SIZE DISTRIBUTIONS IN SANDY FLUVIAL SYSTEMS
ELIZABETH A. HAJEK,*1 SNEHALATA V. HUZURBAZAR,2 DAVID MOHRIG,3 RANIE M. LYNDS,1 AND PAUL L. HELLER1
1University of Wyoming, Department of Geology and Geophysics, 1000 East University Avenue, Laramie, Wyoming 82071, U.S.A.2University of Wyoming, Department of Statistics, 1000 East University Avenue, Laramie, Wyoming 82071, U.S.A.
3Jackson School of Geosciences, Department of Geological Sciences, 1 University Station C1100, Austin, Texas 78712-0254, U.S.A.
e-mail: [email protected]
ABSTRACT: Measured particle-size distributions are commonly reduced to one characteristic value (e.g., median graindiameter) that is used in sediment transport modeling and other analyses. These values are often interpolated from empiricaldistributions or from fitted distributions, usually assuming that observed grain-size populations are adequately represented byGaussian or Normal distributions. In order to investigate the implications of this approach, we (1) statistically characterizegrain-size distributions in samples of bed-material load, suspended load, and slackwater deposits from the sand-beddedCalamus, North Loup, and Niobrara rivers (Nebraska, USA), and (2) explore the potential impact of misfitting distributions onestimating percentile grain diameters. Although log-normal distributions are commonly used to characterize complete grain-size distributions in sedimentary systems, in this study, samples of transported sediment are best modeled with log-hyperbolicdistributions, and slackwater deposits are best fitted by mixtures of distributions. Despite large overlaps in the grain sizes ofbed-material-load and suspended-load samples, estimated parameters of fitted log-hyperbolic distributions show consistentdifferences between these samples across all rivers. Samples of bed-material load have higher modes and positive (coarse-grained) asymmetry, whereas suspended-load samples have lower modes and weaker asymmetry. Because it is has a generalform, the log-hyperbolic distribution should adequately characterize unimodal grain-size samples because its parameters canyield both normal-shaped distributions as well as asymmetric distributions. In all three rivers, slackwater deposits contain theentire range of grain sizes present in suspension as well as a significant component of very fine-grained (, 0.02 mm) materialthat is not present in suspended-sediment samples. This suggests some degree of fractionated deposition of suspended sedimentin areas of near-zero flow velocities. Ultimately, fitting parametric grain-size distributions to grain-size data can be a usefulway to find effective particle-size values for use in sediment transport modeling and other studies. However, particularly withasymmetric grain-size distributions, fitting log-normal distributions to data may result in errors of estimated percentile grainsizes, which should be considered in studies relying on characteristic grain-diameter values.
INTRODUCTION
The distribution of grain sizes in sedimentary systems is largely afunction of the distribution of available sediment and sediment-transportprocesses that sort and redistribute particles. In most sediment transportmodeling full particle-size distributions are commonly reduced to onecharacteristic value (e.g., median or 95th percentile grain diameter; D50and D95, respectively). Percentile grain diameters are often estimatedfrom empirical distributions either by linearly interpolating betweenweight percents of measured bin sizes or by using probability-basedmethods which are often based on normal distributions. An alternative tointerpolating between measured bin weight percents is to fit a parametricdistribution to empirical data and, for example, estimate D50 directlyfrom the fitted distribution. The goals of this study are to (1) characterizegrain-size distributions (GSDs) from three modern rivers in order tounderstand how GDSs vary within and between sandy river systems anddetermine which parametric distributions best describe empirical data,
and (2) explore the potential impact of misfitting distributions onestimating percentile grain diameters.
Understanding how GSDs relate to sediment transport and deposition in
different settings is important both in modern systems and ancient deposits.
Advances in analytical particle-size measurement have increased descrip-
tive capabilities, while improved computing power has expandedpractically available statistical models for data (Fieller et al. 1992). Work
focused specifically on statistically characterizing GSDs in various
sedimentary systems has resulted in differences with respect to which
distributions best describe samples from different environments (Ghosh
and Mazumder 1981; Fieller et al. 1984; Hartmann and Christiansen 1992;Sutherland and Lee 1994). For example, some authors have proposed that
fluvial grain-size distributions can be sufficiently approximated by a log-
normal distribution (e.g., Kothyari 1995; Kranck et al. 1996a, 1996b;
Purkait 2002). In contrast, other work has shown that other distributions,
including log-skew-Laplace and log-hyperbolic distributions, fit somesediment samples better than log-normal distributions (e.g., Barndorff-
Nielsen et al. 1982; Fieller et al. 1984; Flenley et al. 1987; Fieller et al. 1991;
Fieller et al. 1992). While some have proposed explanations for why certain
parametric distributions fit better than others (e.g., Ghosh and Mazumder* Present address: University of Minnesota, St. Anthony Falls Lab, 23rd
Avenue SE, Minneapolis, Minnesota 55414, U.S.A.
Copyright E 2010, SEPM (Society for Sedimentary Geology) 1527-1404/10/080-184/$03.00
1981; Ghosh et al. 1981), the underlying causes are unknown, in partbecause of a lack of quantitative studies on the subject, and differences instrategies for sediment sampling, measuring, and statistical analysis. Inaddition to fitting parametric distributions to grain-size data, nonpara-metric methods, including inverse modeling (e.g., Weltje and Prins 2007),can be used to describe and interpret GSDs. Here we focus on usingparametric methods to characterize GSDs.
In an effort to better understand how GSDs can vary within andbetween sandy river systems, we statistically characterize sedimentsamples from three modern rivers in central Nebraska, USA. Samplesof bed-material load, suspended load, and slackwater deposit werecollected from the Niobrara, North Loup, and Calamus rivers. Grainsizes between 0.001 and 30 mm for each sample were measured with aHoriba LA-300 laser particle-size analyzer and Retsch Technology digitalimage-processing particle-size analyzer, and statistical GSDs weremodeled using the program ShefSize (Robson et al. 1997). Samples ofbed-material load and suspended load show unimodal distributions bestfitted by log-hyperbolic models, and estimated parameters from fittedlog-hyperbolic distributions provide useful comparisons of sedimentsamples within and between rivers. These results differ from those ofprevious studies where fluvial sediments were found to be fitted best bylog-normal distributions (e.g., Kothyari 1995; Kranck et al. 1996a, 1996b;Purkait 2002). Slackwater deposits have distributions with a relativelyabundant fine-grained (, 0.02 mm) fraction and are best modeled bymixture distributions. These samples have finer-grained modes thansuspended-sediment samples, suggesting that the relationship betweensuspended load and suspended-load deposits is more complex thansuggested in previous studies (e.g., Ghosh et al. 1986).
To demonstrate the potential effect of mischaracterizing GSDs,simulated distributions were generated from log-hyperbolic distributionswith a range of asymmetry parameters observed in the data presented inthis study. Percentile grain diameters (D5, D10, D50, D90, D95) areestimated from log-normal distributions fitted to the simulated data. Forlog-hyperbolic distributions with moderate negative and positive asym-metry values, the D50 estimated from fitted log-normal distributionsactually represents the D41 and D59, respectively, of the simulated data.Misfits also occur in one tail of asymmetric distributions where log-normal estimates of D10 and D90 actually represent the D2 and D97,respectively, for positively and negatively asymmetrical simulated data.Whether these errors are significant depends the objectives of a particularstudy, but the potential for misestimation of percentile grain diametersshould be an important consideration for sediment transport modeling orother studies relying on characteristic grain diameters.
STUDY AREAS AND METHODS
Sediment samples were collected from the Niobrara, North Loup, andCalamus rivers in east-central Nebraska (Fig. 1) during the summer of2004. These rivers are similar in overall setting and scale but provide somedifferences to be compared. For example, the rivers have similar overall
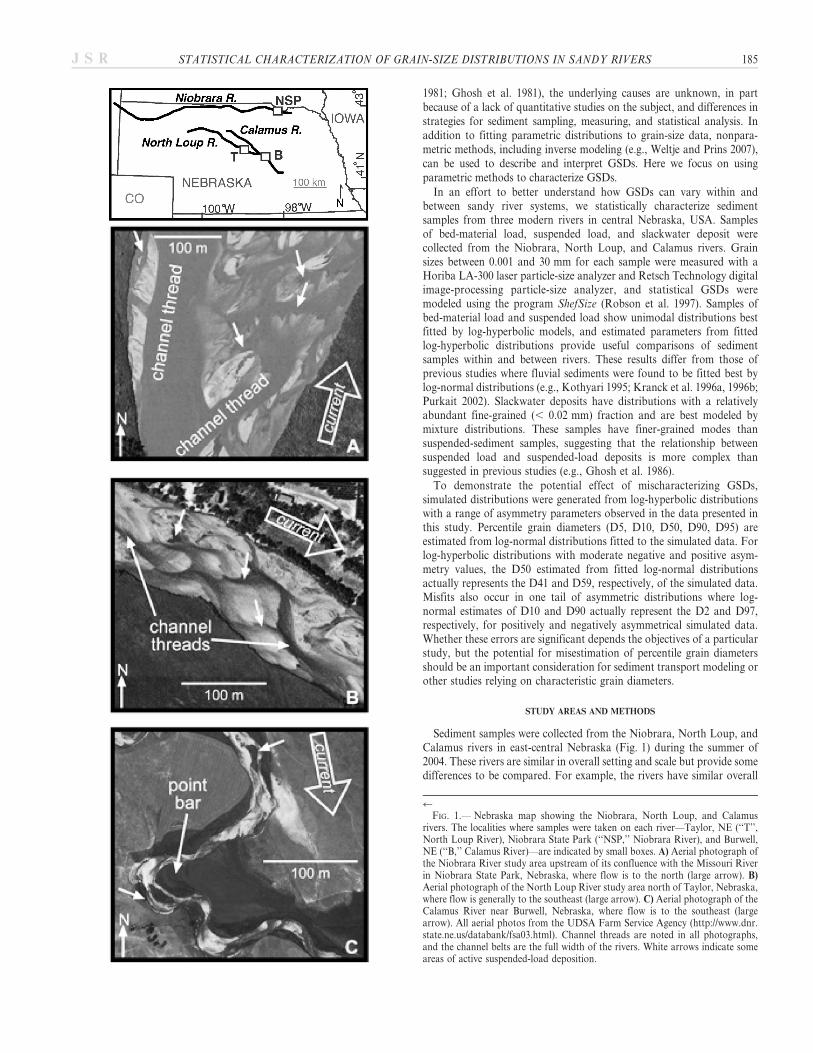
rFIG. 1.— Nebraska map showing the Niobrara, North Loup, and Calamus
rivers. The localities where samples were taken on each river—Taylor, NE (‘‘T’’,North Loup River), Niobrara State Park (‘‘NSP,’’ Niobrara River), and Burwell,NE (‘‘B,’’ Calamus River)—are indicated by small boxes. A) Aerial photograph ofthe Niobrara River study area upstream of its confluence with the Missouri Riverin Niobrara State Park, Nebraska, where flow is to the north (large arrow). B)Aerial photograph of the North Loup River study area north of Taylor, Nebraska,where flow is generally to the southeast (large arrow). C) Aerial photograph of theCalamus River near Burwell, Nebraska, where flow is to the southeast (largearrow). All aerial photos from the UDSA Farm Service Agency (http://www.dnr.state.ne.us/databank/fsa03.html). Channel threads are noted in all photographs,and the channel belts are the full width of the rivers. White arrows indicate someareas of active suspended-load deposition.
STATISTICAL CHARACTERIZATION OF GRAIN-SIZE DISTRIBUTIONS IN SANDY RIVERS 185J S R

sediment loads (dominantly sand-sized), but two have much sandiersource areas than the other. Additionally, these rivers span a range ofmean annual discharges from , 8 to almost 50 m3/s, and two of therivers are braided and one meandering.
The Niobrara is a braided river (Fig. 1A) that originates in east-centralWyoming, flows eastward across northern Nebraska, and terminates atthe Missouri River at the study area near Niobrara, Nebraska (Fig. 1).Sediment sources include Miocene and Pliocene continental deposits inwestern Nebraska and the Cretaceous Pierre Shale and Niobrara Chalk ineastern Nebraska (Watkins and Diffendal 1997). The Niobrara Rivermaintains year-round base flow (Bristow et al. 1999) because it derivesmost of its discharge from groundwater (Bleed 1990). The mean annualdischarge of the Niobrara River near Verdel, Nebraska (20 km upstreamof the study locality) from 1959 through 2007 was 49 m3/s (http://waterdata.usgs.gov/ne/nwis/rt).
The North Loup River has a braided planform (Fig. 1B) and is sourcedin the Sand Hills of central Nebraska, making it a particularly sandybraided river. The river was studied near the town of Taylor, Nebraska(Fig. 1). The mean annual discharge at the study location from 1938through 2007 was 14 m3/s (http://waterdata.usgs.gov/ne/nwis/rt).
The Calamus River, like the North Loup River, is sourced in andentirely confined to the Sand Hills of central Nebraska. On the studiedreach, upstream of the Calamus Reservoir near the town of Burwell,Nebraska, the Calamus River is primarily a sinuous single-thread sand-bedded channel with infrequent mid-channel bars (Fig. 1C). The CalamusRiver has been interpreted as containing braided reaches (Bridge et al.1998) but is single thread in the study locality. The sinuosity of theCalamus River in the study area is 1.8. The mean annual discharge on theCalamus River recorded at the Burwell gauging station from 1941 to 1994was 8.4 m3/s (http://waterdata.usgs.gov/ne/nwis/rt), recording highestdischarges during the spring months.
Sediment Sampling
Sediment sampling for this study was designed to capture the distributionof grain sizes being transported in the mobile bed and in suspension of eachriver, and also of sediment accumulating in areas of near-zero flow velocity(slack water) within active channels. After collection, all samples wereallowed to settle in the sample container, the water was decanted, and thesediment was placed into plastic bags for storage.
Samples of bed-material load were collected from the mobile channelbed as grab samples from active ripples (Fig. 2A), dunes, planar beds, andantidunes. Grab samples of mobile bed material were skimmed directlyfrom the bed surface into a plastic sample container. These samplesinclude sediment transported solely along the bed as well as suspendedmaterial that was temporarily resting on the bed and/or trappedinterstitially amongst bedload particles.
Suspended-load samples were collected with a wading-type suspended-sediment sampler, US DH-48. The sampler is 33 cm long, consists ofstreamlined aluminum casting, and holds a plastic 0.47-liter samplecontainer. Suspended sediment was collected from several locations in thehigh-velocity cores of the modern rivers: at roughly 0.2 times flow depthbeneath the water surface and at 10 cm downstream from dune or barcrests at the submerged elevation of the crestline. These particularlocations were selected in an effort to normalize for spatial variations insuspended-sediment size and concentration within the rivers due to flowdepth and proximity to bedforms. In some cases the sampler did not catchenough sediment for analysis, so the processes was repeated a maximumof three times in the same location.
Slackwater deposits were sampled from areas within the active riverchannel with locally zero or near-zero flow velocities where fine-grainedsuspended sediment was accumulating (Fig. 2B, C). Samples werecollected in plastic sample containers by skimming the upper , 1 cm
FIG. 2.— Examples of sediment collected along the North Loup River nearTaylor, NE. A) Active ripples composed of sediment transported on the bed in theNorth Loup River. Flow direction is to the right, and flow depth is approximately2 cm. B) The lee side of this bar in the Calamus River is sheltered from strongcurrents, resulting in extremely low to zero flow velocities and the deposition of thesuspended load into the interbar area (, 1.7-m-tall person is standing in center ofinterbar area). C) Active suspended-sediment deposition in the North Loup Rivernear Taylor, Nebraska. The sandy barform on bottom and right side ofphotograph is migrating downstream to the upper right. Suspended sediment isdeposited and reworked as trains of climbing ripples on the downstream side of thebarform (dark area, upper left; , 0.7 m water depth).
186 E.A. HAJEK ET AL. J S R

of sediment from the river bottom in areas with suspended sedimentdeposits with thicknesses in excess of , 10 cm.
In addition to the goal of characterizing the GSDs associated with bed-load and suspended-load transport modes in the rivers, this samplingstrategy was chosen so that modern data were collected in such a way thatanalogous material could be sampled from ancient outcrop or subsurfacedeposits for future comparisons. For example, samples of ancient bed-material load could be collected from preserved ripple or dune cross beds,and intrachanel slackwater deposits (Lynds and Hajek 2006) could besampled and potentially used as a proxy for ancient suspended sedimentloads.
Sample Preparation
All samples were dried by air or in a drying oven. Nearly half thesamples contained significant amounts of organic material. The organicmatter was removed by placing the sample in a beaker with twice thevolume of water as sediment, and a 2:1 ratio of water to 30% hydrogenperoxide. The beaker with sediment, water, and hydrogen peroxide wasplaced under a fume hood on a hot plate at 40uC and allowed to boil untildry. In a few cases this process was repeated twice to remove all theorganic material.
All bed-material-load samples and some slackwater-deposit samples weredivided into two populations sieved at 90 mm in preparation for subsequentgrain-size measurement. Samples were sieved for approximately 15 minuteswith a Ro-tap. The coarse-grained (. 0.09 mm) and fine-grained(, 0.09 mm) fractions were individually weighed and placed in plastic bags.
Grain-Size Assessment
In order to fully measure the wide range of grain sizes present in thesamples, a Horiba LA-300 laser particle-size analyzer (LPSA) was used tomeasure the fine-grained (, 0.09 mm) fraction of each sediment sample,and the coarse-grained material (. 0.09 mm) was analyzed using aRetsch Technology digital image-processing particle-size analyzer (CAM-SIZER). The LPSA uses a diode laser to measure grain sizes from 0.001to 0.1 mm in diameter, and the CAMSIZER uses digital photographicimages to measure grain sizes ranging from 0.05 to 30 mm in diameter,providing excellent characterization of the fine and coarse tails of thedistribution, respectively. Both machines measure distributions as massfraction of the sample, so the full grain-size distributions reported hereinare the weighted average of the fine- and coarse-grained measurements.
STATISTICAL CHARACTERIZATION
Normal distributions are common in natural processes, and GSDs areoften presumed to follow normal distributions in log scale (Middleton1970). The log-normal distribution is a specific sub-case of the moregeneral log-hyperbolic distribution. Barndorff-Nielsen (1977) formalizedstatistical modeling of GSDs by developing the hyperbolic family ofdistributions and using them to characterize data from eolian sedimentdeposits documented by Bagnold (1954). The log-hyperbolic distributionplots as a hyperbola on a log-log scale and so can reflect varying degreesof asymmetry, unlike the log-normal distribution, which plots as aparabola and is limited to being symmetrical. For this reason, the log-hyperbolic distribution can better represent asymmetry or skewnessexhibited by many empirical GSDs.
The log-hyperbolic probability density function for x as the natural logof grain size is given by
g(xjp,f,d,m)~
expf{f½ffiffiffiffiffiffiffiffiffiffiffiffi1zp2p ffiffiffiffiffiffiffiffiffiffiffiffiffiffiffiffiffiffiffiffiffiffiffi
1z(x{m
d)2
r{p(
x{m
d)�g
f2dffiffiffiffiffiffiffiffiffiffiffiffi1zp2p
K1(f)gð1Þ
for x e R, where K1(.) is the modified Bessel function of the third kind.The parameters are p e R indicating the asymmetry of the distribution,f . 0 indicating the peakedness, and the location and scale parameterare given by m e R and d . 0, respectively. The case when this generaldistribution approaches the log-normal distribution occurs when p 5 0,f R s2 as d R 0 where s2 is the variance of the normal. Another specialcase, the log-skew-Laplace distribution, is defined when p ? 0 andd R 0, and this distribution plots as a pair of intersecting lines in log-logspace.
Several studies have shown examples of log-hyperbolic or log-skew-Laplace GSDs in natural systems. Bagnold and Barndodrff-Nielsen(1980) present examples of various samples, including river-bedsediments, that are best characterized by the log-hyperbolic distribution.Barndorff-Nielsen et al. (1982) used the log-hyperbolic distribution toexamine variation in grain size in a sequence of sand samples along aneolian dune, as did Sutherland and Lee (1994) in their characterization ofHawaiian beach sands. The log-skew-Laplace distribution was found tobe the best model for littoral sands from the Hebrides (Fieller et al. 1992)and Libyan eolian sediments (Flenley et al. 1987).
In all these examples, as well as in this and most other grain-sizestudies, data are grouped into classes of grain sizes. Furthermore, theexact number of grains in each class is not available, rather the weightpercent of the sample within each class is recorded. Given the unknownnumber of grains in each class and in the total sample, in statisticalanalysis the likelihood function in the estimation procedure is replacedwith the likeness function (Barndorff-Nielsen 1977).
For this study, we use ShefSize (Robson et al. 1997), a statisticalprogram developed to fit the log-hyperbolic, log-skew-Laplace, log-normal, and mixtures of two log-skew-Laplace distributions to eachsample. When fitting distributions, we follow Fieller et al. (1992) and usea modified chi-squared-type statistic called Ncrit for comparing models:
Ncrit~x2
t;0:95Pk1 fri{pi(h)g2=pi(h)
ð2Þ
where k is the number of grain-size classes, m is the number of estimatedparameters for a distribution (e.g., two for log normal and four for loghyperbolic), t 5 k 2 m 2 1, ri is the observed weight percent in the ithclass, pi is the estimated probability (or estimated weight percent) of theith class, and h contains the parameters for the fitted distribution. Largervalues of Ncrit indicate better model fit. Presently the log-hyperbolic, logskew-Laplace, log normal, and mixtures of two log skew-Laplace are theonly distributions available to fit in ShefSize, and they are sufficient foran exploratory analysis of the data.
RESULTS
Model Fitting
Across all three rivers, bed-load and suspended-load samples showsingle-peak distributions whereas slackwater deposits have a significantfine-grained tail (Fig. 3). In Table 1 we present information on thebest-fitting distribution from the four available using ShefSize. Ingeneral, bed-material-load and suspended-sediment samples are bestfitted using a log-hyperbolic distribution, with a portion of the samplesbeing better fitted by log-skew-Laplace distributions and log-hyperbolicdistributions, respectively. Slackwater-deposit samples tend to be multi-modal and are better fitted using a mixture of two log-Laplacedistributions.
Unimodal Distributions: Estimated Parameters
Estimated parameters from fitted log-hyperbolic distributions showconsistent differences between grain-size distributions within and between
STATISTICAL CHARACTERIZATION OF GRAIN-SIZE DISTRIBUTIONS IN SANDY RIVERS 187J S R

rivers. Estimated mode values for bed-material-load samples are, ingeneral, higher than those of suspended-sediment samples within eachriver (Fig. 4). Likewise, the North Loup River has the highest averagebed-material-load modes as well as the highest average suspended-loadmodes. Estimated asymmetry parameters (Fig. 5) also show differencesbetween bed-material-load and suspended-load deposits, where bedloadsamples tend to be skewed toward coarser-grained sediment andsuspended-load samples tend to be symmetric or slightly skewed towardfiner-grained particles.
Mixture Distributions
All slackwater-deposit samples were better fitted by mixtures of twolog-skew-Laplace distributions than by any single distribution. This islikely because of the significant fine-grained tail present in these samples.Currently, there are no available routines for fitting mixtures of log-hyperbolic models to weighted GSDs; however, once these are coded, itwill be worth exploring whether mixed log-hyperbolic distributionsprovide a better fit than mixtures of log-skew Laplace distributions.
TABLE 1.—Summary of best-fitting distributions for each sample type from each river. Log-hyperbolic distributions fit unimodal bed-material-load andsuspended-load samples best, whereas slackwater-deposit samples are best fitted with a mixture of two distributions. Special-case log-hyperbolic column
summarizes the number of samples best fitted with either log-normal distributions (‘‘L. Norm.’’) or log-skew-Laplace distributions (‘‘L.S.L.’’).
Sample Type Total Samples Log Hyperbolic Special Case Log Hyperbolic Mixture Distribution
Bed Load
Calamus 20 12 (60%) 4 (20%) – L.S.L. 4 (20%)Niobrara 33 27 (82%) 5 (15%) – L.S.L. 1 (3%)North Loup 14 9 (64%) 5 (36%) – L.S.L. 0
Suspended Sediment
Calamus 12 8 (67%) 3 (25%) – L. Norm. 1 (8.3 %)Niobrara 18 17 (94%) 1 (6%) – L. Norm. 0North Loup 9 7 (78%) 2 (22 %) – L. Norm. 0
Slackwater Deposits
Calamus 14 0 1 (7%) – L.S.L. 13 (93%)Niobrara 6 0 0 6 (100%)North Loup 7 2 (29%) 0 5 (71%)
FIG. 3.—Sample grain-size distributions for each river plotted on log-log scale. Vertical light-gray lines on each plot designate grain-size breaks between, from left toright, clay/silt, silt/sand, and sand/gravel. Bed-material and suspended-load samples show unimodal distributions, whereas slackwater deposits have a noticeable fine-grained tail.
188 E.A. HAJEK ET AL. J S R

DISCUSSION
Modeling Grain-Size Distributions
Efforts made to characterize GSDs are largely motivated by a desire tomodel and predict relationships between different grain-size populations(e.g., bed sediment load vs. suspended material) and understand theinfluence of grain-size distributions on sediment transport, and vice versa.Previous studies of GSDs and sediment transport and deposition havecommonly assumed normal distributions on a log scale (e.g., Kranck etal. 1996a, 1996b; Purkait 2002, 2006). Other studies have shown grain-sizedistributions that are not best fitted by log-normal distributions(Barndorff-Nielsen et al. 1982).
Much of this previous work focused on fitting log-normal distributionsbecause, computationally, fitting other distributions was extremelydifficult (Fieller et al. 1992). This is no longer a limitation, and freewareprograms such as ShefSize provide tools for sedimentologists to easily fitdistributions to sample data, compare goodness-of-fit for differentdistributions, and estimate distribution parameters.
Empirical relationships between, for example, bed material andsuspended material or sorting and river slope (Kothyari 1995) based onpresumed log-normality may be insufficient to characterize the variabilityof sediment distributions in natural systems. In particular, relationshipsof mode and variance used in models may be inconsistent for highlyskewed or asymmetric samples, as well as samples showing mixturedistributions. Having the full suite of parameters derived from fitting thelog-hyperbolic distribution provides a good basis for statistical compar-ison and modeling (Hartmann and Flemming 2002).
Log-Normal vs. Other Unimodal Distributions.—The reasons whyparticular deposits are best characterized by log-hyperbolic rather thanlog-normal distributions remain unclear. For example, Purkait andMazumder (2000) suggest that transport distance can transformoriginally log-hyperbolic samples into log-normal distributions—evenon the scale of individual barforms. In this study, however, multiplesamples from a variety of locations within reaches of three riversconsistently show log-hyperbolic distributions in both bed-material loadand suspended load, regardless of position within channels or along bars.
In general, the log-hyperbolic distribution should provide a good fit tomost samples, inasmuch as even log-normal distributions can beparameterized using log-hyperbolic distributions. In this study the resultthat some suspended-sediment samples are better fitted by log-normaldistributions (Table 1) is probably due to the tendency for these samplesto be symmetrical (Fig. 5), whereas the log-skew-Laplace function bettercaptures the asymmetry exhibited by some of the bed-material-loadsamples.
Mixture Distributions.—Historically, mixtures of distributions havealso been computationally difficult to fit (Fieller et al. 1991). Often, forthe sake of simplicity, volumetrically less-significant grain-size fractionsare ignored and only the dominant peak is modeled. For example, whenanalyzing suspended-sediment samples, Kranck et al. (1996a, 1996b)focused on the main peak in the distribution and omitted the fine-grained‘‘floc tail’’ for modeling sediment concentrations. They point out thatignoring this particular sediment fraction does not affect the mode ofsuspended-sediment samples, even in cases of repeated resuspension anddeposition (Kranck et al. 1996b).
In this study, results show that mixture distributions better characterizeslackwater deposits than any of the unimodal distributions. This is not
FIG. 4.— Boxplots of estimated mode parameter for bed-material (‘‘bed’’) andsuspended load (‘‘susp.’’) samples from each river. Boxes show the range from thefirst to third quartiles (the inter-quartile range), with the median indicated by aline, and whiskers (brackets) showing the range of observations excluding outliers.Isolated lines represent extreme outliers, defined as greater than two times theinter-quartile range below or above the first or third quartiles, respectively. Samplesizes are indicated in parentheses. Generally, bed-load sample modes arenoticeably coarser than those of suspended material for each river; however,overlap in bed-load and suspended-load modes within the same river does occur.Overall the North Loup River tends to be the coarsest river and the Calamus thefinest, although these differences are small.
FIG. 5.— Boxplots of estimated log-hyperbolic asymmetry parameter bed-material (‘‘bed’’) and suspended-load (‘‘susp.’’) samples from each river. Boxplotsare generated as described in the caption for Figure 4, and sample sizes areindicated in parentheses. An asymmetry parameter equal to zero would indicatesymmetrical distributions, and positive or negative asymmetry implies skewnesstowards coarse or fine grain sizes, respectively. Bed-load samples dominantly showsymmetry to slight coarse-grained asymmetry while suspended-load samples tendto be skewed towards fine grain sizes.
STATISTICAL CHARACTERIZATION OF GRAIN-SIZE DISTRIBUTIONS IN SANDY RIVERS 189J S R

surprising, given the presence of substantial amounts of very fine-grainedmaterial in these samples. Modeling mixtures of distributions in ShefSizeis currently limited to two log-skew-Laplace distributions. Future workwill target fitting of mixtures of two or more hyperbolic distributions.This type of modeling might help discriminate between the populations ofsediment that may be contributing to deposits with mixture distributions(e.g., bed load or suspended load). Likewise, constituent sedimentpopulations or distributions may also be investigated by decomposingGSDs with linear mixing models (e.g., Weltje and Prins 2007)
Relationship between Sample Types
Bed-Material Load and Suspended Load.—It is important to note thatall three rivers show significant overlap between bed-material-load andsuspended-load samples. Despite having slightly different modes andasymmetry (Figs. 4, 5), in general, the majority of grain sizes movingalong the bed are also carried in suspension.
Additionally, the vast majority of both bed-material-load andsuspended-load samples in this study follow a log-hyperbolic rather thana log-normal distribution. Overall, this result is different from that ofGhosh and Mazumder (1981), who show log-normal distributions insuspension arising from log-hyperbolic bed distributions. More quanti-tative work will need to be done modeling GSDs in more samples fromdifferent settings before specific relationships between GSDs andsediment transport will be revealed.
Suspended Load and Slackwater Deposits.—The GSDs of slackwater-deposit samples in this study are striking in that they contain a significantproportion of fine-grained material (, 0.02 mm), particularly withrespect to what is being carried in suspension (Fig. 3). Somehow thefinest grain sizes being transported in suspension are being concentratedin areas of near-zero flow velocity, suggesting some sort of fractionation,or preferential fine-grained deposition in these parts of the active channel.Although this material is not well represented in suspension, it canaccumulate on the river bed, presumably along with colloids andcontaminants transported with this grain-size fraction.
One possibility is that the slackwater deposits reflect sedimenttransported in the river under different flow conditions when a muchhigher proportion of fine-grained material was carried in the channel.This is unlikely, however, given that all three rivers show the samecharacter and have different sediment sources and seasonal floodinghistories.
Flocculation of fine-grained particles provides a potential mechanismfor deviating from the unimodal log-hyperbolic GSD in a manner similarto that found in slackwater deposits. The observed slackwater depositshave distributions very similar to suspended-sediment samples of Krancket al. (1996a, 1996b), whose sample distributions (measured asconcentration rather than weight percent) show a main, relatively coarsepeak that appears to be a unimodal distribution, and a relatively flat fine-grained (# medium silt) ‘‘floc tail’’ (Kranck et al. 1996a, 1996b).Flocculated material behaving as a single sand-size grain may containunsorted particles ranging in size from clay to silt that are independentlymeasurable upon disaggregation. Although we are uncertain the extent towhich flocculation predominates in the studied rivers, this behavior isobserved in fresh waters and occurs at a range of fine-grained sedimentconcentrations and flow velocities (e.g., Schieber et al. 2007).
One important motivation for understanding the relationship betweensuspended-sediment distribution and slackwater deposits is the possibilityof reconstructing paleoflow conditions, including paleochannel slope orpaleoflow velocity, from ancient deposits. Because of their work showingthat, unlike the distribution predicted by the Rouse equation, the entirerange of grain sizes in suspension are deposited on the bed, Ghosh andMazumder (1981) and Ghosh et al. (1986) suggest that paleoflow velocity,
in terms of bed shear velocity, could be calculated using the mode ofsuspended-sediment deposits and measures of local paleoflow depths.Samples from this study, however, show distinctly lower modes forsuspended-sediment deposits (slackwater deposits) than material intransport as suspended load (Fig. 6). In the three rivers studied,differences in GSDs between suspended sediment and slackwater depositsare the result of spatial variation in sediment transport and depositionalproperties. These spatial variations, common in channels with irregularbottom topography, are not captured by the laboratory experiments ofGhosh et al. (1986). Future work will focus on modeling the differencesbetween bedload, suspended load, and slackwater grain-size distributionsin riverine deposits in an effort to establish statistically meaningfulrelationships between these populations.
POTENTIAL EFFECTS OF MISFITTING GSDS
Commonly used sediment-transport equations often rely on singlegrain diameters (e.g., D50, D84, D95, etc.) calculated from empirical orfitted parametric GSDs. To explore the potential impact of misclassifyingGSDs, we simulated data from log-hyperbolic distributions with varyingdegrees of asymmetry and fitted log-normal distributions to the simulateddata. First, in Figure 7 we show an example of a Calamus River bed-loadsample that is best fitted by a log-hyperbolic distribution. Note that themode of the fitted log-normal distribution is distinctly offset from thefitted log-hyperbolic GSD and that the tails do not match well.
For data simulated from log-hyperbolic distributions, estimates of the5th, 10th 16th, 50th, 84th, 90th, and 95th percentile grain diameters wereobtained from the fitted log-normal distributions and compared to theactual percentile grain diameters. Table 2 summarizes the discrepancybetween the estimated percentile grain diameters from fitted log-normaldistributions and the actual percentile grain diameters of the simulatedGSDs.
FIG. 6.—Box plots of sample modes for each sample type and river. Slackwaterdeposits have different modes than suspended sediment samples, which is differentthan what was found experimentally by Ghosh et al. (1981, 1986). This suggeststhere is a more complicated relationship between the transport and deposition ofsuspended sediment in these systems.
190 E.A. HAJEK ET AL. J S R

This exercise demonstrates that if a sediment population has a log-hyperbolic GSD with some degree of asymmetry (e.g., p $ 0.5 or# 20.5, as do many of the bed-load and suspended-load samples in thisstudy) the D50 calculated from a normal distribution would actuallyrepresent the D41 or D59 (depending on the direction of asymmetry) ofthe sample. Likewise, when the asymmetry parameter is negative (GSD isskewed to the fine tail) percentile grain diameters are overestimated in thecoarse tail, with the inverse being true for distributions with positiveasymmetry.
Whether using the D41 rather than the true D50 is a significant errordepends on the precision required of a particular study and the scale ofinquiry. There are cases where mischaracterizing GSDs could result inorder-of-magnitude differences in results, including predicting changes toporosity and permeability from particle-size distributions (e.g., Beard andWeyl 1973). This should be decided on a case-by-case basis, but the
potential error incurred by assuming normality should be taken intoconsideration.
CONCLUSIONS
Efficiently summarizing GSDs with parametric distributions can beuseful for sediment transport modeling and other studies. We find that alog-hyperbolic distribution fits best for bed-material-load and suspended-load samples from the three sand-bedded rivers in this study. For othersystems this may not always be the case, although because it is the mostgeneral distribution, the log-hyperbolic distribution should provideadequate estimates for a variety of unimodal grain-size samples, includingthose that are log-normally distributed. This is particularly importantconsidering that the most commonly used distribution (log-normal) maypoorly represent some aspects of data from samples, particularly thosewith strong asymmetry.
Slackwater deposits in this study are best characterized as a mixture,possibly of two log-skew-Laplace distributions, and show an increasedproportion of fine-grained material relative to suspended sediment. Thesedata also show that previous studies indicating that the suspended-sediment mode does not change with deposition are not universally true,especially in systems where bar-form topography induce large-scalespatial variations in flow velocity. Modeled relationships betweensuspended-load and suspended-deposit distributions must be establishedbefore paleoflow velocity or paleoslope can be calculated from ancientriver deposits.
Modeling with simulated GSDs shows that estimates of median graindiameter from normal distributions fitted to populations with moderatenegative or positive asymmetry actually represent the 41st or 59thpercentile grain diameter, respectively, of a sample. Such errors inestimation of percentile grain diameter should be considered for studies inwhich GDSs are reduced to one characteristic grain diameter forsediment-transport modeling.
The availability of programs that can be used to fit statisticaldistributions to samples (including ShefSize) makes it easy for thoseworking with sediment samples to be more quantitative about describingand comparing grain-size distributions. This, in turn, will improve ourabilities to fully characterize the relationships between grain-sizedistributions and sediment transport processes.
ACKNOWLEDGMENTS
This research was partially supported by grants from the National ScienceFoundation (EAR-0345366) and the American Chemical Society PetroleumResearch Fund as well as Geological Society of America, AmericanAssociation of Petroleum Geologists, and International Association ofMathematical Geosciences foundation grants to R. Lynds. We thank Laura
TABLE 2.—Comparison of percentile grain diameters estimated from fitted log-normal distributions to the true grain-diameter percentile of simulated data.Five simulated log-hyperbolic GSDs were generated with varying degrees of asymmetry (p 5 21.0, 20.7, 0, 0.5, and 1.2) and with the remaining threelog-hyperbolic parameters held constant (m 5 4.5, d 5 0.35, and f 5 1.6). The chosen parameters are within the observed range from bed-load and
suspended-load samples in this study. Each row lists the true percentile of the grain diameter estimated as the D5, D10, D16, D50, D84, D90, and D95 fromthe fitted log-normal distribution for each simulated data set. For example, the median grain diameter (D50) estimated from a log-normal distribution fitted
to the first simulation (a log-hyperbolic distribution with asymmetry p 5 21.0) is actually the D41 of the simulated distribution.
D5 D10 D16 D50 D84 D90 D95
p = 21.0 7 10 14 41 89 97 100p = 20.7 7 10 14 42 88 95 99p = 0.0 5 9 14 50 86 91 95p = 0.5 2 6 12 57 86 90 94p = 1.2 0 2 10 59 86 90 93
FIG. 7.— Example of fitted log-normal, log-hyperbolic, and log-skew-Laplacedistributions for a Calamus River bed-load sample. This sample (gray boxes) isrepresentative of bed-load samples in this study and is best fitted by the log-hyperbolic distribution (solid black curve) with parameters p 5 1.2, m 5 5.17,d 5 0.522, and f 5 1.6. The dotted black line is the fitted log-normaldistribution, and the dashed black curve is the fitted log-skew-Laplace distribution.
STATISTICAL CHARACTERIZATION OF GRAIN-SIZE DISTRIBUTIONS IN SANDY RIVERS 191J S R

Vietti for help in the field and are particularly appreciative of conscientiousreviews by Whitney Autin, Gert Jan Weltje, and an anonymous reviewer.
REFERENCES
BAGNOLD, R.A., 1954. The Physics of Blown Sand and Desert Dunes: London,Methuen, 265 p.
BAGNOLD, R.A., AND BARNDORFF-NIELSEN, O., 1980, The pattern of natural sizedistribution: Sedimentology, v. 27, p. 199–207.
BARNDORFF-NIELSEN, O., 1977, Exponentially decreasing distributions for the logarithmof particle size.: Royal Society of London, Proceedings, series A, v. 353, p. 401–419.
BARNDORFF-NIELSEN, O., DALSGAARD, K., HALGREEN, C., KUHLMAN, H., MOLLER, J.T.,AND SCHOU, G., 1982, Variation in particle size distribution over a small dune:Sedimentology, v. 29, p. 53–65.
BEARD, D.C., AND WEYL, P.K., 1973, Influence of texture on porosity and permeabilityof unconsolidated sand: American Association of Petroleum Geologists, Bulletin,v. 57, p. 349–369.
BLEED, A., 1990, Groundwater, in Bleed, A., and Flowerday, C.A., eds., An Atlas of theSand Hills: Lincoln, Conservation and Survey Division, Institute of Agriculture andNatural Resources, University of Nebraska, p. 67–114.
BRIDGE, J.S., COLLIER, R., AND ALEXANDER, J., 1998, Large-scale structure of CalamusRiver deposits (Nebraska, USA) revealed using ground-penetrating radar: Sedimen-tology, v. 45, p. 977–986.
BRISTOW, C.S., SKELLY, R.L., AND ETHRIDGE, F.G., 1999, Crevasse splays from therapidly aggrading, sand-bed, braided Niobrara River, Nebraska: effect of base-levelrise: Sedimentology, v. 46, p. 1029–1047.
FIELLER, N.R.J., FLENLEY, E.C., GILBERTSON, D.D., AND THOMAS, D.S.G., 1991, Dumb-bells: a plotting convention for ‘‘mixed’’ grain size populations: Sedimentary Geology,v. 69, p. 7–12.
FIELLER, N.R.J., FLENLEY, E.C., AND OLBRICHT, W., 1992, The statistics of particle sizedata: Royal Statistical Society Journal, v. 41, p. 127–146.
FIELLER, N.R.J., GILBERTSON, D.D., AND OLBRICHT, W., 1984, A new method forenvironmental analysis of particle size distribution data from shoreline sediments:Nature, v. 311, p. 648–651.
FLENLEY, E.C., FIELLER, N.R.J., AND GILBERTSON, D.D., 1987, The statistical analysis of‘‘mixed’’ grain size distributions from aeolian sands in the Libyan pre-desert using logskew Laplace models, in Frostick, L., and Reid, I., eds., Desert Sediments: Ancientand Modern: Geological Society of London Special Publication, v. 35, p. 271–280.
GHOSH, J.K., AND MAZUMDER, B.S., 1981, Size distribution of suspended particles—unimodality, symmetry and lognormality, in Tallie, C., Patil, G., and Baldessari, B.,eds., Statistical Distribution in Scientific Work: D. Reidal Publishing Company, TheNetherlands, v. 6, p. 21–32.
GHOSH, J.K., MAZUMDER, B.S., AND SENGUPTA, S., 1981, Methods of computation ofsuspended load from bed materials and flow parameters: Sedimentology, v. 28, p.781–791.
GHOSH, J.K., MAZUMDER, B.S., SAHA, M.R., AND SENGUPTA, S., 1986, Deposition of sandby suspension currents: experimental and theoretical studies: Journal of SedimentaryPetrology, v. 56, p. 57–66.
HARTMANN, D., AND CHRISTIANSEN, C., 1992, The hyperbolic shape triangle as a tool fordiscriminating populations of sediment samples of closely connected origin:Sedimentology, v. 39, p. 697–708.
HARTMANN, D., AND FLEMMING, B.W., 2002, Discussion of: Steven H. Hill and PatrickMcLaren, 2001. A comparison between log-hyperbolic and model-independent grainsize distributions in sediment trend analysis (STA): Journal of Coastal Research, v. 18,p. 592–595.
KOTHYARI, U.C., 1995, Frequency distribution of river bed materials: Sedimentology,v. 42, p. 283–291.
KRANCK, K., SMITH, P.C., AND MILLIGAN, T.G., 1996a, Grain-size characteristics of fine-grained unflocculated sediments; I, ‘‘One-round’’ distributions: Sedimentology, v. 43,p. 589–596.
KRANCK, K., SMITH, P.C., AND MILLIGAN, T.G., 1996b, Grain-size characteristics of fine-grained unflocculated sediments; II, ‘‘Multi-round’’ distributions: Sedimentology,v. 43, p. 597–606.
LYNDS, R., AND HAJEK, E., 2006, Conceptual model for predicting mudstone dimensionsin sandy braided-river reservoirs: American Association of Petroleum Geologists,Bulletin, v. 90, p. 1273–1288.
MIDDLETON, G.V., 1970, The generation of log-normal size frequency distributions insediments, in Romanova, M.A., and Sarmand, V., eds., Topics in MathematicalGeology: New York, Consultants Bureau, p. 34–42.
PURKAIT, B., 2002, Patterns of grain-size distribution in some point bars of the UsriRiver, India: Journal of Sedimentary Research, v. 72, p. 367–375.
PURKAIT, B., 2006, Grain-size distribution patterns of a point bar system in the UsriRiver, India: Earth Surface Processes and Landforms, v. 31, p. 682–702.
PURKAIT, B., AND MAZUMDER, B.S., 2000, Grain size distribution—a probabilistic modelfor Usri River sediments in India, in Wang, Z., and Hu, S., eds., StochasticHydraulics: Rotterdam, A.A. Balkema, p. 291–298.
ROBSON, D., FIELLER, N., AND STILLMAN, E., 1997, ShefSize.SUTHERLAND, R.A., AND LEE, C.-T., 1994, Application of the log-hyperbolic distribution
to Hawiian beach sands: Journal of Coastal Research, v. 10, p. 251–262.WATKINS, D.K., AND DIFFENDAL, R.F.J., 1997, Geology of Niobrara State Park area, in
Flowerday, C.A., and Diffendal, R.F.J., eds., Geology of Niobrara State Park, KnoxCounty, Nebraska, and adjacent areas—With a brief history of the park, Gavins PointDam, and Lewis and Clark Lake: University of Nebraska, Conservation and SurveyDivision, Institute of Agriculture and Natural Resources, p. 6–12.
WELTJE, G.J., AND PRINS, M.A., 2007, Genetically meaningful decomposition of grain-size distributions: Sedimentary Geology, v. 202, p. 409–424.
Received 19 October 2008; accepted 14 September 2009.
192 E.A. HAJEK ET AL. J S R


![Testing five of the simplest upper mantle anisotropic velocity ...geofaculty.uwyo.edu/dueker/PAPERS/dueker papers 2008/Yuan_Anis… · 1. Introduction [2] Resolving anisotropic velocity](https://img.pdfslide.us/doc/110x75/5fad23113a05f555a673cb37/testing-five-of-the-simplest-upper-mantle-anisotropic-velocity-papers-2008yuananis.jpg)