Embed Size (px)
Citation preview

Available online at www.sciencedirect.com
www.elsevier.com/locate/gca
ScienceDirect
Geochimica et Cosmochimica Acta 141 (2014) 160–178
Fluid–rock interactions in CO2-saturated,granite-hosted geothermal systems: Implications for natural
and engineered systems from geochemical experiments and models
Caroline Lo Re a,⇑, John P. Kaszuba a,b, Joseph N. Moore c, Brian J. McPherson c
a Department of Geology and Geophysics, 1000 E. University Avenue, University of Wyoming, Laramie, WY 82071, USAb School of Energy Resources, 1000 E. University Avenue, University of Wyoming, Laramie, WY 82071, USA
c Energy and Geoscience Institute, University of Utah, 423 Wakara Way, Suite 300, Salt Lake City, UT 84108, USA
Received 18 November 2013; accepted in revised form 16 June 2014; Available online 27 June 2014
Abstract
Hydrothermal experiments were conducted and geochemical models constructed to evaluate the geochemical and miner-alogical response of fractured granite and granite + epidote in contact with thermal water, with and without supercriticalCO2, at 250 �C and 25–45 MPa. Illite ± smectite ± zeolite(?) precipitate as secondary minerals at the expense of K-feldspar,oligoclase, and epidote. Illite precipitates in experiments reacting granite and granite + epidote with water; metastable smec-tite forms in the experiments injected with supercritical CO2. Waters are supersaturated with respect to quartz and saturatedwith respect to chalcedony in CO2-charged experiments, but neither mineral formed. Carbonate formation is predicted forexperiments injected with supercritical CO2, but carbonate only formed during cooling and degassing of the granite +epidote + CO2 experiment.
Experimental results provide insight into the buffering capacity of granites as well as the drivers of clay formation. Meta-stable smectite in the experiments is attributed to high water–rock ratios, high silica activities, and high CO2 and magnesium–iron concentrations. Smectite precipitation in supercritical CO2-bearing geothermal systems may affect reservoir permeability.Silicate formation may create or thicken caps within or on the edges of geothermal reservoirs. Carbonate formation, as desiredfor carbon sequestration projects coinciding with geothermal systems, may require extended periods of time; cooling anddegassing of CO2-saturated waters leads to carbonate precipitation, potentially plugging near-surface production pathways.� 2014 Elsevier Ltd. All rights reserved.
http://dx.doi.org/10.1016/j.gca.2014.06.015
0016-7037/� 2014 Elsevier Ltd. All rights reserved.
Abbreviations: scCO2, supercritical CO2; EGS, enhancedgeothermal systems; CCS, carbon capture and storage; GWB, theGeochemist’s Workbench; CPG, CO2-plume geothermal systems.⇑ Corresponding author. Tel.: +1 307 766 3386; fax: +1 307 766
6679.E-mail addresses: [email protected] (C. Lo Re), john.kaszuba@
uwyo.edu (J.P. Kaszuba), [email protected] (J.N. Moore), [email protected] (B.J. McPherson).
1. INTRODUCTION
Shallow crustal rocks routinely undergo fluid–rockinteractions driven by thermal, chemical, and/or physicaldisequilibrium. The resulting mass transfer has importantimplications for our understanding of processes such ashydrothermal alteration, ore formation, fault-zone perme-ability, and sedimentary diagenesis. Mass transfer is alsoespecially important to geothermal operations since chemi-cal reactions can impact production.
Our study comes at a time of renewed interest in conven-tional (convective) and non-conventional (conductive)
C. Lo Re et al. / Geochimica et Cosmochimica Acta 141 (2014) 160–178 161
geothermal systems for energy extraction (e.g., Moore andSimmons, 2013) as well as for sequestering carbon dioxideto mitigate concentrations of atmospheric carbon (e.g.,Benson and Cook, 2005). Water is the naturally occurringfluid in geothermal systems and is commonly used as theworking fluid for heat extraction. Supercritical CO2
(scCO2) has also been proposed as a working fluid(Brown, 2000; Pruess, 2006). Non-conventional enhancedgeothermal systems (EGS) (MIT, 2006) and conventionalCO2-plume geothermal systems (CPG) (Randolph andSaar, 2011) are both targets for using scCO2 as a workingfluid, with the possible ancillary benefit of sequestering car-bon dioxide.
One goal of a CO2-based geothermal system (whetherEGS or CPG) is to dry out the reservoir over time by grad-ually extracting and displacing water. Another goal is tooptimize heat extraction efficiency. The advantage of usingscCO2 compared to water is its low viscosity, large expan-sivity, and reduced reactivity with rock. In addition toincreased productivity, scCO2-based geothermal systemsmay sequester carbon, especially by mineral and/or dissolu-tion trapping (Benson and Cook, 2005) or by loss to sur-rounding country rock if permeability is high enough.
CO2-rich fluids, however, are chemically aggressive andcould impact reservoir permeability and porosity by disso-lution and precipitation reactions. Because there are fewnatural laboratories (CO2 reservoirs) where the evolutionof fluid and hydrothermal alteration can be assessed, wehave used hydrothermal experiments and geochemicalmodels to: (1) quantify fluid–rock interactions in granite-hosted hydrothermal systems, with and without scCO2;and (2) bridge the gap that often exists among field obser-vation, experimental results, and geochemical predictions.Our results elucidate processes such as the buffering capac-ity of felsic rocks, drivers of metastable clay formation, andtungsten ore formation. Results also clarify fluid–rockinteractions in scCO2-based EGS or CPG as well as in hightemperature granitic or arkosic reservoirs targeted for car-bon capture and storage (CCS).
Many experimental efforts have been made over the past50 years to elucidate hydrothermal fluid–rock interactionsfor felsic igneous rocks, and all offer unique contributionsto our understanding of natural and engineered systems(Appendix A). The associated batch and flow-throughexperiments were conducted at temperatures and pressuresranging from 20 to 600 �C and 1.4–150 MPa with distilledwater, or less commonly, dilute Na–Cl, Na–HCO3–Cl, orNa–Ca–HCO3–Cl water. A few used scCO2 at the onsetof each experiment. To date, we are unaware of any studiesusing both scCO2 and a realistic groundwater chemistry.We are also unaware of any that allow a system toapproach a steady-state prior to introducing scCO2. Ourexperiments were designed to explore such conditions.
A commonality observed in the referenced studies is thefrequent precipitation of smectite as a secondary mineral.Based on our knowledge of natural systems, smectite andmixed-layer illite–smectite are characteristic of tempera-tures up to �180 and �220 �C, respectively (e.g., Henleyand Ellis, 1983), and therefore, experimental observationof smectite formed at temperatures higher than �180–
220 �C begs explanation. To our knowledge, this discrep-ancy is not discussed in the literature, and because of itscritical implications for geothermal systems, we reviewand discuss the discrepancy in the context of experimentalsystems, geochemical models, and natural systems.
We present experimental data to evaluate aqueous geo-chemistry and mineralogical relationships in water–gran-ite ± scCO2 and water–epidote–granite ± scCO2 systemsat 250 �C and 25–45 MPa. Granite and epidote–graniteexperiments provide a baseline understanding for fluid–rock interactions in fresh and altered rock, respectively.We also construct thermodynamic models and compare cal-culations/predictions to our experimental results, and thencompare our experimental and model data to natural andengineered systems. Although beyond the scope of thispaper, a kinetic model is also under development. Impor-tant discussion topics include: (1) paths to equilibriumincluding the extent to which experiments approach equilib-rium and the sequence of water–rock reactions; (2) resultsin the context of natural systems, including factors thatgovern smectite formation; and (3) implications for engi-neered systems.
2. METHODS AND MATERIALS
2.1. Experimental design and setup
Hydrothermal experiments were conducted in rockingautoclaves and flexible Au–Ti reaction cells (Dickson cells)(Seyfried et al., 1987). Each gold cell ports directly to avalve that allows for periodic fluid sampling without per-turbing the experiment. Aqueous samples were collectedapproximately every 1, 2, 5, 14, and 28 days for each stageof an experiment (pre- or post- CO2 injection). We also ana-lyzed unreacted water and minerals (i.e., prepared for butnot included in the experiment) as well as the very finalreacted water and minerals (i.e., recovered at the conclusionof the experiment).
Our experiments and geochemical simulations emulatethe geothermal conditions, aqueous geochemistry, and min-eralogy of Roosevelt Hot Springs, Utah (Ward et al., 1978;Capuano and Cole, 1982), a well-characterized, magmati-cally-heated geothermal system. Basing simulations andexperiments on such a system allows us to relate resultsto similar settings. With respect to CO2-based EGS orCPG, our experiments are representative of conditionswhen the reservoir water is saturated with CO2 and hasnot yet been displaced by scCO2. Experiments have initialand final water:rock ratios of �20:1 and 10:1, respectively;this emulates the high water:rock ratio in a localized zoneof fractured granite.
The granite is a mixture of powdered (75%, <45 lm) andchipped (0.1–0.7 cm) research-grade quartz, plagioclasefeldspar (oligoclase), potassium feldspar (K-feldspar), andminor biotite. Instead of using actual granite, this approachallowed us to avoid alteration and accessory minerals, thussimplifying analysis of our modeling and experimentalresults. Two experiments also include 50% epidote, andsimulate fluid–rock interactions in EGS reservoirs stimu-lated by fracturing along pre-existing zones of weakness
162 C. Lo Re et al. / Geochimica et Cosmochimica Acta 141 (2014) 160–178
(i.e., epidote veins) and in pervasively altered granitic rocks(i.e., propylitic or greenschist facies alteration). Proportionsof minerals used in each experiment are listed in Table 1;the composition of each mineral is listed in Table 2.
A multi-component, but dominantly Na–Cl water wasused in the experiments. The waters (ionic strength (I)�0.1 molal) were prepared using research-grade salts andsolutions and contained molal quantities of Na, Cl, andHCO3 and millimolal quantities of K, SiO2(aq), SO4, Ca,Al, and Mg (initial compositions are shown in Table 3).
Five hydrothermal experiments were conducted: onewater–granite experiment (EXP-1), two water–granite–scCO2
experiments (EXP-2 and -3), one water–epidote–graniteexperiment (EXP-4) and one water–epidote–granite–scCO2 experiment (EXP-5). EXP-2 and -3 are similar withthe exception of initial pH, which we varied to observethe effect of pH on initial water–rock interactions (EXP-2pH = 5.7; EXP-3 pH = 3.9). We refer to EXP-2 and -3 asmoderate and low pH water–granite–scCO2 experiments,respectively. Table 1 outlines conditions and parametersfor each experiment. All experiments included an initialwater–rock stage conducted at 250 �C and 25 MPa thatlasted at least 666 h. Two of the experiments (EXP-1 and-4) were terminated when the aqueous chemistryapproached a steady-state. Three of the experiments(EXP-2, -3, and -5) continued for at least another 650 hafter injecting scCO2. The scCO2 stage of these experimentscontinued at 250 �C with final pressures between 30.7 and44.8 MPa. Final pressures stabilized over a period of 1–2 days as CO2 dissolved into the water.
The amount of CO2 injected into EXP-2, -3, and -5ensured RCO2(aq) saturation for the duration of eachexperiment. The Duan and Sun (2003) and/or Duan et al.(2006) equations of state for CO2 were used to calculate
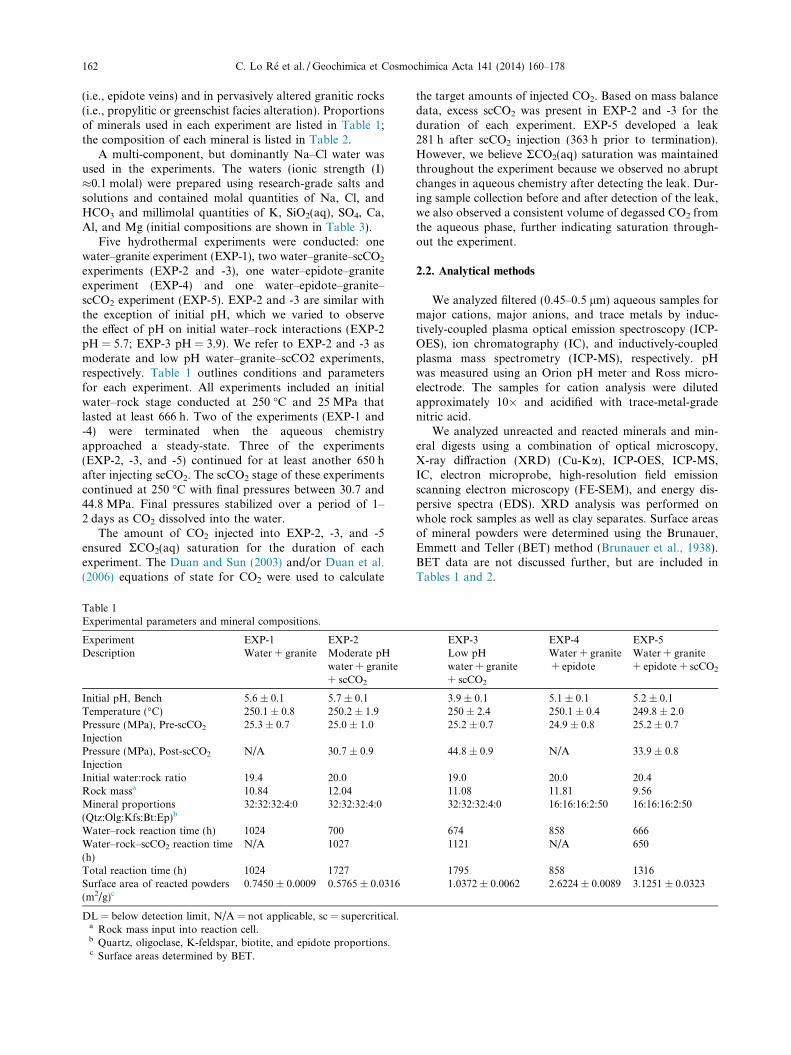
Table 1Experimental parameters and mineral compositions.
Experiment EXP-1 EXP-2Description Water + granite Moderate pH
water + granite+ scCO2
Initial pH, Bench 5.6 ± 0.1 5.7 ± 0.1Temperature (�C) 250.1 ± 0.8 250.2 ± 1.9Pressure (MPa), Pre-scCO2
Injection25.3 ± 0.7 25.0 ± 1.0
Pressure (MPa), Post-scCO2
InjectionN/A 30.7 ± 0.9
Initial water:rock ratio 19.4 20.0Rock massa 10.84 12.04Mineral proportions(Qtz:Olg:Kfs:Bt:Ep)b
32:32:32:4:0 32:32:32:4:0
Water–rock reaction time (h) 1024 700Water–rock–scCO2 reaction time(h)
N/A 1027
Total reaction time (h) 1024 1727Surface area of reacted powders(m2/g)c
0.7450 ± 0.0009 0.5765 ± 0.0316
DL = below detection limit, N/A = not applicable, sc = supercritical.a Rock mass input into reaction cell.b Quartz, oligoclase, K-feldspar, biotite, and epidote proportions.c Surface areas determined by BET.
the target amounts of injected CO2. Based on mass balancedata, excess scCO2 was present in EXP-2 and -3 for theduration of each experiment. EXP-5 developed a leak281 h after scCO2 injection (363 h prior to termination).However, we believe RCO2(aq) saturation was maintainedthroughout the experiment because we observed no abruptchanges in aqueous chemistry after detecting the leak. Dur-ing sample collection before and after detection of the leak,we also observed a consistent volume of degassed CO2 fromthe aqueous phase, further indicating saturation through-out the experiment.
2.2. Analytical methods
We analyzed filtered (0.45–0.5 lm) aqueous samples formajor cations, major anions, and trace metals by induc-tively-coupled plasma optical emission spectroscopy (ICP-OES), ion chromatography (IC), and inductively-coupledplasma mass spectrometry (ICP-MS), respectively. pHwas measured using an Orion pH meter and Ross micro-electrode. The samples for cation analysis were dilutedapproximately 10� and acidified with trace-metal-gradenitric acid.
We analyzed unreacted and reacted minerals and min-eral digests using a combination of optical microscopy,X-ray diffraction (XRD) (Cu-Ka), ICP-OES, ICP-MS,IC, electron microprobe, high-resolution field emissionscanning electron microscopy (FE-SEM), and energy dis-persive spectra (EDS). XRD analysis was performed onwhole rock samples as well as clay separates. Surface areasof mineral powders were determined using the Brunauer,Emmett and Teller (BET) method (Brunauer et al., 1938).BET data are not discussed further, but are included inTables 1 and 2.
EXP-3 EXP-4 EXP-5Low pHwater + granite+ scCO2
Water + granite+ epidote
Water + granite+ epidote + scCO2
3.9 ± 0.1 5.1 ± 0.1 5.2 ± 0.1250 ± 2.4 250.1 ± 0.4 249.8 ± 2.025.2 ± 0.7 24.9 ± 0.8 25.2 ± 0.7
44.8 ± 0.9 N/A 33.9 ± 0.8
19.0 20.0 20.411.08 11.81 9.5632:32:32:4:0 16:16:16:2:50 16:16:16:2:50
674 858 6661121 N/A 650
1795 858 13161.0372 ± 0.0062 2.6224 ± 0.0089 3.1251 ± 0.0323

Table 2Mineral Compositions and Initial Surface Areas.
Componenta,b Quartz K-feldspar Oligoclase Biotite Epidote
Elemental weight percent of mineral reactants (wt% oxide)
P2O5 DL DL DL/NM DL/NM DLMnO DL 0.00 0.01/DL 1.03/0.87 0.09Fe2O3 0.08 0.19 0.12/0.04 22.84a 12.81FeO – – – 17.65b –MgO DL DL DL/DL 13.78/13.82 DLSiO2 97.79 62.48 64.29/61.83 36.17/38.21 34.70Al2O3 0.59 18.92 24.47/24.25 11.56/11.33 22.63CaO DL 0.22 5.23/4.65 0.10/0.01 23.69TiO2 0.03 0.01 0.02/DL 2.50/2.12 0.12Na2O DL 2.35 8.36/8.67 0.60/0.43 DLK2O DL 12.60 0.71/0.50 8.93/9.37 DLF NM NM NM/DL NM/2.57 NMCl NM NM NM/DL NM/0.04 NMTotal 98.48 96.86 103.37/99.94 97.50/96.44 94.04
Mineral formula SiO2 25% NaAlSi3O8
75% KAlSi3O8
Na0.77Ca0.23
(Si2.77,Al1.23)O8
K(Mg1.7,Fe1.3)(AlSi3O10)(OH)2
Ca2(Al0.2Fe0.8)Al2Si3O12(OH)
Source Unknown Unknown Mitchell County,North Carolina
Ontario, Canada Unknown
Surface Area of Unreacted Powders (m2/g)c
EXP-1 0.3367 ± 0.0028 0.4408 ± 0.0208 0.6303 ± 0.0070 1.5652 ± 0.0420 N/AEXP-2 0.3367 ± 0.0028 0.927 ± 0.0385 0.6303 ± 0.0070 1.5652 ± 0.0420 N/AEXP-3 0.3367 ± 0.0028 0.4408 ± 0.0208 0.6303 ± 0.0070 1.5652 ± 0.0420 N/AEXP-4 0.7124 ± 0.0031 0.927 ± 0.0385 0.6303 ± 0.0070 1.5652 ± 0.0420 0.6327 ± 0.0617EXP-5 0.7124 ± 0.0031 0.927 ± 0.0385 0.6303 ± 0.0070 1.5652 ± 0.0420 0.6327 ± 0.0617
DL = below detection limit, N/A = not applicable, NM = not measured.a Component analysis conducted by ICP-OES after acid digestion of mineral.b Component analysis for oligoclase and biotite also conducted by electron microprobe. Microprobe data are the second set of values
shown.c Surface areas determined by BET. Powders comprise 75% of mineral reactants with the remaining 25% consisting of mineral chips.
C. Lo Re et al. / Geochimica et Cosmochimica Acta 141 (2014) 160–178 163
2.3. Geochemical calculations
Geochemical models were developed using The Geo-chemist’s Workbench� version 8.0.10 (GWB) (Bethke andYeakel, 2009), the b-dot ion association model, and the res-ident thermodynamic database thermo.dat. We use the b-dot model because CO2(aq) is predominantly H2CO3(aq)(>99%) and low ionic strengths (0.10–0.15) prevail in ourCO2-charged experiments. We also assume that effects ofCO2 on mineral solubility are due to the pH effect (see alsoLu et al., 2013). We use thermo.dat because it is internallyconsistent and handles aluminum speciation more adeptlythan other available databases (e.g., Kaszuba et al., 2011).The models were used to: (1) determine initial water compo-sitions used in the experiments; (2) calculate in situ pH con-ditions, aqueous species concentrations and activities, andmineral stabilities for individual aqueous samples periodi-cally collected from each experiment; and (3) predictactivities of aqueous species and mineral stabilities atequilibrium in each of the experiments.
To provide a better representation of thermodynamicdata for minerals used in our experiments, we adjustedthe database to include solid–solution plagioclase and epi-dote with equilibrium constants calculated via ideal solu-tion models. Biotite was treated as a mechanical mixtureof 44% annite and 56% phlogopite. The K-feldspar is
perthitic, and was treated as a mechanical mixture of 25%albite and 75% microcline.
GWB was used to determine a water chemistry thatwould be as close to equilibrium as possible with the miner-als in each experiment. This was done to minimize water–rock interaction in the experiments prior to injecting scCO2.
In situ pH was calculated for samples in the water–rocksegment of each experiment by speciating the fluid at250 �C using bench pH, RCO2(aq) measured at the benchand in situ, and the aqueous geochemical data (Table 3).For those experiments injected with scCO2, in situ pHwas calculated using the method of Newell et al. (2008)by speciating the fluid using pH and RCO2(aq) measuredat the bench, the aqueous geochemical data, and RCO2(aq)calculated for in situ conditions. Aqueous species activitiesfrom these calculations are plotted on activity–activity dia-grams to better define the sequence of water–rock reactionsfor each experiment (Section 4.1).
Equilibrium models were constructed to predict activi-ties and concentrations of aqueous species and secondarymineral assemblages for each experiment both before andafter injection of scCO2. Each model incorporates thefluid–rock proportions, mineralogy, and aqueous geochem-istry of each experiment (Tables 1–3). The model predictsthe geochemical behavior of the water–rock segment ofeach experiment (i.e., the entirety of EXP-1 and -4 and
164 C. Lo Re et al. / Geochimica et Cosmochimica Acta 141 (2014) 160–178
the first half of EXP-2, -3, and -5), by speciating the fluidand dissolving and precipitating minerals at 250 �C. Forthose experiments injected with scCO2 (EXP-2, -3, and-5), an appropriate amount of RCO2(aq) was titrated intoeach system, as calculated using the Duan and Sun (2003)equation of state (Section 3.4). The resulting predictedaqueous concentrations are included in Table 3 and onFig. 1 in the column labeled ‘P’ (i.e., ‘predicted’) on theright side of each graph. Predicted, observed, and typicalfield alteration mineralogy is outlined in Table 4.
3. EXPERIMENTAL AND THEORETICAL RESULTS
3.1. Mineral precipitation
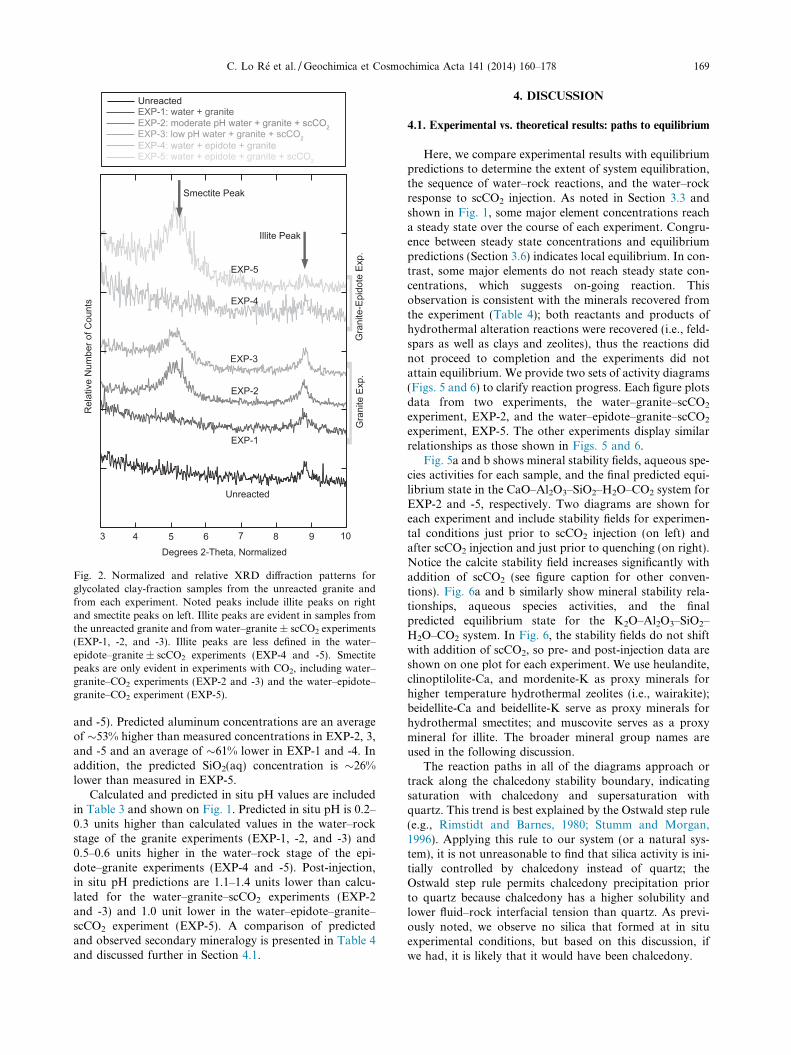
Mineral precipitation occurred in all five experiments(Table 4). XRD results for whole rock samples do not exhi-bit discernible diffractograms for secondary minerals. How-ever, clay fraction diffractograms (Fig. 2) and optical/SEMobservation (below) do indicate clay precipitation in eachexperiment. Both air-dried and glycolated clay-fractionsamples were analyzed; for brevity, air-dried results arenot contained herein.
XRD results for unreacted and reacted powders (EXP-1,-2, and -3) indicate the presence of illite. Illite may also bepresent in the reacted epidote–granite powders (EXP-4 and-5), although the diffraction peaks are not well defined.Based on optical and SEM observation, minimal illiteoccurs in the unreacted granite as compared to reactedgranite suggesting additional illite precipitated in the exper-iments. XRD results also indicate the presence of smectitein the water–granite–scCO2 experiments (EXP-2 and -3)and the water–epidote–granite–scCO2 experiment (EXP-5). Although XRD data are insufficient to identify the typesof illite and smectite, we are confident that the clays are notinterlayered due to the lack of characteristic peaks for reg-ularly or randomly interlayered illite–smectite.
We observed three precipitates in the water–graniteexperiment (EXP-1) including a sparse needle-forming alu-minosilicate (zeolite?) (e.g., Fig. 3a), an abundant petal-forming Mg–Fe-rich aluminosilicate interpreted as illite(possibly celadonite) (Fig. 3b), and one occurrence of hum-mocky silica. The illite is zoned in reflected light and variesfrom green to blue. The silica is interpreted to have depos-ited during cooling (Section 3.3).
In the water–granite–scCO2 experiments (EXP-2 and -3), we observed similarly composed illite and zeolite(?) inaddition to an Fe–Mg-rich, rosette-forming aluminosilicateinterpreted as smectite (Fig. 3c). The low pH water–gran-ite–scCO2 experiment (EXP-3) contains minor amounts ofthree additional minerals, as identified by EDS: scheelite(CaWO4), magnetite, and gold (Fig. 3d–f).
The water–epidote–granite experiment (EXP-4) con-tained trapezohedral analcime, petal-forming illite (Fe–Carich), and rosette-forming smectite (Fe–Mg rich) (Fig. 3g–i). Smectite is a minor phase since only one occurrencewas observed during optical and SEM analysis and thereis no evident XRD peak.
In the water–epidote–granite–scCO2 experiment (EXP-5), abundant, poorly-formed smectite (Fe–Ca-rich)
(Fig. 3j), blocky and rhombohedral Ca-carbonate,(Fig. 3k and l), and globular silica formed. Based onXRD data, illite is also likely present (Fig. 2), but couldnot be positively identified by SEM. Based on aqueous geo-chemistry and saturation indices (not shown), the carbon-ate and silica formed as an artifact of terminating theexperiment (Section 3.3). The presence of carbonate maybe specific to EXP-5 due to abundant calcium from epidotedissolution. Although only observed in EXP-1 and -5, silicamay have formed on termination of the other experimentsas well. We made no effort to identify the type of silica thatprecipitated since it does not relate to in situ experimentalconditions.
The tungsten source in EXP-3 is likely high-temperaturelubricant. In addition, we attribute gold precipitation tomobilization from the reaction cell during the experiment;the morphology of the gold crystals indicates precipitationfrom solution and not contamination from sample coatingor abrasion of the reaction cell.
3.2. Mineral dissolution
Minerals from the water–rock–scCO2 experiments(EXP-2, -3, and -5) display a greater degree of dissolutionthan minerals in the water–rock experiments (EXP-1 and-4). The feldspars in the water–granite experiments (EXP-1, -2, and -3) exhibit dissolution textures (Fig. 4a–d), withrelatively more dissolution of K-feldspar than plagioclase.Feldspars in EXP-2 (initial pH = 5.7) are less dissolvedthan feldspars in EXP-3 (initial pH = 3.9). In the epidote–granite experiments (EXP-4 and -5), epidote (Fig. 4e andf), oligoclase (Fig. 4g), K-feldspar, and quartz (Fig. 4h)all exhibit dissolution textures, in order of decreasingextent. In all experiments, biotite appears fresh althoughclay has formed directly on some surfaces (Fig. 4i).
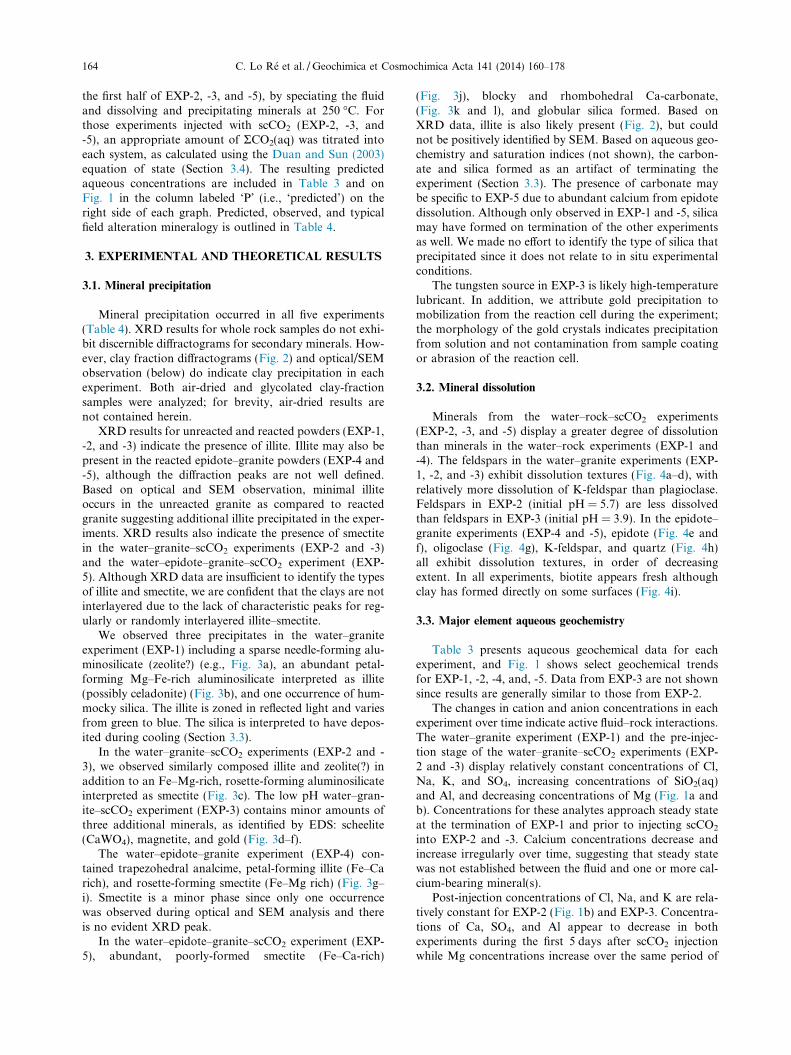
3.3. Major element aqueous geochemistry
Table 3 presents aqueous geochemical data for eachexperiment, and Fig. 1 shows select geochemical trendsfor EXP-1, -2, -4, and, -5. Data from EXP-3 are not shownsince results are generally similar to those from EXP-2.
The changes in cation and anion concentrations in eachexperiment over time indicate active fluid–rock interactions.The water–granite experiment (EXP-1) and the pre-injec-tion stage of the water–granite–scCO2 experiments (EXP-2 and -3) display relatively constant concentrations of Cl,Na, K, and SO4, increasing concentrations of SiO2(aq)and Al, and decreasing concentrations of Mg (Fig. 1a andb). Concentrations for these analytes approach steady stateat the termination of EXP-1 and prior to injecting scCO2
into EXP-2 and -3. Calcium concentrations decrease andincrease irregularly over time, suggesting that steady statewas not established between the fluid and one or more cal-cium-bearing mineral(s).
Post-injection concentrations of Cl, Na, and K are rela-tively constant for EXP-2 (Fig. 1b) and EXP-3. Concentra-tions of Ca, SO4, and Al appear to decrease in bothexperiments during the first 5 days after scCO2 injectionwhile Mg concentrations increase over the same period of
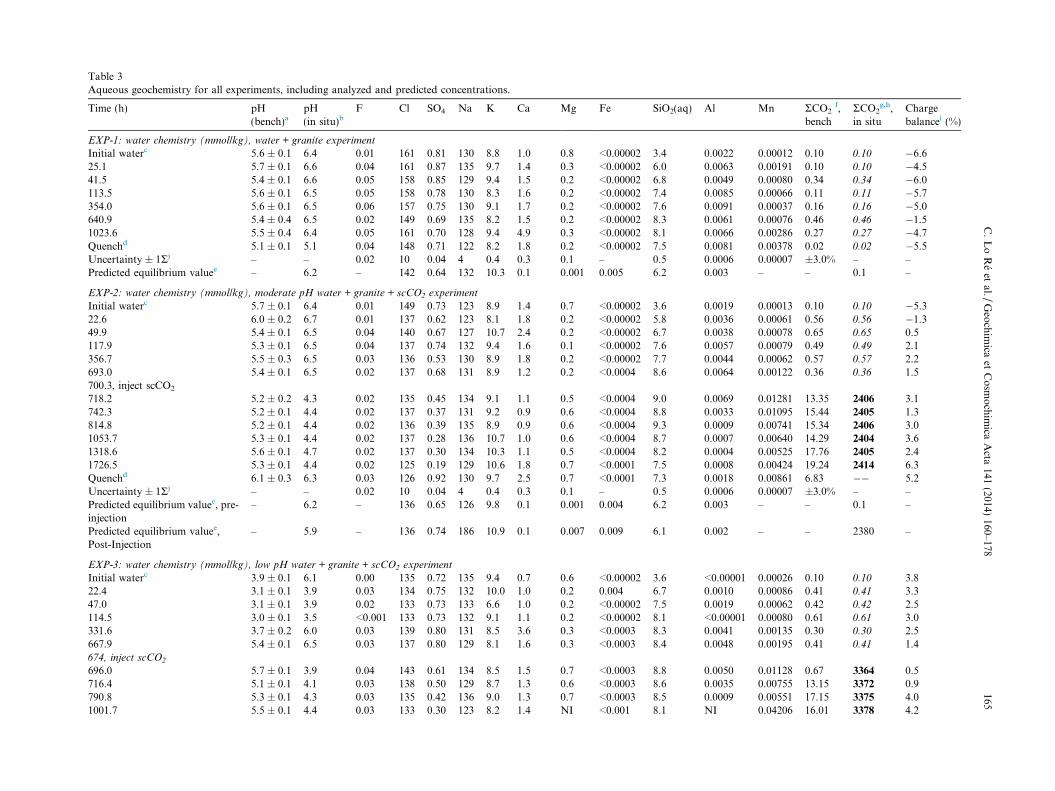
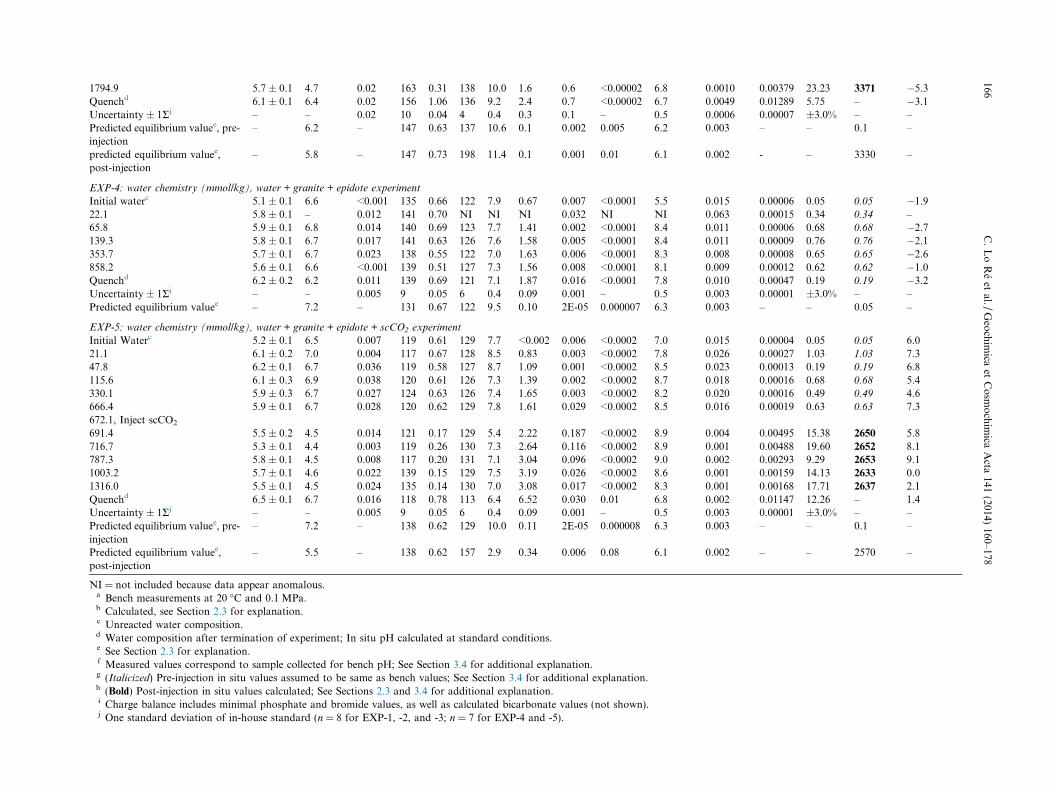
Table 3Aqueous geochemistry for all experiments, including analyzed and predicted concentrations.
Time (h) pH(bench)a
pH(in situ)b
F Cl SO4 Na K Ca Mg Fe SiO2(aq) Al Mn RCO2f,
benchRCO2
g,h,in situ
Chargebalancei (%)
EXP-1: water chemistry (mmol/kg), water + granite experiment
Initial waterc 5.6 ± 0.1 6.4 0.01 161 0.81 130 8.8 1.0 0.8 <0.00002 3.4 0.0022 0.00012 0.10 0.10 �6.625.1 5.7 ± 0.1 6.6 0.04 161 0.87 135 9.7 1.4 0.3 <0.00002 6.0 0.0063 0.00191 0.10 0.10 �4.541.5 5.4 ± 0.1 6.6 0.05 158 0.85 129 9.4 1.5 0.2 <0.00002 6.8 0.0049 0.00080 0.34 0.34 �6.0113.5 5.6 ± 0.1 6.5 0.05 158 0.78 130 8.3 1.6 0.2 <0.00002 7.4 0.0085 0.00066 0.11 0.11 �5.7354.0 5.6 ± 0.1 6.5 0.06 157 0.75 130 9.1 1.7 0.2 <0.00002 7.6 0.0091 0.00037 0.16 0.16 �5.0640.9 5.4 ± 0.4 6.5 0.02 149 0.69 135 8.2 1.5 0.2 <0.00002 8.3 0.0061 0.00076 0.46 0.46 �1.51023.6 5.5 ± 0.4 6.4 0.05 161 0.70 128 9.4 4.9 0.3 <0.00002 8.1 0.0066 0.00286 0.27 0.27 �4.7Quenchd 5.1 ± 0.1 5.1 0.04 148 0.71 122 8.2 1.8 0.2 <0.00002 7.5 0.0081 0.00378 0.02 0.02 �5.5Uncertainty ± 1Rj – – 0.02 10 0.04 4 0.4 0.3 0.1 – 0.5 0.0006 0.00007 ±3.0% – –Predicted equilibrium valuee – 6.2 – 142 0.64 132 10.3 0.1 0.001 0.005 6.2 0.003 – – 0.1 –
EXP-2: water chemistry (mmol/kg), moderate pH water + granite + scCO2 experiment
Initial waterc 5.7 ± 0.1 6.4 0.01 149 0.73 123 8.9 1.4 0.7 <0.00002 3.6 0.0019 0.00013 0.10 0.10 �5.322.6 6.0 ± 0.2 6.7 0.01 137 0.62 123 8.1 1.8 0.2 <0.00002 5.8 0.0036 0.00061 0.56 0.56 �1.349.9 5.4 ± 0.1 6.5 0.04 140 0.67 127 10.7 2.4 0.2 <0.00002 6.7 0.0038 0.00078 0.65 0.65 0.5117.9 5.3 ± 0.1 6.5 0.04 137 0.74 132 9.4 1.6 0.1 <0.00002 7.6 0.0057 0.00079 0.49 0.49 2.1356.7 5.5 ± 0.3 6.5 0.03 136 0.53 130 8.9 1.8 0.2 <0.00002 7.7 0.0044 0.00062 0.57 0.57 2.2693.0 5.4 ± 0.1 6.5 0.02 137 0.68 131 8.9 1.2 0.2 <0.0004 8.6 0.0064 0.00122 0.36 0.36 1.5700.3, inject scCO2
718.2 5.2 ± 0.2 4.3 0.02 135 0.45 134 9.1 1.1 0.5 <0.0004 9.0 0.0069 0.01281 13.35 2406 3.1742.3 5.2 ± 0.1 4.4 0.02 137 0.37 131 9.2 0.9 0.6 <0.0004 8.8 0.0033 0.01095 15.44 2405 1.3814.8 5.2 ± 0.1 4.4 0.02 136 0.39 135 8.9 0.9 0.6 <0.0004 9.3 0.0009 0.00741 15.34 2406 3.01053.7 5.3 ± 0.1 4.4 0.02 137 0.28 136 10.7 1.0 0.6 <0.0004 8.7 0.0007 0.00640 14.29 2404 3.61318.6 5.6 ± 0.1 4.7 0.02 137 0.30 134 10.3 1.1 0.5 <0.0004 8.2 0.0004 0.00525 17.76 2405 2.41726.5 5.3 ± 0.1 4.4 0.02 125 0.19 129 10.6 1.8 0.7 <0.0001 7.5 0.0008 0.00424 19.24 2414 6.3Quenchd 6.1 ± 0.3 6.3 0.03 126 0.92 130 9.7 2.5 0.7 <0.0001 7.3 0.0018 0.00861 6.83 �� 5.2Uncertainty ± 1Rj – – 0.02 10 0.04 4 0.4 0.3 0.1 – 0.5 0.0006 0.00007 ±3.0% – –Predicted equilibrium valuee, pre-injection
– 6.2 – 136 0.65 126 9.8 0.1 0.001 0.004 6.2 0.003 – – 0.1 –
Predicted equilibrium valuee,Post-Injection
– 5.9 – 136 0.74 186 10.9 0.1 0.007 0.009 6.1 0.002 – – 2380 –
EXP-3: water chemistry (mmol/kg), low pH water + granite + scCO2 experiment
Initial waterc 3.9 ± 0.1 6.1 0.00 135 0.72 135 9.4 0.7 0.6 <0.00002 3.6 <0.00001 0.00026 0.10 0.10 3.822.4 3.1 ± 0.1 3.9 0.03 134 0.75 132 10.0 1.0 0.2 0.004 6.7 0.0010 0.00086 0.41 0.41 3.347.0 3.1 ± 0.1 3.9 0.02 133 0.73 133 6.6 1.0 0.2 <0.00002 7.5 0.0019 0.00062 0.42 0.42 2.5114.5 3.0 ± 0.1 3.5 <0.001 133 0.73 132 9.1 1.1 0.2 <0.00002 8.1 <0.00001 0.00080 0.61 0.61 3.0331.6 3.7 ± 0.2 6.0 0.03 139 0.80 131 8.5 3.6 0.3 <0.0003 8.3 0.0041 0.00135 0.30 0.30 2.5667.9 5.4 ± 0.1 6.5 0.03 137 0.80 129 8.1 1.6 0.3 <0.0003 8.4 0.0048 0.00195 0.41 0.41 1.4674, inject scCO2
696.0 5.7 ± 0.1 3.9 0.04 143 0.61 134 8.5 1.5 0.7 <0.0003 8.8 0.0050 0.01128 0.67 3364 0.5716.4 5.1 ± 0.1 4.1 0.03 138 0.50 129 8.7 1.3 0.6 <0.0003 8.6 0.0035 0.00755 13.15 3372 0.9790.8 5.3 ± 0.1 4.3 0.03 135 0.42 136 9.0 1.3 0.7 <0.0003 8.5 0.0009 0.00551 17.15 3375 4.01001.7 5.5 ± 0.1 4.4 0.03 133 0.30 123 8.2 1.4 NI <0.001 8.1 NI 0.04206 16.01 3378 4.2
C.
Lo
Re
etal./
Geo
chim
icaet
Co
smo
chim
icaA
cta141
(2014)160–178
165
1794.9 5.7 ± 0.1 4.7 0.02 163 0.31 138 10.0 1.6 0.6 <0.00002 6.8 0.0010 0.00379 23.23 3371 �5.3Quenchd 6.1 ± 0.1 6.4 0.02 156 1.06 136 9.2 2.4 0.7 <0.00002 6.7 0.0049 0.01289 5.75 – �3.1Uncertainty ± 1Rj – – 0.02 10 0.04 4 0.4 0.3 0.1 – 0.5 0.0006 0.00007 ±3.0% – –Predicted equilibrium valuee, pre-injection
– 6.2 – 147 0.63 137 10.6 0.1 0.002 0.005 6.2 0.003 – – 0.1 –
predicted equilibrium valuee,post-injection
– 5.8 – 147 0.73 198 11.4 0.1 0.001 0.01 6.1 0.002 - – 3330 –
EXP-4: water chemistry (mmol/kg), water + granite + epidote experiment
Initial waterc 5.1 ± 0.1 6.6 <0.001 135 0.66 122 7.9 0.67 0.007 <0.0001 5.5 0.015 0.00006 0.05 0.05 �1.922.1 5.8 ± 0.1 – 0.012 141 0.70 NI NI NI 0.032 NI NI 0.063 0.00015 0.34 0.34 –65.8 5.9 ± 0.1 6.8 0.014 140 0.69 123 7.7 1.41 0.002 <0.0001 8.4 0.011 0.00006 0.68 0.68 �2.7139.3 5.8 ± 0.1 6.7 0.017 141 0.63 126 7.6 1.58 0.005 <0.0001 8.4 0.011 0.00009 0.76 0.76 �2.1353.7 5.7 ± 0.1 6.7 0.023 138 0.55 122 7.0 1.63 0.006 <0.0001 8.3 0.008 0.00008 0.65 0.65 �2.6858.2 5.6 ± 0.1 6.6 <0.001 139 0.51 127 7.3 1.56 0.008 <0.0001 8.1 0.009 0.00012 0.62 0.62 �1.0Quenchd 6.2 ± 0.2 6.2 0.011 139 0.69 121 7.1 1.87 0.016 <0.0001 7.8 0.010 0.00047 0.19 0.19 �3.2Uncertainty ± 1Rj – – 0.005 9 0.05 6 0.4 0.09 0.001 – 0.5 0.003 0.00001 ±3.0% – –Predicted equilibrium valuee – 7.2 – 131 0.67 122 9.5 0.10 2E-05 0.000007 6.3 0.003 – – 0.05 –
EXP-5: water chemistry (mmol/kg), water + granite + epidote + scCO2 experiment
Initial Waterc 5.2 ± 0.1 6.5 0.007 119 0.61 129 7.7 <0.002 0.006 <0.0002 7.0 0.015 0.00004 0.05 0.05 6.021.1 6.1 ± 0.2 7.0 0.004 117 0.67 128 8.5 0.83 0.003 <0.0002 7.8 0.026 0.00027 1.03 1.03 7.347.8 6.2 ± 0.1 6.7 0.036 119 0.58 127 8.7 1.09 0.001 <0.0002 8.5 0.023 0.00013 0.19 0.19 6.8115.6 6.1 ± 0.3 6.9 0.038 120 0.61 126 7.3 1.39 0.002 <0.0002 8.7 0.018 0.00016 0.68 0.68 5.4330.1 5.9 ± 0.3 6.7 0.027 124 0.63 126 7.4 1.65 0.003 <0.0002 8.2 0.020 0.00016 0.49 0.49 4.6666.4 5.9 ± 0.1 6.7 0.028 120 0.62 129 7.8 1.61 0.029 <0.0002 8.5 0.016 0.00019 0.63 0.63 7.3672.1, Inject scCO2
691.4 5.5 ± 0.2 4.5 0.014 121 0.17 129 5.4 2.22 0.187 <0.0002 8.9 0.004 0.00495 15.38 2650 5.8716.7 5.3 ± 0.1 4.4 0.003 119 0.26 130 7.3 2.64 0.116 <0.0002 8.9 0.001 0.00488 19.60 2652 8.1787.3 5.8 ± 0.1 4.5 0.008 117 0.20 131 7.1 3.04 0.096 <0.0002 9.0 0.002 0.00293 9.29 2653 9.11003.2 5.7 ± 0.1 4.6 0.022 139 0.15 129 7.5 3.19 0.026 <0.0002 8.6 0.001 0.00159 14.13 2633 0.01316.0 5.5 ± 0.1 4.5 0.024 135 0.14 130 7.0 3.08 0.017 <0.0002 8.3 0.001 0.00168 17.71 2637 2.1Quenchd 6.5 ± 0.1 6.7 0.016 118 0.78 113 6.4 6.52 0.030 0.01 6.8 0.002 0.01147 12.26 – 1.4Uncertainty ± 1Rj – – 0.005 9 0.05 6 0.4 0.09 0.001 – 0.5 0.003 0.00001 ±3.0% – –Predicted equilibrium valuee, pre-injection
– 7.2 – 138 0.62 129 10.0 0.11 2E-05 0.000008 6.3 0.003 – – 0.1 –
Predicted equilibrium valuee,post-injection
– 5.5 – 138 0.62 157 2.9 0.34 0.006 0.08 6.1 0.002 – – 2570 –
NI = not included because data appear anomalous.a Bench measurements at 20 �C and 0.1 MPa.b Calculated, see Section 2.3 for explanation.c Unreacted water composition.d Water composition after termination of experiment; In situ pH calculated at standard conditions.e See Section 2.3 for explanation.f Measured values correspond to sample collected for bench pH; See Section 3.4 for additional explanation.g (Italicized) Pre-injection in situ values assumed to be same as bench values; See Section 3.4 for additional explanation.h (Bold) Post-injection in situ values calculated; See Sections 2.3 and 3.4 for additional explanation.i Charge balance includes minimal phosphate and bromide values, as well as calculated bicarbonate values (not shown).j One standard deviation of in-house standard (n = 8 for EXP-1, -2, and -3; n = 7 for EXP-4 and -5).
166C
.L
oR
eet
al./G
eoch
imica
etC
osm
och
imica
Acta
141(2014)
160–178

0.0001
0.001
0.01
0.1
1
10
100
1000m
mol
/kg
3
4
5
6
7
pH
0 200 400 600 800Time (hours)
Q P1000
a. EXP-1: Moderate pH Water + Granite
In-Situ pH
Bench pH
Cl
Na
K
SiO2
Ca
SO4
Mg
Al
Inject CO2
0 400 800 1200 1600Time (hours)
Q P
b. EXP-2: Moderate pH Water + Granite + scCO2
In-Situ pH
Bench pH
Cl
Na
K
SiO2
Ca
SO4
Mg
Al
0.0001
0.001
0.01
0.1
1
10
100
1000
mm
ol/k
g
3
4
5
6
7
pH
8
0 200 400 600 800Time (hours)
Q P
c. EXP-4: Water + Epidote + Granite
In-Situ pH
Bench pH
Cl
Na
K
SiO2
Ca
SO4
Mg
Al
Inject CO2
0 400 800 1200Time (hours)
Q P
d. EXP-5: Water + Epidote + Granite + scCO2
In-Situ pH
Bench pH
Cl
Na
K
SiO2
Ca
SO4
Mg
Al
Fig. 1. Water chemistry as a function of time for (a) the water–granite experiment, EXP-1, (b) the moderate pH water–granite–scCO2
experiment, EXP-2, (c) the water–epidote–granite experiment, EXP-4, and (d) the water–epidote–granite–scCO2 experiment, EXP-5. Majorion concentrations and pH are plotted for each experiment. On the right of each graph, quench geochemistry (at 25 �C, 0.1 MPa) andpredicted equilibrium states are plotted for each experiment in the columns labeled ‘Q’ and ‘P,’ respectively. The initial water composition(25 �C, 0.1 MPa) is plotted along the y-axis in each case.
C. Lo Re et al. / Geochimica et Cosmochimica Acta 141 (2014) 160–178 167
time. Post-injection concentrations of SiO2(aq) graduallydecrease over time. Not all analytes establish a steady-stateconcentration by the end of these experiments, includingSiO2(aq), Ca, Mg, SO4, and Al in EXP-2 and SiO2(aq)and Ca in EXP-3.
The water–epidote–granite experiment (EXP-4) and thepre-injection stage of the water–epidote–granite–scCO2
experiment (EXP-5) display relatively constant concentra-tions of Cl, Na, K, and SO4 and increasing concentrationsof SiO2(aq) and Ca (Fig. 1c and d). Concentrations forthese analytes approach steady state at the termination ofEXP-4 and prior to injecting scCO2 into EXP-5. Concen-trations for Al and Mg vary more irregularly over time,but also approach a steady-state concentration, with theexception of Mg in EXP-5.
Post-injection concentrations of Cl, Na, and K are rela-tively constant for EXP-5 (Fig. 1d). Concentrations ofSiO2(aq) and Ca appear to increase during the first 5 daysafter scCO2 injection while SO4 and Al concentrationsdecrease over the same period of time. Post-injection con-centrations of Mg increase abruptly and then gradually
decrease over time. With the exception of Mg, these ana-lytes appear to establish a steady-state concentration priorto the end of the experiment.
When an experiment is cooled and depressurized, it isimportant to collect samples to identify dissolution or pre-cipitation reactions that may be artifacts of the terminationprocess. We refer to this process as ‘quenching’ and to thesamples as ‘quench’ samples. The quench sample data areincluded in Table 3 and shown on Fig. 1 in the columnslabeled ‘Q’. Quench samples contain higher concentrationsof Ca, SO4, and Al and lower concentrations of K com-pared to the samples collected just prior to quenching. Intwo cases, EXP-1 and -5, concentrations of SiO2(aq), Na,and Cl also decrease.
Increased Ca and SO4 suggest possible dissolution of acalcium sulfate during the quench process; we observedno minerals that could explain this observation. DecreasedSiO2(aq), Na, Cl, and possibly K suggest potential precipi-tation of silica and/or halite/sylvite. We observed no salts,but these may have dissolved in the deionized water usedto rinse recovered minerals. We did identify examples of

Table 4Comparison of predicted vs. observed secondary minerals at 250 �C.
EXP-1 EXP-2 EXP-3 EXP-4 EXP-5 Fieldb
Description Water + granite Moderate pHwater + granite + scCO2
Low pHWater + granite + scCO2
Water + epidote+ granite
Water + epidote+ granite + scCO2
–
P O P O P O P O P O
Illitea X X X X X X X X X XSmectite X X X X X X XZeolite X ? ? ? X X XCarbonate X X X XQuartz X X X X X XAlbite X XK-feldspar X X XEpidote X XPrehnite X XFe-oxide/sulfide X X X X
P = predicted mineral, O = observed mineral, X = predicted or observed mineral, ? = suspected mineral; positive identification not possible.a Proxy minerals such as muscovite and phengite are included in this category.b Commonly observed alteration minerals observed in hydrothermal fields at 250 �C (Henley and Ellis, 1983).
168 C. Lo Re et al. / Geochimica et Cosmochimica Acta 141 (2014) 160–178
silica precipitation in both EXP-1 and -5. Increasedconcentrations of Al are more difficult to explain, especiallywith the competing Ca–Na–K–Si reactions alreadyidentified.
A compelling observation is the contrast in SiO2(aq)evolution in the post-injection stages of the water–gran-ite–scCO2 experiment, EXP-2, and the water–epidote–gran-ite–scCO2 experiment, EXP-5. In EXP-2, SiO2(aq)concentrations gradually decrease post-injection whereasin EXP-5, concentrations approach a steady-state.Although we have no way to qualitatively or quantitativelydefine this relationship, these differences are likely due tothe compositions and proportions of smectite and illite thatevolved during the later part of each experiment.
3.4. Total dissolved inorganic carbon
Table 3 includes RCO2(aq) ‘bench’ analyses that corre-spond to degassed and cooled samples exposed to atmo-sphere. Unreacted water used in the experiments startedwith approximately 0.1 mmol/kg RCO2(aq), and afterexposure to compressed air during reaction cell leak tests,increased to a maximum of 0.8 mmol/kg. We also observevariability in the amounts of RCO2(aq) measured duringthe water–rock stage of each experiment (0.1–0.8 mmol/kg) and attribute this to reduced instrument precision nearthe method detection limit. For these samples, contamina-tion (from leak testing with compressed air) and analyticalprecision pose no problem since RCO2(aq) is significantlyundersaturated during the water–rock stage of each exper-iment and no carbonate minerals are present at the begin-ning of the experiments.
We exclude results for in situ RCO2(aq) measurementsbecause of difficulties collecting consistent samples ofexsolved CO2 from CO2-saturated experiments. In orderto conduct geochemical modeling (Section 2.3), we use cal-culated RCO2(aq) concentrations (Table 3). We are able tosubstitute calculated for measured values because
experiments were saturated with respect to post-injectionRCO2
(aq) (Section 2.1). An executable file available from Duanand Sun, representing their 2003 equation of state forCO2, was used for these calculations (Sun, 2011, personalcommunication).
3.5. pH
pH measurements taken in the presence of atmosphereand at 20 �C and 1 bar are included as ‘bench pH’ valuesin Table 3 and shown on Fig. 1. Granite experiments,EXP-1, -2, and -3, had initial pH values of 5.6, 5.7, and3.9, respectively. Epidote–granite experiments, EXP-4 and-5, had initial pH values of 5.1 and 5.2, respectively.
In the case of the water–rock segment of each experi-ment (i.e., no scCO2), bench pH values fluctuate by as muchas ±1.0 over the first 48 h, and then approach steady-statevalues of 5.4–5.5 in EXP-1, -2, and -3 and 5.6–5.9 in EXP-4and -5. After injecting scCO2 into EXP-2, -3, and -5, benchpH values decrease and approach a steady-state value of5.3–5.4 in EXP-2 and -3 and 5.5 in EXP-5 within a coupleof days.
Calculated, in situ pH values are an average of 1.0 unithigher than bench pH values during the water–rock stage ofeach experiment. For those experiments also injected withscCO2 (EXP-2, -3, and -5), post-injection in situ pH valuesare an average of 1.0 unit lower than bench pH values(Table 3 and Fig. 1).
3.6. Theoretical predictions
As predicted by equilibrium calculations, concentrationsfor Cl, Na, K, and generally SiO2(aq) (Table 3 and Fig. 1)correspond well to those measured in the last sample beforethe quench. However, predictions consistently underesti-mate Ca and Mg concentrations (all experiments), andoverestimate SO4 in experiments with scCO2 (EXP-2, -3,
]
]
UnreactedEXP-1: water + graniteEXP-2: moderate pH water + granite + scCO2EXP-3: low pH water + granite + scCO2EXP-4: water + epidote + graniteEXP-5: water + epidote + granite + scCO2
Degrees 2-Theta, Normalized
Rel
ativ
e N
umbe
r of C
ount
s
EXP-5
EXP-3G
rani
te E
xp.
Unreacted
Gra
nite
-Epi
dote
Exp
.
Smectite Peak
Illite Peak
EXP-4
EXP-1
EXP-2
3 109864 5 7
Fig. 2. Normalized and relative XRD diffraction patterns forglycolated clay-fraction samples from the unreacted granite andfrom each experiment. Noted peaks include illite peaks on rightand smectite peaks on left. Illite peaks are evident in samples fromthe unreacted granite and from water–granite ± scCO2 experiments(EXP-1, -2, and -3). Illite peaks are less defined in the water–epidote–granite ± scCO2 experiments (EXP-4 and -5). Smectitepeaks are only evident in experiments with CO2, including water–granite–CO2 experiments (EXP-2 and -3) and the water–epidote–granite–CO2 experiment (EXP-5).
C. Lo Re et al. / Geochimica et Cosmochimica Acta 141 (2014) 160–178 169
and -5). Predicted aluminum concentrations are an averageof �53% higher than measured concentrations in EXP-2, 3,and -5 and an average of �61% lower in EXP-1 and -4. Inaddition, the predicted SiO2(aq) concentration is �26%lower than measured in EXP-5.
Calculated and predicted in situ pH values are includedin Table 3 and shown on Fig. 1. Predicted in situ pH is 0.2–0.3 units higher than calculated values in the water–rockstage of the granite experiments (EXP-1, -2, and -3) and0.5–0.6 units higher in the water–rock stage of the epi-dote–granite experiments (EXP-4 and -5). Post-injection,in situ pH predictions are 1.1–1.4 units lower than calcu-lated for the water–granite–scCO2 experiments (EXP-2and -3) and 1.0 unit lower in the water–epidote–granite–scCO2 experiment (EXP-5). A comparison of predictedand observed secondary mineralogy is presented in Table 4and discussed further in Section 4.1.
4. DISCUSSION
4.1. Experimental vs. theoretical results: paths to equilibrium
Here, we compare experimental results with equilibriumpredictions to determine the extent of system equilibration,the sequence of water–rock reactions, and the water–rockresponse to scCO2 injection. As noted in Section 3.3 andshown in Fig. 1, some major element concentrations reacha steady state over the course of each experiment. Congru-ence between steady state concentrations and equilibriumpredictions (Section 3.6) indicates local equilibrium. In con-trast, some major elements do not reach steady state con-centrations, which suggests on-going reaction. Thisobservation is consistent with the minerals recovered fromthe experiment (Table 4); both reactants and products ofhydrothermal alteration reactions were recovered (i.e., feld-spars as well as clays and zeolites), thus the reactions didnot proceed to completion and the experiments did notattain equilibrium. We provide two sets of activity diagrams(Figs. 5 and 6) to clarify reaction progress. Each figure plotsdata from two experiments, the water–granite–scCO2
experiment, EXP-2, and the water–epidote–granite–scCO2
experiment, EXP-5. The other experiments display similarrelationships as those shown in Figs. 5 and 6.
Fig. 5a and b shows mineral stability fields, aqueous spe-cies activities for each sample, and the final predicted equi-librium state in the CaO–Al2O3–SiO2–H2O–CO2 system forEXP-2 and -5, respectively. Two diagrams are shown foreach experiment and include stability fields for experimen-tal conditions just prior to scCO2 injection (on left) andafter scCO2 injection and just prior to quenching (on right).Notice the calcite stability field increases significantly withaddition of scCO2 (see figure caption for other conven-tions). Fig. 6a and b similarly show mineral stability rela-tionships, aqueous species activities, and the finalpredicted equilibrium state for the K2O–Al2O3–SiO2–H2O–CO2 system. In Fig. 6, the stability fields do not shiftwith addition of scCO2, so pre- and post-injection data areshown on one plot for each experiment. We use heulandite,clinoptilolite-Ca, and mordenite-K as proxy minerals forhigher temperature hydrothermal zeolites (i.e., wairakite);beidellite-Ca and beidellite-K serve as proxy minerals forhydrothermal smectites; and muscovite serves as a proxymineral for illite. The broader mineral group names areused in the following discussion.
The reaction paths in all of the diagrams approach ortrack along the chalcedony stability boundary, indicatingsaturation with chalcedony and supersaturation withquartz. This trend is best explained by the Ostwald step rule(e.g., Rimstidt and Barnes, 1980; Stumm and Morgan,1996). Applying this rule to our system (or a natural sys-tem), it is not unreasonable to find that silica activity is ini-tially controlled by chalcedony instead of quartz; theOstwald step rule permits chalcedony precipitation priorto quartz because chalcedony has a higher solubility andlower fluid–rock interfacial tension than quartz. As previ-ously noted, we observe no silica that formed at in situexperimental conditions, but based on this discussion, ifwe had, it is likely that it would have been chalcedony.

Fig. 3. FE-SEM micrographs of secondary minerals. Each image includes a scale as well as labels for the mineral(s) and associatedexperiment. Images (a) and (b) show typical needle-forming aluminosilicate (zeolite?) and illite petals, respectively, as observed in graniteexperiments, EXP-1, -2, and -3. (c) Typical rosette-forming smectite, as observed in scCO2-containing granite experiments, EXP-2 and -3.Morphology is consistent with euhedral growth in open space. Images (d)–(f) show scheelite, magnetite, and gold, as observed in the low pHwater–granite–scCO2 experiment, EXP-3. (g) Analcime, as observed in the water–epidote–granite experiment, EXP-4. (h) Analcime in a bed ofrosette-forming smectite, as observed in EXP-4. (i) Illite, as observed in EXP-4. (j) Poorly-formed smectite, as observed in scCO2-containingwater–epidote–granite experiment, EXP-5. Images (k) and (i) show blocky and rhombohedral Ca-carbonates from EXP-5. Mineralabbreviations: analcime = Anl; carbonate = Carb; gold = Au; illite = Ill; K-feldspar = Kfs; magnetite = Mt; oligoclase = Olg; scheelite = Sc;smectite = Sm; and zeolite = Zeo.
170 C. Lo Re et al. / Geochimica et Cosmochimica Acta 141 (2014) 160–178
We also note that calculations for the final predictedequilibrium state allowed quartz precipitation (Section 2.3),so predictions necessarily lie along the quartz stabilityboundary and include quartz (Table 4, Section 3.6). Thishas introduced a bias towards lower silica activities forthe final predicted equilibrium state. If calculations allowedchalcedony precipitation, then the predicted equilibrium
states would align with the chalcedony boundary, andtherefore, more closely match observed results. In ourassessment of reaction path progress for each activity dia-gram below, we ignore this bias.
In the water–granite–scCO2 (EXP-2) diagram, speciesactivities for pre-injection samples define a reaction paththat moves from prehnite to zeolite stability (Fig. 5a) and
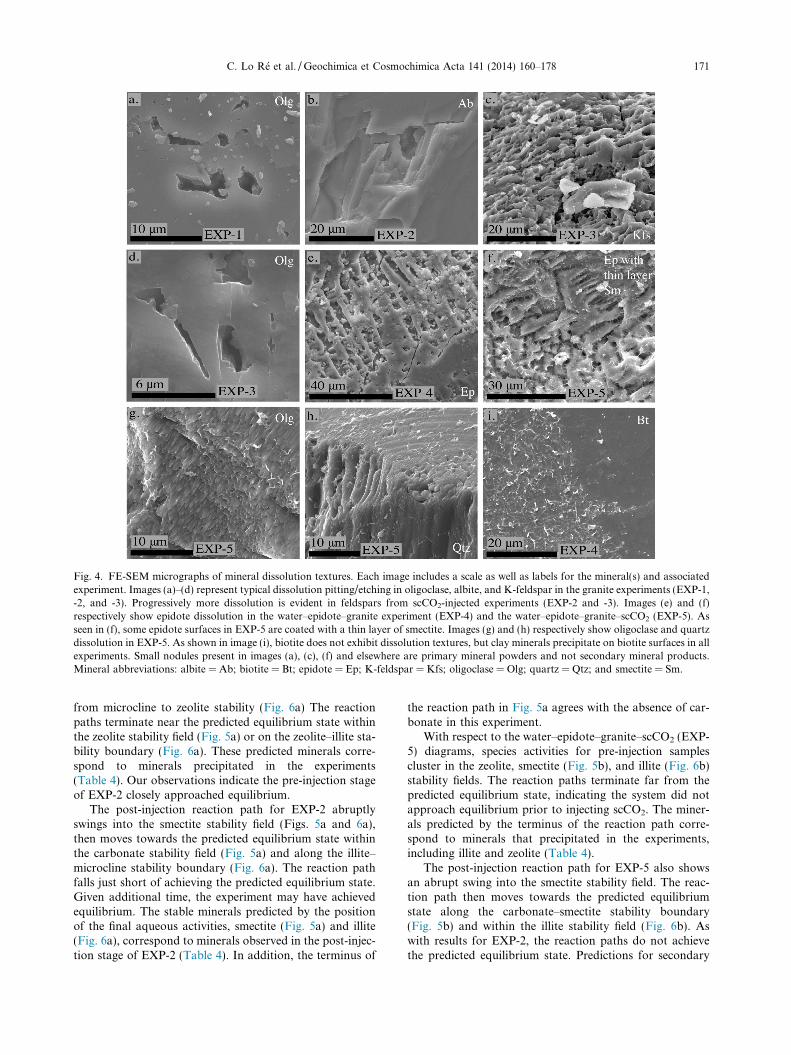
Fig. 4. FE-SEM micrographs of mineral dissolution textures. Each image includes a scale as well as labels for the mineral(s) and associatedexperiment. Images (a)–(d) represent typical dissolution pitting/etching in oligoclase, albite, and K-feldspar in the granite experiments (EXP-1,-2, and -3). Progressively more dissolution is evident in feldspars from scCO2-injected experiments (EXP-2 and -3). Images (e) and (f)respectively show epidote dissolution in the water–epidote–granite experiment (EXP-4) and the water–epidote–granite–scCO2 (EXP-5). Asseen in (f), some epidote surfaces in EXP-5 are coated with a thin layer of smectite. Images (g) and (h) respectively show oligoclase and quartzdissolution in EXP-5. As shown in image (i), biotite does not exhibit dissolution textures, but clay minerals precipitate on biotite surfaces in allexperiments. Small nodules present in images (a), (c), (f) and elsewhere are primary mineral powders and not secondary mineral products.Mineral abbreviations: albite = Ab; biotite = Bt; epidote = Ep; K-feldspar = Kfs; oligoclase = Olg; quartz = Qtz; and smectite = Sm.
C. Lo Re et al. / Geochimica et Cosmochimica Acta 141 (2014) 160–178 171
from microcline to zeolite stability (Fig. 6a) The reactionpaths terminate near the predicted equilibrium state withinthe zeolite stability field (Fig. 5a) or on the zeolite–illite sta-bility boundary (Fig. 6a). These predicted minerals corre-spond to minerals precipitated in the experiments(Table 4). Our observations indicate the pre-injection stageof EXP-2 closely approached equilibrium.
The post-injection reaction path for EXP-2 abruptlyswings into the smectite stability field (Figs. 5a and 6a),then moves towards the predicted equilibrium state withinthe carbonate stability field (Fig. 5a) and along the illite–microcline stability boundary (Fig. 6a). The reaction pathfalls just short of achieving the predicted equilibrium state.Given additional time, the experiment may have achievedequilibrium. The stable minerals predicted by the positionof the final aqueous activities, smectite (Fig. 5a) and illite(Fig. 6a), correspond to minerals observed in the post-injec-tion stage of EXP-2 (Table 4). In addition, the terminus of
the reaction path in Fig. 5a agrees with the absence of car-bonate in this experiment.
With respect to the water–epidote–granite–scCO2 (EXP-5) diagrams, species activities for pre-injection samplescluster in the zeolite, smectite (Fig. 5b), and illite (Fig. 6b)stability fields. The reaction paths terminate far from thepredicted equilibrium state, indicating the system did notapproach equilibrium prior to injecting scCO2. The miner-als predicted by the terminus of the reaction path corre-spond to minerals that precipitated in the experiments,including illite and zeolite (Table 4).
The post-injection reaction path for EXP-5 also showsan abrupt swing into the smectite stability field. The reac-tion path then moves towards the predicted equilibriumstate along the carbonate–smectite stability boundary(Fig. 5b) and within the illite stability field (Fig. 6b). Aswith results for EXP-2, the reaction paths do not achievethe predicted equilibrium state. Predictions for secondary

Fig. 5. Mineral stability relationships, aqueous species activities for individual samples, and predicted equilibrium states in the CaO–Al2O3–SiO2–H2O–CO2 system for (a) the water–granite–scCO2 experiment, EXP-2 and (b) the water–epidote–granite–scCO2 experiment, EXP-5.Two diagrams are shown for each experiment and include stability fields for experimental conditions immediately prior to scCO2 injection (onleft) and after scCO2 injection and immediately prior to terminating the experiment (on right). The dashed, vertical lines represent saturationwith respect to quartz (‘q’), chalcedony (‘c’), and amorphous silica (‘a’). Activities for aqueous species in sequential, pre-injection samples areon the left side; activities for aqueous species in post-injection samples are on the right side. Wide, gray arrows indicate the general path toequilibrium within each experiment. Predicted pre- and post-injection equilibrium states are shown using dark and light-colored stars,respectively. Mineral abbreviations: smectite = Sm and zeolite = Zeo.
172 C. Lo Re et al. / Geochimica et Cosmochimica Acta 141 (2014) 160–178
minerals agree with the presence of illite and smectite inEXP-5 (Table 4). In addition, the terminus of the reactionpath in Fig. 5b agrees with the absence of carbonate in thisexperiment.
The changes in reaction paths in response to scCO2
injection merit comment. Initially, the abrupt increase inlog (aAl3+)/(aH+)3 drives the reaction pathways away frompredicted equilibrium activities with calcite (Fig. 5) andillite (Fig. 6). Activities for H+ and Al3+ of individual
samples (collected just prior to and just after scCO2 injec-tion) increase by 2 and 8 orders of magnitude, respectively.The Al3+ activity initially exceeds H+ activity. Over time,Al3+ activity gradually decreases driving the reaction path-ways back towards predicted equilibrium.
The activity diagrams for the low pH water–granite–scCO2 experiment (not shown for brevity), EXP-3, aresimilar to those shown for EXP-2 (Figs. 5 and 6) withone significant difference: log (aAl3+)/(aH+)3 of some of
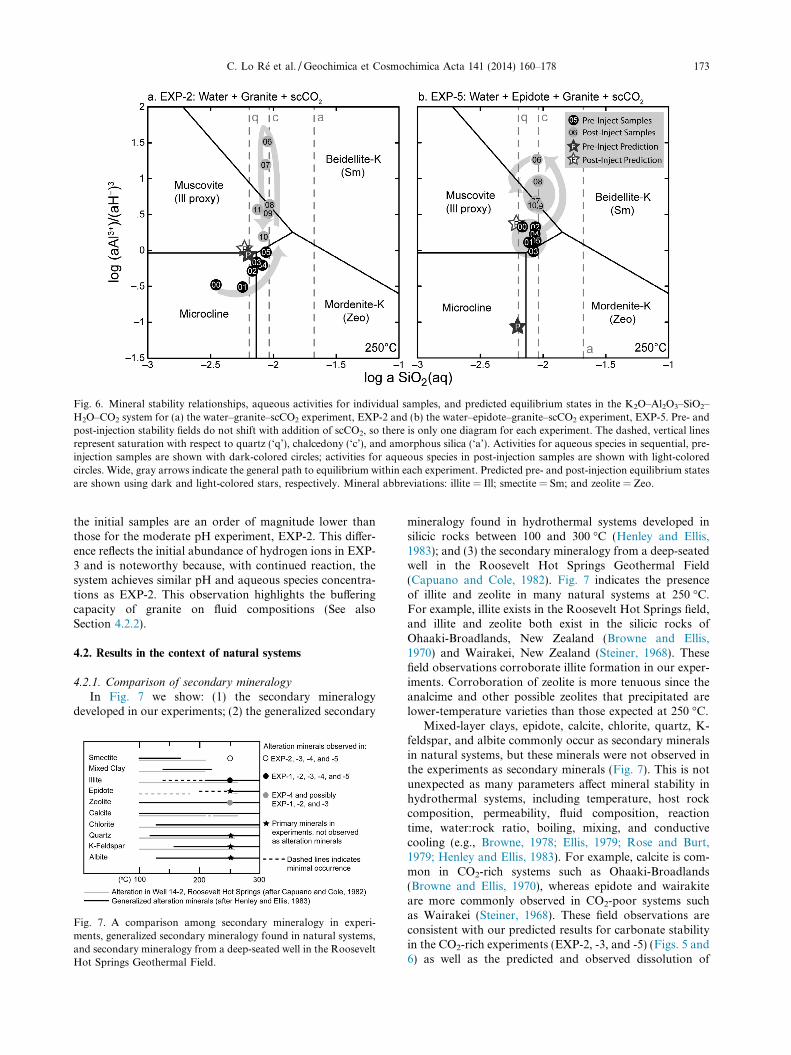
Fig. 6. Mineral stability relationships, aqueous activities for individual samples, and predicted equilibrium states in the K2O–Al2O3–SiO2–H2O–CO2 system for (a) the water–granite–scCO2 experiment, EXP-2 and (b) the water–epidote–granite–scCO2 experiment, EXP-5. Pre- andpost-injection stability fields do not shift with addition of scCO2, so there is only one diagram for each experiment. The dashed, vertical linesrepresent saturation with respect to quartz (‘q’), chalcedony (‘c’), and amorphous silica (‘a’). Activities for aqueous species in sequential, pre-injection samples are shown with dark-colored circles; activities for aqueous species in post-injection samples are shown with light-coloredcircles. Wide, gray arrows indicate the general path to equilibrium within each experiment. Predicted pre- and post-injection equilibrium statesare shown using dark and light-colored stars, respectively. Mineral abbreviations: illite = Ill; smectite = Sm; and zeolite = Zeo.
C. Lo Re et al. / Geochimica et Cosmochimica Acta 141 (2014) 160–178 173
the initial samples are an order of magnitude lower thanthose for the moderate pH experiment, EXP-2. This differ-ence reflects the initial abundance of hydrogen ions in EXP-3 and is noteworthy because, with continued reaction, thesystem achieves similar pH and aqueous species concentra-tions as EXP-2. This observation highlights the bufferingcapacity of granite on fluid compositions (See alsoSection 4.2.2).
4.2. Results in the context of natural systems
4.2.1. Comparison of secondary mineralogy
In Fig. 7 we show: (1) the secondary mineralogydeveloped in our experiments; (2) the generalized secondary
Fig. 7. A comparison among secondary mineralogy in experi-ments, generalized secondary mineralogy found in natural systems,and secondary mineralogy from a deep-seated well in the RooseveltHot Springs Geothermal Field.
mineralogy found in hydrothermal systems developed insilicic rocks between 100 and 300 �C (Henley and Ellis,1983); and (3) the secondary mineralogy from a deep-seatedwell in the Roosevelt Hot Springs Geothermal Field(Capuano and Cole, 1982). Fig. 7 indicates the presenceof illite and zeolite in many natural systems at 250 �C.For example, illite exists in the Roosevelt Hot Springs field,and illite and zeolite both exist in the silicic rocks ofOhaaki-Broadlands, New Zealand (Browne and Ellis,1970) and Wairakei, New Zealand (Steiner, 1968). Thesefield observations corroborate illite formation in our exper-iments. Corroboration of zeolite is more tenuous since theanalcime and other possible zeolites that precipitated arelower-temperature varieties than those expected at 250 �C.
Mixed-layer clays, epidote, calcite, chlorite, quartz, K-feldspar, and albite commonly occur as secondary mineralsin natural systems, but these minerals were not observed inthe experiments as secondary minerals (Fig. 7). This is notunexpected as many parameters affect mineral stability inhydrothermal systems, including temperature, host rockcomposition, permeability, fluid composition, reactiontime, water:rock ratio, boiling, mixing, and conductivecooling (e.g., Browne, 1978; Ellis, 1979; Rose and Burt,1979; Henley and Ellis, 1983). For example, calcite is com-mon in CO2-rich systems such as Ohaaki-Broadlands(Browne and Ellis, 1970), whereas epidote and wairakiteare more commonly observed in CO2-poor systems suchas Wairakei (Steiner, 1968). These field observations areconsistent with our predicted results for carbonate stabilityin the CO2-rich experiments (EXP-2, -3, and -5) (Figs. 5 and6) as well as the predicted and observed dissolution of

174 C. Lo Re et al. / Geochimica et Cosmochimica Acta 141 (2014) 160–178
epidote in the water–epidote–granite–CO2 experiment,EXP-5 (Fig. 4f).
Silica stability in natural systems also informs us aboutour experimental results. Natural geothermal waters above180 �C are often in equilibrium with quartz (Fournier andRowe, 1966; Mahon, 1966; Fournier, 1983). Our calcula-tions also indicate quartz should control silica saturationin the experiments. However, we do not observe secondaryquartz attributable to formation at 250 �C even though ourcalculations suggest oversaturation with quartz. This dis-crepancy confirms that our experiments did not achieveequilibrium. Additionally, natural geothermal fluids areoften quartz-saturated at depth and, upon ascent, SiO2(aq)concentrations increase. Resulting fluids precipitate amor-phous silica or opal at or near the surface (Fournier andRowe, 1966; Rimstidt, 1997). Quench-related silicaobserved in EXP-1 and -5 (Sections 3.1 and 3.3) forms bythe analogous process of cooling and depressurizing thecompleted experiment.
The most conspicuous difference among our results,other published experimental results (Appendix A), andnatural systems (Fig. 7) is that smectite is commonly pro-duced in experiments at temperatures up to 500 �C but isunstable in natural systems at temperatures above 180–220 �C (Henley and Ellis, 1983). Our most reliable under-standing of smectite stability comes from natural systems(e.g., Reyes and Cardile, 1989; Schiffman andFridleifsson, 1991; Inoue et al., 1992; Beaufort et al.,1995; Patrier et al., 1996; Fulignati et al., 1997; Gianelliet al., 1998; Rigault et al., 2010), so it follows that we relyon the geochemistry and mineralogy of these systems tohelp us interpret smectite ‘stability’ and the drivers of smec-tite formation at temperatures greater than 220 �C. Sincestable smectite is not observed in natural systems at250 �C, our geochemical predictions of stable smectite areprobably inaccurate. We attribute this inaccuracy to poorlyconstrained thermodynamic data for systems containingcomplex, solid-solution minerals such as smectite, illite,and zeolite (e.g., Langmuir, 1997).
In comparing our results to natural systems, we alsoinfer that smectite in our experiments is metastable. Hightemperature smectites are recognized as metastable in natu-ral systems, with formation generally in response to phys-ico-chemical processes including mixing and/or boiling(e.g., Beaufort et al., 1995; Patrier et al., 1996; Fulignatiet al., 1997; Rigault et al., 2010). Smectite in high tempera-ture regimes has also been explained as a relict phase (e.g.,Schiffman and Fridleifsson, 1991; Rigault et al., 2010) thatmay persist due to kinetics and/or shielding caused byswelling clays that prevent continued fluid–rock interaction(Reed, 1997).
In addition to temperature changes, there are a varietyof factors that can account for variations in clay formationamong theoretical, experimental, and natural systemsincluding water:rock ratio (e.g., Seyfried and Bischoff,1977; Giggenbach, 1984; Savage et al., 1987; Whitney,1990), permeability (e.g., Patrier et al., 1996; Fulignatiet al., 1997), silica activity or stability (e.g., Giggenbach,1988; Abercrombie et al., 1994; Hutcheon et al., 1994;Vidal et al., 2012), kinetics (e.g., Mottl and Holland,
1978; Schiffman and Fridleifsson, 1991; Patrier et al.,1996), CO2 concentrations (e.g., Giggenbach, 1984), and/or iron and magnesium content (e.g., Mottl and Holland,1978; Reyes and Cardile, 1989). We believe metastablesmectite formed in our experiments due to a combinationof factors including kinetics and relatively high (1) water:rock ratios; (2) silica activities; (3) CO2 concentrations;and (4) magnesium–iron concentrations (Section 3.1).
4.2.2. Application of results to other natural systems
Our results also apply to other natural processes such asthe buffering capacity of granitic rocks, styles of clay forma-tion, and tungsten ore formation. During pluton emplace-ment and cooling, magmatic volatiles such as CO2, SO2,HCl, and H2O escape outwards and mix with local meteoricgroundwater. As warm, acidic fluids ascend, they react withcountry rock and become progressively neutralized becauseof the buffering capacity of the wall rock. This progressionhas implications for the evolution of ore fluids and iscommonly observed in epithermal and porphyry copperdeposits (e.g., Reed, 1997 and references therein). Ourexperimental work simulates this type of process, althoughat higher pH. The pre-injection stage of the low pH water–granite–scCO2 experiment, EXP-3, shows how HCl-richfluids might interact with wall rock. Over a period of28 days, the pH of this experiment increases from 3.9 to6.5 (Table 3) demonstrating the capacity of the granite tobuffer acidic fluids. This buffering capacity is consistentwith neutral pH conditions and processes in many naturalgeothermal systems (Ellis, 1979; Reed, 1997).
The morphology of clay minerals (illite and smectite)formed in our experiments also elucidates specific processesin natural systems. In particular, hydrothermal clay forma-tion is thought by some to mimic that of diagenetic clay for-mation whereby smectite is a precursor to illite, with theconversion taking place due to increasing temperature(e.g., Inoue et al., 1992). Other researchers suggest hydro-thermal clay formation can proceed via direct precipitation(e.g., Bethke et al., 1986; Wang and Xu, 2006). This debatealso ties into field observations that document the forma-tion of smectite and mixed-layer illite/smectite at tempera-tures (<�220 �C) lower than those required for theformation of illite (Henley and Ellis, 1983; Inoue, 1995).Illite and smectite may be present in hydrothermal rocksas distinct minerals or as mixed-layer illite/smectite(Inoue, 1995). In our experiments, illite and smectite exhibitno textural evidence for interlayering or prograde reactions.Smectite precipitation occurred only after scCO2 injection,and its morphology is suggestive of precipitation in openspaces (Fig. 3c). In the context of the debate regardinghydrothermal clay formation, therefore, our experimentalresults indicate that: (1) temperature may not always dictateclay formation (see also Section 4.2.1); and (2) clays canprecipitate directly from solution.
Scheelite precipitated in the low pH water–granite–scCO2 experiment (EXP-3) but not in any of the otherexperiments. Although tungsten was introduced as a con-taminant (Section 3.1), it is appropriate to explore mecha-nisms for scheelite formation since it is found naturallyin granitic hydrothermal systems (Hedenquist and
C. Lo Re et al. / Geochimica et Cosmochimica Acta 141 (2014) 160–178 175
Lowenstern, 1994). Homogenization temperatures of fluidinclusions in scheelite range from 200 to 400 �C, with mostoccurrences ranging from 200 to 300 �C (Naumov et al.,2011). Fluid inclusion data also suggest that scheelite ismore prevalent in association with CO2-rich fluids(Naumov et al., 2011). Formation of scheelite in EXP-3,therefore, corroborates available fluid inclusion data fornatural systems.
4.3. Implications for engineered systems
Our results have implications for conventional geother-mal systems (including CPG), non-conventional geother-mal systems (including EGS), and CCS reservoirs withrespect to porosity/permeability changes, geothermal cap-ping or cap thickening, and carbon sequestration potential.Upon initial development of a system, with or withoutscCO2, the most obvious impacts may be on porosity andpermeability. Our experiments indicate water–rock systemswithout scCO2 precipitate illite and that water–rock–scCO2
systems precipitate smectite. This generalization applies toboth water–granite ± scCO2 and water–epidote–gran-ite ± scCO2 systems. Therefore, with respect to water-basedand CO2-based geothermal operations, operators mayanticipate illite and smectite precipitation, respectively,within production pathways. Illite and especially smectite,a swelling clay, have the potential to greatly affect reservoirporosity and permeability. For example, sandstones witheven a few percent smectite will, in general, exhibit ordersof magnitude lower permeability than sandstones of thesame porosity but no clay content (Nelson, 1994;McPherson and Bredehoeft, 2001). Clays may similarlyform in and affect deep, arkosic reservoirs targeted for car-bon sequestration projects. With continued reaction time,carbonate and/or silica precipitation may also affect theporosity/permeability of exploited granitic or arkosicreservoirs.
Our results also indicate the possibility of either creatingor thickening a geothermal cap due to mineral precipitationwithin or on the edges of a targeted reservoir. In nature,geothermal caps reduce permeability above the main heat-producing reservoir and generally form as a result of silicaand silicate deposition triggered by boiling, mixing of warmCO2-charged, NaCl–waters and cold meteoric waters, orinteraction of steam and gas with cold meteoric waters(Mahon et al., 1980; Hedenquist, 1990; Simmons andBrowne, 2000). In this study, experiments emulate condi-tions under which geothermal caps form in natural systems:NaCl–waters used in the pre-injection experimental seg-ments are ‘mixed’ with CO2, after injection, causing precip-itation reactions that mimic creation or thickening of ageothermal cap. Disadvantages and benefits of such a geo-thermal cap should be considered during development andutilization of geothermal systems.
Our experimental results also contribute to researchaddressing possible carbon sequestration in granite-hostedreservoirs (e.g., Liu et al., 2003; Ueda et al., 2005; Sutoet al., 2007; Lin et al., 2008) and arkosic reservoirs (e.g.,Kaszuba et al., 2005; Rosenbauer et al., 2005;Mandalaparty et al., 2011). With respect to mineral
trapping, where carbon is sequestered by carbonate miner-als, our models predict carbonate formation after injectionof scCO2 into the experiments. However, carbonates didnot precipitate until the experiments were terminated (i.e.,cooled and degassed). Cooling and degassing of scCO2-bearing fluids in geothermal reservoirs may likewise leadto carbonate mineralization and plugging of near-surfaceproduction pathways. By analogy to our experiments, car-bonate mineralization in geothermal reservoirs containingscCO2-bearing working fluids is not expected until later inproduction. With respect to dissolution trapping, wherebycarbon is stored in the water, carbonic acid concentrationsincrease significantly after injection of CO2 into experi-ments (EXP-2, -3, and -5). Thus, dissolution trappingmay be a viable sequestration mechanism early in a geo-thermal operation.
5. CONCLUSIONS
This paper describes experimental results and geochem-ical models in systems containing water + granite ± epi-dote ± scCO2 at temperatures typical of hot geothermalreservoirs (250 �C). Results and implications follow.
(1) At high water:rock ratios (20:1–10:1), feldspar andepidote are the most reactive minerals. Secondaryminerals include illite ± smectite ± zeolite(?), andwaters are supersaturated with respect to quartzand saturated with respect to chalcedony.
(2) Mineral stability relationships, aqueous geochemis-try, and experimental observations are self-consistentand suggest that fluid–rock interactions do notachieve the predicted equilibrium states at laboratorytime scales.
(3) Smectite, not carbonate, precipitates in experimentsafter injection of scCO2.
(4) Smectite is predicted as a stable mineral in the water–epidote–granite ± scCO2 experiments (EXP-4 and-5). However, these predictions are demonstrated tobe inaccurate due to incomplete thermodynamicdata. In the context of other available research, webelieve smectite is metastable in all of our experi-ments and has formed due to kinetics and relativelyhigh water:rock ratios, silica activities, CO2 concen-trations, and magnesium–iron concentrations.
(5) Experimental results corroborate natural processesrelating to the buffering capacity of granites, the driv-ers of clay formation, and tungsten ore formation.
(6) Metastable clay precipitation is likely in granite- orarkosic-hosted engineered systems. Illite may be thedominant clay in water-dominated operations,whereas smectite may be the dominant clay in CO2-based operations. Related porosity and permeabilitychanges need to be understood and addressed to opti-mize geothermal resource management and sustain-ability since even very small amounts of clay canaffect rock permeability by orders of magnitude.
(7) Silicate formation, including clay formation, maycreate or thicken caps within or on the edges of sur-rounding engineered reservoirs. Such changes should

176 C. Lo Re et al. / Geochimica et Cosmochimica Acta 141 (2014) 160–178
be taken into consideration during development,operation, and closure of these systems. In the caseof closure, silicate formation may actually help toisolate the system.
(8) As desired for carbon sequestration projects thatcoincide with engineered systems, carbonate forma-tion may require extended periods of time, barringdegassing of a system. Although mineral trappingmechanisms may be slow, dissolution trapping ofcarbon species is fast (days), and is a possible mech-anism for sequestration in these systems.
Additional experiments evaluating water + gran-ite ± scCO2 ± chlorite ± calcite interactions have beencompleted; these experiments are the foundation of ournext paper on the subject. Geochemical modeling, includingkinetic analysis, is also being conducted on the entireensemble of experiments (Pan et al., 2012).
ACKNOWLEDGEMENTS
This project is supported by DOE grant DE – EE0002766 toMcPherson, Moore, and Kaszuba, the University of Wyoming(UW) School of Energy Resources (SER), and an EncanaCorporation graduate assistantship to Lo Re. The experimentalhydrothermal laboratory was constructed with funding fromSER. Caroline Lo Re thanks Virginia Marcon and Mary KateMcCarney (UW) for immeasurable support in the laboratory.We also thank Norbert Swoboda-Colberg and Susan Swapp forXRD and SEM support as well as Kellie Antrobus for BET anal-yses (UW). We acknowledge Peter Lichtner (Los AlamosNational Laboratory) for geochemical modeling assistance andFred Luiszer (University of Colorado, Laboratory for Environ-mental and Geological Studies) for aqueous analyses. Three anon-ymous reviewers and the editor also helped to greatly improve thefinal manuscript.
APPENDIX A. SUPPLEMENTARY DATA
Supplementary data associated with this article can befound, in the online version, at http://dx.doi.org/10.1016/j.gca.2014.06.015.
REFERENCES
Abercrombie H. J., Hutcheon I. E., Bloch J. D. and de Caritat P.(1994) Silica activity and the smectite–illite reaction. Geology
22, 539–542.Beaufort D., Papapanagiotou P., Fujimoto K., Patrier P. and
Kasai K. (1995) High temperature smectites in active geother-mal systems. In Water–Rock Interaction (eds. Y. K. Kharakaand O. V. Chudaev). A.A. Balkema, Rotterdam, Netherlands,pp. 493–496.
Benson S. and Cook P. (2005) Underground geological storage. InIPCC Special Report on Carbon Dioxide Capture and Storage.
Intergovernmental Panel on Climate Change, Interlaken, Swit-
zerland. pp. 5.1–5.134 (Chapter 5).Bethke C. M. and Yeakel S. (2009) The Geochemist’s Workbench
Release 8.0: Reaction Modeling Guide. University of Illinois,Champaign, Illinois.
Bethke C. M., Vergo N. and Altaner S. P. (1986) Pathways ofsmectite illitization. Clays Clay Min. 34, 125–135.
Brown D. (2000) A Hot Dry Rock geothermal energy conceptutilizing supercritical CO2 instead of water. In Proceedings of
the Twenty-Fifth Workshop on Geothermal Reservoir Engineer-
ing. Stanford University, Palo Alto, CA, pp. 233–238.Browne P. R. L. (1978) Hydrothermal alteration in active
geothermal fields. Annu. Rev. Earth Planet. Sci. 6, 229–250.Browne P. R. L. and Ellis A. J. (1970) The Ohaki-Broadlands
Hydrothermal Area, New Zealand: mineralogy and relatedgeochemistry. Am. J. Sci. 269, 97–131.
Brunauer S., Emmett P. H. and Teller E. (1938) Adsorption ofgases in multimolecular layers. J. Am. Chem. Soc. 60, 309–319.
Capuano R. M. and Cole D. R. (1982) Fluid–mineral equilibria ina hydrothermal system, Roosevelt Hot Springs, Utah. Geochim.
Cosmochim. Acta 46, 1353–1364.Duan Z. H. and Sun R. (2003) An improved model calculation
CO2 solubility in pure water and aqueous NaCl solutions from273 to 533 K and from 0 to 2000 bar. Chem. Geol. 193, 257–271.
Duan Z. H., Sun R., Zhu C. and Chou I. (2006) An improvedmodel for the calculation of CO2 solubility in aqueous solutionscontaining Na+, K+, Ca2+, Mg2+, Cl�, and SO4
2�. Mar. Chem.
98, 131–139.Ellis A. J. (1979) Explored geothermal systems. In Geochemistry of
Hydrothermal Ore Deposits (ed. H. L. Barnes). John Wiley &Sons, New York, pp. 632–684.
Fournier R. O. (1983) A method of calculating quartz solubilities inaqueous sodium chloride solutions. Geochim. Cosmochim. Acta
47, 579–586.Fournier R. O. and Rowe J. J. (1966) Estimation of underground
temperatures from the silica content of water from hot springsand wet-steam wells. Am. J. Sci. 264, 685–697.
Fulignati P., Malfitano G. and Sbrana A. (1997) The Pantelleriacaldera geothermal system: data from the hydrothermal min-erals. J. Volcanol. Geotherm. Res. 75, 251–270.
Gianelli G., Mekuria N., Battaglia S., Chersicla A., Garofalo P.,Ruggieri G., Manganelli M. and Gebregziabher Z. (1998)Water–rock interaction and hydrothermal mineral equilibria inthe Tendaho geothermal system. J. Volcanol. Geotherm. Res.
86, 253–276.Giggenbach W. F. (1984) Mass transfer in hydrothermal alteration
systems – a conceptual approach. Geochim. Cosmochim. Acta
48, 2693–2711.Giggenbach W. F. (1988) Geothermal solute equilibria. Derivation
of Na–K–Mg–Ca geoindicators. Geochim. Cosmochim. Acta 52,2749–2765.
Hedenquist J. W. (1990) The thermal and geochemical structure ofthe Broadlands-Ohaaki Geothermal System, New Zealand.Geothermics 19, 151–185.
Hedenquist J. W. and Lowenstern J. B. (1994) The role of magmasin the formation of hydrothermal ore deposits. Nature 370,519–527.
Henley R. W. and Ellis A. J. (1983) Geothermal systems ancientand modern: a geochemical review. Earth Sci. Rev. 19, 1–50.
Hutcheon I., de Caritat P. and Abercrombie H. J. (1994) Clayminerals – equilibrium modes and temperature indicators. InAlteration and Alteration Processes Associated with Ore-forming
Systems (ed. D. R. Lentz). Geological Association of Canada,Waterloo, Ontario, pp. 43–67.
Inoue A. (1995) Formation of clay minerals in hydrothermalenvironments. In Origin and Mineralogy of Clays: Clays and the
Environment (ed. B. Velde). Springer-Verlag, New York, pp.245–329.
Inoue A., Utada M. and Wakita K. (1992) Smectite-to-illiteconversion in natural hydrothermal systems. Appl. Clay Sci. 7,131–145.
Kaszuba J. P., Janecky D. R. and Snow M. G. (2005) Experimentalevaluation of mixed fluid reactions between supercritical carbon

C. Lo Re et al. / Geochimica et Cosmochimica Acta 141 (2014) 160–178 177
dioxide and NaCl brine: relevance to the integrity of a geologiccarbon repository. Chem. Geol. 217, 277–293.
Kaszuba J. P., Viswanathan H. S. and Carey J. W. (2011) Relativestability and significance of dawsonite and aluminum mineralsin geologic carbon sequestration. Geophys. Res. Lett. 38,L08404.
Langmuir D. (1997) Aqueous Environmental Chemistry. PrenticeHall, Upper Saddle River, NJ.
Lin H., Fujii T., Takisawa R., Takahashi T. and Hashida T. (2008)Experimental evaluation of interactions in supercritical CO2/water/rock minerals system under geologic CO2 sequestrationconditions. J. Mater. Sci. 43, 2307–2315.
Liu L., Suto Y., Bignall G., Yamasaki N. and Hashida T. (2003)CO2 injection to granite and sandstone in experimental rock/hot water systems. Energy Convers. Manag. 44, 1399–1410.
Lu P., Fu Q., Seyfried, Jr., W. E., Hedges S. W., Soong Y., JonesK. and Zhu C. (2013) Coupled alkali feldspar dissolution andsecondary mineral precipitation in batch systems 2: newexperiments with supercritical CO2 and implications for carbonsequestration. Appl. Geochem. 30, 75–90.
Mahon W. A. J. (1966) Silica in hot water discharged fromdrillholes at Wairakei, New Zealand. N. Z. J. Sci. 9, 135–144.
Mahon W. A. J., Klyen L. E. and Rhode M. (1980) Neutralsodium/bicarbonate/sulphate hot waters in geothermal systems.J. Jpn. Geotherm. Energy Assoc. 17, 11–24.
Mandalaparty P., Deo M. and Moore J. (2011) Gas-compositionaleffects on mineralogical reactions in carbon dioxide sequestra-tion. SPE J., 949–958, SPE 124909.
Massachusetts Institute of Technology (2006). The future ofgeothermal energy: impact of enhanced geothermal systems(EGS) on the United States in the 21st century: An assessment.Cambridge, MA.
McPherson B. J. O. L. and Bredehoeft J. D. (2001) Overpressuresin the Uinta basin, Utah: analysis using a three-dimensionalbasin evolution model. Water Resour. Res. 37, 857–871.
Moore J. N. and Simmons S. F. (2013) More power from below.Science 340, 933–934.
Mottl M. J. and Holland H. D. (1978) Chemical exchange duringhydrothermal alteration of basalt by seawater – I. Experimentalresults for major and minor components of seawater. Geochim.
Cosmochim. Acta 42, 1103–1115.Naumov V. B., Dorofeev V. A. and Mironova O. F. (2011)
Physicochemical parameters of the formation of hydrothermaldeposits: A fluid inclusion study. I. Tin and tungsten deposits.Geochem. Int. 49, 1002–1021.
Nelson P. H. (1994) Permeability–porosity relationships in sedi-mentary rocks. Log Anal. 38–62, 1994.
Newell D. L., Kaszuba J. P., Viswanathan H. S., Pawar R. J. andCarpenter T. (2008) Significance of carbonate buffers in naturalwaters reacting with supercritical CO2: Implications for mon-itoring, measuring and verification (MMV) of geologic carbonsequestration. Geophys. Res. Lett. 35, L23403.
Pan F., McPherson B. J., Lichtner P. C., Karra S., Lo Re C.,Kaszuba J. P., Lu C., and Xu T. (2012) Numerical simulationsof interactions between supercritical CO2 and high-temperaturefractured rocks in enhanced geothermal systems. In Proceed-
ings: Thirty-Seventh Workshop on Geothermal Reservoir Engi-
neering. Stanford University, Palo Alto, CA. SGP-TR-194.Patrier P., Papapanagiotou P., Beaufort D., Traineau H., Bril H.
and Rojas J. (1996) Role of permeability versus temperature inthe distribution of the fine (<0.2 m) clay fraction in theChipilapa geothermal system (El Salvador, Central America).J. Volcanol. Geotherm. Res. 72, 101–120.
Pruess K. (2006) Enhanced geothermal systems (EGS) using CO2
as working fluid – a novel approach for generating renewable
energy with simultaneous sequestration of carbon. Geothermics
35, 351–367.Randolph J. B. and Saar M. O. (2011) Combining geothermal
energy capture with geologic carbon dioxide sequestration.Geophys. Res. Lett. 38, L10401. http://dx.doi.org/10.1029/2011GL047265.
Reed M. H. (1997) Hydrothermal alteration and its relationship toore fluid composition. In Geochemistry of Hydrothermal Ore
Deposits (ed. H. L. Barnes). John Wiley & Sons, New York, pp.303–365.
Reyes A. G. and Cardile C. M. (1989) Characterization of clayscales forming in Phillipine geothermal wells. Geothermics 18,429–446.
Rigault C., Patrier P. and Beaufort D. (2010) Clay minerals relatedto circulation of near neutral to weakly acidic fluids in activehigh energy geothermal systems. Bull. Soc. Geol. Fr. 181, 337–347.
Rimstidt J. D. (1997) Gangue mineral transport and deposition. InGeochemistry of Hydrothermal Ore Deposits (ed. H. L. Barnes).John Wiley & Sons, New York, pp. 487–516.
Rimstidt J. D. and Barnes H. L. (1980) The kinetics of silica–waterreactions. Geochim. Cosmochim. Acta 44, 1683–1699.
Rose A. W. and Burt D. M. (1979) Hydrothermal alteration. InGeochemistry of Hydrothermal Ore Deposits (ed. H. L. Barnes).John Wiley & Sons, New York, pp. 632–684.
Rosenbauer R. J., Koksalan T. and Palandri J. L. (2005)Experimental investigation of CO2–brine–rock interactions atelevated temperature and pressure: implications for CO2
sequestration in deep-saline aquifers. Fuel Process. Technol.
86, 1581–1597.Savage D., Cave M. R., Milodowski A. E. and George I. (1987)
Hydrothermal alteration of granite by meteoric fluid: anexample from the Carnmenellis Granite, United-Kingdom.Contrib. Mineral. Petrol. 96, 391–405.
Schiffman P. and Fridleifsson G. O. (1991) The smectite–chloritetransition in drillhole NJ-15, Nesjavellir geothermal field,Iceland: XRD, BSE and electron microprobe investigations.J. Metamorphic Geol. 9, 679–696.
Seyfried, Jr., W. E. and Bischoff J. L. (1977) Hydrothermaltransport of heavy metals by seawater: the role of seawater/basalt ratio. Earth Planet. Sc. Lett. 34, 71–77.
Seyfried, Jr., W. E., Janecky D. R. and Berndt M. E. (1987)Rocking autoclaves for hydrothermal experiments, II. Theflexible reaction-cell system. In Hydrothermal Experimental
Techniques (eds. G. C. Ulmer and H. L. Barnes). John Wiley &Sons, New York, pp. 216–239.
Simmons S. F. and Browne P. R. L. (2000) Hydrothermal mineralsand precious metals in the Broadlands-Ohaaki GeothermalSystem: Implications for understanding low-sulfidation epither-mal environments. Econ. Geol. 95, 971–999.
Steiner A. (1968) Clay minerals in hydrothermally altered rocks atWairakei, New Zealand. Clays Clay Min. 16, 193–213.
Stumm W. and Morgan J. J. (1996) Aquatic Chemistry: Chemical
Equlibria and Rates in Natural Waters. John Wiley & Sons, NewYork.
Sun R. (2011) Personal email communication to Xiuyu Wang(University of Wyoming) regarding executable file for Duan &Sun, 2003. November 20.
Suto Y., Liu L., Yamasaki N. and Hashida T. (2007) Initialbehavior of granite in response to injection of CO2-saturatedfluid. Appl. Geochem. 22, 202–218.
Ueda A., Kato K., Oshumi T., Yajima T., Ito H., Kaieda H.,Metcalfe R. and Takase H. (2005) Experimental studies ofCO2–rock interaction at elevated temperatures under hydro-thermal conditions. Geochem. J. 39, 417–425.

178 C. Lo Re et al. / Geochimica et Cosmochimica Acta 141 (2014) 160–178
Vidal O., Baldeyrou A., Beaufort D., Fritz B., Geoffroy N. andLanson B. (2012) Experimental study of the stability and phaserelations of clays at high temperatures in a thermal gradient.Clays Clay Min. 60, 200–225.
Wang Y. and Xu H. (2006) Geochemical chaos: periodic andnonperiodic growth of mixed-layer phyllosilicates. Geochim.
Cosmochim. Acta 70, 1995–2005.Ward S. H., Parry W. T., Nash W. P., Sill W. R., Cook K. L.,
Smith R. B., Chapman D. S., Brown F. H., Whelan J. A. and
Bowman (1978) A summary of the geology, geochemistry, andgeophysics of the Roosevelt Hot Springs thermal area, Utah.Geophysics 43, 1515–1542.
Whitney G. (1990) Role of water in the smectite-to-illite reaction.Clays Clay Min. 38, 343–350.
Associate editor: Clark M. Johnson