Embed Size (px)
Citation preview
Statistical analysis of satellite remote sensing data for forest inventory and mapping in north of Iran
S. A. Bonyad
Forestry Department, Faculty of Natural Resources
Guilan University, Guilan, Rasht, Iran.
Tel: 98 182322 3023 Fax: 98 182 322102
Email- [email protected]

1. Introduction
The objectives of forest inventory are:
To define the geographical location of forests
To map the forest stands
To stratify the forest
To estimate forest stand parameters
To produce reliable information for forest management
To assign probability to forest maps

Remote sensing data for forest Remote sensing data for forest inventory has two optionsinventory has two options::
Aerial photos Satellite imagery

Main satellite image data sources for for forest inventory forest inventory :
Landsat TM with 7 bands +Pan Landsat ETM+ with 7 bands +Pan IRS Liss3 SPOT, Multispectral and 1 Panchromatic bands,

Forest inventoryForest inventory requirements:
Remotely sensed data
forest stands and
A suitable classification technique
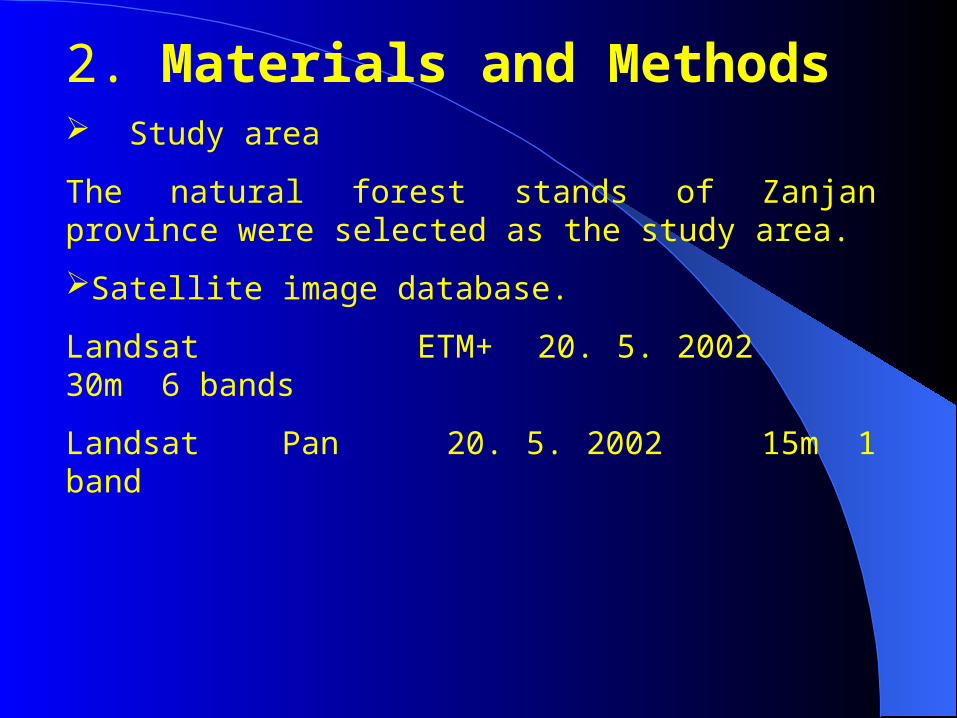
2. Materials and Methods Study area
The natural forest stands of Zanjan province were selected as the study area.
Satellite image database.
Landsat ETM+ 20. 5. 2002 30m 6 bands
Landsat Pan 20. 5. 2002 15m 1 band

Data Analysis Methods Statistical ANOVA and MANOVA techniques:
Wilks’ test
Hotelling’s T2
Principal Components Analysis (PCA)
Factor Analysis
Also:
Vegetation index : DVI , NDVI ,…
Maximum liklelihood classification (MLC) technique
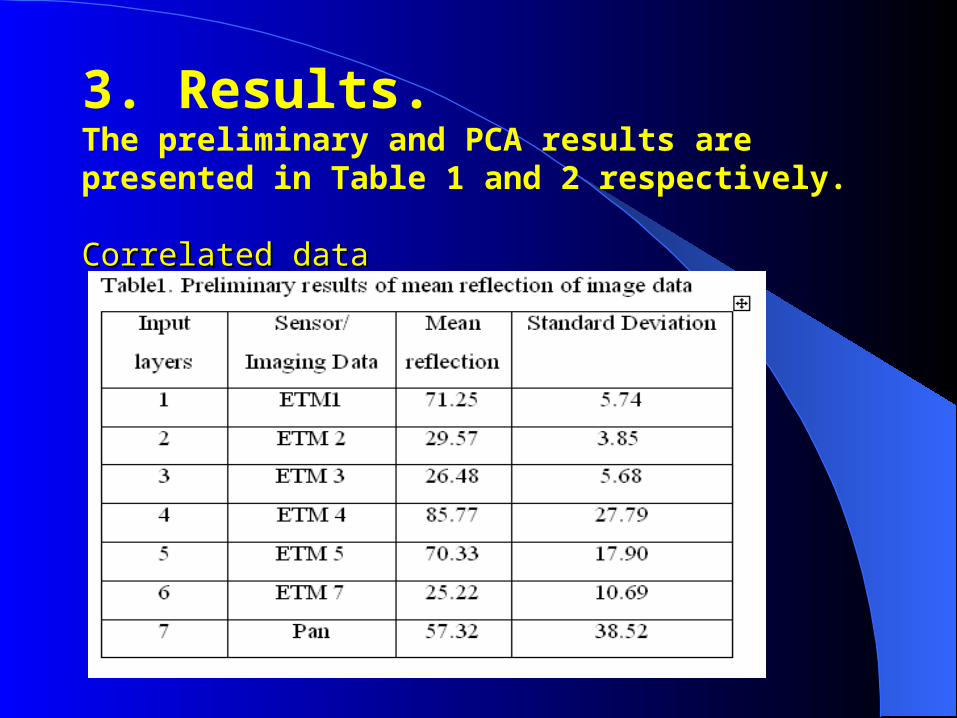
3. Results.The preliminary and PCA results are presented in Table 1 and 2 respectively.
Correlated dataCorrelated data
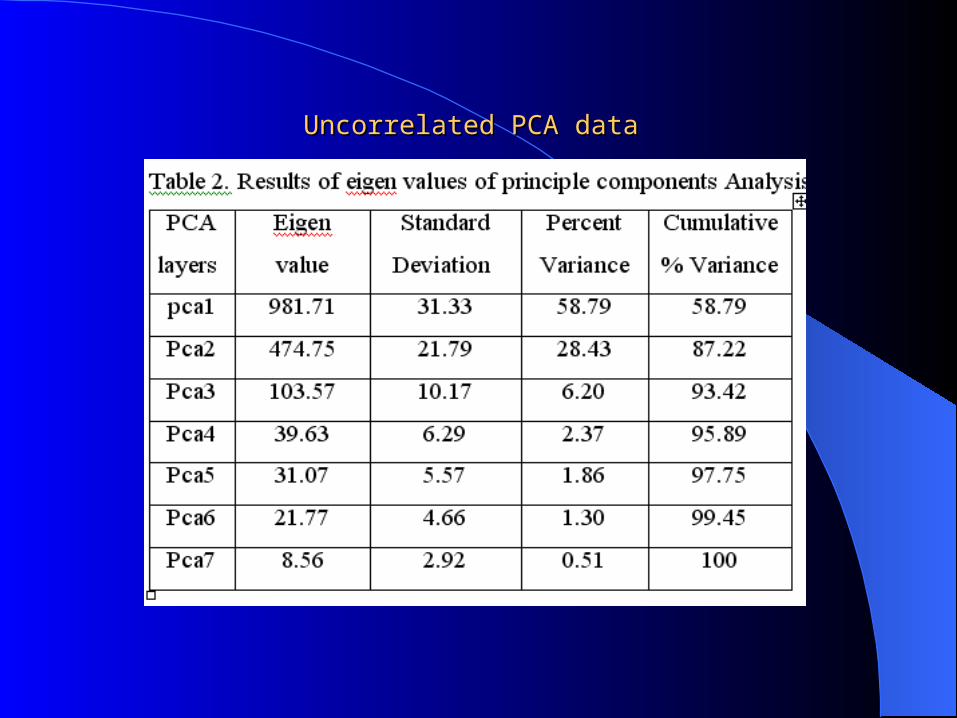
Uncorrelated PCA data Uncorrelated PCA data
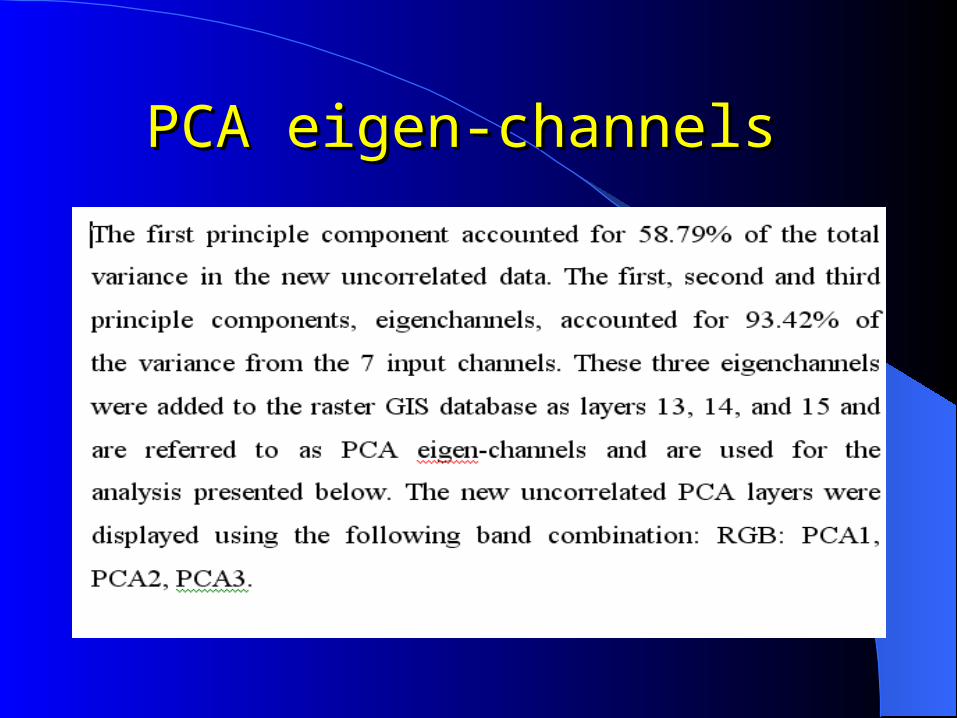
PCA eigen-channelsPCA eigen-channels

Vegetation indexVegetation index for forest for forest inventoryinventory
Followings Vegetation index were used for forest inventory
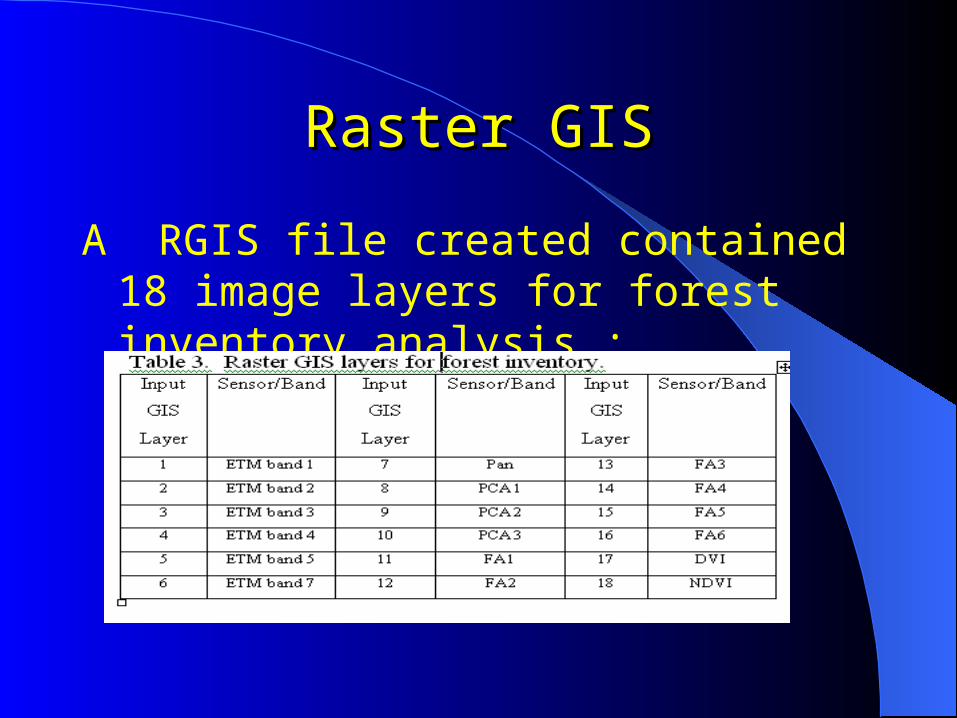
Raster GISRaster GIS
A RGIS file created contained 18 image layers for forest inventory analysis :

KIA
RGB bands combination

Figure 2. Forest inventory map for Forest stands
0 50km
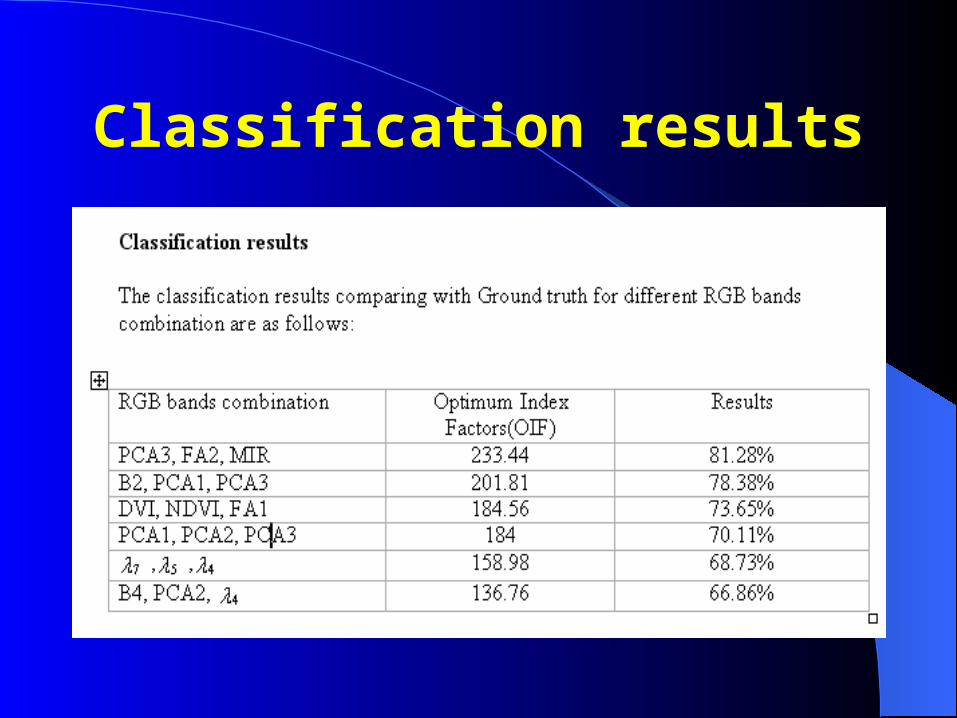
Classification results

4. Conclusions
The PCA eigen-channels, Vegetation index, Factor Analysis are useful for forest inventory, classification and mapping.
The statistical multivariate analysis of variance (MANOVA) techniques are useful to map the forest stands and to estimate stand parameters.

Thank you