Embed Size (px)
Citation preview

Developing Metrics to Discern Apparent Study Power in Protein Mutation DistributionsANNA BLENDERMANN
MENTOR: ARLIN STOLTZFUS

Deep Mutational Scanning
Deep Mutational Scanning: technique that uses high throughput DNA sequencing to analyze protein mutations
Last month, an article appeared in Genetics with results on 2000 mutants of the BRCA1 gene, which is linked to breast cancer (http://www.genetics.org/content/200/2/413)

The Inadequacy of Recent Studies
Understanding the effects of mutations is a major challenge in genomics, evolution, and medicine
Recent studies show…
An unprecedented amount of data on the effects of mutations in proteins
Unexplained differences in the power of studies to discern effects in mutations
For example, Lind’s analysis of ribosomal protein mutations shows little difference between missense and synonymous mutations. (http://www.sciencemag.org/content/330/6005/825.abstract)
UNDISCERNABLE GRAPH?!
Lind Study

Missense Mutations
Missense mutations change amino acids
Largest frequency among the three effect types
Expected to cause a wide variety of effects
GCC = alanine
GUC = valine
Different amino acid

Nonsense & SynonymousMutations
CAG = glutamine
UAG = stop condon
Truncated protein
CAA = valine
CAT = valine
Different codon, same amino acid
Synonymous mutations…- Change codons but not amino acids- Have very small, beneficial effects
Nonsense mutations…- Truncate proteins- Have strong, deleterious effects

Learning and Implementing R
My project required learning R and writing code for the development of analytical metrics

Using Rstudio for Data Analysis
Rstudio was used to compile distribution graphs of missense, nonsense, and synonymous mutations, in stacked histogram form
Firnberg Study
StackedHistogram
Distributions

Visualizing DMS Data with Fitness
Fitness Distribution graphs are based on
Y-axis: frequency of protein mutations
X-axis: fitness level of the resulting cell
Frequency – number of mutations
Fitness – how fast the cell grows
NonsenseMutations
MissenseMutations
SynonymousMutations

Visualizing DMS Data with QuantilesQuantile Distribution graphs are based on
Y-axis: frequency of mutations relative to the total number of protein mutations
X-axis: fitness level of effect types relative to the overall fitness of the cell
Frequency – number of mutations
Fitness – how fast the cell grows
NonsenseMutations
SynonymousMutations
Missense Mutations

Developing Metrics for Quality Analysis Five Metrics were developed to assess
the quality of fitness and quantile distributions
Standard deviation of synonymous mutations
Difference of missense & nonsense averages
Difference of synonymous & missense averages
Difference of synonymous & nonsense averages
Difference of nonsense average and min fitness

Completing Metric Analysis with Five Steps
#1
• Compute metric values
#2
• Get R^2 values from cross validation
#3
• Plot metrics vs. R^2 values
#4
• Graph linear regressions (best fit lines)
#5
• Calculate P-values for each plot
Metric Analysis – determining the ability of each metric to evaluate apparent study power
Apparent Study Power – how well a distribution graph displays data
Our Five Steps

Computing Metrics for NineMutation Studies We had 25 studies, but only 9 studies contained the
effect types needed to calculate the metrics
Study Stan.dev Mis.non Syn.mis Syn.non Non.fitness
Acevedo 0.250016 0.229262 0.234982 0.464244 0.080622Carrasco 0.235649 0.275932 0.192387 0.46832 0Dc_phi NA 0.294643 NA NA 0.101563Firnberg 0.147203 0.159689 0.252223 0.411911 0.317862Hietpas 0.051814 0.223672 0.419424 0.643095 0.268372Peris 0.146945 0.306863 0.321471 0.628333 0Roscoe 0.078261 0.379291 0.203929 0.58322 0.114418Sanjuan 0.245534 0.263043 0.273641 0.536685 0Wu_v1 0.199661 0.243483 0.279801 0.523284 0.17869

Getting R^2 Values from the Cross Validation
R^2.values
0.149265640.159300050.583690740.180154820.226848490.173370460.218351220.187491490.14267328
R^2 values – mean quantile (exchangeability) values from each study that measure power on 0-1 scale
VS
Study Stan.dev Mis.non Syn.mis Syn.non Non.fitness
Acevedo 0.250016 0.229262 0.234982 0.464244 0.080622Carrasco 0.235649 0.275932 0.192387 0.46832 0Dc_phi NA 0.294643 NA NA 0.101563Firnberg 0.147203 0.159689 0.252223 0.411911 0.317862Hietpas 0.051814 0.223672 0.419424 0.643095 0.268372Peris 0.146945 0.306863 0.321471 0.628333 0Roscoe 0.078261 0.379291 0.203929 0.58322 0.114418Sanjuan 0.245534 0.263043 0.273641 0.536685 0Wu_v1 0.199661 0.243483 0.279801 0.523284 0.17869

Plot - Standard Deviation of Synonymous Mutations
X-Axis Values: r^2 values
Y-Axis Values: sd(synonymous)
Linear Regression Slope: negative

Plot - Difference of Missense & Nonsense Averages
X-Axis Values: r^2 values
Y-Axis Values: avg(mis) – avg(non)
Linear Regression Slope: positive

Plot - Difference of Synonymous & Missense Averages
X-Axis Values: r^2 values
Y-Axis Values: avg(syn) – avg(mis)
Linear Regression Slope: positive

Plot - Difference of Synonymous & Nonsense Averages
X-Axis Values: r^2 values
Y-Axis Values: avg(syn) – avg(non)
Linear Regression Slope: positive

Plot - Difference of Average Nonsense and Minimum Fitness
X-Axis Values: r^2 values
Y-Axis Values: avg(non) – min(fitness)
Linear Regression Slope: zero
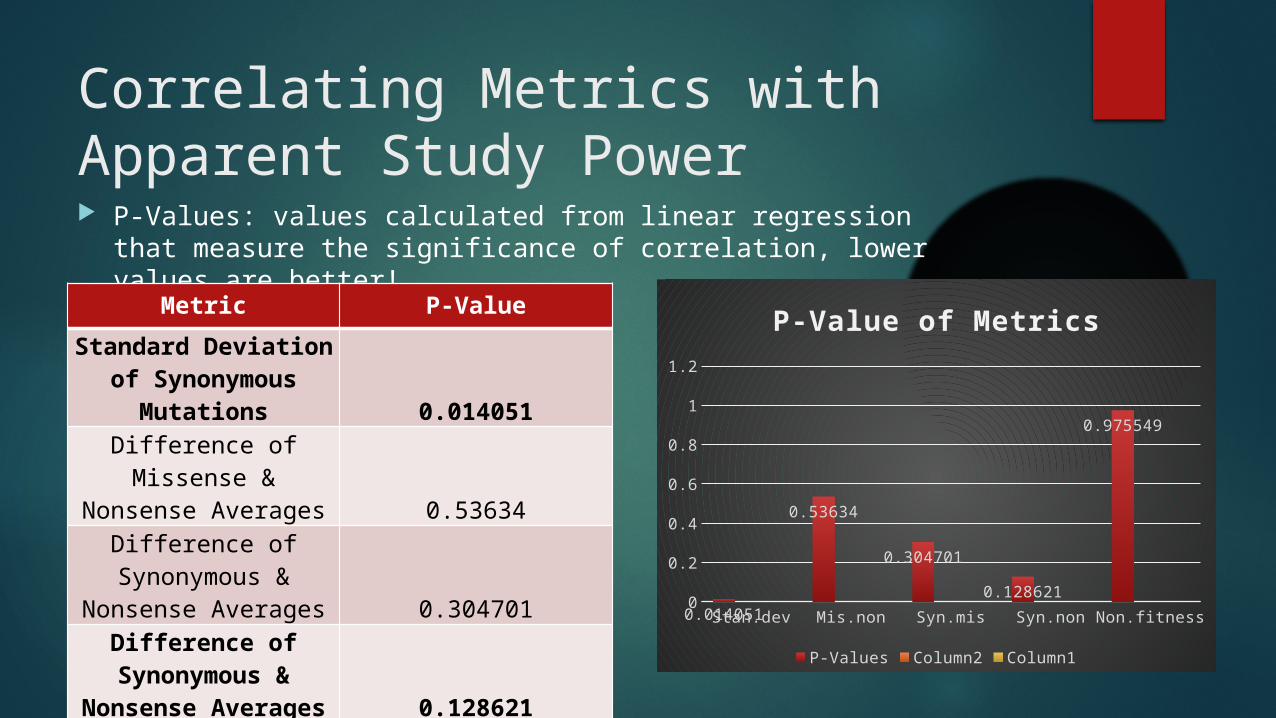
Correlating Metrics with Apparent Study Power P-Values: values calculated from linear regression that
measure the significance of correlation, lower values are better!
Metric P-Value
Standard Deviation of Synonymous Mutations 0.014051
Difference of Missense & Nonsense Averages 0.53634
Difference of Synonymous & Nonsense Averages 0.304701
Difference of Synonymous & Nonsense Averages 0.128621
Difference of Nonsense Average and Min Fitness 0.975549
Stan.dev Mis.non Syn.mis Syn.non Non.fitness0
0.2
0.4
0.6
0.8
1
1.2
0.014051
0.53634
0.304701
0.128621
0.975549
P-Value of Metrics
P-Values Column2 Column1

1. We developed one metric ideal for the quality analysis of mutation distributions: Standard Deviation of Synonymous Mutations
2. There were not enough studies with available data to create linear regressions that accurately evaluated the usability of each metric
3. We only tested five metrics, so there was already a 15%-20% chance that at least one P-value < 0.05
Future Work: develop MORE METRICS from the mutational data from MORE STUDIES, to help researchers accurately assess the quality of their studies and thus, better discern the effects of mutations in proteins
Our Conclusions Based on the Metric Analysis

Thank You
Dr. Arlin Stoltzfus, Mentor
Dr. Mary Satterfield, MML Chief of Staff
Dr. Brandi Tolliver, NIST SURF Director
The SURF Program