Embed Size (px)
Citation preview
289
STATIC DEFORMATION OF FLUID-SATURATED ROCKS
by
Karl Coyner
Earth Resources LaboratoryDepartment of Earth, Atmospheric, and Planetary Sciences
Massachusetts Institute of TechnologyCambridge, MA 02139
ABSTRACT
The static strain response of porous solids to combinations of confiningstress and pore pressure is explained both theoretically and experimentally.The theoretical analysis is a synopsis of linear elasticity principles for porousmedia taken mainly from Biot (1941), Gassmann (1951), Biot and Willis (1956),and Geertsma (1957). From this analysis the conclusion is made that the"effective stress" of Terzaghi (1923, 1925), which is the difference betweenhydrostatic confining stress and pore pressure for strain properties, has notheoretical or experimental significance for the static strain response of intactrocks. The Terzaghi effective stress cannot account for the intrinsic bulk strainof minerals, a component of strain response important in consolidatedsediments and rocks but not in muds and soils, for which the Terzaghi relationwas originally intended. Effective stress "laws" for static deformation proposedby Nur and Byerlee (1971), Garg and Nur (1973), Robin (1973), and Carroll(1979) are shown only to be reformulations of linear elasticity relations. Theeffective stress so defined has no intrinsic physical meaning. Experimental bulkstrain measurements on a suite of rocks as a function of hydrostatic confiningstress and pore pressure are presented. Equilibrium straln at any combinationof confining stress and pore pressure is predicted on the basis of 1) the zeropore pressure or drained jacketed stress-strain relation, and 2) the unjacketedstress-strain relation. Unjacketed strain measurements with a confiningpressure fluid are emphasized as a means of directly measuring the intrinsicmodulus of aggregate minerals in rocks. A technique is outlined forexperimentally obtaining pore volume or porosity as a function of confiningstress from finely digitized unjacketed and jacketed strain data by astraightforward application of linear elasticity principles incrementalized oversmall data steps. An argument is made, based on the linear elasticity analysisfor strain response, that the differential hydrostatic stress, or what iscommonly called effective stress, predicts many physical properties exclusive ofbulk strain because of 1) the large intrinsic moduli of minerals, and 2)thedefinition of a stress as a force per unit area is maintained during deformationbecause of the small strains normally encountered in consolidated rocks andsediments.
INTRODUCTION
A remarkable variety of geological processes and geophysical properties aswe know them would not exist on earth without water. Because rocks andsediments are porous in the crust, at least down to the brittle-ductile
290 Coyner(
transition, water may freely exist as a separate fluid phase at depth. Wherelithosphere is subducted water may be carried to even greater depths. As aresult of water, or more accurately, aqueous solutions in the crust there arephenomena as diverse as hydrothermal ore deposits, the lowering of solidustemperatures in basaltic magmas, diagenesis, substantial current flow throughrock, and acoustic attenuation. Even hydrocarbons and organically-derived gasare possible only because of the water which sustained the original plant life.
The pressure in fluids at depth may be a signiflcant factor in someprocesses. Pressure in the fluid phase can be generated by gravity, stresswaves, tectonic stress, heat, and chemical or electrical potentials. A simplemodel for an ideal earth is a column of interconnected pore space filled withwater in which pore pressure increases with depth proportional to density andthe gravitational constant. There are obvious important exceptions, mostlybecause of the time scales involved. On one hand, some deep mines incrystalline rock are dry and pore pressure is insignificant. In developingsedimentary basins, on the other hand, rapid sedimentation and burialcombined with heat and low permeability leads to overpressurized pore fluids.As a result, hydrocarbons are expelled from source rocks, fluids migrate overvast distances, and drilling holes is made interesting. On a shorter time scale,the instantaneous compressibility for an acoustic stress wave in rock maycreate local pressure gradients in the fluid phase because of pore shape.Another example of the importance of pore pressure is in the interpretation ofearthquakes and overthrust fauiting as complex reactions between regionalstress fields and temporal and spatial variations in pore fluid pressure. Severalinstances have been documented of earthquakes being turned on and off byhigh-pressure fluid injection in wells.
Because of rock porosity, fluids to flll that porosity, and sources of fluidpressure, the overall mechanical response of rocks and sediments with fluids isdetermined by a two-component stress system. An overall frame or confiningstress is transmitted through grain-to-grain contacts and may vary as afunction of direction. The second stress component is pore pressure.Fortunately, fluid cannot support shear except over small distances. In lowfrequency or static situations pore pressure is therefore hydrostatic.
A logical analysis of the mechanical response of rocks and sediments wouldtreat confining stress and pore pressure as independent variables. There is,however, a simplifying functional relation generally known as "effective stress".Historically, Terzaghi (1923, 1925) showed in laboratory experiments thatuniaxial consolidation and strength of fully-saturated soils is governed by thesimple difference between normal stress and pore pressure. This differencebecame known as the "effective stress", and was identified as the controllingparameter in these types of deformation studies.
Over the years this simple observation has been extended and applied tocover the deformation of rocks and other porous materials besides soils. Asother physical properties have been studied in the laboratory the term effectivestress has been applied to measqrements such as velocity, electrical resistivity,attenuation, and permeability. As a term, effective stress is often loosely usedas a synonym for differential stress or pressure, again the simple differencebetween frame stress or confining pressure and pore pressure. In theliterature effective stress sometimes innocuously turns up as a label on the
12-2
(
(
(
(
(
(
Static Deformation .291
stress axis. At other times effective stress is embellished as a "law," a"principle," or as a "concept."
What effective stress really means for rocks with pore pressure is not clear.The term, however, is commonly used to interpret properties of rocks andsediments in situations where pore pressure and confining stress are variables.The principal concern here is whether there is any physics involved or if theTerzaghi relation is just a good approximation. In this paper the point isdeveloped that the latter is true. This becomes very apparent when theproperty measured in the laboratory is static bulk strain.
The main purpose of this study is to investigate the equilibrium or .staticstrain response of rocks to a combination of confining stress and porepressure. This is the real key to understanding what effective stress meansbecause changes in other physical properties, such as velocity andpermeability, can be interpreted and modelled if elastic deformation isdescribed. The first section of this paper is a review of the linear elasticmaterial description of porous solids as initially developed by Biot (1941) foranalysis of the three-dimensional consolidation of soils. The analysis is carriedout in fair detail because, as will be shown in the second section, what has beenproposed as an "effective stress law" for bulk strain (Nur and Byerlee, 1971;Garg and Nur, 1973; Carroll, 1979) is simply a reformulation of the linear elasticdescription. The "effective stress" so defined has no intrinsic physical meaningand actually obscures true interpretation of strain response. The third sectionuses some graphical examples to clarify the points.
Perhaps part of the confusion is due to the fragmentary and limited natureof previous experimental efforts aimed toward an understanding of the role ofpore pressure and confining stress on static strain in rocks. There have onlybeen a few experimental studies of static rock strain where both confiningstress and pore pressure are variables (Van der Knapp, 1959; Nur and Byerlee,1971).
A major effort of this paper is to present experimental static strain datafor a suite of rocks including sandstones, granites, and limestone, where bothpore pressure and confining stress are systematically varied. In the fourth,fifth, and sixth sections of this paper the experimental test and results arediscussed. Inert nitrogen is used as the pore fluid and confining stress ishydrostatic pressure. Strain is measured with strain gages attached directly torock samples. The experimental strain data agrees with the predictions oflinear elasticity theory or the proposed effective stress laws for bulk strainwhen nonlinear behavior of the samples is incrementalized over many stepsthat are each nearly linear. This is possible through the power of the computerin collecting finely digitized experimental stress-strain data.
A second purpose for this study is to examine aspects of experimentalstrain data that may be useful in modelling other physical propertymeasurements such as velocity, permeability, and resistivity. If themeasurement of physical properties as a function of confining stress is aworthwhile effort, then the modelling of these properties with varying poreshapes must ultimately appeal to and agree with strain data. The sixth sectionof this paper points out how pore volume and porosity can be calculated quiteaccurately as a function of confining stress from jacketed and unjacketed
12-3
292Coyner
stress-strain measurements. The unjacketed strain test, which has beenneglected in recent years, is emphasized as a direct measurement of theintrinsic bulk modulus.
LINEAR ELASTICITY OF FLUID-SATURATED POROUS MEDIA
Consider a homogeneous and isotropic porous solid. The following analysisis of a sample element large enough so that the porosity distribution doesn'tinterfere with the homogeneity assumption. For this sample element stress isdeflned as total force per unit area and strain is defined as relativedisplacement between points in the solid phase. Assume that the pores areempty. The strain tensor as a function of stress for this sample element is
(
(
( 1)(
where e;; is strain,O'ij is deviatoric stress, 0'l:Jc is hydrostatic stress, and 0;; is theKronecker's delta. The elastic bulk modulus is K and shear modulus is G.Strains are considered infinitesimal so that solid translation and rotationalterms are not used. Repeated indices indicate summation. In this form thestress tensor is decomposed into two parts, the left term in parenthesisrepresenting deviatoric stress and the right term representing pure hydrostaticstress. The deviatoric stress changes the shape and strain is a function of theshear modulus; the hydrostatic stress changes the volume and strain is afunction of the bulk modulus.
Alternatively, the tensor expression can be expressed with the Poisson'sratio v of the porous solid. The identity for an isotropic material is
K - 2G(1 +0.- 3(1-2v) '
and
(
(
(
(2)
Now consider the effect of a pore fluid at an equilibrium pressure of valuep introduced throughout the pore space. No bulk shear strain will occurbecause fluid pressure is hydrostatic and the porous solid is isotropic. Theresult of pore pressure is a pure volumetric strain, equal in all directions. Anadditional term is added to the stress-strain relation so that the completeexpression becomes
(3)
Pore pressure p is positive and the sign of the additional term is positive sothat bulk strain decreases with an increase in p. The convention used in thisanalysis is that compression is negative. The constant H was introduced by Biot
12-4
(
(.
Static Deformation 293
(1941) and is simply defined as the ratio between bulk volume strain and porepressure change p with external stress constant. Biot (1941) and Biot andWillis (1957) suggested appropriate experimental tests for the determination ofH. Bulk modulus K is measured with either the pores empty of fiuid or else atconstant pore pressure, I.e., a drained test.
As can be seen from the form of Eq. (3) the constant H is a modulus similarto the bulk and shear moduli. The constant H can, however, be defined in termsof bulk modulus K and solid matrix modulus K;, of the solid phase with theadditional assumption that the solid phase is homogeneous and isotropic. Thisassumption was used by Gassmann (1951) and later Geertsma (1957). A shortderivation follows.
For the sample element under consideration if there is only a hydrostaticc.onfining pressure, such that aij = -aOij, and a pore pressure of value p, theexpression for bulk strain e from Eq. (3) becomes
(4)
The overall stress field can be decomposed into two stress states, individuallyanalyzed, and the resulting strains summed by virtue of the overall linearityassumption. In Fig. 1 the decomposed stress states are schematically shown.Stress state (1) is an equal and uniform internal and external hydrostaticstress p. The' normal stress over every boundary between pore and matrix isuniquely defined as p. An important point is that homogeneity requires that theporosity cannot split the sample, either because the sample element is toosmall or else because of a fracture. Since the solid phase is homogeneous andisotropic, with bulk modulus K;" the result is a pure volumetric strain
(5)
Stress state (2) is an external hydrostatic stress a-p with constant porepressure and the resulting volumetric strain is
(6)
Summation of the two volume strains gives
(7)
Comparison with Eq. (4) reveals that
12-5
294 Coyner
(8)
(
The stress-strain relation in Eq. (3) can therefore be written as
E .. = _l_[a .. _laLLo,,] + _l_(aLLo,,) + l[l__llo." 2G '] 3 =" 9K = '] 3 K K;, r '] (9) (
This is the overall stress-strain relation for a linear, isotropic, macro- andmicro-homogeneous porous solid when pore ll.uid pressure is an additional statevariable.
Solving Eq.(9) with respect to stresses gives the relation(
where
K~=1-K;,'
(10)
(11)
This is perhaps the simplest expression and can be found in Biot (1941, 1962)and Rice (19BO), with negative pore pressure. The first coefficient inparentheses can be identified with the Lame parameter A. The materialconstant ~ was called CI. by Biot (1941 and later) and by Nur and Byerlee (1971).If microhomogeneity and isotropy are assumed the equivalence in Eq. (11) isexactly correct. Otherwise, ~ is a material constant to be determined, andappropriate experimental tests are given by Biot (1941) and by Biot and Willis(1957). The quantity of fluid expelled during a jacketed compression testdivided by bulk volumetric strain furnishes the value of ( This will be discussedin a later section.
To this point the assumption has been that pore pressure remains constantduring external static deformation, as for a drained experiment or an opensystem. To complete the static linear description the ll.uid mass must beincluded with stress, strain, and pore pressure as fundamental state variables.Biot (1941) defined the response of ll.uid volume in the pores to stress and porepressure as e, the increment of ll.uid volume per unit volume of porous solid.The expression for e is
(
(12)
where H, and R are material constants. For constant confining stress the
volume of fiuid displaced into the pores of a unit volume is calculated with ~.
Thr.ough the definition of a strain potential energy for the porous solid itcan be shown that HI = H, the constant in Eq. (B). The argument used by Blot
12-6 (
Static Deformation 295
(1941. 1973) is that a'jdeij + pdvp , vp being the pore fluid volume, is an exactdifferential, and there is a thermodynamic argument for why this is true (Biot,1973). For the present purpose, however, the important result from his energyargument is the reciprocity between the response of pore volume v p tohydrostatic confining stress a and bulk volume response Vb to pore pressure p.This can be expressed as
[aVb] = _(!?2] .ap a aa ~
(13)
Love (1944) also gives several forms of the reciprocity theorem for elasticity.Gassmann (1951) and Geertsma (1957) also use reciprocity in their derivations.
Reciprocity can be used to show that HI = H. If the porosity is fullyconnected and fully saturated with pore fluid the increment of Iluid content 0in Eq. (12) can be identified with change in pore volume normalized to bulkvolume. The eqUivalent to Eq. (12) is
1 1 [av ]-dv =_:..::.e.. d a +Vb p 11/, aa ~
1 [av ]- :..::.e.. dpVb ap a
(14)
If the porous solid is completely immersed in fluid with pressure p bulkvolumetric strain is given by 11 K.. If the external pressure p is removed suchthat only pore pressure p remains, the overall porous solid will expand by anamount inversely proportional to bulk modulus K. Summing these two stagesgives the partial derivative of bulk volume to pore pressure with constantconfining pressure
(15)
The same result can be seen in Eq. (7) if confining stress a is set equal to zero.By reciprocity, Eq. (13), the partial derivative of pore volume to hydrostaticconfining stress is given by
(16)
With the matrix solid homogeneity and isotropy assumption the equivalence ofEq. (8) holds, and substitution of Eq. (16) into Eq. (14) gives
(17)
Comparison With Eq. (12) indicates that HI = H and that
12-7
296 Coyner
1.. __1_[ 8vp ]R-Vb 8P.'
(18)
(
and now it will be shown that R can be expressed as a function of porosity, bulkmodulus, and solid matrix bulk modulus.
The change in pore volume with pore pressure can be equated to change inbulk volume Vi, and solid matrix volume v. by
(19)
Bulk volume and pore volume are related to solid matrix volume v. through theporosity rp such that
(
v.Vi, =-
l-rp
rp v•.l-rp
Substitution of Eqs. (20) into the reciprocity theorem, Eq. (13), gives
(20)(
On the righthand side of Eq. (21) the differential for solid volume v. is thedifference between the differential for bulk volume, equal to 11 K, and thedifferential for pore volume, Eq. (16). Therefore
(
(
and substitution of this with Eq. (15) into Eq. (19) gives
_1[!!2] =1.. _ (1 + rp)[_l].Vb 8P.K K.
(22)
(23)
(
Consequently, if the matrix solid is homogeneous and isotropic, the Biotconstant R, referring to Eq. (18) and (23), can be identified as
(24)
12-8
Static Deformation 297
which is also given by Geertsma (1957). Therefore the increment of fluidvolume e of Biot(1941) can be expressed as a change in pore volume
_1(llv )=_1[.L__l ]akk +_1[.L__l L_-!-pVb P Vb K J<. 3 Vb K X;f J<. '
or, equating pore volume with fluid volume v" a change in fluid volume
(25)
(26)
where v, is the fluid volume in the unstressed state. Eq. (26) can be found inRice and Cleary (1976, their Eq. (2)).
Following Rice and Cleary (1976), the variation in fluid mass lim, inresponse to pore pressure and confining stress may be expresse d in a linearexpansion of m, =P,v, to give
(27)
where lim, is variation in fluid mass, lip, is variation in fluid density, liv, isvariation in fluid volume, and v, and P, are fluid volume and fluid density in thereference state. Using the identity of the fluid bulk modulus K"
(28)
the substitution of Eq. (28) and Eq. (26) into Eq. (27) gives
(29)
This is the equation for fluid mass variation with stress and pore pressure whenthe solid matrix modulus can be locally associated with J<. at every point in thesolid. Together with Eq. (10) and Darcy's fluid flow equation a full set ofconstitutive relations are achieved for linear, isotropic, homogeneous, poroussolids, with fully compressible constituents. Coupled with equilibriumconditions and compatibility conditions the full field equations, includingdiftusivity, can be generated (Rice and Cleary, 1976; Rice, 1980).
A crucial assumption in these derivations is that of solid matrixhomogeneity and isotropy. This is also part of the reason why there are so manydifterent symbois and material constants in various treatments. Theassumptions can be distinguished by considering a macrohomogeneous andmacroisotropic versus a microhomogeneous and microisotropic porous solid.Macrohomogeneity is fundamentally necessary for the analysis of stress andpressure on a sample element of the porous solid. Macroisotropy has been
12-9
298Coyner
(
assumed but is not necessary, and the extension to various sy=etries wasdone by Biot (1956). The key issue is microhomogeneity and microisotropy. Ifthe solid matrix is everywhere microhomogeneous and microisotropic, and theporosity is fully interconnected, then the solid matrix bulk modulus K" can beused in all of the previous equations. Geologic materials, however, are far shortof that ideal. Many different minerals exist in rocks and sediments and eachmineral type is usually elastically anisotropic. A qUick look at Birch'scompilation in Clark (1966) shows that mineral elastic constants may vary byover 100%. The resolution of this fact to theory is by the definition of anequivalent homogeneous porous solid with equivalent solid matrix bulk modulusK,,'. This is a representative statistical average of all the different moduli of theindividual minerals. It can be calculated as a Voigt-Reuss-Hill average (Brace,1965) or else measured directly in an unjacketed stress-strain measurement. Arather noisy collection of K,,' values for some rocks can be found in Birch'scompilation in Clark (1966, Table 7-13). The experimental section of this paperwill present many more.
The use of K,,' in place of K" in Eqs. (25), (26), and (29) is not, however,totally correct. The K" in the last term of those equations can be traced to thevariation in pore volume with constant differential pressure (Biot, 1973; Brownand Korringa, 1975). Brown and Korringa (1975) define the compressibility
(
(
(30)
where v, is pore volume, p is pore pressure, and Pd is differential pressure, (1
p. If the solid matrix is microhomogeneous and microisotropic thecompressibility IC, equals 11 K", and the variation in pore volume v, isequivalent to stress state (1) in Eq.(6). Biot(l973) also distinguished thecompressibility ern and Rice and Cleary (1976) distingUished the modulus K,,"(=11 IC,).
Using these two constants, K,,' and K,,", Eqs. (10), (11), and (29), theconstitutive relations, are rewritten
(
(
2(1<j = (K-SG)OijE,tk +2GEij -t;POij'
Kt;= 1 -~'
(31)
(32)
(33)
(
The significance of K,,' and K,," is that they are material constants that, whenexperimentally measured, remove the homogeneity and isotropy requirementon the solid matrix. Equivalently, the Hand R constants of Biot (1941) could beused. It may be noted that the analysis with K,,' and Ks" and Biot's analysisusing Hand R are far more general. therefore, than the analysis of Gassmann(1951) and Geertsma (1957), both of whom specialize to the case of ahomogeneous and isotropic matrix of modulus K". Biot almost certainly realized
12-10
Static Deformation 299
this in 1941. but what must be remembered is that Biot's original applicationwas soils. In a partially saturated. clay dominated soil the parameters such asporosity, matrix modulus. and pore fiuid modulus are almost impossible todefine and measure. By sticking to Hand R Biot 1) defined measurableconstants (H and R), 2) did not have to assume microhomogeneity andmicroisotropy, and 3) avoided any mention of porosity, so that the discussionand confusion with Terzaghi's "etIective porosity" was avoided altogether.
Several other useful relations between bulk volume, pore volume, andporosity can be derived with the equations. For this purpose assume K. = K.' =Jl;". From Eq. (16) the ditIerential of pore volume strain with hydrostaticoonfining stress u was given by
_1[Oup 1=_[1. __1 ]Vb au K K.'
(16)
The variation in porosity rp with hydrostatic confining stress u can then becalculated from the expression
(34)
The first term on the left is given by Eq. (16), and the second term on. the rightincludes the definition of bulk modulus K and porosity rp. Eq. (34) cantherefore be expressed as
[££1 =_[1.- - _1] + 2[1.-]au K K. Vb K
= _iL::1l + _1K K.' (35)
This means that porosity variation With external confining stress u can becalculated from rp, K, and Jl; (=K.'). If porosity is very low and K« K" such aswith crack-dominated solids at low pressure, the porosity can be ignored and
[££1 = _[1.- - _1].au K K.(36)
This is the expression given by Walsh (1965). The expression in Eq. (35) is,however, more general.
EFFECTIVE STRESS
The modern idea of an etIective stress in fiuid-saturated porous mediaapparently originated with Karl Terzaghi. who is generally regarded as the
12-11
300 Coyner(
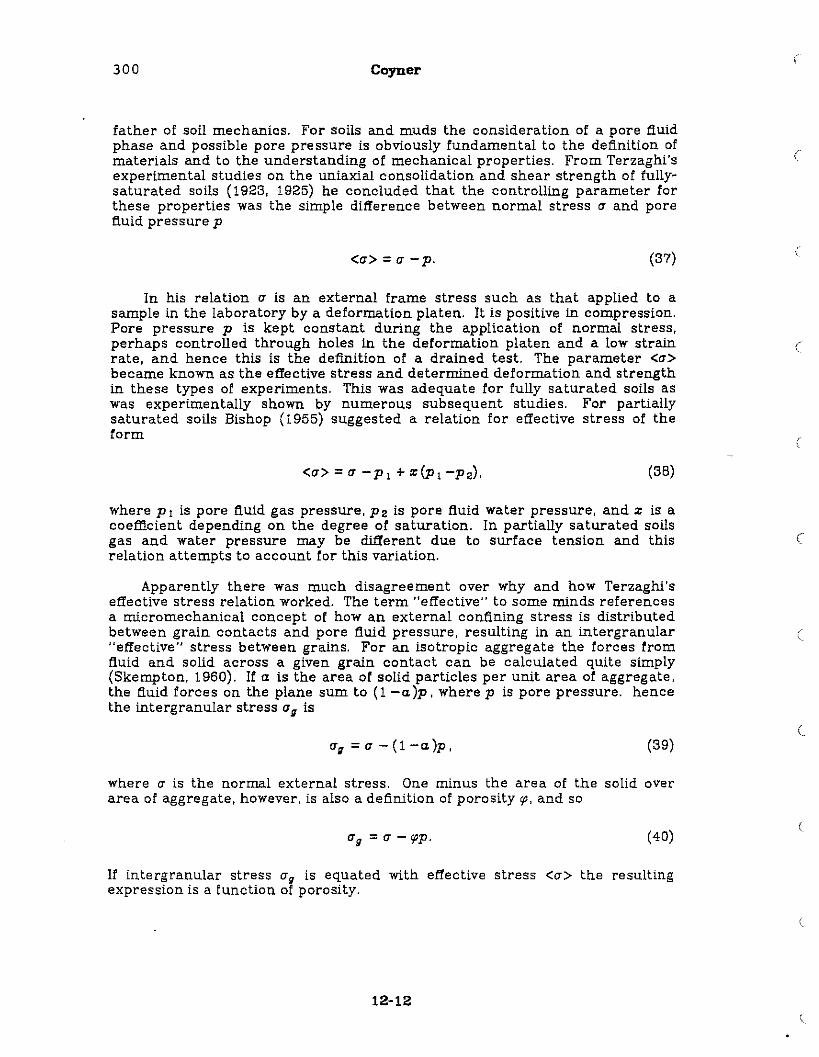
father of soil mechanics. For soils and muds the consideration of a pore fluidphase and possible pore pressure is obviously fundamental to the deflnition ofmaterials and to the understanding of mechanical properties. From Terzaghi'sexperimental studies on the uniaxial consolidation and shear strength of fullysaturated soils (1923, 1925) he concluded that the controlling parameter forthese properties was the simple difference between normal stress Cf and porefiuid pressure p
(
<Cf> = Cf - p. (37)
In his relation Cf is an external frame stress such as that applied to asample in the laboratory by a deformation platen. It is positive in compression.Pore pressure p is kept constant dUring the application of normal stress,perhaps controlled through holes in the deformation platen and a low strainrate, and hence this is the definition of a drained test. The parameter <Cf>
became known as the etl'ective stress and determined deformation and strengthin these types of experiments. This was adequate for fully saturated soils aswas experimentally shown by numerous subsequent studies. For partiallysaturated soils Bishop (1955) suggested a relation for etl'ective stress of theform
(
(
(38)
where PI is pore fluid gas pressure, P2 is pore fluid water pressure, and:r: is acoefficient depending on the degree of saturation. In partially saturated soilsgas and water pressure may be different due to surface tension and thisrelation attempts to account for this variation.
Apparently there was much disagreement over why and how Terzaghi'seffective stress relation worked. The term "effective" to some minds referencesa micromechanical concept of how an external confining stress is distributedbetween grain contacts and pore fluid pressure, resulting in an intergranular"effective" stress between grains. For an isotropic aggregate the forces fromfluid and solid across a given graln contact can be calculated qUite simply(Skempton, 1960). If a is the area of solid particles per unit area of aggregate,the fluid forces on the plane sum to (1 -a)p, where p is pore pressure. hencethe intergranular stress Cfg is
(
(
Cfg =Cf - (l-a)p, (39)(
where Cf is the normal external stress. One minus the area of the solid overarea of aggregate, however, is also a definition of porosity rp, and so
Cfg = Cf - rpp. (40)
If intergranular stress Cfg is equated with effective stress <Cf> the resultingexpression is a function of porosity.
12-12
Static Deformation301
Terzaghi envisioned soils as individual plates and grains of solid materialseparated by springs that compressed during compaction. Terzaghi reasonedand argued that the simple differential pressure (j • p could not determinedeformation in the limit of zero porosity. The simple intergranular stresshypothesis above agrees with this. As the porosity goes to zero the effect ofpore pressure goes to zero. In the other direction, however, soils and muds inhis experiments that deform according to (j • P did not have 100% porosity.Terzaghi suggested that because individual particles have surface roughnessthere is actually an "effective porosity" for intergranular stress that for soilswas approximately equal to 1.
Biot (1935, 1941) established the physics of three dimensionalconsolidation. In his work he totally discarded effective stress and insteadtreated external stress and pore fluid pressure as independent variables.Stress was defined as total force per unit area of a representative homogeneouselement and not separated between solid and fluid. The micromechanics ofparticle surfaces in contact were implicitly contained in the overall bulk andshear moduli and in the phenomenological constants Hand R. Time effects inconsolidation were included with Darcy's law. The linear elasticity of porousmedia presented in the previous section is the Biot formulation forconsolidation. For muds and soils the bulk modulus is much greater than theintrinsic bulk modulus and the Biot stress-strain relation becomes equal to theTerzaghi relation.
In subsequent redevelopments of Biot's consolidation equations byGassmann (1951) and Geertsma (1957) more readily defined physicalparameters such as intrinsic bulk modulus (K.), pore fiuid modulus (K,), andporosity (,,) were introduced in place of the original H and R constants of Biot.These too have been used in the previous section. It is significant to note,however, that effective stress was not referenced although the conceptcontinued to be extensively used in the soil mechanics literature (Skempton,1960; Siiklje, 1969). Hubbert and Rubey (1959) argued for the Terzaghi relationas a general principle for stress in the crust.
When it became apparent that pore fiuid injection could cause earthquakes(Healy et al., 1968) or that pore pressure could be responsible for temporalvelocity variations and aftershocks associated with earthquakes (Nur, 1971; Nurand Booker, 1972: Booker, 1974), pore pressure effects and effective stress wererevived in a major way. For the most part effective stress was used as asynonym for differential pressure (Brace, 1972). In some cases, however, itgained additional status as the "law of effective stress" (Brace and Martin, 1968:Nur and Byerlee, 1971: Garg and Nur, 1973), the "effective stress concept"(Carroll, 1979), or as any of a number of "effective pressure laws" (Robin, 1973).
The mechanics of rock response to pore pressure and confining stress atsmall strains is well described by the linear elasticity of porous media in thefirst section. What is generally called effective stress or effective stress "laws"can be explained from the descriptions of the first section. Here it will be shownthat the "effective stress law" for bulk strain (Nur and Byerlee, 1971; Garg andNur, 1973; Carroll, 1979) and pore volume strain (Robin, 1973) are onlyreformulations of the linear elasticity analysis.
12-13
302 Coyner(
It is entirely possible to regroup terms in the stress-strain relationship (Eq.(10) ) so that stress and pore pressure are combined as an "effective stress."This was done by Nur and Byerlee (1971), Garg and Nur (1973), and Carroll(1979). Nur and Byerlee (1971) actually started out with Eq. (10) and derived ~(their a) in Eq. (11) along the same lines as Gassmann (1951) and Geertsma(1957). Eq. (10) from the first section can be regrouped as
(
f7ij + ~p oij = (K - ~ G)OijekJ: + 2Geii
K~= 1--
K.(41)
(
The combination of stress and pore pressure on the left Nur and Byerlee (1971)termed "effective stress" <f7ij> so that
(
(42)
Therefore <f7ii> describes strain as a function of hydrostatic confining stressand pore pressure p as if there were no pore pressure. Rice and Cleary (1976)also use this definition in their development. Nur and Byerlee (1971) appliedEq. (l0) to the s~eciflc case of a microhomogeneous and microisotropic linear
solid and hence H =~ - ~ .
The Nur and Byerlee (1971) and Garg and Nur (1973) definition of effectivestress is an association of the confining stress and pore pressure in Eq. (10).There is no new physics introduced in doing so. Absolute strain could bepredicted directly from Eq. (10) without any need for "effective stress." This ismade clear in the section with graphical examples and in the experimental test.
Biot (1962a) referenced "effective stress" (17') as the simple difference
(43)
the portion of the total stress in excess Of local pore pressure p. With thisdefinition, the stress-strain relation Eq. (10) becomes
(
(44)
obviously quite different from the Nur and Byerlee (1971) definition.
The Nur and Byerlee (1971) definition of effective stress is strictly validonly for an isotropic, linear, homogeneous, porous solid. Bulk isotropy isrequired because the bulk modulus K and intrinsic bulk modulus K. are used inEq. (11). Carroll (1979) analyzed the general anisotropic case although Biot
12-14
Static Deformation 303
(1955. 1956) had extended his consolidation equations to general anisotropysome years earlier. The same derivation as' that of Nur and Byerlee (1971) wasfollowed except that the bulk modulus K was replaced by a tensor of elasticmoduli M,jkl and the intrinsic bulk modulas K. was replaced by a tensor ofelastic compliances Qjkk. The effective stress for deformation of an anisotropicsolid then becomes
(45)
Comparing this expression with the Nur and Byerlee (1971) definition ofeffective stress,
(46)
anisotropy in either the solid matrix or overalliporous solid means a differenteffective stress in different directions. .Of course Eq. (10) could be formulatedwith tensor moduli and this was done by Biot (1955, 1956) although without thesuccinctness of tensor notations. The question of anisotropy will be furtheraddressed and clarified in the graphical 'examples.
Linear elasticity equations in the first section describe both bulk strainand pore volume strain in response to pore pressure and confining stress. AsNur and Byerlee (1973) defined an "effective st~ess law" for bulk strain so tooRobin (1973) defined an "effective stress law" for pore volume strain. From Eq.(16) of the first section the variation in pore volume l!.vp about some referencestate at constant pore pressure normalized to pore volume is given by
l!.v 1 1 1:::.::E.... =--( - - -)a.vp rp K K" (47)
The variation in response to a combination of confining stress and porepressure is derived from Eq. (25) of the first section and is given by
l!.vp 1 1 1 . 1= --( - - -)(a - pI) - -;:;-povp rp K K. K.
This equation can be expanded to
l!.vp = _1..[K. -KJr[a _.p + rpK pl.V p rp K"K K" -K
(48)
(49)
Comparison of this last equation with Eq. (48) gives an "effective stress" forpore volume strain
12-'15
304 Coyner
<at> = a - [1 - (K."'!!.K) ]po (50)
This equation appears Imore substantial than the deformation that it isdescribing. Substitution of reasonable moduli and porosities for rocks showsthat the coefficient in brackets is nearly 1. or that
<a> = a -p. (37)(
If porosity rather than pore VIQlume is described by an "effective stress law" thelast equation is exact.
GRAPIDCAL EXAMPLES
A few graphical exarmples with synthetic data will clarify most of the pointsand concepts made in the previous sections. Various plots shown in Fig. 2 arestress-strain relations for ditterent idealized porous materials. On these plotsthe vertical axis is hydrostatic confining stress and the horizontal axis is strain.
In Fig. 2a the stress-strain relation for a perfectly linear. isotropic.homogeneous. porous solid is shown. Although the strain axis may be linear orvolumetric strain. assume for this discussion that it is volumetric strain. Thesteeper of the two solid lines extending out from the origin. labelled U. is thestress-strain relation for the solid matrix materia!. If the porous solid ismicro-homogeneous and micno-isotropic the inverse slope of this line is K.. thesolid matrix or intrtnsic bulk modulus. If these attributes only apply on amacroscopic scale tb.en the slope is K;. the solid matrix bulk modulus of an·equivalent homogeneous maiteria!. The strain measured in an unjacketedstress-strain test. where conifining pressure fiuid freely infiltrates the pores.would follow line U.
The shallower solid line in Fig. 2a. labelled J. is the jacketed stress-strainrelation with the pores empty or at least drained of pressure. 'The inverse slopeis K. the jacketed bulk modulus. which includes features of pore closure inaddition to solid matrix s~rain.
The upper solid line in Fig. 2a which is parallel to the jacketed stress-strainline represents the jacketed stress-strain relation for the porous solid withconstant pore pressure of level p. Since pore pressure cannot be greater thanconfining pressure the origin for this line is at hydrostatic confining pressurep. At this point pore preSSUl'e equals confining pressure and the overall solid.as well as porosity and solid 'matrix. has experienced volumetric strain p / K..Assume that confining pressure a combined with pore pressure p results inbulk volumetric strain e. The stress field may be decomposed into two stepsbecause of linearity. The:first step is an equal internal and external pressure pthat results in strain p / K". The second step is an external pressure a - p withconstant pore pressure that 'results in a strain (a - p) / K. Total strain is thesum of these two steps:
12-16
(
(
,.
or
Static Deformation
(O'-p) + ..L=e,K K.
K0' - (1 - -)p = Ke
K.
K~ =1 - !C.
•
305
(51)
(52)
(11)
This is Eq. (10) of the first section for the case of hydrostatic confiningpressure and a completely homogeneous and isotropic porous solid.
The "effective stress law" or "concept" of Nur and Byerlee (1971), Garg andNur (1973), Robin (1973), and Carroll (1979), is to describe the strain atconfining stress u and pore pressure p in terms of the same strain at zero porepressure. Their effective stress is simply the left term in the above equation. InFig. 2a the dashed line down from the point u, e to the zero pore pressurerelation line J and from there across to the stress axis graphically defines theeffective stress or pressure. This is simply a matter of definition and theeffective pressure so defined has no intrinsic physical meaning. Since K and K.are both constants the coefficient 1 - K / K. is constant With pressure.
The plot in Fig. 2b shows what happens when the pore space is structurallyanisotropic. The solid matrix remains, on the average, isotropic, and so thesingle steeper solid line is solid matrix strain. The horizontal axis is linearstrain, however, to show the anisotropy in 2 directions represented by the pairof shallower solid lines. For an anisotropic rock the effective stress will bedifferent depending on direction. Linear strain at a confining stress u and porepressure p will. if related to the strain with .zero pore pressure, correspond totwo different "effective pressures" u' and u'. This is indicated by the dashedlines in Fig. 2b. If the matrix solid is also anisotropic the lack of uniqueness indefining a single effective stress is further exacerbated because solid matrixstrain will also vary with direction. In the experimental test problems withanisotropy in the samples were avoided by using bulk strain. Even if effectivestress were calculated for linear strain, anisotropy is not a major problem inthe samples studied. At low pressures modulus anisotropy is greatest, but sinceK«K., the coefficient ~is not that sensitive to sizable differences in K.
The plot in Fig. 2c is more representative of a real rock. The horizontalaxis is volumetric strain. The matrix solid stress-strain relation is nearly linear;any nonlinearity would be caused by occluded porosity or crystal defects. Thejacketed stress-strain relation with zero pore pressure starts out nonlinearbecause of asperity closure effects. At high hydrostatic confining pressurethose pore features responsible for most of the nonlinear strain have beenremoved. The inverse slope of the stress-strain relation at high pressure is thebulk modulus of a nearly linear porous solid, not of the solid matrix which isstill given by the straight line.
The stress-strain relation at constant pore pressure p is the zero porepressure curve with the origin relocated along the solid matrix stress- strainrelation at hydrostatic confining pressure p. Bulk volumetric strain atconfining pressure (j and pore pressure p is a sum of solid matrix strain p / K.
iil.2-17
306 Coyner
and zero pore pressure strain at confining pressure u - p, The bulk modulus KIs a function of differential pressure u - p, Consequently, the coeffiCient ~ Is afunction of dltl'erentlal pressure,
The effective stress u' for hydrostatic confining pressure u and porepressure p is graphically calculated in Fig, 2c, It can be seen that thedefinition reduces the effect of pore pressure by coming down to a strain levelhigher on the zero pore pressure curve than that at u - p, At higher pressuresthe slopes approach that of the solid matrix and the effect of pore pressure isfurther reduced, This simply reflects a decrease in the value of coefficient (.For rocks the solid matrix strain is an appreciable part of overall strain and theeffective stress calculated is larger than differential pressure, For muds andsoils blilk strain is much larger than solid matrix strain, ~ is nearly equal to 1,and the effective stress definition approximates dltl'erentlal stress, Essentially,the effective stress definition above for rocks obscures the solid matrix strainby reducing the effect of pore pressure, If the vertical axis is instead the solidmatrix stress-strain relation in Fig, 2c, then differential pressure determinesstrain,
In Fig, 2d the idea of semilinearity (Blot, 1973) is graphically depicted for anonlinear rock with finite strain, Semilinearity simply means that the solidmatrix material behaves as a linear solid while the overall rock responds as anonlinear solid, Semilinearity depends on strains being very small so that thedefinltion of stress as a force per unlt area is maintained before and after thedeformation, In the plot the vertical axis is hydrostatic confining stress andthe horizontal axis is volumetric strain, At constant pore pressure the bulkvolumetric stress-strain relation is given by the curve labelled Vb' Becauserocks In general behave as a semilinear material the bulk, strain can becontinuously broken down into pore volume strain and solid volume strain,Solid matrix volume strain is measured in an unjacketed stress-strain test andis the straight solid line labelled v.' The difference between bulk volumetricstrain and solid matrix volumetric strain is pore volume strain, the middlecurve labelled vp in Fig, 2d, All strains are normalized to overall bulk volume,With bulk and solid matriX volume strain measured, the decrease in pore volumewith confining stress can be calculated quite accurately with finelyincrementalized data points, Porosity decrease as a function of increasingconfining stress can be calculated from the bulk volume decrease and porevolume decrease from a reference state,
EXPERlllEN'I'AL TEST
Rocks, sediments, and soils fall far short of the ideal porous solidsdescribed in the elasticity analysis, Rocks are not homogeneous, rarelyisotropic, almost never linear, and loathe to respond to infinitesimal strain, Itshould be of general interest, then, to investigate whether the equations fit realmaterials such as rocks, In the experiments to be described the bulk strain ofa suite of rock samples was measured as a function of systematically cycledhydrostatic confining stress and internal gas pore pressure, For each sample,jacketed and unjacketed bulk moduli were calculated and the stress-strainmeasurements were compared with that predicted by the equations in theanalysis, Additional measurements of jacketed and unjacketed strain were thenmade for a number of other rock samples,
12-18
(
(
(
(
(
(
'Static Deformation 307
The linear description in the first section originated with Biot (1941).Since that time there have apparently been only two relevant ,experimentalstress-strain studies on rocks, where pore pressure was a variable in addition toconfining stress. These are by Van der Knaap (1959) and by Nur and Byerlee(1971). Although he reports that experiments were run on a number ofsandstones and limestones, Van der Knaap (1959) only gives data for a sampleof Belait sandstone (1"=15%). He established experimentally the essentialfeatures of the analysis given in the first section and in the graphical examples.First, the stress-strain curve measured for this rock at a constant porepressure of about 1 kbar was, predicted from the zero pore pressure curve byusing the intrinsic bulk modulus measured in an unjacketed stress-strain test.Without a jacket the confining pressure fiuid fills the porosity of the sample andthe resultant strain can be identified with an average modulus of the solidphase. The prediction corresponds to Fig. 2c in the graphical examples, wherethe zero pore pressure curve slides up the straight line of the intrinsic solidmodulus to a point equal to pore Pl'essure p.
The second feature of the analysis established experimentally by Van derKnaap (1959) is the division of bulk strain between pore volume strain and solidmatrix volume strain. According to the linear elastic description the solidmatrix volume strain should be inversely proportional to the intrinsic solid bulkmodulus. For Belait sandstone Van der Knaap measured bulk strain as afunction of increasing confining stress and, simultaneously, pore fiuid expelledfrom the pore space at constant pore pressure. The difference between thesetwo had to be the amount of solid matrix strain. This measured differenceagreed with the predicted calculation based on the intrinsic solid bulk modulus.
Nur and Byerlee (1971) measured bulk strain on a sample of Webersandstone (1"=9.5%, this paper) at various un.specified combinations ·of porepressure and confining stress. Although their aim was to test an "effectivestress law" for bulk strain, the prediction of strain with pore pressure with their"effective stress" indicates that the incrementalized linear elasticitydescription works. This is because the true source of their "effective stress" isthe Biot linearized elasticity equations as shown in the first section. Garg andNur (1973), however. working with tihe same data set on Weber sandstone, replot"effective stress" versus strain and show a serious negative discrepancy. Theysuggest that the data includes a time effect due to slow pore fiuid diffusion. butwhy this did not show up in the earlier work is not clear. Nur and Byerlee(1971) do mention that up to 12 hours between data points was necessary forequilibration.
These two studies, then, are apparently the only ones to invesbgate thecombined infiuence of pore pressuTe and confining stress on strain. Only one,by Van der Knaap (1959), appears reliable, and the data presented therein isonly for a single sandstone. The conclusion is that not enough experiments onthis fundamental issue have been made. In particular, experiments on rocks ofextreme micro-inhomogeneity and micro-anisotropy, such as crystallinegranites, have not been done.
Data can be found in the literature, however, that can be used in theequations. Fatt (1959) measured and calculated for Boise sandstone jacketedand unjacketed bulk modulus, porosity. and the coefficient {' at severalconfining pressures. These values, in addition to shear modulus and fiuid
12-19
308 Coyner
compressibility, fix the properties necessary for predicting the static elasticresponse. A major emphasis in experimental studies has been the stress-strainresponse of jacketed samples that are dry or, if saturated, at constant porepressure (Adams and Williamson, 1923; Zisman, 1933; Carpenter and Spencer,1940; Hughes and Cook, 1953; Fatt, 1958; Brace, 1965; Simmons et al., 1974).These kind of data provide the jacketed bulk modulus, and numbers have beencompiled by Birch (Clark, 1966, Table 7-13). The important observation in thesestudies is the functional nonlinearity between stress and strain caused by localchanges in contact area and asperity closure, especially at low stress. Becauseof nonlinearity the static moduli are a function of stress. Whether or not thestatic moduli are a function of differential stress, a - p, is a question addressedin this experimental study.
In addition to the jacketed bulk modulus K the unjacketed bulk modulusK.' Is required. Experimental stress-strain measurement of an unjacketedsample, where confining pressure fluid penetrates the pores, is a directmeasure of an average intrinsic modulus of the solid matrix. This is ameasurement emphasized in this experimental study. Values for a number ofrocks have been compiled by Birch (Clark, 1966, Table 7-13), but most of thedata is quite old and there is a great deal of scatter in the measurements. Thelargest proportion of unjacketed moduli in Birch's compilation come fromZisman (1933). Instrumentation and techniques have seemingly improved sincethat time. Nur and Byerlee (1971) report a value of 0.454 Mbar for Westerlygranite that as been cited (Rice and Cleary, 1976) but which is too low.Measurements by Knopoff (1954), Adams and Williamson (1923), and this studyindicate that a more reasonable value is 0.56 Mbar. Values for a number ofrocks are measured and tabulated in this study.
An alternative to direct measurement of intrinsic solid modulus is tocalculate a Yoigt-Reuss-Hill average from modal analysis and individual mineralmoduli. This was done by Brace (1965). This calculation assumes thatindividual mineral moduli from other sources are appropriate and thatmicroanisotropy is random.
Several points are clear in the previous experimental efforts with porefluids and pore pressure. Nur and Byerlee (1971) had a serious problem withtime-dependent effects because it took so long (~12 hours) for straln toequilibrate. Also clear from the experimental results of Mann and Fatt (1960)and Wyllie et al. (1958) is that liquids, particularly water, increased strainlevels in the sandstones studied. Presumably, there is a chemical-physicalinteraction of pore fluid with matrix that increases elastic compliance. Todd(1973), however, reports agreement of static compressibilities in a dry andwater-saturated sample of Fairfax diabase.
In order to accurately assess the elasticity relations and to avoid thedeleterious effects of liqUid pore flUids on strain, the decision was made early inthis study to use nitrogen gas as the pore flUid. The three favorable aspects ofgas are: 1) no interaction between pore fluid and rock matrix, 2) highcompressibility, so that when pore volume is strained from confining stress thechange in pore pressure is minimal, and 3) low viscosity, so that pore pressureequilibrates rapidly throughout the pore space and with the external nitrogengas reservoir. Nitrogen gas was chosen because of readily available 6000 psicylinders. Regulated pressures to that level were then possible without the
12-20
(
(
(
(
(
need of a pump.
Static Deformation 309
The basic experimental method was to measure bulk strain on jacketedsamples of' rock subjected to systematic cycles of hydrostatic confining stressami pare fiuid pressure. Rock strain was measured with strain gages attacheddirectly to the rock surface, leads from which were brought out through thejacketing material. Hydrostatic confining stress to 1 kbar was generated on thesamples in a pressure vessel. A small high-pressure fitting penetrated thesample jacket and associated tubing brought nitrogen gas pore pressure up to350 bars from an external gas reservoir.
For the measurement of unjacketed bulk modulus jackets were removedfrom the samples and kerosene confining pressure fluid penetrated the pores.Strain was measured to 1 kbar pressure.
With stress-strain data from jacketed measurements at zero pore pressureand unjacketed strain measurements, bulk modulus and intrinsic bulk moduluscould be calculated. The theory of the first section could then be used topredict and compare with strain measurements at various pore pressures. Inthe following paragraphs the experimental test is broken down into discussionsof rock samples, instrumentation, procedure, and data reduction.
The rocks studied included sandstones, granites, and limestone, and a listof samples is given in Table 1. The first seven samples in the list were fullyinvestigated with various pore pressure runs, and jacketed and unjacketedmeasurements. The remaining rocks in the list were measured jacketed andthen unjacketed.
Rock samples were of two types. Large 3" diameter by 2" long finelyfinished cores were prepared for the jacketed measurements with porepressure. Smail blocks, usually about 1" square by 1/2" thick were preparedfor the unjacketed measurements so as to preserve the larger cores fromkerosene contamination. The small blocks were first measured jacketed andthen unjacketed. Therefore, multiple data sets could be compared fromdifferent samples of the same rock.
Rock samples were cored from various larger blocks of rock using a watercooled ,diamond core drill. Samples were finished to a nominal 2" long by 3"diameter size with diamond-wheel cylindrical and surface finish grinders. Smallblock samples were cut to dimension with a diamond saw. Samples were flushedwith water and acetone and then saturated in acetone by pulling a vacuum onthe sample while submerged in an acetone-filled beaker. Samples were keptsaturated for at least 24 hours and then vacuum dried (20 micron) at 60degrees C for at least 24 hours.
Strain !gages were applied directly to the finished surfaces of the samples.For the core samples three strain gages (BLH FAE-50-S6E) were attached inthree mutu'ally perpendicular directions on the cylindrical surface, one aXiallyand two circumferentially. For the block samples normally two gages,sometimes' three, were attached in mutually perpendicular directions. Ifbedding or a rift plane were present gages were oriented according to theplanar ·fea~ure. The general area on the sample where a gage was to beattached was always sanded with 400 grit sandpaper. For all of the samples
12-21
310 Coyner
with appreciable porosity the rock surface was first filled with a viscous epoxy(BLH EPY 150) to prevent gage collapse into the pores under pressure. Thisepoxy, when dry, was sanded until the minerals were uniformly exposed,finishing with 400 grit paper. This procedure was found to be much easier whenthe epoxy was colored with a red dye. After surface preparation gages wereapplied with epoxy (EFY 150) and clamped to the samples with teflon sheets,sections of 3 inch thin wall brass tubing, and hose clamps.
The jacketed sample arrangement within the pressure vessel apparatus isshown diagrammatically in Fig. 3. Pore pressure in the sample is controlledthrough a stainless steel fitting that penetrates the jacket. High pressuretubing from the fitting to outside of the vessel goes to either.a vacuum pump ora regulated nitrogen gas tank. The sample jacket contains two layers. First is apolyurethane sheet that is slit around the gages for lead attachment. Afterclean #22 copper wire is soldered to the gages the entire assembly of fitting,sample, and jacket is potted with an air-drying liquid polyurethane compound(Flexane, Devcon Corp.). The polyurethane sheet prevents the compound fromentering the pores of the sample. Stress-strain tests on jacketed andunjacketed nonporous aluminum and lucite indicated no interference from thejacket on strain measurements.
A 3-wire lead system was used between the sample strain gages and thebridge completion network. Each gage had an individual bridge conditioningmodule (Analog Devices 2B30K) with one half of the bridge completed by shared120 ohm resistors (Vlshay 0.01%) A common shunt resistor on one of the sharedresistors allowed for simultaneous calibration of all of the strain gages. Thebridge conditioning modules output connects to the HP 3497A dataacquisition/control unit and from there to the HP 1000 computer.
The pressure vessel apparatus in Fig. 3 is capable of subjecting samples upto 15 inches long and almost 3.5 inches in diameter to hydrostatic confiningpressures up to 4 kbar. In these experiments. however, the samples were muchsmaller and pressures never exceeded 1.2 kbar. The confining pressure fluid iskerosene pumped up to pressure by an air-driven Haskell pump. Air to thepump and air to an air-operated high pressure relief valve is controlled byindividual solenoid valves. These solenoid vaives are in turn controlled byrelays on a board in the HP 3497A data acquisition/control unit. Confiningpressure and pore pressure are monitored by pressure transducers whosesignals are conditioned with Anaiog Devices 2B31K modules and then fed intothe HP 3497A data acquisition/control unit. This device is in turn controlled bythe HP 1000 computer. Software developed on the computer controlled thecycling of confining fluid pressure and the collection of data from the straingages and pressure transducers.
The procedure for a typical stress-strain measurement with pore pressureis now described. The jacketed sample arrangement with leads attached waslocated within the pressure vessel and a 20 bar confining pressure was applied.Allowing the sample to stay at zero pressure for lengths of time without thispressure made it susceptible to leaks. A vacuum (20 micron) was pulled on thesample for no less than 24 hours. Several slow cycles of confining pressurewere then automatically applied up to the maximum desired confining pressurein order to get a repeatable stress-strain curve. This was determined by thecollecte,d data and was usually achieved after 3 cycles. For the sandstones it
12-22
(
(
(
c
(
Static Deformation 311
was found that strain, after initially decreasing at a given pressure over thefirst few cycles, increased with additional cycles. The maximum confiningpressure for the sandstones was 1000 bars, for the granites 1200 bars, and forthe limestone 750 bars. Hysteresis and repeatability of the vacuum stressstrain curves was usually less than 10 microstrain (10 x 10-6 inch/inch ofsample).
After cycling to obtain a repeatable vacuum stress-strain curve themeasurements with pore pressure could begin. For most of the rock samplesconfining pressure was cycled with constant nitrogen gas pore pressures of 50,100, 150, 200, 250, and 300 bars. The procedure was to raise confining pressureto a value about 5 bars above the level of pore pressure which was subsequentlyintroduced. Strain levels immediately dropped and equilibrium was assumedwhen strain readings leveled off at a stable value. For the sandstones andlimestone this took about 15 minutes and for the granites about 30 minutes.After the system equilibrated, the confining presure was cycled up with strainand pressure measurements recorded every 10 bars at a stress rate of about 5bars/minute. Pore pressure was maintained at a constant level by periodicadjustments with the regulator or released via a valve. After reaching thedesired maximum, confining pressure was reduced with measurementsrecorded every 25 bars. Pore pressure was then slowly released, confiningpressure was reduced to 20 bars, and the overall system was allowed toequilibrate for 6 to 24 hours before the next cycle. For most of the samplesmultiple cycles were run with the same pore pressure.
Initially, the unjacketed bulk modulus, or the intrinsic bulk modulus, wascalculated from the different pore pressure strain measurements at constantdifferential pressure. If differential pressure is kept constant as the absolutemagnitudes vary, the strain undergone by the sample is a measure of theintrinsic bulk modulus 1(,'. The data for this calculation were limited by thenumber of runs with different pore pressures and the results were not precise.To accurately fix the solid matrix modulus 1(,' unjacketed stress-strainmeasurements were made on smaller "block" samples. Two or three gagesattached to these block samples were oriented in directions similar to thelarger cores. The first step for these samples was a set of jacketed stress-straincycles. The samples were fully encapsulated and suspended in the pressurevessel without the pore pressure fitting. These measurements were comparedwith the measurements on the larger cores for repeatability. The jacket wasthen snipped off, the sample saturated with kerosene, again placed in thepressure vessel, and unjacketed cycles of stress-strain were measured to 1kbar. With the system automated these cycles were slowed down to ensure thatpore pressure equalled confining pressure. Typically one cycle took about 10hours. Permeability, however, does not change with pressure in thismeasurement.
One drawback of the strain gage technique is that once attached, the gagecannot be calibrated exceit electronically by the gage factor assigned by the
manufacturer (G.F. = ~~~ L-RJ2.00). From the strain gage to the computer the
system is exceedingly accurate and calibration is based on the gage factor.Ambient temperature and electronic fluctuation result in at most a ± 5microstrain drift over a 10 hour period. The real question is how well theresistance change of the gage refiects true bulk strain in the rock. Points toconsider in answering this question include: 1) filling the pores with epoxy
12-23
312Coyner
(
probably stiffens the rock directly below the gage, 2) the epoxy layer betweengage and rock surface absorbs some of the true strain, 3) repeatability of themeasured stress-strain relation at a particular point on the rock betweendifferent gages, and 4) repeatability of the measured stress-strain relation inthe same orientation for different samples of the same rock.
During the course of this study approximately 165 strain gages wereattached to 35 rocks and standards. Perhaps the best estimate of error isgained in that process. Point 1 in the list above is perhaps not that serious.Jacketed data on some of the sandstones in this study compares favorably withthat of Fatt (1958) and Mann and Fatt (1960). They measured some of the samerocks with an external cantllever-type device. For the unjacketedmeasurements the calculated bulk modulus for some of the clean sandstones isnearly that of quartz, so the epoxy in the pore space does not seriouslyinterfere with that measurement. Point 2 above was studied by Brace (1964)and is termed the "pressure effect." All of the data in this study have beencorrected for pressure effect by adding 0.06 microstrain per bar of confiningpressure.
Points 3 and 4 in the list above are addressed from the standpoint ofhaving made so many measurements. For almost all of the rocks at least 2samples were measured jacketed. For Westerly granite, Chelmsford granite, andBerea sandstone 4 samples were measured. About 10% of the gages appliedresulted in questionable data. This was indicated by 1) strongly negativehysteresis strain in jacketed tests or 2) failure to agree with other gages in thesame orientation. For the few jacketed tests where good gages were replacedthe subsequent measured strains were repeatable to about ± 1%. For thedifferent samples of Westerly and Chelmsford the jacketed absolute linearstrains at 1 kbar compared to within ± 40 microstrain at levels of 1000-2500microstrain.
In the unjacketed tests the intrinsic solid strain was amazinglyreproducible. For samples of Westerly granite, Bedford limestone, and Bereasandstone linear strain was repeatable to within 2%.
Jacketed and unjacketed linear and bulk moduli were calculated on thecomputer from the digitized stress-strain data. The analysis program was thatused by Cheng and Johnston (1981). A Chebyshev polynomial. usually 6th to 8thorder, was fit to the data and differentiated for modulus. The first few strainpoints at low pressure were sometimes filtered and fit separately with a loworder polynomial to make the modulus monotonically increase with pressure.For the calculation of bulk modulus strain data from three directions were firstsummed.
During the course of measuring rocks three different synthetic sampleswere measured. These were titanium (Ti-6Al-6Vn-2Sn). fused silica (GE125), andaluminum (T2024). The titanium and aluminum were not heat treated. Bulkmoduli calculated from the stress-strain data were 1.10 Mb for the titanium,0.385 Mb for the quartz, and 0.735 Mb for the aluminum. The value foraluminum is similar to the 0.744 MbaI' value observed by Bridgman (1923, p.166) and the 0.752 MbaI' value observed by Brace (1965).
12-24
(
(
(
(
(
(
,,
Static Deformation
EXPEIDllENTAL RESULTS
313
Volume microstrain versus pressure plots for the seven rockssystematically studied with pore pressure are shown in Figs 4-10. There is adichotomous interpretation for the data and the two interpretations define theaxes differently as will be discussed. The solid black curve in each plot,however, is the measured zero pore pressure (vacuum) volumetric strain versushydrostatic confining pressure. Volumetric strain is the sum of strains fromthree mutually perpendicular gages on each rock sample. The squarishsymbols in these plots are the strain measurements with different porepressures, I.e., 50, 100, etc., bars. There is no need to distinguish absolutevalues 01 pore pressure in the symbols because there are no systematic trendsbeyond the interpretations given. The immediate conclusion Irom the prolusion01 data points on top of the solid black line is that bulk strain in the tests withpore pressure is understood and very predictable.
The first interpretation 01 the data in Figs. 4-10 is with the "effective stresslaw" for bulk strain of Nur and Byerlee (1971), Garg and Nur (1973), and Carroll(1979). For this interpretation the vertical axis is effective stress or effectivepressure and is defined by
<a> = a-t;p
K~=1-K."
(53)
(54)
where <a> is effective stress, a is hydrostatic confining stress, p is porepressure, K is bulk modulus, and K.' is solid matrix bulk modulus. Thehorizontal axis is volumetric microstrain and the origin is at zero pressure.From the zero pore pressure stress-strain data and unjacketed stress-straindata shown in Figs. 19-25 the two moduli and the coefficient ~ were calculatedas a lunction of pressure. For each 01 the rocks these values are plotted inFigs. 11-17. For each data point of volume microstrain measured with porepressure and confining pressure the effective pressure was calculated with theabove equation. In calculating effective stress the moduli at a pore andconfining pressure were taken as a function of the simple ditierence betweenpore and confining pressure. The square symbols in Figs. 4-10 representcalculated effective pressure versus volume microstrain. Agreement isexcellent, regardless of rock-type. This means that bulk strain at anycombination of pore and confining pressure Is predictable from the zero porepressure data and unjacketed data. Strain in the Weber sandstone with porepressure that troubled Nur and Byerlee (1971) and Garg and Nur (1973) ispredicted exactly in Fig. 4 for all pore pressures. Strain in the granites and inthe limestone is also predicted exactly with the definition of effective stress.
The coefficient ~ decreases with increasing confining pressure according tothe plots in Figs. 11-17. Since K.' is nearly constant with pressure, ~ decreaseswith increasing pressure in a manner that refiects the increase in K. In Fig. 18the value of ~ between zero and 1 kbar pressure is summarized for the sevenrocks studied in detail. The largest value of ~ is at low confining pressure sincebulk modulus K is lowest relative to solid matrix bulk modulus K.'. Of the threesandstones studied Navajo had the stiffest response, and the value of ~ never
12-25
314 Coyner
reaches above 0.75. For the other two sandstones, Berea and Weber, {' almostreaches 1 at low pressure. At high pressure {' for these sandstones is around0.5, Bedford limestone has very little nonlinear strain, few crack like porestructures, and {' decreases very little with pressure. The greatest range of {' isfor the three granltes. At low pressure, Chelmsford granite {' is nearly 1; at highpressure it decreases to about 0.25.
In these data the effective stress law for bulk strain of Nur and Byerlee(1971), Garg and Nur (1973), and Carroll (1979) has been shown experimentallycorrect for a large variety of rocks. The calculated effective stress, however,has no physical significance beyond predicting strain in rocks with porepressure. As shown in' the second section effective stress is simply areformulation of Biot's linearized elasticity equation. There is a far easiermeans of predicting the strain without calculating moduli or effective stress.This is a second interpretation of the data in Figs. 4-10. If ifl j is the drained andjacketed stress-strain response of the porous solid and iflu is the unjacketedstress-strain response, the strain e at any combination of pore pressure p andhydrostatic confining stress a is
(
(
e = iflj(a -p) + iflu(P). (55)
Total strain is simply a sum of the drained and jacketed response at thedifferential pressure plus the unjacketed response at the pore pressure.Conceptually the overall stress field has been decomposed into an equalinternal and external pressure p and an external pressure a - p. For thisinterpretation the vertical axis in Figs. 4-10 is now differential pressure and thehorizontal axis is the drained, jacketed response to differential pressure. Theorigin of the plots is iflu (P), which varies as a function of pore pressure, and inthis interpretation is being subtracted out. There is no need to replot the datain Figs. 4-10 because agreement is still excellent.
The main result is that bulk strain in response to po.re and confiningpressure is understood and predictable from the drained, jacketed andunjacketed stress-strain relation. For this purpose the "effective stress" of Nurand Byerlee (1971), Garg and Nur (1973), and Carroll (1979) is a ratherredundant calculation with no intrinsic physical meaning. The data necessaryto calculate effective stress can be used directly to predict strain with porepressure.
A more fundamental aspect of the data is the duplication of the drained,constant pore pressure stress-strain function regardless of pore pressure.Particularly for the granites studied there is severe microinhomogeneity andmicroanisotropy of mineral grains. The linear compressibility of quartz alongthe c axis is 0.718 Mb- I ; perpendicular to the c axis it is 0.995 Mb- I (Birch,Table 7-12, in Clark, 1966). The linear compressibility of orthoclase is muchmore anisotropic: along the a axis 1.013 Mb- I ; along the c axis 0.468 Mb- I .
Microcline is a solid solution of orthoclase and albite and is a common phase inthe granites studied. With these different mineral grains adjacent, cracksdevelop due to mechanical anisotropy as well as thermal expansion anisotropyduring cooling (Nur, 1969). In the application of pore pressure and confiningpressure in the laboratory the process is conceptualized as two stages. First anequal internal and external pressure at the value of the pore pressure, then an
12-26
(
l
(
Static Deformation 315
external pressure equal to the differential pressure. The application of anequal internal and external pressure necessarily causes shear stresses andgrain boundary reorganization where minerals with different compressibilitiesmeet. For example, where the c axis of orthoclase lies parallel to the c axis ofquartz the application of 1 kbar pore and confining pressure during anunjacketed test will result in 468 microstrain in orthoclase and 995 microstrainin the quartz. If a small crack separates the two minerals surface topographieswill shift relative to each other. When confining pressure is then applied atconstant pore pressure of 1 kbar the nonlinear aspect of strain as the crackcloses may be different than when pore pressure is zero. Whether there is morestrain or less strain is not predictable as that is a function of an exactdescription of topography. The order in which stresses are introduced will alsobe a factor. In the data collected on granites with pore pressure no measurableconsistent trend in bulk strain was detected with increasing pore pressure.Therefore the conclusion is that microanisotropy and microinhomogeneity donot seriously affect the nonlinear constant pore pressure strain response afteran initial pore and confining pressure are placed on the rock.
~ A1'ID POROSITY
The material constant t introduced in the stress-strain analysis of linearporous solids is quite useful for visualizing the experimentally measured strainresponse of rocks. In this discussion the symbol t is used, as in recentderivations (Rice and Cleary, 1976; Garg and Nur, 1973; Rice, 1980), aithough inBiot's work (1941,1961) and in Nur and Byerlee's formulation (1971) the symbola is used. Biot (1941) and Biot and Willis (1957) pointed out that t (their a) isthe ratio between pore volume strain and bulk volume strain in a drained,jacketed test, and that the lower limit on t is the porosity 'I' and the upper limitis 1.
This identity and the bounds can be easily derived for a linear porous solidwith a homogeneous and isotropic solid matrix. For such a material t can beassociated with bulk modulus K and intrinsic bulk modulus K;, in the followingrelation:
~=1-:'. (11)
Bulk strain for the solid in response to hydrostatic confining pressure a atconstant pore pressure is given by
(56)
Pore volume strain for the solid is given by
(16)
12-27
316 Coyner(
The ratio of these two expressions gives the stated result,
(57)
which is r.The numerical value of r is bounded by \",,;r,,;1. First, as can be seen from
the expression for r, the value must be positive but cannot be greater than 1since K";K,, is always true. The lower limit may be obtained from Eq. (35) whichdescribes the porosity response to confining pressure
(
[~1 = (1 - 91) 1v~ 1 K - K" .
Multiplying through by K gives
(35)
(58)
r
The expression in parentheses is r. The left side of the equation cannot benegative with increasing 0'. Therefore r;;" \".
The significance of the coefficient r is that it represents the ratio of porevolume to bulk volume strain in a jacketed, drained test. For laboratory studiesof rock properties measured as a function of confining stress the source ofinformation on physical dimension is given by rock strain. The bulk strain ofrocks under pressure, an easily measured quantity, is a combination of solidmatrix strain in addition to pore volume strain. Pore volume strain is thedesired quantity, and the coefficient r bridges bulk strain data to pore volumestrain. The numerical value is a direct indication of pore volume response topressure with one assumption. This interpretation of r is only strictly true forfully homogeneous and isotropic solids. The experimental evidence of Van derKnapp (1959) indicates that, at least for the sandstone studied, this assumptionis not too severe.
Therefore, in Fig. 18 or in any of the plots in Figs. 11-17, the value of r canbe interpreted in a manner quite different than as the pore pressure coefficientin the effective stress law for bulk strain. For the Berea and Weber sandstonesand Chelmsford granite the value of r approaches 1 at low pressure, indicatingthat almost all of the measured bulk strain is pore volume strain. For soils andmuds r Is also 1. For granites at high pressure the greatest portion of bulkstrain is the deformation of the matrix minerals, so that the value of r is low.For Westerly granite at 1 kbar confining pressure r is approaching a fairlyconstant value of about 0.22, indic\l.ting that 22% of external bulk strain is beingabsorbed by the pore space. The lower limit of r, the porosity, is neverapproached in these samples over the pressure range to 1 kbar. A rock withnegligible nonlinear strain, as for the sample of Bedford limestone, has a nearlyconstant, small range of r values. Below the pressure at which pores collapse
12-28
(
(
l
Static Deformation 317
and the stress-strain relation is severely altered J has a value of about 0,6,meaning that about 60% of the bulk strain measured is a pore volume strain,
The numerical value of <" calculated as a function of confining pressure canbe used to calculate pore volume strain and hence porosity as a function ofpressure from bulk strain, A more direct technique based on the data would usethe digitized jacketed and unjacketed stress-strain relations, The initialporosity must be known, Starting at zero pressure with a unit bulk volume andpore volume from the initial porosity, the bulk stress-strain relation is steppedthrough incrementally, Solid volume strain in the unjacketed data is subtractedfrom bulk volume strain in the jacketed data over each step to arrive at porevolume strain, Essentially this is an incrementalized application of Eq, (16)over steps small enough that the bulk strain appears linear, New bulk and porevolumes are calculated at each step from the bulk and pore volume strains, Ateach step porosity is calculated from current pore and bulk volumes. In thismanner a porosity or pore volume versus pressure relation can be constructedbased only on results from linear elasticity and assuming thatmicroinhomogeneity and microanlsotropy do not severely distort volume strain,This is a point amenable to further experimental test as was done by Van derKnapp (1959) for the Belait sandstone.
For the seven rocks studied with pore pressure porosity versus confiningstress has been calculated with this procedure. The results are plotted in Figs,26-32, The scales on all of the plots are the same for easy comparison, Initialporosities for these samples were calculated from dry and saturated weighingsof the large cores and are recorded in Table 1. Accuracy of the initial porosityis not that critical for calculating the porosity decrease with confiningpressure, The curves in Figs. 26-32 can therefore be shifted up and down theporosity axis, particularly the low porosity granites, Of the three sandstonesBerea shows the most rapid decrease of porosity with confining pressure. Thiscorrelates with the low bulk modulus measured for this rock, The Navajosandstone, a relatively stiff sandstone because of the extensive silicacementation, only decreases a little more than 0,2% in porosity at 1 kbar, TheWeber sandstone porosity decreases dramatically over the first few hundredbars of confining pressure, Bedford limestone, almost a linear porous solid,shows a very small decrease in porosity to 500 bars, The three granitesrepresent an interesting range with the Chelmsford porosity decreasing thegreatest amount, from 1.1% down to 0,75% at 1 kbar, After about 500 bars therate of porosity decrease with pressure for the Chelmsford and Barre arenearly the same, Westerly granlte is the stiffest of the three granites, Porositydecreases by only 0,1% between a and 1 kbar,
GENERAL DISCUSSION
The theoretical development of linear elasticity and the experimental testof bulk strain clearly indicate that effective stress is an unnecessary definitionin the description of bulk deformation of intact rocks where pore pressure andconfining stress are variables, With the drained, jacketed stress-strain relationand the unjacketed stress-strain relation measured, deformation behavior atany combination of confining stress and pore pressure is completely described,To calculate the "effective stress law" for bulk strain of Nur and Byerlee (1971),Garg and Nur (1973), and Carroll (1979) is clearly not necessary to predict
12-29
318 Coyner
(
strain and the "efiective stress" so calculated is without physical significance.
The observation remains, however, that difierential stress, or pressure,adequately describes various physical properties of rocks measured in thelaboratory with pore pressure in addition to confining stress. These propertiesinclude acoustic velocities, both P- and S-wave (Gardner et al., 1965; Coyner,1984), fluid permeability (Knutson and Bohor, 1963; Brace et al., 1988; Coyner,1984), pore phase electrical resistivity (Coyner, unpublished results), andfracture strength (Robinson, 1959; Handin et al., 1983; Brace and Martin, 1988).These observations, that pore pressure is equally "efiective" as confining stressin laboratory measurements, have been associated with Terzaghi's efiectivestress relation (Brace, 1972). Terzaghi, however, introduced the concept todescribe deformation and failure in muds and soils. The question to beanswered is why these other physical properties should be described by thesame relationship, especially since bulk strain is clearly not.
In this paper the linear static theory of Biot for fluid-saturated poroussolids has been developed and applied to the bulk and pore volume deformationof rocks. Even though linearity and infinitesimal strain are fundamentalassumptions, aspects of the analysis can be applied to the physical propertieslisted above. This is in spite of the fact that these properties may vary in ahighly nonlinear fashion with stress. The purpose here is not to model thisnonlinearity with pore closure models, but to explain the strain response to acombination of stress and pore pressure which would lead to the Terzaghirelation.
The linear analysis of the first section allows for the decomposition ofstresses given in Eqs.(5) and (6) and shown in Fig. 1. From the viewpoint of thisdecomposition the efiect of a pore pressure p and a confining stress a on otherphysical properties can be addressed. The argument is similar for all of theproperties listed above exclusive of bulk strain. Recall that the two-stepdecomposition is an equal and uniform internal and external stress equal topore pressure p and an external stress of value a-p. This decomposition, infact, mimics a possible laboratory procedure in testing for a pore pressureeffect.
The first step in the analysis ideally reduces every linear dimension by anamount inversely proportional to the intrinsic bulk modulus of the solid phase.For rocks, which are composed of various anisotropic minerals and perhaps afraction of occluded porosity, this statement is only an approximation. Thisstatement is exactly true for a microhomogeneous and microisotropic poroussolid with fully interconnected porosity. Given this assumption, there is anequal fractional decrease in solid and pore phases. Therefore, the porosity, theaspect ratios of all the cracks and pores, and the relative orientation of allcracks and pores, all remain constant. For silicate and salt-like crystallinestructures the intrinsic modulus is quite large. about 0.37 Mb for quartz andlarger for other silicates and ionic solids. This means that an equal externaland internal pressure of 1 kbar reduces linear dimensions by approximately0.1%. A crack 10.0 microns in diameter becomes 9.99 microns in diameter.
The effect on physical properties of this first step is negligible. Sinceporosity remains constant electrical resistivity does not change if Archie's Lawholds. Fluid permeability, even though quite sensitive to 3-dimensional pore
12-30
(
Static Deformation 319
shape, should not decrease measurably when pore dimensions decrease by 0.1%.Acoustic velocity does not change because aspect ratios are constant and thebulk density increase is negligible. Fracture strength does not change becausecrack and pore orientation has not changed and the amount of strain is sosmall that the stress definition as a force per unit area changes negligibly.
The second step in the analysis, the application of external pressure (J - p ,is what causes the asperities to close and pore surfaces to come into contact.The ditIerential stress, (J - p, is then seen as the "effective" stress because itdetermines the deformation of pores that leads to a change in the physicalproperties. Because of the inherent stiffness of minerals that make up rocksand sediments and the hydrostatic pressure of pore ftuid the ditIerential stressor the "effective stress" describes the response of physical properties. TheTerzaghi relation has the status of a very good approximation.
There is a general usefulness for measuring the static strain of rocks. Alaboratory technique for investigating rock properties has been themeasurement of properties such as velocity, attenuation, resistivity, andpermeability, as the rock sample is subjected to confining stress. As the cracksand pores close the properties may change dramatically. The reason thesetests are useful is that the mineralogy of the phases remains constant, so thatvariable is removed. Properties are measured and can be modelled with cracksor ellipsoids of various shape that shrink and change in number with pressure.An appeal to what is actually happening to the rock under stress must go tostrain measurements because they provide dimensional information. In theprevious section it was shown how subtraction of unjacketed stress-strain datafrom jacketed stress-strain data gives pore volume deformation as a function ofconfining stress. This result should be useful in modelling the physicalproperties of these rocks.
The other point to emphasize here is the unjacketed stress-strain test.This test gives a direct measurement of solid matrix modulus averaged overmany elastically anisotropic composite grains in various orientations. Themeasurement is useful for two reasons. One, as was previously discussed, porevolume strain as a function of confining stress can be calculated. Two, theintrinsic, solid matrix modulus is necessary in most velocity modelling as well asin deformation modelling. For rocks, if there is little occluded porosity orcrystal defects, the static calculation of intrinsic bulk matrix modulus fromunjacketed stress-strain data can be directly used in velocity modelling. Thestatic and dynamic modulus should be nearly the same for the solid phase. Forthe overall bulk rock dynamic modulus can be much larger than static modulus(Cheng and Johnston, 1981).
CONCLUSIONS
(1) The static bulk strain of rocks in response to a combination of hydrostaticconfining stress and pore presure is predictable and understood by thelinear elastic description of porous media. Strain at any combination ofhydrostatic confining stress and pore pressure can be predicted from 1)the drained stress-strain response of the porous solid, and 2) the intrinsicbulk modulus K.' measured in an unjacketed stress-strain test.
12-31
320 Coyner
(2) The lack of microhomogeneity and microisotropy does not measurablyinfluence the drained bulk stress-strain relation with an initial porepressure. Experimental observations show the zero pore pressure stressstrain response is followed in a rock with pore pressure p, the onlydifference being a constant shift in pressure and strain p / K;,' due to theintrinsic modulus K;,' of the rock. Silicate minerals are so stiff that grainboundary shear due to pore pressure has a minimal effect on thesubsequent nonlinear strain response to confining stress.
(3) The differential stress a - p will generally determine those physicalproperties exclusive of bulk strain which are strongly influenced by thepresence of cracks and pores, I.e., velocity, attenuation, permeability,resistivity, and fracture strength. The reason is because of the largeintrinsic modulus of crystalline minerals and the small bulk strains of rockin response to stress.
(4) The "effective stress law" for strain proposed by Nur and Byerlee (1971),Garg and Nur (1973), Robin (1973), and Carroll (1979) is simply areformulation of the Biot linearized description of fluid-saturated porousmedia. Effective stress so defined for intact materials entails nofundamental description of micromechanic distribution of stress betweengrains in intact rock. To avoid confusion, effective stress should only beused as a synonym for differential stress, the difference between confiningstress and pore pressure.
(5) The coefficient ~ was initiaily introduced by Biot (1941. his ex) and is a fairlyuseful material constant. Experimentally determined, ~ equals the ratio ofchange in pore volume to change in bulk volume at constant pore pressure.This coefficient, in addition to bulk modulus and shear modulus, completethe constitutive equation for drained response. The coefficient ~ can becalculated from the bulk modulus K and the matrix solid bulk modulus K;,by the relation
K~=1-
K;,.
The moduli can be incrementalized with stress to account for nonlinearityin stress-strain. The value of ~ is theoretically rp"; ~ ,,; 1 for a solid ofporosity rp.
(6) Assuming that semilinearity (Biot, 1973) is generally true for rocks, theporosity or pore volume change with confining stress can be calculatedfrom the initial porosity and carefully measured jacketed and unjacketedstress-strain relations. Porosity versus hydrostatic confining stress hasbeen calculated for the seven rocks studied with pore pressure. Theresults show that porosity change with confining stress to 1 kbar is largestfor the sandstones in the order Berea> Weber> Navajo. For the Bedfordlimestone porosity change is very small. Of the three granites studied theporosity decrease is greatest for Chelmsford, less for Barre, and least forWesterly.
(7) A large volume of jacketed and unjacketed static stress-strain data for anumber of rocks has been presented. Bulk moduli and intrinsic bulkmoduli have been calculated for these rocks as a function of confining
12-32
(
(
(
c
(
(
(
(
(
(
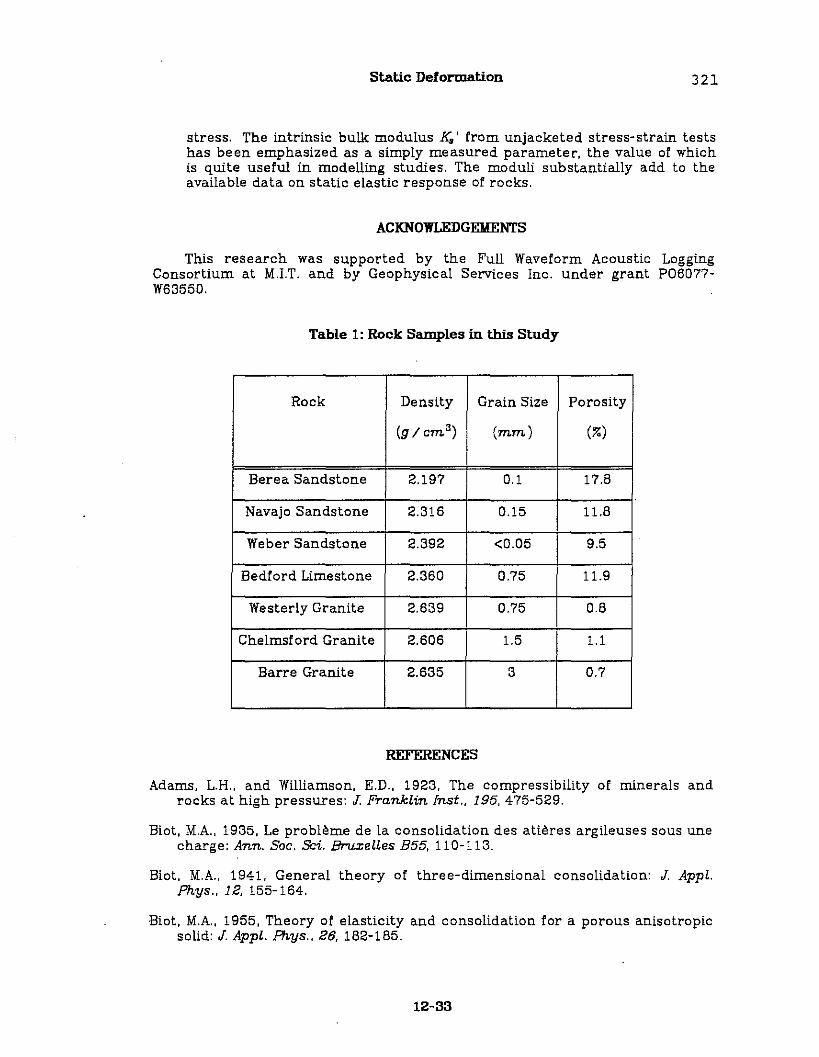
Static Deformation 321
stress. The intrinsic bulk modulus K.' from unjacketed stress-strain testshas been emphasized as a simply measured parameter, the value of whichis quite usefui in modelling studies. The moduli substantially add to theavailable data on static elastic response of rocks.
ACKNOWLEDGEMENTS
This research was supported by the Full Waveform Acoustic LoggingConsortium at M.l.T. and by Geophysical Services Inc. under grant P06077W63550.
Table 1: Rock Samples in this Study
Rock Density Graln Size Porosity
(g I cm 3) (mm) (%)
Berea Sandstone 2.197 0.1 17.8
Navajo Sandstone 2.316 0.15 11.8
Weber Sandstone 2.392 <0.05 9.5
Bedford Limestone 2.360 0.75 11.9
Westerly Granite 2.639 0.75 0.8
Chelmsford Granite 2.606 1.5 1.1
Barre Granite 2.635 3 0.7
REFERENCES
Adams, L.H., and Williamson, E.D., 1923, The compressibility of minerals androcks at high pressures: J Franklin Inst., 195,475-529.
Biot, M.A., 1935, Le probl~me de la consolidation des ati~res argileuses sous unecharge: Ann. Soc. Sci. BMJ,zelles B55, 110-113.
Biot, M.A., 1941. General theory of three-dimensional consolidation: J. Appl.Phys., 12, 155-164.
Biot, M.A., 1955, Theory of elasticity and consolidation for a porous anisotropicsolid: J Appl. Phys., 26, 182-185.
12-33
322 Coyner(
Biot, M.A., 1956, General solutions of the equations of elasticity andconsolidation for a porous material: J. Appl. Mech., 78, 91-96.
Biot, M.A., 1962, Mechanics of deformation and acoustic propagation in porousmedia: J. Appl. Phys., 33, 1482-1498.
Biot, M.A., 1965, Mechanics of incremental Deformations, John Wiley, New York,497pp.
Biot, M.A., 1972, Theory of finite deformations of porous solids: ind. Univ. Math.J., 21, 597-620.
Biot, M.A., 1973, Nonlinear and semilinear rheology of porous solids: J. Geophys.Res., 78, 4924-4937.
Biot, M.A. and Willis, D.G., 1957, The elastic coefficients of the theory ofconsolidation: J. Appl. Mech., 24, 594-601.
Birch, F., 1966, Compressibility elastic constants: in Handbook of PhysicalConstants, Geol. Soc. Am. Mem. 97,97-173.
Brace, W.F., 1964, Effect of pressure on electric-resistance strain gages: Exp.Mech., 4, 212-216.
Brace, W.F., 1965, Some new measurements of linear compressibility of rocks: J.Geophys. Res., 70, .391-398.
Brace, W.F., 1972, Pore pressure in geophysics: Amer. Geophys. Union Mono. 16,265-273.
Brace, W.F. and Martin, R.J., 1968, A test of the law of effective stress forcrystalline rocks of low porosity: Int. J. Rock Mech. Min. Sci., 5, 415-426.
Brace, W.F., Walsh, J.B. and Frangos, W.T., 1968, Permeability of granite underhigh pressure: J. Geophys. Res., 73, 2225-2236.
Bridgman, P.W., 1923, The compressibility of thirty metals as a function ofpressure and temperature: Proc. Am. Acad., 58, 166-242.
Brown, R.J.S. and Korringa, J., 1975, On the dependence of the elastic propertiesof a porous rock on the compressibility of the pore fluid: Geophysics, 40,608-616.
Carpenter, C.B. and Spencer, G.B., 1940, Measurements of compressibility ofconsolidated oil-bearing sandstones: R.I.3540, USBM.
Carroll, M.M., 1979, An effective stress law for anisotropic elastic deformation: J.Geophys. Res., 84, 7510-7512.
Cheng, C.H. and Johnston, D.H., 1981, Dynamic and Static Moduli: Geophys. Res.Letters, 8, 39-42.
Coyner, K.C., 1984, Effects of stress, pore pressure, and pore fluids on bulkstrain, velocity, and permeability in rocks: Ph.D. Thesis, M.l.T., Cambridge,
12-34
(
(
(
(
(
(
(
(
Ma.
Static Deformation 323
Fatt. I.. 1958, The compressibility of sandstones at low to moderate pressures:Bull. Am. Assoc. Pet. Geol., 42, 1924-1957.
Fatt, I., 1959, The Biot-Willis elastic coefficients for a sandstone: J. Appl. Mech.,26, 296-297.
Gardner, H.F., Wyllie, M.R.J. and Droschak, D.M., 1965, Hysteresis in the velocitypressure characteristics of rocks: Geophysics. 3D, 111-116.
Garg, S.K. and Nur, A., 1973, Effective stress laws for tluid-saturated porousrocks: J. Geophys. Res., 78,5911-5921.
Gassmann, F., 1951, Uber die elastizitat poroser medien: 'li.erteljahrsschr.Naturforsch. Ges. Zurich, 96, 1-21.
Geertsma, J., 1957, The effect of tluid pressure decline on volumetric changes ofporous rocks: 1'7'ans. A.J.M.E., 210, 331-340.
Handin, J., Hager, RV., Jr., Friedman, M. and Feather, J.N., 1963, Experimentaldeformation of sedimentary rocks under contlning pressure: Pore pressuretests: Bull. Am. Ass. Petrol. Geol., 47, 717-755.
Healy, J.H., Rubey, W.W., Griggs, D.T. and Raleigh, C.B.. 1968, The Denverearthquakes: Science, 161, 1301-1310.
Hubbert, M.K. and Rubey, W.W., 1959, Role of tluid pressure in mechanics ofoverthrust faulting, 1,2: Bull. Geol. Soc. Am., 70,115-166.
Hubbert, M.K. and Rubey, W.W., 1960, Role of tluid pressure in mechanics ofoverthrust faulting: a reply: Bull. Geol. Soc. Am., 71,611.
Hughes, D.S. and Cooke, C.E., 1953, The effect of pressure on the reduction ofpore volume of consolidated sandstones: Geophysics, 18.298-309.
Knutson, c.r. and Bohor, B.F., 1963, Reservoir rock behavior under moderateconfining pressure, in 5th Symposium on rock mechanics, Univ. Minnesota,MacMillan, New York, 627-659.
Love, A.E.H., 1944, A 1'7'eatise on the Mathematical Theory of Elasticity, Dover,New York.
Mann, RL. and Fatt. I.. 1960. Effect of pore tluids on the elastic properties ofsandstones: Geophysics, 25, 433-444.
Nur, A.. 1969. Effects of stress and fluid inclusions on wave propagation in rocks:Ph.D. Thesis, M.I.T., Cambridge, Ma.
Nur, A., 1972, Dilatancy. pore tluids and premonitory variations of ts/tp traveltimes: Bull. Seism. Soc. Am., 78, 1217-1222.
Nur, A. and Booker, J.R, 1972, Aftershocks caused by pore tluid tlow? Science,175, 885-B87.
12-35
324 Coyner(
Nur, A. and Byerlee, J.D., 1971, An exact effective stress law for elasticdeformation of rocks with fluids: J. Geophys. Res., 76,6414-6419.
Robin, P.,-Y.F., 1973, Note on effective pressure: J. Geophys. Res., 78,2434-2437.
Robinson, L.H., Jr., 1959, The effect of pore and confining pressure on thefailure process in sedimentary rock: Coto. Sch. Mines Q., 54, 177-199.
Rice, J.R., 1977, Advances in Civil Engineeri:ng through Engineering Mechanics,ASCE, New York, 295pp.
Rice, J.R., 1980, The mechanics ot earthquake rupture: in Physics 01 the Earth'slnteriors (Proceedings ot the International School of Physics "EnricoFermi", Soc. Italiana di Fisica, Bologna, Italy (printed by North Holland Pub!.Co.), 1980, pp. 555-649.
Rice, J.R. and Cleary, M.P., 1976, Some basic stress diffusion solutions tor fluidsaturated elastic porous media with compressible constituents: Rev.Geophys. Space Phys., 14, 227-241.
Skempton, A.W., 1961, Effective stress in soils, concrete and rocks: in Conf. onPore Pressure and Suction in Soils, 4-16, Butterworth, London.
Sliklje, L" 1969, Rheological Aspects 01 Soil Mechanics, Interscience, New York,123pp.
Terzaghi, K., 1923, Die Berechuung der durchHissigkeitsziffer des tones ans demverlaut der hydrodynamischen spannungserscheinunger: Sitz. Akad. Wissen.Wien Math-naturw K1. Abt. l!a, 132 105-124.
Terzaghi, K" 1925, EJrdbaumechanik anI bodenphysikalischer GnLndlage, Leipzig.
Todd, T., 1973, Effect 01 cracks on elastic properties allow porosity rocks: Ph.D.thesis, M.LT., Cambridge, Ma.
Van der Knapp, W., 1959, Nonlinear behavior of elastic porous media: Trans. Am.lnst. Min. Flngr., 216, 179-187.
Walsh, J.B., 1965, The effect of cracks on the compressibility ot rocks: J.Geophys. Res., 70,381-389.
Wyllie, M.R.J., Gregory, A.R. and Gardner, G.H.F., 1958, An experimentalinvestigation of factors affecting elastic wave velocities in porous media:Geophysics, 23, 459-493.
Zisman, W.A., 1933, Compressibility and anisotropy of rocks at and near theearth's surface: Proc. Nat. Acad. Sci., 19, 666-679.
12-36
(
(
(
(
(
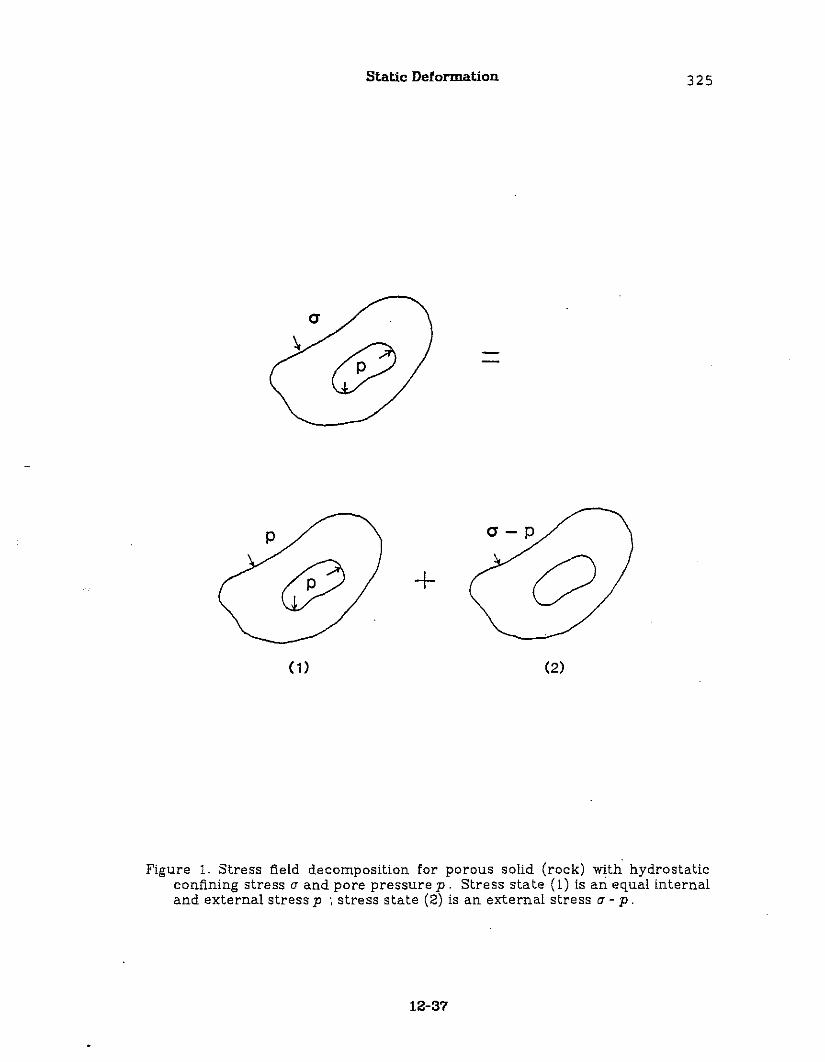
Static Deformation 325
a
p
+
a-p
o(2)
Figure 1. Stress field decomposition for porous solid (rock) with hydrostaticconfining stress (j and pore pressure p. Stress state (1) is an equal Internaland external stress p : stress state (2) is an external stress (j - p.
12-37
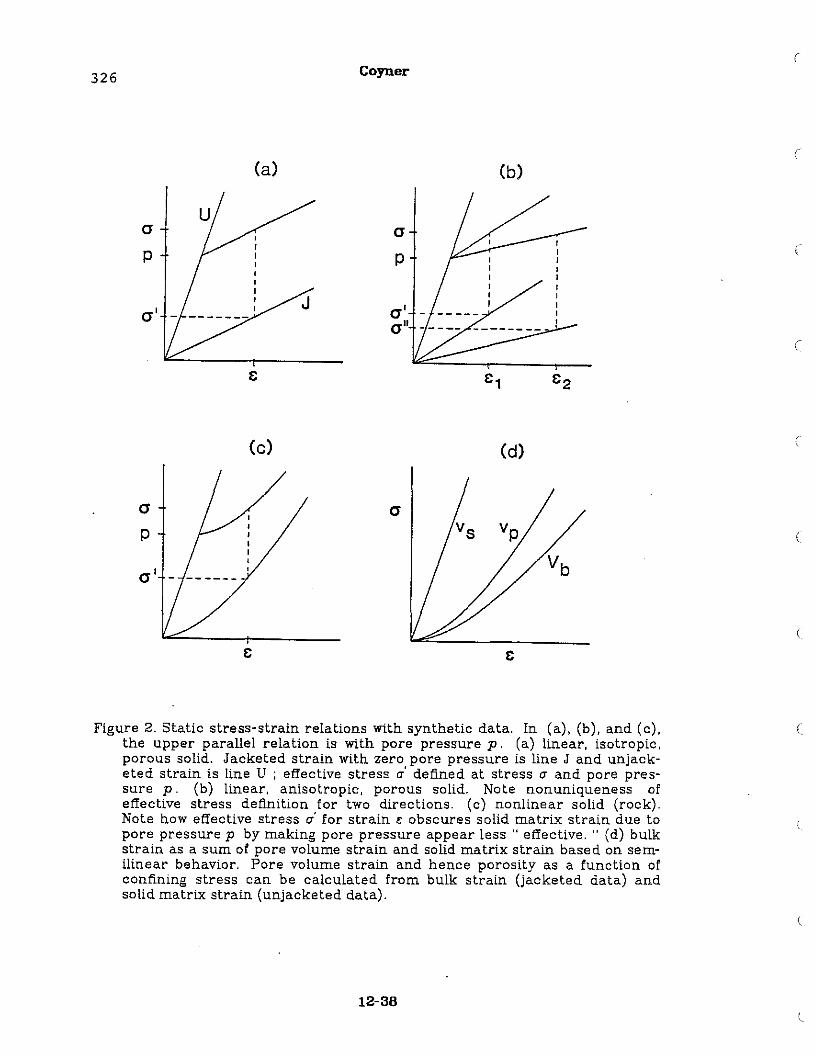
326 Coyner
(
(a) (b)
Ua ap p (
a' J a'-a"
(
e1 &2
(c) (d)
ap
a' -
(
Figure 2. Static stress-strain relations with synthetic data. In (a), (b), and (c),the upper parallel relation is with pore pressure p. (a) linear, isotropic,porous solid. Jacketed strain with zero pore pressure is line J and unjacketed strain is line U ; effective stress rr' defined at stress rr and pore pressure p. (b) linear, anisotropic, porous solid. Note nonuniqueness ofeffective stress definition for two directions. (c) nonlinear solid (rock).Note how effective stress rr' for strain e obscures solid matrix strain due topore pressure p by making pore pressure appear less" effective. " (d) bulkstrain as a sum of pore volume strain and solid matrix strain based on semilinear behavior. Pore volume strain and hence porosity as a function ofconfining stress can be calculated from bulk strain (jacketed data) andsolid matrix strain (unjacketed data).
(
(
12-36(
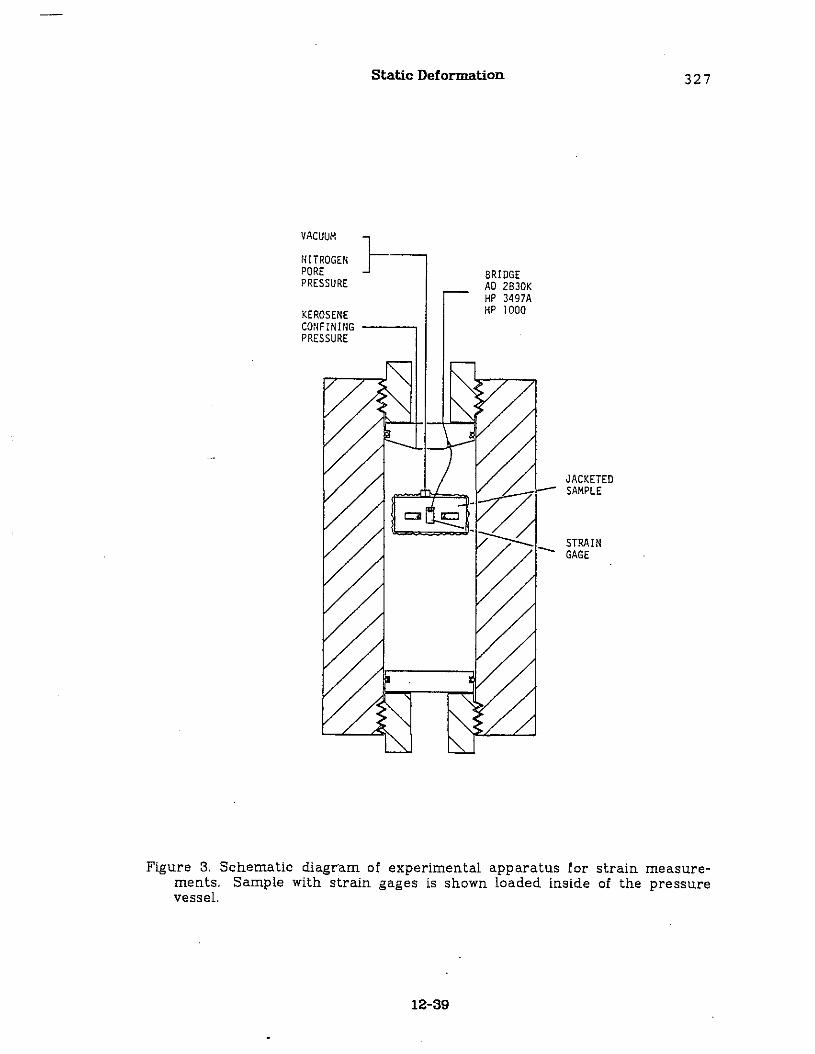
Static Deformation 327
KEROSENECONFINING ------~PRESSURE
VACUUM
NITROGENPOREPRESSURE
}-BRIOGEAO 2B30KHP 3497AHP 1000
JACKETEDSAMPLE
STRAINGAGE
Figure 3. Schematic diagr"am of experimental apparatus for strain measurements. Sample with strain gages is shown loaded inside of the pressurevessel.
12-39
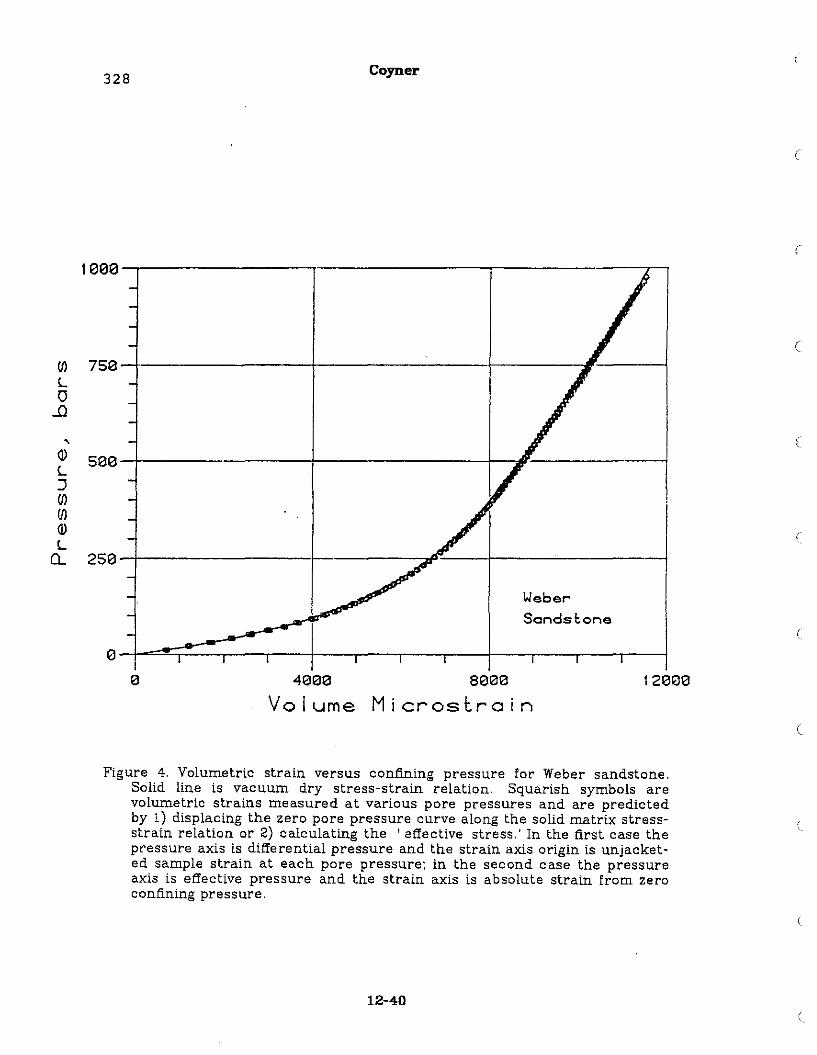
328Coyner
(
(J)
LlJ
.l:l
,~
LJ(J)(J)
~
LCL
1000-,--------,--------,----------:1...--,
750-J.--------t---------~---__,1---_1
500-l---------J---------t--I--------l
250-+--------I------~~-_I_------._1
Weber
Sandstone
c
(
4000
Volume8000
Microsl:.rain12000
c
Figure 4. Volumetric strain versus confining pressure for Weber sandstone.Solid line is vacuum dry stress-strain relation. Squarish symbols arevolumetric strains measured at various pore pressures and are predictedby 1) displacing the zero pore pressure curve along the solid matrix stressstrain relation or 2) calculating the 'effective stress.' In the first case thepressure axis is differential pressure and the strain axis origin is unjacketed sample strain at each pore pressure; in the second case the pressureaxis is effective pressure and the strain axis is absolute strain from zeroconfining pressure.
12-40
(
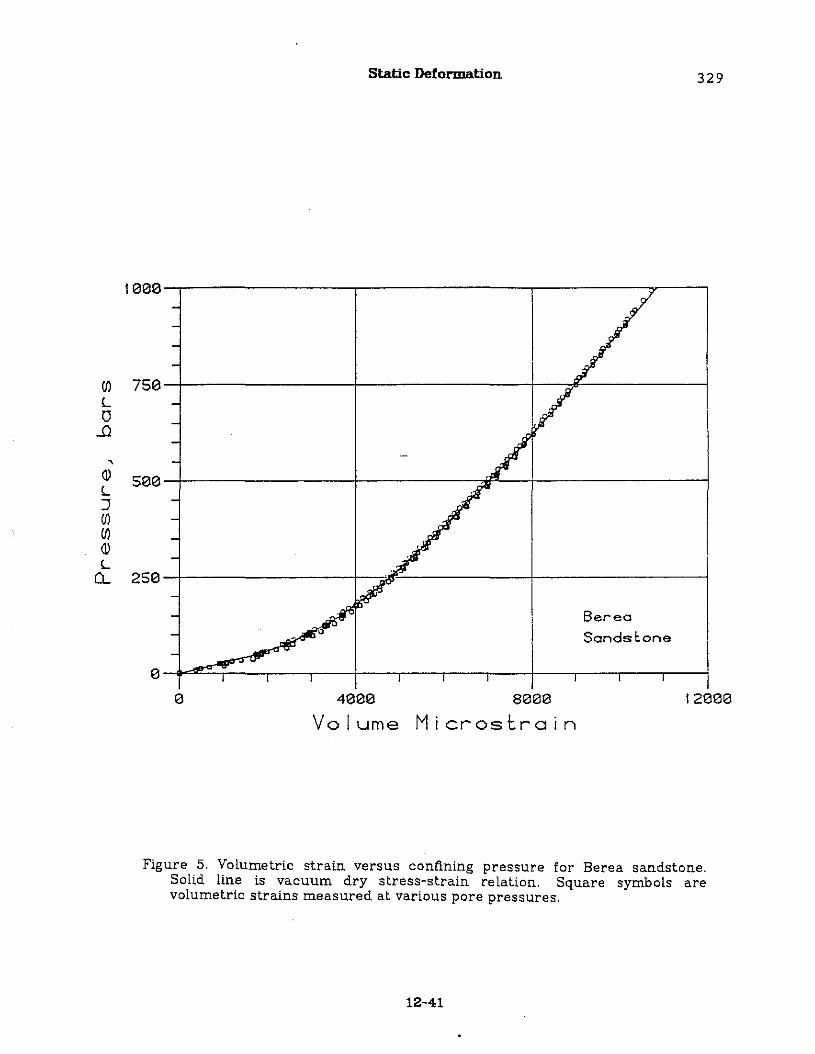
Static Deformation 329
Ieee-,----------,--------,------y---
Berea
Sandst.one
2se-+-------+-df:.=-------+------~
see-+-------+------;jJ!L-+--------j
if) 7Se---1---------I--------j--;:jr--------jLa
.i)
(J)
LJif)if)(J)L
Q..
4eeeVolume
eeeeMicrosl:rain
12eee
Figure 5. Volumetric strain versus confining pressure for Berea sandstone.Solid line is vacuum dry stress-strain relation. Square symbols arevolumetric strains measured at various pore pressures.
12-41
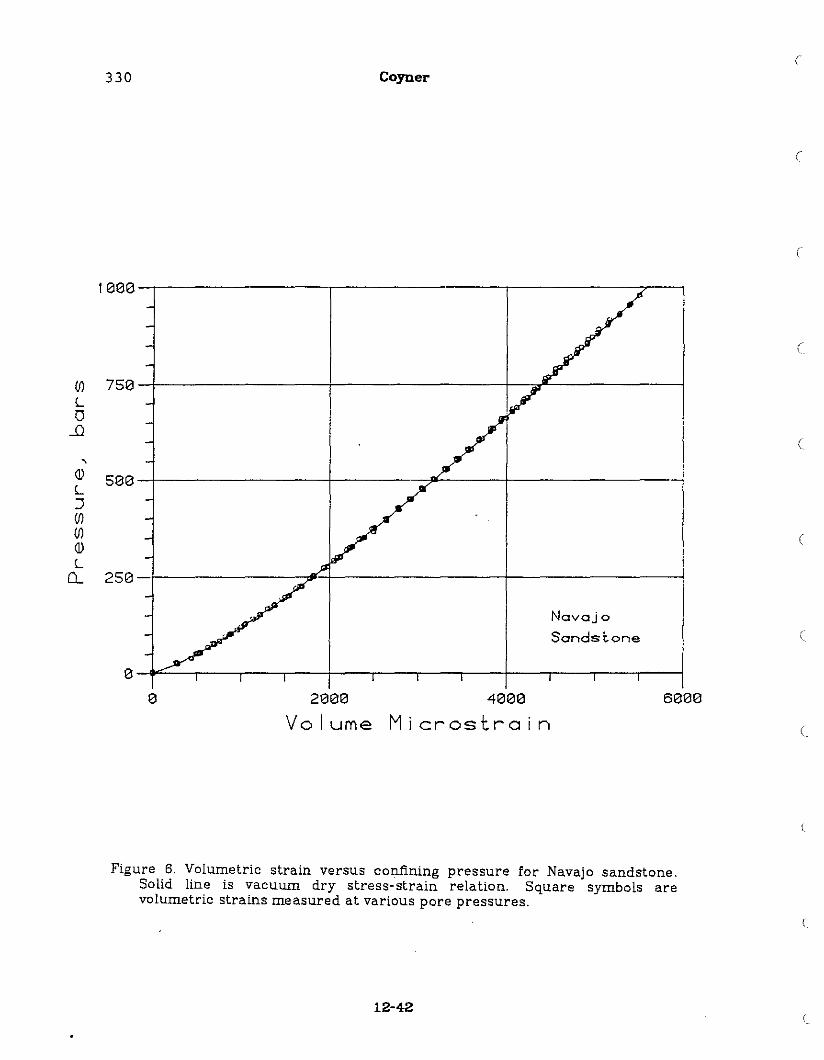
330 Coyner(
(
(
Ieee--r--------r--------,-------:;r-----,
(
(
(f) 7513-l--------+--------t--;;;IC----------jLlJ
.ii
(
6131313
Novojo
Sondstone
4131313
Microstrain2131313
Volume
see --+---------l-------:7"------+------------j
2513-l-------"'fI?-+--------t--------
Q)LJ(f)(f)Q)
L0..
Figure 6, Volumetric strain versus confining pressure for Navajo sandstone,Solid line is vacuum dry stress-strain relation, Square symbols arevolumetric strains measured at various pore pressures,
12-42(
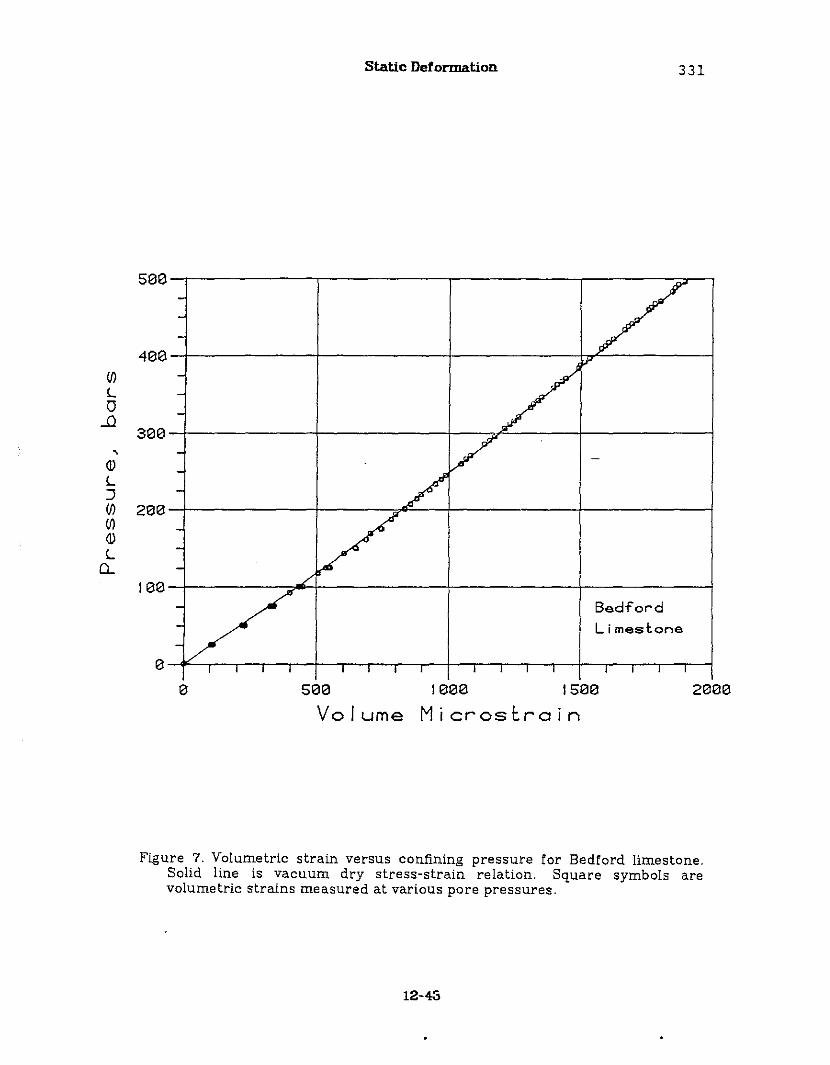
Static Deformation 331
500--r------,-------,---------;----=-,
400IJ)
L0
.J)300
,(J)
L:Jif) 2013if)(J)
LQ..
100BedfordLimestone
o 5013
Volume
101313 15013
Microscrain20013
Figure 7. Volumetric strain versus confining pressure for Bedford limestone.Solid line is vacuum dry stress-strain relation. Square symbols arevolumetric strains measured at various pore pressures.
12-4S
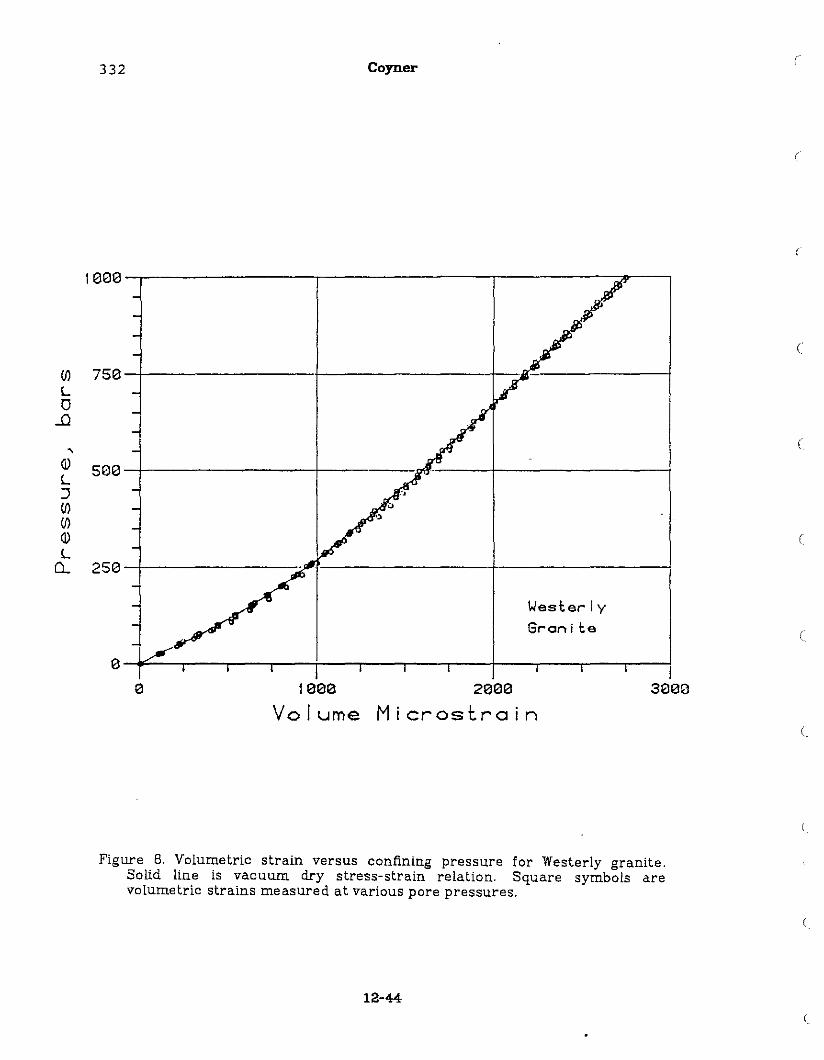
332 Coyner(
(
1eee-r--------,--------r-----~-,
(
2se-J.-------;JITf---------!--------j
soe-+--------!------.."'---t---------j
if) 7se-+--------+--------·+-..r--------1Lo
-0
,Q)
LJif)if)rJ)
L0...
IeeeVolume
Wescerly
Gran ice
2eeeMicrost.rain
3eem
(
Figure B. Voiumetric strain versus confining pressure for Westerly granite.Soiid iine is vacuum dry stress-strain relation. Square symbols arevolumetric strains measured at various pore pressures.
(
12-44
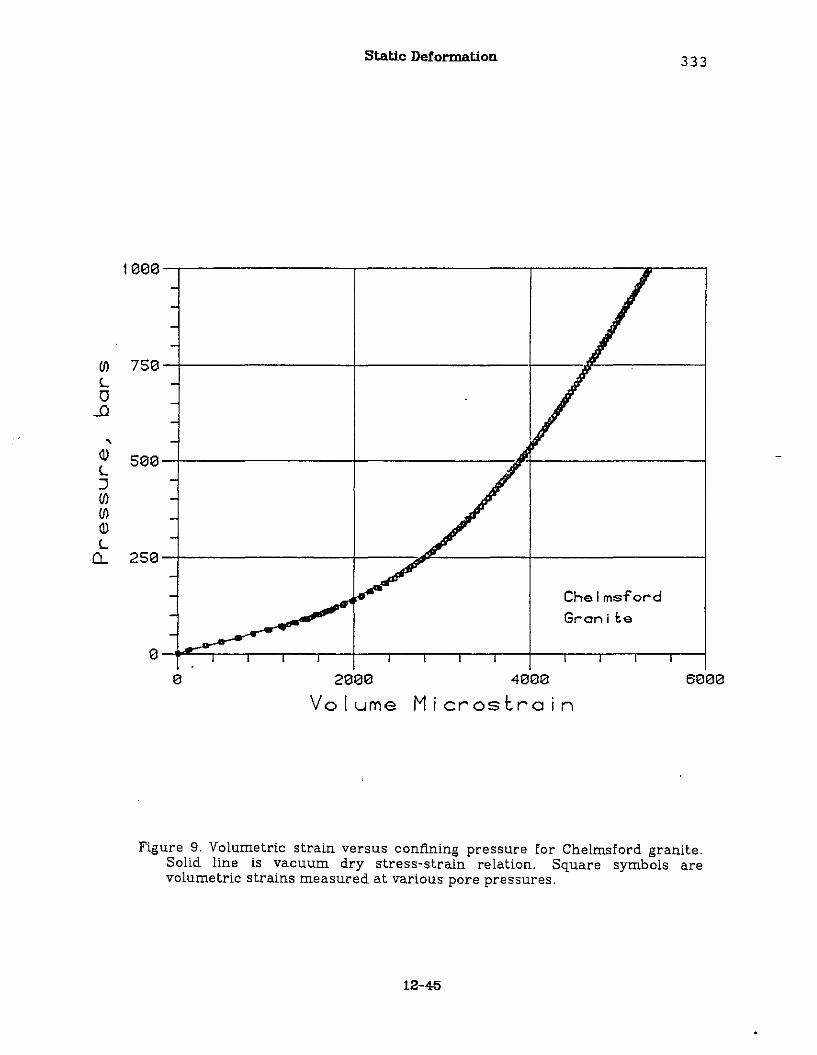
Static Deformation 333
1eee--r--------r-------,..------,---,
Chelmsfor-dGr-on i ee
see-J---------l--------.l1---------1
2se-l--------+-----:;;tjC----+-------j
(j) 7se-!--------+--------I,-----I----,-------1LlJ
...Q
Q)
LJ(j)(j)Q)
L0...
2eeeVolume
4eeeMicrost.rain
6eee
Figure 9. Volumetric strain versus confining pressure for Chelmsford granite.Solid line is vacuum dry stress-strain relation. Square symbols arevolumetric strains measured at various pore pressures.
12-45
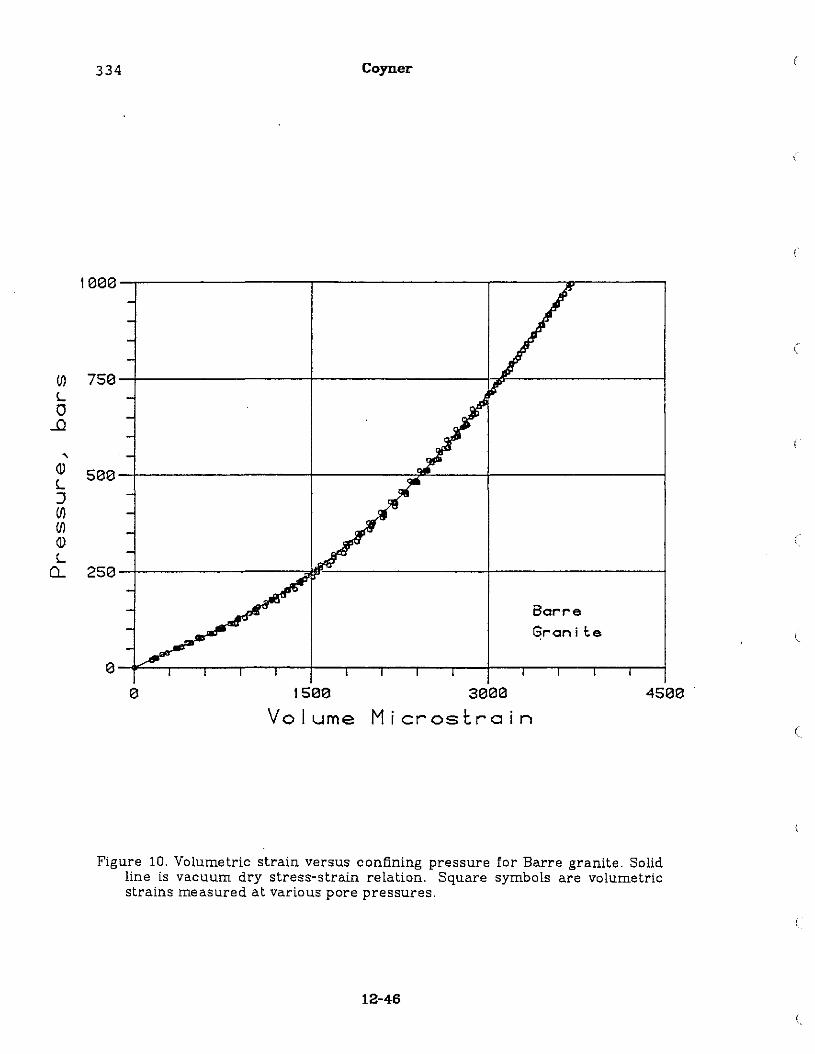
334 Coyner
(
1eee~----------,------------r---~------,
BorreGran i l:e
2se-l---------.8i1C'--------..J.----------.1
see-+-------_+----~~-_+-------_1
,(])
L:J(J)(J)(])
L0...
(J) 7Se-l---------I---------I-.,,?--------1Lo
....0
lseeVolume
seeeMicrostrain
4see
Figure 10. Volumetric strain versus confining pressure for Barre granite. Solidline is vacuum dry stress-strain relation. Square symbols are volumetricstrains measured at various pore pressures.
12-46
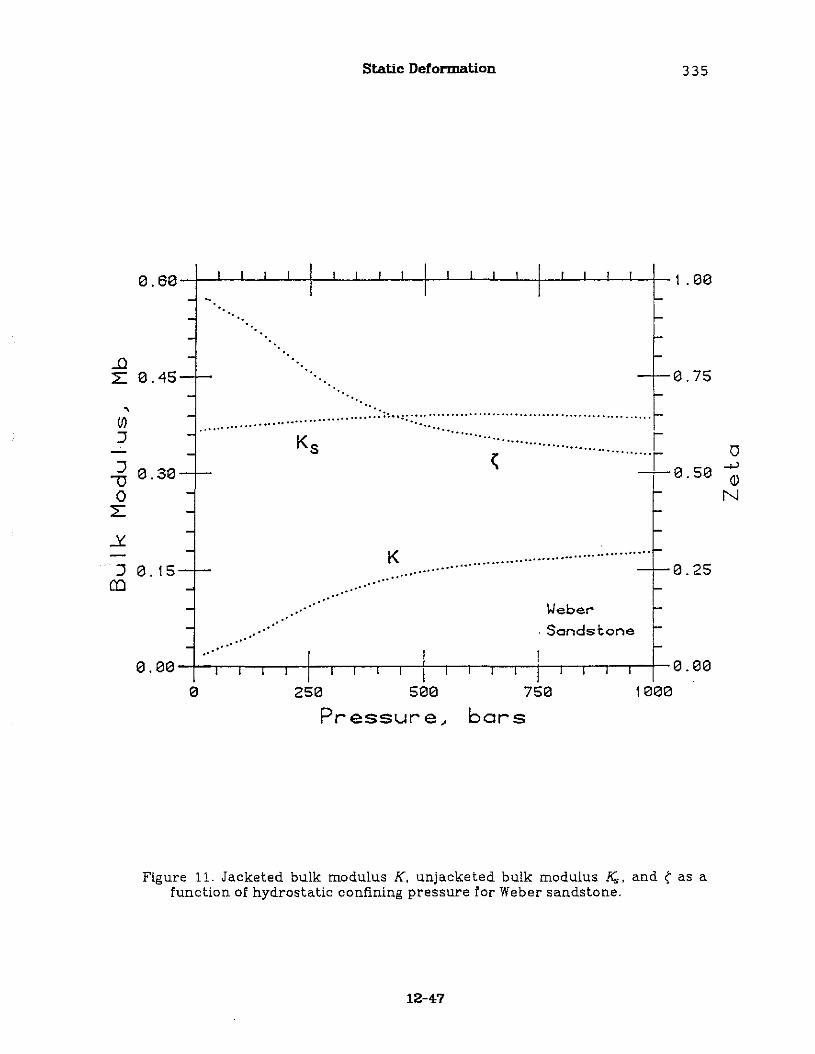
Static Deformation 335
'. '. '.'.
'.'.
-0:::L 0.45 0.75
..,..,., :: :::,..::::::::::::::::::::::: ::: '1Kg r "
~ ·· ....·T v
-0.50 -<J(])
N
K
IJJ:J
~ 0.30o
:::L
..:L
:J 0.15CO
.. , ... , ..... ' ........................ ,.. '.. ,
0.25
.'.. '.'.. ,..,
.'.'
.'.'
Weber
·Sondscone
75e
bars250 5ee
Pressure,
o . 0e -+-.--r----r-,,.-I-r-r-r-r-+--.-.-.-....-t-.-.--r-.---r- 0 . 00
Ieee
Figure 11. Jacketed bulk modulus K, unjacketed bulk modulus K", and (' as afunction of hydrostatic confining pressure for Weber sandstone.
12-47
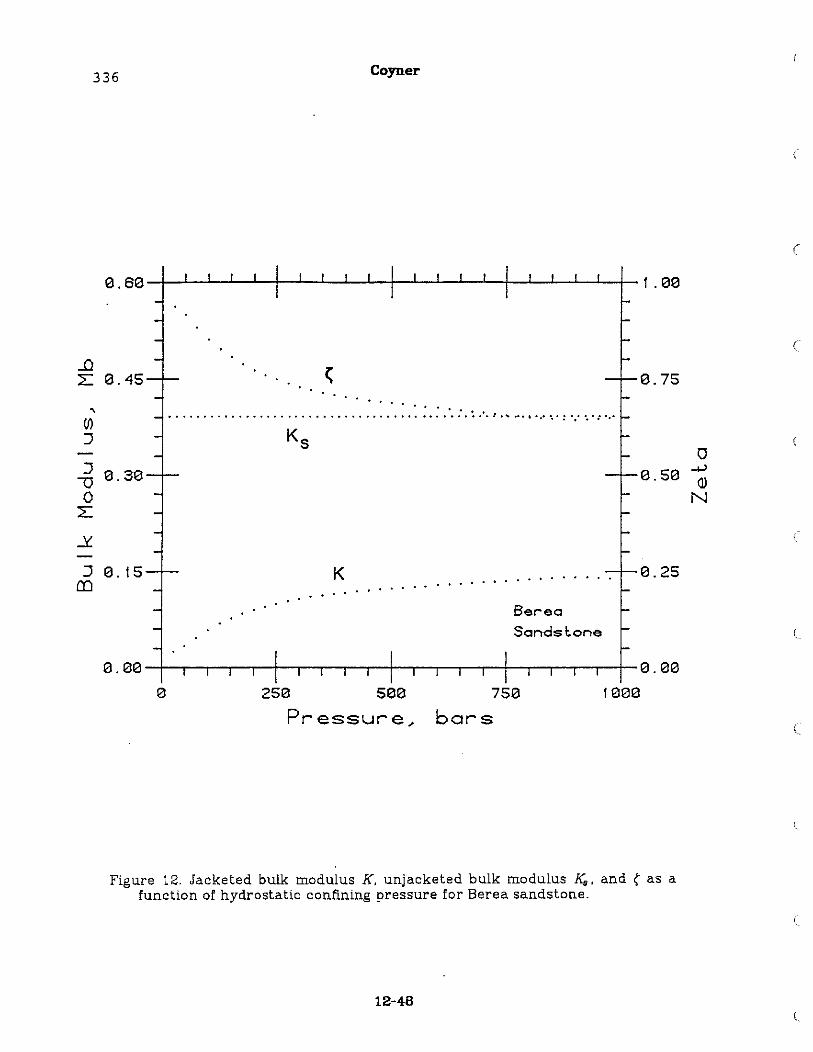
336 Coyner
(
(
.... . . . .......................................... : .: .'. : ... '" .'.' ... : '.' '.' : '.'
..D2: 0.45
,IJ)
J
J 0.30-00
2:
...Y
J 0.15a:l . .
K. . . . . . . . ..... .....
BereaSands I:. one
0.75
o.....,0.50 C)
N
0.25
(
750
bars250 see
Pressure,
o.00 -+--r--r--r-r-t--r--r--r--r-t--r--r--r-r-+-.-.-.-.-+- 0 . 00
Ieee
Figure 12. Jacketed bulk modulus K, unjacketed bulk modulus K., and (" as afunction of hydrostatic confining pressure for Berea sandstone.
12-46
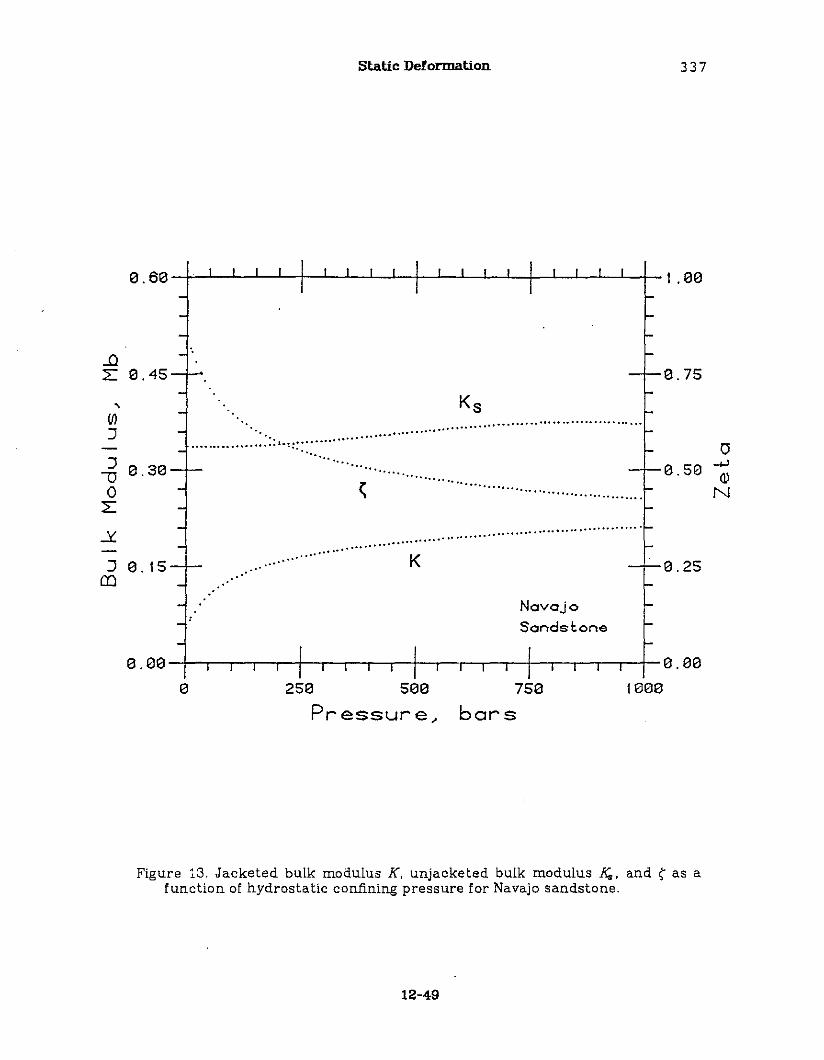
Static Deformation 337
a.613 -+-.L.-.L.-.L.-.L.-+--J...--'---'---'--+--'---'---'---'--+--'---'---'---'--j- 1 . 1313
...0L 13.45
,(f)
J
J 13.313\J0
L
...'L
J 13.15m
..........................................................." ................... :1 .. :::::: .. ··
.... .... ...... ...... ......... .... .......................................
• " •••••••••••• 0 •••••••• 0 ••••0
•••••••••••••
................................ K...... ,.. ,
13.75
o....,13.50 (j)
N
13.25
.'Navajo
Sandsl:one
750
bars250 51313
Pressure,
a .1313 -+-.----r---r----,-!---,c--c--r--r-+-.,.---,.-.--.--+--.--.--.--.-_�_ a .ea1000
Figure l3. Jacketed bulk modulus K, unjacketed bulk modulus K., and S as afunction of hydrostatic confining pressure for Navajo sandstone.
12-49
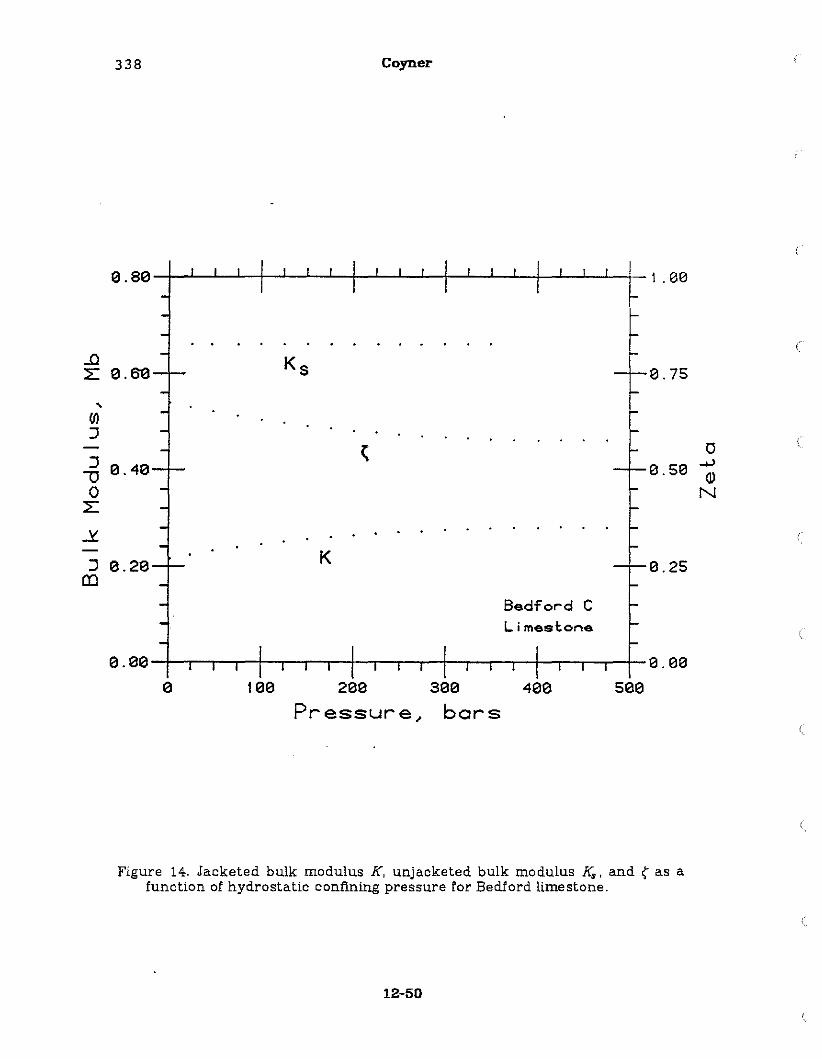
338 Coyner
0.80 -+--'---'---'--+--1..--1..--1..-+--1..--1..--'--+--1..--'---'--+-.1..--,---,--;1_ 1 . ee
Figure 14. Jacketed bulk modulus K, unjacketed bulk modulus K., and \ as afunction of hydrostatic confining pressure for Bedford limestone.
12-50
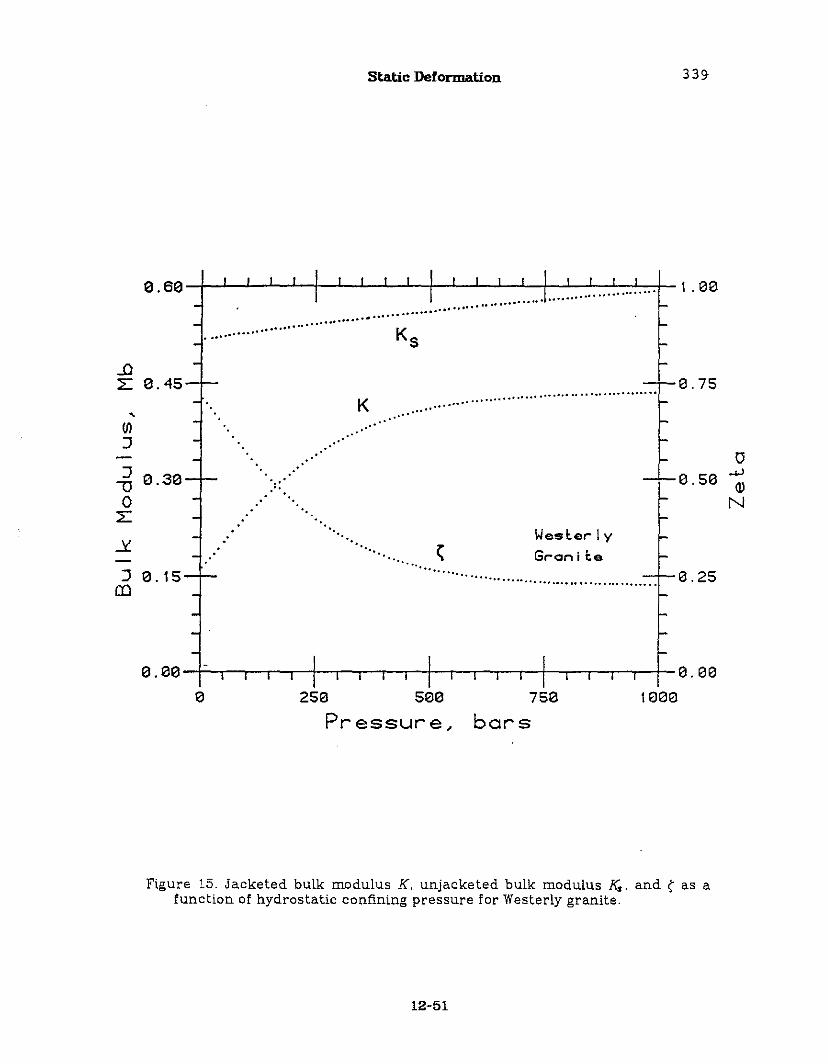
Static Deformation 33~
• • 0- ,0' .0•• _.0
•0,.,
o .60 -/.-l--Jl.-..L.-..L.--I-..L-...J...-L.-l...-!---l.-l--l--''--I--.L.-..-'-.._.. ...L..._....1.. -...-'.'- 1 . ee........••0. 0 .
0 ••••0.0°.0 .0.° •.... .0.···., 0 0 ••0 • 0 ••
.-0L 0.45 e.75
\}-+J
e.50 <ll
N
0.25
loJesle,..lyG,..an i le
, ••••••0 •• _0 ••• 0.· •••••••................................. ,
.... 7'" "............
" ·0 ••• 0 •••0
••
0', ••• u •••••••••••••••••••••
.'
K
.'
'.
.. ,
'.
.'.'
'.,."
.'
.'
Ul:J
-6 0.30o
L
-oX
:J0.15CO
75e
bars25e see
Pressure,
o . e0 -J.:......--.--.,--.---!-,--,--,--,---!--..--r--r---r--t--,--,...-,...-,...-+- e . 00
teee
Figure 15. Jacketed bulk modulus K, unjacketed bulk modulus Ks, and ~ as afunction of hydrostatic confining pressure for Westerly granite.
12-51
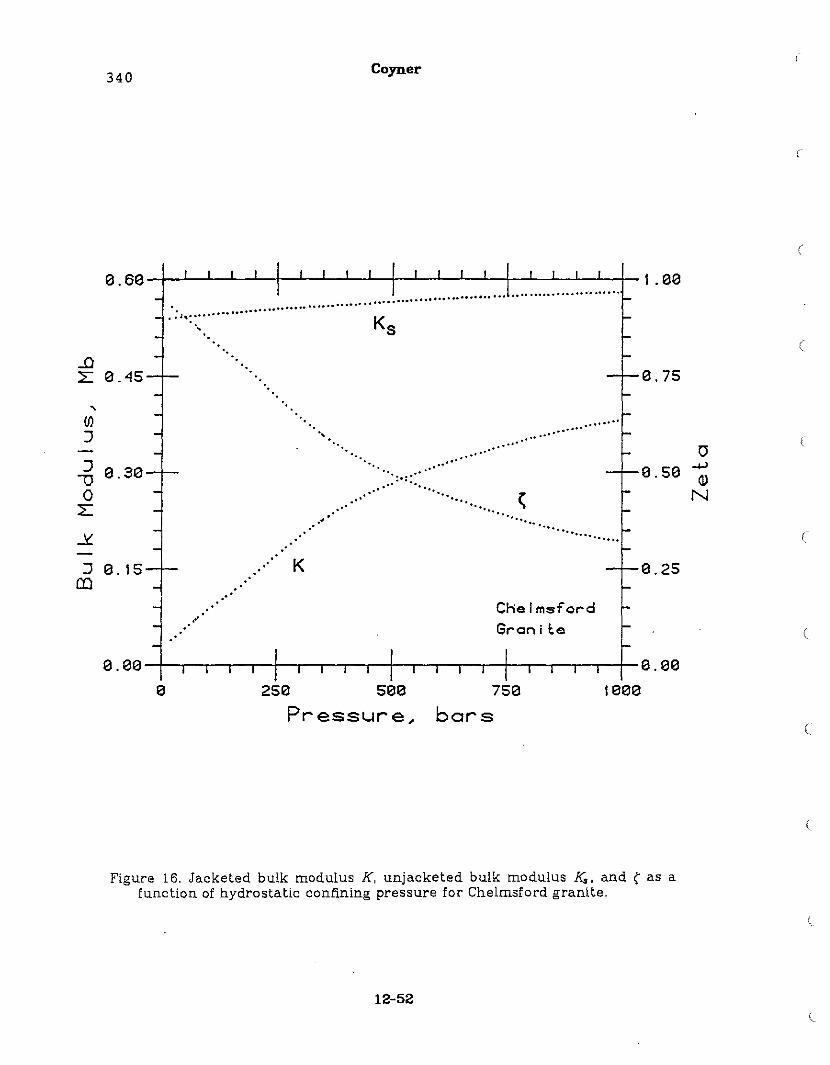
340Coyner
(
.............................. ..••• 0 ••••• 0 •••
• 00.0•• 0 •••••••••••• 00 •• ••
o .J,,: .....
'.'. (
'.'..-0::L 13.45
,(f)
:J-:J 13.313-00
::L
~
:J 13.15CO
.'
.'..,."
."
'.
.'.'
K
'.
..'••0-
.'
................................ ,.. ,.".'
'0.:.: ::: '".. ''" ~'" .......
'" ". " ......• -0. 0 0 -0.
0'0
ChelmsfordGran i ~El
13.75
o-'-'13.513 <DN
13.25
c
7513
bars2513 51313
Pressure,
13 .1313 -+--r--r---...--,-I~..--,...-...--r-+--.--r--r--.---t-~-.---.,.---.,.--+-a . 1313
Ieee
Figure 16. Jacketed bulk modulus K, unjacketed bulk modulus K", and \ as afunction of hydrostatic confining pressure for Chelmsford granite.
12-52
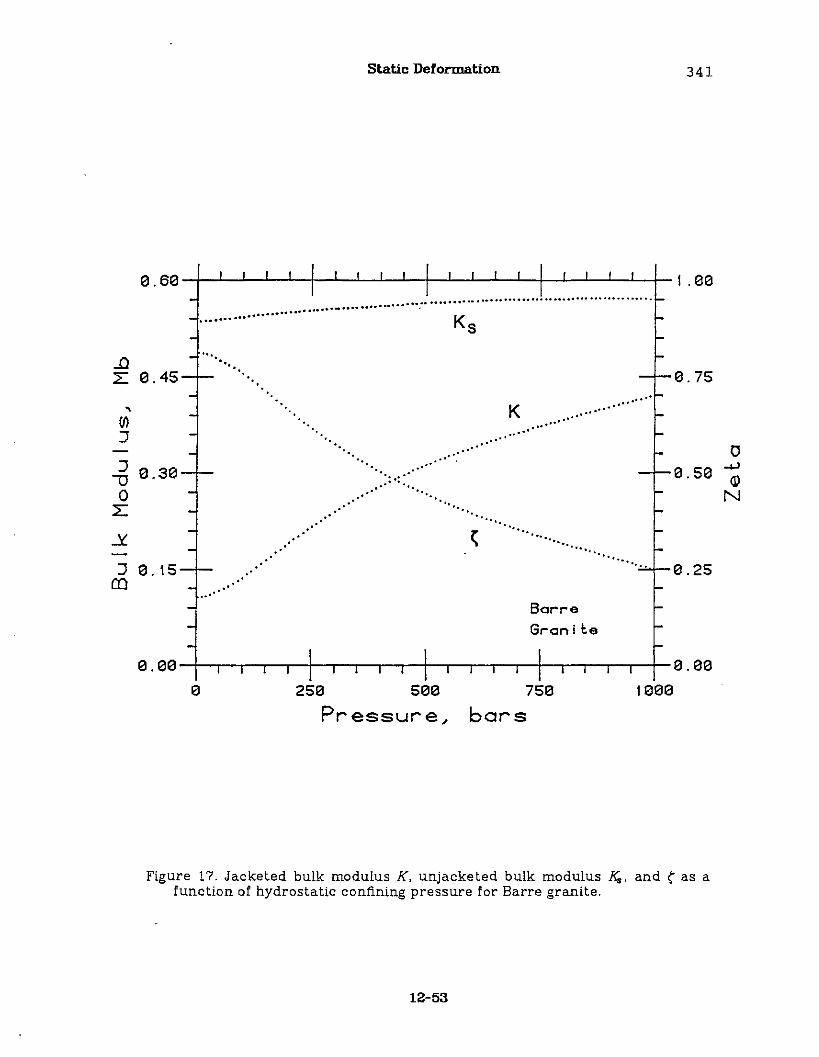
Static Deformation 341
o . 60 -t--'--'--'--'--t--'--'--'--'--t---'---'--'----'--t---'---'---'--'--_t_ I .00.. e •• O .0 0_ eO 0 ..
.... •••• •••••••••• u •••• 00 u ••••••0.··
....'"
K
..Q::E: 0.45
,(I)
:J
~ 0.30o
::E:
.:L
:J 0.15CO ".. ,
'.'.
"
.'
".'.
.,'.. ,....
.',,'
':.:'. '.
. ............ ,.............. ,.. '
.'.. ,,.'
",
....' .
'"
~" .....
'"'" ....
'".... 0 ... " .....
0.75
(1....,a.5a Q)
N
0.25
Borre
Grcnil:.e
750
bars25a 5ee
Pressure~
ea , 00 -t--.---r---r-,rll--r-r-,.--,.--+--r-...-...-..,.--t-........,--.,-.,-_t_a . a0
Ieee
Figure 17. Jacketed bulk modulus K, unjacketed bulk modulus K", and ( as afunction of hydrostatic confining pressure for Barre granite.
12-53
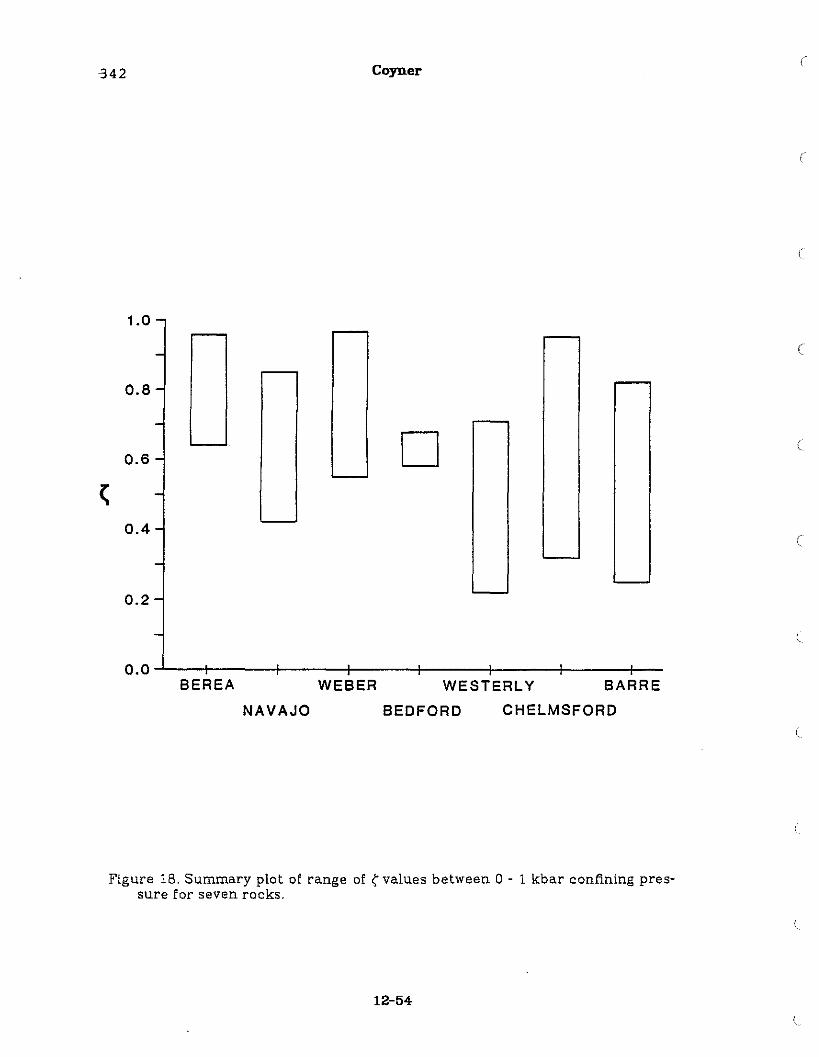
"342 Coyner(
(
1.0
C
0.8
D (
0.6
~
0.4C
0.2
0.0 -'---t----t----t---t----j----+----+-BEREA WEBER WESTERLY BARRE
NAVAJO BEDFORD CHELMSFORD(
Figure 18. Summary plot of range of ~ values between 0 - 1 kbar confining pressure for seven rocks.
12-54
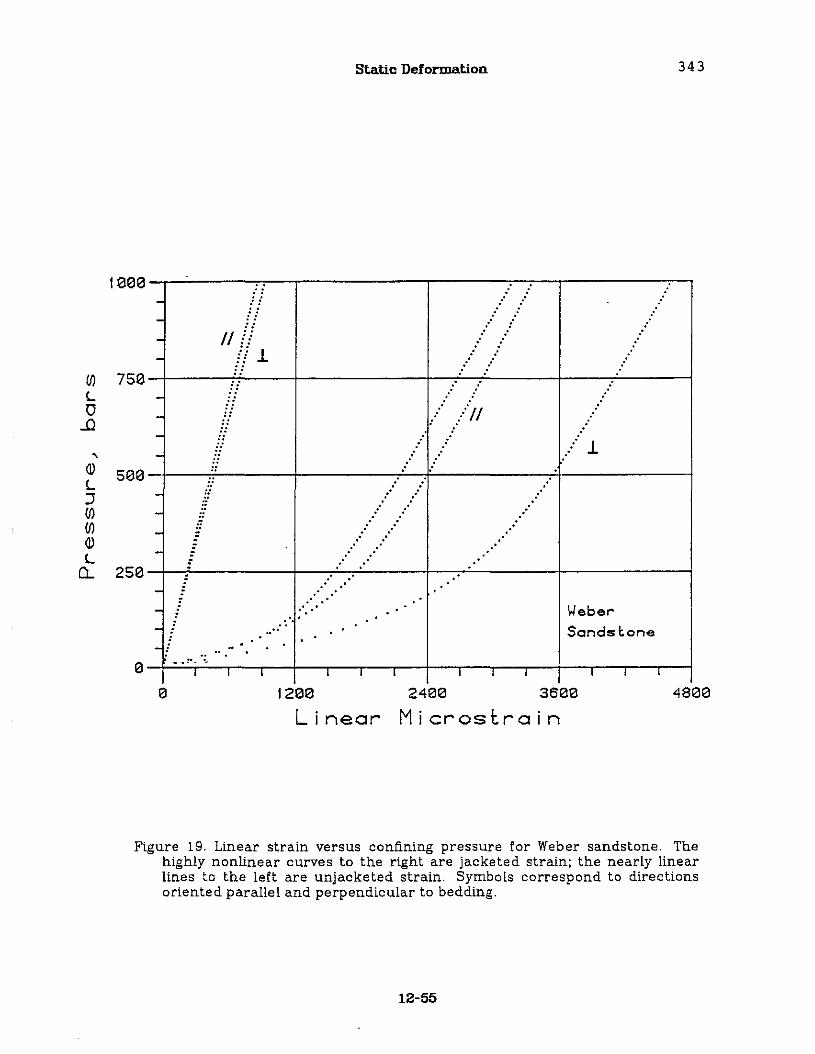
Static Deformation 343
.1
...
1/ ii::.1: :
-see -f----:~..----+------7--,f-----~j-----__i
----
2se-+-~.----+_---,c'-:~--+____:_''----_f-----_i
Ieee----
if) 7seL -0 -...Q
-
(])L:Jif)if)(])
LCL
--- f-[e . "'0 '.
I I I I I I
121313
Linear
\oIeberSandstone
I I I I I ,
241313 36013
Microstrain481313
Figure 19. Linear strain versus confining pressure for Weber sandstone. Thehighly nonlinear curves to the right are jacketed strain; the nearly linearlines to the left are unjacketed strain. Symbols correspond to directionsoriented parallel and perpendicular to bedding.
12-55
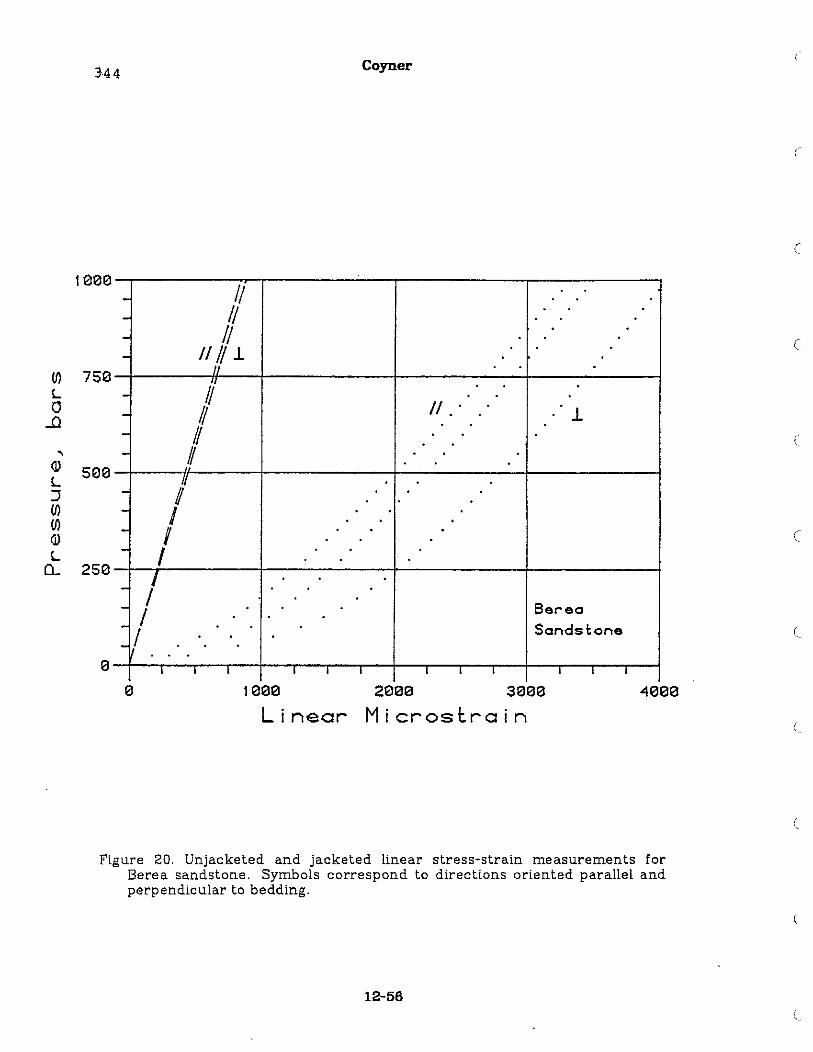
344 Coyner(
(
(
HJ00
(f) 750L0
...Q
,<J) 500L:J(f)(f)<J)
L0- 250
- II- II- II- II/ll.
Ii
- II'- /I II .. l.- /I- #- ;/- I- I- I- ;'- / Berea-/ Sandstone- .
I I I I I I I I I I I I
(
(
(
101313
Linear201313 3131313
Micros!:'rain4131313
(
(
Figure 20, Unjacketed and jacketed iinear stress-strain measurements forBerea sandstone, Symbols correspond to directions oriented parallel andperpendicular to bedding,
12-56
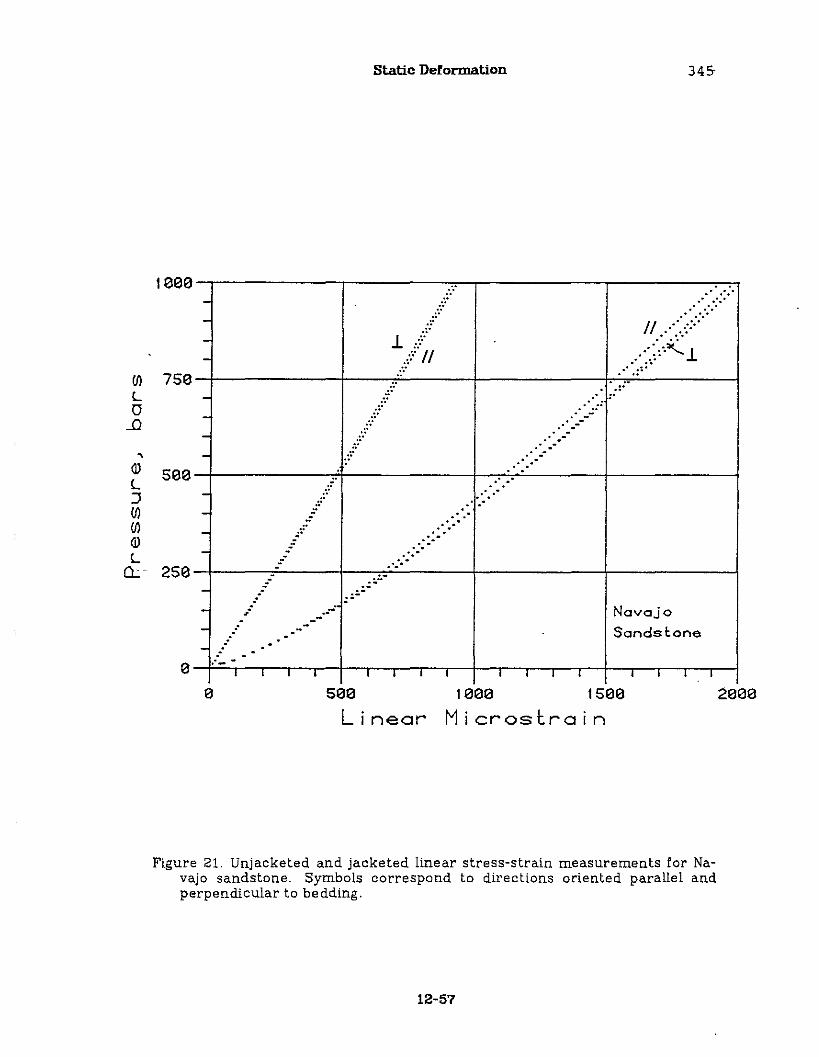
I I I I I I I I I I I I I
500 1131313 151313
Linear Microscrain
1000----
(J) 750L -0 -...0 -, -
(I) 500L:J -(J) -(J) -(I)
L -a..: 250
----
0
.'
,"- .
,"
Static Deformation
.." ............
.. "....
345-
." ....
II .' ....
······"'-...10" .:"
NavajoSandstone
I I. I
2131313
Figure 21. Unjacketed and jacketed linear stress-strain measurements for Navajo sandstone. Symbols correspond to directions oriented parallel andperpendicular to bedding.
12-57
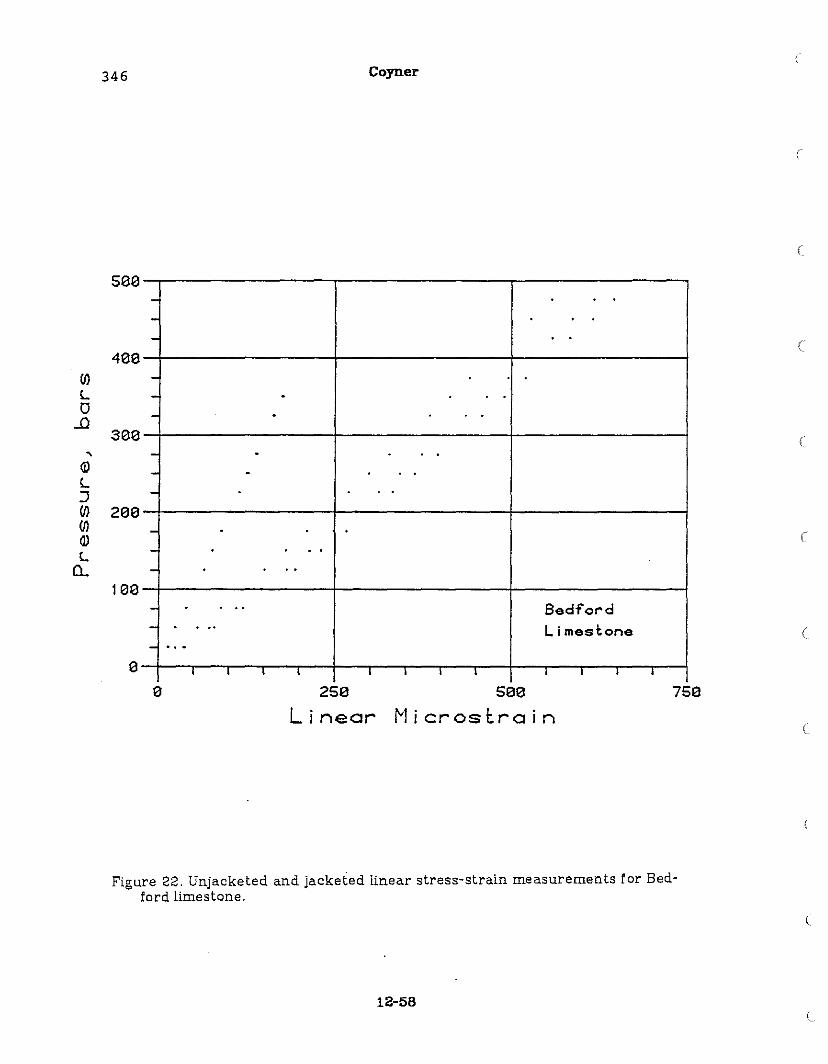
346 Coyner
(
(
(
(
(
----- .- .
- .- .-
- .-- ..
- . .- Bedfor-d- . -- Limestone- ...
I I I I I I I I i r I •
see
see
(J)Lo
...Q
(j)
L:J(J) 2ee(J)OJL
Q..
258
Linearsee
tvl i crosl:ra i n
7se
(
Figure 22. Unjacketed and jacketed linear stress-strain measurements for Bedford limestone.
12-58
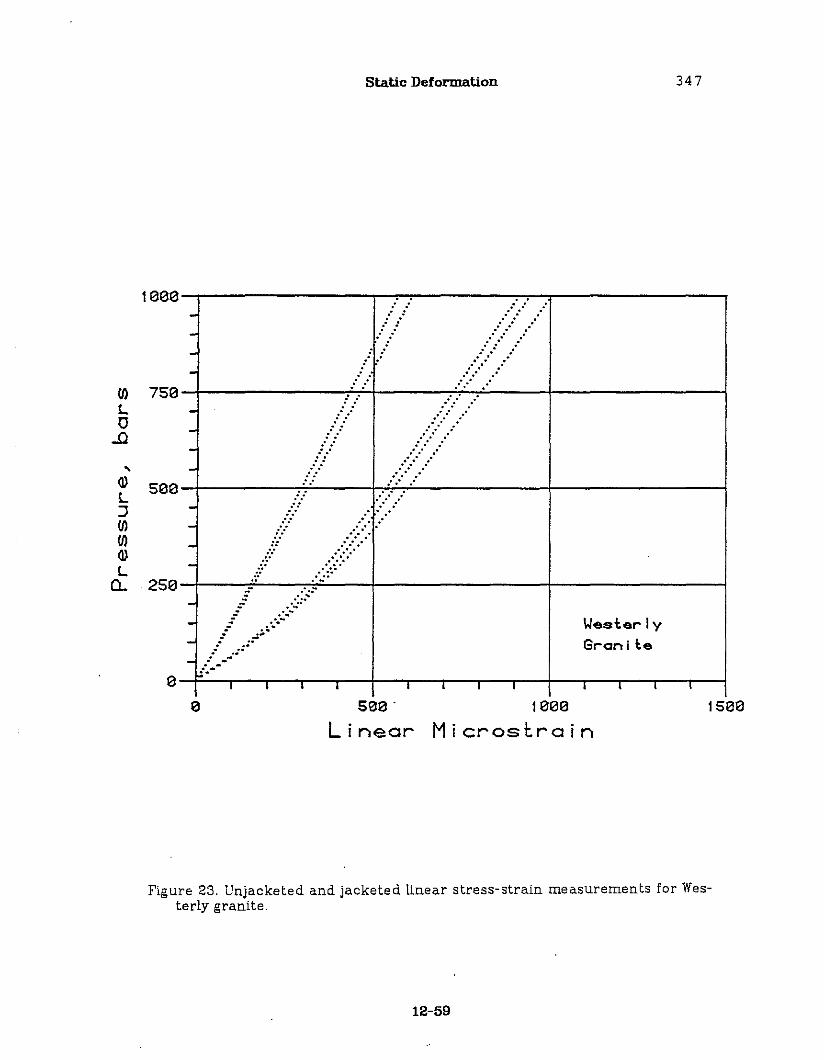
Static Deformation 347
1500
\.Ieste.-Iy
G.-oni te
1000Microst.rain
o
1000-r-------r::-:-----,,....,...,...----------r- ./,/ ....::::>..= ./.>.,-
0°."
...::...750-+------f++----::'.~. -,.,::....---+-------1
= ..(.'......0° .. 0°
- /.... .....•.:.....: .- ...
0° .' .0
500-+----:7'---H.. ·::,.·.::,...-----+-------i- .., .:.......- ~. ~
..-:.-:..- ......- ...~./:::..
250 ..~- ..~::."- .,::~.,
- .:;:'-.- .:.
- /.~---
0-j=--"-""r--I,-t-,,r--y,--"I,-r-,-I--.-,-r-,---r--.-,-iSe0 .
Linear
~L~(fj
IIIQ)
LQ..
(fjLo
..0
Figure 23. Unjacketed and jacketed linear stress-strain measurements for Westerly granite.
12-59
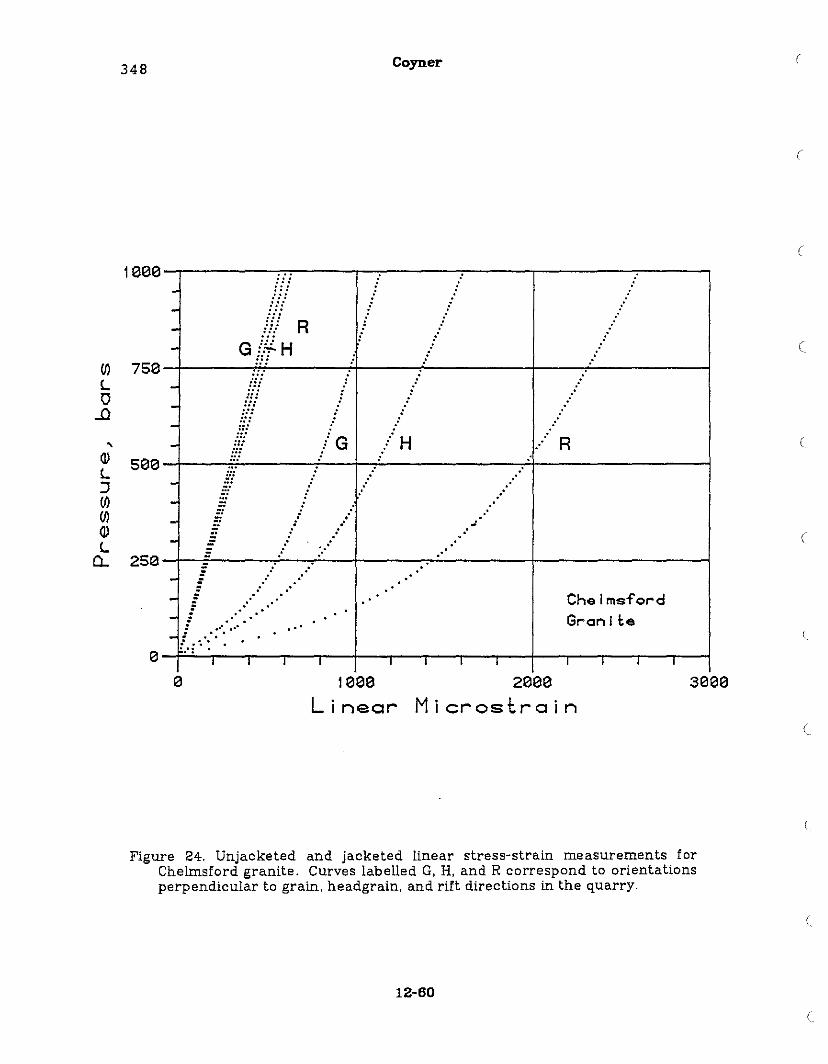
(J)Lo
...Q
(J)L:J(J)(J)(J)L
c..
348
::::':':'::: R
G H.i.. H
::f/.~:~::::
:::
.'"
.. '
/G
Coyner
H
,.
.,;
.'
R
Chelmsfor-dGr-an J tG
(
(
(
(
(
(
1I:H30
Linear2000
Microstroin
I I I I I I I I I I I
S0e0
(
Figure 24. Unjacketed and jacketed linear stress-strain measurements forChelmsford granite. Curves labelled G, H, and R correspond to orientationsperpendicular to grain, headgrain, and rift directions in the quarry.
12-60
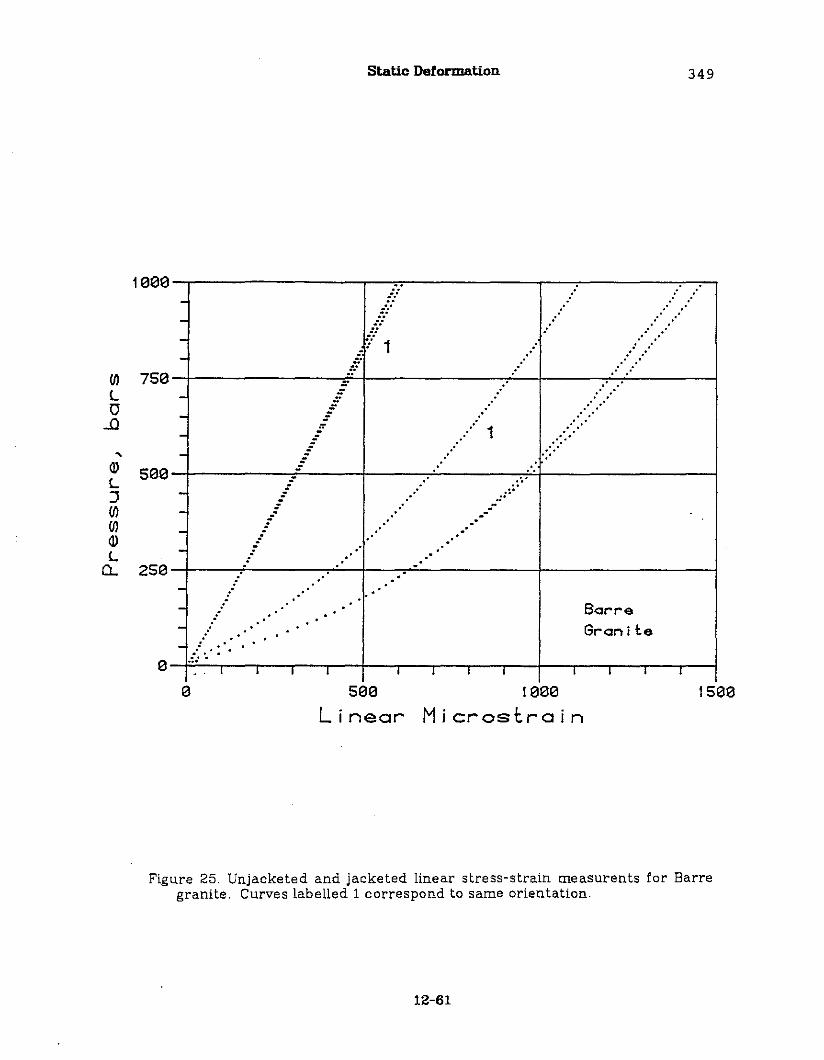
Static Deformation 349
""
"
I I
.. ..,.:'..:'
" .'
BorreGroni t.e
I I
....
I I
.'
I I
1
1
""
.'
"
I II I
1"100----
(f) 750L -0 -..Q -, -~ 500L:J -(f) -(f) -~
L -CL. 250
----
0
50e
Linearlee0
Microscrain15ee
Figure 25. Unjacketed and jacketed linear stress-strain measurents for Barregranite. Curves labelled 1 correspond to same orientation.
12-61
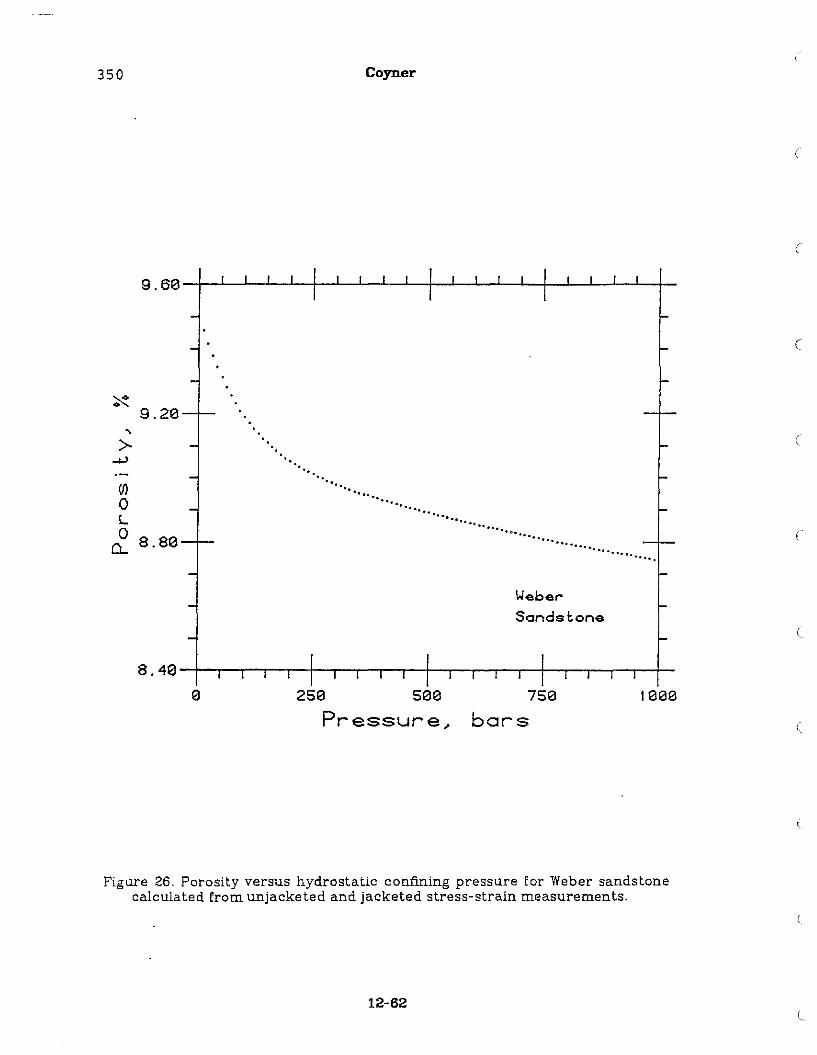
350 Coyner
(
(
(
~9.20
,>-
-+>
(J)
0L0 8.800....
WeberSands~one
(
(
2se seePressure~
7sebars
Ieee(
FigLU"e 26. Porosity versus b.ydrostatic confining pressure for Weber sandstonecalculated from unjacketed and jacketed stress-strain measurements.
12-62
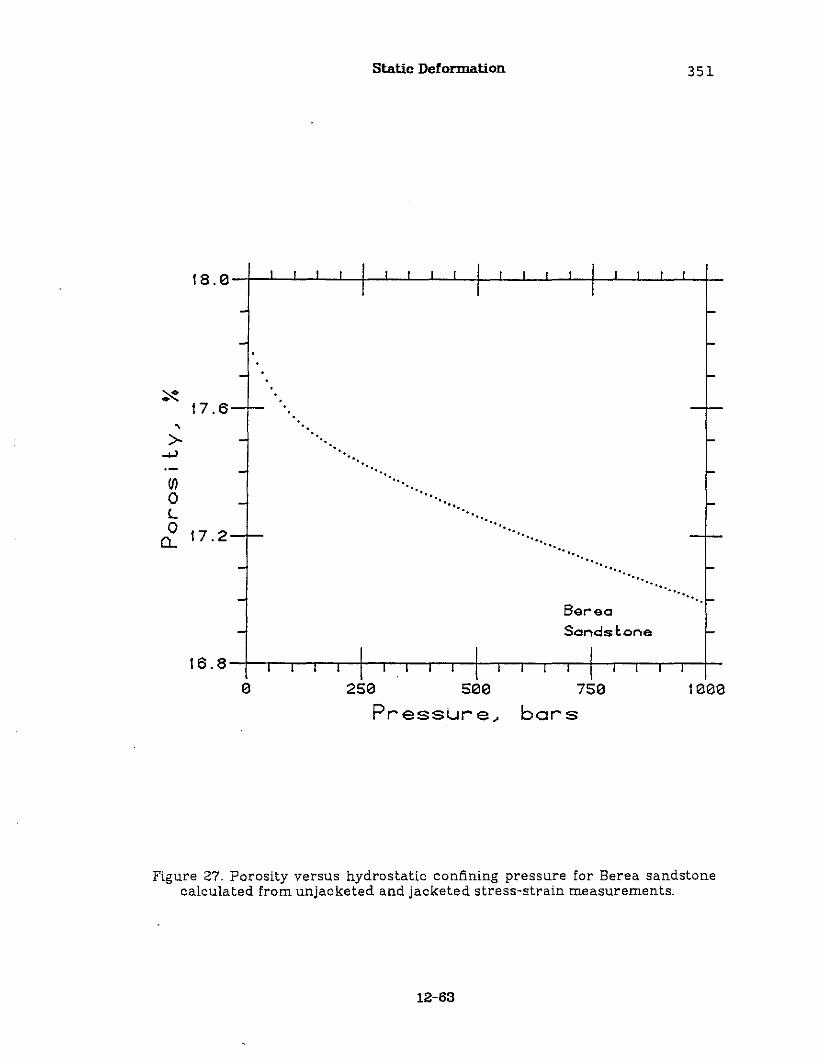
Static Deformation 351
~17.6
,>-......,
If)0L0 17.2Q..
'.
'.'.
'" ..'"
'" '. '" .....Ber-ea
Sandstone
16 . 8 -t-,.---,---,---,c--I-r-r-,--,--+-.-..,..-..,..-..,--+---.--.-.--.--+--
250 500
Pressure,750
bars1l3l30
Figure 27. Porosity versus hydrostatic confining pressure for Berea sandstonecalculated from unjacketed and jacketed stress-strain measurements.
12-63
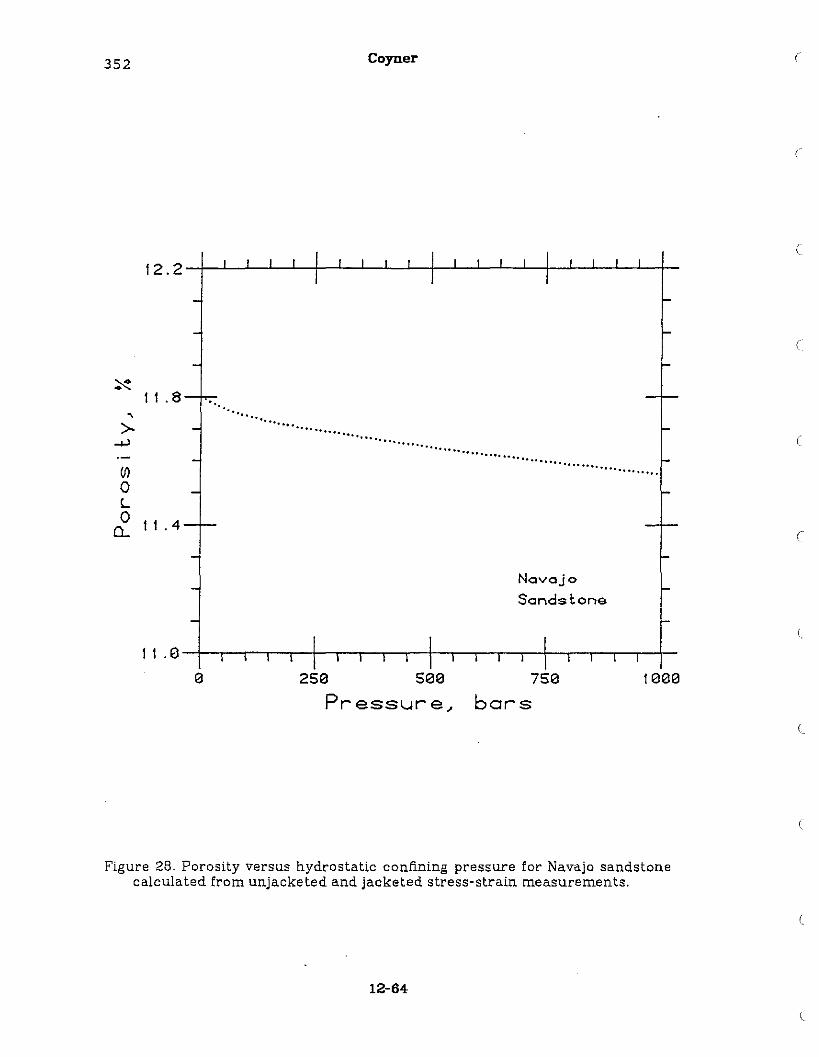
352 Coyner (
(
(
(
~1 1 .8
~
>-....,(j)
0L0 1 1 .40..
'~"" "' ...... .... .......... ........ ...... ........ '" .
" - ....... .........
Navajo
Sandstone
(
(
2se seePressure J
7sebars
Figure 28. Porosity versus hydrostatic confining pressure for Navajo sandstonecalculated from unjacketed and jacketed stress-strain measurements.
12-64
(.
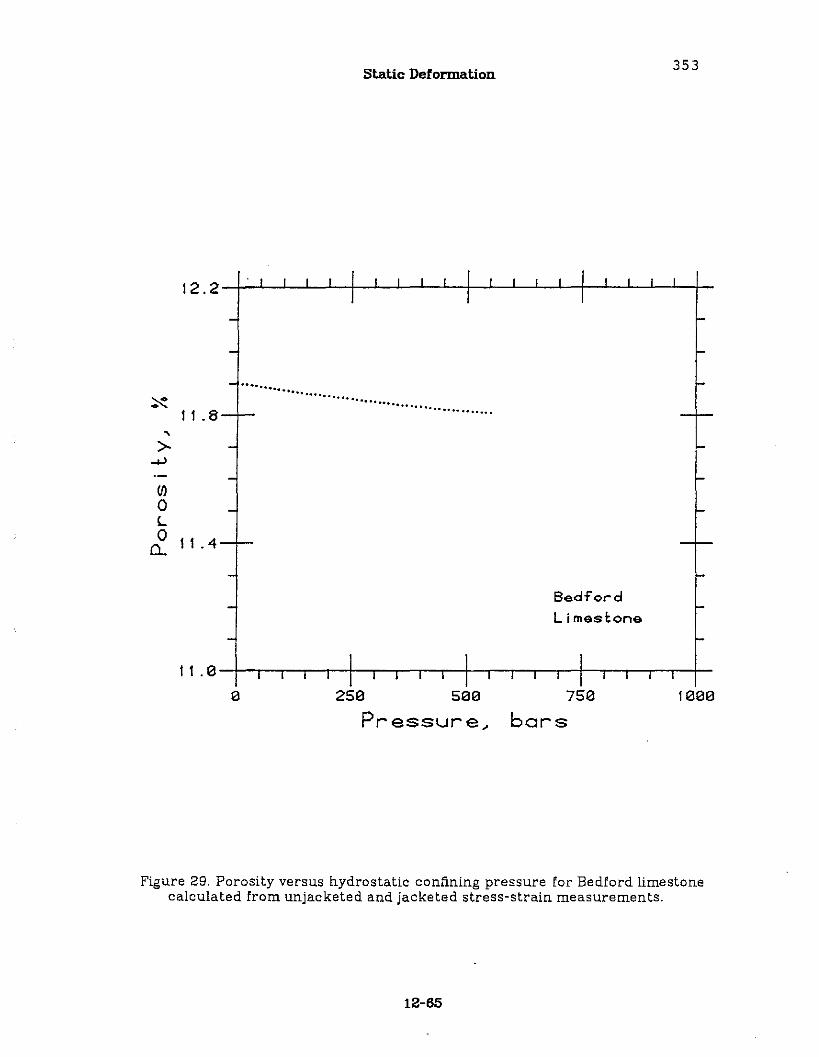
Static Deformation353
~I I .8
,>-
..>J
(f)
0L0 1 1 .4Cl.
•••••••••••••• '.' 00 •
• 0.0.000.0 •••• 0 •••0
•
.0 .
2S8 S88
Pressure~
Bedfor-d
Limestone
7S8
bars
Figure 29. Porosity versus hydrostatic confining pressure for Bedford limestonecalculated from unjacketed and jacketed stress-strain measurements.
12-65
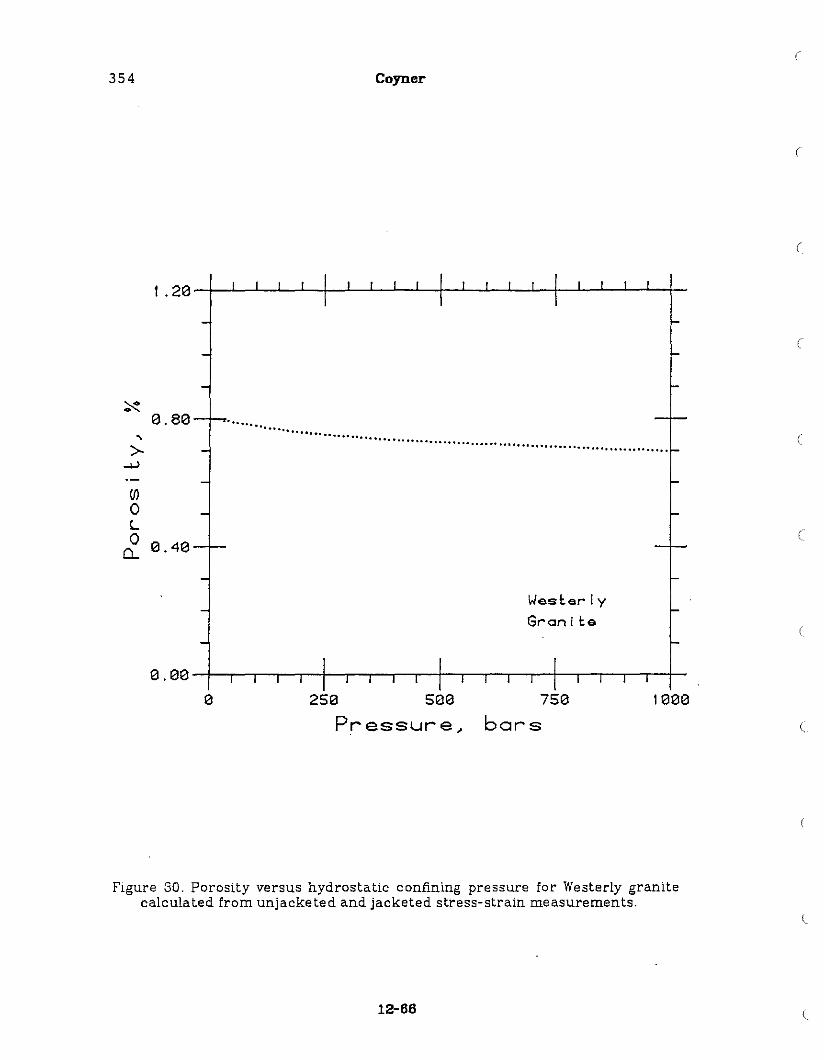
354 Coyner
(
(
(
(
~0.80
,>-~
(f)
0L0 0.40Q..
......• '0.0 .0 •• 0 ••
0eo •• .....................
•••• 0.0.0 •• 0 •• 0.0 •••• 0 •••••••••• 0 .
\.Iesterly
Gran I le
(
(
250 500
Pressure,750
bars1000
(
Figure 30. Porosity versus hydrostatic confining pressure for Westerly granitecalculated from unjacketed and jacketed stress-strain measurements.
12-66
(
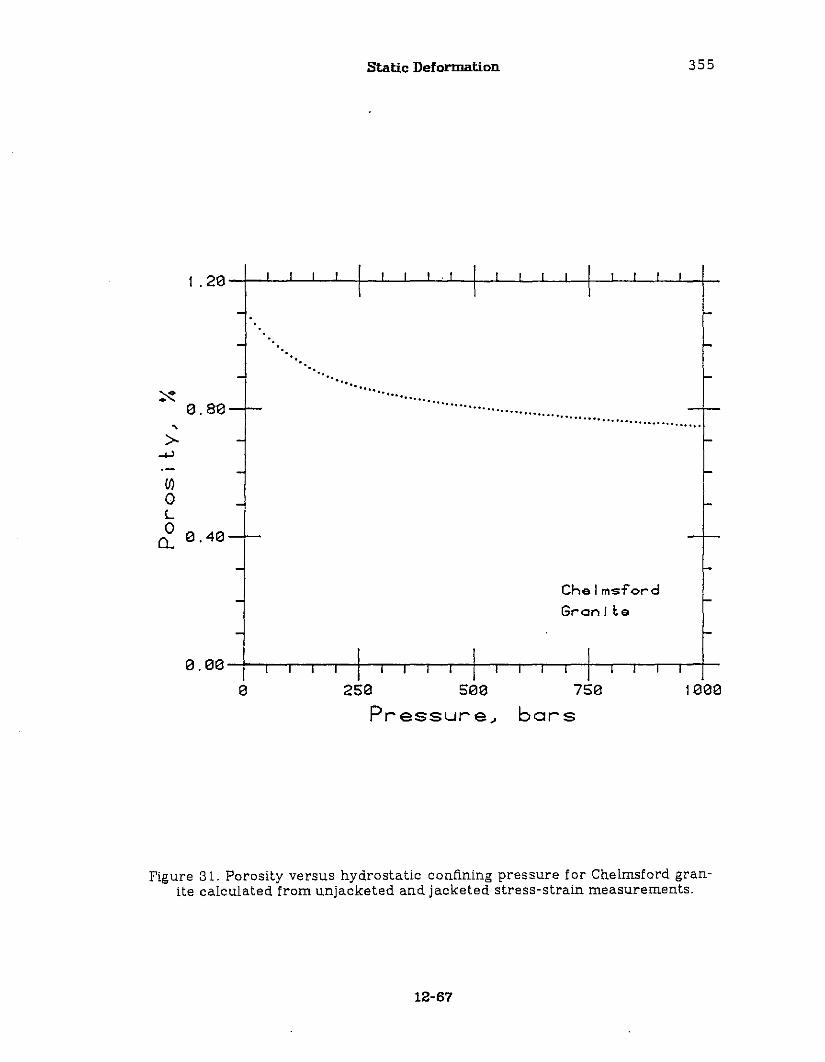
Static Deformation 355
'.
~ e,8e,
>-......,
(f)
0L0 e,4eQ.
'.'. '. '.
"0 ° 0 ••O •••
' •• 00 •• 0 0 •• ,
o. 00.0 • ........ .. ................•• 0 ••••• 0 0 •• 0 •
0•
ChelmsfordGran I tG
e ,ee -+-r-r-r-r-+-r-r-r-r-+---r---r---r---r-+---r---r---r---r-+-
250 seePressure~
750bars
Figure 31. Porosity versus hydrostatic confining pressure for Chelmsford granite calculated from unjacketed and jacketed stress-strain measurements.
12-67
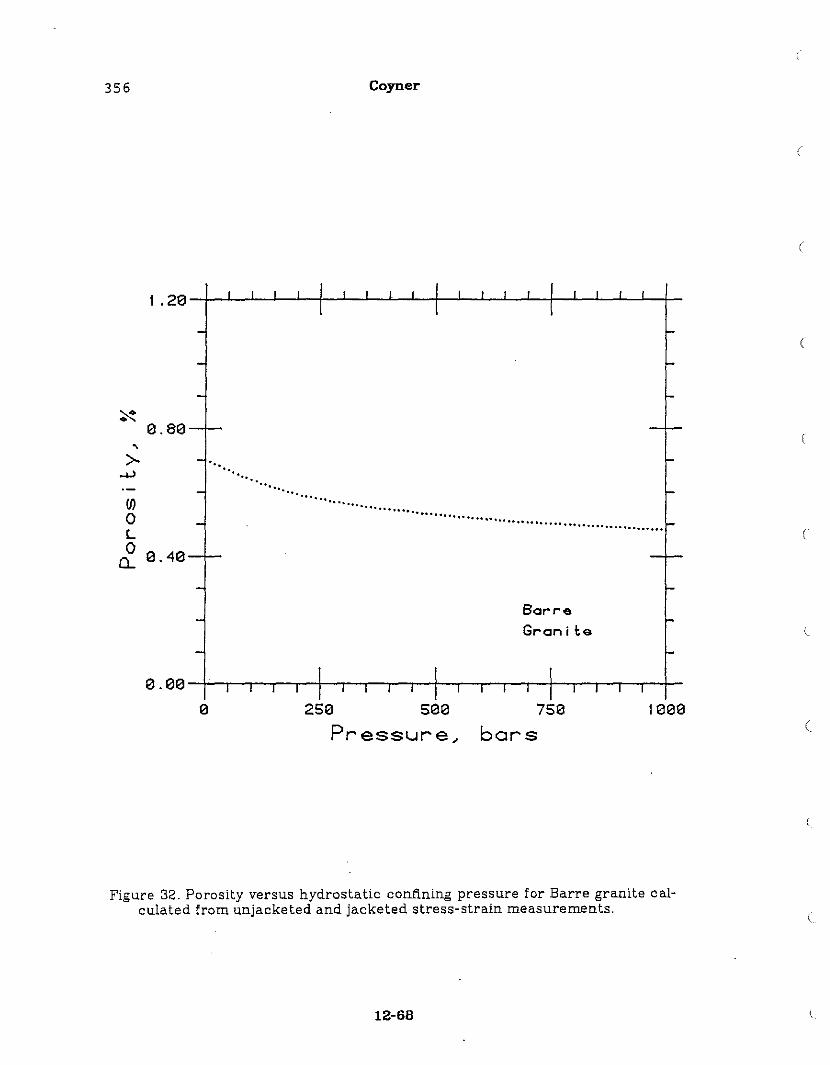
356 Coyner
(
(
(
(
~0.80,
>-4J
(J)0L0 0.40Q..
...'", '" ..... ... ...... ....... ....... ....... -' ... ............. '"
....... h· •• o • eo ' •••• 0 •••••••
80......G..an i te
(
(
(
250 500
Pressure,750
bars100e
(
Figure 32. Porosity versus hydrostatic confining pressure for Barre granite calculated from unjacketed and jacketed stress-strain measurements.
12-68