Embed Size (px)
Citation preview

International Research Journal of Engineering and Technology (IRJET) e-ISSN: 2395-0056
Volume: 05 Issue: 03 | Mar-2018 www.irjet.net p-ISSN: 2395-0072
© 2018, IRJET | Impact Factor value: 6.171 | ISO 9001:2008 Certified Journal | Page 1984
Static Analysis of Pulsar Bike Frame Made up of Aluminum alloy 6063
Ms. Priyanka Pandit Kore1, Prof. H. D. Lagdive2
1 Student, Mechanical Engineering Department, N B Navale Sinhgad College of Engineering, Solapur, Maharashtra, India
2 Assistant Professor, Mechanical Engineering Department, N B Navale Sinhgad College of Engineering, Solapur, Maharashtra, India.
-------------------------------------------------------------------***------------------------------------------------------------------ Abstract— In this work, different analysis techniques for automobile frame are studied under different loading conditions. The loading may be static or dynamic. Also studied analytical and experimental techniques available for automobile frame analysis. This overview helped to study how to reduce weight of automobile chassis. It contributes around 14% in the total weight of vehicle. It is thus significant to improve the design of the chassis to provide good balancing and improved fuel efficiency. The proposed work deals with the performance improvement of the existing chassis with certain design changes. In this, Chassis is manufactured by using material Aluminium alloy and Stress and Deformation analysis is done by using software and load vs deformation as well as load vs stress graph for both materials are studied in this work.
Keywords— Automobile frame, Static & dynamic Load conditions, Material
INTRODUCTION
A variety of weight reduction strategies are adopted by different automakers to minimize weight in automobiles. Using lightweight materials such as aluminum and carbon-fiber or optimizing existing vehicle designs are some of the key strategies adopted by manufacturers in the automotive industry.
This work deals with study of a two wheeler chassis which serves as a skeleton upon which parts like gearbox and engine are mounted. It contributes around 14% in the total vehicle weight. It is thus significant to improve the design of the chassis to provide good balancing and improved fuel efficiency. This work deals with the performance improvement of the existing chassis of a two wheeler with certain design changes (trying different materials).The parts are developed with Computer Aided Design software (CATIA) & analysis is done using Hypermesh & ANSYS software. Aluminum alloy 6063 is used to replace the existing Mild Steel material and study the results. Analysis is done under static loading conditions. The loads studied are tank load, engine load, rider load & pillion load. From this proposed study, it is expected that the chassis with alternate material is performing better with a satisfying amount of weight reduction and the weight reduction will hence lead to better fuel efficiency of the vehicle without disturbing strength of chassis.
PROBLEM STATEMENT
Mass or weight reduction is becoming an important issue in automotive industry. Weight reduction will give substantial impact to fuel economy, efforts to reduce emissions and therefore, helps to the save environment.
Chassis is a prominent structure for bike body, which takes the loads during serious accidents, costly recalls; chassis also has an impact on product image. Commonly used material for chassis is mild steel which is heavy in weight or more accurately in density. From the literature reviewed it has been observed that for weight reduction there are various alternate materials available for chassis which are lesser in weight and provides high strength. But these materials are used for heavy vehicles, all terrain vehicles. The same can be used for two wheeler chassis. And static characteristics can be studied for the vehicle. So, the overall weight of the vehicle can be reduced for better fuel efficiency.
OBJECTIVE
Weight reduction of vehicle while maintaining strength.
Prepare a CAD model from input parameters. Study of Static behavior of chassis using FEM
analysis. Validation of FEA results by using experimental
analysis.
SCOPE
It is necessary to study optimization methods for weight reduction of two wheelers. Use of advance techniques like Finite element analysis in Automobile field will be definitely very beneficial. In this work finite element analysis is used for study of mechanical properties of pulsar 180 bike chassis which will be manufactured by using one of the alternative material Al 6063 alloy. And deformation, strength of chassis can be studied by using ANSYS software.
METHODOLOGY
It is necessary to select a proper methodology for any research work. Experimental approach along with numerical approach gives verified results. In this proposed work the experimental analysis is done and results are verified using the advanced numerical method called as finite element analysis.[10] Literature survey is done initially to find the
International Research Journal of Engineering and Technology (IRJET) e-ISSN: 2395-0056
Volume: 05 Issue: 03 | Mar-2018 www.irjet.net p-ISSN: 2395-0072
© 2018, IRJET | Impact Factor value: 6.171 | ISO 9001:2008 Certified Journal | Page 1985
scope for work and objective is finalized. The problem is defined and methodology is selected. The prototype of a pulsar 180 bike chassis is tested for varying load and deformation is calculated. A 3D model of pulsar 180 bike chassis under test is simulated using finite element method and deflection is calculated. The results are verified. Strength and deflection of chassis with existing material and selected Al 6063 material are compared in this dissertation work.
Flow chart below describes the methodology used for in this dissertation:
Fig. 1 Flowchart showing methodology used for this work
EXPERIMENTATION
In experimental validation after fabrication of model next step is validation of FEA analysis results by using experimentation method. The experimental investigation of fabricated prototype is performed on universal testing machine at S. M. Engineers, Pune. Compression test has been performed on the manufactured prototype of aluminium alloy 6063 bike chassis. By using special type of jig chassis is mounted on universal testing machine. Capacity of this universal testing machine is 5 Kgf to 5 Tons. The input conditions are recreated in the lab while the component is being tested. The loading and the boundary conditions are matching the practical working conditions in which the
vehicle is expected to perform. An equivalent maximum load of 1400 N is applied on the prototype for testing purpose.
EXPERIMENTATION FOR DEFORMATION OF THE CHASSIS
The deformation of the chassis was tested on universal testing machine. The chassis was made up of Al 6063, which was used for the test. The chassis placed in the universal testing machine. Following is the methodology for the experimentation and analysis if results
a. Maximum load applied on chassis was calculated before testing.
b. The prototype is placed in the machine between the grips. The machine itself records the displacement between its cross heads on which the specimen is held.
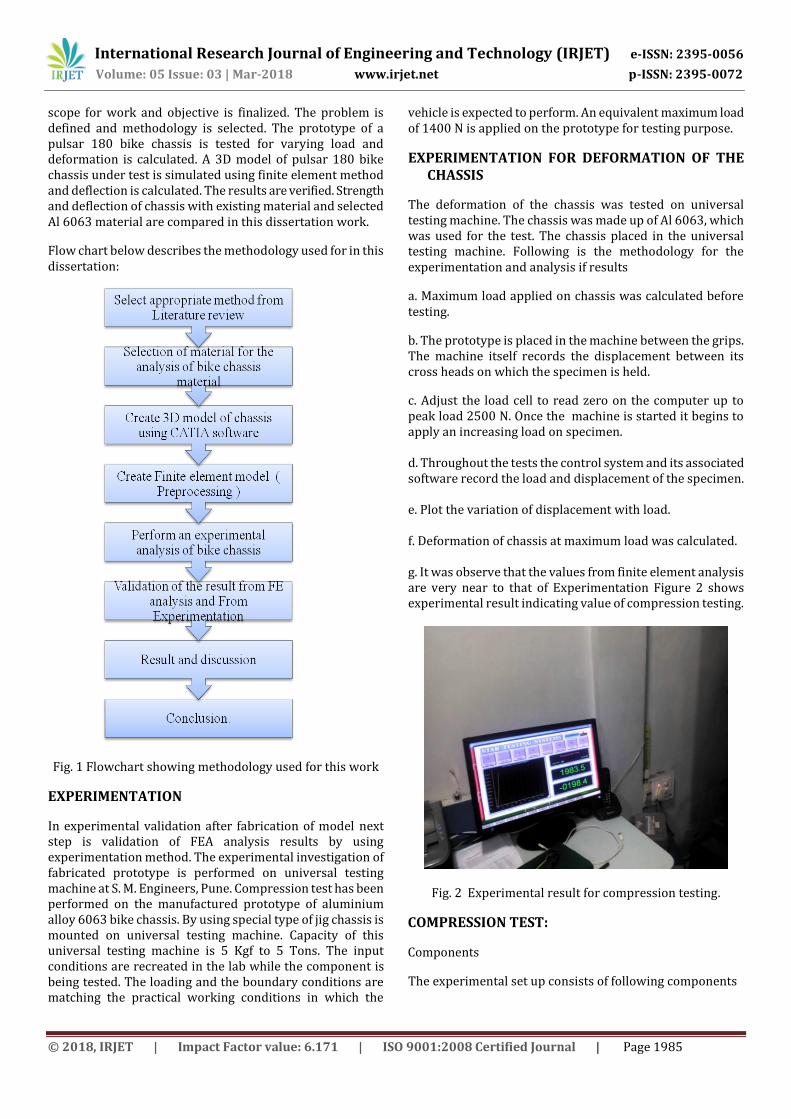
c. Adjust the load cell to read zero on the computer up to peak load 2500 N. Once the machine is started it begins to apply an increasing load on specimen. d. Throughout the tests the control system and its associated software record the load and displacement of the specimen. e. Plot the variation of displacement with load. f. Deformation of chassis at maximum load was calculated. g. It was observe that the values from finite element analysis are very near to that of Experimentation Figure 2 shows experimental result indicating value of compression testing.
Fig. 2 Experimental result for compression testing.
COMPRESSION TEST:
Components
The experimental set up consists of following components
International Research Journal of Engineering and Technology (IRJET) e-ISSN: 2395-0056
Volume: 05 Issue: 03 | Mar-2018 www.irjet.net p-ISSN: 2395-0072
© 2018, IRJET | Impact Factor value: 6.171 | ISO 9001:2008 Certified Journal | Page 1986
Test component – Prototype of bike chassis prepared from aluminium alloy 6063.
Load frame - Usually consisting of two strong supports for the machine.
Load cell - A force transducer or other means of measuring the load.
Means of measuring extension or deformation - Many tests require a measure of the response of the test specimen to the movement of the cross head. Extensometers are sometimes used.
Output device - A means of providing the test result is needed. Some older machines have dial or digital displays and 12
Many newer machines have a computer interface for analysis and printing.
Conditioning - Many tests require controlled conditioning (temperature, humidity, pressure, etc.). The machine can be in a controlled room or a special environmental chamber can be placed around the test specimen for the test.
Test fixtures, specimen holding jaws, and related sample making equipment.
IMPACT TESTING OF MATERIAL
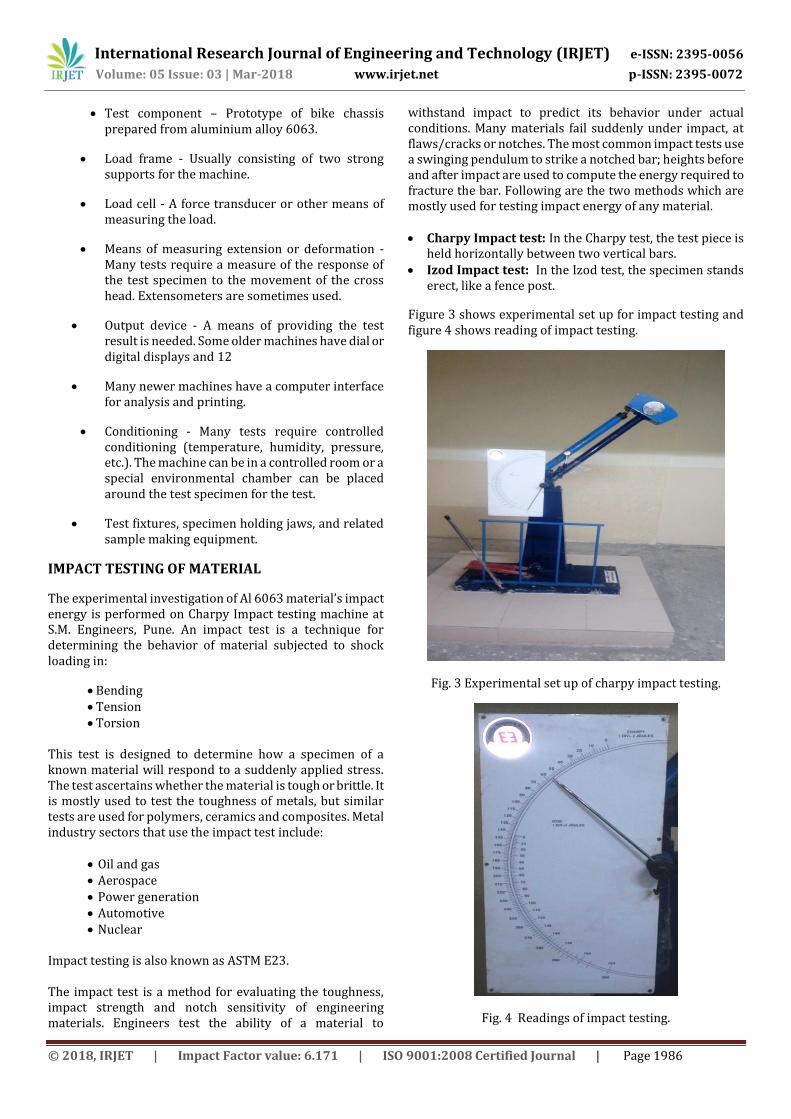
The experimental investigation of Al 6063 material’s impact energy is performed on Charpy Impact testing machine at S.M. Engineers, Pune. An impact test is a technique for determining the behavior of material subjected to shock loading in:
Bending Tension Torsion
This test is designed to determine how a specimen of a known material will respond to a suddenly applied stress. The test ascertains whether the material is tough or brittle. It is mostly used to test the toughness of metals, but similar tests are used for polymers, ceramics and composites. Metal industry sectors that use the impact test include:
Oil and gas Aerospace Power generation Automotive Nuclear
Impact testing is also known as ASTM E23. The impact test is a method for evaluating the toughness, impact strength and notch sensitivity of engineering materials. Engineers test the ability of a material to
withstand impact to predict its behavior under actual conditions. Many materials fail suddenly under impact, at flaws/cracks or notches. The most common impact tests use a swinging pendulum to strike a notched bar; heights before and after impact are used to compute the energy required to fracture the bar. Following are the two methods which are mostly used for testing impact energy of any material. Charpy Impact test: In the Charpy test, the test piece is
held horizontally between two vertical bars. Izod Impact test: In the Izod test, the specimen stands
erect, like a fence post.
Figure 3 shows experimental set up for impact testing and figure 4 shows reading of impact testing.
Fig. 3 Experimental set up of charpy impact testing.
Fig. 4 Readings of impact testing.

International Research Journal of Engineering and Technology (IRJET) e-ISSN: 2395-0056
Volume: 05 Issue: 03 | Mar-2018 www.irjet.net p-ISSN: 2395-0072
© 2018, IRJET | Impact Factor value: 6.171 | ISO 9001:2008 Certified Journal | Page 1987
OBSERVATIONS
Table 1 Observation of Impact testing of Al 6063 material.
Sr. No. Test Specimen
Energy absorbed during impact testing( joules)
1 Sample 1 46
2 Sample 2 48
3 Sample 3 50
4 Sample 4 50
5 Sample 5 52
The results obtained from charpy impact testing of Al 6063 material are shown in table 1. from this table it is observed that impact energy absorbed by material is ranging from 42 joules – 52 joules.
RESULT AND DISCUSSION
% WEIGHT REDUCTION
Weight of pulsar bike chassis made of steel material is 13 kg and whether if same chassis is manufactured by using Al 6063, then there is weight reduction up to 34%. i.e. weight of Al 6063 material chassis is 8kg. Table 2. shows weight comparison of chassis made up of both the materials.
Table 2. Weight comparison of chassis made up of M.S. And Al 6063
Material of chassis Weight(Kg) % difference
Chassis of Mild steel
(IS :3074/2013) 13
34%
Chassis of Aluminium 8
COMPARISON BETWEEN M.S. AND AL 6063 FROM FEA RESULT
From the paper “Comparative Finite Element Analysis of Different Materials for Bike Chasis to Reduce Weight”[10]
Table 3. it is observed that chassis with current material i.e. M.S. shows 49.06 MPa stress where as chassis with Al 6063 material shows 41.88 MPa stress. Along with this percentage elongation of M.S. and Al 6063 are 0.3949 and 0.4574 respectively. From this, Percentage error between both the materials for elongation as well as stress is below 20%, which is allowable. So, from this table it is observed that by changing the material of chassis with Al 6063 will not disturb strength of chassis.
Table 3. Result comparison of Steel and Al 6063 material from FEA analysis
Material %Elongation Stress
M.S. 0.3949 49.06
Al 6063 0.4574 41.88
RESULT AND DISCUSSION OF FEA ANALYSIS FOR AL 6063 MATERIAL
Table 4. shows results obtained by FEA analysis for Al 6063 material. From this result, values of deformation of chassis for applied load and magnitude of stress generated for the same load are obtained.
Table 4. FEA Analysis Result Table for Deformation and Stress.
Sr. No. Load (N) Deformation (mm) FEA
Stress (N/mm2)
1 103 0 0
2 230 0.02 2
3 350 0.04 3.5
4 465 0.06 5.3
5 500 0.08093 7.4
6 570 0.095 8.9
7 675 0.11 10
8 780 0.12 11.2
9 865 0.14 12.5
10 900 0.1524 13.98
11 960 0.17 15.2
12 1050 0.18 16.5
13 1150 0.2 18
14 1250 0.21 19.3
15 1350 0.23 21
16 1400 0.2431 22.3
17 1420 0.28 25.35
18 1500 0.31 28.45
19 1800 0.3430 31.4
20 2000 0.3812 34.9
21 2200 0.4574 41.8
From this above observation table graph of load Vs deformation and Load Vs stress are obtained. These graphs are discussed below.
0
0.1
0.2
0.3
0.4
0.5
35
0
57
0
86
5
10
50
13
50
15
00
22
00Defo
rm
ati
on
(m
m)
Load (N)
Load Vs Deformation
Deformation
Fig.5 Load Vs deformation graph for Al 6063 from of FEA
result.

International Research Journal of Engineering and Technology (IRJET) e-ISSN: 2395-0056
Volume: 05 Issue: 03 | Mar-2018 www.irjet.net p-ISSN: 2395-0072
© 2018, IRJET | Impact Factor value: 6.171 | ISO 9001:2008 Certified Journal | Page 1988
Figure 5 shows load Vs deformation graph obtained by FEA analysis for Al 6063 material. From this graph it is observed that maximum load applied on chassis is 2200 N. Rider load + pillion load + Fuel tank load is applied on upper part of chassis and remaining load of engine is applied on lower bent tubes of chassis. From this graph it is observed that as load increases deformation also increases. For this applied load maximum deformation of chassis is 0.4574 mm. From this figure it is also observed that graph is curvature in nature instead of straight line. This nature totally depends on type of elements and assigned properties of material. Finer the size of element more accurate is the result. But if very fine element is selected then machine will take more time to solve the problem. This is applicable for all FEA results.
Figure 6 is load Vs stress curve which is obtained by results of FEA analysis. From this curve it is observed that it follows linear behavior because material is ductile and load applied is within elastic limit. Maximum load applied on chassis is 2200 N and its corresponding von misses stress generated in chassis is 41.881 N/mm2.
01020304050
Str
ess (N
/mm
2)
Load (N)
Load Vs Stress
stress
Fig. 6 Load Vs stress graph of FEA result.
RESULT AND DISCUSSION OF EXPERIMENTAL ANALYSIS FOR AL 6063 MATERIAL
Displacement is measured for the prototype from the universal testing machine results. Gradually load is increased on machine and numbers of readings are observed from machine. Table 5 shows observed results of deformation testing. And a load Vs deformation graph is obtained from these readings.
Table 5 Observations of experimental analysis .
Sr. No. Load (N) Deformation
(mm)
Stress
(N/mm2)
1 103 0.01 2.623535
2 230 0.025 5.85838
3 350 0.05 8.914926
4 465 0.075 11.84412
5 570 0.1 14.51859
6 675 0.125 17.19307
7 780 0.15 19.86755
8 865 0.175 22.0326
9 960 0.2 24.45237
10 1050 0.225 26.74478
11 1150 0.25 29.2919
12 1250 0.275 31.83902
13 1350 0.3 34.38614
14 1420 0.325 37.36913
15 1500 0.35 40.244524
16 1800 0.37 45.848192
17 2000 0.4 50.942435
18 2200 0.43 56.036679
Figure 7 shows graph of load Vs deformation obtained by above observation table. From the graph it is observed that curve shows linear behavior. For maximum applied load of 2200 N on the chassis it shows maximum deformation of 0.43 mm. It is observed that as load increases deformation also increases.
0
0.1
0.2
0.3
0.4
0.51
03
46
5
78
0
10
50
13
50
18
00Defo
rm
ati
on
(m
m)
Load (N)
Load Vs Deformation
Deformation
Fig. 7 Load Vs deformation graph from experimental method for Al 6063.
Figure 8 shows graph of load Vs stress which is obtained from experimental results. This graph also follows straight line because of ductile material.
0
20
40
60
10
3
35
0
57
0
78
0
96
0
11
50
13
50
15
00
20
00
Str
ess (N
/mm
2)
Load (N)
Load Vs Stress
Stress
Fig. 8 Load Vs Stress graph from experimental method for Al 6063.
International Research Journal of Engineering and Technology (IRJET) e-ISSN: 2395-0056
Volume: 05 Issue: 03 | Mar-2018 www.irjet.net p-ISSN: 2395-0072
© 2018, IRJET | Impact Factor value: 6.171 | ISO 9001:2008 Certified Journal | Page 1989
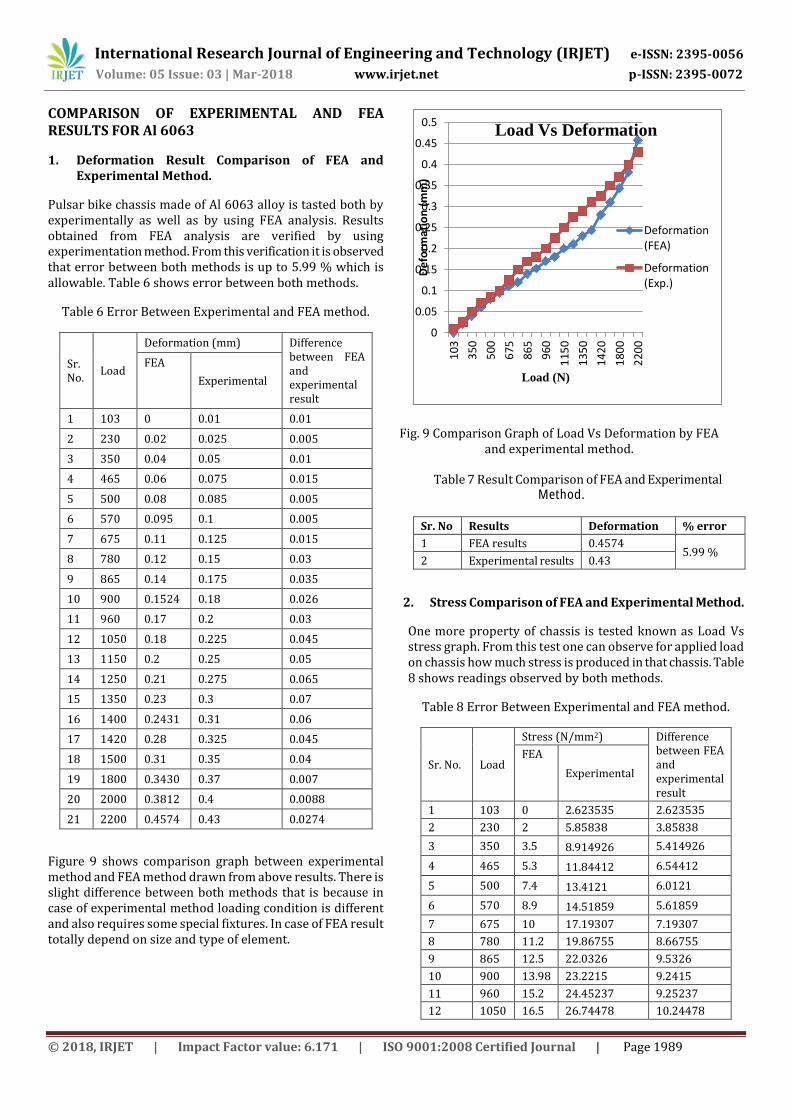
COMPARISON OF EXPERIMENTAL AND FEA RESULTS FOR Al 6063
1. Deformation Result Comparison of FEA and Experimental Method.
Pulsar bike chassis made of Al 6063 alloy is tasted both by experimentally as well as by using FEA analysis. Results obtained from FEA analysis are verified by using experimentation method. From this verification it is observed that error between both methods is up to 5.99 % which is allowable. Table 6 shows error between both methods.
Table 6 Error Between Experimental and FEA method.
Sr. No.
Load
Deformation (mm) Difference between FEA and experimental result
FEA
Experimental
1 103 0 0.01 0.01
2 230 0.02 0.025 0.005
3 350 0.04 0.05 0.01
4 465 0.06 0.075 0.015
5 500 0.08 0.085 0.005
6 570 0.095 0.1 0.005
7 675 0.11 0.125 0.015
8 780 0.12 0.15 0.03
9 865 0.14 0.175 0.035
10 900 0.1524 0.18 0.026
11 960 0.17 0.2 0.03
12 1050 0.18 0.225 0.045
13 1150 0.2 0.25 0.05
14 1250 0.21 0.275 0.065
15 1350 0.23 0.3 0.07
16 1400 0.2431 0.31 0.06
17 1420 0.28 0.325 0.045
18 1500 0.31 0.35 0.04
19 1800 0.3430 0.37 0.007
20 2000 0.3812 0.4 0.0088
21 2200 0.4574 0.43 0.0274
Figure 9 shows comparison graph between experimental method and FEA method drawn from above results. There is slight difference between both methods that is because in case of experimental method loading condition is different and also requires some special fixtures. In case of FEA result totally depend on size and type of element.
0
0.05
0.1
0.15
0.2
0.25
0.3
0.35
0.4
0.45
0.5
103
350
500
675
865
960
115
0
135
0
142
0
180
0
220
0
De
form
atio
n (
mm
)
Load (N)
Load Vs Deformation
Deformation(FEA)
Deformation(Exp.)
and experimental method.
Sr. No Results Deformation % error
1 FEA results 0.4574 5.99 %
2 Experimental results 0.43
2. Stress Comparison of FEA and Experimental Method.
One more property of chassis is tested known as Load Vs stress graph. From this test one can observe for applied load on chassis how much stress is produced in that chassis. Table 8 shows readings observed by both methods.
Table 8 Error Between Experimental and FEA method.
Sr. No. Load
Stress (N/mm2) Difference between FEA and experimental result
FEA
Experimental
1 103 0 2.623535 2.623535
2 230 2 5.85838 3.85838
3 350 3.5 8.914926 5.414926
4 465 5.3 11.84412 6.54412
5 500 7.4 13.4121 6.0121
6 570 8.9 14.51859 5.61859
7 675 10 17.19307 7.19307
8 780 11.2 19.86755 8.66755
9 865 12.5 22.0326 9.5326
10 900 13.98 23.2215 9.2415
11 960 15.2 24.45237 9.25237
12 1050 16.5 26.74478 10.24478
Fig. 9 Comparison Graph of Load Vs Deformation by FEA
Table 7 Result Comparison of FEA and Experimental Method.
International Research Journal of Engineering and Technology (IRJET) e-ISSN: 2395-0056
Volume: 05 Issue: 03 | Mar-2018 www.irjet.net p-ISSN: 2395-0072
© 2018, IRJET | Impact Factor value: 6.171 | ISO 9001:2008 Certified Journal | Page 1990
13 1150 18 29.2919 11.2919
14 1250 19.3 31.83902 12.53902
15 1350 21 34.38614 13.38614
16 1400 22.3 35.65412 13.35412
17 1420 25.35 37.36913 12.01913
18 1500 28.45 40.244524 11.79452
19 1800 31.4 45.848192 14.44819
20 2000 34.9 50.942435 16.04244
21 2200 41.8 56.036679 14.23668
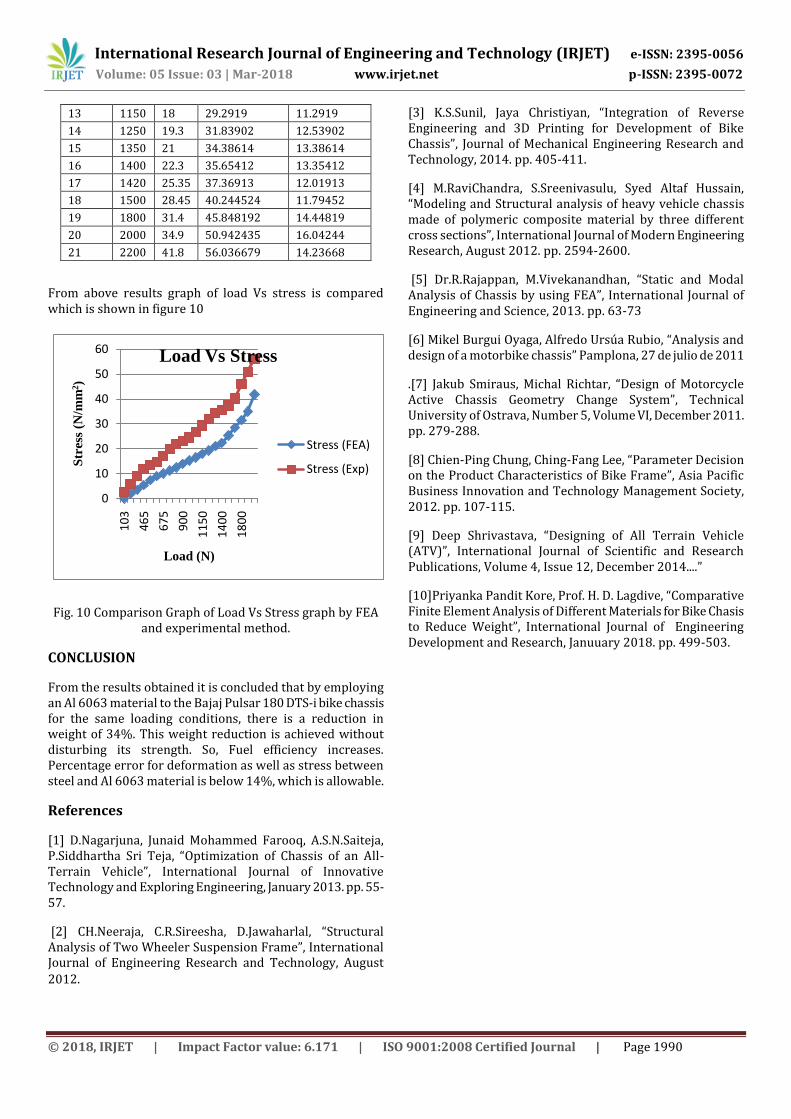
From above results graph of load Vs stress is compared which is shown in figure 10
0
10
20
30
40
50
60
10
3
46
5
67
5
90
0
11
50
14
00
18
00
Str
ess
(N
/mm
2)
Load (N)
Load Vs Stress
Stress (FEA)
Stress (Exp)
Fig. 10 Comparison Graph of Load Vs Stress graph by FEA and experimental method.
CONCLUSION
From the results obtained it is concluded that by employing an Al 6063 material to the Bajaj Pulsar 180 DTS-i bike chassis for the same loading conditions, there is a reduction in weight of 34%. This weight reduction is achieved without disturbing its strength. So, Fuel efficiency increases. Percentage error for deformation as well as stress between steel and Al 6063 material is below 14%, which is allowable.
References
[1] D.Nagarjuna, Junaid Mohammed Farooq, A.S.N.Saiteja, P.Siddhartha Sri Teja, “Optimization of Chassis of an All-Terrain Vehicle”, International Journal of Innovative Technology and Exploring Engineering, January 2013. pp. 55-57.
[2] CH.Neeraja, C.R.Sireesha, D.Jawaharlal, “Structural Analysis of Two Wheeler Suspension Frame”, International Journal of Engineering Research and Technology, August
2012.
[3] K.S.Sunil, Jaya Christiyan, “Integration of Reverse Engineering and 3D Printing for Development of Bike Chassis”, Journal of Mechanical Engineering Research and Technology, 2014. pp. 405-411.
[4] M.RaviChandra, S.Sreenivasulu, Syed Altaf Hussain, “Modeling and Structural analysis of heavy vehicle chassis made of polymeric composite material by three different cross sections”, International Journal of Modern Engineering Research, August 2012. pp. 2594-2600.
[5] Dr.R.Rajappan, M.Vivekanandhan, “Static and Modal Analysis of Chassis by using FEA”, International Journal of Engineering and Science, 2013. pp. 63-73
[6] Mikel Burgui Oyaga, Alfredo Ursúa Rubio, “Analysis and design of a motorbike chassis” Pamplona, 27 de julio de 2011
.[7] Jakub Smiraus, Michal Richtar, “Design of Motorcycle Active Chassis Geometry Change System”, Technical University of Ostrava, Number 5, Volume VI, December 2011. pp. 279-288.
[8] Chien-Ping Chung, Ching-Fang Lee, “Parameter Decision on the Product Characteristics of Bike Frame”, Asia Pacific Business Innovation and Technology Management Society, 2012. pp. 107-115.
[9] Deep Shrivastava, “Designing of All Terrain Vehicle (ATV)”, International Journal of Scientific and Research Publications, Volume 4, Issue 12, December 2014....”
[10]Priyanka Pandit Kore, Prof. H. D. Lagdive, “Comparative Finite Element Analysis of Different Materials for Bike Chasis to Reduce Weight”, International Journal of Engineering Development and Research, Januuary 2018. pp. 499-503.