Embed Size (px)
Citation preview
Dickson and Gross, Oecologia
Electronic supplemental material (ESM)
Additional figures showing effects of fertilization, time, and burning on soil nitrogen levels, plant species richness, Simpson Dominance, species abundances, and colonization.
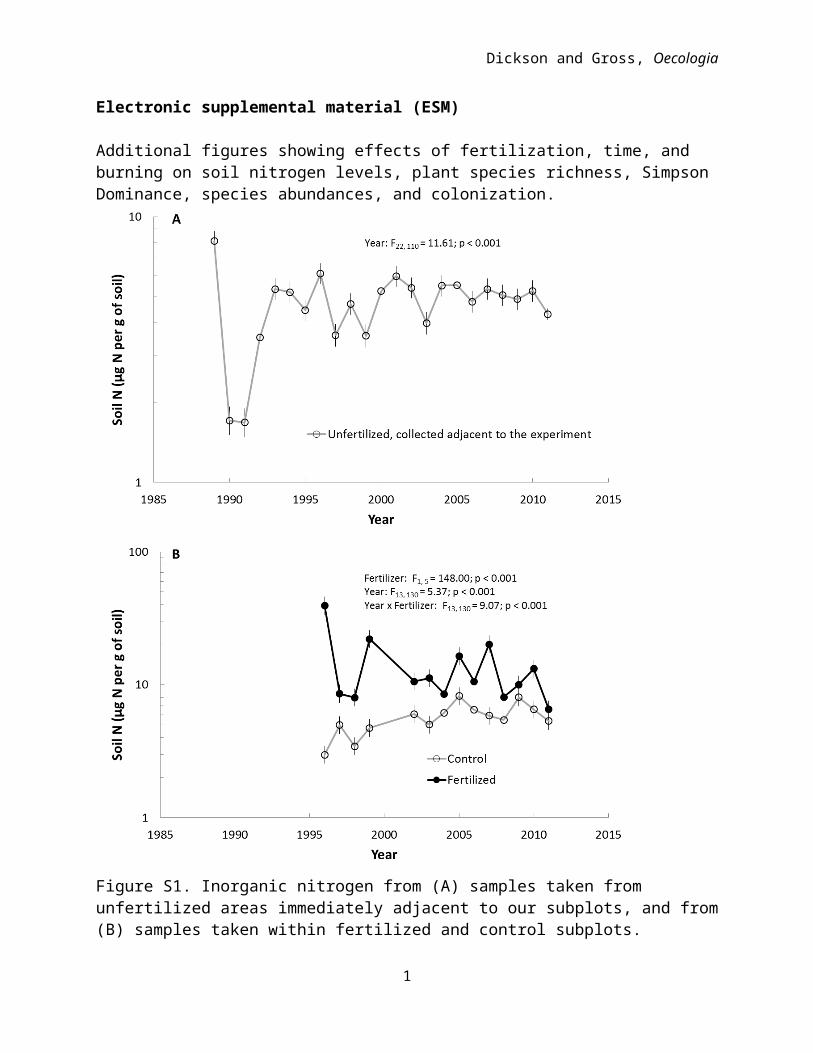
Figure S1. Inorganic nitrogen from (A) samples taken from unfertilized areas immediately adjacent to our subplots, and from (B) samples taken within fertilized and control subplots. Inorganic nitrogen (N) measurements were collected via 24 hours soil extractions with 1M KCl solution (yearly means are averages of samples collected in April and September).
1
Dickson and Gross, Oecologia
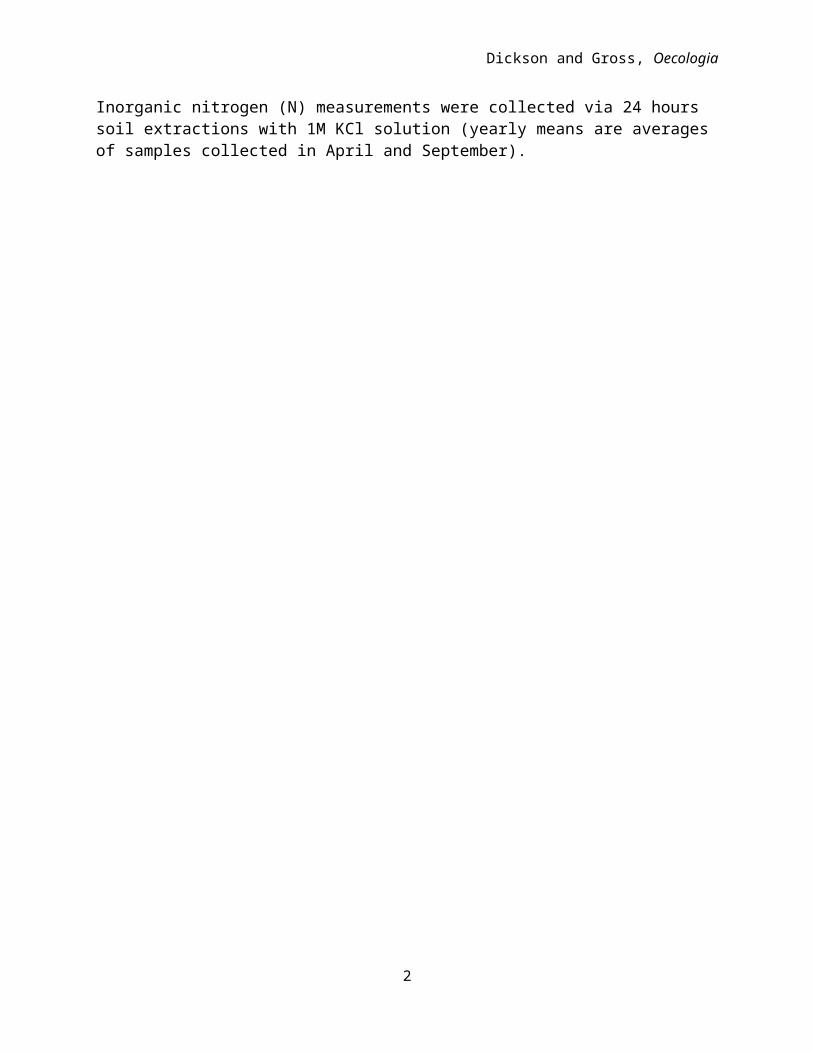
Figure S2. Species richness in fertilized and control subplots in experimental old-fields in response to fire at the KBS LTER. Fire was introduced in 1997 to manage woody tree invasion in all plots. Burning was not done every year, and there were no experimental unburned plots. The statistics on the effects of burning and burning x fertilizer are contrasts. Values are means +1 SE; N=6.
2
Dickson and Gross, Oecologia
3
Dickson and Gross, Oecologia
4
Dickson and Gross, Oecologia
5
Dickson and Gross, Oecologia
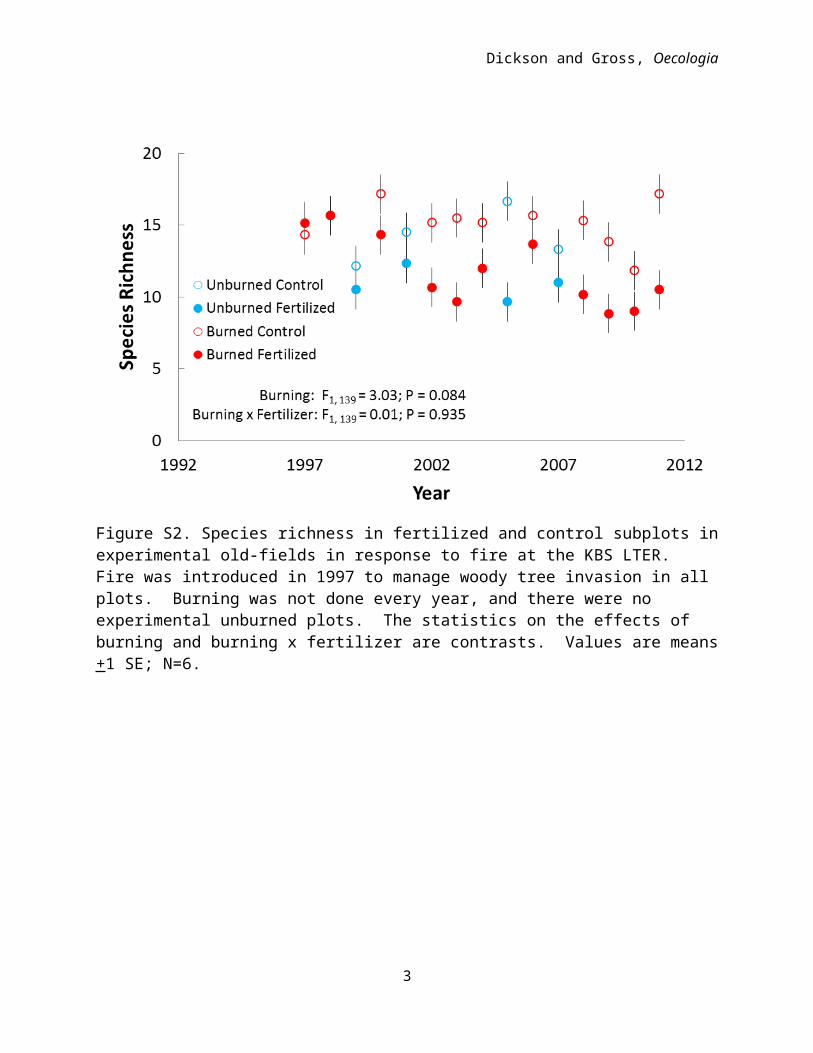
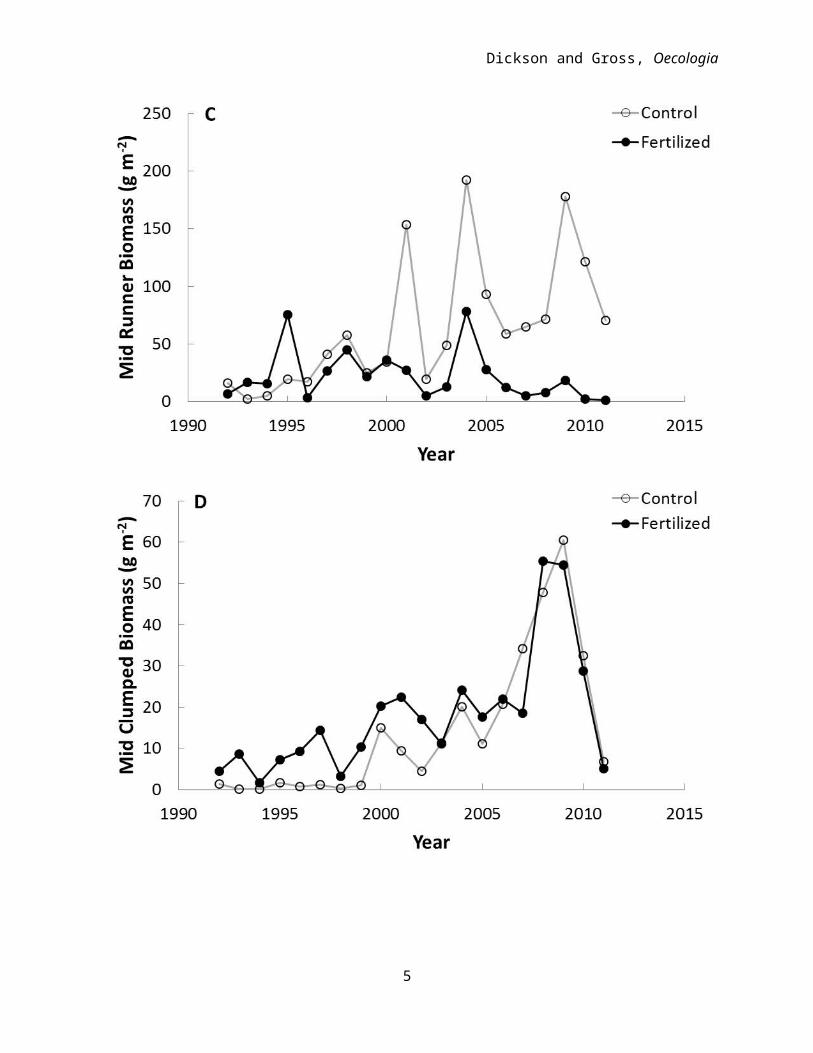
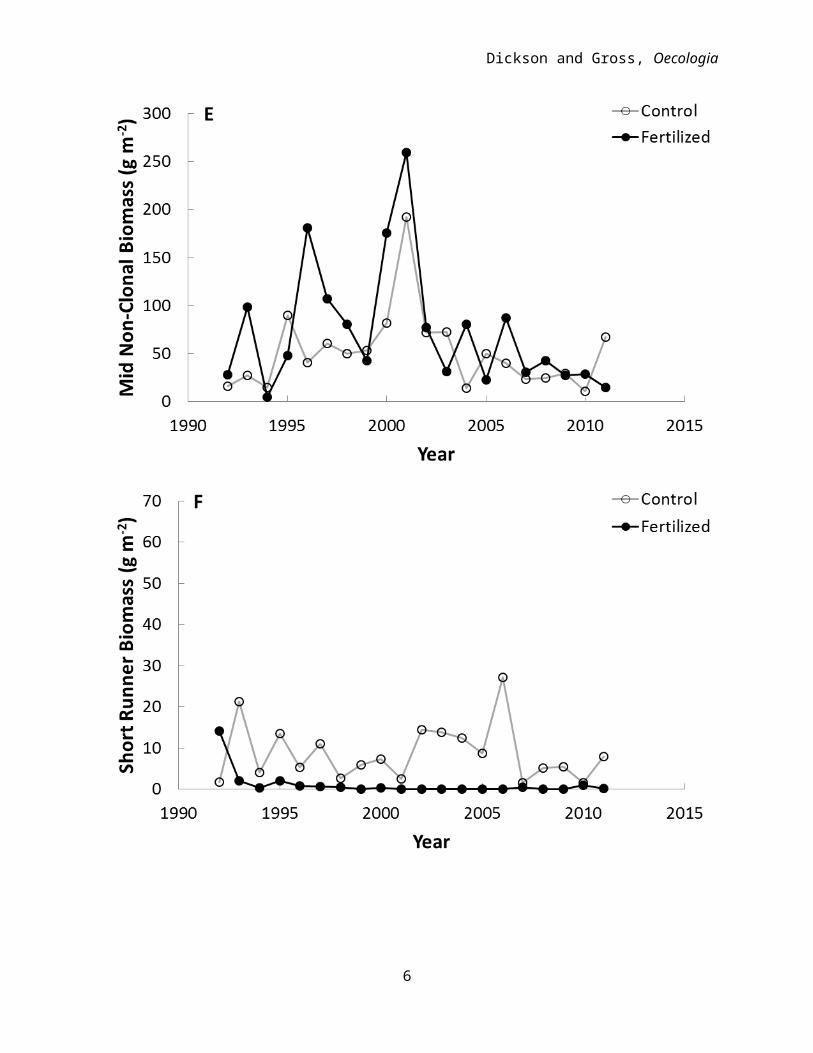
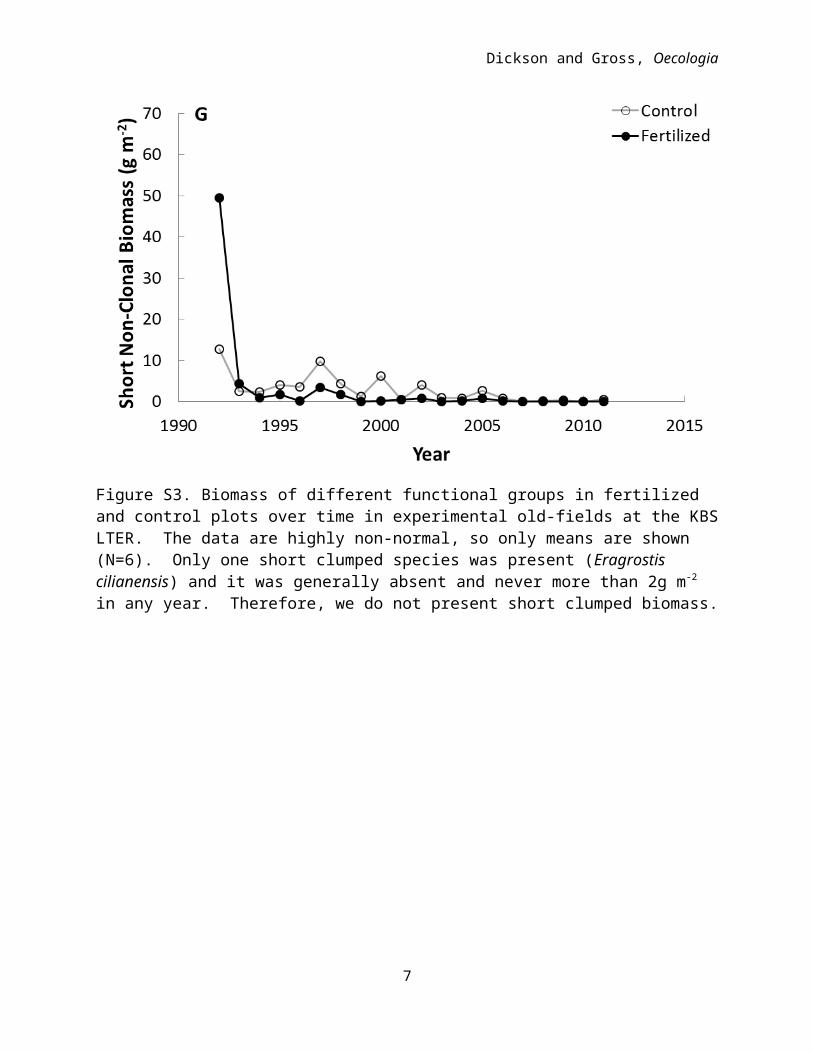
Figure S3. Biomass of different functional groups in fertilized and control plots over time in experimental old-fields at the KBS LTER. The data are highly non-normal, so only means are shown (N=6). Only one short clumped species was present (Eragrostis cilianensis) and it was generally absent and never more than 2g m-2 in any year. Therefore, we do not present short clumped biomass.
6
Dickson and Gross, Oecologia
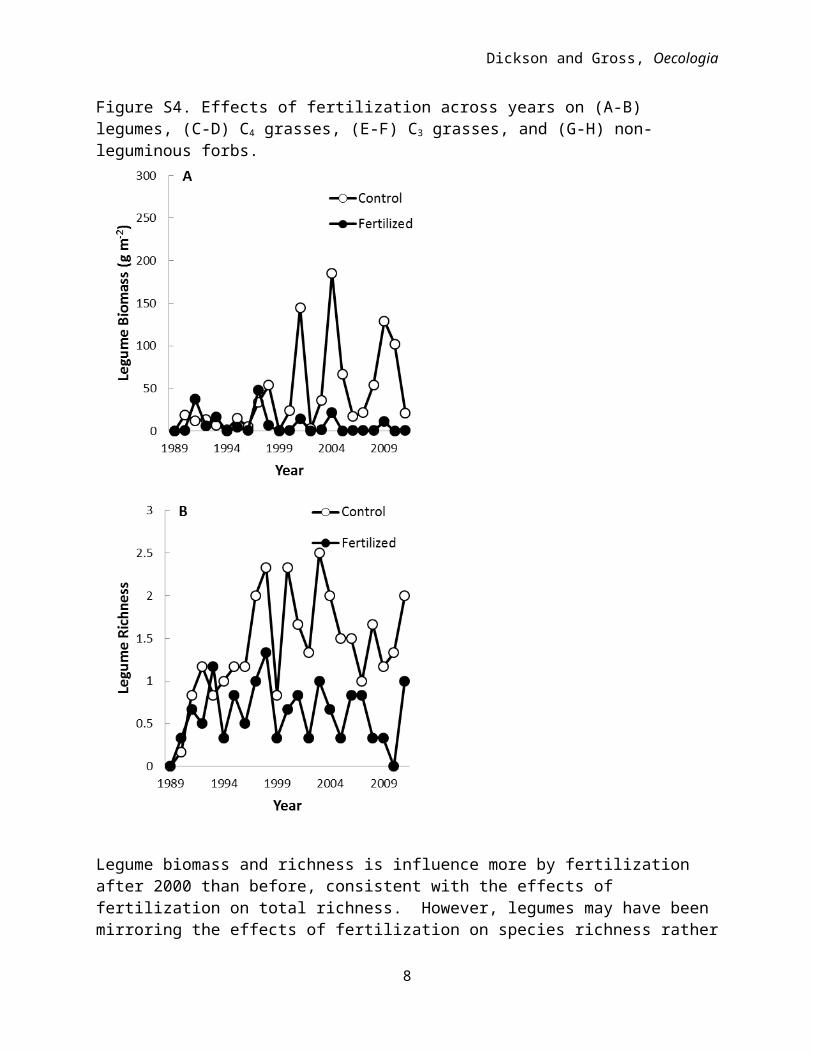
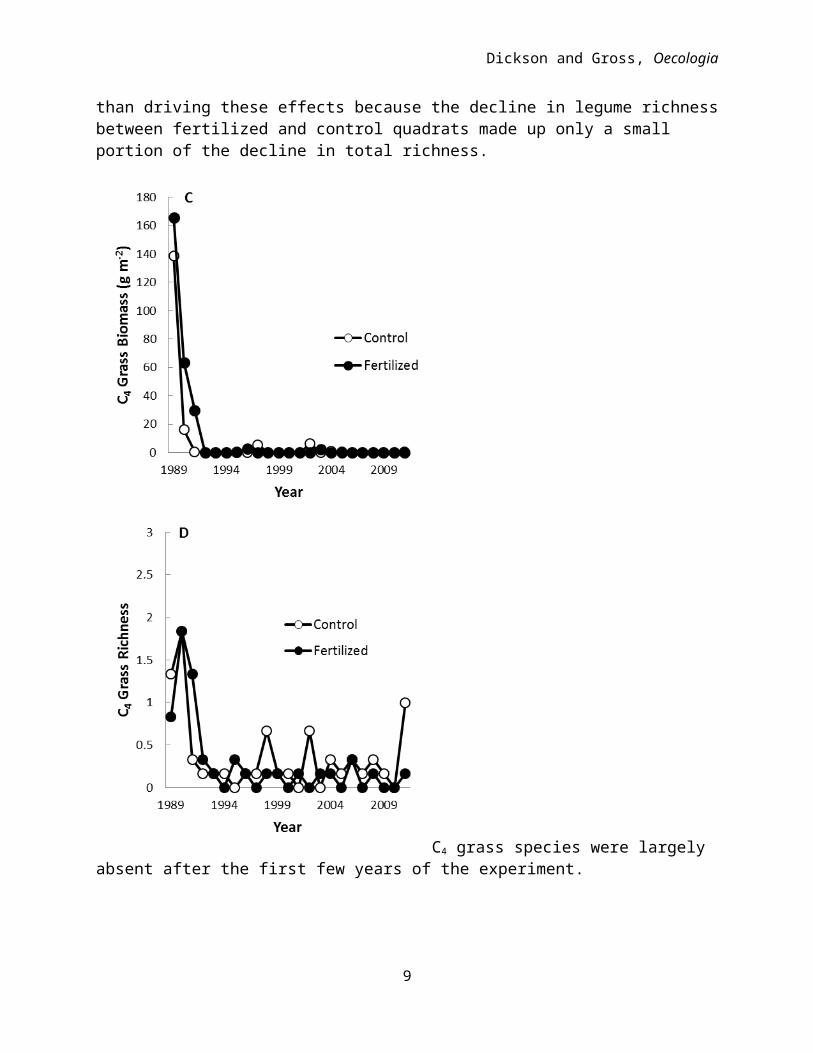
Figure S4. Effects of fertilization across years on (A-B) legumes, (C-D) C4 grasses, (E-F) C3 grasses, and (G-H) non-leguminous forbs.
Legume biomass and richness is influence more by fertilization after 2000 than before, consistent with the effects of fertilization on total richness. However, legumes may have been mirroring the effects of fertilization on species richness rather than driving these effects because the decline in legume richness between fertilized and control quadrats made up only a small portion of the decline in total richness.
7
Dickson and Gross, Oecologia
C4 grass species were largely absent after the first few years of the experiment.
8
Dickson and Gross, Oecologia
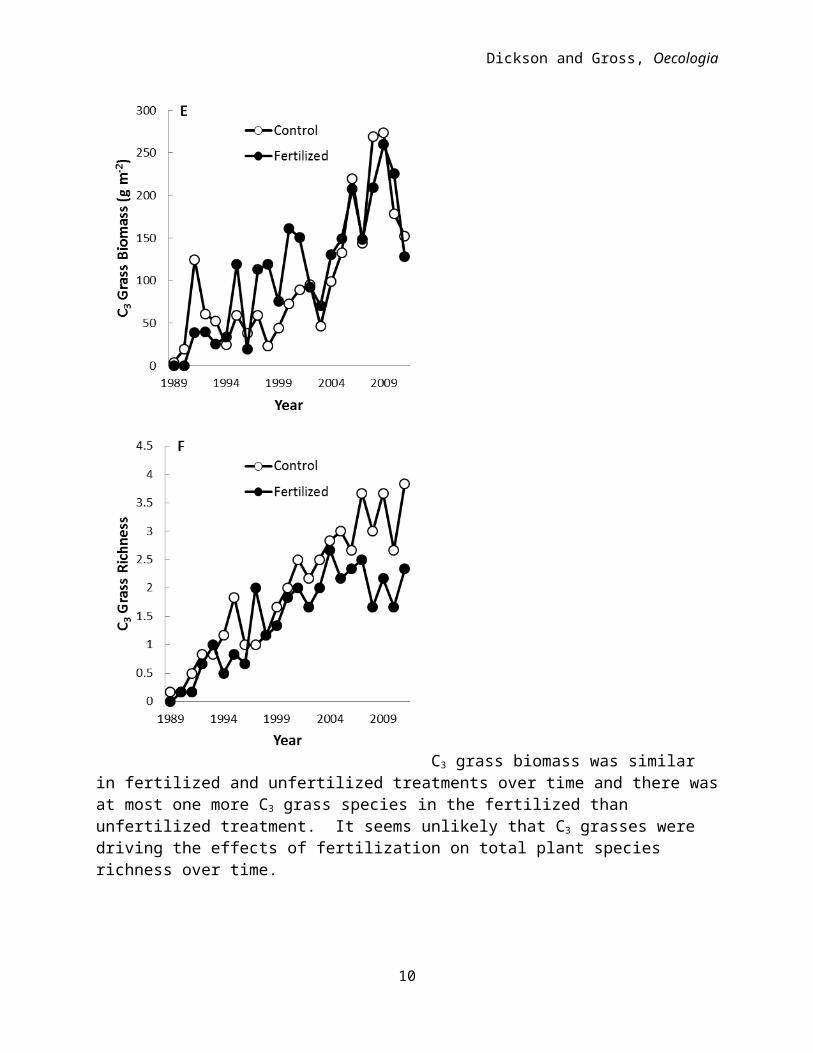
C3 grass biomass was similar in fertilized and unfertilized treatments over time and there was at most one more C3 grass species in the fertilized than unfertilized treatment. It seems unlikely that C3 grasses were driving the effects of fertilization on total plant species richness over time.
9
Dickson and Gross, Oecologia
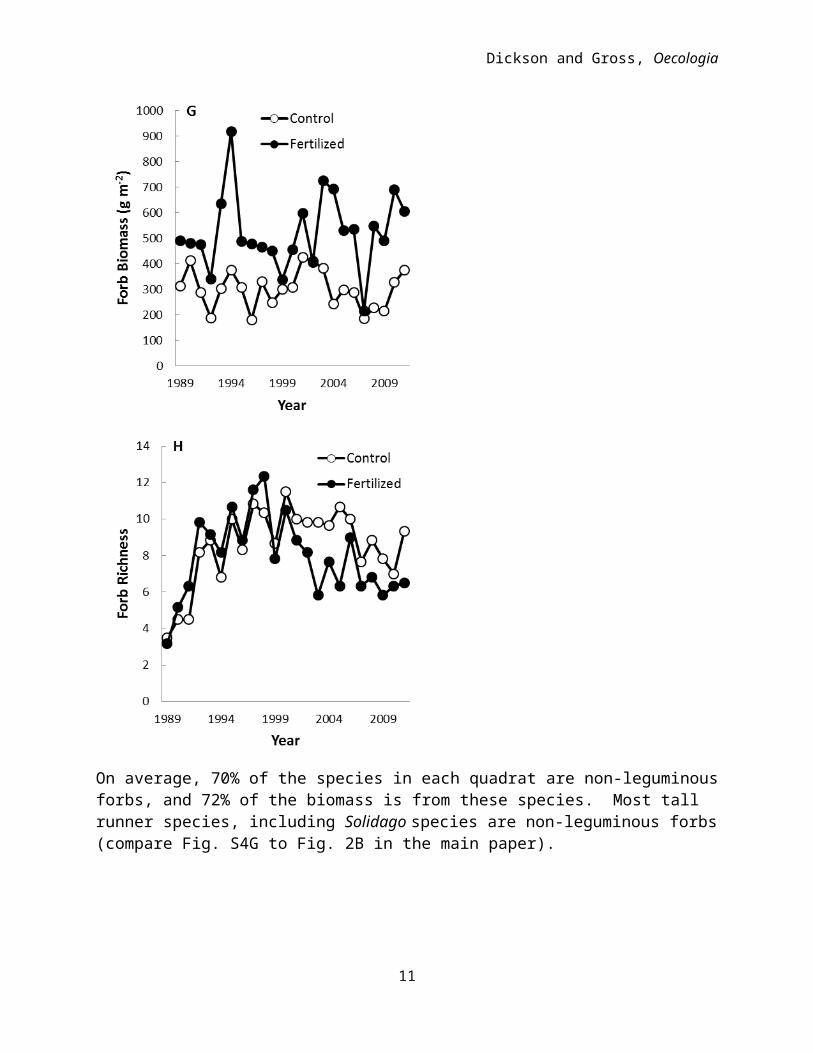
On average, 70% of the species in each quadrat are non-leguminous forbs, and 72% of the biomass is from these species. Most tall runner species, including Solidago species are non-leguminous forbs (compare Fig. S4G to Fig. 2B in the main paper).
10
Dickson and Gross, Oecologia
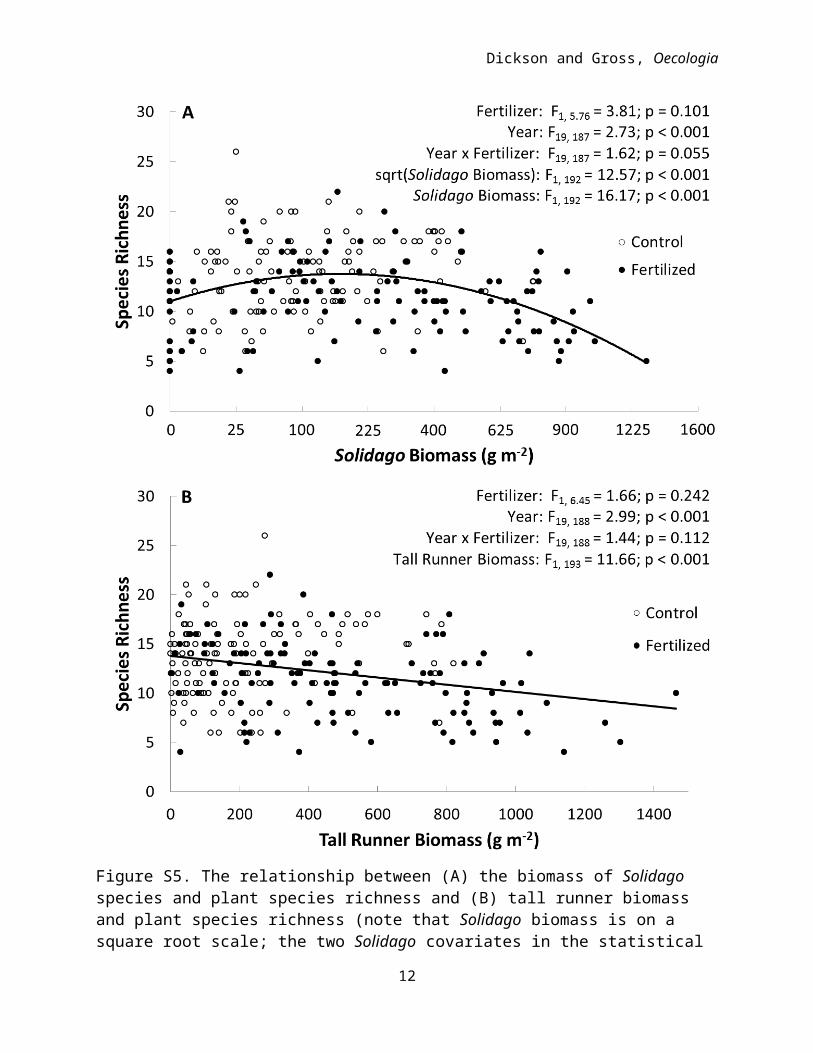
Figure S5. The relationship between (A) the biomass of Solidago species and plant species richness and (B) tall runner biomass and plant species richness (note that Solidago biomass is on a square root scale; the two Solidago covariates in the statistical results refer to the linear and quadratic portions of the polynomial relationship between Solidago biomass and species richness).
11
Dickson and Gross, Oecologia
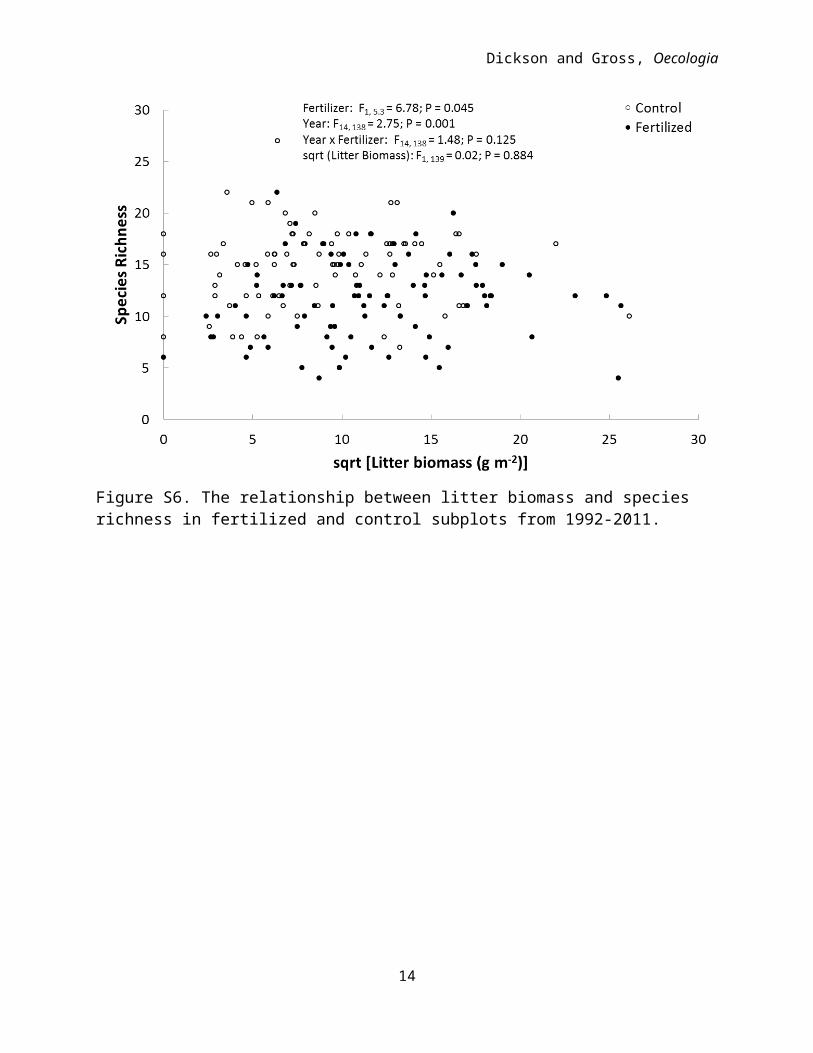
Figure S6. The relationship between litter biomass and species richness in fertilized and control subplots from 1992-2011.
12
Dickson and Gross, Oecologia
-10
-8
-6
-4
-2
0
2
4
6
8
10Sp
ecie
s Gai
ned
of Lo
st
Year
Control
Fertilized
Fertilizer: F1, 5 = 0.25; P = 0.636Year: F8, 80 = 2.49; P = 0.018Year x Fertilizer: F8, 80 = 1.28; P = 0.268
10-11
94-95
96-97
98-99
00-01
02-03
04-05
06-07
08-09
Fertilizer: F1, 5 = 0.68; P = 0.446Year: F8, 80 = 1.62; P = 0.134Year x Fertilizer: F8, 80 = 0.81; P = 0.598
Figure S7. Species gained (positive) or lost (negative) from the preceding two years to the years listed on the x-axis. We calculated a species gain if a given species was found in the biomass sample from a given subplot from at least one of two years (ex. 1994-1995) but not present in either of the two preceding years (ex. 1992-1993). Although we did not find that fertilization significantly affected the gain or loss of species in any two year period, there were obviously some differences over time in colonization patterns of this successional community. The lack of significant effects on species gain / loss suggests that changes in colonization occurred gradually over time. Values are means +1 SE; N=6.
13
Dickson and Gross, Oecologia
Figure S8. Average rank-abundance of the 10 most abundant species from each quadrat in fertilized and control treatments in the first (1992-2001) and second (2002-2011) decade of the experiment. We used rank-abundance slopes to explore how species abundances changed in response to fertilization. Rank-abundance slopes have been used for some time to document differences in species abundance patterns among communities. Because our subplots varied in the number of species and because this can impact the slope of the rank-abundance curve, we only analyzed rank-abundance relationships for subplots with at least 11 species and analyzed the relationship for the 10 most abundant species. We chose 10 species as the cutoff because 77% of samples contained at least 10 species and because this was enough species to observe changes in the abundance of rare species. We calculated separate rank-abundance slopes for the initial decade of the experiment (1992-2001) where fertilization did not significantly affect species richness and the subsequent decade (2002-2011) where fertilization caused a decline in species richness. We calculated least-square means for each estimate of biomass at each rank, which removed variation due to blocking and years. Note that the identity of the species at each rank likely varies from quadrat to quadrat and across treatments and years. We analyzed whether rank-abundance slopes were different between the unfertilized and fertilized treatment using Fisher exact test contingency tables.
14