Embed Size (px)
Citation preview
Species Diversity and Richness of Prairies
at Pierce Cedar Creek Institute
Leah Sefton and Caitlin McColl
Dr. Bradley Swanson
Central Michigan University
Oct. 28, 2011
Abstract
Prairies are the most threatened and least protected ecosystems in the United States as
more than 90% of prairie land in North America has been converted to agricultural land.
Ecosystems such as prairies are complex and are composed of cycles of interactions between
animals, plants, and abiotic factors. When species diversity or richness in these ecosystems
becomes limited, the whole system can become prone to failure as it loses support points in the
various cycles. Major factors controlling species diversity and richness in prairies include the
disturbance regime, such as prescribed burns, and edge effect, where areas closer to the edge
tend to be more vulnerable to invasion by exotic species. Five of Pierce Cedar Creek Institute’s
six prairies that we studied are planted on former agricultural land and are burned on a 3-5 year
cycle in order to maintain diversity and inhibit woody growth; the sixth prairie in this study was
not planted and has never been burned. The null hypotheses for this project were that 1) the size
of the prairie does not impact species diversity or richness, 2) the edge:area ratio does not impact
species diversity or richness, and 3) proximity to the edge does not impact species diversity or
richness. We collected species count data over three months in order to determine the species
diversity and richness evident in the prairies. We found no significant impact of size, edge:area
ratio, or proximity to edge on the species diversity or richness in any of the six prairies studied.
2
Introduction
Prairies are the most threatened and least protected ecosystems in the United States; more
than 90% of prairie land in North America has been converted to agricultural land (Samson and
Knopf, 1994). Many of the prairies that were not converted have experienced years of fire
suppression, habitat fragmentation, and invasion by exotic species, all of which contribute to the
degradation of the ecosystem (Heslinga and Grese, 2010). An understanding of how this
ecosystem is impacted by these factors is critical for rehabilitation and conservation.
Prairie ecosystems serve important ecosystem functions, such as being an essential
habitat for a variety of plants, invertebrates, and mammals, serving as breeding ground for many
bird species, being a reservoir of plant and animal biological diversity, and functioning as carbon
sinks (Samson and Knopf, 1994). Ecosystems such as prairies are complex and are composed of
cycles of interactions between animals, plants, and abiotic factors (e.g., water, soil, and air or
wind; Given, 1994). When species diversity (the variety/abundance of species present in an area)
or richness (the number of species present in an area) in these ecosystems becomes limited, the
whole system can become prone to failure as it loses support points in the various cycles (Given,
1994).
One of the major factors controlling species diversity in prairies is the disturbance regime
to which they are exposed (Collins, 1987). The intermediate disturbance hypothesis suggests that
when either the intensity or frequency of disturbance is at an intermediate level, alpha-diversity
is maximized by the equilibrium produced between competitive and colonist species (Vujnovic
et al., 2002; Collins, 1987). Understanding the interaction of species and disturbance is
especially important in restored systems, such as prairies, for several reasons (Howe, 1995;
Collins, 1987). First, prairies are unlikely to have natural recolonization of native prairie species
given the rarity and distance between the habitat patches. Second, the initial seed mix used in the
restoration is likely to be the major source for a majority of the prairie plants. Improving species
diversity requires assessment of non-native and native species to control the abundance of each
so as to limit the ability of non-native species to outcompete the native species, and maintain
healthy population size and genetic diversity in non-native species (Heslinga and Grese, 2010).
Another factor impacting species diversity is the edge effect. Edge effects occur when
the area closer to the perimeter of a habitat is different from the area at the center (Krohne, 2001).
Areas closer to the edge tend to be more vulnerable to invasion by exotic species. Roscher et al.,
3
(2009) found that the number and density of non-native species decreased from the edge of the
prairie to the center. Edge effects are especially pronounced in smaller prairies or prairie
fragments, where a large percentage of the total prairie area may be considered the edge (Koper
et al., 2009).
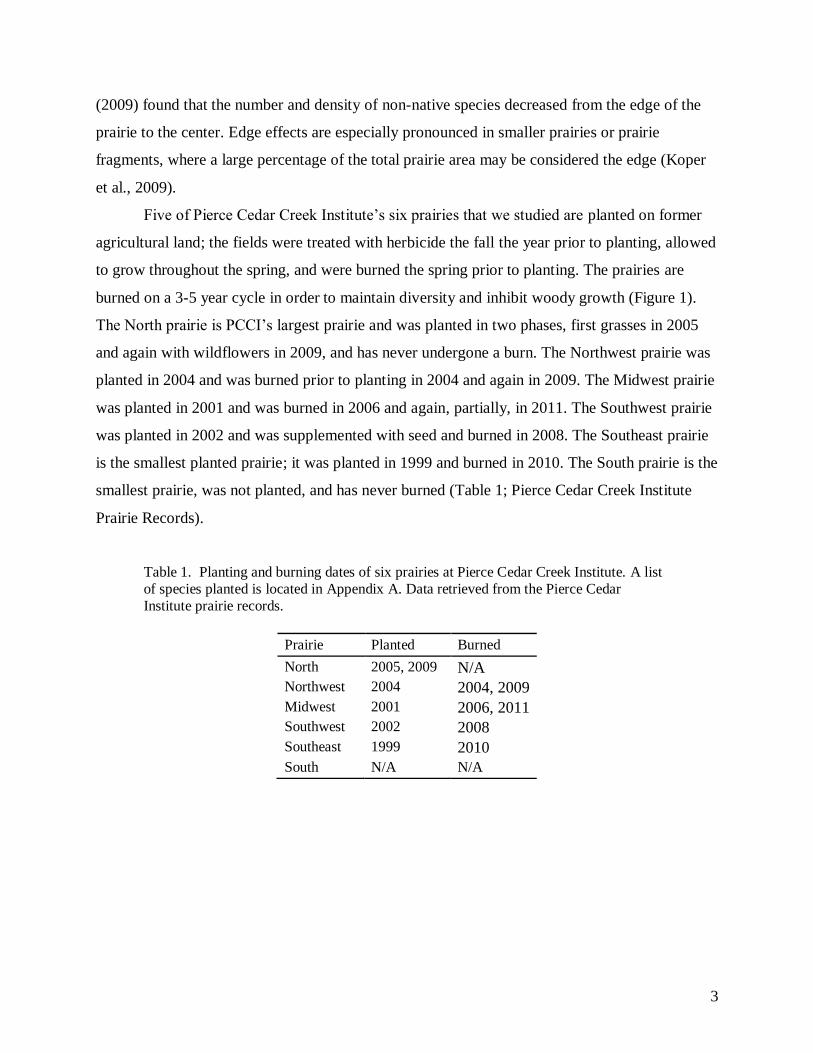
Five of Pierce Cedar Creek Institute’s six prairies that we studied are planted on former
agricultural land; the fields were treated with herbicide the fall the year prior to planting, allowed
to grow throughout the spring, and were burned the spring prior to planting. The prairies are
burned on a 3-5 year cycle in order to maintain diversity and inhibit woody growth (Figure 1).
The North prairie is PCCI’s largest prairie and was planted in two phases, first grasses in 2005
and again with wildflowers in 2009, and has never undergone a burn. The Northwest prairie was
planted in 2004 and was burned prior to planting in 2004 and again in 2009. The Midwest prairie
was planted in 2001 and was burned in 2006 and again, partially, in 2011. The Southwest prairie
was planted in 2002 and was supplemented with seed and burned in 2008. The Southeast prairie
is the smallest planted prairie; it was planted in 1999 and burned in 2010. The South prairie is the
smallest prairie, was not planted, and has never burned (Table 1; Pierce Cedar Creek Institute
Prairie Records).
Table 1. Planting and burning dates of six prairies at Pierce Cedar Creek Institute. A list
of species planted is located in Appendix A. Data retrieved from the Pierce Cedar
Institute prairie records.
Prairie Planted Burned
North 2005, 2009 N/A
Northwest 2004 2004, 2009
Midwest 2001 2006, 2011
Southwest 2002 2008
Southeast 1999 2010
South N/A N/A
4
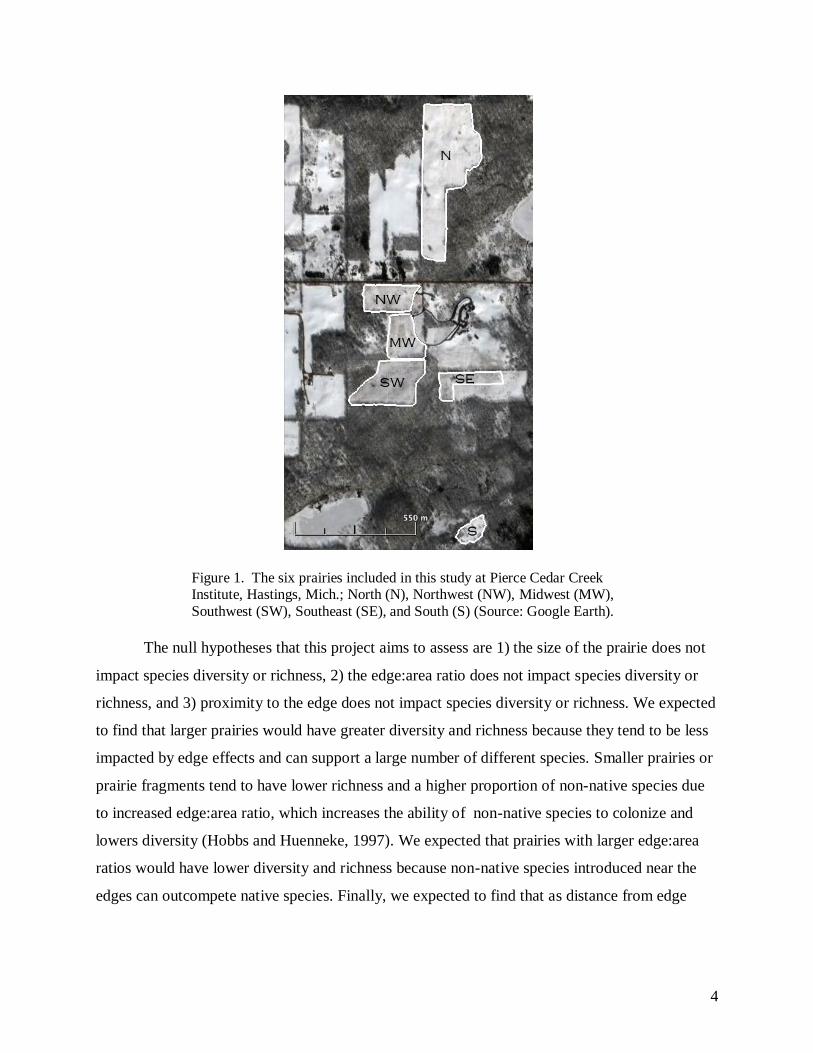
Figure 1. The six prairies included in this study at Pierce Cedar Creek Institute, Hastings, Mich.; North (N), Northwest (NW), Midwest (MW),
Southwest (SW), Southeast (SE), and South (S) (Source: Google Earth).
The null hypotheses that this project aims to assess are 1) the size of the prairie does not
impact species diversity or richness, 2) the edge:area ratio does not impact species diversity or
richness, and 3) proximity to the edge does not impact species diversity or richness. We expected
to find that larger prairies would have greater diversity and richness because they tend to be less
impacted by edge effects and can support a large number of different species. Smaller prairies or
prairie fragments tend to have lower richness and a higher proportion of non-native species due
to increased edge:area ratio, which increases the ability of non-native species to colonize and
lowers diversity (Hobbs and Huenneke, 1997). We expected that prairies with larger edge:area
ratios would have lower diversity and richness because non-native species introduced near the
edges can outcompete native species. Finally, we expected to find that as distance from edge
5
increases, diversity and richness would decrease because edges are transition zones where new
species are introduced.
Methods
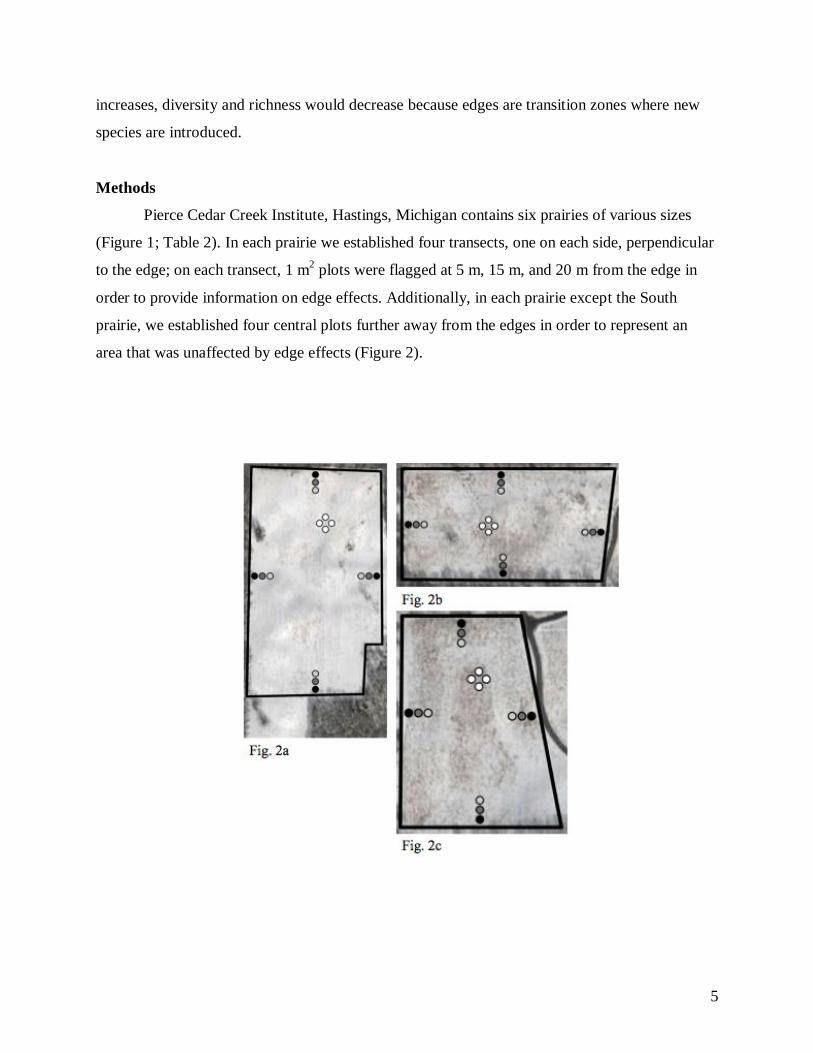
Pierce Cedar Creek Institute, Hastings, Michigan contains six prairies of various sizes
(Figure 1; Table 2). In each prairie we established four transects, one on each side, perpendicular
to the edge; on each transect, 1 m2 plots were flagged at 5 m, 15 m, and 20 m from the edge in
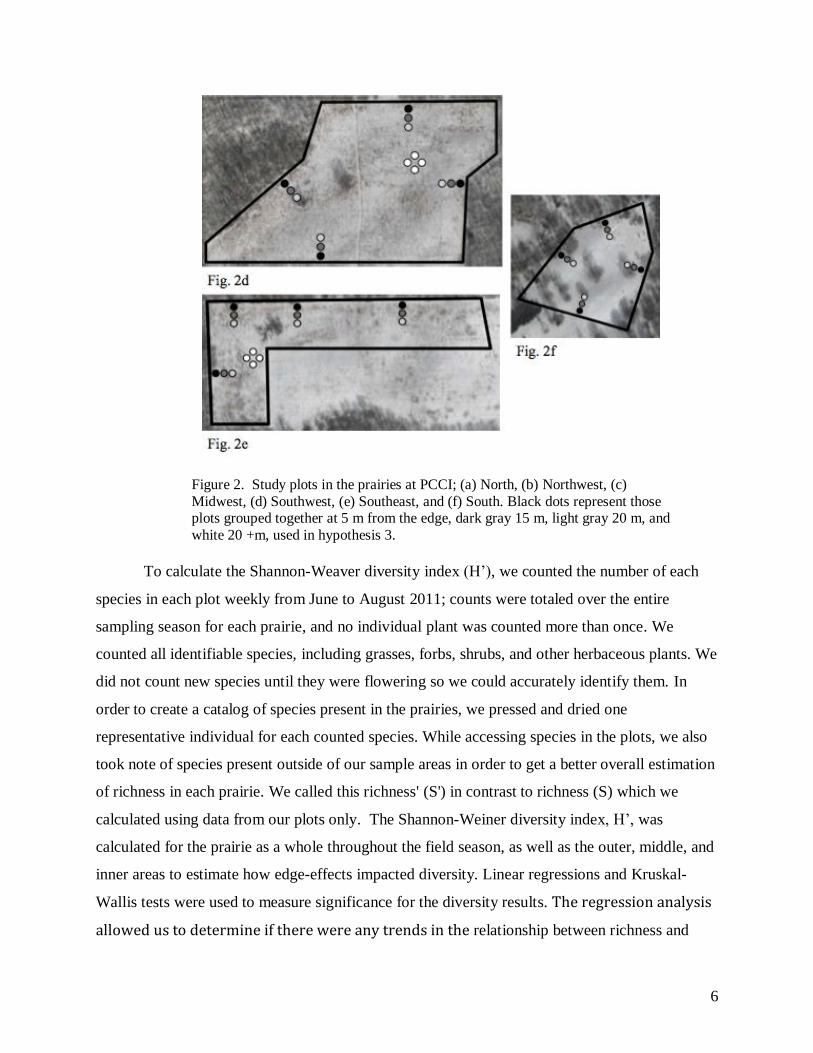
order to provide information on edge effects. Additionally, in each prairie except the South
prairie, we established four central plots further away from the edges in order to represent an
area that was unaffected by edge effects (Figure 2).
6
Figure 2. Study plots in the prairies at PCCI; (a) North, (b) Northwest, (c)
Midwest, (d) Southwest, (e) Southeast, and (f) South. Black dots represent those plots grouped together at 5 m from the edge, dark gray 15 m, light gray 20 m, and
white 20 +m, used in hypothesis 3.
To calculate the Shannon-Weaver diversity index (H’), we counted the number of each
species in each plot weekly from June to August 2011; counts were totaled over the entire
sampling season for each prairie, and no individual plant was counted more than once. We
counted all identifiable species, including grasses, forbs, shrubs, and other herbaceous plants. We
did not count new species until they were flowering so we could accurately identify them. In
order to create a catalog of species present in the prairies, we pressed and dried one
representative individual for each counted species. While accessing species in the plots, we also
took note of species present outside of our sample areas in order to get a better overall estimation
of richness in each prairie. We called this richness' (S') in contrast to richness (S) which we
calculated using data from our plots only. The Shannon-Weiner diversity index, H’, was
calculated for the prairie as a whole throughout the field season, as well as the outer, middle, and
inner areas to estimate how edge-effects impacted diversity. Linear regressions and Kruskal-
Wallis tests were used to measure significance for the diversity results. The regression analysis
allowed us to determine if there were any trends in the relationship between richness and
7
distance from the edge even though there were no significant differences in pair-wise
comparisons. The Kruskal-Wallis test would show if one of the distances was significantly
different than the other distances without having a significant trend. For example, if the diversity
or richness at 5 m, 15 m, and 20 m were the same but the central plots were different this would
not be detected by the linear regression.
We calculated the percent abundance of native/planted species versus non-native species
in each prairie in order to determine which prairies are more affected by non-native species and
to see if the number of non-native species present is relative to distance from the edge. Due to
clover (Trifolium repens) having an overwhelming abundance in many of the prairies and
apparently not having much of a negative effect on native species present, we did these
calculations once including the clover count and once excluding the clover count. When clover
was present in the prairies, it was present in massive quantities. Including the clover in the
species abundance calculations dramatically skewed the results to indicate that non-native
species were much more abundant while their biomass compared to goldenrod and grasses was
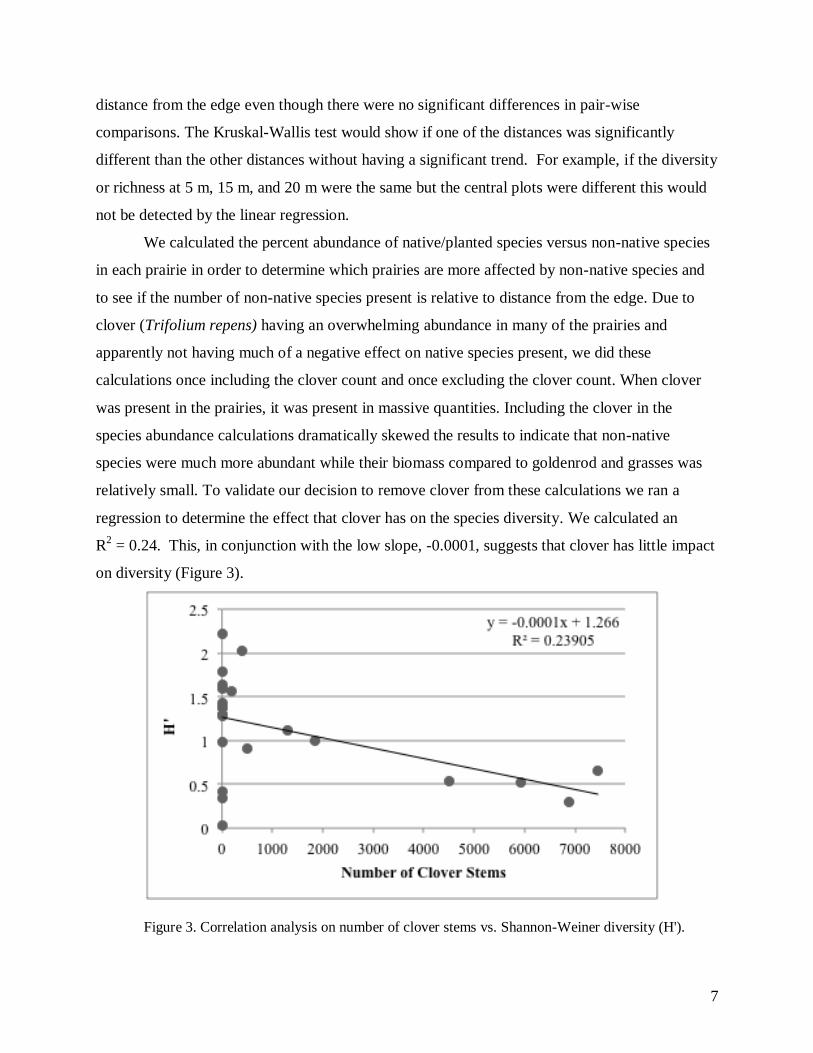
relatively small. To validate our decision to remove clover from these calculations we ran a
regression to determine the effect that clover has on the species diversity. We calculated an
R2 = 0.24. This, in conjunction with the low slope, -0.0001, suggests that clover has little impact
on diversity (Figure 3).
Figure 3. Correlation analysis on number of clover stems vs. Shannon-Weiner diversity (H').
8
We also averaged the percentages of non-native species for each prairie (all excluding clover) in
order to compare the prairies to each other. We tested the significance of these values using
Kruskal-Wallis tests.
Due to the nature of this project being conservation based and focusing on the effects of
non-native species and edge effects on prairies, we would rather make a type I error (falsely
rejecting the null hypothesis) than a type II error (falsely failing to reject the null hypothesis). In
order to achieve this we set our alpha value to 0.1.
Results
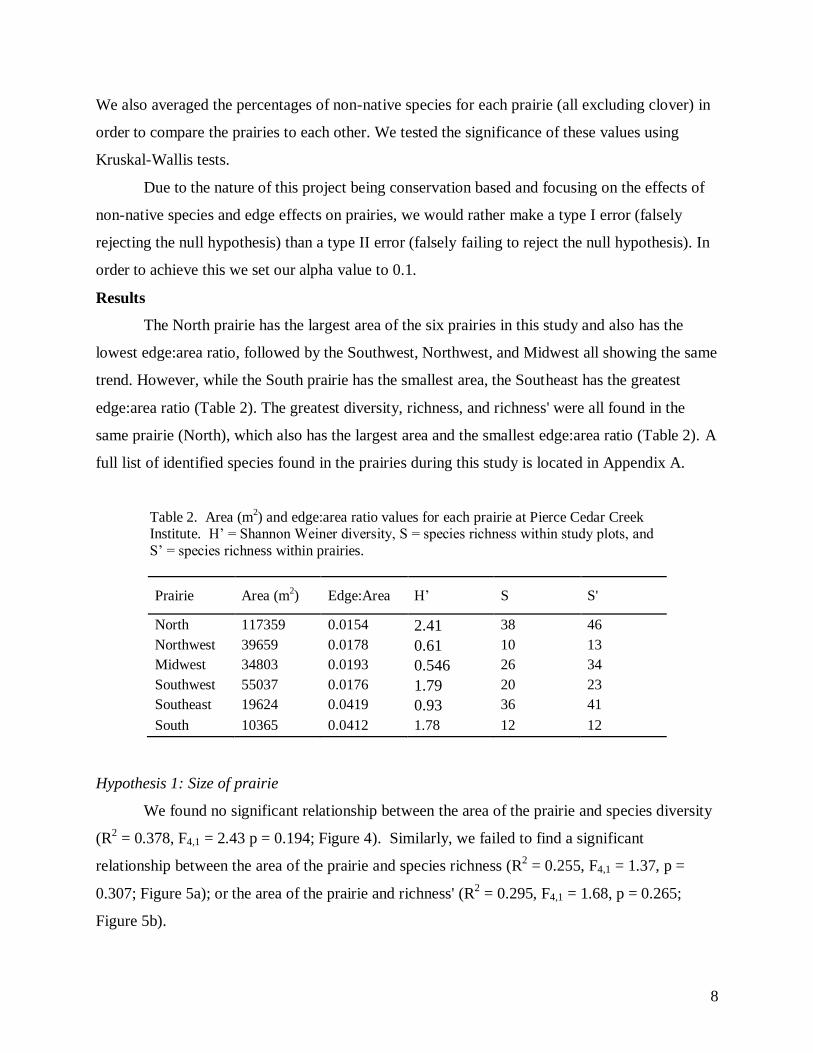
The North prairie has the largest area of the six prairies in this study and also has the
lowest edge:area ratio, followed by the Southwest, Northwest, and Midwest all showing the same
trend. However, while the South prairie has the smallest area, the Southeast has the greatest
edge:area ratio (Table 2). The greatest diversity, richness, and richness' were all found in the
same prairie (North), which also has the largest area and the smallest edge:area ratio (Table 2). A
full list of identified species found in the prairies during this study is located in Appendix A.
Table 2. Area (m2) and edge:area ratio values for each prairie at Pierce Cedar Creek
Institute. H’ = Shannon Weiner diversity, S = species richness within study plots, and
S’ = species richness within prairies.
Prairie Area (m2) Edge:Area H’ S S'
North 117359 0.0154 2.41 38 46
Northwest 39659 0.0178 0.61 10 13
Midwest 34803 0.0193 0.546 26 34
Southwest 55037 0.0176 1.79 20 23
Southeast 19624 0.0419 0.93 36 41
South 10365 0.0412 1.78 12 12
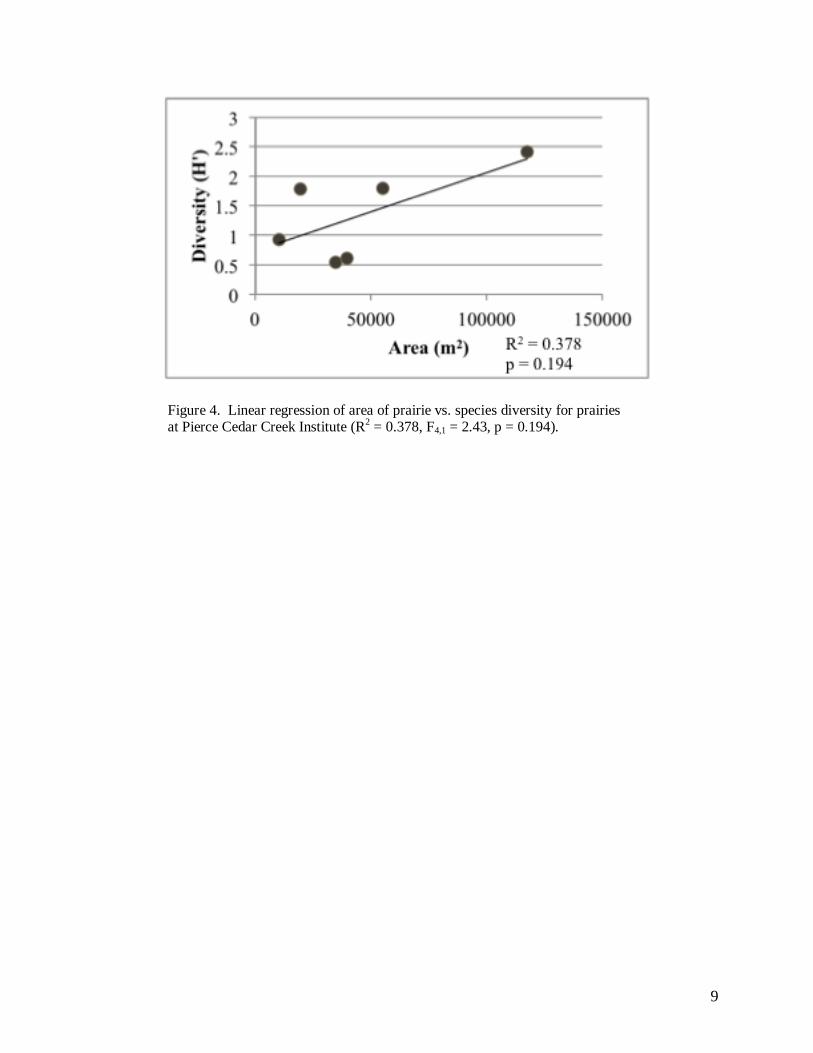
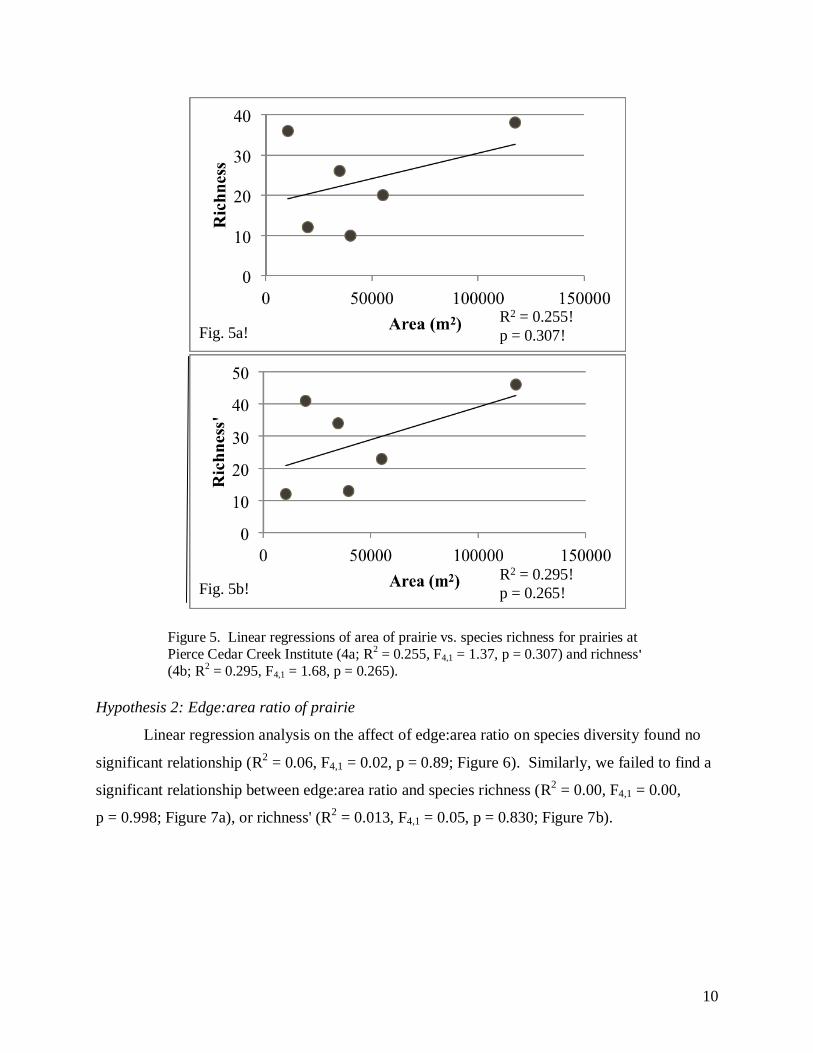
Hypothesis 1: Size of prairie
We found no significant relationship between the area of the prairie and species diversity
(R2 = 0.378, F4,1 = 2.43 p = 0.194; Figure 4). Similarly, we failed to find a significant
relationship between the area of the prairie and species richness (R2 = 0.255, F4,1 = 1.37, p =
0.307; Figure 5a); or the area of the prairie and richness' (R2 = 0.295, F4,1 = 1.68, p = 0.265;
Figure 5b).
9
Figure 4. Linear regression of area of prairie vs. species diversity for prairies at Pierce Cedar Creek Institute (R
2 = 0.378, F4,1 = 2.43, p = 0.194).
10
Figure 5. Linear regressions of area of prairie vs. species richness for prairies at
Pierce Cedar Creek Institute (4a; R2 = 0.255, F4,1 = 1.37, p = 0.307) and richness'
(4b; R2 = 0.295, F4,1 = 1.68, p = 0.265).
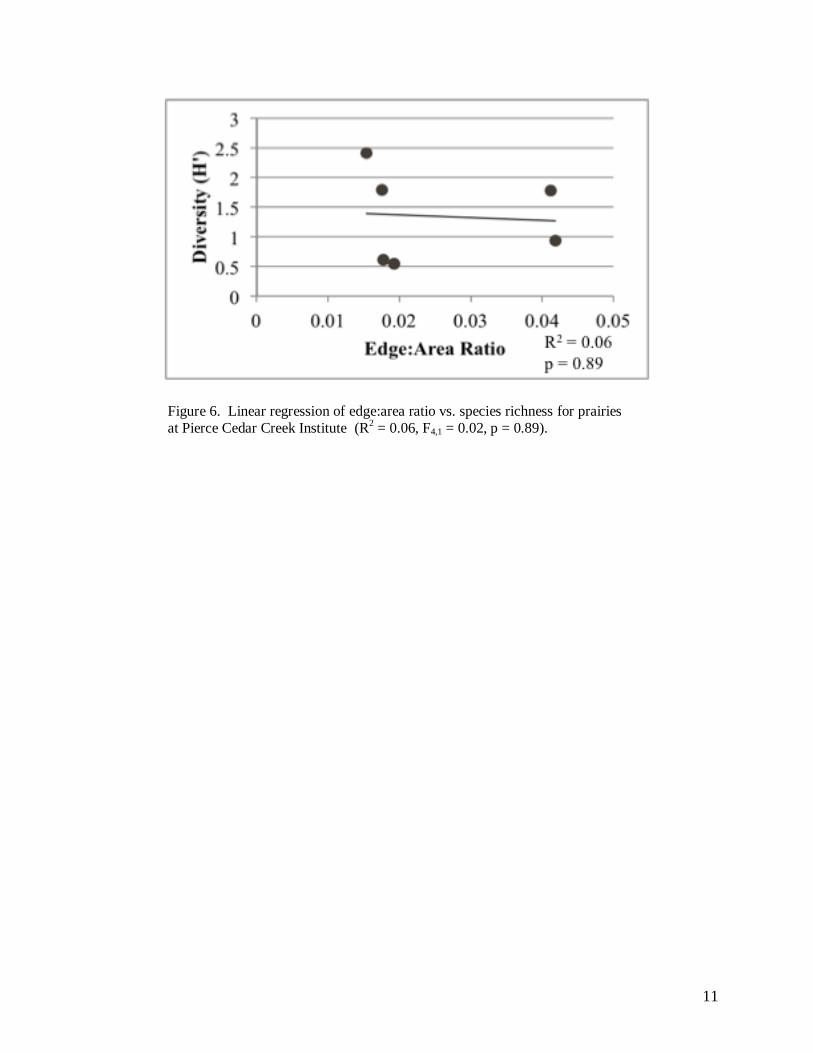
Hypothesis 2: Edge:area ratio of prairie
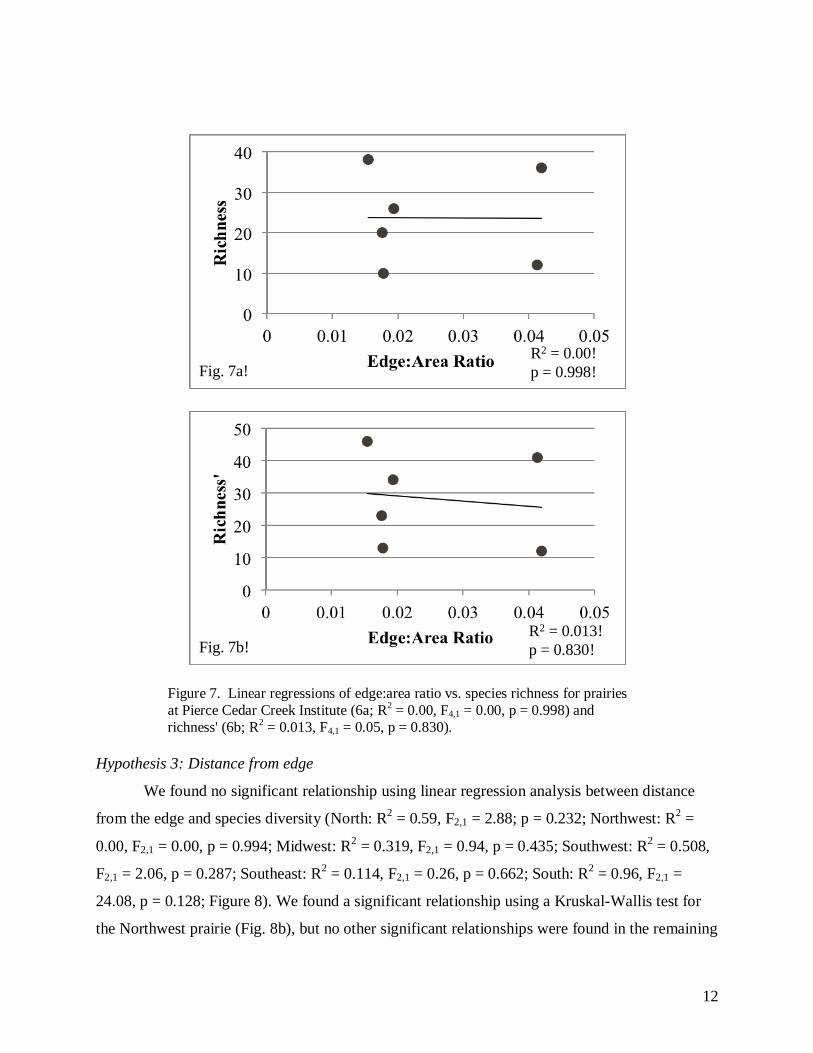
Linear regression analysis on the affect of edge:area ratio on species diversity found no
significant relationship (R2 = 0.06, F4,1 = 0.02, p = 0.89; Figure 6). Similarly, we failed to find a
significant relationship between edge:area ratio and species richness (R2 = 0.00, F4,1 = 0.00,
p = 0.998; Figure 7a), or richness' (R2 = 0.013, F4,1 = 0.05, p = 0.830; Figure 7b).
!
!
Fig. 5a!
Fig. 5b!
R2 = 0.255!p = 0.307!
R2 = 0.295!p = 0.265!
!
!
Fig. 5a!
Fig. 5b!
R2 = 0.255!p = 0.307!
R2 = 0.295!p = 0.265!
11
Figure 6. Linear regression of edge:area ratio vs. species richness for prairies
at Pierce Cedar Creek Institute (R2 = 0.06, F4,1 = 0.02, p = 0.89).
12
Figure 7. Linear regressions of edge:area ratio vs. species richness for prairies
at Pierce Cedar Creek Institute (6a; R2 = 0.00, F4,1 = 0.00, p = 0.998) and
richness' (6b; R2 = 0.013, F4,1 = 0.05, p = 0.830).
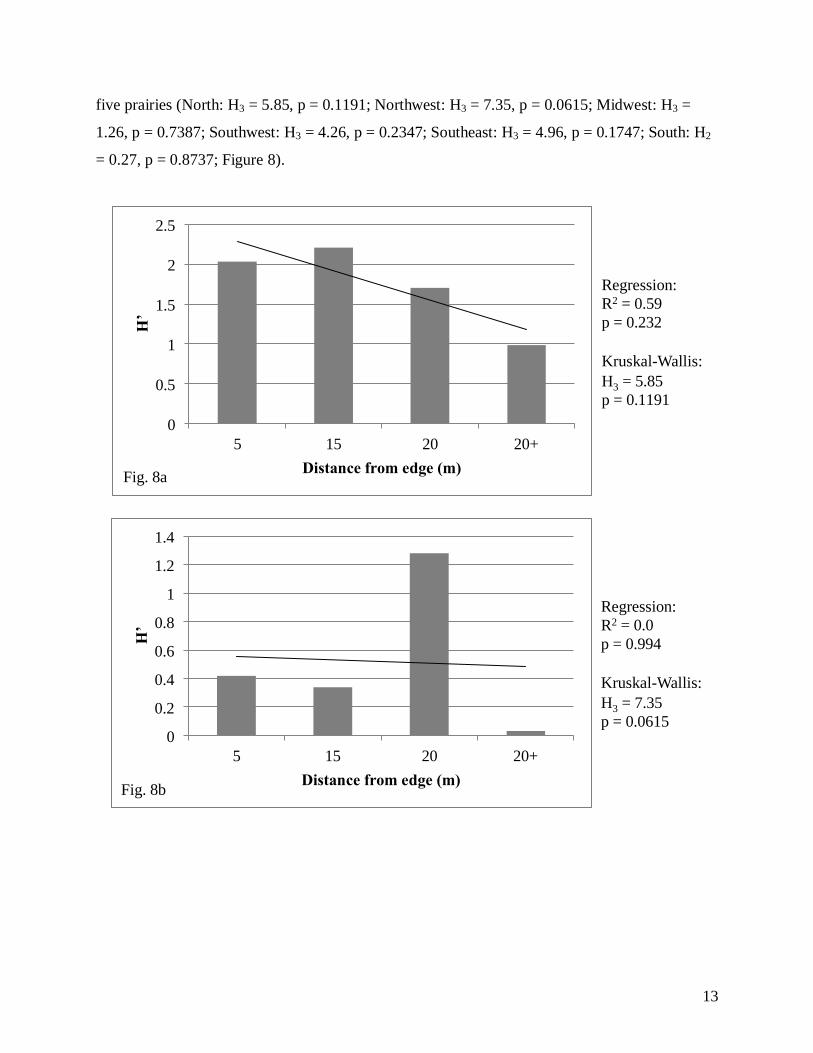
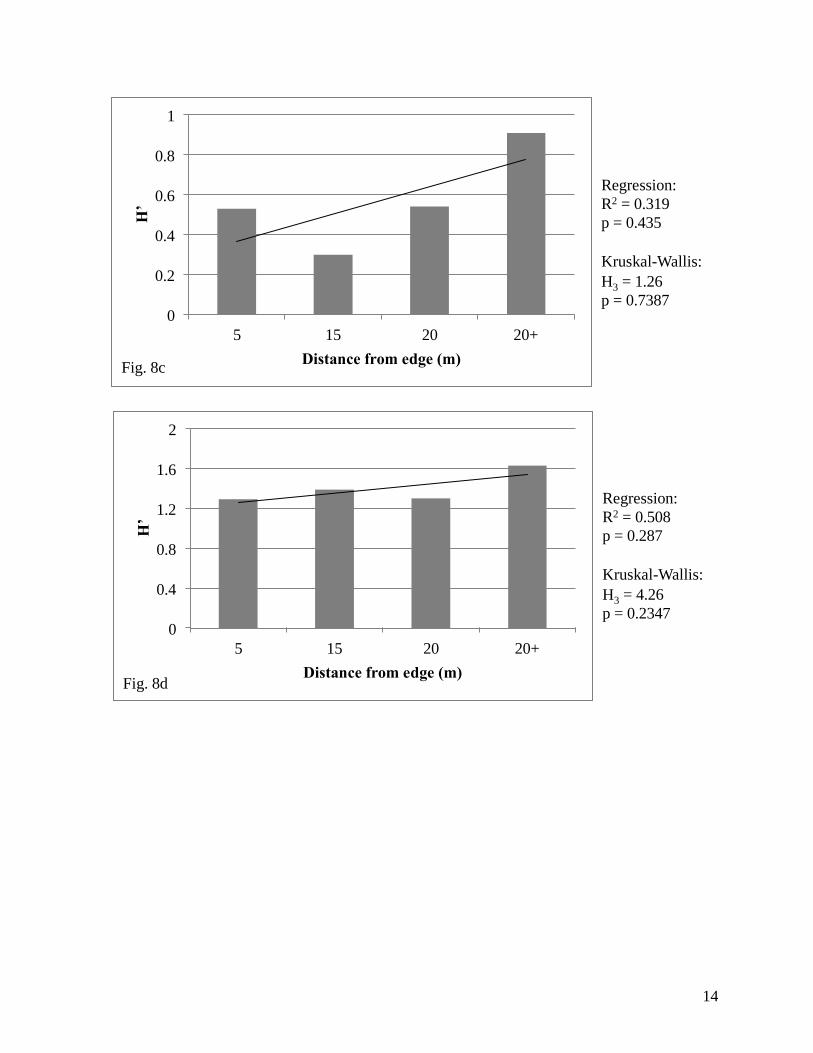
Hypothesis 3: Distance from edge
We found no significant relationship using linear regression analysis between distance
from the edge and species diversity (North: R2 = 0.59, F2,1 = 2.88; p = 0.232; Northwest: R
2 =
0.00, F2,1 = 0.00, p = 0.994; Midwest: R2 = 0.319, F2,1 = 0.94, p = 0.435; Southwest: R
2 = 0.508,
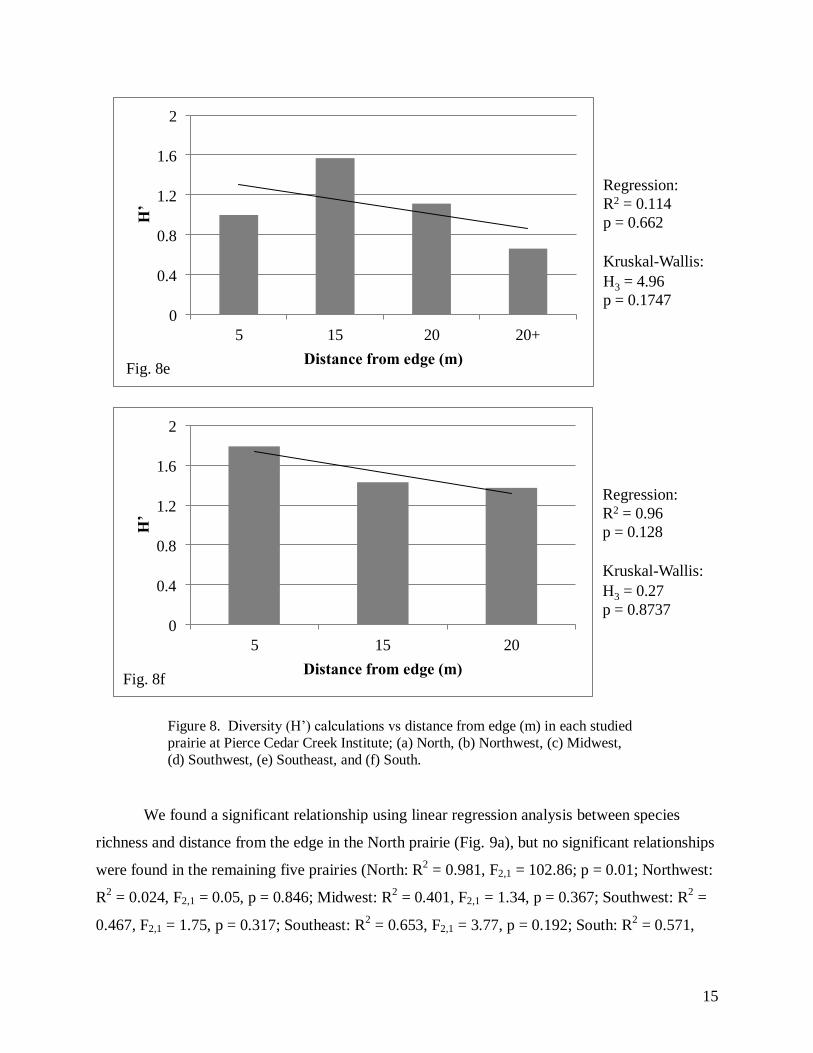
F2,1 = 2.06, p = 0.287; Southeast: R2 = 0.114, F2,1 = 0.26, p = 0.662; South: R
2 = 0.96, F2,1 =
24.08, p = 0.128; Figure 8). We found a significant relationship using a Kruskal-Wallis test for
the Northwest prairie (Fig. 8b), but no other significant relationships were found in the remaining
!Fig. 7a!
R2 = 0.00!p = 0.998!
!Fig. 7b!
R2 = 0.013!p = 0.830!
!Fig. 7a!
R2 = 0.00!p = 0.998!
!Fig. 7b!
R2 = 0.013!p = 0.830!
13
five prairies (North: H3 = 5.85, p = 0.1191; Northwest: H3 = 7.35, p = 0.0615; Midwest: H3 =
1.26, p = 0.7387; Southwest: H3 = 4.26, p = 0.2347; Southeast: H3 = 4.96, p = 0.1747; South: H2
= 0.27, p = 0.8737; Figure 8).
0
0.5
1
1.5
2
2.5
5 15 20 20+
H’
Distance from edge (m)
0
5
10
15
20
25
30
5 15 20 20+
S
Distance from edge (m)
! " #$%&
Regression:
R2 = 0.59
p = 0.232
Kruskal-Wallis:
H3 = 5.85
p = 0.1191
Regression:
R2 = 0.981
p = 0.01
Kruskal-Wallis:
H3 = 7.28
p = 0.0635
Fig. 8a
Fig. 9a
! " #$%' ( ) $&
0
0.2
0.4
0.6
0.8
1
1.2
1.4
5 15 20 20+
H’
Distance from edge (m)
0
2
4
6
8
5 15 20 20+
S
Distance from edge (m)
Regression:
R2 = 0.0
p = 0.994
Kruskal-Wallis:
H3 = 7.35
p = 0.0615
Regression:
R2 = 0.024
p = 0.846
Kruskal-Wallis:
H3 = 2.9
p = 0.4073
Fig. 8b
Fig. 9b
14
* +, ' ( ) $&
0
0.2
0.4
0.6
0.8
1
5 15 20 20+
H’
Distance from edge (m)
0
4
8
12
16
20
5 15 20 20+
S
Distance from edge (m)
Regression:
R2 = 0.319
p = 0.435
Kruskal-Wallis:
H3 = 1.26
p = 0.7387
Regression:
R2 = 0.401
p = 0.367
Kruskal-Wallis:
H3 = 1.17
p = 0.7602
Fig. 8c
Fig. 9c
) " - $%' ( ) $&
0
0.4
0.8
1.2
1.6
2
5 15 20 20+
H’
Distance from edge (m)
0
2
4
6
8
10
12
5 15 20 20+
S
Distance from edge (m)
Regression:
R2 = 0.508
p = 0.287
Kruskal-Wallis:
H3 = 4.26
p = 0.2347
Regression:
R2 = 0.467
p = 0.317
Kruskal-Wallis:
H3 = 1.21
p = 0.7506
Fig. 8d
Fig. 9d
15
Figure 8. Diversity (H’) calculations vs distance from edge (m) in each studied
prairie at Pierce Cedar Creek Institute; (a) North, (b) Northwest, (c) Midwest,
(d) Southwest, (e) Southeast, and (f) South.
We found a significant relationship using linear regression analysis between species
richness and distance from the edge in the North prairie (Fig. 9a), but no significant relationships
were found in the remaining five prairies (North: R2 = 0.981, F2,1 = 102.86; p = 0.01; Northwest:
R2 = 0.024, F2,1 = 0.05, p = 0.846; Midwest: R
2 = 0.401, F2,1 = 1.34, p = 0.367; Southwest: R
2 =
0.467, F2,1 = 1.75, p = 0.317; Southeast: R2 = 0.653, F2,1 = 3.77, p = 0.192; South: R
2 = 0.571,
) " - $%( . ) $&
0
0.4
0.8
1.2
1.6
2
5 15 20 20+
H’
Distance from edge (m)
0
5
10
15
20
25
30
5 15 20 20+
S
Distance from edge (m)
Regression:
R2 = 0.114
p = 0.662
Kruskal-Wallis:
H3 = 4.96
p = 0.1747
Regression:
R2 = 0.653
p = 0.192
Kruskal-Wallis:
H3 = 5.76
p = 0.1239
Fig. 8e
Fig. 9e
) " - $%&
0
0.4
0.8
1.2
1.6
2
5 15 20
H’
Distance from edge (m)
0
2
4
6
8
10
5 15 20
S
Distance from edge (m)
Regression:
R2 = 0.96
p = 0.128
Kruskal-Wallis:
H3 = 0.27
p = 0.8737
Regression:
R2 = 0.571
p = 0.454
Kruskal-Wallis:
H3 = 0.18
p = 0.9139
Fig. 8f
Fig. 9f
16
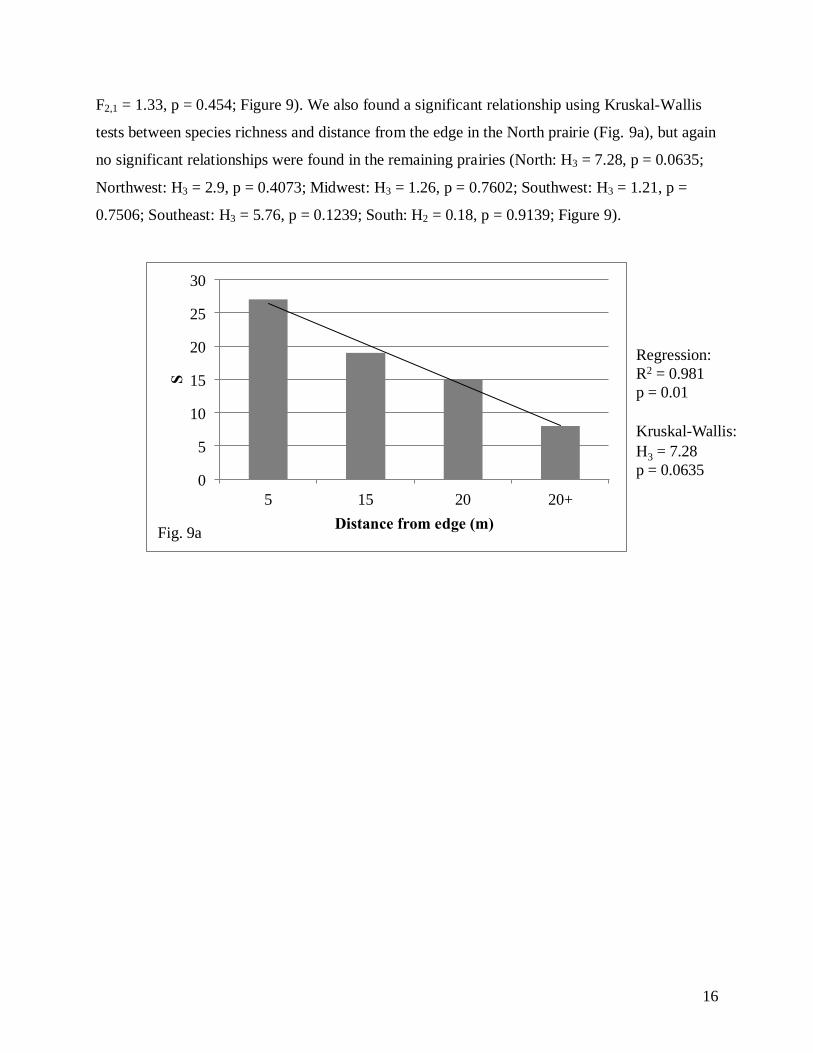
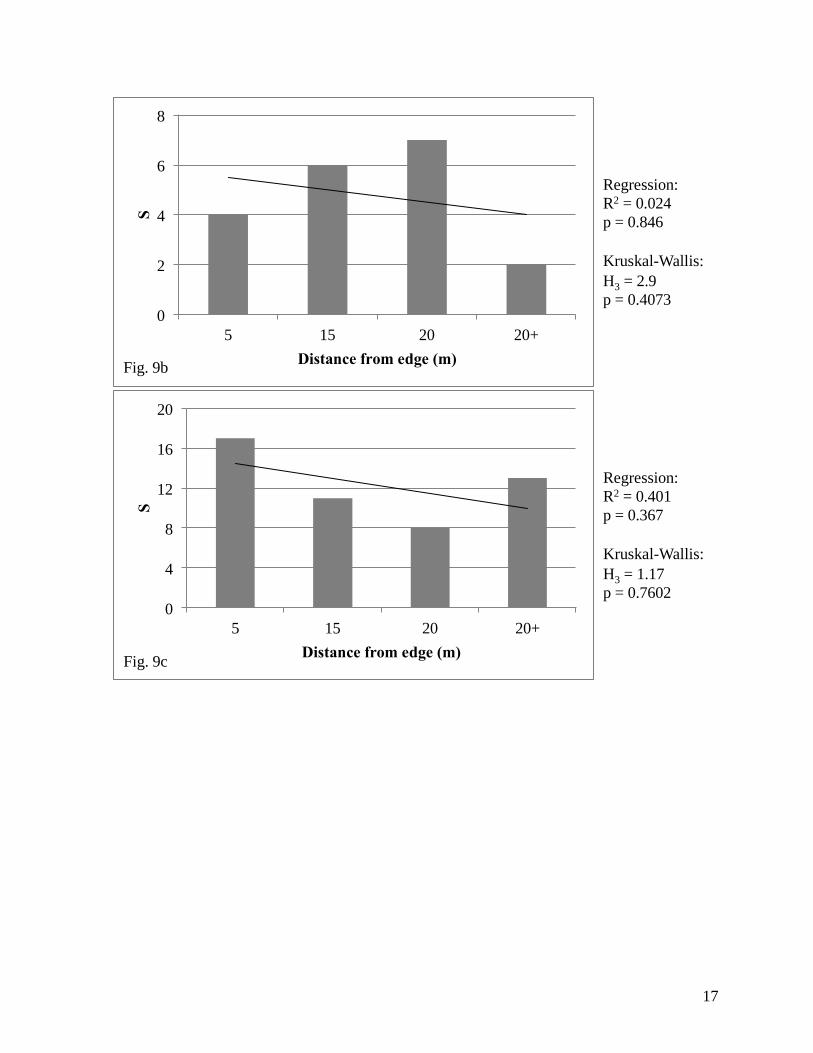
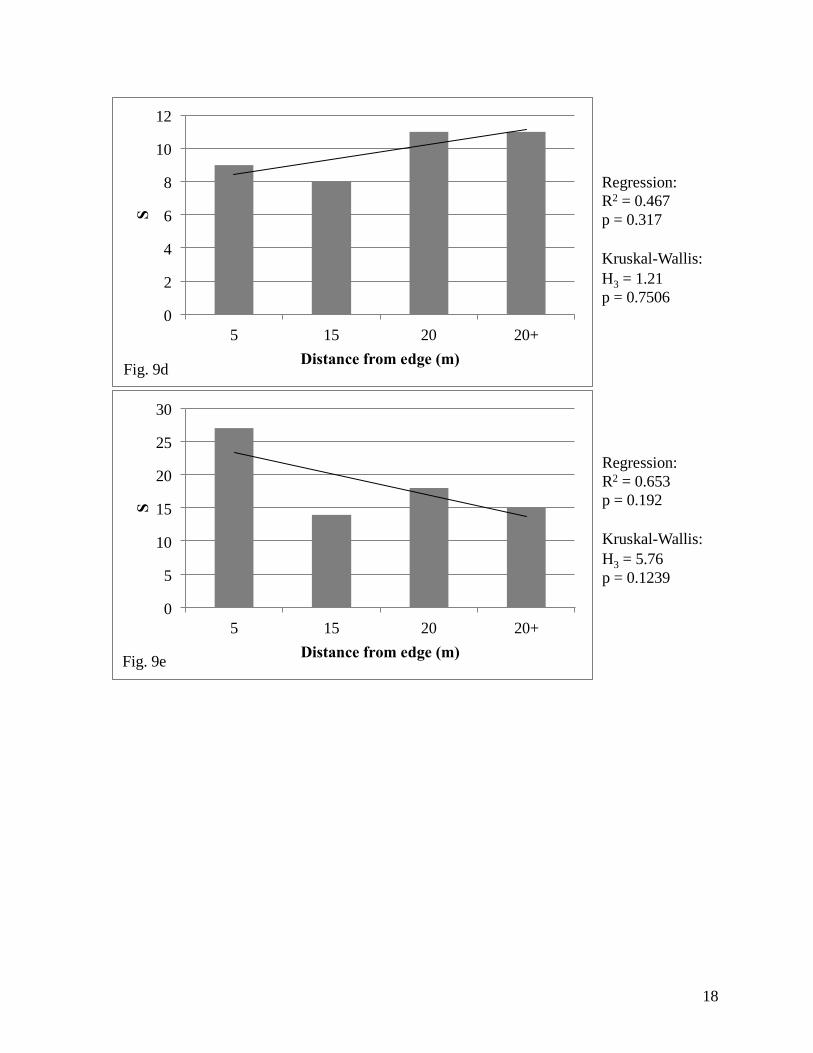
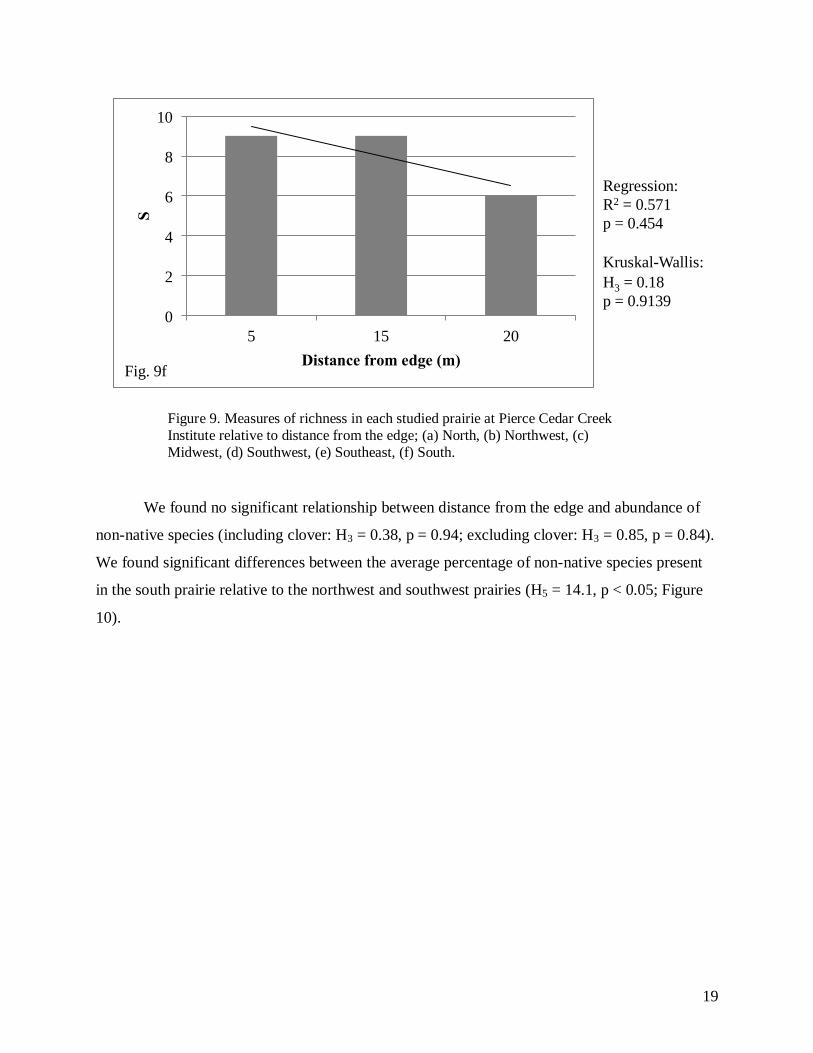
F2,1 = 1.33, p = 0.454; Figure 9). We also found a significant relationship using Kruskal-Wallis
tests between species richness and distance from the edge in the North prairie (Fig. 9a), but again
no significant relationships were found in the remaining prairies (North: H3 = 7.28, p = 0.0635;
Northwest: H3 = 2.9, p = 0.4073; Midwest: H3 = 1.26, p = 0.7602; Southwest: H3 = 1.21, p =
0.7506; Southeast: H3 = 5.76, p = 0.1239; South: H2 = 0.18, p = 0.9139; Figure 9).
0
0.5
1
1.5
2
2.5
5 15 20 20+ H’
Distance from edge (m)
0
5
10
15
20
25
30
5 15 20 20+
S
Distance from edge (m)
! " #$%&
Regression:
R2 = 0.59
p = 0.232
Kruskal-Wallis:
H3 = 5.85
p = 0.1191
Regression:
R2 = 0.981
p = 0.01
Kruskal-Wallis:
H3 = 7.28
p = 0.0635
Fig. 8a
Fig. 9a
17
! " #$%' ( ) $&
0
0.2
0.4
0.6
0.8
1
1.2
1.4
5 15 20 20+
H’
Distance from edge (m)
0
2
4
6
8
5 15 20 20+
S
Distance from edge (m)
Regression:
R2 = 0.0
p = 0.994
Kruskal-Wallis:
H3 = 7.35
p = 0.0615
Regression:
R2 = 0.024
p = 0.846
Kruskal-Wallis:
H3 = 2.9
p = 0.4073
Fig. 8b
Fig. 9b
* +, ' ( ) $&
0
0.2
0.4
0.6
0.8
1
5 15 20 20+
H’
Distance from edge (m)
0
4
8
12
16
20
5 15 20 20+
S
Distance from edge (m)
Regression:
R2 = 0.319
p = 0.435
Kruskal-Wallis:
H3 = 1.26
p = 0.7387
Regression:
R2 = 0.401
p = 0.367
Kruskal-Wallis:
H3 = 1.17
p = 0.7602
Fig. 8c
Fig. 9c
18
) " - $%' ( ) $&
0
0.4
0.8
1.2
1.6
2
5 15 20 20+
H’
Distance from edge (m)
0
2
4
6
8
10
12
5 15 20 20+
S
Distance from edge (m)
Regression:
R2 = 0.508
p = 0.287
Kruskal-Wallis:
H3 = 4.26
p = 0.2347
Regression:
R2 = 0.467
p = 0.317
Kruskal-Wallis:
H3 = 1.21
p = 0.7506
Fig. 8d
Fig. 9d
) " - $%( . ) $&
0
0.4
0.8
1.2
1.6
2
5 15 20 20+
H’
Distance from edge (m)
0
5
10
15
20
25
30
5 15 20 20+
S
Distance from edge (m)
Regression:
R2 = 0.114
p = 0.662
Kruskal-Wallis:
H3 = 4.96
p = 0.1747
Regression:
R2 = 0.653
p = 0.192
Kruskal-Wallis:
H3 = 5.76
p = 0.1239
Fig. 8e
Fig. 9e
19
Figure 9. Measures of richness in each studied prairie at Pierce Cedar Creek
Institute relative to distance from the edge; (a) North, (b) Northwest, (c)
Midwest, (d) Southwest, (e) Southeast, (f) South.
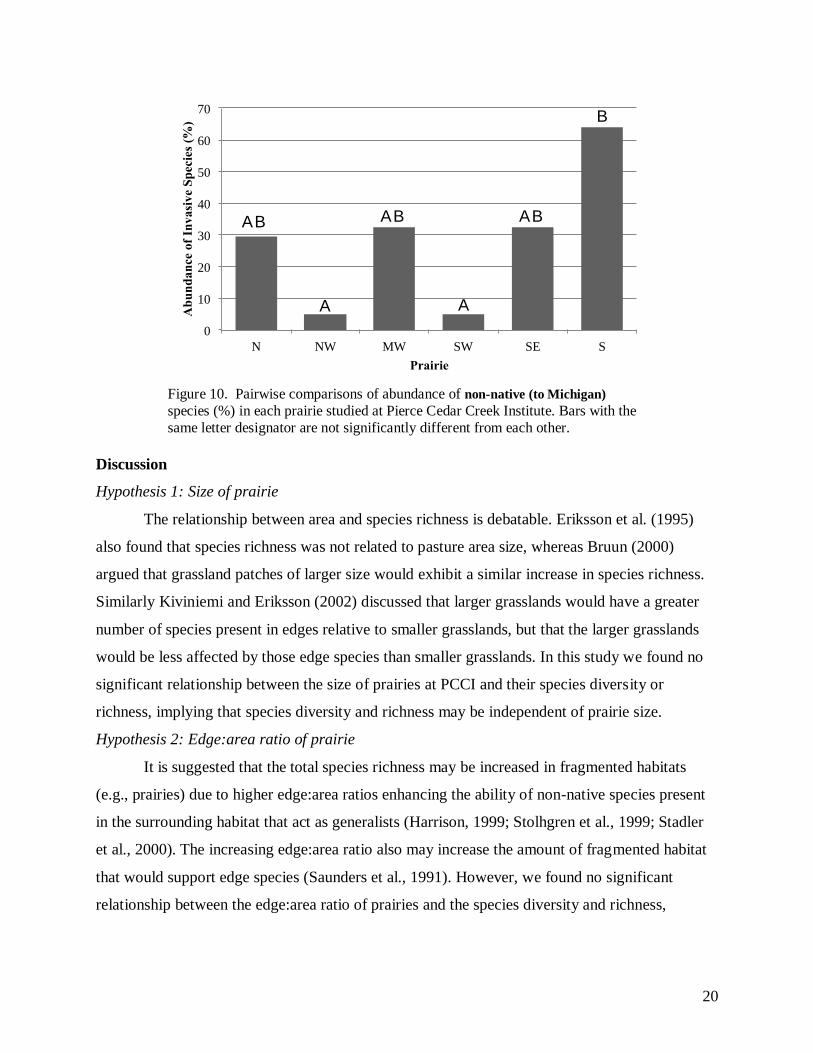
We found no significant relationship between distance from the edge and abundance of
non-native species (including clover: H3 = 0.38, p = 0.94; excluding clover: H3 = 0.85, p = 0.84).
We found significant differences between the average percentage of non-native species present
in the south prairie relative to the northwest and southwest prairies (H5 = 14.1, p < 0.05; Figure
10).
) " - $%&
0
0.4
0.8
1.2
1.6
2
5 15 20
H’
Distance from edge (m)
0
2
4
6
8
10
5 15 20
S
Distance from edge (m)
Regression:
R2 = 0.96
p = 0.128
Kruskal-Wallis:
H3 = 0.27
p = 0.8737
Regression:
R2 = 0.571
p = 0.454
Kruskal-Wallis:
H3 = 0.18
p = 0.9139
Fig. 8f
Fig. 9f
20
Figure 10. Pairwise comparisons of abundance of non-native (to Michigan)
species (%) in each prairie studied at Pierce Cedar Creek Institute. Bars with the
same letter designator are not significantly different from each other.
Discussion
Hypothesis 1: Size of prairie
The relationship between area and species richness is debatable. Eriksson et al. (1995)
also found that species richness was not related to pasture area size, whereas Bruun (2000)
argued that grassland patches of larger size would exhibit a similar increase in species richness.
Similarly Kiviniemi and Eriksson (2002) discussed that larger grasslands would have a greater
number of species present in edges relative to smaller grasslands, but that the larger grasslands
would be less affected by those edge species than smaller grasslands. In this study we found no
significant relationship between the size of prairies at PCCI and their species diversity or
richness, implying that species diversity and richness may be independent of prairie size.
Hypothesis 2: Edge:area ratio of prairie
It is suggested that the total species richness may be increased in fragmented habitats
(e.g., prairies) due to higher edge:area ratios enhancing the ability of non-native species present
in the surrounding habitat that act as generalists (Harrison, 1999; Stolhgren et al., 1999; Stadler
et al., 2000). The increasing edge:area ratio also may increase the amount of fragmented habitat
that would support edge species (Saunders et al., 1991). However, we found no significant
relationship between the edge:area ratio of prairies and the species diversity and richness,
0
10
20
30
40
50
60
70
N NW MW SW SE S
Ab
un
da
nce
of
Inva
siv
e S
pec
ies
(%)
Prairie
AB AB AB
A A
B
21
implying that there is no effect of the amount of edge in a prairie on the species diversity and
richness.
Hypothesis 3: Distance from edge
Increased edge:area ratio increases the amount of fragmentation in prairies, thus reducing
the distance and area between edges (Saunders et al., 1991). Using this idea, it is possible that a
gradient of invasion along the distances going towards the center of a prairie may be present with
higher richness along the edges and lower richness towards the center, where the native species
would have an initial advantage until the encroaching generalist species spread far enough in.
Only one of the six prairies in our study showed a significant relationship between the distance
from the edge and species diversity (Northwest, Fig. 8b). Additionally, two of the prairies
showed a pattern opposite of that which we had expected (Midwest and Southeast; Figures 8c
and 8d, respectively). The North prairie was the only one to show the expected relationship in
species richness in regards to distance from the edge, whereas all others showed no consistent
trend and no significant differences between distances (Figure 9). Our results suggest that
distance from the edge has little to no effect on the species diversity or richness.
Native and Non-Native Species
Our data show that there is a significant difference between the average percentage of
non-native species between the Northwest and Southwest from the South, indicating that the
Northwest and Southwest have a much lower amount of non-native species present than the
South, while the remaining four prairies were not statistically different from any others (Figure
10). Both the Northwest and Southwest prairies have relatively low edge:area ratios, although the
North prairie has the lowest edge:area ratio. One explanation for this discrepancy may be that the
North prairie is relatively isolated from the rest of the prairies at PCCI and is surrounded by
forest rather than roads, fields, or other prairies. Being surrounded by forest could increase the
rate of introduction of non-native species despite a small edge:area ratio.
Another possible explanation for these results is that the North prairie has never been
successfully burned, while the Northwest was burned Spring 2009 and the Southwest was burned
Spring 2008. Having never been burned, the North may be experiencing suppression of tall
native grasses due to the old grasses covering much of the soil and suppressing new growth by
limiting light and nutrient availability, while the native grasses in the Northwest and Southwest
prairies have had access to abundant resources to grow and outcompete non-native species. The
22
South prairie has not been burned by Institute staff and it has a unique makeup relative to the
remaining five planted prairies and does not have the same management practices.
Conclusions
The amount of non-natives present in the prairies at PCCI are higher than the numbers
found in remnant prairies in the Midwest, determined by Heslinga and Grese (2010). In their
study, their site of interest (Dow Field) had 21.1% non-native species present (derived from the
reported 78.9% native species), a decidedly lower number than we encountered in most of our
sites. However, the Dow Field is a remnant prairie rather than manually planted, and it was
studied after 16 years of burning maintenance, much longer than that of the prairies at PCCI.
Noting this, it is possible that the native prairie species at PCCI will continue to improve
competitively as the prairies are maintained over time (Heslinga and Grese, 2010).
Our values for species diversity are lower than those recorded for Dow Field (Diversity =
2.57), though it is not much higher than that of the North prairie (Diversity = 2.41). Additionally,
our levels of species richness differ from that of Dow Field (73 species observed over 16 years),
which is much higher than what we observed, the highest being 41 in the North prairie (Table 2).
Again, the Dow Field was a remnant prairie that was introduced to burning maintenance 16 years
prior to the study, so the diversity differences are likely due to the difference in time allowing the
native species to become more dominant and less hidden by non-natives (Heslinga and Grese
2010).
According to our results, the prairies at PCCI are in good health relative to their sizes and
species composition. Our data show no significant impact of area on the species diversity or
richness, implying that there is no significant difference between the health of the smaller
prairies relative to the larger prairies. Our data also showed no significant impact of the
edge:area ratio on diversity or richness, which mean that the prairies are not being substantially
threatened by edge-encroaching and non-native species. Lastly, our data show little to no
significant impact of distance from the edge on the species diversity, concluding again that non-
native and edge-encroaching species are not threatening the prairies. The percent abundance of
non-native species does not differ at different distances from the edge, although the average
abundance of non-native species is significantly higher in the South prairie relative to all other
prairies; however, the South prairie was not planted and is not included in conservation practices
such as prescribed burns, which explains the overwhelming amount of non-native species present.
23
We believe additional surveys of the prairies would be necessary to conclude any conservation or
management concerns that may be developing in the five planted prairies, as species inventories
such as this may not detect the early signs of degradation (Kiviniemi and Eriksson, 2002).
Alternatively, there are at least two other explanations for our results. First, our sample
sizes were relatively small due to there only being six prairies available to be included in this
study. Given the relatively small size of the prairies, each had to count as a replication unit in
order to avoid pseudo-replication. Despite our small sample size, we had a reasonable statistical
power (range: 0.70 – 0.81) (Lenth, 2006-9) in our regression analyses; therefore we do not
believe that the results are strictly due to an insufficient sample size.
Secondly, many of the prairie grasses and flowers did not bloom until after our sampling
period ended. We began our fieldwork in early June and ended it in early August, whereas many
grasses and forbs do not tend to flower until mid- to late August. If we had been able to continue
sampling the prairies throughout August, we would likely have witnessed more species sprout
and bloom in our plots that were either flowerless or unidentifiable at the time of our fieldwork
or had not yet emerged at all. For example, upon returning to PCCI in mid-September we saw
distinct changes in the species composition of the prairies, which certainly would have had an
impact on our results if we had been sampling throughout the entire flowering season of the
prairies.
Acknowledgements
We would like to thank the Pierce Cedar Creek Institute and the Undergraduate Research
Grants for the Environment program for providing us with the funding and opportunity to
participate in this program and complete this research project. We would also like to thank Dr.
Bradley Swanson for his support and guidance throughout the planning and execution of this
project.
24
Literature Cited
Bruun, H. H. (2000). Patterns of species richness in dry grassland patches in an agricultural
landscape. Ecography, 23, 641 – 650.
Collins, S. L. (1987). Interaction of disturbances in tallgrass prairie: A field Experiment. Ecology,
68, 1243 - 1250.
Eriksson, A., Eriksson, O., & Berglund, H. (1995). Species abundance patterns of plants in
Swedish semi-natural pastures. Ecography, 18, 310 – 317.
Given, D. R. (1994). Principles and Practice of Plant Conservation (1st ed). London: Chapman
& Hall.
Harrison, S. (1999). Local and regional diversity in a patchy landscape: Native, alien, and
endemic herbs on serpentine. Ecology, 80, 70 – 80.
Heslinga, J. L., & Grese, R. E. (2010). Assessing plant community changes over sixteen years of
restoration in a remnant Michigan tallgrass prairie. American Midland Naturalist, 164,
322 - 336.
Hobbs, R. J., & Huenneke, L. F. (1992). Disturbance, diversity, and invasion: Implications for
conservation. Conservation Biology, 6, 324 - 337.
Howe, H. F. (1995). Succession and fire season in experimental prairie plantings. Ecology, 76,
1917 - 1925.
Kiviniemi, K., & Eriksson, O. (2002). Size-related deterioration of semi-natural grassland
fragments in Sweden. Diversity and Distributions, 8, 21 – 29.
Koper, N., Mozel, K. E., & Henderson, D. C. (2010). Recent declines in northern tall-grass
prairies and effects of patch structure on community persistence. Biological Conservation,
143, 220 - 229.
25
Krohne, D. T. (2001). General Ecology (2nd ed., instructor's ed.). Australia:
Brooks/Cole/Thomson Learning.
Lenth, R. V. (2006-9). Java Applets for Power and Sample Size [Computer software]. Retrieved
September 20, 2011, from http://www.stat.uiowa.edu/~rlenth/Power.
Roscher, C., Beßler, H., Oelmann, Y., Engels, C., Wilcke, W., & Schulze, E. (2009). Resources,
recruitment, limitation, and invader species identity determine pattern of spontaneous
invasion in experimental grasslands. Journal of Ecology, 97, 32 – 47.
Samson, F., & Knopf, F. (1994). Prairie conservation in North America. BioScience, 44, 418 -
421.
Saunders, D. A., Hobbs, R. J., & Margules., C. R. (1991). Biological consequences of ecosystem
fragmentation: A review. Conservation Biology, 5, 18 – 32.
Stadler, J., Trefflich, A., Klotz, S., & Brandl, R. (2000). Exotic plant species invade diversity
hot: The alien flora of northwestern Kenya. Ecography, 23, 169 – 176.
Stohlgren, T. J., Binkley, D., Chong, G. W., Kalkhan, M. A., Schell, L. D., Bull, K. A., Otsuki,
Y., Newman, G., Bashkin, M., & Son, Y. (1999). Exotic plant species invade hot spots of
native plant diversity. Ecological Monographs, 69, 25 – 46.
Vujnovic, K., Wein, R. W., & Dale, M. R. T. (2002). Predicting plant species diversity in
response to disturbance magnitude in grassland remnants of central Alberta. Canadian
Journal of Botany, 80, 504 - 511.
26
Appendix A. Prairie Species Lists
Note: This list includes correctly identified genus or species only.
* Denotes those species not found in study plots.
North Prairie
Big Bluestem (Andropogon gerardii)
Bird's Foot Trefoil (Lotus corniculatus)*
Black medick (Medicago lupulina)
Bull Thistle (Cirsium vulgare)
Canada Wild Rye (Elymus canadensis)*
Carolina Horsenettle (Solanum carolinense)
Common Burdock (Arctium minus)*
Common Cinquefoil (Potentilla simplex)
Common Dandelion (Taraxacum officinale)
Common Fleabane (Philadelphia fleabane)
Common Milkweed (Asclepias syriaca)
Common Mullein (Verbascum thapsus)
Common Plantain (Plantago major)
Common Ragweed (Ambrosia artemisiifolia)
Common Selfheal (Prunella vulgaris)
Common Yarrow (Achillea millefolium)*
Common Yellow Woodsorrel/Sourgrass (Oxalis stricta)
Curled Dock (Rumex crispus)
Dwarf Dandelion (Krigia virginica)
English Plantain (Plantago lanceolata)
Field Mustard/Turnip Mustard (Brassica rapa)
Goldenrod (Solidago spp.)
Gray Coneflower (Ratibida pinnata)*
Indian Grass (Sorghastrum nutans)*
Lance Leaf Coreopsis (Coreopsis lanceolata)*
Mouse-Ear Chickweed (Cerastium vulgatum)
Orchard Grass (Dactylis glomerata)
Oxeye Daisy (Leucanthemum vulgare)
Pennycress (Thlaspi arvense)
Purple Cone Flower (Echinacea purpurea)*
Quack Grass (Elymus repens)
Queen Anne's Lace (Daucus carota)
Rabbit Foot Clover (Trifolium arvense)*
Raspberry (Rubus spp.)
Red Clover (Trifolium pratense)
Rose (Rosa spp.)
Rough-Fruited Cinquefoil (Potentilla recta)
Sheep's Sorrel (Rumex acetosella)
Silvery Cinquefoil (Potentilla argentea)
Spring Speedwell (Veronica verna)
27
Switchgrass (Panicum virgatum)
Timothy (Phleum pratense)
Tower Mustard (Arabis glabra)
Unk Yellow (looks like cinquefoil)
White Avens (Geum canadense)
White Clover (Trifolium repens)
Wild Rye (Elymus spp.)
Northwest Prairie
Black-Eyed Susan (Rudbeckia hirta)
Butterfly Weed (Asclepias tuberosa)*
Chicory (Cichorium intybus)*
Common Dandelion (Taraxacum officinale)
Common Fleabane (Philadelphia fleabane)
Deptford Pink (Dianthus armeria)*
Goldenrod (Solidago spp.)
Oxeye Sunflower (Heliopsis helianthoides)
Raspberry (Rubus spp.)
Rough-Fruited Cinquefoil (Potentilla recta)
Wild Mint (Mentha arvensis)
Midwest Prairie
Big Bluestem (Andropogon gerardii)
Bottlebrush Grass (Elymus hystrix)*
Canada Bluegrass (Poa compressa)
Common Cinquefoil (Potentilla simplex)
Common Dandelion (Taraxacum officinale)
Common Fleabane (Philadelphia fleabane)
Common Ragweed (Ambrosia artemisiifolia)
Curled Dock (Rumex crispus)
Deptford Pink (Dianthus armeria)
English Plantain (Plantago lanceolata)
Field Hawkweed (Hieracium pratense)
Goldenrod (Solidago spp.)
Grey Coneflower (Ratibida pinnata)*
Meadow Fescue (Schedonorus pratensis)
Orchard Grass (Dactylis glomerata)
Oxeye Sunflower (Heliopsis helianthoides)
Path Rush (Juncus tenuis)
Quack Grass (Elymus repens)
Raspberry (Rubus spp.)
Redtop (Agrostis alba)
Rough-Fruited Cinquefoil (Potentilla recta)
Smooth Beardtongue (Penstemon digitalis)
Switchgrass (Panicum virgatum)
Timothy (Phleum pratense)
28
White Clover (Trifolium repens)
White Wild Indigo (Baptisia alba macrophylla)*
Wild Bergamot (Monarda fistulosa)*
Wild Blue Lupine (Lupinus perennis)*
Wild Rye (Elymus spp.)
Southwest Prairie
Big Bluestem (Andropogon gerardii)
Black-Eyed Susan (Rudbeckia hirta)
Canada Bluegrass (Poa compressa)
Carolina Horsenettle (Solanum carolinense)
Common Dandelion (Taraxacum officinale)
Common St. Johnswort (Hypericum perforatum)
Deer-Tongue Grass (Panicum clandestinum)
Field Mustard/Turnip Mustard (Brassica rapa)
Goldenrod (Solidago spp.)
Gray Coneflower (Ratibida pinnata)*
Indian Hemp (Apocynum cannabinum)
Little Bluestem (Schizachyrium scoparium)
Oxeye Sunflower (Heliopsis helianthoides)
Purple Coneflower (Echinacea purpurea)*
Raspberry (Rubus spp.)
Rough-Fruited Cinquefoil (Potentilla recta)
Switchgrass (Panicum virgatum)
Wild Bergamot (Monarda fistulosa)
Wild Mint (Mentha arvensis)
Southeast Prairie
Big Bluestem (Andropogon gerardii)
Black-Eyed Susan (Rudbeckia hirta)
Broom Sedge (Carex scoparia)
Bull Thistle (Cirsium vulgare)
Butterfly Weed (Asclepias tuberosa)*
Canada Bluegrass (Poa compressa)
Common Burdock (Arctium minus)*
Carolina Horsenettle (Solanum carolinense)
Common Dandelion (Taraxacum officinale)
Common Fleabane (Philadelphia fleabane)
Common Ragweed (Ambrosia artemisiifolia)
Cup Plant (Silphium perfoliatum)*
Curled Dock (Rumex crispus)
Deptford Pink (Dianthus armeria)
English Plantain (Plantago lanceolata)
Ebony Spleenwort (Asplenium platyneuron)
Field Hawkweed (Hieracium pratense)
Fox Sedge (Carex vulpinoidea)
29
Goldenrod (Solidago spp.)
Gray Coneflower (Ratibida pinnata)*
Mouse-Ear Chickweed (Cerastium vulgatum)
Oxeye Daisy (Leucanthemum vulgare)
Oxeye Sunflower (Heliopsis helianthoides)
Path Rush (Juncus tenuis)
Purple Loosestrife (Lythrum salicaria)*
Quack Grass (Elymus repens)
Queen Anne's Lace (Daucus carota)
Raspberry (Rubus spp.)
Red Clover (Trifolium pratense)
Redtop (Agrostis alba)
Rough-Fruited Cinquefoil (Potentilla recta)
Sheep's Sorrel (Rumex acetosella)
Smooth Beardtongue (Penstemon digitalis)
Smooth Brome (Bromus inermis)
Switchgrass (Panicum virgatum)
Timothy (Phleum pratense)
White Avens (Geum canadense)
White Clover (Trifolium repens)
Wild Bergamot (Monarda fistulosa)*
South Prairie
Canada Bluegrass (Poa compressa)
Common St. Johnswort (Hypericum perforatum)
Creeping Cinquefoil (Potentilla reptans)
Deer-Tongue Grass (Panicum clandestinum)
Dwarf Dandelion (Krigia virginica)
Field Hawkweed (Hieracium pratense)
Quack Grass (Elymus repens)
Raspberry/Blackberry (Rubus spp.)
Redtop (Agrostis alba)
Sheep's Sorrel (Rumex acetosella)
Spotted Knapweed (Centaurea maculosa)
Note: In all prairies except for the South, an additional 2-4 species were found that were unable to be identified due
to lack of flowers or discerning features. Said species were excluded from this list.