Embed Size (px)
Citation preview
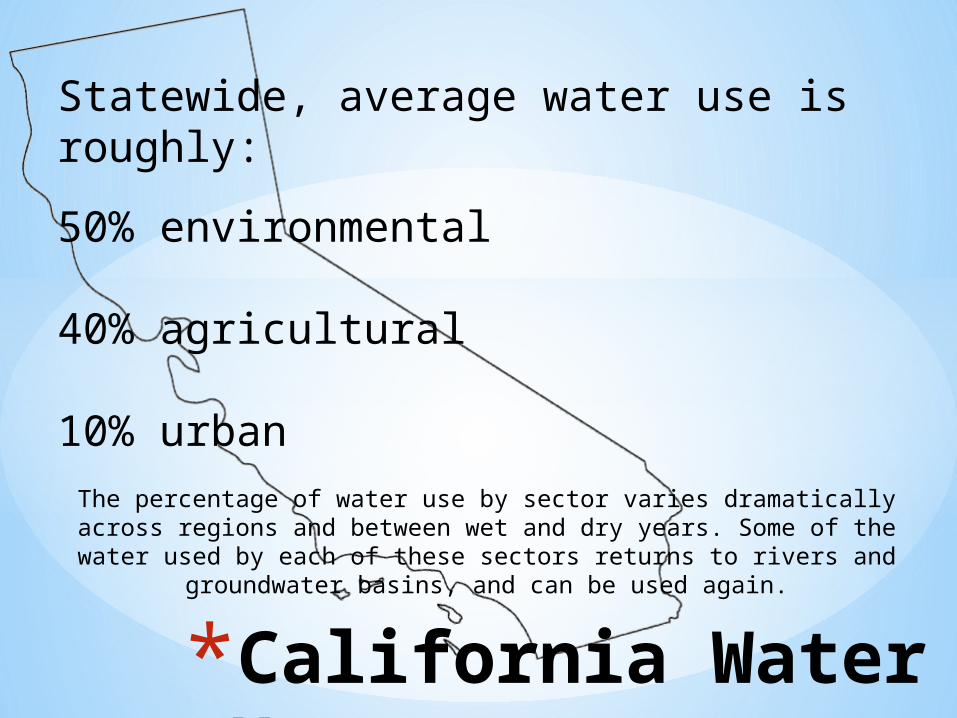
Statewide, average water use is roughly:
50% environmental
40% agricultural
10% urbanThe percentage of water use by sector varies dramatically across
regions and between wet and dry years. Some of the water used by each of these sectors returns to rivers and groundwater basins, and
can be used again.
*California Water Use
*Environmental Water Use
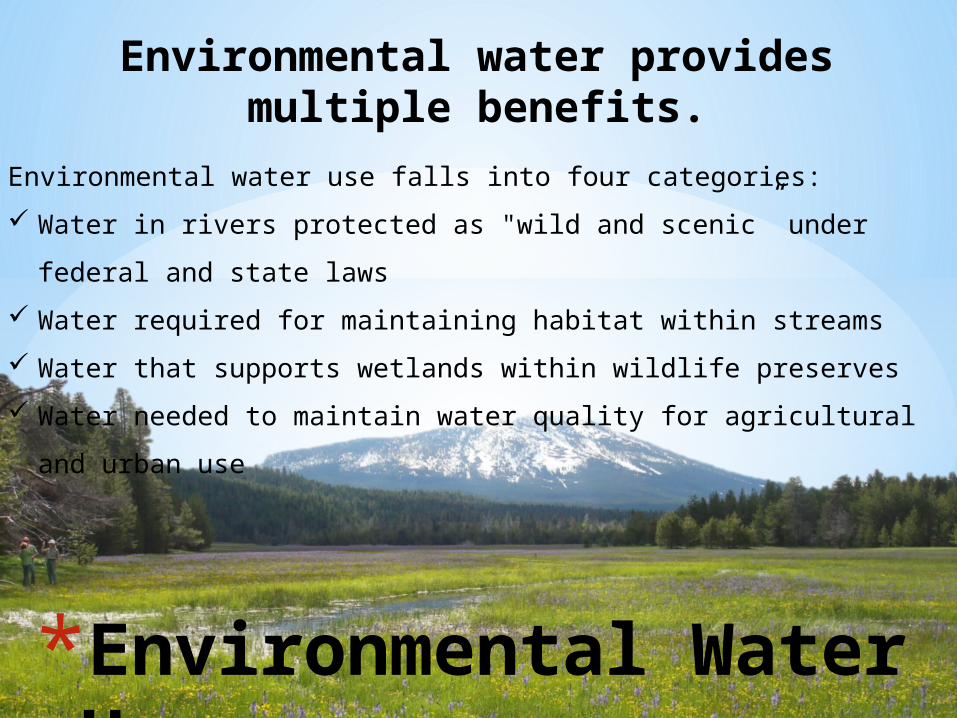
Environmental water provides multiple benefits.
Environmental water use falls into four categories:
Water in rivers protected as "wild and scenic” under federal and
state laws
Water required for maintaining habitat within streams
Water that supports wetlands within wildlife preserves
Water needed to maintain water quality for agricultural and urban
use
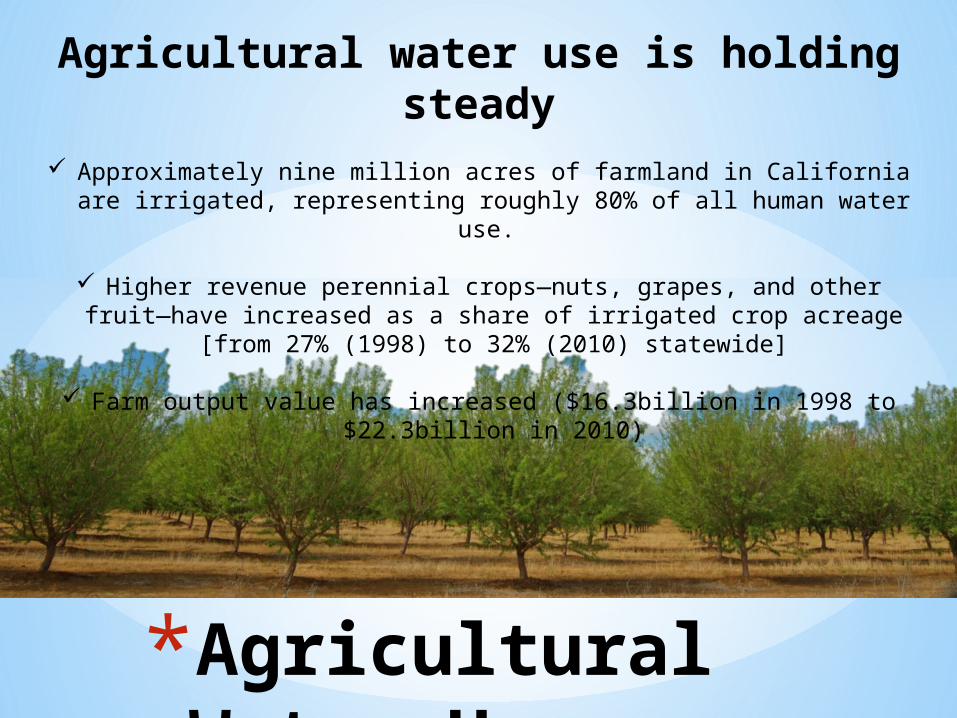
Agricultural water use is holding steady
Approximately nine million acres of farmland in California are irrigated, representing roughly 80% of all human water use.
Higher revenue perennial crops—nuts, grapes, and other fruit—have increased as a share of irrigated crop acreage [from 27% (1998) to
32% (2010) statewide]
Farm output value has increased ($16.3billion in 1998 to $22.3billion in 2010)
*Agricultural Water Use
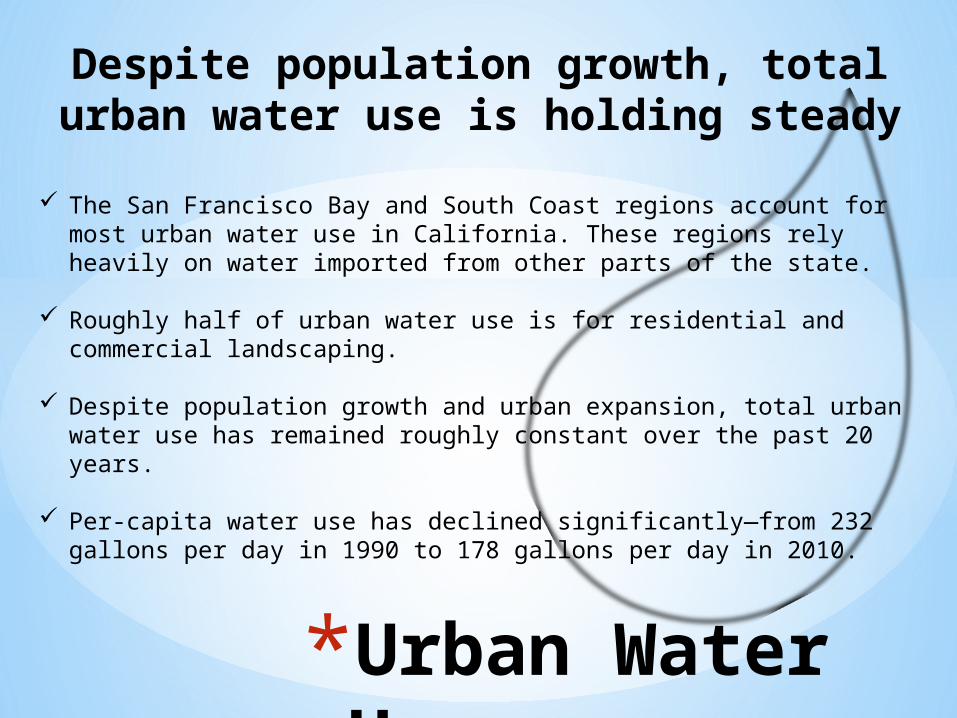
Despite population growth, total urban water use is holding steady
The San Francisco Bay and South Coast regions account for most urban water use in California. These regions rely heavily on water imported from other parts of the state.
Roughly half of urban water use is for residential and commercial landscaping.
Despite population growth and urban expansion, total urban water use has remained roughly constant over the past 20 years.
Per-capita water use has declined significantly—from 232 gallons per day in 1990 to 178 gallons per day in 2010.
*Urban Water Use
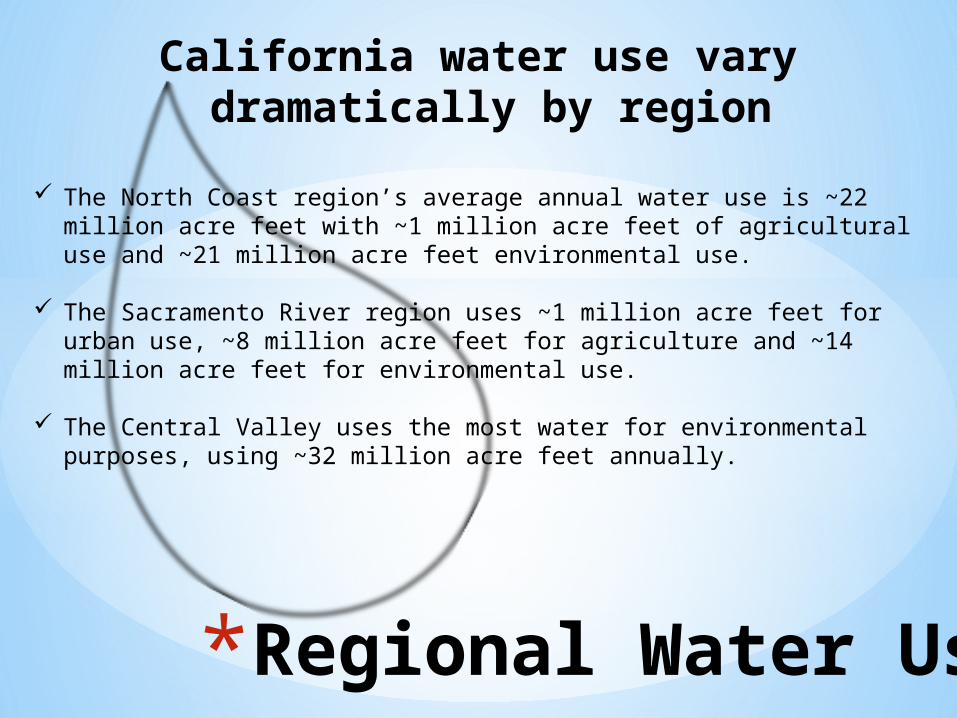
*Regional Water Uses
California water use vary dramatically by region
The North Coast region’s average annual water use is ~22 million acre feet with ~1 million acre feet of agricultural use and ~21 million acre feet environmental use.
The Sacramento River region uses ~1 million acre feet for urban use, ~8 million acre feet for agriculture and ~14 million acre feet for environmental use.
The Central Valley uses the most water for environmental purposes, using ~32 million acre feet annually.
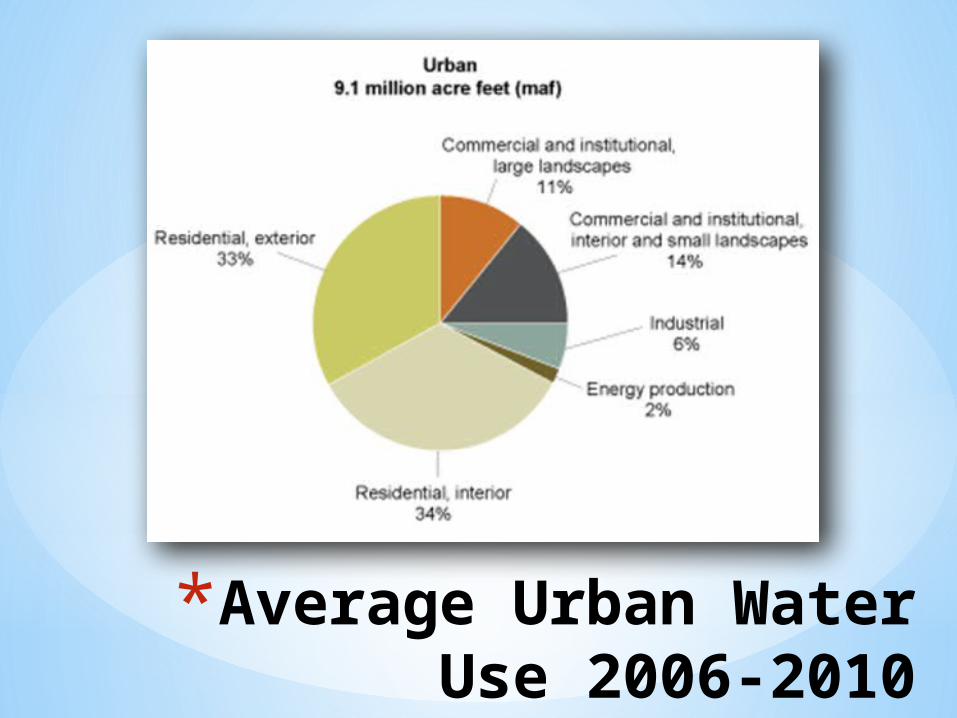
*Average Urban Water Use 2006-2010
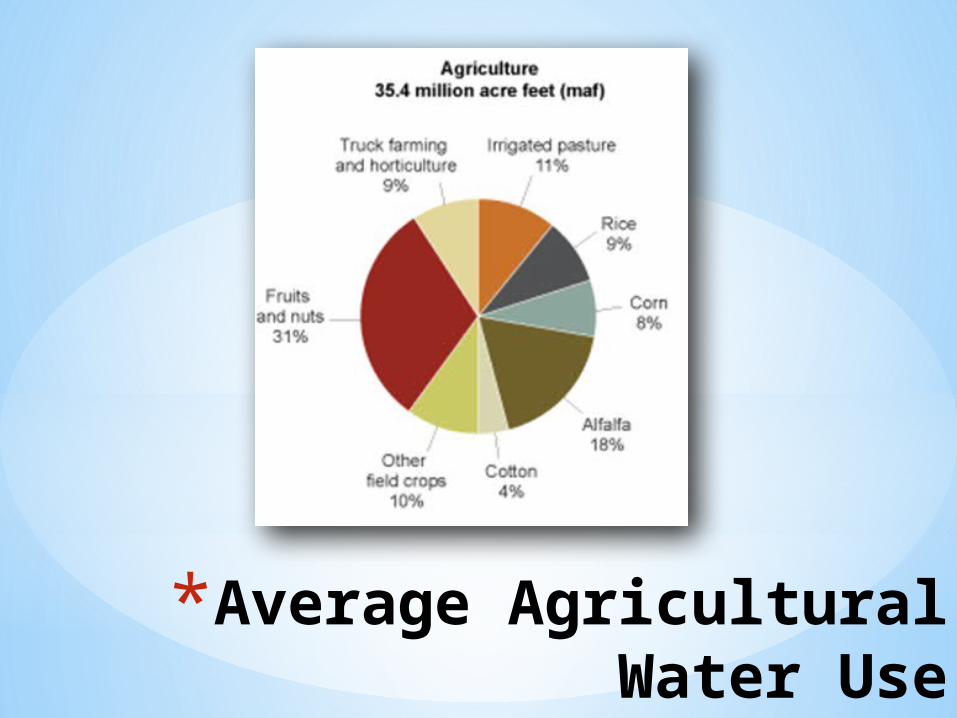
*Average Agricultural Water Use2006-2010
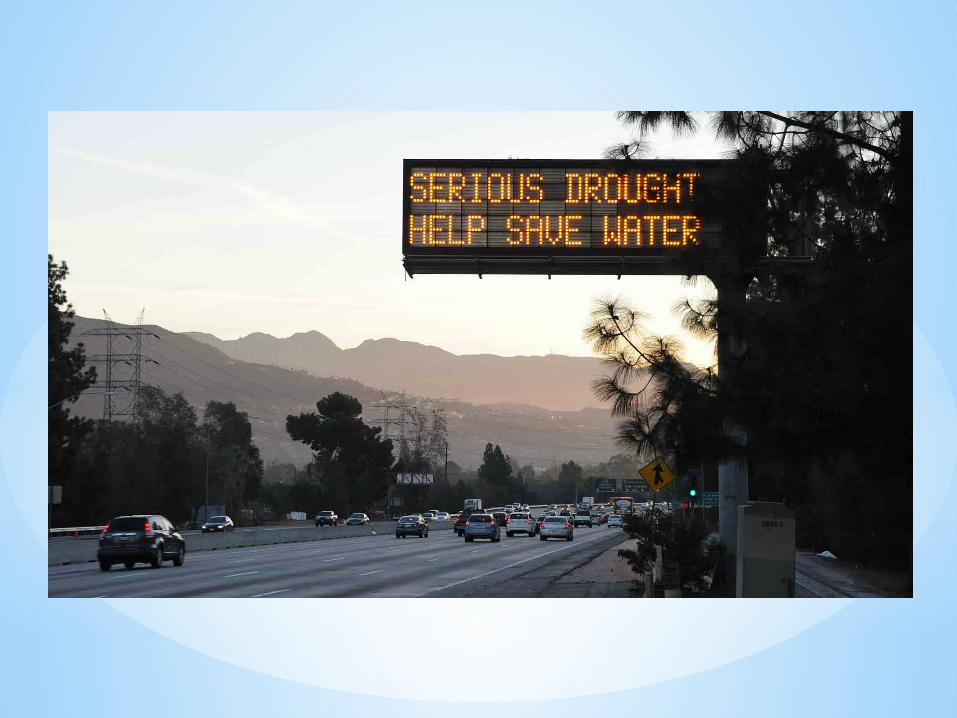
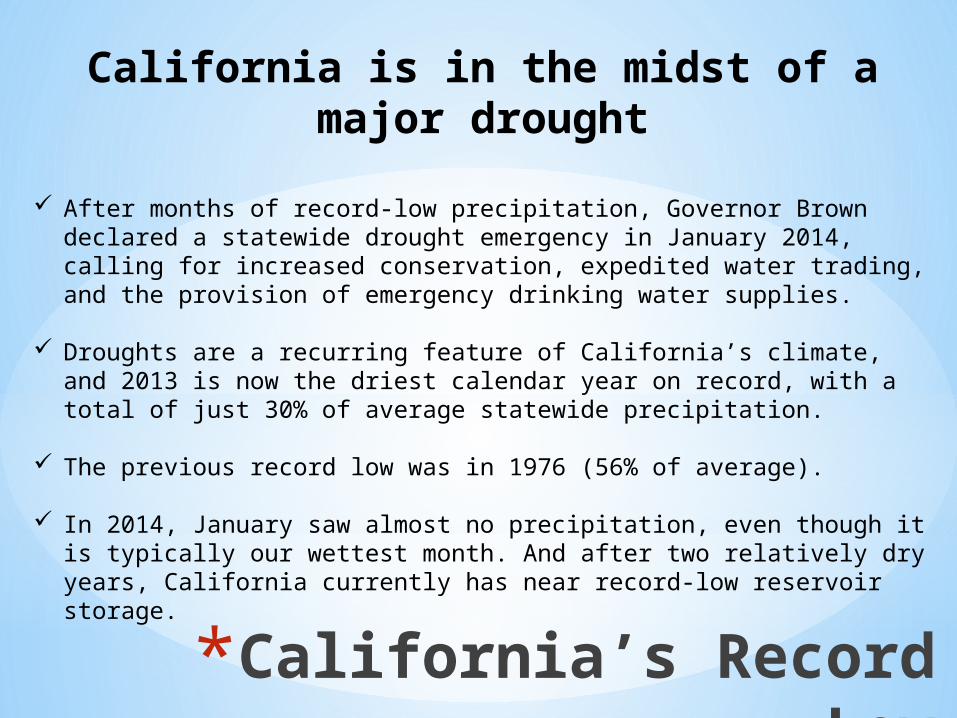
California is in the midst of a major drought
After months of record-low precipitation, Governor Brown declared a statewide drought emergency in January 2014, calling for increased conservation, expedited water trading, and the provision of emergency drinking water supplies.
Droughts are a recurring feature of California’s climate, and 2013 is now the driest calendar year on record, with a total of just 30% of average statewide precipitation.
The previous record low was in 1976 (56% of average).
In 2014, January saw almost no precipitation, even though it is typically our wettest month. And after two relatively dry years, California currently has near record-low reservoir storage.
*California’s Record Low
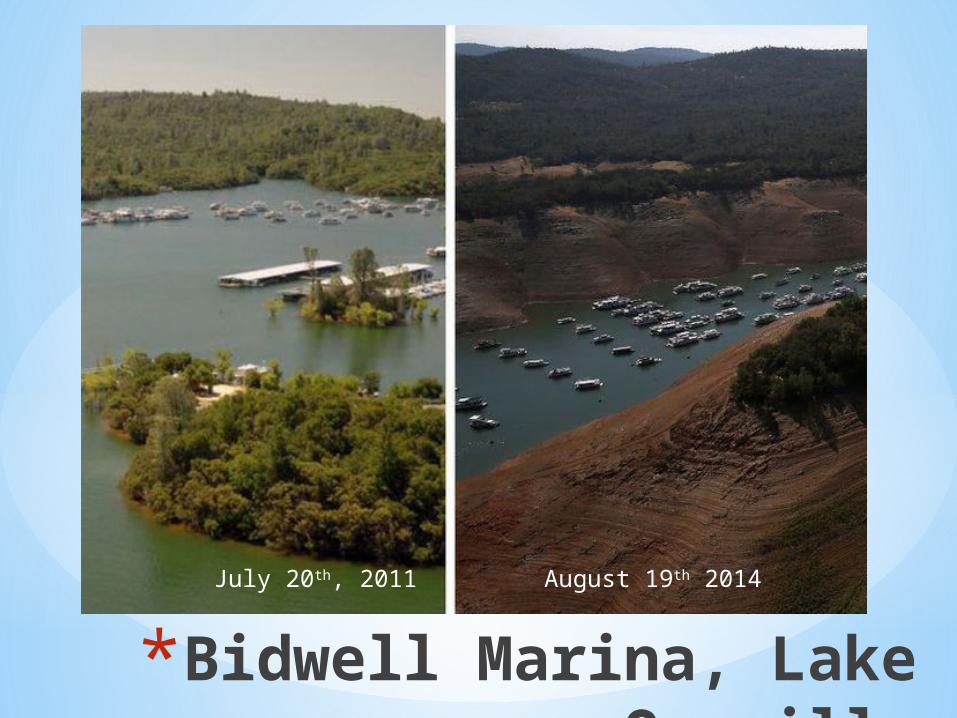
*Bidwell Marina, Lake Oroville
July 20th, 2011 August 19th 2014
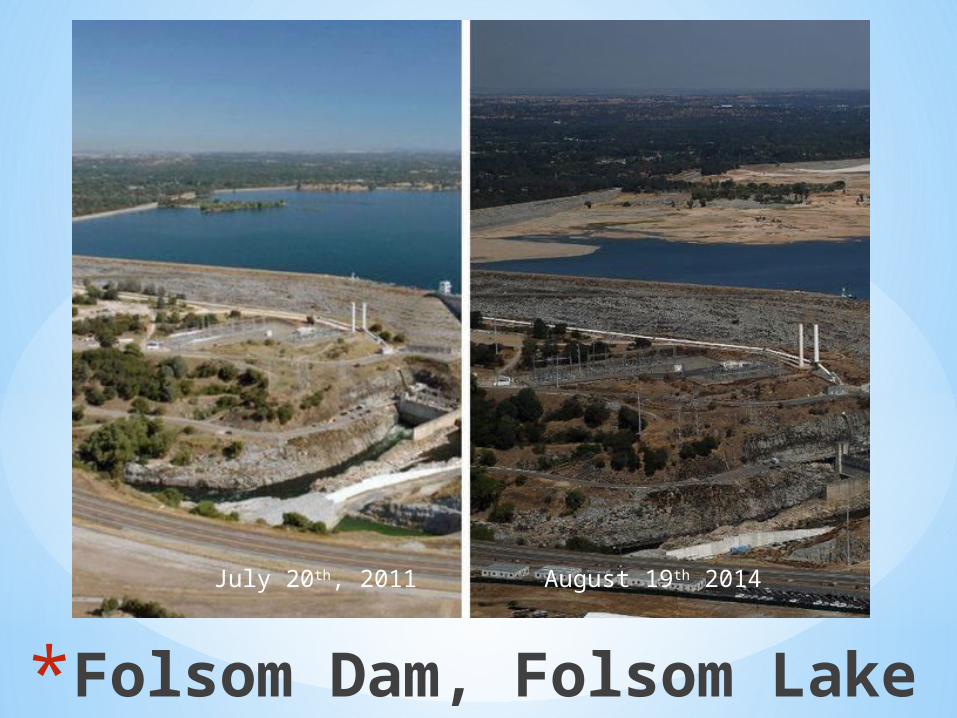
*Folsom Dam, Folsom Lake
July 20th, 2011 August 19th 2014
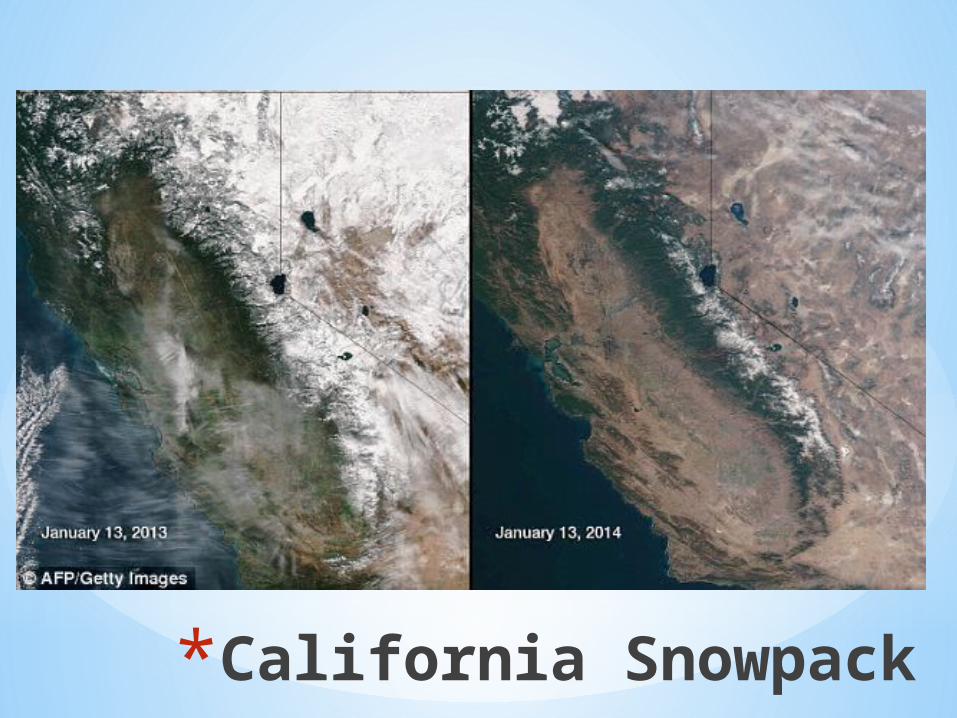
*California Snowpack