Embed Size (px)
Citation preview
STATEN ISLAND FERRY DECEMBER 2014
2
Foreword A team of graduate students from Columbia University’s Masters of Science in Sustainability Management (MSSM) program prepared this report for their capstone course. The MSSM program is cosponsored by the Earth Institute and the School of Continuing Education.
The capstone workshop is a client-based consulting project in which students address real life sustainability issues. The workshop is designed to integrate the program’s distinct curriculum areas, which include: integrative sustainability management; economics and quantitative analysis; physical dimensions of sustainability management; public policy; and general and financial management.
STATEN ISLAND FERRY DECEMBER 2014
3
Table of Contents 1. Executive Summary .......................................................................................................................................... 5
2. Introduction ...................................................................................................................................................... 7
2.1 Background: Staten Island Ferry ................................................................................................................ 7
2.2 Background: SIF LNG Conversion Proposal ................................................................................................ 7
3. Stakeholder Analysis ........................................................................................................................................ 8
3.1 Staten Island Ferry ...................................................................................................................................... 9
3.2 Residents ..................................................................................................................................................... 9
3.3 Regulatory Agencies.................................................................................................................................... 9
3.4 Vendors ....................................................................................................................................................... 9
3.5 Member Industry Associations ................................................................................................................... 9
4. Regulations ..................................................................................................................................................... 10
4.1 Federal Regulations .................................................................................................................................. 10
4.2 State Regulations ...................................................................................................................................... 11
4.3 Local Regulations ...................................................................................................................................... 12
4.4 Regulatory Risk ......................................................................................................................................... 12
5. Cost-Benefit Analysis ..................................................................................................................................... 14
5.1 Standing .................................................................................................................................................... 14
5.2 Assumptions .............................................................................................................................................. 15
5.3 Baseline Emissions .................................................................................................................................... 15
5.4 Breakdown of Costs .................................................................................................................................. 16
5.5 Breakdown of Benefits .............................................................................................................................. 18
5.6 Cost-Benefit Analysis Results .................................................................................................................... 19
5.7 Limitations ................................................................................................................................................ 19
6. Sensitivity Analysis ......................................................................................................................................... 19
6.1 Monte Carlo Simulation ............................................................................................................................ 20
6.2 Best-Worst Case Scenario ......................................................................................................................... 21
7. Other Costs and Benefits ............................................................................................................................... 22
7.1 Environmental ........................................................................................................................................... 22
7.2 Social ......................................................................................................................................................... 22
8. Other Decision Making Techniques ............................................................................................................... 23
9. Recommendation ........................................................................................................................................... 24
STATEN ISLAND FERRY DECEMBER 2014
4
Appendix ............................................................................................................................................................ 25
Appendix 1 ...................................................................................................................................................... 25
Appendix 2 ...................................................................................................................................................... 26
Appendix 3 ...................................................................................................................................................... 27
Appendix 4 ...................................................................................................................................................... 28
Appendix 5 ...................................................................................................................................................... 29
Appendix 6 ...................................................................................................................................................... 30
References .......................................................................................................................................................... 31
STATEN ISLAND FERRY DECEMBER 2014
5
1. Executive Summary The New York City Department of Transportation operates the Staten Island Ferry (“SIF”), transporting over twenty-two million passengers between Staten Island and Manhattan every year. The SIF’s foremost priority is to provide this service as safely and reliably as possible. As a part of city government, however, the Staten Island Ferry must also respond to near-term political and fiscal imperatives, and consider the longer-term legal, social, and environmental impacts of its actions and decisions, and their possible effects on city residents.
Currently, the SIF is facing the pressures of an aging fleet, escalating operating and capital expenses, and increasing scrutiny of its environmental performance. The current fleet of eight ferries includes one ferry that entered service in 1965, two that entered service in 1981, and two others that began service in 1986. The U.S. Environmental Protection Agency has imposed new marine fuel and engine emission standards, and the City of New York is pushing city agencies to lower carbon emissions and requiring SIF to increase service, all factors that will contribute to SIF’s rising costs.
In an effort to address these concerns, the management of SIF is considering transitioning its diesel-fueled fleet into ferries that run either mostly or completely on liquefied natural gas (“LNG”). Under this plan, SIF would retire the three oldest ferries, and would upgrade the five remaining ferries and three new builds, with LNG-fueled engines or conversion kits. LNG-fueled engines have been in use for many years in Norway, and are now being developed for more widespread use, most notably for Washington State Ferries, in order to meet growing restrictions on emissions of air pollutants and greenhouse gases. In addition, LNG-fueled engines not only reduce harmful exhaust emissions, but will enable SIF to take advantage of natural gas prices that are currently much lower than the price of the ultra-low sulfur diesel (“ULSD”) that SIF and most other U.S. ships must use.
To assess whether transitioning to a ferry fleet fueled predominantly with LNG will be the most cost-effective way to reduce emissions, SIF requested that students of the Columbia University M.S. in Sustainability Management program perform a comprehensive cost-benefit analysis (“CBA”) of the proposal. Unlike a conventional CBA, the comprehensive CBA that follows accounts not only for the direct financial costs and benefits of the LNG conversion proposal, but also integrates a quantitative and qualitative analysis of some of the associated social and environmental costs and benefits as well. That is, the CBA includes items that have easily identified prices, such as equipment, fuel, and training costs, as well as items that are not typically accounted for in a CBA, such as the health costs associated with certain air pollutants and the environmental risks associated with diesel and natural gas.
Specifically, the CBA that accompanies this report analyzes three options: a base case in which SIF continues to use ULSD as propulsion fuel (the “Diesel Option”); an option for fueling exclusively with LNG (the “LNG 100 Option”) or 90% LNG with 10% ULSD for a pilot ignition source (the “LNG 90/10 Option”); and a dual fuel option in which LNG constitutes around 65% and ULSD about 35% of the fuel the ferries consume, but with the option to use one fuel more than the other, depending on fuel prices (the “LNG 65/35 Option”). All three options would comply with current EPA emission standards.
The report that follows first examines the stakeholders and the legal context of SIF’s proposal. Then the report outlines the factors comprising the CBA and the process of establishing baseline emissions, determining capital and operating expenses, and pricing emissions reductions. The results of the CBA are that the Diesel Option, despite having the highest emissions, met EPA’s standards for the least cost.
To assess how the CBA results would vary with changes in key variables, the report also includes a sensitivity analysis using a Monte Carlo simulation. In developing the inputs for the CBA, the prices of fuel
STATEN ISLAND FERRY DECEMBER 2014
6
and of carbon dioxide emissions emerged as the variables with the most volatility and greatest uncertainty. After running the Monte Carlo simulation with these two variables, the Diesel Option still produced the highest net present value. Also, to test how the discount rate might affect the results of the CBA, the report includes the findings of a best-worst case scenario, in which the CBA is performed using a maximum discount rate of 7% and a minimum discount rate of 3%. Once again, applying the best-worst case scenario, the Diesel Option generated the most cost-efficient outcomes.
Finally, the report employs a second decision-making technique, a Decision Matrix Analysis, to weigh the three options. In contrast to a conventional CBA, which accounts only for the items that can be monetized, the Decision Matrix technique integrates qualitative factors into the decision-making process. To apply the Decision Matrix analysis here, eleven members of SIF’s management from various departments responded to surveys in which they prioritized different criteria corresponding to their level of importance. The criteria considered included: reliability, safety, regulatory risk, political risk, fuel price predictability, environmental performance, and overall cost. After scoring the three options on how well they satisfied each of the criteria, the Diesel Option again ranked highest.
STATEN ISLAND FERRY DECEMBER 2014
7
2. Introduction
2.1 Background: Staten Island Ferry
The Staten Island Ferry, which is operated by the New York City Department of Transportation (“NYC-DOT”), is the nation’s largest passenger-only ferry system, and is the key mass transit link between Staten Island and Manhattan. The SIF operates twenty-four hours per day, every day of the year, carrying about seventy thousand riders per weekday, and over twenty-two million passengers each year. The ferry makes the 5.2-mile, 22-minute run between the St. George Terminal in Staten Island and the Whitehall Terminal in Manhattan over 35,000 times annually (NYC Department of Transportation).
The SIF is a free service, funded primarily through the City of New York with additional funding from the federal and state governments. Its annual operating budget is over $100 million a year. The SIF fleet currently consists of eight diesel-powered ships. There are three “Molinari Class” ships (the Guy V. Molinari, the John J. Marchi, and the Spirit of America), which entered service in 2005-2006. Each is 310 feet long and 70 feet wide, and can carry 4,427 passengers with a crew of sixteen. There are also two “Barberi Class” ships (the Andrew J. Barberi and the Samuel I. Newhouse), which entered service in 1981-1982 and are about the same size as the Molinari Class boats. Each can carry 5,200 passengers with a crew of 15. There are also two smaller “Austen Class” ships (the Alice Austen and John A. Noble), that entered service in 1986. Each is 207 feet long and 40 feet wide, and can carry 1,107 passengers with a crew of nine. Finally, there is one remaining “Kennedy Class” ship in use, the John F. Kennedy, that began service in 1965, is 297 feet long, almost 70 feet wide, and can carry 3,055 passengers with a crew of thirteen (NYC Department of Transportation).
2.2 Background: SIF LNG Conversion Proposal
The purpose of this report is to analyze the quantitative and qualitative cost and benefit implications associated with the possibility of transitioning SIF’s current fleet of diesel-powered ships to a fleet powered mainly with liquefied natural gas (“LNG”). The SIF’s consideration of LNG arises from the confluence of three circumstances. First, the U.S. Environmental Protection Agency (“EPA”) has been phasing in increasingly stringent exhaust emissions standards for diesel engines using a tiered approach (Tiers 1 to 4) as a way to promote public health and welfare. Second, New York City, under both the current and former administrations of Bill DeBlasio and Michael Bloomberg, is committed to reducing carbon emissions and criteria air pollutants as a way to lower healthcare spending and improve the quality of life of New York City’s residents. Third, the advent of hydraulic fracturing combined with horizontal drilling (“fracking”) has dramatically increased the country’s domestic supply of natural gas, which has significantly lowered the cost of natural gas as a fuel source. Because natural gas is generally considered to be a much cleaner-burning fuel than diesel, SIF management perceived an opportunity, in converting its fleet to LNG, to lower the fleet’s emissions while substantially lowering its fuel costs. The SIF consumes between 60,000 and 70,000 gallons of ultra-low sulfur diesel fuel every week (NYC Department of Transportation) at a cost of $1.57 per gallon, so using LNG, which costs $0.92 for the equivalent amount of energy, could potentially reduce SIF’s operating expenses by a significant amount. However, it is not possible to make the decision to transition to LNG simply based on current fuel prices; fuel costs are highly volatile. In addition, there are also high capital costs associated with converting existing ships to LNG and designing and building new LNG vessels. The goal of this report, therefore, is to conduct a comprehensive CBA of the plan to transition the SIF fleet to LNG, which will take all of these factors into account.

STATEN ISLAND FERRY DECEMBER 2014
8
SIF has been investigating options to reduce harmful air emissions for several years. For example, SIF was part of a joint effort with the Port Authority of New York and New Jersey to offset nitrogen oxide (“NOx”) emissions from the Port Authority’s Harbor Deepening Project. In connection with that project, the SIF installed after-treatment devices, a Selective Catalytic Reduction system (“SCR”) and a Diesel Oxidation Catalyst, on the Alice Austen in late 2003 to 2004, and upgraded the engines on the Barberi, Kennedy, and Molinari Class engines to meet EPA Tiers 1 and 2 emissions limits. The SCR and DOC devices were so successful in reducing NOx and particulate matter (“PM”) emissions, that the SIF then installed the SCR and DOC on the John Noble in 2011 to 2012. In addition, as its first step in exploring the use of LNG as a fuel source, the SIF sought and received a $2.34 million grant from the U.S. Department of Transportation in 2011 to fund a pilot project converting the Alice Austen to LNG. That project is still in the planning stage. The CBA described in this report seeks to evaluate the relative merits of three further options to lower the harmful emissions and fuel costs of the rest of the SIF fleet, as well as any other potential economic, social and environmental risks or impacts:
Diesel Option – This is the baseline option and will be the option SIF implements if it decides not to convert any ferries other than the Alice Austen to LNG. In this option, SIF will design and build three new ships (the “New Build Class”), with EPA Tier 4-compliant after-treatment devices. The three New Builds will replace the Barbieri and Kennedy Class ships still in use now, which will then be retired. With this option, all ships in the SIF fleet will fuel with ULSD, which contains only 15 parts per million of sulfur.
LNG 100 Option or LNG 90/10 Option – Upgrading the engines on the John Noble and the three Molinari Class ships with direct injection conversion kits to enable the current engines to use 90% LNG as the primary fuel supply and 10% ULSD for the pilot ignition source; and installing on the three New Build Class vessels, either (a) 100% LNG-fueled spark injection engines, or (b) dual fuel (90% LNG, 10% ULSD), direct injection engines. These options also contemplate the installation of on-board LNG storage tanks and associated LNG systems and equipment, and anticipate fueling using either an LNG bunker barge, or an upgraded St. George fueling facility with LNG storage tanks and possibly a liquefaction plant to supplement stored LNG.
Dual Fuel 65/35 Option – Upgrading the engines on the John Noble and the Molinari Class vessels with the engine manufacturer’s gas blend dual fuel (65% LNG, 35% ULSD) conversion kits and after-treatment SCRs, and installing gas blend dual fuel engines with Tier 4 after-treatment devices on the New Build Class vessels. This option also includes installation of on-board LNG storage tanks, associated systems, and equipment, and anticipates fueling using either an LNG bunker barge, or an upgraded St. George fueling facility with LNG storage tanks and possibly a liquefaction plant to supplement stored LNG.
3. Stakeholder Analysis Identifying the stakeholders is the first step of the CBA. The stakeholders are those people or entities who will affect, be affected by, or who have any interest or involvement in the options the SIF is considering. The list of stakeholders includes federal, state and local governmental agencies, the SIF itself, its passengers and employees, certain NYC residents, various vendors, and two not-for-profit maritime industry member organizations.
STATEN ISLAND FERRY DECEMBER 2014
9
3.1 Staten Island Ferry
The SIF/NYC-DOT will obviously wield the greatest influence on and be affected the most by each of the three options, as it bears the financial and legal consequences associated with each option. The SIF employees, and possibly their unions, are also stakeholders because they may want to consider any health and safety implications associated with the SIF’s choice. Finally, SIF passengers will also have an interest in any perceived changes each option represents to their health, safety, or the quality of their ride.
3.2 Residents
Many NYC residents, particularly those living closest to the SIF ports, will be potentially affected by breathing any harmful emissions from the ferries, including residents of Staten Island, Manhattan, and Brooklyn. Residents near the St. George Terminal will also likely have an interest in the possible construction and use of LNG storage tanks and a liquefaction facility.
3.3 Regulatory Agencies
There are multiple governmental agencies that will be involved in the development and oversight of the standards and procedures necessary for the safe operation of the SIF if it converts its fleet to LNG or dual fuel engines. At the federal level, EPA and the U.S. Coast Guard provide much of the regulatory framework under which the SIF must operate. EPA sets many of the engine performance standards and other environmental standards for air and water quality with which the options will need to comply. The Coast Guard sets, certifies and enforces all of the standards related to the design, build, maintenance, repair, training, and safety for all marine passenger vessels. The U.S. Department of Transportation also provides funding for SIF projects and operations. At the state level, the Department of Environmental Conservation (“DEC”) will have to enact all of the regulations pertaining to the proposed permitting, siting, planning, building, and operation of LNG-related facilities such as the storage and liquefaction facilities that SIF is considering. At the local level, the Mayor’s office and the City Council have jurisdictional authority over the funding, operations and planning of the SIF, and the Fire Department of NYC will have to approve the transportation, safety and emergency response protocols for the transportation and handling of LNG.
3.4 Vendors
The engine manufacturers that design and build the equipment SIF needs for each option could have an interest in SIF’s choices. The fuel suppliers and the costs and logistics related to fueling under each option could also influence SIF’s choices.
3.5 Member Industry Associations
The SIF voluntarily complies with standards set by two different maritime industry member organizations, the American Bureau of Shipping (“ABS”) and the Passenger Vessel Association. Both of these organizations are actively involved in setting the technical and safety standards that guide the design, construction, and operational performance of marine vessels and equipment.
STATEN ISLAND FERRY DECEMBER 2014
10
4. Regulations There are several regulations at the federal, state and local levels that will govern SIF’s use of diesel or LNG as marine fuel and the exhaust emissions of its engines. These regulations in large part define the performance parameters for staff and equipment under each of the three options and the associated costs of meeting them.
4.1 Federal Regulations
At the federal level, SIF will need to adhere to the relevant regulations that the EPA, the U.S. Coast Guard (USCG), the U.S. Department of Transportation (USDOT), the Occupational Safety and Health Administration, and the Federal Energy Regulatory Commission (“FERC”) mandate and enforce (American Bureau of Shipping).1 Foremost among these regulations, and a key driver of SIF’s proposal to convert its fleet to LNG, are the regulations that the EPA has promulgated to advance the goals of the Clean Air Act.
4.1.1 EPA
Under the Clean Air Act, Congress required the EPA to establish national ambient air quality standards (“NAAQS”) for six “criteria” pollutants that can cause harm to health, property, and the environment when they accumulate in high enough concentrations: PM, NOx, ground level ozone (created by reactions between NOx and hydrocarbons, “HC”, in sunlight), sulfur dioxide (“SO2”), carbon monoxide (“CO”), and lead (EPA). In order to achieve or maintain those NAAQS, EPA compels each state to develop and submit enforceable State Implementation or Maintenance Plans (EPA). A geographic area with air quality that is cleaner than the standard is called an “attainment” area; areas that do not meet the standards are called “nonattainment” areas (EPA). As part of EPA’s strategy to help states minimize NAAQS and reach attainment, the EPA imposes limits on the quantity of criteria pollutants that mobile sources like the ferries can emit.
Specifically, since June of 2012, EPA has required Category 1 and Category 2 marine engines (all SIF ferries have Category 2 engines) to fuel with ULSD.2 EPA set this requirement both to reduce SO2 emissions, and to enable the use of the kind of after-treatment technology SIF has already installed on the Austen Class ships, SCR for NOx reduction, and DOC or particulate filters for PM reduction. In addition, this regulation phases in four tiers of increasingly strict engine exhaust pollutant limits for NOx, HC, PM, and CO (EPA). 3 The tier and standards that apply depend on the year the engine was certified, and the power and the displacement of the particular engine (EPA).4 The engine manufacturer is responsible for obtaining EPA certification. For engines that were new or remanufactured between 2009 and 2014, Tier 3 standards apply. For engines that are new or remanufactured between 2014 and 2017, Tier 4 standards, requiring the installation of after-treatment technology, apply. Under the current proposal, SIF plans for the New Build Class to meet Tier 4 standards. Under the Diesel Option, the Molinari Class vessels will meet Tier 2 1 While FERC is responsible for authorizing the siting and construction of onshore LNG facilities under Section 3 of the Natural Gas Act, those facilities have been LNG import or export terminals, which is not contemplated here. FERC may need to authorize the construction and operation of any connection to an interstate natural gas pipeline associated with SIF’s proposal for a liquefaction plant (DEC). 2 The standards for C3 engines (ocean-going vessels like cruise ships, container ships, tankers and bulk carriers with displacement > 30 liters per cylinder) are different and not relevant here. C3 engines must comply with standards set forth in an international treaty the U.S. ratified (Art. VI of MARPOL), which designates a North American Emission Control Area (“ECA”) extending 200 miles out from most U.S. coasts. For C3 engines, ULSD will be phased in beginning in 2015, and Tier III standards will begin to apply in 2016. There is no Tier IV. 3 See 40 CFR 1042, “Control of Emissions of Air Pollution From Locomotive Engines and Marine Compression-Ignition Engines Less Than 30 Liters per Cylinder.” The relevant sections are attached as Appendix 1. 4 These regulations apply to new marine diesel engines below 30 liters per cylinder displacement, or for existing engines above 600 kW (800 hp) that are “remanufactured,” defined as the removal and replacement of all cylinder liners, either during a single maintenance event or over a 5-year period, and take effect as soon as certified remanufacture systems are available.
STATEN ISLAND FERRY DECEMBER 2014
11
standards and the John Noble will meet Tier 3 standards. Under both LNG Options and the Dual Fuel 65/35 Option, SIF anticipates that the Molinari Class and the John Noble will meet Tier 4 standards.
4.1.2 USCG
The USCG sets, certifies, and enforces all aspects of the design, construction, operation (including staffing and training requirements), maintenance and repair of a passenger vessel throughout its life, with a particular focus on safety. Thus, the USCG must approve any retrofits of existing equipment, or purchase and installation of new equipment, that the SIF undertakes (Passenger Vessel Association ). The USCG is still developing LNG-specific regulations. In addition, the installation, operation, and maintenance of facilities that transfer LNG to and from marine vessels must be designed, built, and operated in accordance with applicable USCG regulations, also still being developed (Biblow); (American Bureau of Shipping).
To illustrate the process, Washington State Ferries (WSF), which is planning to convert part of its fleet to LNG, has been working with the USCG since 2011 on the conversion plan. In connection with that process, WSF developed a Waterways Suitability Assessment, consisting of Safety, Navigation, and Security Risk Assessments documenting conditions that could result in a release of LNG, and a Risk Management Plan that identified the best methods to prevent those conditions (Washington State Separtment of Transportation, Ferries Division). WSF also developed an LNG Operations Manual. The USCG completed its initial review of these documents in October 2014 and is currently holding a 60-day public comment period.
4.2 State Regulations
4.2.1 LNG Facilities
As part of both LNG and the Dual Fuel 65/35 Options, SIF plans to install LNG storage tanks with associated systems and equipment on the John Noble, the Molinari Class and the New Build Class, and is also considering constructing on-site gas storage and liquefaction facilities to supplement stored LNG bunker supplies between LNG deliveries. These plans are currently not feasible; there is a moratorium prohibiting new LNG facilities, including storage and conversion facilities, in New York City (DEC).5 This moratorium, which has been repeatedly extended every two years by the State legislature, most recently to April 1, 2015, would restrict SIF’s LNG refueling options. Without a liquefaction facility, SIF would need to fuel the ferries with LNG fuel truck deliveries from out-of-state sources, with a bunker barge, or by bunkering at a fixed facility located in another state (American Bureau of Shipping).
Even if the moratorium was lifted, however, SIF could not site, build or operate any LNG facility until the New York State DEC adopted regulations to govern LNG facilities (6 NYCRR Part 570), and SIF obtained permits for the facilities as set forth in those regulations. DEC just revised its proposed regulations, which are undergoing a public comment period until December 12, 2014 (DEC). Some of the regulations most pertinent to SIF are:
570.1(c)(9) defining a LNG facility as any structure or facility used to store LNG in a tank system, or other storage device or to convert LNG into natural gas;
5 More specifically, in response to a 1973 maintenance accident at an LNG facility on Staten Island, the Legislature enacted a statewide moratorium on new LNG facilities. This moratorium was lifted on April 1, 1999 for all locations except municipalities with a population of one million or more (i.e., NYC).
STATEN ISLAND FERRY DECEMBER 2014
12
570.2(b) requiring permit applications to include information about tank design and capacity; facility capacity, which is not to exceed 70,000 gallons; the expected sources of natural gas or LNG for the facility; the routes to be used to supply the facility; possible environmental impacts; the capability and preparedness of local fire departments who would respond to a release of LNG or fire; proof of liability insurance covering the proposed LNG operations; and the floodplains, land use and population data for the facility property and properties within one-half mile of it;
570.2(d) incorporating applicable (1) National Fire Protection Association (“NFPA”) provisions and (2) USCG provisions; (3) requiring applicant to pay for needed training, personnel, or equipment for local fire departments to respond to a release or fire involving LNG at the facility; and (4) requiring DEC to consider the physical, flammability, and explosivity characteristics of LNG, risks to persons and property in the area neighboring the facility, and risks from transportation accidents, when determining whether to issue a permit;
570.2(k) requiring a permit application fee of $1,000 for a facility with capacity greater than 10,000 gallons to 70,000 gallons, and recovery of all DEC costs of administration and enforcement;
570.3 requiring inspections, recordkeeping, and training of local fire department personnel;
570.4 prohibiting the intrastate transportation of LNG, and requiring compliance with all applicable State and federal rules for interstate transportation of LNG;
570.8 requiring reporting of spills; and
570.9 preserving the NYC moratorium
(DEC). DEC also notes that all individual permit applications must undergo full State Environmental Quality Review Act review (“SEQR”) (DEC).
4.2.2 SEQR
In New York State, most projects or activities proposed by a unit of local government, and all discretionary approvals (i.e., permits) from a State agency, require an environmental impact assessment under 6 NYCRR Part 617 SEQR (DEC). Here, SIF would have to complete an Environmental Assessment Form, determine the significance of the LNG conversion proposal’s environmental impacts, and then decide whether to prepare an Environmental Impact Statement and whether to hold a public hearing on the proposal.
4.3 Local Regulations
Reducing air pollution and greenhouse gases (“GHGs“) is one of the city’s top priorities. Decreasing emission levels from the SIF is consistent with the goals of PlaNYC, the city’s long-term sustainability agenda, to reduce the city’s GHGs by 30 percent before 2030, and by 80 percent before 2050, from 2005 levels. Air pollution is a major health concern in the five boroughs because it is linked to various adverse health effects, such as respiratory illness and heart disease (NYCDOT). PlaNYC requires that all city agencies plan to transition to clean-burning fuel.
4.4 Regulatory Risk
In evaluating which of the three options will create the most benefit at the least cost, the SIF will also need to consider whether there are potential future regulations that may make any of the options harder to comply with or more expensive.
STATEN ISLAND FERRY DECEMBER 2014
13
4.4.1 GHG Emissions Regulations
In the near-term, achieving EPA’s required reductions of NOx and PM is the biggest challenge. Over the long term, reducing GHGs such as carbon dioxide may prove to be another regulatory obstacle SIF will have to confront.6 It is difficult to predict which fuel option, ULSD or LNG, will make it easier to meet potential new GHG standards. LNG, which is composed almost entirely of methane, burns cleaner in terms of reducing NOx by 80%, and SOx and PM by nearly 100%, without major technology changes, and emits 20% less CO2 than diesel. This potential reduction of CO2, however, is simply based on LNG’s lower carbon content; it likely overstates the actual climate benefit of using natural gas once the emissions of CO2 and methane over LNG’s entire life cycle are taken into account. The extraction, processing, transport, storage and containment, delivery and use of LNG as fuel may make LNG’s cumulative GHG emissions higher than diesel (Lowell, Wang and Lutsey, Assessment of the Fuel Cycle Impact of Liquefied Natural Gas As Used in International Shipping); (Howarth, Santoro and Ingraffea). Moreover, methane has a global warming potential which is 25 times higher than CO2, and methane slip – methane left unburned during fuel combustion that exhausts into the atmosphere – is a main contributor to LNG’s overall GHG emissions (Laugen). And efforts to contain methane leaks, which occur at most stages of LNG’s life cycle, may increase the cost of LNG, as releasing methane to the atmosphere costs less than capturing it (Lowell, LNG as a Marine Fuel); (Nocera).
4.4.2 Fracking Regulations
Hydraulic fracturing, or hydrofracking (“fracking”) into unconventional natural gas resources has produced an abundant, low-price (compared to ULSD) domestic supply of natural gas and oil. Concerns over its environmental footprint, however, are also leading to increased regulatory scrutiny from EPA and states like Colorado and Pennsylvania, and outright bans in many localities of New York, Colorado, and even Texas (Krauss); (Snyder, Polson and Olson). New York State currently has a moratorium on fracking, issued as an executive order, while the State conducts health and environmental studies that address concerns related to fracking. These concerns include the risks fracking poses to water supplies, and the risks that the many toxic chemicals used in fracking pose to public health. DEC and the New York Department of Health are studying whether to allow fracking for natural gas, and if so, how to regulate it so as to protect public health and the environment. Even if the State of New York decides to allow fracking, individual municipalities have the right under their home rule powers to decide whether to allow or ban fracking within their town boundaries (Sadasivam). The various restrictions on fracking may start to impede access to recoverable shale deposits, reducing the potential supply and raising the price of domestic natural gas. Also, the expected increase in the medium term of LNG exports will likely help drive up demand for fracked gas (Regoli and Polley).
4.4.3 LNG Regulations
Because the use of LNG as a marine propulsion fuel is a new opportunity, a regulatory framework governing the storage, use and bunkering of marine LNG is only now starting to be developed, which creates a good deal of uncertainty about how costly and complex the required practices will ultimately be. As discussed above, there are no uniform federal regulations governing small marine LNG facilities or LNG-fueled vessels. The USCG, Occupational Safety and Health Administration, DOT, EPA, American Bureau of Shipping, and National Fire Protection Association are all developing the regulations that will
6 EPA does not currently have plans to introduce a Tier 5 limiting GHG emissions (Stout). Locally, NYC does not view ferries to be significant to plans to lower GHGs: “new ferries are not likely to have a significant effect on reducing New Yorker’s driving or carbon emission and so they were not quantified as part of the 80x50 reduction plan” (NYC Mayor's Office 83).
STATEN ISLAND FERRY DECEMBER 2014
14
apply to the planning, design, construction, operation, equipment, and training of personnel for LNG vessels and facilities (Kytomaa and Morrison). The potential state and local regulations that will govern LNG facilities have also not been finalized (Graykowski); (American Bureau of Shipping). DEC has proposed regulations to govern the safe siting, building and operation of new LNG facilities. But until DEC finalizes those regulations, the exact requirements remain uncertain (Trimarchi). In addition, until the moratorium on LNG facilities in NYC is lifted, it will be difficult to anticipate the local restrictions that may apply. Thus, the lack of definitive rules at this point may add a degree of uncertainty to the pricing of these items now and in the near future.
5. Cost-Benefit Analysis As part of NYC-DOT, a local governmental agency, the SIF must respond to regulatory pressure to reduce harmful exhaust emissions, and consider the environmental impacts of its decisions equally with social and economic factors (DEC). The regulatory pressures include those from EPA, PlaNYC, and prospective regulations to limit GHGs. Thus, this CBA is comprehensive and includes social and environmental costs and benefits, as well as economic ones. That is, this CBA attempts to account for social and environmental impacts that may arise from the three options that would not be monetized in a conventional CBA. The analysis begins by identifying the stakeholders with standing, then presents and analyzes the monetary values assigned to the costs and benefits associated with each option.
5.1 Standing
Stakeholders with standing are those who have costs and benefits that will be accounted for in a CBA. The stakeholders that have standing in this cost benefit analysis are the NYC-DOT, the SIF, SIF’s staff and passengers, and residents in certain areas of New York City.
The NYC-DOT operates the SIF, and must ensure that its operations do not harm marine life and the environment (New York City Department of Transportation). NYC-DOT is also responsible for managing the budget of the SIF.
The SIF is responsible for planning and implementing the proposed options, and SIF personnel have standing in this report as their safety and health may be directly affected by the option SIF chooses.
The 472,621 residents of Richmond County (Staten Island), the 1,626,159 residents of New York County (Manhattan), and the 2,592,149 residents of Kings County (Brooklyn) have standing, based on an extensive literature review and consultation with several experts in the field. Air pollution is primarily a local concern; therefore, the populations of these three counties, which are in closest proximity to the two ferry terminals, have standing. Many air quality assessment reports, including EPA valuations, also use county level analysis (Environmental Protection Agency). Furthermore, Staten Island residents account for roughly 58% of total ridership, followed by visitors, and then residents of other NYC boroughs totaling 6% of ridership (New York City Economic Development Corporation). Brooklyn was given standing as it is downwind of New York Harbor. Scientific evidence shows that pollutants incrementally affect downwind areas, and a recent EPA Value report states that regions downwind of marine ports might experience elevated levels of PM concentrations from diesel engines (Environmental Protection Agency).
Determining the areas that have standing is important as it provides a more accurate representation of the affected population. Income levels of the population are a determinant of health costs, which in turn impact the value of pollutants and emissions. This will be discussed further in Section 5.5.2, Appendix 4 and Appendix 5.
STATEN ISLAND FERRY DECEMBER 2014
15
5.2 Assumptions
For the purpose of this CBA, we have taken 3.4% to be the discount rate. This is the rate that the federal Office of Management and Budget recommends.
We have assumed that operation during peak hours will be split equally amongst all six large ferries (the three Molinari and the three New Build Class ferries), and that operation during off-peak hours will be split equally between the two Austen class ferries.
We assumed that environmental benefits have a growth rate of 2.55% based on a 24-year historical growth rate for income levels in Kings County, New York County, and Richmond County since 1989 (United States Census Bureau).
We also assumed that operating expenses will grow at 2.0%, which is the forecasted annual inflation rate over the next 30 years.
5.3 Baseline Emissions
To calculate baseline emissions, we assumed that current emissions are consistent with applicable EPA emission standards. Austen Class ferries have Tier 3-compliant engines, Molinari Class ferries have Tier 2-compliant engines, and the New Build Class ferries will have Tier 4-compliant engines. Baseline emissions are presented in the CBA spreadsheet tab entitled “Environmental Cost.”
To estimate quantities of HC, NOx, PM, CO, and SOx emissions, we followed equation 5.16 used in Carbon Footprinting for Ports Guidance Document, issued by the World Ports Climate Initiative (“WPCI”) and authored by Starcrest Consulting Group, LLC, a leading maritime consulting firm that has conducted emissions inventories for many ports, including the Port Authority of New York and New Jersey and the Port of Los Angeles. Their recommended formula to derive emissions specific to harbor craft is:
𝐸 = 𝐸𝐹 ∗ 𝑘𝑊 ∗ 𝐿𝐹 ∗ 𝐴𝐶𝑇
Where:
E = total emissions of a particular pollutant expressed in mass
EF = emission factor, defined as the amount of pollutant emitted per unit of time
kW = maximum rated horsepower of the engine
LF = load factor, defined as a dimensionless multiplier that corrects for the fact that the engines are not constantly operated at their maximum power rating
ACT = activity data expressed in units that correspond with EF
In the specific case of this study for SIF, the above inputs and sources are as follows:
EF g/kWh, based on EPA Emission Standards Reference Guide for Federal Marine Compression-Ignition (CI) Engines
kW kW, engine specifications and options outlined by SIF, converted from horsepower (HP) LF 0.42, from the California default values used by CARB ACT hours, modeled using the SIF published schedule
STATEN ISLAND FERRY DECEMBER 2014
16
To estimate emissions of the GHGs CO2, N20, and CH4, we relied on formula 5.15 recommended in Carbon Footprinting for Ports Guidance Document for harbor craft:
𝐸 = 𝐸𝐹 ∗ 𝐴𝐶𝑇
E = total emissions of a particular greenhouse gas expressed in mass
EF = emission factor, defined as the amount of pollutant emitted per unit of time
ACT = activity data expressed in units that correspond with EF.
In the specific case of this study for SIF, the above inputs and sources are as follows:
EF CARB or EPA greenhouse gas emission factors expressed in grams of pollutant per gallon of fuel consumed by engines, per WPCI guidance
ACT Gallons of fuel consumed obtained from SIF
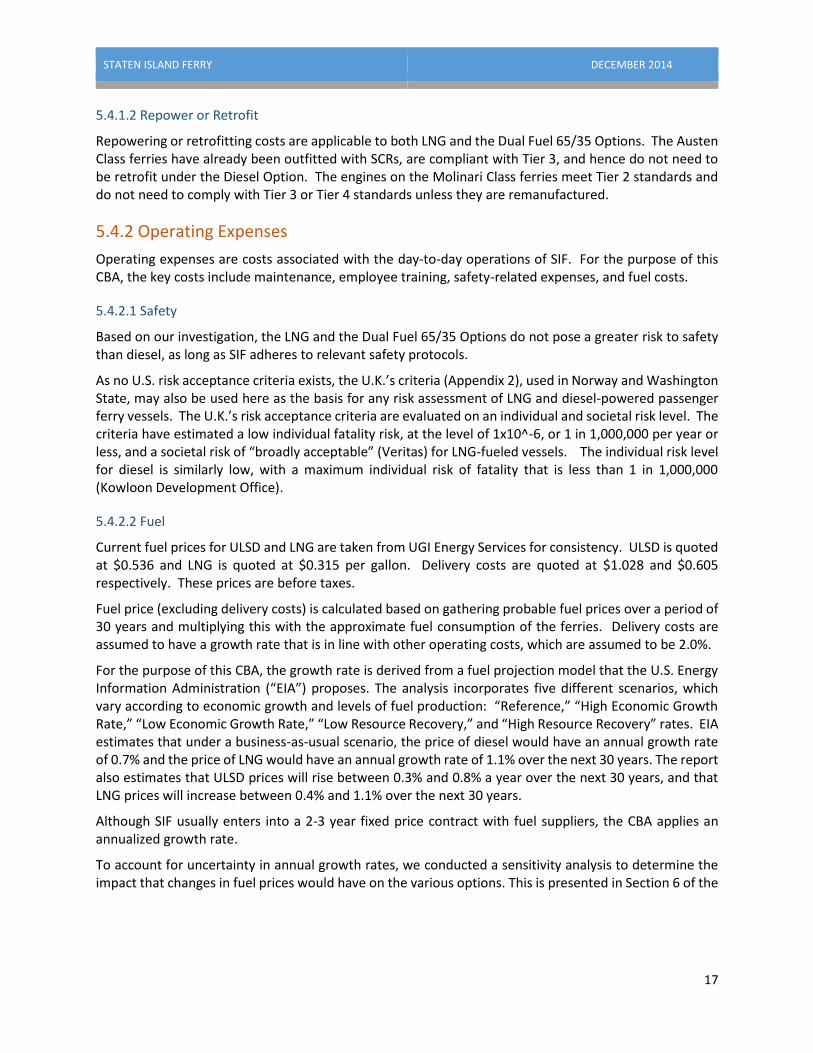
Using the above formulas, the estimated baseline emissions annually in metric tons, are as follows:
Table 1:
Class HC+NOx PM2.5 CO SO2 CO2
Austen 5.87 0.13 4.74 0.94 1029
Molinari 189.25 6.55 121.32 20.79 22,642
New Build 30.18 0.61 75.82 17.01 18,525
Total 225.30 7.29 201.88 38.74 42,196
5.4 Breakdown of Costs
The costs associated with each option have been divided into capital expenditures and operating expenses. Capital expenditures are those related to the construction of ferries and retrofit of engines. Operating expenses are those that relate to maintenance, employee training in the safe operation and maintenance of equipment, and fuel consumption. These costs are calculated based on information received directly from SIF, as well as estimates from the EPA and EIA.
5.4.1 Capital Expenditures
Capital expenditures are costs associated with acquiring or upgrading physical assets. These costs can typically be depreciated over the useful life of the asset.
5.4.1.1 New Construction
SIF is set to commission the construction of three new ferries. The cost of the engines and the onboard fuel tanks are what largely account for the difference in price among the three options. The construction cost of the hull and the superstructure is not expected to differ much among the different options. Pricing information for constructing new LNG facilities is not available at this time. SIF may add the relevant inputs to the CBA when that information becomes available.
STATEN ISLAND FERRY DECEMBER 2014
17
5.4.1.2 Repower or Retrofit
Repowering or retrofitting costs are applicable to both LNG and the Dual Fuel 65/35 Options. The Austen Class ferries have already been outfitted with SCRs, are compliant with Tier 3, and hence do not need to be retrofit under the Diesel Option. The engines on the Molinari Class ferries meet Tier 2 standards and do not need to comply with Tier 3 or Tier 4 standards unless they are remanufactured.
5.4.2 Operating Expenses
Operating expenses are costs associated with the day-to-day operations of SIF. For the purpose of this CBA, the key costs include maintenance, employee training, safety-related expenses, and fuel costs.
5.4.2.1 Safety
Based on our investigation, the LNG and the Dual Fuel 65/35 Options do not pose a greater risk to safety than diesel, as long as SIF adheres to relevant safety protocols.
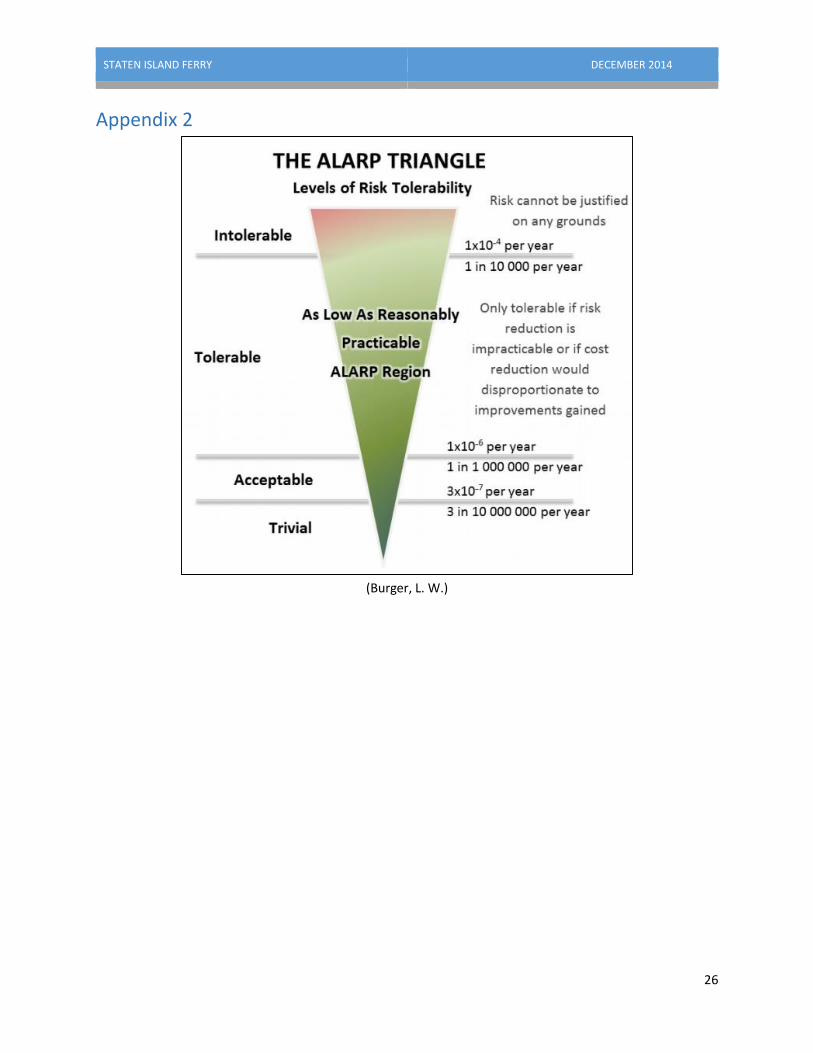
As no U.S. risk acceptance criteria exists, the U.K.’s criteria (Appendix 2), used in Norway and Washington State, may also be used here as the basis for any risk assessment of LNG and diesel-powered passenger ferry vessels. The U.K.’s risk acceptance criteria are evaluated on an individual and societal risk level. The criteria have estimated a low individual fatality risk, at the level of 1x10^-6, or 1 in 1,000,000 per year or less, and a societal risk of “broadly acceptable” (Veritas) for LNG-fueled vessels. The individual risk level for diesel is similarly low, with a maximum individual risk of fatality that is less than 1 in 1,000,000 (Kowloon Development Office).
5.4.2.2 Fuel
Current fuel prices for ULSD and LNG are taken from UGI Energy Services for consistency. ULSD is quoted at $0.536 and LNG is quoted at $0.315 per gallon. Delivery costs are quoted at $1.028 and $0.605 respectively. These prices are before taxes.
Fuel price (excluding delivery costs) is calculated based on gathering probable fuel prices over a period of 30 years and multiplying this with the approximate fuel consumption of the ferries. Delivery costs are assumed to have a growth rate that is in line with other operating costs, which are assumed to be 2.0%.
For the purpose of this CBA, the growth rate is derived from a fuel projection model that the U.S. Energy Information Administration (“EIA”) proposes. The analysis incorporates five different scenarios, which vary according to economic growth and levels of fuel production: “Reference,” “High Economic Growth Rate,” “Low Economic Growth Rate,” “Low Resource Recovery,” and “High Resource Recovery” rates. EIA estimates that under a business-as-usual scenario, the price of diesel would have an annual growth rate of 0.7% and the price of LNG would have an annual growth rate of 1.1% over the next 30 years. The report also estimates that ULSD prices will rise between 0.3% and 0.8% a year over the next 30 years, and that LNG prices will increase between 0.4% and 1.1% over the next 30 years.
Although SIF usually enters into a 2-3 year fixed price contract with fuel suppliers, the CBA applies an annualized growth rate.
To account for uncertainty in annual growth rates, we conducted a sensitivity analysis to determine the impact that changes in fuel prices would have on the various options. This is presented in Section 6 of the
STATEN ISLAND FERRY DECEMBER 2014
18
report. Because of SIF’s multi-year fixed price contract with suppliers, we have disregarded any short-dated7 volatility in fuel forecasting.
Please see Appendix 3 for a more detailed explanation.
5.5 Breakdown of Benefits
In this CBA, the benefits are derived from reductions in pollutant levels and the incremental health and environmental improvements that result from improved air quality. We have chosen to use the social costs, rather than market prices, for each pollutant. Social cost reflects the total impact of pollution on society, including environmental and health effects, which are significant to many of the stakeholders. It has been shown in previous studies that emissions are associated with respiratory illnesses, cardiovascular disease, increased mortality and hospitalization rates. Furthermore, studies have shown that this problem is further exacerbated in densely populated areas (Kazuhiko Ito).
5.5.1 Emissions Reduced
To calculate the total benefits from the various options, we have to first calculate the reductions in emissions associated with each option. Reductions in emissions were determined by taking baseline emissions as presented in Section 5.3, Table 1, and subtracting the projected emissions from each of the options.
Projected emissions calculated for each of the options are based on the emissions factors of the fuel (USLD or LNG) and compliance with EPA standards.
The emissions reductions in metric tons for each option are as follows:
Table 2:
Pollutant HC + NOx PM2.5 CO SO2 CO2
Diesel Option (Baseline) 0 0 0 0 0
LNG 100 Option 159.71 5.97 37.08 38.74 10,958.51
LNG 90/10 Option 42.81 3.25 0.00 34.91 9,985.80
Dual Fuel 65/35 Option 42.81 3.25 0.00 13.86 4,330.82
5.5.2 Health and Environmental Benefits
Using the amount of emissions reduced from Table 2 in the section above, we multiplied the emissions reduced with the social costs of each pollutant to arrive at the total benefits from emissions reductions.
The social costs of each pollutant have been gathered from peer-reviewed academic studies or government-backed studies (Yohe); (Muller and Mendelsohn); (H. Scott Matthews). An average was taken and outliers were removed if more than one source was found. Table 3 shows the social costs of each pollutant. For a more detailed analysis on how the social cost of each pollutant was determined, refer to Appendix 4 and Appendix 5 of this report.
Table 3:
Pollutant SO2 NOx PM2.5 CO2 CO
Cost ($) 2003.26 400.65 4407.17 43 750.96
7 Short-dated volatility refers to intra-day, weekly or monthly price movements of the underlying commodity.
STATEN ISLAND FERRY DECEMBER 2014
19
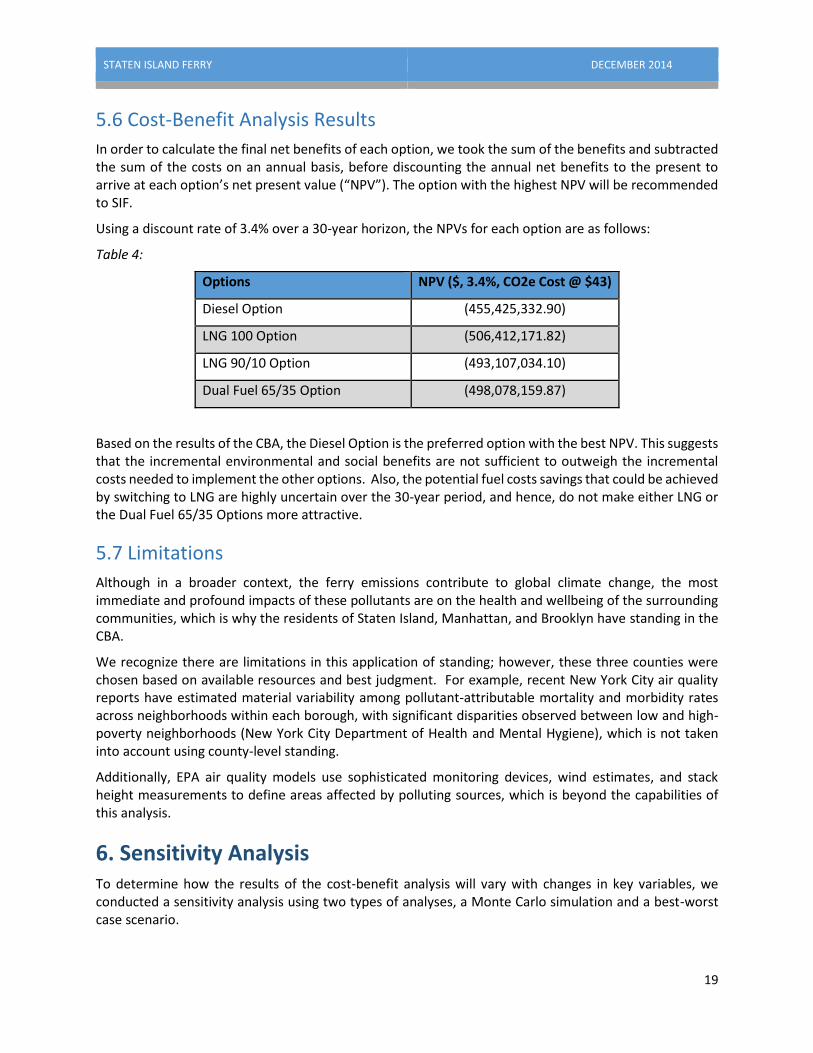
5.6 Cost-Benefit Analysis Results
In order to calculate the final net benefits of each option, we took the sum of the benefits and subtracted the sum of the costs on an annual basis, before discounting the annual net benefits to the present to arrive at each option’s net present value (“NPV”). The option with the highest NPV will be recommended to SIF.
Using a discount rate of 3.4% over a 30-year horizon, the NPVs for each option are as follows:
Table 4:
Options NPV ($, 3.4%, CO2e Cost @ $43)
Diesel Option (455,425,332.90)
LNG 100 Option (506,412,171.82)
LNG 90/10 Option (493,107,034.10)
Dual Fuel 65/35 Option (498,078,159.87)
Based on the results of the CBA, the Diesel Option is the preferred option with the best NPV. This suggests that the incremental environmental and social benefits are not sufficient to outweigh the incremental costs needed to implement the other options. Also, the potential fuel costs savings that could be achieved by switching to LNG are highly uncertain over the 30-year period, and hence, do not make either LNG or the Dual Fuel 65/35 Options more attractive.
5.7 Limitations
Although in a broader context, the ferry emissions contribute to global climate change, the most immediate and profound impacts of these pollutants are on the health and wellbeing of the surrounding communities, which is why the residents of Staten Island, Manhattan, and Brooklyn have standing in the CBA.
We recognize there are limitations in this application of standing; however, these three counties were chosen based on available resources and best judgment. For example, recent New York City air quality reports have estimated material variability among pollutant-attributable mortality and morbidity rates across neighborhoods within each borough, with significant disparities observed between low and high-poverty neighborhoods (New York City Department of Health and Mental Hygiene), which is not taken into account using county-level standing.
Additionally, EPA air quality models use sophisticated monitoring devices, wind estimates, and stack height measurements to define areas affected by polluting sources, which is beyond the capabilities of this analysis.
6. Sensitivity Analysis To determine how the results of the cost-benefit analysis will vary with changes in key variables, we conducted a sensitivity analysis using two types of analyses, a Monte Carlo simulation and a best-worst case scenario.
STATEN ISLAND FERRY DECEMBER 2014
20
6.1 Monte Carlo Simulation
One key limitation of a CBA is that it is highly improbable for any growth rate, price or parameter to remain constant throughout the 30-year period. The Monte Carlo simulation is able to address this limitation by random sampling and taking the average (mean) of the CBA model iterations. The Monte Carlo simulation uses repeated random samplings of variables to approximate the probability of certain outcomes. For this analysis, we ran 1000 iterations of the model.
6.1.1 Key Variables in Monte Carlo Simulation
The key variables in the Monte Carlo analysis are fuel cost and carbon cost.
6.1.1.1 Fuel Cost
Fuel cost is a key variable as it can determine which engine type delivers greater fuel costs savings over the 30-year-period, thereby reducing overall operating costs. Fuel cost is highly variable, and based on information that we received from SIF, SIF spends over 36 million dollars annually on fuel. This is a significant proportion of SIF’s annual operating costs; hence, variation in its growth rate over the 30 years should be examined.
Fuel price is included in the Monte Carlo Analysis because LNG prices and ULSD prices fluctuate over time and it is impossible to predict future prices because of different uncertainties levels. Vast variation of fuel prices significantly affects costs and benefits of both LNG and USLD.
We assumed that fuel prices followed a uniform distribution bounded by the upper and lower growth rate scenarios. We assumed that ULSD prices will rise between 0.3% and 0.8% a year and LNG prices will increase between 0.4% and 1.1% over the next 30 years. We also assumed a uniform distribution as there was no evidence to suggest that fuel price followed other statistical distributions. Hence, we assumed that all growth rates between the upper and lower bounds had an equal probability of occurring.
6.1.1.2 Carbon Cost
Our research indicated that of all of the air pollutants, the cost of CO2 had the highest variance. Also, of all of the pollutants, CO2 emissions were the highest, and more than 100 times greater than all of the other pollutants combined. Thus, we included CO2 cost as a parameter in the Monte Carlo Analysis.
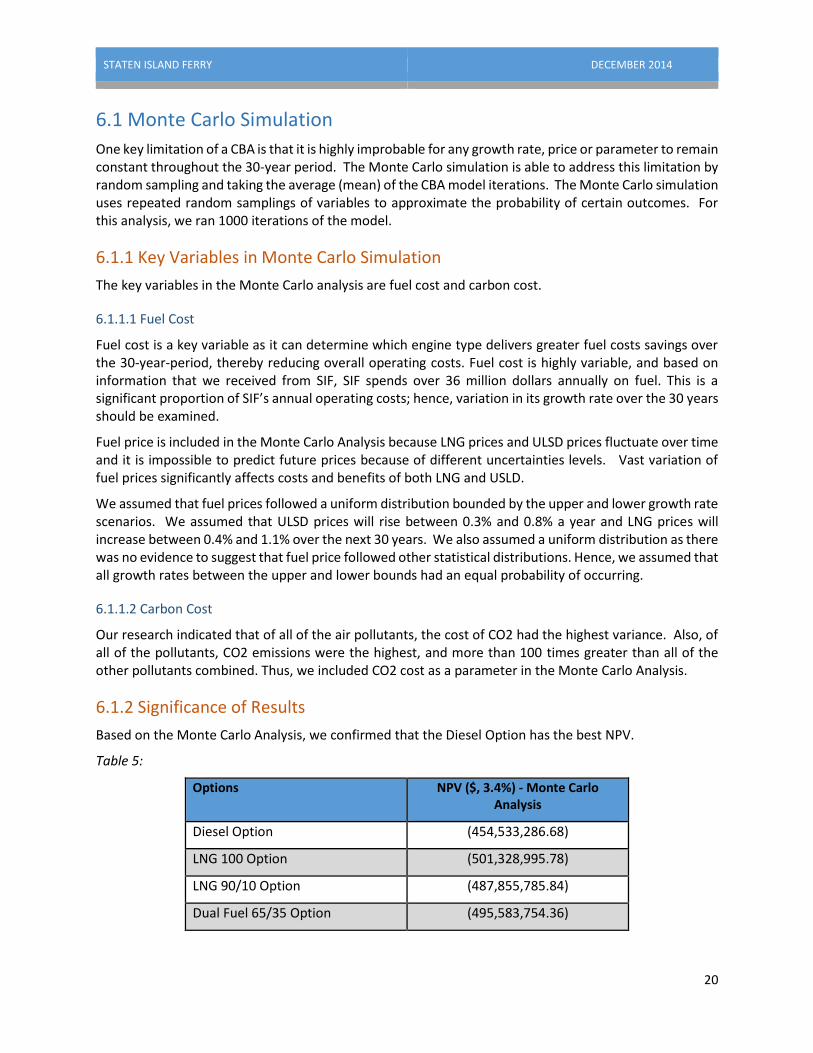
6.1.2 Significance of Results
Based on the Monte Carlo Analysis, we confirmed that the Diesel Option has the best NPV.
Table 5:
Options NPV ($, 3.4%) - Monte Carlo Analysis
Diesel Option (454,533,286.68)
LNG 100 Option (501,328,995.78)
LNG 90/10 Option (487,855,785.84)
Dual Fuel 65/35 Option (495,583,754.36)
STATEN ISLAND FERRY DECEMBER 2014
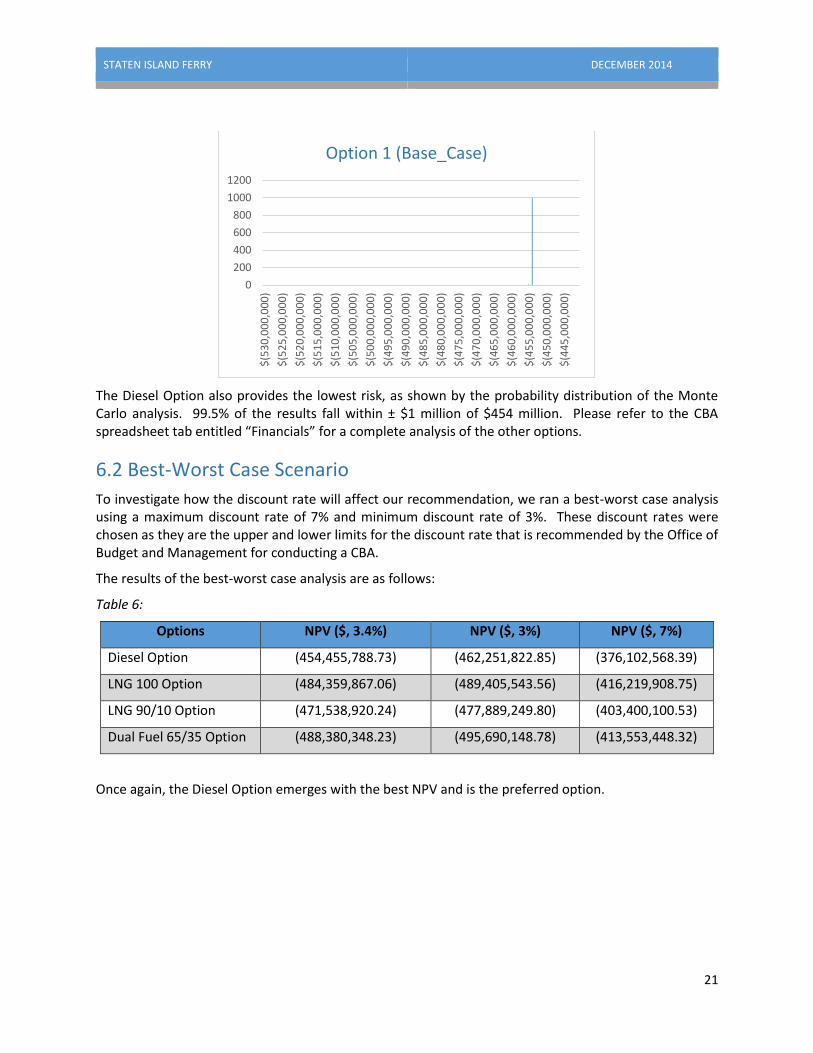
21
The Diesel Option also provides the lowest risk, as shown by the probability distribution of the Monte Carlo analysis. 99.5% of the results fall within ± $1 million of $454 million. Please refer to the CBA spreadsheet tab entitled “Financials” for a complete analysis of the other options.
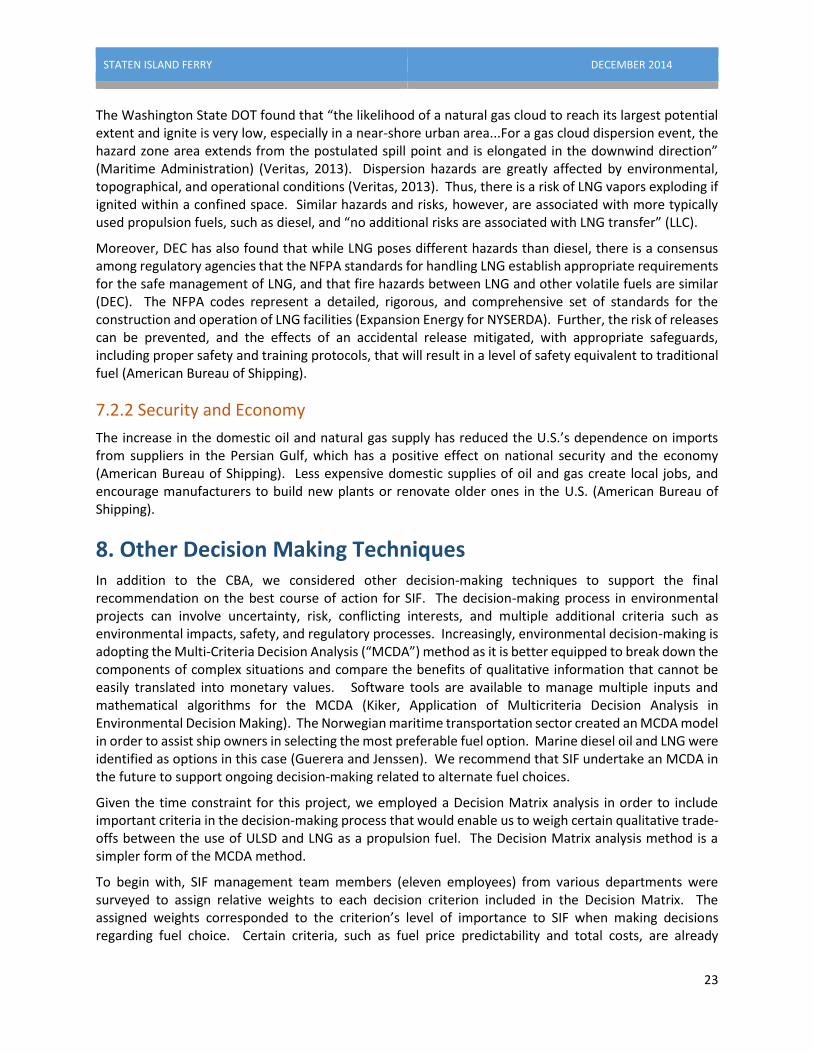
6.2 Best-Worst Case Scenario
To investigate how the discount rate will affect our recommendation, we ran a best-worst case analysis using a maximum discount rate of 7% and minimum discount rate of 3%. These discount rates were chosen as they are the upper and lower limits for the discount rate that is recommended by the Office of Budget and Management for conducting a CBA.
The results of the best-worst case analysis are as follows:
Table 6:
Options NPV ($, 3.4%) NPV ($, 3%) NPV ($, 7%)
Diesel Option (454,455,788.73) (462,251,822.85) (376,102,568.39)
LNG 100 Option (484,359,867.06) (489,405,543.56) (416,219,908.75)
LNG 90/10 Option (471,538,920.24) (477,889,249.80) (403,400,100.53)
Dual Fuel 65/35 Option (488,380,348.23) (495,690,148.78) (413,553,448.32)
Once again, the Diesel Option emerges with the best NPV and is the preferred option.
0
200
400
600
800
1000
1200
$(5
30
,00
0,0
00
)
$(5
25
,00
0,0
00
)
$(5
20
,00
0,0
00
)
$(5
15
,00
0,0
00
)
$(5
10
,00
0,0
00
)
$(5
05
,00
0,0
00
)
$(5
00
,00
0,0
00
)
$(4
95
,00
0,0
00
)
$(4
90
,00
0,0
00
)
$(4
85
,00
0,0
00
)
$(4
80
,00
0,0
00
)
$(4
75
,00
0,0
00
)
$(4
70
,00
0,0
00
)
$(4
65
,00
0,0
00
)
$(4
60
,00
0,0
00
)
$(4
55
,00
0,0
00
)
$(4
50
,00
0,0
00
)
$(4
45
,00
0,0
00
)
Option 1 (Base_Case)

STATEN ISLAND FERRY DECEMBER 2014
22
7. Other Costs and Benefits The production and use of both diesel and natural gas create impacts that are difficult to measure or have an indirect connection to SIF’s choices; nevertheless, these impacts should be considered.
7.1 Environmental
There could be environmental benefits to switching to LNG from diesel, such as a lower threat of surface water and groundwater contamination; any LNG spilled would quickly vaporize and not affect water quality (DEC). And, assuming methane leaks are contained, switching to LNG from diesel would reduce the emission levels of some criteria pollutants and greenhouse gases (Expansion Energy for NYSERDA).
On the other hand, there are many possible environmental risks associated with the extraction, production, and transportation of oil and gas from both conventional sources and from unconventional fracked sources. These potential costs include contamination of ground water and well water, air pollution, greenhouse gas releases, spills, deforestation, and, particularly with fracking, the use of toxic chemicals and the disposal of contaminated wastewater, the depletion of fresh water, and possibly earthquakes (New York City Department of Environmental Protection). Moreover, onshore oil and gas development from unconventional sources has been exempted from the pollution standards set forth in various federal laws that would otherwise provide environmental and public health benefits and protection: the Safe Drinking Water Act; the Clean Water Act; the Clean Air Act; the Resource Conservation and Recovery Act; the Comprehensive Environmental Response, Compensation, and Liability Act; the National Environmental Policy Act; and the Emergency Planning and Community Right-to-Know Act (United States Government Accountability Office ); (The Network for Public Health Law). Thus, when fracking causes environmental damage, it is unclear who will bear the cost of the damage.
7.2 Social
7.2.1 Health and Safety
Nearby residents, passengers, and employees of SIF are likely to have concerns about the safety of transporting, storing, and fueling with LNG. Those concerns primarily relate to the flammability of LNG and the risk of accidental release and explosion, or to its character as a cryogenic liquid. SIF can mitigate these risks with proper design, construction, maintenance, and repair of LNG-related equipment, and with appropriate safety procedures and training for employee. SIF should, however, expect and prepare to confront some resistance to both LNG and the Dual Fuel 65/35 Options because of the public’s perception of added safety risks related to LNG.
Natural gas is primarily composed of methane, which is a nontoxic flammable gas. LNG is created by cooling natural gas to about -260°F, a temperature below its boiling point which reduces LNG’s volume by a factor of 600 and makes it more efficient for storage and transport. As a liquid, LNG is colorless, odorless, non-toxic and non-corrosive. LNG will neither burn nor explode. If accidentally released, however, it will form a vapor cloud as the LNG boils at ambient temperatures. To result in a fire or explosion, the vapor cloud must be in the flammable range for methane, which is between 5.3% and 14% by volume in the air, and the cloud must then somehow be ignited (American Bureau of Shipping). Also, direct contact with LNG can cause effects similar to thermal burns and may damage skin and tissues (American Bureau of Shipping).
STATEN ISLAND FERRY DECEMBER 2014
23
The Washington State DOT found that “the likelihood of a natural gas cloud to reach its largest potential extent and ignite is very low, especially in a near-shore urban area...For a gas cloud dispersion event, the hazard zone area extends from the postulated spill point and is elongated in the downwind direction” (Maritime Administration) (Veritas, 2013). Dispersion hazards are greatly affected by environmental, topographical, and operational conditions (Veritas, 2013). Thus, there is a risk of LNG vapors exploding if ignited within a confined space. Similar hazards and risks, however, are associated with more typically used propulsion fuels, such as diesel, and “no additional risks are associated with LNG transfer” (LLC).
Moreover, DEC has also found that while LNG poses different hazards than diesel, there is a consensus among regulatory agencies that the NFPA standards for handling LNG establish appropriate requirements for the safe management of LNG, and that fire hazards between LNG and other volatile fuels are similar (DEC). The NFPA codes represent a detailed, rigorous, and comprehensive set of standards for the construction and operation of LNG facilities (Expansion Energy for NYSERDA). Further, the risk of releases can be prevented, and the effects of an accidental release mitigated, with appropriate safeguards, including proper safety and training protocols, that will result in a level of safety equivalent to traditional fuel (American Bureau of Shipping).
7.2.2 Security and Economy
The increase in the domestic oil and natural gas supply has reduced the U.S.’s dependence on imports from suppliers in the Persian Gulf, which has a positive effect on national security and the economy (American Bureau of Shipping). Less expensive domestic supplies of oil and gas create local jobs, and encourage manufacturers to build new plants or renovate older ones in the U.S. (American Bureau of Shipping).
8. Other Decision Making Techniques In addition to the CBA, we considered other decision-making techniques to support the final recommendation on the best course of action for SIF. The decision-making process in environmental projects can involve uncertainty, risk, conflicting interests, and multiple additional criteria such as environmental impacts, safety, and regulatory processes. Increasingly, environmental decision-making is adopting the Multi-Criteria Decision Analysis (“MCDA”) method as it is better equipped to break down the components of complex situations and compare the benefits of qualitative information that cannot be easily translated into monetary values. Software tools are available to manage multiple inputs and mathematical algorithms for the MCDA (Kiker, Application of Multicriteria Decision Analysis in Environmental Decision Making). The Norwegian maritime transportation sector created an MCDA model in order to assist ship owners in selecting the most preferable fuel option. Marine diesel oil and LNG were identified as options in this case (Guerera and Jenssen). We recommend that SIF undertake an MCDA in the future to support ongoing decision-making related to alternate fuel choices.
Given the time constraint for this project, we employed a Decision Matrix analysis in order to include important criteria in the decision-making process that would enable us to weigh certain qualitative trade-offs between the use of ULSD and LNG as a propulsion fuel. The Decision Matrix analysis method is a simpler form of the MCDA method.
To begin with, SIF management team members (eleven employees) from various departments were surveyed to assign relative weights to each decision criterion included in the Decision Matrix. The assigned weights corresponded to the criterion’s level of importance to SIF when making decisions regarding fuel choice. Certain criteria, such as fuel price predictability and total costs, are already
STATEN ISLAND FERRY DECEMBER 2014
24
monetized in the CBA, but were also included in the Decision Matrix. Next, we assigned objective scores between 0-100 for how each option satisfied each criterion. The Decision Matrix survey with the results is included in Appendix 6.
The results of the Decision Matrix indicate that SIF’s management team considers reliability of service, safety, and environmental performance as the most important selection criteria. The criteria weights in combination with the scores indicate that the ULSD Diesel Option is the best course of action.
9. Recommendation Based upon the results of the CBA and the sensitivity analysis, as well as the management priorities SIF identified in the Decision Matrix analysis, we recommend that SIF pursue the Diesel Option over the LNG 100 Option, the LNG 90/10 Option, or the LNG 65/35 Option. Our analysis addresses the direct financial costs and benefits of the LNG conversion proposal, but also integrates a quantitative and qualitative analysis of some of the associated social and environmental costs and benefits as well. Although air emissions will be higher with the Diesel Option, the lower emissions from using LNG will not outweigh the additional costs associated with repowering or retrofitting the existing fleet, constructing three new ferries with LNG engines, and building LNG facilities and other infrastructure to support this option. The Diesel Option also best supports the SIF management priorities of reducing costs and ensuring the reliability of the fleet.
The Diesel Option underperforms in air emissions when compared to the LNG and Dual-Fuel Options. However, the Diesel Option resulted in the lowest total cost while providing the greatest upfront savings. Although transitioning to LNG is expected to provide fuel cost savings based on current fuel prices, the uncertainty around future prices does not provide confidence that the price will remain lower throughout the 30-year life of the project. Moreover, the current moratorium on LNG facilities and the lack of fueling options may increase the risk of delays or disruptions in service that is not justified.
Under the Diesel Option, the engines remain LNG-ready with the addition of conversion kits, which provides the greatest flexibility with the lowest risk. Diesel is also a proven fuel for marine transportation. Therefore, we recommend implementing the Diesel Option at this time. In the future, when there is more certainty around the development of supporting LNG infrastructure in NYC, SIF can again consider retrofitting with LNG or dual-fuel engines.
STATEN ISLAND FERRY DECEMBER 2014
25
Appendix
Appendix 1
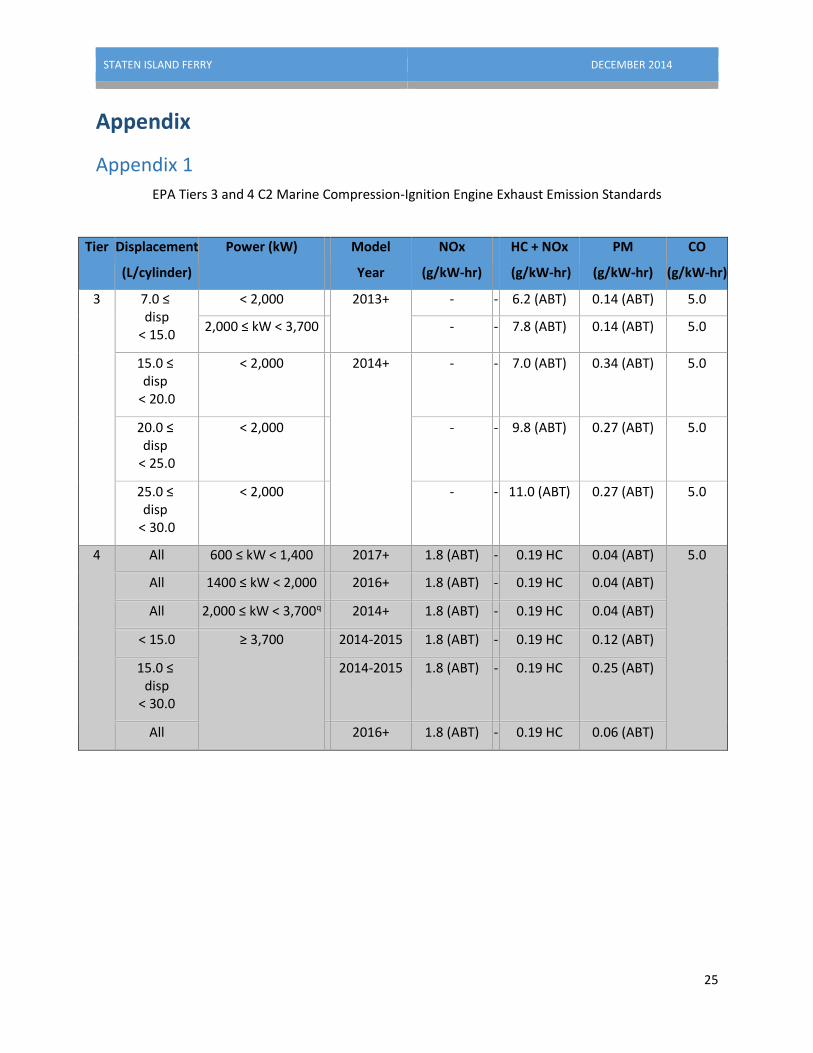
EPA Tiers 3 and 4 C2 Marine Compression-Ignition Engine Exhaust Emission Standards
Tier Displacement
(L/cylinder)
Power (kW) Model
Year
NOx
(g/kW-hr)
HC + NOx
(g/kW-hr)
PM
(g/kW-hr)
CO
(g/kW-hr)
3 7.0 ≤ disp
< 15.0
< 2,000 2013+ - - 6.2 (ABT) 0.14 (ABT) 5.0
2,000 ≤ kW < 3,700 - - 7.8 (ABT) 0.14 (ABT) 5.0
15.0 ≤ disp
< 20.0
< 2,000 2014+ - - 7.0 (ABT) 0.34 (ABT) 5.0
20.0 ≤ disp
< 25.0
< 2,000 - - 9.8 (ABT) 0.27 (ABT) 5.0
25.0 ≤ disp
< 30.0
< 2,000 - - 11.0 (ABT) 0.27 (ABT) 5.0
4 All 600 ≤ kW < 1,400 2017+ 1.8 (ABT) - 0.19 HC 0.04 (ABT) 5.0
All 1400 ≤ kW < 2,000 2016+ 1.8 (ABT) - 0.19 HC 0.04 (ABT)
All 2,000 ≤ kW < 3,700q 2014+ 1.8 (ABT) - 0.19 HC 0.04 (ABT)
< 15.0 ≥ 3,700 2014-2015 1.8 (ABT) - 0.19 HC 0.12 (ABT)
15.0 ≤ disp
< 30.0
2014-2015 1.8 (ABT) - 0.19 HC 0.25 (ABT)
All 2016+ 1.8 (ABT) - 0.19 HC 0.06 (ABT)
STATEN ISLAND FERRY DECEMBER 2014
26
Appendix 2
(Burger, L. W.)
STATEN ISLAND FERRY DECEMBER 2014
27
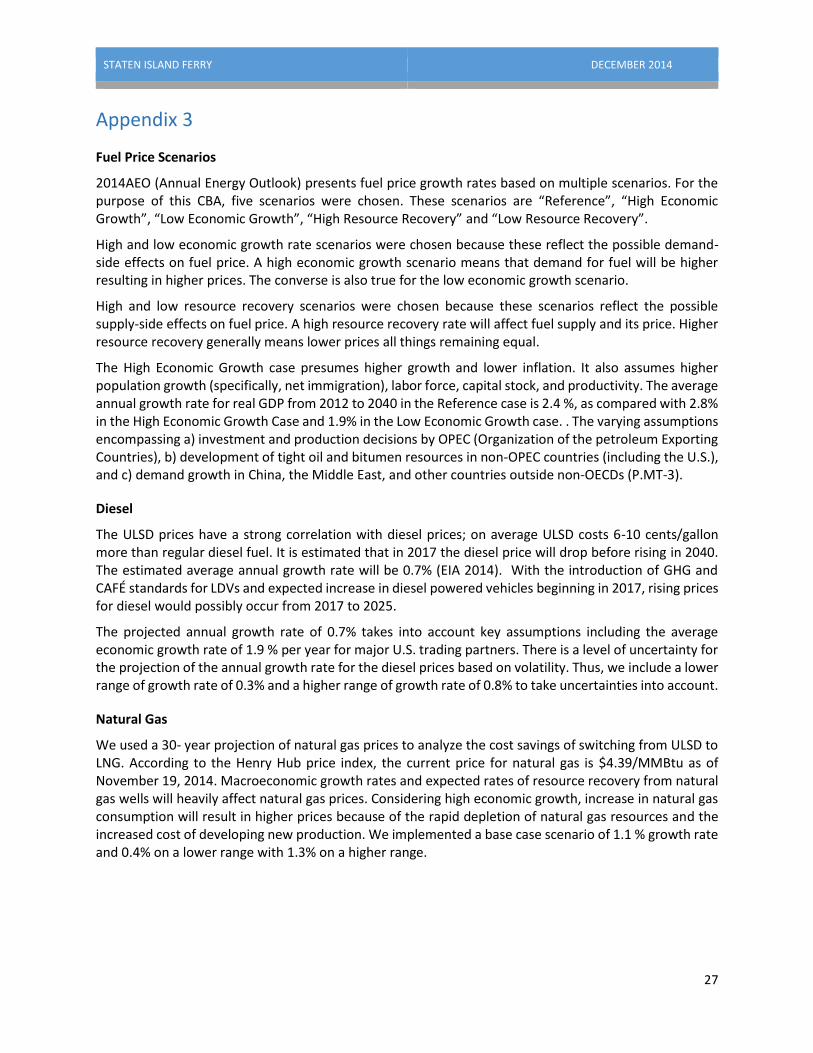
Appendix 3
Fuel Price Scenarios
2014AEO (Annual Energy Outlook) presents fuel price growth rates based on multiple scenarios. For the purpose of this CBA, five scenarios were chosen. These scenarios are “Reference”, “High Economic Growth”, “Low Economic Growth”, “High Resource Recovery” and “Low Resource Recovery”.
High and low economic growth rate scenarios were chosen because these reflect the possible demand-side effects on fuel price. A high economic growth scenario means that demand for fuel will be higher resulting in higher prices. The converse is also true for the low economic growth scenario.
High and low resource recovery scenarios were chosen because these scenarios reflect the possible supply-side effects on fuel price. A high resource recovery rate will affect fuel supply and its price. Higher resource recovery generally means lower prices all things remaining equal.
The High Economic Growth case presumes higher growth and lower inflation. It also assumes higher population growth (specifically, net immigration), labor force, capital stock, and productivity. The average annual growth rate for real GDP from 2012 to 2040 in the Reference case is 2.4 %, as compared with 2.8% in the High Economic Growth Case and 1.9% in the Low Economic Growth case. . The varying assumptions encompassing a) investment and production decisions by OPEC (Organization of the petroleum Exporting Countries), b) development of tight oil and bitumen resources in non-OPEC countries (including the U.S.), and c) demand growth in China, the Middle East, and other countries outside non-OECDs (P.MT-3).
Diesel
The ULSD prices have a strong correlation with diesel prices; on average ULSD costs 6-10 cents/gallon more than regular diesel fuel. It is estimated that in 2017 the diesel price will drop before rising in 2040. The estimated average annual growth rate will be 0.7% (EIA 2014). With the introduction of GHG and CAFÉ standards for LDVs and expected increase in diesel powered vehicles beginning in 2017, rising prices for diesel would possibly occur from 2017 to 2025.
The projected annual growth rate of 0.7% takes into account key assumptions including the average economic growth rate of 1.9 % per year for major U.S. trading partners. There is a level of uncertainty for the projection of the annual growth rate for the diesel prices based on volatility. Thus, we include a lower range of growth rate of 0.3% and a higher range of growth rate of 0.8% to take uncertainties into account.
Natural Gas
We used a 30- year projection of natural gas prices to analyze the cost savings of switching from ULSD to LNG. According to the Henry Hub price index, the current price for natural gas is $4.39/MMBtu as of November 19, 2014. Macroeconomic growth rates and expected rates of resource recovery from natural gas wells will heavily affect natural gas prices. Considering high economic growth, increase in natural gas consumption will result in higher prices because of the rapid depletion of natural gas resources and the increased cost of developing new production. We implemented a base case scenario of 1.1 % growth rate and 0.4% on a lower range with 1.3% on a higher range.
STATEN ISLAND FERRY DECEMBER 2014
28
Appendix 4
Carbon Dioxide and Equivalents (CO2e) & Social Cost of pollutants
Carbon dioxide equivalent is a relative measure of how much heat GHG traps in the atmosphere. This varies in relation of the global warming potential (GWP) of different gases by a similar mass of carbon dioxide (CO2). The global warming potential is calculated over a specific time interval horizon from 20 to 100 years. GWPs are used in this report in order to compare the different gasses from each option in a similar basis.
In this case, we are dealing mainly with CO2, which has a GWP of exactly 1. Thus, methane (CH4) has a GWP of 21, and N2O has a GWP of 310, both over a 100-year period. (Data from 2007 IPCC SAR).
The social cost of carbon (“SCC”), is the present value of future damages from one additional unit of carbon emissions per year. This cost is intended to be a comprehensive measure of damages from carbon, including its impacts on agricultural productivity, human health, infrastructure damage, biodiversity loss, and ecosystem services. SCC is the equivalent shadow price on CO2 emissions, and there is a wide range of SCC estimates in the related literature because of the uncertainty surrounding various parameters and assumptions involved. Many studies have argued in favor of using a social cost of carbon, and there is increasing evidence that a time-varying discount rate is the correct approach in the context of global warming (Pearce).
We have chosen $43 per ton for our model, which is the average estimate of the SCC from the IPCC. This value is the mean SCC based on all available credible peer-reviewed estimates, which range from $10 to $350. The standard deviation is $83 per ton, and it is used in the Monte Carlo simulation to generate random values for SCC based on statistical inputs (Yohe).
Similarly, the US Interagency Working Group, comprised of representatives from the White House, EPA and various governmental departments, developed estimates for SCC in November 2013 that have been used in regulatory impact analyses and decision-making (Greenstone, Kopits and Wolverton), and the average SCC at a discount rate of 3% is also $43 per ton of CO2 (Interagency Work Group on Social Cost of Carbon, United States Government).
STATEN ISLAND FERRY DECEMBER 2014
29
Appendix 5
Other Pollutants
We valued PM, NOx, and SO2 using a study by Nicholas Muller and Robert Mendelsohn based on a sampling of 10,000 sources across the United States (Muller and Mendelsohn). This study values pollution reduction based on a myriad of effects, such as crop production, visibility, and mortality, and is the first study to value national air pollution damages using source-specific marginal values, which permits a measure of aggregate damages that is consistent with national income accounts. The large sampling size combined with the social cost valuation method makes this peer-reviewed study a quality source for our analysis. We normalized these values based on 2013 median income levels for the specified population area of NYC using data from the United States Census Bureau.
We valued CO using another report, as this was not available in the Muller and Mendelsohn study. This other study estimated environmental costs based on the production of transportation equipment, materials and services, and these external cost estimates included the full life-cycle effects from air emissions of several pollutants, including carbon monoxide. Estimates from a multitude of previous studies, including regulatory agency studies, were used as proxies for the typical costs of transportation emissions for large sample areas. The median, minimum and maximum values of dollar per ton for CO are $520, $1 and $1,050, respectively (H. Scott Matthews). For the purpose of our analysis, we used the median value of $520/ton. This dollar value was also normalized based on 2013 income levels for Kings, Richmond and New York Counties.
Our team also considered alternative methodologies for valuing the social costs of pollutants. For example, one method estimates value based on the physical cost of engine updates to achieve reductions, and another uses hospitalization estimates for a specified population. We determined, however, that dollar per ton values based on extensive research studies were the most accurate method to value these pollutants for our purposes.
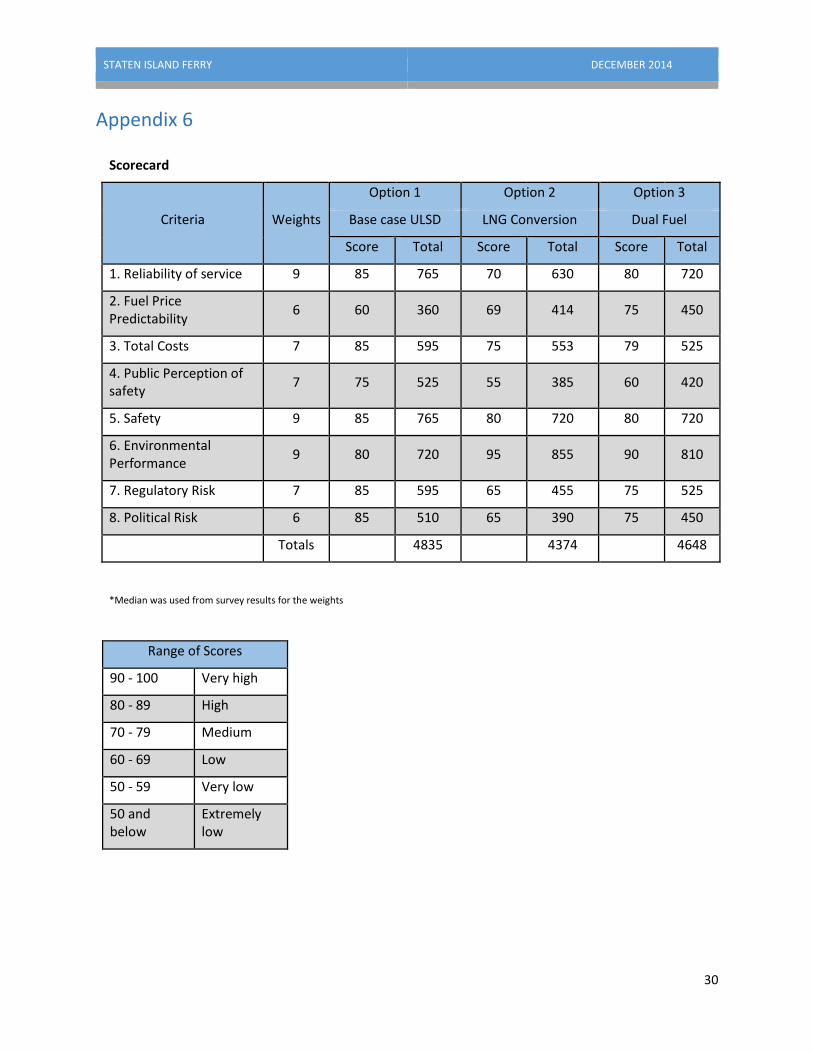
STATEN ISLAND FERRY DECEMBER 2014
30
Appendix 6
Scorecard
Criteria Weights
Option 1 Option 2 Option 3
Base case ULSD LNG Conversion Dual Fuel
Score Total Score Total Score Total
1. Reliability of service 9 85 765 70 630 80 720
2. Fuel Price Predictability
6 60 360 69 414 75 450
3. Total Costs 7 85 595 75 553 79 525
4. Public Perception of safety
7 75 525 55 385 60 420
5. Safety 9 85 765 80 720 80 720
6. Environmental Performance
9 80 720 95 855 90 810
7. Regulatory Risk 7 85 595 65 455 75 525
8. Political Risk 6 85 510 65 390 75 450
Totals 4835 4374 4648
*Median was used from survey results for the weights
Range of Scores
90 - 100 Very high
80 - 89 High
70 - 79 Medium
60 - 69 Low
50 - 59 Very low
50 and below
Extremely low
STATEN ISLAND FERRY DECEMBER 2014
31
References A Liquid Market. July 2012. 20 Oct 2014. <http://www.economist.com/node/21558456>.
American Bureau of Shipping. "Bunkering of Liquefied Natural Gas-fueled Marine Vessels in North America."
2014. ABS Web site. 18 October 2014.
<http://ww2.eagle.org/content/dam/eagle/publications/2014/LNG%20Bunkering.pdf>.
Biblow, Charlotte. "Are New Liquefied Natural Gas Facilities Coming to New York?" 21 November 2013.
Farrell Fritz. 8 November 2011. <http://www.farrellfritz.com/wp-content/uploads/CAB-Are-New-
Liquefied-Nat-Gas-Nov-21-2013.pdf>.
Burger, L. W. and M. P. Oberholzer. "Risk Assessment for the Proposed Sunrise Energy Liquified Petroleum
Gas (LPG) Terminal at Saldanha Bay - Transportation of LPG from Ship Loading." 2012. PDF.
DEC. Public Can Submit Comments on the Revised Proposed LNG Regulations from Nov. 12 through Dec. 12,
2014. 28 October 2014. 10 November 2014. <http://www.dec.ny.gov/press/99344.html>.
—. Revised Proposed 6 NYCRR Part 570 - Regulation of Liquefied Natural Gas Facilities. November 2014. 13
November 2014. <http://www.dec.ny.gov/regulations/93069.html>.
—. Revised Proposed Express Terms (Full Text) - 6 NYCRR Part 570. 2014. 10 November 2014.
<http://www.dec.ny.gov/regulations/93166.html>.
—. Revised Proposed Express Terms (Full Text) - 6 NYCRR Part 570. November 2014. 13 November 2014.
<http://www.dec.ny.gov/regulations/93166.html>.
—. Revised Summary of Regulatory Impact Statement - 6 NYCRR Part 570. November 2014. 22 November
2014. <http://www.dec.ny.gov/regulations/93213.html>.
—. SEQR. 2014. 13 November 2014. <http://www.dec.ny.gov/permits/357.html>.
—. Summary of Assessment of Public Comment - 6 NYCRR Part 570. 2014. 13 November 2014.
<http://www.dec.ny.gov/regulations/96963.html>.
—. Summary of Assessment of Public Comment - 6 NYCTT Part 570. 2014. 15 November 2014.
<http://www.dec.ny.gov/regulations/96963.html>.
Environmental Protection Agency. "Draft Regulatory Impact Analysis: Control of Emissions of Air Pollution
from Locomotive Engines and Marine Compression-Ignition Engines Less than 30 Liters per Cylinder."
2007.
EPA. Clean Air Act Requirements and History. 15 August 2013. 8 November 2014.
<http://www.epa.gov/air/caa/requirements.html>.
—. Cleaning Up Commonly Found Air Pollutants. 28 October 2014. 5 November 2014.
<http://www.epa.gov/airquality/peg_caa/cleanup.html>.
—. Federal Marine Compression-Ignition (CI) Engines -- Exhaust Emission Standards. 15 November 2012. 1
November 2014. <http://www.epa.gov/otaq/standards/nonroad/marineci.htm>.
—. "Federal Marine Compression-Ignition (CI) Engines -- Exhaust Emission Standards." 15 November 2012.
Emission Standards Reference Guide. 3 November 2014.
<http://www.epa.gov/otaq/standards/nonroad/marineci.htm>.
STATEN ISLAND FERRY DECEMBER 2014
32
—. Federal Marine Compression-Ignition (CI) Engines -- Exhaust Emission Standards. 15 November 2012. 10
November 2014. <http://www.epa.gov/otaq/standards/nonroad/marineci.htm>.
—. What Are the Six Common Air Pollutants? 20 April 2012. 1 November 2014.
<http://www.epa.gov/airquality/urbanair/>.
Expansion Energy for NYSERDA. "NYS Liquefied Natural Gas (LNG) 6 NYCRR Part 570 Promulgation Support
Study." 20 September 2011. 16 November 2014.
<http://www.dec.ny.gov/docs/remediation_hudson_pdf/lngnyserdareport1.pdf>.
Graykowski, John. LNG: Ports as a Catalyst? 10 October 2013.
Greenstone, Michael, Elizabeth Kopits and Ann Wolverton. "Developing a Social Cost of Carbon for US
Regulatory Analysis: A Methodology and Interpretation." Review of Environmental Economics and
Policy 7.1 (2013): 23-46.
Guerera, Adriana and Michael Myrvold Jenssen. "Multi Criteria Decision Analysis (MCDA) in the Norwegian
Maritime Sector." June 2014. Norwegian University of Science and Technology. 29 October 2014.
<http://www.diva-portal.org/smash/get/diva2:752188/FULLTEXT01.pdf>.
H. Scott Matthews, Chris Hendrickson, Arpad Horvath. "External Costs of Air Emissions from Transportation."
Journal of Infrastructure Systems 7 (2001): 13-17.
Houser, Trever. "An Oil and Gas Renaissance." The Peterson Institute for International Economics (2012).
Howarth, Robert, Renee Santoro and Anthony Ingraffea. "Methane and the Greenhouse-Gas Footprint of
Natural Gas from Shale Formations." Climatic Change (2011): 106: 679-690.
Interagency Work Group on Social Cost of Carbon, United States Government. "Technical Support
Document:- Technical Update of the Social Cost of Carbon for Regulatory Impact Analysis- Under
Executive Order 12866." 2013.
Kazuhiko Ito, Robert Mathes, Zev Ross, Arthur Nádas, George Thurston, and Thomas Matte. "Fine Particulate
Matter Constituents Associated with Cardiovascular Hospitalizations and Mortality in New York City."
Environmental Health Perspectives 119.4 (2011): 467-473.
Kiker, Gregory. "Application of Multicriteria Decision Analysis in Environmental Decision Making." n.d. 15
November 2014. <ftp://ecosistemas.uchile.cl/pub/DSS/Kiker%20et%20al%202005.pdf>.
—. "Application of Multicriteria Decision Analysis in Environmental Decision Making." n.d. 15 November
2014. <http://intertox.com/files/public/070412%20Cocheco_IEAM.pdf>.
Kowloon Development Office. "Comprehensive Feasibility Study of the Revised Scheme of Southeast
Kowloon Development." July 2001.
<http://www.epd.gov.hk/eia/register/report/eiareport/eia_0592001/9-5.pdf>.
Krauss, Clifford. "In Texas, a Fight Over Fracking." The New York Times 9 October 2014: B1,7.
Kytomaa, Harri and Trey Morrison. The Liquefied Natural Gas (LNG) Industry and Fire Protection Regulations.
1 October 2013.
Laugen, Lars. "An Environmental Life Cycle Assessment of LNG and HFO as Marine Fuels." June 2013.
www.diva-portal.org. 18 October 2014. <http://www.diva-
portal.org/smash/get/diva2:648752/FULLTEXT01.pdf>.
STATEN ISLAND FERRY DECEMBER 2014
33
LLC, Mystic River Partners. "LNG Marine Fuel Risk, Safety & Crew Training." 2013.
<http://www.gastechnology.org/Training/Documents/LNG17-proceedings/Transport-21-Robert-
Kamb-Presentation.pdf>.
Lowell, Dana. "LNG as a Marine Fuel." 16 January 2012. www.northeastdiesel.org. 18 October 2014.
<http://northeastdiesel.org/pdf/workgroup/LNGMarineFuel.pdf>.
Lowell, Dana, Haifeng Wang and Nic Lutsey. "Assessment of the Fuel Cycle Impact of Liquefied Natural Gas As
Used in International Shipping." May 2013. www.theicct.org. 18 October 2014.
<http://www.theicct.org/sites/default/files/publications/ICCTwhitepaper_MarineLNG_130513.pdf>.
Maritime Administration. "Liquefied Natural Gas (LNG) Bunkering Study." 2014. Det Norske Veritas. 3
September 2014. <http://www.marad.dot.gov/documents/DNVLNGBunkeringStudy3Sep14.pdf>.
Muller, Nicholas Z. and Robert Mendelsohn. "Measuring the damages of air pollution in the United States."
Journal of Environmental Economics and Management (2007): 1-14. Document.
New York City Department of Environmental Protection. "Final Impact Assessment Report: Impact
Assessment of Natural Gas Production in the New York City Water Supply Watershed." December
2009. October 2014.
<http://www.nyc.gov/html/dep/pdf/natural_gas_drilling/12_23_2009_final_assessment_report.pdf
>.
New York City Department of Health and Mental Hygiene. "Air Pollution and the Health of New Yorkers: The
Impact of Fine Particles and Ozone." n.d.
New York City Department of Transportation. "Staten Island Ferry Safety & Environmental Protection Plan." 3
February 2014. NYC DOT. 27 September 2014. <http://www.nyc.gov/html/dot/downloads/pdf/dot-
sif-sep-policy.pdf >.
New York City Economic Development Corporation. Staten Island Ferry-Whitehall Terminal Demographics.
New York City, 2008.
Nocera, Joe. "'Moment of Truth' on Emissions." The New York Times 6 October 2014.
NYC Department of Transportation. Alternative Fuels Program. 2014. 6 November 2014.
<http://www.nyc.gov/html/dot/html/motorist/alternativefuel.shtml>.
—. Staten Island Ferry. 2014. 28 October 2014.
NYC Mayor's Office. "New York City's Pathways to Deep Carbon Reductions." December 2013. PlaNYC. 21
November 2014. <http://s-media.nyc.gov/agencies/planyc2030/pdf/nyc_pathways.pdf>.
NYCDOT. Alternative Fuels Program. 2014. 10 November 2014.
<http://www.nyc.gov/html/dot/html/motorist/alternativefuel.shtml>.
Passenger Vessel Association . Passenger Vessel . 2014. 23 September 2014.
<http://www.passengervessel.com/downloads/reference_library/pva-industry-fact-sheet.pdf>.
Pearce, David. "The Social Cost of Carbon and Its Policy Implications." Oxford Review of Economic Policy 19.3
(2003): 362-84.
Puget Sound Maritime Air Forum. Puget Sound Maritime Air Emissions Inventory. Puget Sound: Puget Sound
Maritime Air Forum, 2012.
STATEN ISLAND FERRY DECEMBER 2014
34
Regoli, Natalie and Brian Polley. "bakermckenzie.com." March/April 2014. Regulatory uncertainty hampers
LNG export projects. 18 October 2014. <http://www.bakermckenzie.com/files/Publication/4af48c12-
2e03-42c0-9d7f-a2f2e56036f6/Presentation/PublicationAttachment/6870ed5c-4a47-4c60-8cac-
a67116e8fa66/ar_emi_regulatoryuncertaintylng_marapr14.pdf>.
Sadasivam, Naveena. New York State of Fracking: A ProPublica Explainer. 22 July 2014. 7 November 2014.
<http://www.propublica.org/article/new-york-state-of-fracking-a-propublica-explainer>.
Snyder, Jim, Jim Polson and Bradley Olson. Bloomberg.com: Leaky Wells Spur Call for Stricter Rules on Gas
Drilling. 17 September 2014. 18 October 2014. <http://www.bloomberg.com/news/2014-09-
16/leaky-wells-spur-call-for-stricter-rules-on-gas-drilling.html?wpisrc=nl-wonkbk&wpmm=1>.
Stout, Alan. Tier IV Regulations & Their Impact Bruce of WorkBoat.com Buls. 22 October 2014.
Trimarchi, Peter. New York Proposes Regulations Governing the Siting of LNG Facilities. 19 September 2013.
United States Census Bureau. Table C1. Median Household Income by County: 1969, 1979, 1989. n.d. 17
November 2014.
<https://www.census.gov/hhes/www/income/data/historical/county/county1.html>.
Veritas, Det Norske. "Safety and Navigational Risk Assessment for LNG-Fueled Passenger Ferry Vessels." 8
October 2013. <http://www.wsdot.wa.gov/NR/rdonlyres/C3E95FB3-7AA2-4F5F-9CCD-
0CC7F602F459/0/reducedPP061307WSFWSAReportrev01.pdf.>.
Washington State Separtment of Transportation, Ferries Division. "Executive Summary of Washington State
Ferries' Liquefied Natural Gas (LNG) Project." October 2014. Washington State Department of
Transportation Liquefied Natural Gas. 8 November 2014.
<http://www.wsdot.wa.gov/Ferries/Environment/LNG.htm>.
Yohe, G.W., R.D. Lasco, Q.K. Ahmad, N.W. Arnell, S.J. Cohen, C. Hope, A.C. Janetos and R.T. Perez.
"Perspectives on climate change and sustainability." M.L. Parry, O.F. Canziani, J.P. Palutikof, P.J. van
der Linden and C.E. Hanson, Eds. Climate Change 2007: Impacts, Adaptation and Vulnerability.
Contribution of Working Group II to the Fourth Assessment Report of the Intergovernmental Panel on
Climate Change. Cambridge: Cambridge University Press, 2007. 811-841.