Embed Size (px)
Citation preview
FEDERALLY INSURED BY NCUA
2018 ANNUAL REPORTGregory RosstonChair
Dr. Frank SarnquistVice Chair
Tana HutchisonTreasurer
Dan KolkowitzSecretary
Dr. Shirley Everett
Curtis Feeny
Susan Kingston
Joan Opp
Robert Reidy
Jon Dreyfus
Jerry Jobe
Jane Duperrault
Jerry Jobe
Timothy Warner
Neil HamiltonChair
Susan Kingston
Desmond Low-Kum
David MacKenzie
Archna Mehta
Joan OppPresident/CEO
Amber DanfordSVP/Chief Operation Officer
Brian ThorntonSVP/Chief Lending Officer
Brian ZeitlerSVP/Chief Information Officer
Paul JockischSVP/Interim Chief Financial Officer
650.723.2509
888.723.7328
sfcu.org
P. O. Box 10690 Palo Alto, CA 94303-0843
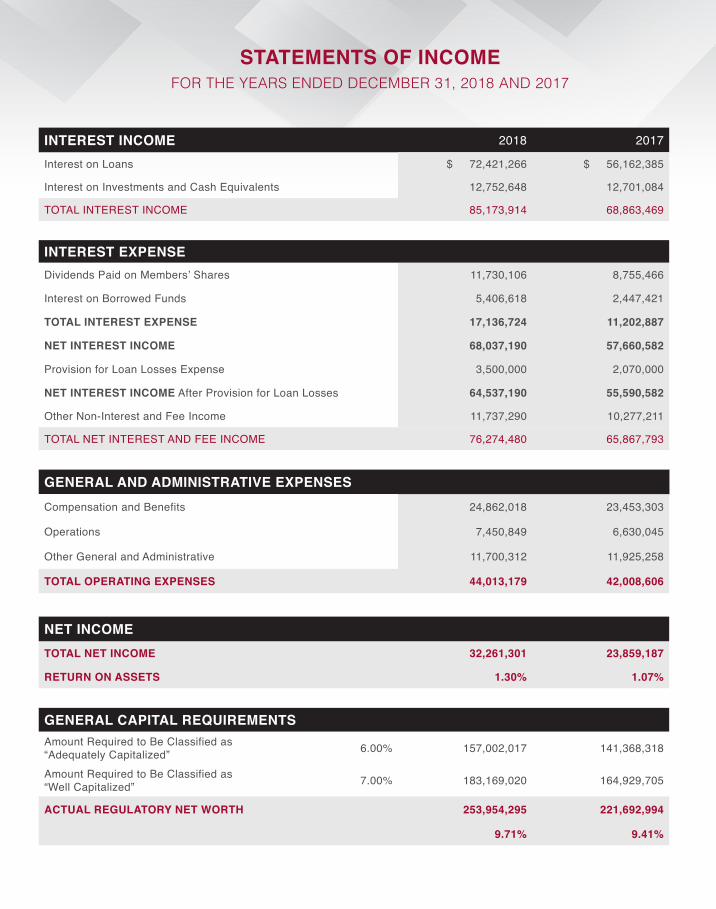
INTEREST INCOME 2018 2017
Interest on Loans $ 72,421,266 $ 56,162,385
Interest on Investments and Cash Equivalents 12,752,648 12,701,084
TOTAL INTEREST INCOME 85,173,914 68,863,469
INTEREST EXPENSEDividends Paid on Members’ Shares 11,730,106 8,755,466
Interest on Borrowed Funds 5,406,618 2,447,421
TOTAL INTEREST EXPENSE 17,136,724 11,202,887
NET INTEREST INCOME 68,037,190 57,660,582
Provision for Loan Losses Expense 3,500,000 2,070,000
NET INTEREST INCOME After Provision for Loan Losses 64,537,190 55,590,582
Other Non-Interest and Fee Income 11,737,290 10,277,211
TOTAL NET INTEREST AND FEE INCOME 76,274,480 65,867,793
GENERAL AND ADMINISTRATIVE EXPENSESCompensation and Benefits 24,862,018 23,453,303
Operations 7,450,849 6,630,045
Other General and Administrative 11,700,312 11,925,258
TOTAL OPERATING EXPENSES 44,013,179 42,008,606
NET INCOMETOTAL NET INCOME 32,261,301 23,859,187
RETURN ON ASSETS 1.30% 1.07%
GENERAL CAPITAL REQUIREMENTSAmount Required to Be Classified as “Adequately Capitalized” 6.00% 157,002,017 141,368,318
Amount Required to Be Classified as “Well Capitalized” 7.00% 183,169,020 164,929,705
ACTUAL REGULATORY NET WORTH 253,954,295 221,692,994
9.71% 9.41%
ADVISORY BOARD
BOARD OF DIRECTORS
EXECUTIVE STAFF
SUPERVISORY COMMITTEE
STATEMENTS OF INCOMEFOR THE YEARS ENDED DECEMBER 31, 2018 AND 2017
EMERITUS BOARD MEMBERS
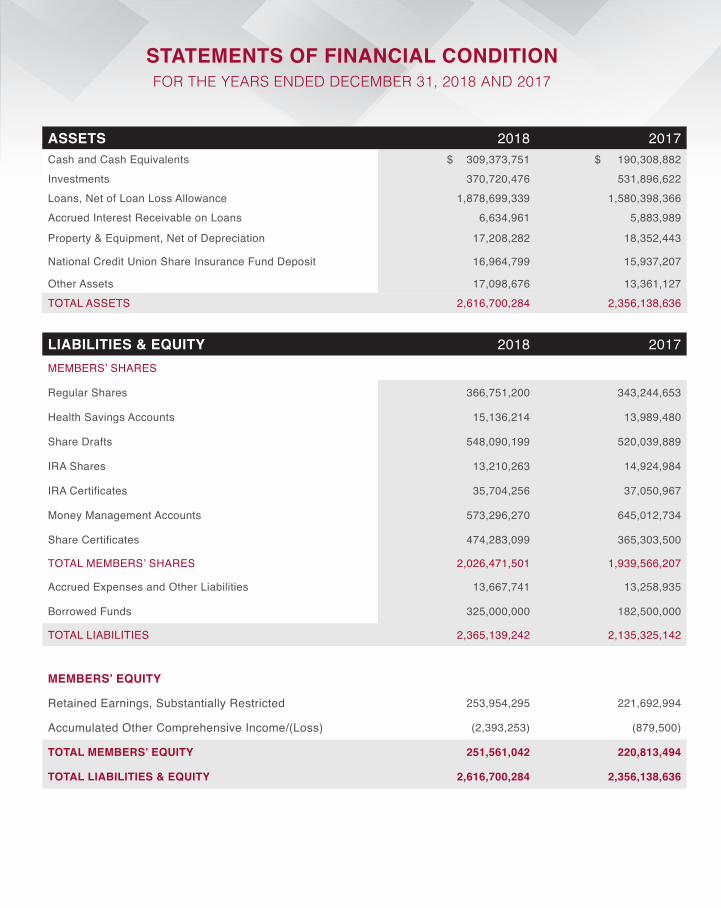
STATEMENTS OF FINANCIAL CONDITIONFOR THE YEARS ENDED DECEMBER 31, 2018 AND 2017
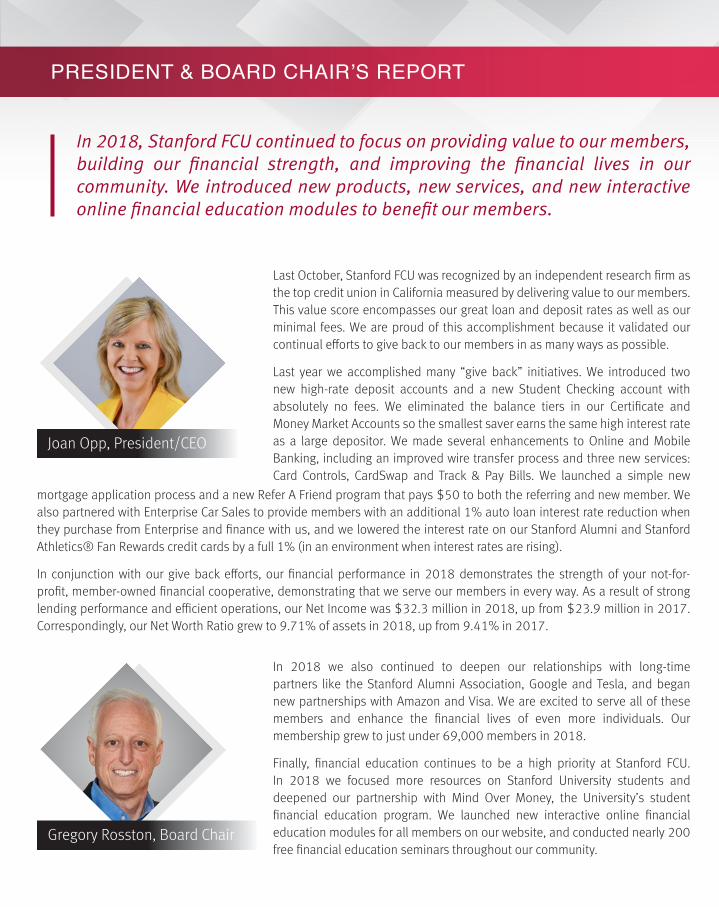
Last October, Stanford FCU was recognized by an independent research firm as the top credit union in California measured by delivering value to our members. This value score encompasses our great loan and deposit rates as well as our minimal fees. We are proud of this accomplishment because it validated our continual efforts to give back to our members in as many ways as possible.
Last year we accomplished many “give back” initiatives. We introduced two new high-rate deposit accounts and a new Student Checking account with absolutely no fees. We eliminated the balance tiers in our Certificate and Money Market Accounts so the smallest saver earns the same high interest rate as a large depositor. We made several enhancements to Online and Mobile Banking, including an improved wire transfer process and three new services: Card Controls, CardSwap and Track & Pay Bills. We launched a simple new
Gregory Rosston, Board Chair
Joan Opp, President/CEO
In 2018, Stanford FCU continued to focus on providing value to our members, building our financial strength, and improving the financial lives in our community. We introduced new products, new services, and new interactive online financial education modules to benefit our members.
Tana Hutchison, Treasurer
Supervisory Committee Report | Neil Hamilton
The Supervisory Committee provides oversight of financial reporting and compliance activities and reports to Stanford FCU’s Board of Directors. The Committee’s primary responsibilities are:
Determining that management has maintained effective internal controls to achieve the credit union’s financial reporting requirements;
Ensuring that accounting records accurately reflect the credit union’s operations and results;
Reviewing the policies and control procedures established by the Board of Directors;
Ensuring that management practices and policies continue to safeguard member assets; and
Assessing the policies and control procedures that safeguard against errors, conflicts of interest, and fraud.
Neil Hamilton, Chair
Treasurer’s Report | Tana Hutchison
2018 was a strong financial year for Stanford FCU, as supported by the audited financial statements. Net income for the year ending December 31, 2018 was $32.3 million with a Return on Assets of 1.30%, mostly due to loan originations exceeding expectations. As a testament to maintaining minimal fees for members, our Fee Income represented only 1.1% of Earnings and we rebated over $380,000 in fees to our Partner and Ambassador members during the year.
The loan portfolio ended 2018 with a balance of over $1.88 billion (net of allowance), a net increase of nearly $300 million from the prior year. This indicates that we were able to fund the borrowing needs of thousands of members, including funding new loans of nearly $500 million in real estate loans and almost $100 million in new consumer loans.
ASSETS 2018 2017Cash and Cash Equivalents $ 309,373,751 $ 190,308,882 Investments 370,720,476 531,896,622Loans, Net of Loan Loss Allowance 1,878,699,339 1,580,398,366 Accrued Interest Receivable on Loans 6,634,961 5,883,989
Property & Equipment, Net of Depreciation 17,208,282 18,352,443
National Credit Union Share Insurance Fund Deposit 16,964,799 15,937,207
Other Assets 17,098,676 13,361,127 TOTAL ASSETS 2,616,700,284 2,356,138,636
LIABILITIES & EQUITY 2018 2017MEMBERS’ SHARES
Regular Shares 366,751,200 343,244,653
Health Savings Accounts 15,136,214 13,989,480
Share Drafts 548,090,199 520,039,889
IRA Shares 13,210,263 14,924,984
IRA Certificates 35,704,256 37,050,967
Money Management Accounts 573,296,270 645,012,734
Share Certificates 474,283,099 365,303,500
TOTAL MEMBERS’ SHARES 2,026,471,501 1,939,566,207
Accrued Expenses and Other Liabilities 13,667,741 13,258,935
Borrowed Funds 325,000,000 182,500,000
TOTAL LIABILITIES 2,365,139,242 2,135,325,142
MEMBERS’ EQUITY
Retained Earnings, Substantially Restricted 253,954,295 221,692,994
Accumulated Other Comprehensive Income/(Loss) (2,393,253) (879,500)
TOTAL MEMBERS’ EQUITY 251,561,042 220,813,494
TOTAL LIABILITIES & EQUITY 2,616,700,284 2,356,138,636
Based on the financial statements included in this report and the Committee’s oversight work, I can confidently report that Stanford FCU was financially sound and operated in compliance with all state and federal regulations during 2018. This assessment is supported by the regulatory examination performed by the National Credit Union Administration, the independent audit performed by the accountancy firm of Clifton Larson Allen, LLP, as well as the internal audits conducted by the accounting firm of Crowe, LLP. The Committee also welcomes and reviews member comments and inquiries regarding Stanford FCU’s operations and policies. Members may contact us at [email protected].
The credit union ended the year with just over $2.6 billion in assets, which was an 11.1% increase from the prior year. Stanford FCU is in the top 100 credit unions in the nation by asset size. Deposit balances from our members increased to over $2.0 billion for the first time.
PRESIDENT & BOARD CHAIR’S REPORT SUPERVISORY COMMITTEE & TREASURER’S REPORT
mortgage application process and a new Refer A Friend program that pays $50 to both the referring and new member. We also partnered with Enterprise Car Sales to provide members with an additional 1% auto loan interest rate reduction when they purchase from Enterprise and finance with us, and we lowered the interest rate on our Stanford Alumni and Stanford Athletics® Fan Rewards credit cards by a full 1% (in an environment when interest rates are rising).
In conjunction with our give back efforts, our financial performance in 2018 demonstrates the strength of your not-for-profit, member-owned financial cooperative, demonstrating that we serve our members in every way. As a result of strong lending performance and efficient operations, our Net Income was $32.3 million in 2018, up from $23.9 million in 2017. Correspondingly, our Net Worth Ratio grew to 9.71% of assets in 2018, up from 9.41% in 2017.
In 2018 we also continued to deepen our relationships with long-time partners like the Stanford Alumni Association, Google and Tesla, and began new partnerships with Amazon and Visa. We are excited to serve all of these members and enhance the financial lives of even more individuals. Our membership grew to just under 69,000 members in 2018.
Finally, financial education continues to be a high priority at Stanford FCU. In 2018 we focused more resources on Stanford University students and deepened our partnership with Mind Over Money, the University’s student financial education program. We launched new interactive online financial education modules for all members on our website, and conducted nearly 200 free financial education seminars throughout our community.

STATEMENTS OF FINANCIAL CONDITIONFOR THE YEARS ENDED DECEMBER 31, 2018 AND 2017
Last October, Stanford FCU was recognized by an independent research firm as the top credit union in California measured by delivering value to our members. This value score encompasses our great loan and deposit rates as well as our minimal fees. We are proud of this accomplishment because it validated our continual efforts to give back to our members in as many ways as possible.
Last year we accomplished many “give back” initiatives. We introduced two new high-rate deposit accounts and a new Student Checking account with absolutely no fees. We eliminated the balance tiers in our Certificate and Money Market Accounts so the smallest saver earns the same high interest rate as a large depositor. We made several enhancements to Online and Mobile Banking, including an improved wire transfer process and three new services: Card Controls, CardSwap and Track & Pay Bills. We launched a simple new
Gregory Rosston, Board Chair
Joan Opp, President/CEO
In 2018, Stanford FCU continued to focus on providing value to our members, building our financial strength, and improving the financial lives in our community. We introduced new products, new services, and new interactive online financial education modules to benefit our members.
Tana Hutchison, Treasurer
Supervisory Committee Report | Neil Hamilton
The Supervisory Committee provides oversight of financial reporting and compliance activities and reports to Stanford FCU’s Board of Directors. The Committee’s primary responsibilities are:
Determining that management has maintained effective internal controls to achieve the credit union’s financial reporting requirements;
Ensuring that accounting records accurately reflect the credit union’s operations and results;
Reviewing the policies and control procedures established by the Board of Directors;
Ensuring that management practices and policies continue to safeguard member assets; and
Assessing the policies and control procedures that safeguard against errors, conflicts of interest, and fraud.
Neil Hamilton, Chair
Treasurer’s Report | Tana Hutchison
2018 was a strong financial year for Stanford FCU, as supported by the audited financial statements. Net income for the year ending December 31, 2018 was $32.3 million with a Return on Assets of 1.30%, mostly due to loan originations exceeding expectations. As a testament to maintaining minimal fees for members, our Fee Income represented only 1.1% of Earnings and we rebated over $380,000 in fees to our Partner and Ambassador members during the year.
The loan portfolio ended 2018 with a balance of over $1.88 billion (net of allowance), a net increase of nearly $300 million from the prior year. This indicates that we were able to fund the borrowing needs of thousands of members, including funding new loans of nearly $500 million in real estate loans and almost $100 million in new consumer loans.
ASSETS 2018 2017Cash and Cash Equivalents $ 309,373,751 $ 190,308,882 Investments 370,720,476 531,896,622Loans, Net of Loan Loss Allowance 1,878,699,339 1,580,398,366 Accrued Interest Receivable on Loans 6,634,961 5,883,989
Property & Equipment, Net of Depreciation 17,208,282 18,352,443
National Credit Union Share Insurance Fund Deposit 16,964,799 15,937,207
Other Assets 17,098,676 13,361,127 TOTAL ASSETS 2,616,700,284 2,356,138,636
LIABILITIES & EQUITY 2018 2017MEMBERS’ SHARES
Regular Shares 366,751,200 343,244,653
Health Savings Accounts 15,136,214 13,989,480
Share Drafts 548,090,199 520,039,889
IRA Shares 13,210,263 14,924,984
IRA Certificates 35,704,256 37,050,967
Money Management Accounts 573,296,270 645,012,734
Share Certificates 474,283,099 365,303,500
TOTAL MEMBERS’ SHARES 2,026,471,501 1,939,566,207
Accrued Expenses and Other Liabilities 13,667,741 13,258,935
Borrowed Funds 325,000,000 182,500,000
TOTAL LIABILITIES 2,365,139,242 2,135,325,142
MEMBERS’ EQUITY
Retained Earnings, Substantially Restricted 253,954,295 221,692,994
Accumulated Other Comprehensive Income/(Loss) (2,393,253) (879,500)
TOTAL MEMBERS’ EQUITY 251,561,042 220,813,494
TOTAL LIABILITIES & EQUITY 2,616,700,284 2,356,138,636
Based on the financial statements included in this report and the Committee’s oversight work, I can confidently report that Stanford FCU was financially sound and operated in compliance with all state and federal regulations during 2018. This assessment is supported by the regulatory examination performed by the National Credit Union Administration, the independent audit performed by the accountancy firm of Clifton Larson Allen, LLP, as well as the internal audits conducted by the accounting firm of Crowe, LLP. The Committee also welcomes and reviews member comments and inquiries regarding Stanford FCU’s operations and policies. Members may contact us at [email protected].
The credit union ended the year with just over $2.6 billion in assets, which was an 11.1% increase from the prior year. Stanford FCU is in the top 100 credit unions in the nation by asset size. Deposit balances from our members increased to over $2.0 billion for the first time.
PRESIDENT & BOARD CHAIR’S REPORT SUPERVISORY COMMITTEE & TREASURER’S REPORT
mortgage application process and a new Refer A Friend program that pays $50 to both the referring and new member. We also partnered with Enterprise Car Sales to provide members with an additional 1% auto loan interest rate reduction when they purchase from Enterprise and finance with us, and we lowered the interest rate on our Stanford Alumni and Stanford Athletics® Fan Rewards credit cards by a full 1% (in an environment when interest rates are rising).
In conjunction with our give back efforts, our financial performance in 2018 demonstrates the strength of your not-for-profit, member-owned financial cooperative, demonstrating that we serve our members in every way. As a result of strong lending performance and efficient operations, our Net Income was $32.3 million in 2018, up from $23.9 million in 2017. Correspondingly, our Net Worth Ratio grew to 9.71% of assets in 2018, up from 9.41% in 2017.
In 2018 we also continued to deepen our relationships with long-time partners like the Stanford Alumni Association, Google and Tesla, and began new partnerships with Amazon and Visa. We are excited to serve all of these members and enhance the financial lives of even more individuals. Our membership grew to just under 69,000 members in 2018.
Finally, financial education continues to be a high priority at Stanford FCU. In 2018 we focused more resources on Stanford University students and deepened our partnership with Mind Over Money, the University’s student financial education program. We launched new interactive online financial education modules for all members on our website, and conducted nearly 200 free financial education seminars throughout our community.
FEDERALLY INSURED BY NCUA
2018 ANNUAL REPORTGregory RosstonChair
Dr. Frank SarnquistVice Chair
Tana HutchisonTreasurer
Dan KolkowitzSecretary
Dr. Shirley Everett
Curtis Feeny
Susan Kingston
Joan Opp
Robert Reidy
Jon Dreyfus
Jerry Jobe
Jane Duperrault
Jerry Jobe
Timothy Warner
Neil HamiltonChair
Susan Kingston
Desmond Low-Kum
David MacKenzie
Archna Mehta
Joan OppPresident/CEO
Amber DanfordSVP/Chief Operation Officer
Brian ThorntonSVP/Chief Lending Officer
Brian ZeitlerSVP/Chief Information Officer
Paul JockischSVP/Interim Chief Financial Officer
650.723.2509
888.723.7328
sfcu.org
P. O. Box 10690 Palo Alto, CA 94303-0843
INTEREST INCOME 2018 2017
Interest on Loans $ 72,421,266 $ 56,162,385
Interest on Investments and Cash Equivalents 12,752,648 12,701,084
TOTAL INTEREST INCOME 85,173,914 68,863,469
INTEREST EXPENSEDividends Paid on Members’ Shares 11,730,106 8,755,466
Interest on Borrowed Funds 5,406,618 2,447,421
TOTAL INTEREST EXPENSE 17,136,724 11,202,887
NET INTEREST INCOME 68,037,190 57,660,582
Provision for Loan Losses Expense 3,500,000 2,070,000
NET INTEREST INCOME After Provision for Loan Losses 64,537,190 55,590,582
Other Non-Interest and Fee Income 11,737,290 10,277,211
TOTAL NET INTEREST AND FEE INCOME 76,274,480 65,867,793
GENERAL AND ADMINISTRATIVE EXPENSESCompensation and Benefits 24,862,018 23,453,303
Operations 7,450,849 6,630,045
Other General and Administrative 11,700,312 11,925,258
TOTAL OPERATING EXPENSES 44,013,179 42,008,606
NET INCOMETOTAL NET INCOME 32,261,301 23,859,187
RETURN ON ASSETS 1.30% 1.07%
GENERAL CAPITAL REQUIREMENTSAmount Required to Be Classified as “Adequately Capitalized” 6.00% 157,002,017 141,368,318
Amount Required to Be Classified as “Well Capitalized” 7.00% 183,169,020 164,929,705
ACTUAL REGULATORY NET WORTH 253,954,295 221,692,994
9.71% 9.41%
ADVISORY BOARD
BOARD OF DIRECTORS
EXECUTIVE STAFF
SUPERVISORY COMMITTEE
STATEMENTS OF INCOMEFOR THE YEARS ENDED DECEMBER 31, 2018 AND 2017
EMERITUS BOARD MEMBERS