Embed Size (px)
Citation preview

1
FINANCIAL STATEMENTS 2013
BUILDING THE BIGGER PICTURE
2
CONTENTS
FINANCIAL STATEMENTS 2013
Report of the Board of Directors 3 Consolidated income statement and consolidated statement of comprehensive income (IFRS) 8Consolidated balance sheet (IFRS) 9Consolidated cash flow statement (IFRS) 10Consolidated statement of changes in equity 11 1. Accounting principles 12 2. Business operations sold 20 3. Revenue 20 4. Long-term projects 20 5. Material and services 20 6. Other operating income and expenses 20 7. Depreciations 20 8. Impairments 20 9. Employee benefits 21 10. Research and development expenses 21 11. Financial income and expenses 21 12. Income taxes 21 13. Discontinued operations 22 14. Earning per share 22 15. Tangible assets 23 16. Goodwill 23 17. Impairment tests 24 18. Other intaglible assets 25 19. Available receivables and other receivables 25 20. Inventories 26 21. Account receivables and other receivables 26 22. Cash and cash equivalents 26 23. Deferred tax assets and liabilities 27 24. Equity 28 25. Financial liabilities 29 26. Account payable and other liabilities 30 27. Pension obligations 30 28. Provisions 31 29. Financial risk management 32 30. Other lease agreement 35 31. Conditional liabilities and assets 35 32. Insiders 35 33. Events after the end of the reporting
period 35
Group´s key figures 36Parent company income statement (FAS) 37Parent company balance sheet (FAS) 38Parent company cash flow statement (FAS) 40Notes to financial statements, Parent company Destia Ltd. (FAS) 41Notes to income statement, Parent company Destia Ltd. (FAS) 41Board of Director’s proposal on the use of distributable assets 47Auditor’s report 48Consolidated income statement, quarterly figures 49Consolidated balance sheet, quarterly figures 50Consolidated cash flow statement, quarterly figures 51
3
REPORT OF TH E BOARD OF D I R E CTO R S
Operating environment
Uncertainty in the economy continued during 2013, which had a negative effect on the economic operating environment in infrastructure construction and on the availability of financing for projects. A slight decline in the infrastructure construction market during the year under review was due to a slowdown in house-building construction. Public infrastructure investments remained stable, while private infrastructure investments de-creased. Numerous new road development projects were put out to tender in 2013. In the next few years too, public sector project programmes will offer major projects, which will generate a base level of demand for the infrastructure construction sector, despite a decline in the market as a whole. The slowdown of the entire construction market can especially be seen in a lower demand for aggregates. The rather low amount of work currently available in infrastructure planning is cause for longer term concern.
According to a joint economic forecast made by the Tampere University of Applied Sciences and VTT Technical Research Centre of Finland, infrastructure construction and maintenance shrank 3.5 per cent in 2013. The municipal market was sluggish in the year ended, even though there were signs of life in growth municipalities, especially in the Greater Helsinki area. Competi-tion for projects increased.
The economic conditions of the civil engineering sector were affected by the general economic development, the public sector financial deficit, the level of costs that has remained high, and the decline in house-building construction.
According to an economic report by the Finnish Ministry of Finance, civil engineering production is contracting in 2013 for the fifth consecutive year, but more gently than before. Last year the decline was 6.8 per cent and this year it is expected to be 3.2 per cent.
Civil engineering sector costs rose 0.8 per cent from December 2012 to December 2013. According to Statistics Finland, the annual change in costs varied by sub- index, from -2.1 per cent in surfacings to 2.8 per cent in rock structures.
IFRS financial statements
Since 2011, the consolidated financial statements have been prepared in accordance with International Financial Reporting Standards (IFRS). The 2013 interim reports with reference data have been prepared in accordance with IFRS regulations. Prior to this, the Group's financial reporting was based on the Finnish Accounting Standards (FAS). The Group adopted the IFRS on 1 January 2010.
The effect of the closure of business operations in Norway is presented under Discontinued operations.
Business development
In the 1 January–31 December 2013 accounting period, the op-erations of the Destia Group (hereinafter Destia) consisted of four regional and two operational business units. The regional business units providing infrastructure construction and maintenance servic-es are Southern Finland, Western Finland, Eastern Finland and Northern Finland. Their business includes the construction and maintenance of traffic routes, industrial and traffic environments and the complete living environment, as well as the services of the winter maintenance management centre, Kelikeskus. The Special
Construction business unit is responsible for railway construction and railway infrastructure maintenance, rock and mining construc-tion, aggregates services as well as the Group's own fleet service. Destia's other operational business unit, Consulting Services, takes care of design, surveying and international consultation.
During the accounting period, Destia's revenue from continuing operations amounted to EUR 489.7 million (EUR 507.3, 2012) and EUR 143.3 million (134.6) in the fourth quarter. The im-proved fourth quarter revenue over the previous year was due to favourable weather conditions. The annual revenue for continuing operations fell 3.5 per cent from the previous year. This drop in revenue was due not only to an overall slowdown in the market, but also a failure to win tenders for several major projects.
Key orders received during the year, and the order book
Destia's order book at year-end, EUR 593.0 million (600.8), was 1.3 per cent less than the previous year. In a tightened market sit-uation, the company's tendering activities had a negative impact on order book development.
In the fourth quarter of 2013, Destia won a significant track con-tract, which supports the company’s objectives of growing on the track maintenance and construction markets. The Maintenance Area 5 track and safety equipment maintenance contract put out to tender by the Finnish Transport Agency covers the period 2014−2019 plus two optional years. The maintenance area includes track sections from Haapamäki to Orivesi, Jyväskylä, Vaasa and Kaskinen, as well as from Jyväskylä to Äänekoski.
In the fourth quarter, Destia signed agreements with the munic-ipality of Kempele for the 2014 delivery of aggregates, with the City of Pori for renovation of the Pori Bridge, and with the Finnish Transport Agency for project management of the 2014 InfraTee-ma project.
During the accounting period, Destia won the construction contract put out to tender by Länsimetro for the tunnel section between Keilaniemi and Lauttasaari. The contract includes construction and structural engineering work of the metro tunnel over a 4 km distance between Keilaniemi and Lauttasaari. Work on the contract began in early March 2013 and is expected to be completed in September 2014.
Destia won the contract put out to tender by the Finnish Transport Agency for the construction of a double track in the Riippa−Eskola track section. The contract entails the renovation of old track and the construction of new track over a 30-km distance. The contract also includes the construction of new linesides, bridges, service and private roads as well as the conversion of the track’s elec-trification system to conform to double-track requirements. The contract is expected to be completed in November 2016.
In 2013, Destia won and carried out the maintenance contract for bridges put out to tender by the Uusimaa Centre for Economic De-velopment, Transport and the Environment (ELY Centre). The contract included the repair of 21 bridges, primarily in the Greater Helsinki area. The contracted work will be completed by the end of the year.
Destia implements the contract for the first stage of the construction of streets, municipal engineering and blocks in the Lakari industrial and logistics area to be built in Rauma. The contract started in Feb-ruary 2013, and is expected to be completed in spring 2014.
In public tendering for regional main road maintenance contracts in 2013, Destia won seven out of 12. The Huittinen, Jämsä, Pu-
4
dasjärvi−Taivalkoski, Vaasa, Suomussalmi and Paimio contracts won are five years in duration, and the Nurmes contract is seven years. All in all, Destia maintained its good market position in the regional maintenance of main roads.
Destia signed contracts with the Centres for Economic Develop-ment, Transport and the Environment in Northern Ostrobothnia, Lapland and North Savo to transfer the Kuusamo, Ivalo and Pieksämäki regional main road maintenance contracts to Destia’s responsibility in the middle of the maintenance period. All three regional contracts are one year in duration.
Destia signed a contract with the City of Joensuu for Joensuu’s southern regional contract. This contract will last until the end of September 2016.
Destia won the contract put out to tender by the Central Finland Centre for Economic Development, Transport and the Environment for the upgrading of National Road 56 between Jämsä and Mänttä. The planned completion of the contract is in December 2014.
Destia’s Consulting Services is involved in a consortium that won the project put out to tender by the Finnish Transport Agency that includes ground surveys of Pisararata.
Destia signed a contract with the Finnish Transport Agency for the service level measurements of surfaced roads during 2014−2019.
Destia also won the Technopark II parking project in Lappeenran-ta, which is scheduled for completion in June 2014.
Destia signed a contract for the first stage of the Kivikontie interchange put out to tender by the City of Helsinki, which will be completed in September 2014. A contract was also signed for track renewal between Myllymäki and Tuuri put out to tender by the Finnish Transport Agency, which will be completed in July 2014.
Contracts put out to tender by the Port of Oulu, for the second phase of its West Quay construction project, which started at the end of August and will be completed at the end of 2014, and by the Northern Ostrobothnia ELY Centre, for light traffic arrange-ments on National Road 27 in Ylivieska, were also signed. The planned completion of the contract is in September 2014.
The E18 Koskenkylä−Kotka life-cycle project, which was ongoing in 2013, has proceeded according to plan. The Main Road 51 Kiven-lahti–Kirkkonummi improvement project was completed in October 2013. The project will continue with the maintenance of surfacings, road structures and bridge structures for a period of 15 years.
Group performanceGroup’s key figures (IFRS), MEUR 1-12/2013 1-12/2012Revenue, continuing operations 489.7 507.3Operating result, continuing operations 18.9 14.0% of revenue 3.9 2.8Result for the period, continuing operations 12.5 11.1
% of revenue 2.6 2.2Result for the period 14.9 10.8Return on investment, % 22.1 12.5Equity ratio, % 44.0 35.2Net gearing, % -51.6 -40.5Average personnel 1,515 1,591Occupational accidents resulting in absence from work *) 10.8 15.6
Order book at the end of period 593.0 600.8*) Occupational accidents of Destia’s own personnel per one million working hours
The operating result for continuing operations during the ac-counting period was EUR 18.9 million (14.0). Relative profitability improved significantly to 3.9 per cent (2.8).
The result, which was fundamentally better than the previous year, was made possible by an improvement in the average prof-itability of projects and a significantly lower level of fixed costs than in previous years.
Other operating profit for the reporting period was EUR 5.3 mil-lion (5.3). For the most part, it is made up of rental proceeds and property- and fleet-related capital gains.
The result for the accounting period was weakened by Destia having to pay a total of EUR 2.1 million in compensation, includ-ing penalty interest and legal fees, ordered in arbitration. The final impact of this payment on Destia's operating profit was EUR 1.3 million and on financial costs EUR 0.5 million. The dispute concerned old contracts carried out in 2008.
The financial targets set for the 2010−2013 strategy period were met in return on investment and equity ratio. The operating profit percentage also nearly reached its target, despite the challenging market trends. The growth target was not met. The targets were: operating profit 4.0 per cent; return on investment 15.0 per cent; equity ratio 35.0 per cent; and a faster rate of growth in revenue than the market growth rate.
Balance sheet, cash flow and financing
The total assets on the consolidated balance sheet at the end of the accounting period were EUR 220.0 million (223.5). Return on investments was 22.1 per cent (12.5), equity ratio 44.0 per cent (35.2) and net gearing 51.6 per cent (-40.5).
The Group's liquidity is very good. Cash flow for the accounting period comprised an operating cash flow of EUR 14.9 million (39.1), an investment cash flow of EUR -1.2 million (-1.4) and a financing cash flow of EUR -20.3 million (-30.5). Operating cash flow showed a sharp development at the end of 2012, which had a reductive effect on operating cash flow at the beginning of 2013. Investment cash flow includes the maturing of a EUR 25 million investment held until the due date and its maturity. In May, the Group prematurely amortised long-term loans to the value of EUR 20 million. The interest rate swap related to the loan was reduced by a corresponding amount causing a non-recurring financial cost of EUR 1.0 million, which is included in operating cash flow. The interest rate swap hedging the remaining long-term loan no longer meets the hedge accounting requirements of the IFRS, which is why in future it will be valued at fair value through profit and loss.
The cash and cash equivalents on the consolidated balance sheet at the end of the accounting period were EUR 54.5 million (61.1). During the accounting period, the Group's EUR 150 million in commercial papers and EUR 31.1 million short-term credit limits were not used (these were also not used during the reference period). As a result of the premature amortisation of the EUR 20 million loan, the amount of liabilities fell to EUR 11.2 million (32.9) at the end of the accounting period. Of all loans, 2.0 per cent (1.0) are short-term and 98.0 per cent (99.0) long-term. Interest-bearing net liabilities at the end of the accounting period were EUR -43.3 million (-28.1), meaning that the company was free of net liabilities.
The Group's net financial costs during the accounting period were EUR 2.2 million (3.1), or 0.4 per cent (0.6) of revenue. Fourth
5
quarter financial costs were increased by the EUR 0.5 million in penalty interest that Destia was ordered to pay in arbitration. A reduction in financial costs was primarily due to the low amount of interest-bearing net liabilities. Non-recurring items increased the net financial items by a total of EUR 1.5 million dur-ing the accounting period. Income taxes in the reporting period amounted to EUR 4.2 million (in the reference period, EUR 0.2 million negative).
Protection against currency, commodity and interest risks has been organised in accordance with the Group’s treasury policy
Shares and share capital
The registered share capital of Destia Ltd is EUR 17.0 million and its total number of shares is 680,000. The company is owned 100 per cent by the State of Finland.
Investments and divestments
During the reporting period, gross investments made totalled EUR 9.5 million (7.3), or 1.9 per cent (1.4) of revenue. Investments were mainly targeted at the fleet, but also at data systems and holiday timeshares for the recreational use of personnel.
Annual General Meeting 2013 and administration
Destia Ltd’s Annual General Meeting held on 18 March 2013 confirmed the company’s financial statements for 2012 and discharged the members of the Board of Directors and the President & CEO from liability for the accounting period 1 Janu-ary–31 December 2012. The Annual General Meeting decided, as proposed by the Board of Directors, that no dividends be paid for the accounting period ending 31 December 2012.
The Annual General Meeting ratified the total number of members in the Board of Directors as five and reappointed Karri Kaitue as the Chairman of the Board of Directors. Kalevi Alestalo, Elina Engman, Matti Mantere and Solveig Törnroos-Huhtamäki were re-elected as members of the Board of Directors.
The Annual General Meeting elected Deloitte & Touche Ltd (Au-thorised Public Accountants) as Destia Oy’s auditor for the 2013 accounting period, with Aleksi Martamo (APA) as the auditor with principal responsibility.
At its organising meeting, the Board reappointed Matti Mantere as Vice Chairperson.
Two committees were appointed to support the work of the Board: a Nomination and Compensation Committee, and an Audit Committee. In accordance with Destia’s administration and management system, the Chairman of the Board, Karri Kaitue, will continue as the Chairperson of the Nomination and Com-pensation Committee. Kalevi Alestalo and Elina Engman were elected as the Committee's members. Matti Mantere was elected as the Chairperson of the Audit Committee, with Kalevi Alestalo and Solveig Törnroos-Huhtamäki as members.
The Annual General Meeting decided to keep the compensations of the Board members unchanged: monthly compensation for the Board’s Chairperson was EUR 3,300. The monthly compensation for the Vice Chairperson was EUR 1,800, and the other members of the Board each received EUR 1,500 as monthly compensa-tion. In addition to the monthly compensation, all members of
the Board were paid EUR 600 each as a participation fee for every Board and committee meeting. Travel costs are remitted in accordance with Destia’s travel regulations.
Management and personnel
At the beginning of 2013, Destia streamlined the work of its management team in order to enhance the control of customer work and to meet rapid changes in the market situation. The Group Management Team comprises President & CEO Hannu Leinonen, CFO Pirkko Salminen, and Executive Vice Presi-dents Minna Heinonen, Pasi Kailasalo, Jouni Karjalainen, Jukka Raudasoja, Marko Vasenius and Seppo Ylitapio, and personnel representative Kimmo Laaksola. In addition, Extended Manage-ment Team was established to prepare and guide development projects and strategy concerning the entire Group and to develop the management system. In addition to the persons mentioned above, the Extended Management Team also includes Senior Vice Presidents Laura Ahokas, Miia Apukka, Aki Markkola and Tom Schmidt.
The Group’s average number of personnel during the reporting period was 1,515 (1,591). At the end of December, the number of personnel was 1,465 (1,502), 1,375 (1,417) of which were perma-nent staff and 90 (85) temporary employees. Due to the season-ality of the business, the number of personnel varies during the year, peaking in the summer.
Collective labour agreements concerning infrastructure industry employees and salaried staff were signed on 17 November 2011. The contractual period for both agreements is 1 March 2012−31 March 2014.
On 24 June 2013, Destia Ltd concluded redundancy nego-tiations under the Act on Co-operation within Undertakings aimed at reducing the number of employees working in regional maintenance contracts, as a consequence of the results of the tendering of regional contracts. As a result of the negotiations, Destia Ltd made seven drivers redundant. The redundancies were implemented during 2013.
On 14 February 2013, Destia’s Board of Directors decided on a bonus scheme for 2013 covering all personnel. The bonus scheme forms a part of the overall personnel reward scheme. The bonus scheme brings a supportive, in-house co-operation and strategy enhancing control and reward element to compen-sation. The scheme will support and develop the company’s prof-itability and operating conditions. The target group for the new bonus scheme is comprised of three different personnel groups: 1) personnel working on Destia projects; 2) work supervisors; and 3) support function personnel and business unit support person-nel, including management.
On 14 February 2013, the Destia Board of Directors decided on the establishment and implementation of a long-term incentive scheme. The purpose of the scheme is to combine shareholder and management objectives in order to increase the value of the company as well as to get management to commit to the com-pany and offer them a competitive bonus scheme. The scheme features three separate three-year earnings periods, 2013–2015, 2014–2016 and 2015–2017. For each earnings period, the Board of Directors will decide on the earnings criteria, the targets set for them and the persons included in the scheme. The earnings criteria for earnings period 1 January 2013–31 December 2015 is the Group's cumulative 2013−2015 EBITDA adjusted with chang-es in net liabilities. At the Board meeting held on 19 December
6
2013, it was decided that the earnings criteria for earnings period 1 January 2014–31 December 2016 would be, correspondingly, the Group's cumulative 2014-2016 EBITDA adjusted with chang-es in net liabilities. Any bonuses earned during the earnings period 2014–2015 would be paid in money in the spring of 2020. The target group for earnings period 2014–2016 currently con-sists of 15 persons, including business unit and support function heads and the President and CEO. The Board of Directors is also authorised to review the remuneration paid, if needed.
The company’s remuneration schemes correspond to the opinion given on 13 August 2012 by the Cabinet Committee on Econom-ic Policy about compensation paid to company management and key personnel.
In 2013, the Group's staff costs remained on a par with the previous year at EUR 86.9 million (86.5), or 17.7 per cent (17.4) of revenue. Staff costs include the EUR 5.5 million (3.9) in perfor-mance and incentive bonuses for all personnel.
The improvement of safety is a key challenge for the construction field, since it substantially impacts productivity in the field and its attractiveness as an employer. Occupational health and safety are provided for in accordance with a separate occupational health and safety policy. The results of actions taken are meas-ured regularly. In 2013, Destia's personnel accident frequency, i.e. the number of workplace accidents leading to at least one day of absence per one million working hours, was 10.8 (15.6).
In 2013, Destia continued investments in human resources devel-opment. Some 600 Destia employees have taken part in the Tah-To training programme, which supports managerial work and per-formance management. All Destia employees have gone through the TahTo2 training programme. The TahTo2 training programme included the basic elements of performance management as well as occupational safety matters, analysis of the personnel survey results and addressing a discussion model.
Litigation and disputes
In January 2013, the environmental authority made a request to investigate Destia’s Harjula soil area at Mäntsälä. In summer 2012, on its own initiative Destia informed the environmental authority that soil had by mistake been taken from outside the extraction area covered by the valid permit, but from property owned by the company. Destia continues to investigate the mat-ter in co-operation with the environmental authority.
The Supreme Administrative Court rejected Destia’s right to appeal in spring 2013 concerning the excessive taking of soil in Hartola. Therefore, the decision on the matter given in 2011 by the Court of Appeal remains final. The Court of Appeal fined Destia’s two work supervisors for environmental offences and ordered Destia Ltd to pay compensation.
In a decision given by the District Court of Helsinki on 31 May 2013, Destia has won its civil case in which Telasteel Oy de-manded about EUR 1 million in compensation from Destia. The dispute concerned a contract in which Telasteel was a subcon-tractor for Destia. Telasteel has appealed the decision at the Court of Appeal. In Destia’s view, the demand is groundless.
The arbitration proceedings in a dispute between Destia and Rakennusliike Lehto Oy ended in November 2013 to the benefit of Rakennusliike Lehto Oy. The arbitration proceedings con-cerned a subcontracting contract for nine business properties in
2008. Destia was ordered to pay Rakennusliike Lehto Oy EUR 1.5 million in damages for contracts lost as well as legal expenses and penalty interest. Of the compensation, EUR 1.3 million had an impact on Destia’s 2013 operating result and EUR 0.5 million on financial costs. The decision of the arbitration proceedings cannot be appealed.
Short-term risks and uncertainties
In recent years, risk management has been developed at Destia in a variety of manners. The key risk-management guidelines and principles have been compiled in the company’s new risk man-agement policy ratified by the Board of Directors on 28 August 2013.
Destia’s risk management policy describes the main principles, responsibilities and modes of operation of risk management. To implement the policy, more detailed procedures for the various fields of the company's operations have been devised. The risk management policy is based on The Finnish Corporate Govern-ance Code and the international COSO ERM and SFS-ISO 31000 (”Risk management. Principles and Guidelines”) frameworks.
Destia divides risks into market and operating environment risks, operational risks, damage risks, and financial and financing risks.
The fluctuation in the economic operating environment and the uncertainty in the market situation are causing a significant risk for Destia’s business. Although the number of public infrastruc-ture projects has so far remained stable, all in all the amount of infrastructure construction is expected to decline. Public sector investments in infrastructure construction are declining and economic uncertainty has also reduced the willingness of the private sector to invest. The contracting market is reflected in the competitive situation in the sector and, in Destia’s core business areas, the competitive situation is expected to remain fierce. Suc-cess in tendering for regional main road maintenance contracts as well as major contracts is of paramount importance.
In the management of risks caused by the operating environ-ment, it is essential to focus on the selected business areas, and to ensure the operational cost-efficiency, solidity, as well as readiness to react in varying situations.
The most significant operational risks concern project manage-ment and profitability. Uncertainty in terms of project profitability is being created by the potential increase of input prices and the ability to manage project-related risks. The key factors in reaching project targets are active project management from tender calculation to implementation, cost monitoring, ensuring resources and developing project management expertise.
Destia has invested in the reliable financial reporting of essen-tial content, which is a requirement for the identification and assessment of financial risks. The reliability of financial reports is ensured through monitoring and by developing control methods. Risks concerning the financial reporting process are managed through uniform operating methods and by ensuring the reliability of reporting tools used.
Fluctuations in economic conditions may cause considerable changes on financial markets. Destia manages its financial risks in accordance with the company’s treasury policy and hedg-es fundamental risks by derivative contracts. The company’s freedom from net liabilities significantly reduces financial risks. Changes in the prices of oil-based commodities, in particular,
7
cause uncertainty for the profitability of the company. The risk is being prevented by monitoring and assessing the commodity price development, by ensuring key procurements economically from a project perspective, and by hedging the price risks using derivative instruments.
In Destia’s damage risk management, the key factors are proac-tive project management procedures, investments in occupation-al safety and ensuring adequate insurance cover.
Environmental issues
Destia holds the international combined ISO 9001 and 14001 quality and environmental certificate concerning all contracting services, or services for infrastructure construction, infrastructure maintenance consulting, aggregates, and railways. In the ac-counting period, Destia’s operations were conducted in accord-ance with the certification requirements. Operational focus was placed on eco-efficiency, use of natural resources and materials, consumption of fuels and energy, operational environmental safety, and consideration for the areas near locations where Destia operates. Destia’s environmental issues are reported more closely on the company's website.
Research and development
In the accounting period, the focal area in research and devel-opment was the information model-based method expanding around the utilisation of power tool automation, to which mobile data acquisition is also closely linked. A significant part of the development work is included in the field’s RYM Oy PRE research programme. Visibility in the field was especially gained by the model-based quality assurance method and the upgrad-ing of National Road 13, where an accurate initial data model was measured using mobile laser cutting to serve as the basis for model-based planning and implementation. The additional resources targeted at the development of engineering construc-tion have yielded results which can be made use of in service implementation. The renewal of the mobile data acquisition and reporting of infrastructure maintenance services progressed as planned, and the system has been introduced widely in produc-tion. Additionally, several results relating to method and fleet development improving productivity and safety were created. R&D costs totalled some MEUR 1.1 (1.0).
In addition, the company implemented an extensive TahTo train-ing, which supports managerial work and performance man-agement, and a number of significant ICT system development projects were ongoing. The development costs of these activities were MEUR 2.3 (1.9).
Corporate Governance Statement
Destia Ltd’s Corporate Governance Statement will be published separately from this interim report in the company’s 2013 Annual Report on Destia’s website at www.destia.fi.
Events following the reporting period
There have been no major exceptional events after the end of the accounting period.
Strategic direction
On 22 September 2013, the Destia Ltd’s Board of Directors rati-fied the new company strategy for 2014−2022 and the new finan-
cial targets for the 2014−2016 business planning period. The key focus of the strategy is to grow profitably on the infrastructure market through good customer work and by making good use of in-house expertise. Based on this, the Board set the following financial targets for the 2014−2016 business planning period: average growth in revenue of 5 per cent a year, operating profit of 5 per cent by the end of the period, return on investment of more than 15 per cent, and equity ratio of at least 40 per cent.
Destia’s core business are large road projects and infrastructure maintenance requiring special expertise. The focus areas of Destia’s strategic growth in the coming period are in the rock and railways businesses and in energy construction. Destia strongly invests in customer work and the improvement of occupation-al safety. The development of personnel is still the company’s strategic area of focus.
Outlook for 2014
The continuation of economic uncertainty and the tightening of the financial markets in the Eurozone influence the infrastructure market in 2014. With the public infrastructure market remain-ing relatively stable and the level of private sector investments decreasing, the infrastructure market is expected to contract further until 2015. Competition is fierce as the number of major projects decreases and as projects started during previous years are being completed.
Destia’s order book remains at the level of the turn of 2013/2014, with most of it extending till the current year and the next year. The lower than forecast level of the order book and, especially, the poor success in the tendering of major projects in 2013 set a challenge for revenue in 2014. However, the order book together with the measures taken to improve customer work and project management are a good foundation for keeping profitability and cash flow at a good level also in future.
Destia Group’s 2014 revenue and operating profit are expected to remain slightly below the previous year's level.
Proposal by the Board on the use of distributable assets
The profit of the parent company in the accounting period was EUR13,256,966.26, which is proposed to be recorded on the profits and losses account. Destia Ltd’s distributable assets total EUR57,217,630.87, including the invested unrestricted equity fund of EUR56,430,070.64.
Destia Ltd’s Board of Directors proposes to the Annual General meeting that no dividends and no repayment of capital be paid for the accounting period ending 31 December 2013.
8
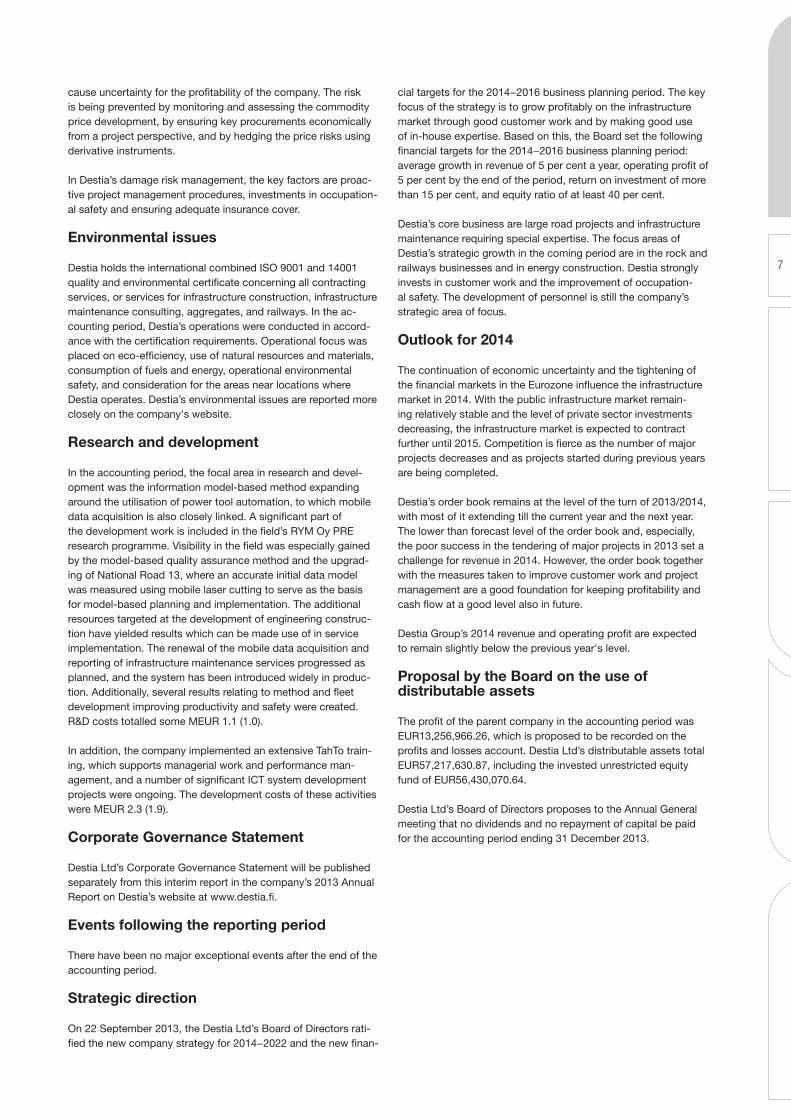
CONSOLIDATED INCOME STATEMENT AND CONSOLIDATED STATEMENT OF COMPREHENSIVE INCOME IFRS EUR 1,000 Note 1 Jan-31 Dec 2013 1 Jan-31 Dec 2012 Continuing operations Revenue 3, 4 489,708 507,272Other operating income 6 5,295 5,277 Materials and services 5 335,392 355,644Employee benefit expenses 9 86,923 86,470Depreciations 7 12,190 13,871Other operating expenses 6 41,557 42,604Operating profit 18,941 13,961 Financial income 11 570 335Financial expenses 11 2,739 3,426Profit before taxes 16,772 10,869 Income taxes 12 4,242 -183Result for the period of continuing operations 12,530 11,052 Discontinued operations Result for the period of discontinued operations 13 2,330 -243 Result for the period 14,860 10,809 Other comprehensive income including tax effects Items that will not be reclassified to profit and loss Actuarial profit and loss from benefit-based pension arrangements -1,332 -757 -1,332 -757Items that may be reclassified subsequently to profit and loss Translation differences of foreign subsidiaries -1 67Cash flow hedges 977 -88 976 -21 Other comprehensive income net of tax -356 -778 Comprehensive income for the financial year 14,504 10,031 Result for the period and comprehensive income for the period belong to parent company shareholders. Earnings per share, EUR 21.85 15.90
9
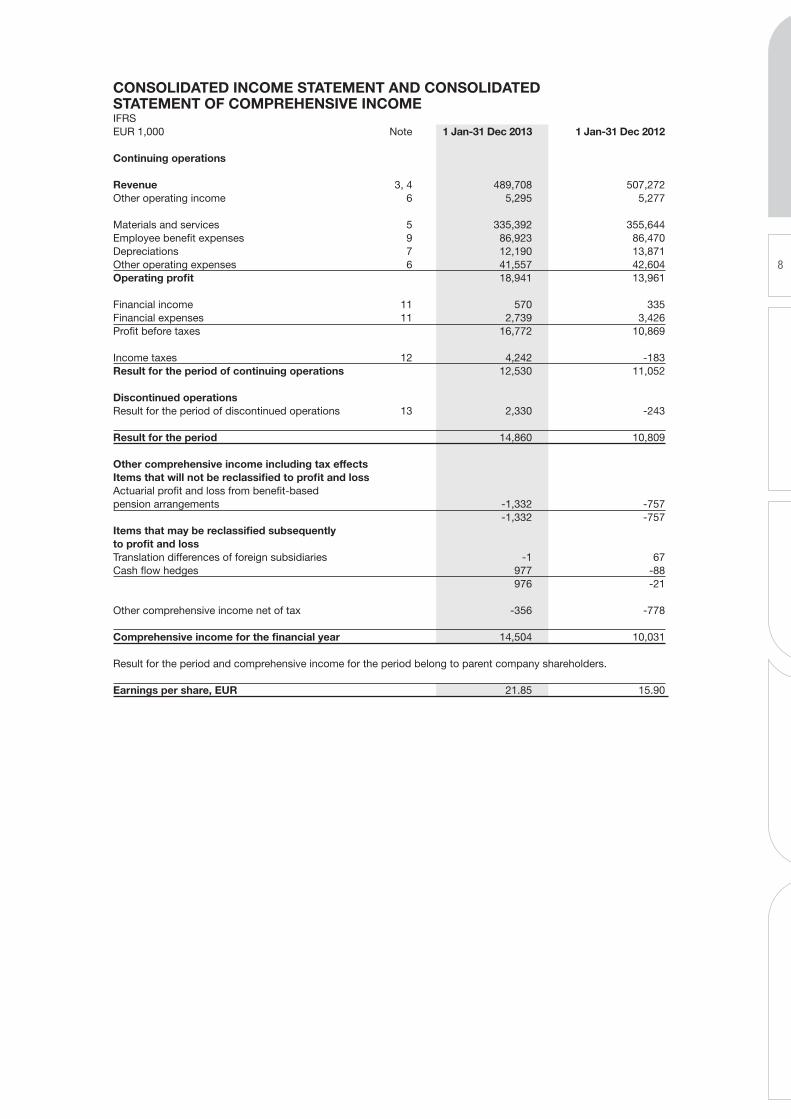
CONSOLIDATED BALANCE SHEET IFRS EUR 1,000 Note 31.12.2013 31.12.2012 ASSETS Non-current assets Tangible assets 15 57,684 66,866Goodwill 16 16,985 16,985Other intangible assets 18 2,355 2,287Pension receivables 27 132Available-for-sale financial assets 19 2,083 1,661Deferred tax assets 23 2,045 4,612Non-current assets, total 81,152 92,542 Current assets Inventories 20 20,619 24,336Accounts and other receivables 21 63,794 45,501Cash and cash equivalents 22 54,467 61,077Current assets, total 138,881 130,915 Assets, total 220,033 223,458 Note 31.12.2013 31.12.2012EQUITY AND LIABILITIES Equity attributable to equity holders of the parent company 24 Share capital 17,000 17,000Invested unrestricted equity fund 56,430 56,430Other items -282 -1,259Retained earnings 10,770 -2,758Equity, total 83,917 69,413 Non-current liabilities Deferred tax liabilities 23 554 1,417Pension liabilities 27 830 Provisions 28 11,762 15,303Financial liabilities 25 10,936 32,626Non-current liabilities, total 24,081 49,346 Current liabilities Accounts payable and other liabilities 26 75,675 65,066Provisions 28 6,642 13,162Financial liabilities 25 239 409Advances received 29,478 26,060Current liabilities, total 112,035 104,699 Equity and liabilities, total 220,033 223,458
10
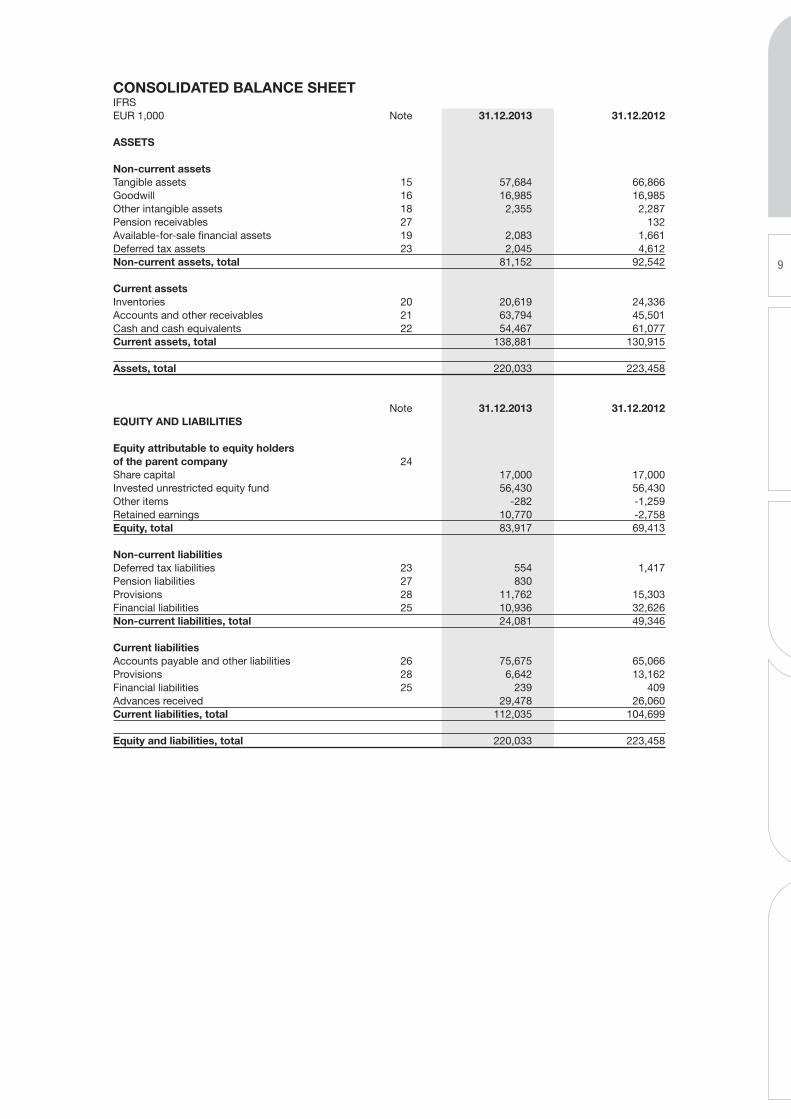
CONSOLIDATED CASH FLOW STATEMENT IFRS EUR 1,000 2013 2012 OPERATING CASH FLOW STATEMENT Cash receipts from customers 475,192 535,248Expenses paid to suppliers and personnel -456,849 -488,657Interests paid -684 -1,736Dividends received 2 2Interests received 163 333Other financial items -2,178 -2,131Tax paid -531 -792Net operating cash flow, continuing operations 15,115 42,267 Net operating cash flow, discontinued operations -213 -3,143Net operating cash flow 14,902 39,124 INVESTMENT CASH FLOW Investments in intangible and tangible assets -7,605 -7,179Sale of intangible and tangible assets 6,513 5,818Investments in other assets -25,997 -4Proceeds from the sale of other investments 25,859 Net investment cash flow, continuing operations -1,231 -1,365 Net investment cash flow, discontinued operations Net investment cash flow -1,231 -1,365 FINANCIAL CASH FLOW Decrease in non-current debt (-) -20,177 -30,028Decrease in short-term financing (-) -98 -472Net financial cash flow, continuing operations -20,276 -30,500 Net financial cash flow, discontinued operations Net financial cash flow -20,276 -30,500 Change in cash and cash equivalents -6,604 7,259Cash and cash equivalents at beginning of financial year 61,077 53,732Effect of exhange rate changes -6 86Cash and cash equivalents at end of financial year 54,467 61,077
11
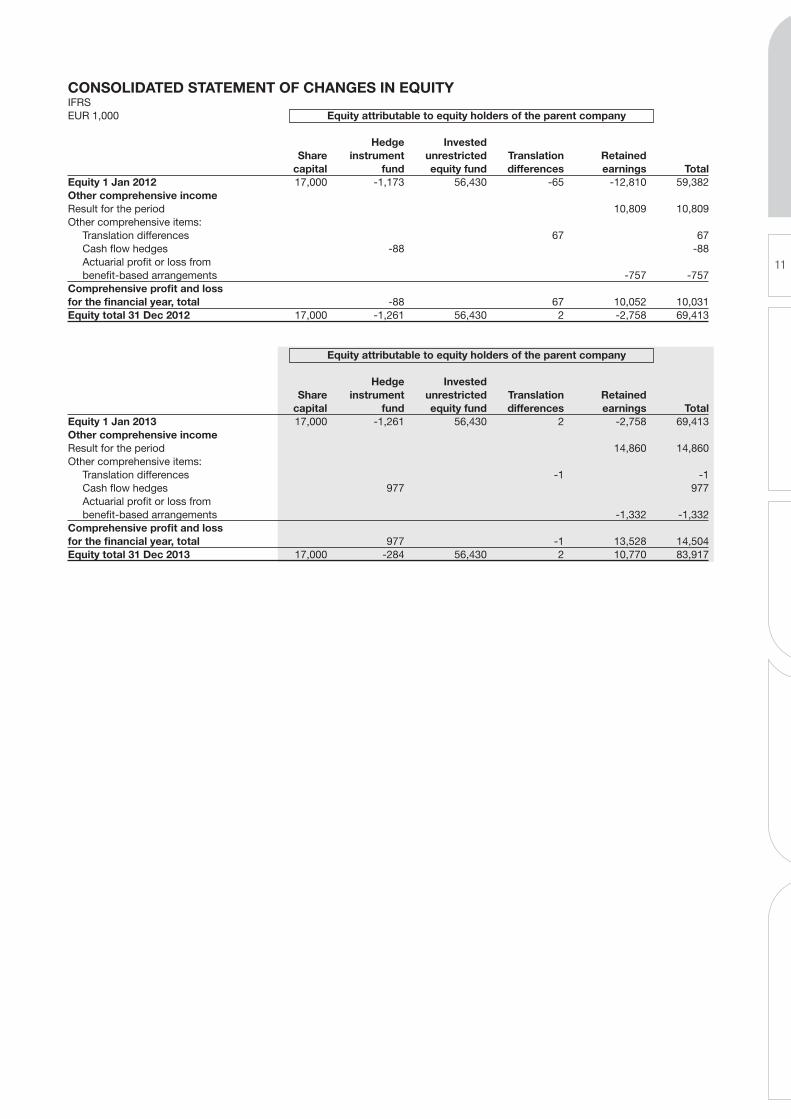
CONSOLIDATED STATEMENT OF CHANGES IN EQUITY IFRS EUR 1,000 Equity attributable to equity holders of the parent company Hedge Invested Share instrument unrestricted Translation Retained capital fund equity fund differences earnings TotalEquity 1 Jan 2012 17,000 -1,173 56,430 -65 -12,810 59,382Other comprehensive income Result for the period 10,809 10,809Other comprehensive items: Translation differences 67 67 Cash flow hedges -88 -88 Actuarial profit or loss from benefit-based arrangements -757 -757Comprehensive profit and loss for the financial year, total -88 67 10,052 10,031Equity total 31 Dec 2012 17,000 -1,261 56,430 2 -2,758 69,413
Equity attributable to equity holders of the parent company Hedge Invested Share instrument unrestricted Translation Retained capital fund equity fund differences earnings TotalEquity 1 Jan 2013 17,000 -1,261 56,430 2 -2,758 69,413Other comprehensive income Result for the period 14,860 14,860Other comprehensive items: Translation differences -1 -1 Cash flow hedges 977 977 Actuarial profit or loss from benefit-based arrangements -1,332 -1,332Comprehensive profit and loss for the financial year, total 977 -1 13,528 14,504Equity total 31 Dec 2013 17,000 -284 56,430 2 10,770 83,917
12
NOTES OF TH E CO N SOl I DATE D F INANC IA l STATE m E N T
Basic information about the Group
Destia is a Finnish infrastructure and construction service company, which plans, builds and maintains traffic routes and industrial and traffic environments as well as complete living environments. Our services cover the whole spectrum, from overground operations to subterranean construction. The Group mainly operates in Finland.
The Group’s parent company is Destia Oy, registered in Vantaa. Its registered address is Heidehofintie 2, 01300 Vantaa, Finland.
A copy of the Consolidated Financial Statements is available at www.destia.fi or from the parent company’s head office at Heide-hofintie 2, 01300 Vantaa.
On 12 February 2014, the Destia Oy’s Board of Directors ap-proved these financial statements for publication in their entirety. Under the Finnish Limited Liability Companies Act, shareholders may approve or reject the financial statements at the General Meeting held following their publication. The General Meeting may also take the decision to amend the financial statements.
1. Accounting principles
Basic principles
The consolidated financial statements were prepared in compli-ance with the International Financial Reporting Standards (IFRS), and the preparation abided by the International Accounting Standard (IAS) and International Financial Reporting Standards (IFRS) as well as the interpretations by the Standing Interpre-tations Committee (SIC) and International Financial Reporting Interpretations Committee (IFRIC) in force as at 31 December 2013. The International Financial Reporting Standards refer to the standards approved in the Finnish Accounting Act and provisions issued by virtue of it to be adopted in the EU in accordance with the procedure regulated by the EU regulation (EC) no 1606/2002 and the subsequent interpretations. The notes to the consolidat-ed financial statements are also in line with the requirements of the Finnish accounting and Community legislation supplementing the IFRS regulations.
At the end of 2011, the Group switched to IFRS practices, at the same time applying IFRS 1 First-time Adoption of International Financial Reporting Standards, the switchover date being 1 January 2010.
The Consolidated Financial Standards were prepared with refer-ence to original acquisition costs, with the exception of tradable financial assets, financial assets and liabilities recognised at fair value through profit or loss, and fair value hedges, which are valued at the current rate. The figures are in thousands of euros.
Preparing the statements in accordance with the IFRS stand-ards requires management to make certain estimates and have information relating to considered decisions the management has taken. This information relating to considered decisions, used in the application of the Group’s accounting policies, and which mostly affect the figures in the financial statements, is given in the section entitled ‘Accounting policies requiring discretion on the part of the management and the main factors of uncertainty connected with the estimates made’.
Accounting policies governing the Consolidated Financial Statements
Subsidiaries
Subsidiaries are companies over which the Group exercises con-trol. This is when the Group holds more than 50% of the votes, or has control of the company in another way. Furthermore, the existence of a potential voting right is taken into account when the conditions for control of the company are being assessed, when the instruments giving entitlement to a potential voting right can be realised at the time of examination. Control means the right to decide the company’s principles underlying finances and business in order to achieve benefit from its operations.
Intra-Group shareholdings are eliminated using the acquisition cost method. The consideration transferred, the acquired com-pany’s identifiable assets and liabilities assumed are measured at their acquisition-date fair values. The expenditure incurred through an acquisition is recognised as a cost. The consideration transferred does not include transactions treated separately from the acquisition. Their effect is accounted for through profit or loss at the time of the acquisition. Any contingent consideration is measured at its acquisition-date fair value, and is classed either as a liability or equity. Contingent consideration classed as a liability is measured at fair value on the last day of each reporting period, and the ensuing profit or loss is recognised through profit or loss or in other comprehensive income. Contingent considera-tion classified as equity is not remeasured. Acquired subsidiaries are consolidated from the time the Group has acquired control, and transferred subsidiaries until that control ceases. All the Group’s internal commercial transactions, receivables, liabilities, unrealised gains and internal profit distribution are eliminated when the Consolidated Financial Statements are being prepared. Unrealised losses are not eliminated if the loss is due to impair-ment. Changes to the parent company’s share of ownership in subsidiaries that do not lead to loss of control are treated as equity-related transactions.
Under the exemption allowed in the IFRS 1 standard, any company acquisitions prior to the IFRS switchover date are not adjusted to comply with IFRS principles, but remain at their value according to former Finnish accounting practices.
In March 2012, Destia’s Norwegian subsidiary Alpha Veg AS filed for bankruptcy. The effect on the result of the Norwegian busi-ness is shown in ‘Discontinuing operations’. The discontinued operation is presented in the notes to the accounts.
Changes to items denominated in foreign exchange
Figures showing the results and financial position of the units in the Group are denominated in the currency which is that for each unit’s main operating environment (‘functional currency’). The figures in the Consolidated Financial Statements are in euros, which is the functional and reporting currency of the Group’s parent company.
Commercial transactions denominated in foreign exchange
Commercial transactions denominated in a foreign currency are denominated in the functional currency at the rate on the date of the transaction. In practice, rates are often used that approximate to the rate on the date in question. Monetary items denominated in a foreign currency are converted to the functional currency
13
using the rate of exchange on the last day of the reporting peri-od. Non-monetary items denominated in a foreign currency, and which are measured at fair value, are converted to the function-al currency using the exchange rates on the date fair value is determined. Otherwise, non-monetary items are measured at the exchange rate on the date of the transaction.
Gains and losses from commercial transactions denominated in a foreign currency and changes to monetary items are treated through profit or loss. Exchange rate gains and losses from the business operation are included in equivalent items above oper-ating profit. Exchange rate gains and losses from foreign curren-cy loans are included in finance income and expenses, except for exchange rate differences on loans which are to protect net investments in foreign units, and which are effective there. These exchange rate differences are recognised in other comprehensive income, and accumulated exchange rate differences are shown separately under equity, until the foreign unit is partially or wholly disposed of.
Conversion of the financial statements of foreign companies in the Group
The items for income and costs in the statements of comprehen-sive income and separate income statements of foreign compa-nies in the Group are converted to euros at the exchange rates on the dates on which the commercial transactions take place, and the figures in the balance sheets are converted using the ex-change rates on the date on which the reporting period ends. The translation of the profit and loss and comprehensive profit and loss for the financial period using different exchange rates, in the income statement and comprehensive income statement, causes a translation difference in equity on the balance sheet, which is entered in ‘Other comprehensive profit a loss items’. Translation differences arising from the elimination of the acquisition cost of foreign subsidiaries and the conversion of equity items accumu-lating after an acquisition are recognised in other comprehensive income. If a subsidiary is sold wholly or partially, the accumulated translation differences are reclassified to profit or loss as part of the profit or loss from sales.
Under the exemption allowed in the IFRS 1 standard, transla-tion differences arising prior to 1 January 2010, which was the date on which the Group switched to compliance with IFRS standards, are to be recognised in accumulated profit funds in connection with the switch, and will not be recognised through profit or loss when a subsidiary is sold at a later date. From the switchover date, translation differences arising when the Consol-idated Financial Statements are being prepared will be presented as a separate item under equity. From 1 January 2010, goodwill generated from the acquisition of foreign units and fair value adjustments made to the book values of the assets and liabilities of foreign units when they are acquired are to be treated as the assets and liabilities of these foreign units. They are converted to euros at the exchange rate on the last day of the reporting period. Goodwill from acquisitions prior to 1 January 2010 is recognised in euros.
Tangible fixed assets (Property, plant and equipment)
Tangible fixed assets are measured at acquisition cost less accu-mulated depreciation and impairment losses.
An acquisition cost includes the expenditure incurred directly from acquiring a tangible fixed asset, including the costs of
dismantling or moving the asset based on the original value, and of restoring the location to its original state, if the organisation has such an obligation. The acquisition costs of an asset that has been produced by the company itself includes the costs of materials, the direct costs of employee benefits and the other di-rect costs of preparing the asset for its intended purpose. When preparation of an asset for its intended purpose or sale requires a good deal of time, the direct borrowing costs of its acquisition, construction or production are capitalised as part of its acquisi-tion costs.
If an asset consists of more than one part, whose lifetimes vary in length, each part is treated as a separate commodity. In such cases, expenditure for the replacement of the part is capitalised and any book value remaining when that replacement takes place is derecognised. Expenditure incurred at a later date is only included in the book value of a tangible fixed asset if the Group is likely to benefit financially from the commodity in the future and the acquisition cost of the commodity can be reliably determined. Other repair and maintenance costs are recognised as incurred.
Assets are depreciated during their estimated useful life on a straight-line basis. The exception is areas of soil, depreciation on which is calculated according to use. No depreciation is calculat-ed for land. Estimated useful lives are as follows:
• Buildings: 10–40 years• Machinery and equipment: 3–20 years• Other tangible assets: according to use
An asset’s residual value and its useful life are revised at the end of each financial year, at the very least, and, where necessary, adjusted to reflect the changes that have taken place with regard to the expectations of its financial benefit. When a tangible fixed asset is classified as held for sale in accordance with IFRS 5 Non-current Assets Held for Sale and Discontinued Operations, the depreciation process ends. The gains and losses from the sale of decommissioned tangible fixed assets or their disposal are recognised in profit and loss.
Government subsidies
Government/public subsidies are entered in the profit and loss statement when it is reasonably certain that they will be obtained. Subsidies that have been received as payments against already realised costs are recognised through profit or loss in the period in which the subsidy is realised. Subsidies are presented in other operating income.
Intangible assets
Goodwill
Goodwill is recognised at the amount by which the transferred consideration exceeds the Group’s share of identifiable fair value net assets for an acquired company on the date it is acquired. Goodwill arising from the merger of business oper-ations prior to 2010 is equivalent to the book value according to the earlier norms for the financial statements, which is used as the default acquisition cost under IFRS 1. No deprecation is recognised for goodwill (or any other unlimited-life intangible assets), but it is tested annually for potential impairment. For this purpose, goodwill is allocated to units producing money flow. Goodwill is measured at the original acquisition price less impairment.
14
Research and development expenditure
Research expenditure is recognised through profit or loss. Devel-opment expenditure incurred from the planning of new or more advanced procedures and concepts is capitalised as intangible assets in the balance sheet from the time when they are technical-ly feasible, can be commercially exploited and can be expected to produce future economic benefit. Capitalised development costs include the material, labour and testing costs which are directly incurred when preparing the commodity for its intended purpose. Previously amortised development costs are no longer recognised at a later date. Amortisation begins when the asset is ready to be used. Incomplete assets are tested annually for impairment. After initial recognition, capitalised development costs are valued at the original acquisition cost less amortisation and impairment.
Other intangible assets
An intangible asset is entered in the balance sheet at the original acquisition cost, where it can be determined reliably and where the Group is likely to expect to benefit financially from the asset in the future.
Intangible assets with a restricted useful life are amortised on a straight-line basis through profit or loss within their known or estimated useful life.
The depreciation periods for other intangible assets are:
• Computer software: 5 years• Other intangible rights: 5 years
Inventories
Inventories are measured at the acquisition cost or net realisation value, whichever is the lower. The acquisition cost is determined using the average weighted share price method. The acquisition cost of finished good and intermediate inventories consists of the raw materials, the expenses incurred from direct work, other direct expenses, an appropriate share of the variable general costs of manufacture and fixed general costs at a normal level of activity. The net realisable value is the estimated selling price in the ordinary course of business less the estimated necessary costs of completion of the inventories and the estimated costs necessary to realise yield.
Rental agreements
The Group as lessee
Rental agreements relating to fixed tangible assets, which expose the Group to significant risks and rewards inherent in holding such assets, are classified as finance lease agreements.
An asset acquired through a finance lease agreement is entered in the balance sheet at the inception of the lease at the fair value of the leased commodity or the present value of the minimum lease payments, whichever is lower.
An asset acquired through a finance lease agreement is depre-ciated over its useful life or within the lease term, whichever is shorter. Lease payments are apportioned between the finance charge and the reduction of the outstanding liability so that the finance charge is allocated to each period during the lease term to produce a constant periodic rate of interest on the remaining balance of the liability. Rental obligations are included in financial liabilities. Leases where a significant portion of the risks and
rewards of ownership are retained by the lessor are classified as other rental agreements. Payments made under operating leases expenses are charged to the income statement on a straight-line basis over the period of the lease.
The Group as lessor
Assets let by the Group are included in tangible fixed assets in the balance sheet. They are depreciated during their useful life in the same way as equivalent tangible fixed assets in the Group’s use. Revenue from rental agreements is charged to the income statement on a straight-line basis over the period of the lease.
Impairment of tangible and intangible assets
At each date the reporting period ends, the Group assesses whether there are suggestions that an asset is impaired. If there are such signs, an estimate is made of the amount that is recov-erable on the asset in question. In addition, an estimate is made each year of the following: goodwill, unlimited-life intangible assets and intangible assets in progress.
The need to record impairment is examined at the level of units producing money flow, i.e. at the lowest unit level, which is mainly independent of the other units and whose money flows can be distinguished from the money flows of equivalent units and are virtually independent of them. The recoverable amount is the fair value of the asset less expenditure incurred from its sale or its utility value, whichever is the greater. The utility value is the present value of future net money flows expected to be derived from an asset or cash-generating unit. The discounting has been performed in accordance with IAS 36.
An impairment loss is recognised when the book value of an asset is greater than its recoverable amount. An impairment loss is recognised directly through profit or loss. If the impairment loss is allocated to a unit producing a money stream, it is first applied to reduce the goodwill for that unit, and then to reduce the value of other assets of the unit uniformly. When an impairment loss is being entered, the useful life of the asset being depreciated is re-assessed. An impairment loss for an asset other than goodwill is reversed if there has been a change in the values used to de-termine the recoverable amount on the asset. However, impair-ment losses cannot be reversed to exceed the asset’s book value as it would be, had no impairment loss been recognised. In no circumstances can impairment losses recognised for goodwill be reversed.
Employee benefits
Pension obligations
Pension schemes are classified as defined benefit or defined contribution plans. With the latter, the Group pays fixed premi-ums into a separate unit. The Group has no legal or constructive obligation to increase premiums if the organisation in receipt of the premiums is unable to pay the relevant pension benefits. All schemes that do not fulfil these conditions are defined bene-fit plans. Payments made into defined contribution plans are recognised through profit or loss in the financial year in which the obligation arises.
The Group’s obligations regarding defined benefit plans are calculated separately for each scheme, using the projected unit credit method.
15
Pension expenditure is recognised as costs on the basis of au-thorised actuarial calculations for the length of service of person-nel. When the current value of a pension obligation is being cal-culated, the discount rate used is the yield on high-quality bonds issued by companies, and if that is not available, the interest on state debentures. Owing to the non-recurring payment of pension contributions, the pay rise percentage used in the calculations is 0. The maturity of bonds and debentures corresponds essentially to the maturity of the pension obligation being calculated. From the current value of a pension obligation in a balance sheet is subtracted the assets included in the pension scheme meas-ured at fair value on the last day of the reporting period and the unvested past service costs.
All actuarial gains and losses that accumulated by 1 January 2010, the date of the switchover to IFRS standards, were recog-nised under equity in the opening IFRS balance sheet, in accord-ance with IFRS 1 standard. Actuarial gains and losses thereafter are recognised in other comprehensive income in the period in which they are made.
Past service costs are recognised on the straight-line basis through profit or loss for the period in which they are vested. If the benefits are vested directly, they are recognised as direct costs.
Provisions and contingent liabilities
Provisions are recognised when the Group has a present legal or constructive obligation as a result of past events, it is proba-ble that an outflow of resources will be required to settle the obligation, and a reliable estimate of the amount can be made. Provisions are stated at the present value of the obligation. The discount rate is determined to reflect current market assess-ments of the time value of money and the risks specific to the obligation. If the Group expects a provision to be reimbursed, for example, by a third party, the reimbursement is recognised as a separate asset if the reimbursement is virtually certain.
A quality reservation (provision) is recognised when a project covered under a guarantee clause is delivered. The amount of the quality reservation (provision) is based on the experience-based estimate of the guarantee costs to be incurred.
The Group recognises a provision for onerous contracts when the expected benefits to be derived from a contract are less than the unavoidable costs of meeting obligations.
A reorganisation provision is recognised when the Group has drawn up a detailed reorganisation plan, begun on its execution and reported the matter.
A provision associated with environmental obligations is recog-nised when the Group has an obligation based on environmental legislation and the Group’s principles of environmental respon-sibility and which relates to the decommissioning of a produc-tion plant, landscaping responsibilities, repairing environmental damage or moving equipment from one place to another.
A contingent liability is a potential obligation arising as a result of past events, whose existence is only confirmed when an uncertain event takes place which is beyond the Group’s control. Contingent liabilities may also be regarded as existing obligations that are unlikely to require fulfilment of a payment obligation, or a reliable estimate of the amount cannot be made. A contingent liability is presented in the Notes to the Financial Statements.
Taxes based on taxable income for the period and deferred taxes
Tax expenses comprise tax based on taxable income for the pe-riod and deferred tax. Income tax is recognised through profit or loss, except for taxes related to items recognised directly to the shareholders’ equity or the comprehensive income statement. With these, tax is recognised in the relevant items. Tax based on taxable income for the period is calculated using the corporate income tax rate effective in each country. Deferred taxes are calculated on all temporary differences between the book value and taxable value. However, no deferred tax liability is recognised if it is due to the initial recognition of an asset or liability where there is no matter of a merger or the commercial transaction at the time does not affect the business results or taxable income.
Deferred taxation is recognised for investments in subsidiaries, except where the Group is able to specify a date on which the temporary difference dissolves and the temporary difference will probably not dissolve in the foreseeable future.
The largest temporary differences arise from the depreciation of tangible fixed assets, the valuation of derivative contracts at fair value, defined benefit pension plans and unused taxable losses.
Deferred taxes are calculated using the statutory tax rates by the last day of the reporting period or the tax rates which have been approved in practice by the closing date. Deferred tax assets are recognised to the extent that it is probable that taxable income, against which the temporary difference can be applied, will mate-rialise in the future.
Revenue recognition
Sales (Turnover) are/is presented in such a way that the revenue from the sales of goods and services at fair value are recognised and adjusted to allow for indirect taxes, discounts and exchange rate differences for sales in foreign currencies.
Long-term projects
The revenue and costs of long-term projects are recognised as such with reference to the stage of completion, when the final financial result for the project can be estimated reliably enough. The stage of completion is determined for each project as the share of the costs incurred from the work carried out by the review date compared with the total costs estimated for the project.
Expenditure that relates to a project still not entered as income is recognised as long-term projects in progress under inventories. If the expenditure incurred and recognised gains exceed the amount invoiced for the project, the difference is shown under trade and other receivables in the balance sheet. If the expendi-ture incurred and recognised gains are less than what is invoiced for the project, the difference is shown under trade payables and other debt. When the end financial result of a long-term project cannot be reliably assessed, the project expenditure is recog-nised in the same period in which it is incurred, and the revenue from the project is only recognised up to the amount where a sum of money equivalent to the expenditure incurred is available. If it is probable that the overall expenditure incurred in complet-ing the project will exceed total income from it, the expected loss is entered as a direct cost.
16
Sold goods and services
Revenue from the sale of goods is recognised when the signif-icant risks, rewards and effective control associated with the ownership of the goods have transferred to the purchaser. As a general rule, this is when delivery under the terms of the contract relating to the products takes place. Revenue from services is entered as income in the financial year in which the service is delivered.
Interest and dividends
Interest received is recognised using the effective interest rate method, and dividend income when entitlement to a dividend arises.
Non-current assets held for sale and discontinued operations
Non-current assets (or a disposal group) and assets and liabilities relating to discontinued operations are classified as held for sale, if their book value will be recovered principally through the sale of the assets rather than through continuing use. For this to be the case, the sale must be highly probable, the asset (or disposal group) must be available for immediate sale in its present con-dition, subject only to terms that are usual and customary, the management must be committed to selling and the sale should go ahead within one year from the date of classification.
Immediately prior to classification, the assets held as for sale or assets and liabilities of a disposable group are measured in accordance with the IFRS standards to be applied. From the time of the classification, assets held for sale (or a disposable group) are measured at book value or at fair value less the expenditure incurred from their sale, whichever is the lower. Depreciation of these assets ends at the time of classification.
Assets included in a disposable group - and not included in the scope of the IFRS 5 valuation rules - and liabilities (in a dispos-able group) are measured in accordance with the IFRS standards even after the classification date.
A discontinued operation is a part of the Group which has been disposed of or which has been classified as held for sale, and which meets the following conditions: it is a significant sepa-rate business unit or unit representing a geographical area, part of one coordinated plan relating to disposal of a separate key business area or geographical territory, or a subsidiary that was acquired exclusively for the purpose of selling it on. The financial result for discontinued operations is recognised as its own item in the Group’s comprehensive income statement. Assets held for sale, disposable groups, items recognised in other compre-hensive income relating to assets held for sale, and liabilities in-cluded in a disposable group are presented in the balance sheet separately from other items.
Financial assets and liabilities
Financial assets
The Group classifies financial assets in the following categories: financial assets at fair value through profit or loss, investments held till maturity, loans and other receivables and availa-ble-for-sale financial assets. The classification depends on the purpose of the acquisition of the financial assets, and they are classified when they are originally purchased.
Transaction costs are included in the original book value for financial assets, where it concerns an item that is not measured at fair value through profit or loss. All purchases and sales of fi-nancial assets are recognised on the date of trading, which is the date on which the Group undertakes to buy or sell the financial instrument. The balance sheet depreciation of financial assets takes place when the Group has lost its agreed entitlement to money flows, or when it has transferred risks and revenue out-side the Group to a significant extent.
Included in financial assets at fair value through profit or loss are items included in financial assets acquired to be held for trading, or which are classified at fair value at initial recognition through profit or loss (use of the fair value option). The classification may only be altered in rare circumstances. The latter group includes financial assets that are managed based on fair value or an item included in financial assets associated with one or more embedded derivatives that changes contractual money flows substantially, where the entire compound instrument is measured at fair value. Financial assets held for trading are mainly acquired to control changes in short-term market prices. Derivatives that are not contracts of guarantee or do not meet the conditions of hedge accounting are classified as held for trading. Derivatives that are held for trading and financial assets maturing within 12 months are included in current assets.
Group items are measured at fair value, based on the quoted market price on the last day of the reporting period. The fair values of interest rate swaps are determined as the current value of future money flows and foreign exchange forwards are measured at the rates in force for them on the last day of the reporting period. When measuring derivatives and other financial instruments that are not to be traded, the Group usually uses approved valuation methods and discounted values for future money streams. Both unrealised and realised gains and losses from changes in fair value are recognised through profit or loss in the financial year in which they are made.
Loans and other receivables are non-derivative assets with fixed or measurable payments. They are not quoted in active markets and the Group does not hold them for trading or classify them as available-for-sale at initial recognition. They are valued at amortised cost using the effective interest rate method. Loans and other receivables are presented as current or non-current fi-nancial assets depending on their nature, the latter if they mature after 12 months have passed.
Available-for-sale financial assets are non-derivative assets specifically included in this classification or not included in any other. They are included in non-current assets, except if they are to be held for under 12 months from the last day of the reporting period, in which case they are included in current assets.
Available-for-sale financial assets may consist of shares and interest-bearing investments. They are measured at fair value or, when fair value cannot be reliably determined, at acquisition cost. The fair value of an investment is determined with reference to its buying rate. If there are no quoted rates for available-for-sale financial assets, the Group applies various valuation methods to value them. They include, for example, references to recent trades between independent bodies, discounted money flows or valuations for other similar instruments. For this, information obtained from the markets is generally used as opposed to contributing factors that the Group has itself decided, which are used as little as possible.
17
Changes to the fair value of available-for-sale financial assets are recognised in other comprehensive income, and are presented in the fair value fund, with consideration being given to their implications for tax. Accumulated fair value adjustments are transferred from equity through profit or loss when an investment is sold or its value is impaired so that an impairment loss on the investment should be recognised. Interest on available-for-sale debt instruments is recognised in finance income using the effec-tive interest rate method.
Cash and cash equivalents
Cash and cash equivalents comprise cash balances, call depos-its and other short-term highly liquid investments that are readily convertible to known amounts of cash and which are subject to an insignificant risk of changes in value. The items classified as cash and cash equivalents have a maturity of no more than twelve months from the time of acquisition.
Impairment of financial assets
The Group assesses on the last day of each reporting period whether there is any objective evidence that a financial as-set or group of financial assets is impaired. If the fair value of investments has fallen significantly below the acquisition cost and period determined by the Group, this is an indication of an impairment of available-for-sale share. If any such evidence exists, the amount recognised in the shareholders’ fair value reserve is unrecognised and recognised in the income statement. Impairment loss on available-for-sale financial assets categorised as equity instruments are not reversed through profit or loss. A later reversal of impairment loss on interest rate instruments is, however, recognised through profit or loss.
The Group recognises an impairment loss on trade receivables, when there is objective evidence that a receivable is not fully col-lectible. The borrower’s significant financial difficulties, probability of a bankruptcy or non-payment exceeding 90 days are evidence of impairment loss on a trade receivable.
Financial liabilities
Financial liabilities are initially recognised in accounting at fair value. Transaction costs are included in the initial book value of the financial liabilities measured at acquisition cost. Later, financial liabilities, except for derivatives that are liabilities, are measured at amortised acquisition cost using the effective inter-est rate method. Financial liabilities are included in non-current and current liabilities, being classed as current unless the Group has an unconditional right to defer payment of the debt within at least 12 months from the last day of the reporting period.
Expenses under liabilities are recognised as costs in the period in which they are incurred. Commissions associated with loan commitments are recognised as transaction costs to the extent that it is probable that the entire loan commitment or part of it will be taken up. In such a case, the commission is entered in the balance sheet until the loan is taken up. When it is, the commis-sion associated with loan commitments is recognised as part of the transaction costs. If the loan commitment is unlikely to be taken up, the commission is recognised as an advance payment for a liquidity service and is amortised as a cost for the period of the loan commitment.
Derivative financial instruments and hedge accounting
Derivatives are initially recognised at fair value on the date the derivative contract is entered into and are subsequently remeasured at their fair value. Gains and losses resulting from measurement at fair value are treated in the accounts in the way specified for the purpose of use of the derivative instrument. The profit and loss effects of the changes to the values of derivative instruments where hedge accounting is applied, and which are effective hedging instruments, are presented uniformly with the hedged item. When entered into, derivative financial instruments are treated as fair value hedges of receivables, liabilities or fixed commitments, or, in the case of currency exchange risk, as mon-ey flow hedges, money flow hedges for an anticipated and highly likely commercial transaction, as hedges of net investments in a foreign unit, or as derivative financial instruments that do not meet the hedge accounting criteria.
When a hedging arrangement is entered into, the relationship between the item being hedged and the hedging instrument, as well as the objectives of the Group’s risk management and the hedging strategy are documented. When starting out, and at least every time the financial accounts are being prepared, the Group documents the effectiveness of qualifying derivatives by examining their ability to offset changes to the fair value of the hedged item or money streams.
Money flow hedging
The change in the fair value of the effective portion of derivative instruments qualifying for hedge cash flow is recognised in other comprehensive income and presented in the hedge fund under equity (in Other funds). The gains and losses accumulated in equity from hedging instruments are transferred to the statement of income when the hedged item impacts on profit or loss. Gains and losses from derivatives hedging an anticipated sale in a for-eign currency are recognised as sales adjustments when the sale goes ahead. The ineffective portion of a derivative instrument is recognised in other operating income and expenses. If a hedged, anticipated commercial transaction leads to the recognition of an asset not included in financial assets, such as a tangible fixed asset, the gains and losses accumulated in equity are reclassified as an adjustment to the acquisition cost of that asset. When a derivative financial instrument acquired for money flow hedging matures or is sold, or when the conditions of hedge accounting are no longer met, the gain or loss from the derivative instrument remains under equity until such time as the anticipated commer-cial transaction takes place. However, if that is no longer expect-ed to happen, the gain or loss under equity is directly recognised through profit or loss.
Other hedging instruments where hedge accounting does not apply
Even if certain hedging relationships meet the requirements of effective hedging set for the Group’s risk management, hedge accounting may not apply to them. Such instruments include derivatives hedging a commodity risk in connection with oper-ations and some derivatives hedging currency risks. Changes to their fair value are recognised in other business revenue and costs in accordance with the Group’s established practice. In the balance sheet, these commodity risk and foreign currency trade receivable/account payable derivatives are presented in current receivables or liabilities. The fair values for hedging instruments are presented in Notes to the Financial Statements under Fair values for financial assets and liabilities. Changes to the hedge
18
fund are presented in Notes to the Financial Statements under Equity, in the section Other funds.
Share capital
Ordinary shares are presented as share capital. Expenditure relating to the issue or acquisition of own equity instruments are presented as an allowance account under equity.
Operating profit
IAS 1 standard (Presentation of Financial Statements) does not define operating profit. The Group has defined it as follows: operating profit is the net sum obtained after adding other oper-ating income to revenues and then deducting purchasing costs adjusted by the change in stocks of finished products and work in progress, the costs incurred for own-use manufacture, costs from employee benefits, depreciation, amortisation and any im-pairment losses, and other operating expenses. All other income statement items are presented under operating profit. Exchange rate differences and changes in the fair value of derivatives are included in operating profit if they arise from items connected with business operations; otherwise they are entered in financ-ing items. In its tables and texts, the Group uses both the term ‘operating result’ and ‘operating profit’.
Accounting policies requiring discretion on the part of the management and the main factors of uncertainty connected with the estimates made
Estimates and assumptions regarding the future have to be made during preparation of the financial statements, but the final outcome may be otherwise. Furthermore, the application of accounting policies requires discretion.
Discretion on the part of management regarding choice and application of accounting policies
Group management makes considered decisions regarding the selection and application of accounting policies. This applies in particular to those cases in which the IFRS standards in effect provide the opportunity to choose between various accounting, valuation or presentation methods. The main area where manage-ment has exercised its discretion in this way relates to the exemp-tions allowed and utilised by the Group in IFRS 1 in the adoption of IFRS standards, such as the treatment of acquisitions prior to the switchover date in accordance with the rules applied at that time.
Factors of uncertainty connected with estimates
The estimates made in connection with preparing the financial statements reflect the best judgement of the management on the last day of the reporting period. These estimates are affected by past experience and assumptions regarding future develop-ments, which are regarded as well-founded at the time of closing of the accounts, and which relate, for example, to expected trends in the Group’s economic operating environment in terms of revenue and costs. The Group regularly monitors the reali-sation of these estimates and assumptions and any changes to background factors with the business units through internal and external information sources. Any changes in estimates and assumptions are recognised in the financial statements of the period during which such corrections are made.
The key assumptions regarding the future and the main factors of uncertainty connected with the estimates made on the last day
of the reporting period, which pose a significant risk of change to the book values of the Group’s assets and liabilities basically during the following year, are given below. Group management regards these particular areas of the financial statements as crucial. Application of accounting policy as it affects them mostly requires the utilisation of significant estimates and assumptions.Impairment testing
The Group carries out annual impairment testing of goodwill, intangible assets in progress and intangible assets having an indefinite useful life. Suggestions of impairment are evaluated in the way described above in the accounting policies. The recover-able amounts of cash-generating units have been defined on the basis of value in use calculations. These calculations call for the use of estimates.
Recognition as income and expenses
As described in the revenue recognition policies, the revenue and costs of a long-term project are recognised as income and expenses on the basis of the stage of completion, once the outcome of the project can be reliably estimated. Recognition associated with the stage of completion is based on estimates of expected income and expenses of the project and reliable measurement of project progress. If estimates of the project's outcome change, the recognised income and profit/loss are amended in the period in which the change is first known about and can be estimated for the first time. Any loss expected from a project is directly recognised as an expense.
Tax
When tax is recognised in the accounts, management’s most essential estimate applies to the criteria for recording deferred tax receivables. When a tax-deductible temporary difference dissolves, it results in smaller quantities of taxable income in sub-sequent financial years. The most common deductible temporary difference between taxation and accounts is a loss verified in taxation. Management has to estimate whether in the future suf-ficient taxable income will accumulate against which unused tax losses can be used. A deferred tax receivable is only recognised on losses to the extent that there is an estimated income to be generated in subsequent financial years, against which the com-pany can probably reduce its tax losses.
Employee benefits
The factors used to calculate employee benefit obligations that require the management’s assessment are connected, for ex-ample, to an estimate of the expected return on funds in defined benefit pension plans, determining the discount rate used to cal-culate the pension cost and obligation for the financial year, fore-casting future trends in pay, the assumed rise in pension costs, assumed lengths of service of personnel, and inflation trends.
Provisions
When recognising provisions, the management has to assess whether there is a legal or actual obligation in which there is a probable liability to pay a debt. In addition, they have to assess the extent of the obligation and estimate the time when it is real-ised. If all this can be done reliably, the obligation is recognised as a provision in the financial statements.
19
Application of the amended IAS 1 and IAS 19 standards and the new IFRS 13 standard
Change to IAS 1 Presentation of Financial Statements (in effect on 1 July 2012 or in financial years commencing thereafter). The main change is the requirement to group items in other compre-hensive income according to whether they can be reclassified into profit or loss at a later date if certain conditions are met. The change affected the method of presentation of actuarial profit and loss in the comprehensive income statement.
Change to IAS 19 Employee Benefits (in effect on 1 January 2013 or in financial years commencing thereafter). The main change is that all actuarial gains and losses must in future be recognised di-rectly in other items in the comprehensive income statement, i.e. abolition of the ‘corridor’ method, with financial expenditure being determined on the basis of net reserves. The change did not af-fect the Group, as Destia enters actuarial profit and loss in ‘Other comprehensive profit and loss items’, as permitted by IAS 19.
IFRS 13 Fair Value Measurement (in effect on 1 January 2013 or in financial years commencing thereafter). The standard’s purpose is to increase level of conformity and reduce complexity, as it gives a precise definition of fair value and unites in the same standard requirements for defining fair value and the necessary notes to the financial statements. The application of the IFRS 13 standard did not have any major impact on the financial state-ments of the Group.
Application of the new and amended IFRS standards
The IASB has published the following new or amended standards and interpretations, which the Group has not as yet applied. The Group will adopt them from the date on which they come into ef-fect, or if that date is other than the first day of the financial year, from the start of the subsequent financial year. The Group does not consider that the other standards or interpretations published by the IASB, and not listed here, are relevant to the Group’s future financial statements.
IFRS 10 Consolidated Financial Statements (in effect on 1 January 2014 or in financial years commencing thereafter). The standard determines the key factor for control in accordance with existing principles, where it is decided whether the organi-sation should be consolidated. The standard also gives addi-tional guidance on defining control when it is difficult to judge. It is estimated that the standard will not significantly affect the Group’s financial statements. The standard has been approved for application in the EU, and the Group will apply the standard from 1 January 2014.
IFRS 11 Joint Arrangements (in effect on 1 January 2014 or in financial years commencing thereafter).The core principle of this standard joint arrangements focuses on the resulting rights and obligations in accounting for joint arrangements rather than their legal form. Joint arrangements are of two types: joint operations and joint ventures. The standard furthermore requires one meth-od, the equity method, to be used in reports on joint ventures, the earlier proportionate consolidation option no longer being permitted. It is estimated that the standard will not significantly affect the Group’s financial statements. The standard has been approved for application in the EU, and the Group will apply the standard from 1 January 2014.
IFRS 12 Disclosure of interest in other entities (in effect on 1 January 2014 or in financial years commencing thereafter). This standard contains requirements in the notes to financial state-ments concerning interests in other entities, including associates, joint arrangements, companies set up for a specific purpose, and other off-balance sheet entities. The standard has been approved for application in the EU, and the Group will apply the standard from 1 January 2014.
IAS 27 (amended 2011) Consolidated and Separate Financial Statements (in effect on 1 January 2014 or in financial years commencing thereafter). This amended standard contains the re-quirements for separate financial statements remaining since the sections on control have been incorporated in the new IFRS 10. It is estimated that the standard will not significantly affect the Group’s financial statements. The standard has been approved for application in the EU, and the Group will apply the standard from 1 January 2014.
IAS 28 (amended 2011) Investments in Associates and Joint Ven-tures (in effect on 1 January 2014 or in financial years commenc-ing thereafter). This amended standard contains the requirements for treating associates and joint ventures using the equity method resulting from the publication of IFRS 11. It is estimated that the standard will not significantly affect the Group’s financial state-ments. The standard has been approved for application in the EU, and the Group will apply the standard from 1 January 2014.
IFRS 9 Financial Instruments (entry into force open). IFRS 9 is the first phase of a larger project aimed at replacing IAS 39 with a new standard. The various valuation methods are retained, but are simplified. Financial assets are divided into two main groups based on valuation: those measured at amortised acquisition cost and those measured at fair value. The classification de-pends on the company’s business model and the characteristics of agreed money streams. The Group will assess the possible impact of the standard on its financial statements in subsequent financial years. The standard has not yet been approved for application in the EU.
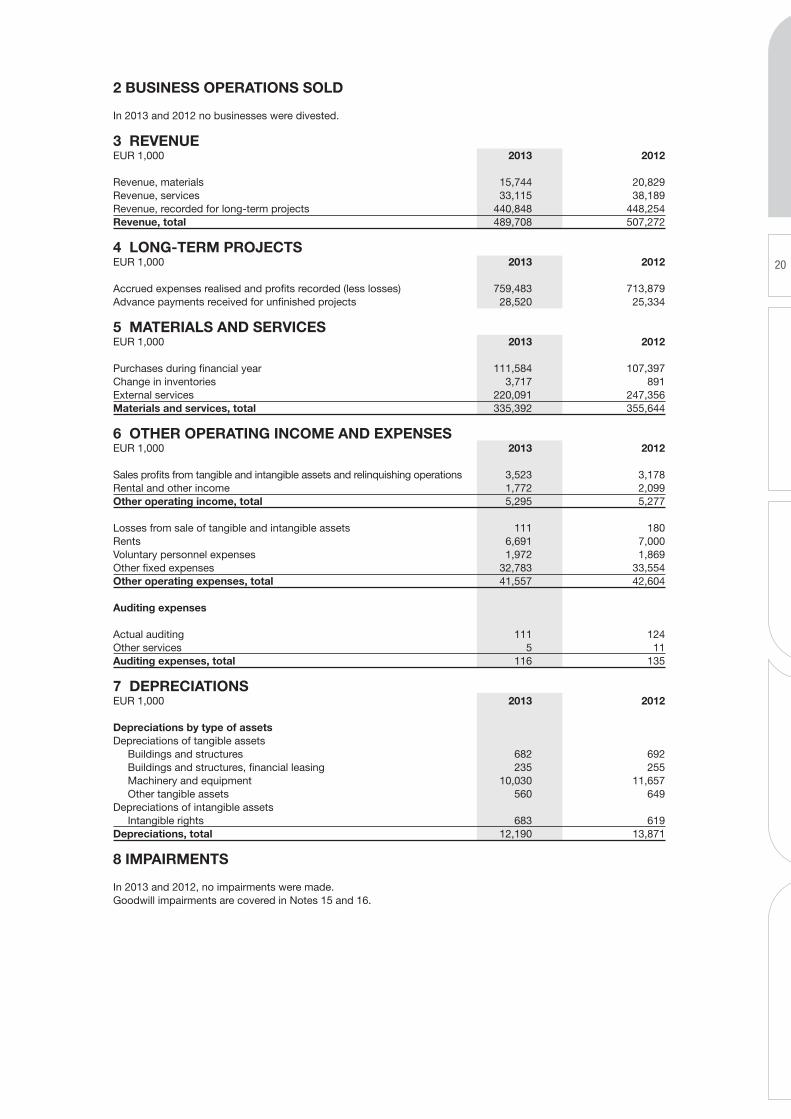
20
2 BUSINESS OPERATIONS SOLD
In 2013 and 2012 no businesses were divested.
3 REVENUE EUR 1,000 2013 2012 Revenue, materials 15,744 20,829Revenue, services 33,115 38,189Revenue, recorded for long-term projects 440,848 448,254Revenue, total 489,708 507,272
4 LONG-TERM PROJECTS EUR 1,000 2013 2012 Accrued expenses realised and profits recorded (less losses) 759,483 713,879Advance payments received for unfinished projects 28,520 25,334
5 MATERIALS AND SERVICES EUR 1,000 2013 2012 Purchases during financial year 111,584 107,397Change in inventories 3,717 891External services 220,091 247,356Materials and services, total 335,392 355,644
6 OTHER OPERATING INCOME AND ExPENSES EUR 1,000 2013 2012 Sales profits from tangible and intangible assets and relinquishing operations 3,523 3,178Rental and other income 1,772 2,099Other operating income, total 5,295 5,277 Losses from sale of tangible and intangible assets 111 180Rents 6,691 7,000Voluntary personnel expenses 1,972 1,869Other fixed expenses 32,783 33,554Other operating expenses, total 41,557 42,604 Auditing expenses Actual auditing 111 124Other services 5 11Auditing expenses, total 116 135
7 DEPRECIATIONS EUR 1,000 2013 2012 Depreciations by type of assets Depreciations of tangible assets Buildings and structures 682 692 Buildings and structures, financial leasing 235 255 Machinery and equipment 10,030 11,657 Other tangible assets 560 649Depreciations of intangible assets Intangible rights 683 619Depreciations, total 12,190 13,871
8 IMPAIRMENTS
In 2013 and 2012, no impairments were made.Goodwill impairments are covered in Notes 15 and 16.
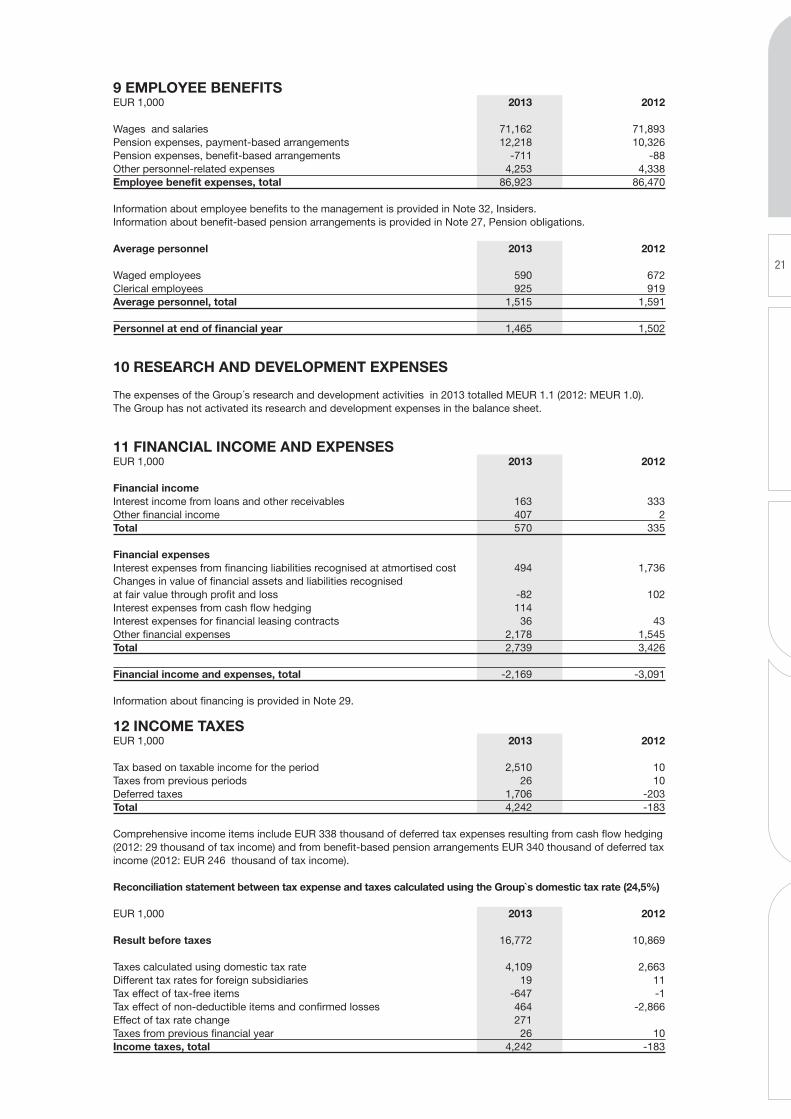
21
9 EMPLOYEE BENEFITS EUR 1,000 2013 2012 Wages and salaries 71,162 71,893Pension expenses, payment-based arrangements 12,218 10,326Pension expenses, benefit-based arrangements -711 -88Other personnel-related expenses 4,253 4,338Employee benefit expenses, total 86,923 86,470
Information about employee benefits to the management is provided in Note 32, Insiders. Information about benefit-based pension arrangements is provided in Note 27, Pension obligations.
Average personnel 2013 2012 Waged employees 590 672Clerical employees 925 919Average personnel, total 1,515 1,591 Personnel at end of financial year 1,465 1,502
10 RESEARCH AND DEVELOPMENT ExPENSES
The expenses of the Group´s research and development activities in 2013 totalled MEUR 1.1 (2012: MEUR 1.0). The Group has not activated its research and development expenses in the balance sheet.
11 FINANCIAL INCOME AND ExPENSES EUR 1,000 2013 2012 Financial income Interest income from loans and other receivables 163 333Other financial income 407 2Total 570 335 Financial expenses Interest expenses from financing liabilities recognised at atmortised cost 494 1,736Changes in value of financial assets and liabilities recognised at fair value through profit and loss -82 102Interest expenses from cash flow hedging 114 Interest expenses for financial leasing contracts 36 43Other financial expenses 2,178 1,545Total 2,739 3,426 Financial income and expenses, total -2,169 -3,091
Information about financing is provided in Note 29.
12 INCOME TAxES EUR 1,000 2013 2012 Tax based on taxable income for the period 2,510 10Taxes from previous periods 26 10Deferred taxes 1,706 -203Total 4,242 -183 Comprehensive income items include EUR 338 thousand of deferred tax expenses resulting from cash flow hedging (2012: 29 thousand of tax income) and from benefit-based pension arrangements EUR 340 thousand of deferred tax income (2012: EUR 246 thousand of tax income). Reconciliation statement between tax expense and taxes calculated using the Group`s domestic tax rate (24,5%) EUR 1,000 2013 2012
Result before taxes 16,772 10,869 Taxes calculated using domestic tax rate 4,109 2,663Different tax rates for foreign subsidiaries 19 11Tax effect of tax-free items -647 -1Tax effect of non-deductible items and confirmed losses 464 -2,866Effect of tax rate change 271 Taxes from previous financial year 26 10Income taxes, total 4,242 -183
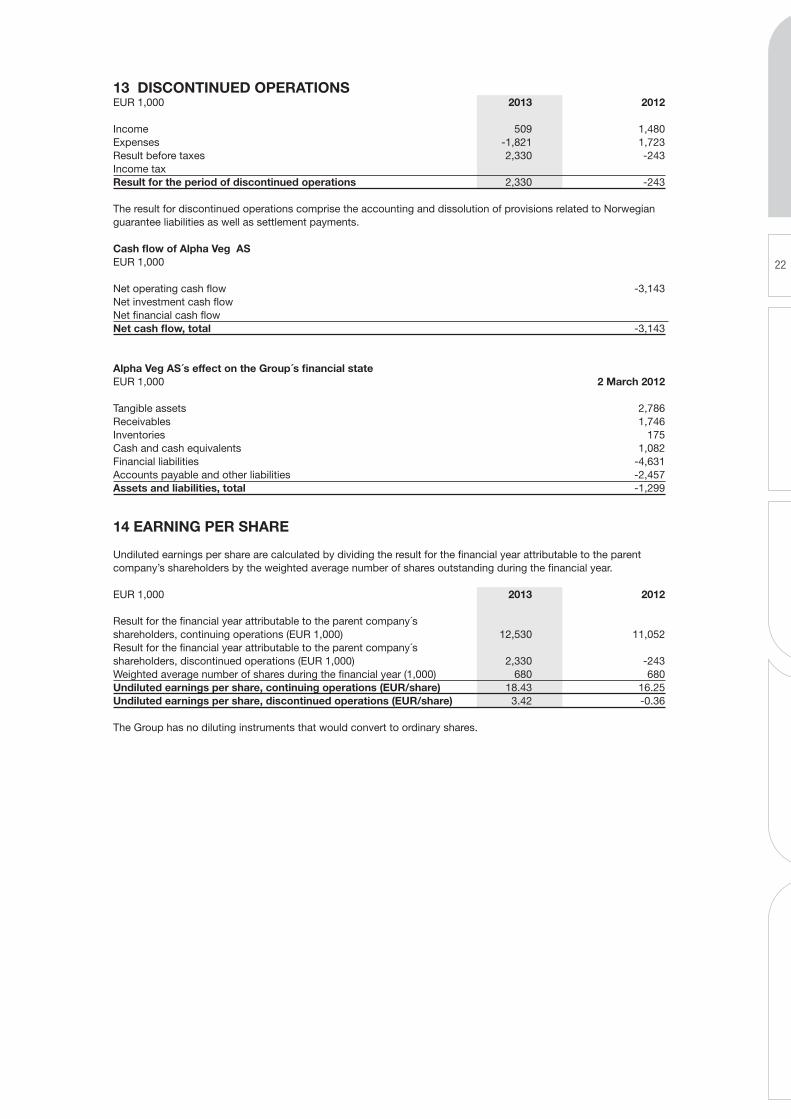
22
13 DISCONTINUED OPERATIONS EUR 1,000 2013 2012 Income 509 1,480Expenses -1,821 1,723Result before taxes 2,330 -243Income tax Result for the period of discontinued operations 2,330 -243 The result for discontinued operations comprise the accounting and dissolution of provisions related to Norwegian guarantee liabilities as well as settlement payments.
Cash flow of Alpha Veg AS EUR 1,000 Net operating cash flow -3,143Net investment cash flow Net financial cash flow Net cash flow, total -3,143 Alpha Veg AS´s effect on the Group´s financial state EUR 1,000 2 March 2012 Tangible assets 2,786Receivables 1,746Inventories 175Cash and cash equivalents 1,082Financial liabilities -4,631Accounts payable and other liabilities -2,457Assets and liabilities, total -1,299
14 EARNING PER SHARE
Undiluted earnings per share are calculated by dividing the result for the financial year attributable to the parent company’s shareholders by the weighted average number of shares outstanding during the financial year. EUR 1,000 2013 2012 Result for the financial year attributable to the parent company´s shareholders, continuing operations (EUR 1,000) 12,530 11,052Result for the financial year attributable to the parent company´s shareholders, discontinued operations (EUR 1,000) 2,330 -243Weighted average number of shares during the financial year (1,000) 680 680Undiluted earnings per share, continuing operations (EUR/share) 18.43 16.25Undiluted earnings per share, discontinued operations (EUR/share) 3.42 -0.36 The Group has no diluting instruments that would convert to ordinary shares.
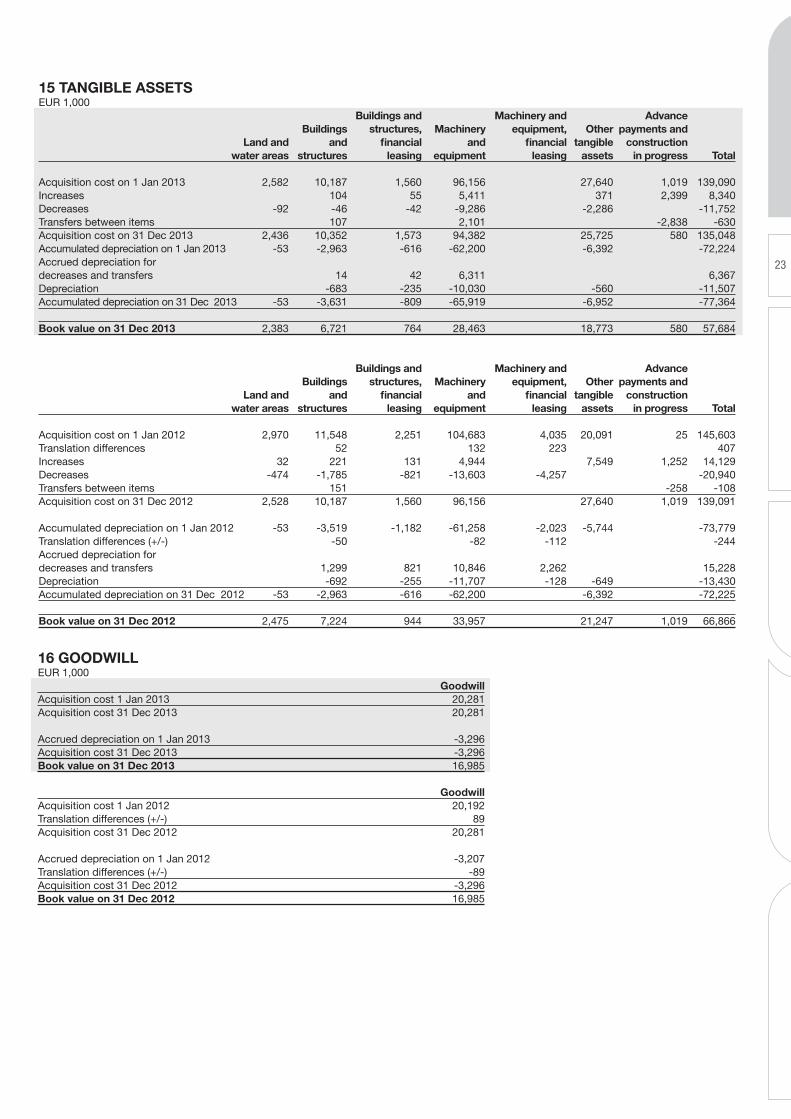
23
15 TANGIBLE ASSETS EUR 1,000 Buildings and Machinery and Advance Buildings structures, Machinery equipment, Other payments and Land and and financial and financial tangible construction water areas structures leasing equipment leasing assets in progress Total
Acquisition cost on 1 Jan 2013 2,582 10,187 1,560 96,156 27,640 1,019 139,090Increases 104 55 5,411 371 2,399 8,340Decreases -92 -46 -42 -9,286 -2,286 -11,752Transfers between items 107 2,101 -2,838 -630Acquisition cost on 31 Dec 2013 2,436 10,352 1,573 94,382 25,725 580 135,048Accumulated depreciation on 1 Jan 2013 -53 -2,963 -616 -62,200 -6,392 -72,224Accrued depreciation for decreases and transfers 14 42 6,311 6,367Depreciation -683 -235 -10,030 -560 -11,507Accumulated depreciation on 31 Dec 2013 -53 -3,631 -809 -65,919 -6,952 -77,364 Book value on 31 Dec 2013 2,383 6,721 764 28,463 18,773 580 57,684
Buildings and Machinery and Advance Buildings structures, Machinery equipment, Other payments and Land and and financial and financial tangible construction water areas structures leasing equipment leasing assets in progress Total
Acquisition cost on 1 Jan 2012 2,970 11,548 2,251 104,683 4,035 20,091 25 145,603Translation differences 52 132 223 407Increases 32 221 131 4,944 7,549 1,252 14,129Decreases -474 -1,785 -821 -13,603 -4,257 -20,940Transfers between items 151 -258 -108Acquisition cost on 31 Dec 2012 2,528 10,187 1,560 96,156 27,640 1,019 139,091
Accumulated depreciation on 1 Jan 2012 -53 -3,519 -1,182 -61,258 -2,023 -5,744 -73,779Translation differences (+/-) -50 -82 -112 -244Accrued depreciation for decreases and transfers 1,299 821 10,846 2,262 15,228Depreciation -692 -255 -11,707 -128 -649 -13,430Accumulated depreciation on 31 Dec 2012 -53 -2,963 -616 -62,200 -6,392 -72,225 Book value on 31 Dec 2012 2,475 7,224 944 33,957 21,247 1,019 66,866
16 GOODWILL EUR 1,000 GoodwillAcquisition cost 1 Jan 2013 20,281Acquisition cost 31 Dec 2013 20,281 Accrued depreciation on 1 Jan 2013 -3,296Acquisition cost 31 Dec 2013 -3,296Book value on 31 Dec 2013 16,985
GoodwillAcquisition cost 1 Jan 2012 20,192Translation differences (+/-) 89Acquisition cost 31 Dec 2012 20,281 Accrued depreciation on 1 Jan 2012 -3,207Translation differences (+/-) -89Acquisition cost 31 Dec 2012 -3,296Book value on 31 Dec 2012 16,985
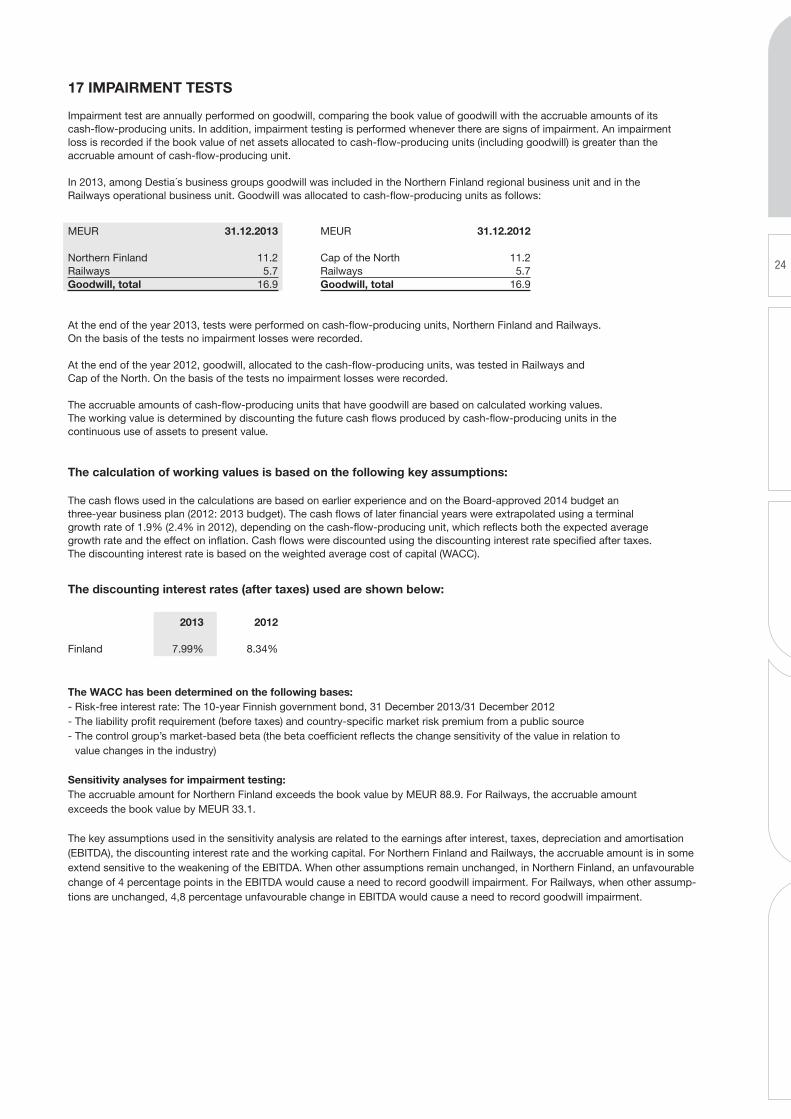
24
17 IMPAIRMENT TESTS Impairment test are annually performed on goodwill, comparing the book value of goodwill with the accruable amounts of its cash-flow-producing units. In addition, impairment testing is performed whenever there are signs of impairment. An impairment loss is recorded if the book value of net assets allocated to cash-flow-producing units (including goodwill) is greater than the accruable amount of cash-flow-producing unit. In 2013, among Destia´s business groups goodwill was included in the Northern Finland regional business unit and in the Railways operational business unit. Goodwill was allocated to cash-flow-producing units as follows:
MEUR 31.12.2013 Northern Finland 11.2Railways 5.7Goodwill, total 16.9
MEUR 31.12.2012
Cap of the North 11.2Railways 5.7Goodwill, total 16.9
2013 2012 Finland 7.99% 8.34%
At the end of the year 2013, tests were performed on cash-flow-producing units, Northern Finland and Railways. On the basis of the tests no impairment losses were recorded. At the end of the year 2012, goodwill, allocated to the cash-flow-producing units, was tested in Railways and Cap of the North. On the basis of the tests no impairment losses were recorded. The accruable amounts of cash-flow-producing units that have goodwill are based on calculated working values. The working value is determined by discounting the future cash flows produced by cash-flow-producing units in the continuous use of assets to present value.
The calculation of working values is based on the following key assumptions: The cash flows used in the calculations are based on earlier experience and on the Board-approved 2014 budget an three-year business plan (2012: 2013 budget). The cash flows of later financial years were extrapolated using a terminal growth rate of 1.9% (2.4% in 2012), depending on the cash-flow-producing unit, which reflects both the expected average growth rate and the effect on inflation. Cash flows were discounted using the discounting interest rate specified after taxes. The discounting interest rate is based on the weighted average cost of capital (WACC).
The discounting interest rates (after taxes) used are shown below:
The WACC has been determined on the following bases: - Risk-free interest rate: The 10-year Finnish government bond, 31 December 2013/31 December 2012- The liability profit requirement (before taxes) and country-specific market risk premium from a public source - The control group’s market-based beta (the beta coefficient reflects the change sensitivity of the value in relation to
value changes in the industry) Sensitivity analyses for impairment testing:The accruable amount for Northern Finland exceeds the book value by MEUR 88.9. For Railways, the accruable amount exceeds the book value by MEUR 33.1.
The key assumptions used in the sensitivity analysis are related to the earnings after interest, taxes, depreciation and amortisation (EBITDA), the discounting interest rate and the working capital. For Northern Finland and Railways, the accruable amount is in some extend sensitive to the weakening of the EBITDA. When other assumptions remain unchanged, in Northern Finland, an unfavourable change of 4 percentage points in the EBITDA would cause a need to record goodwill impairment. For Railways, when other assump-tions are unchanged, 4,8 percentage unfavourable change in EBITDA would cause a need to record goodwill impairment.
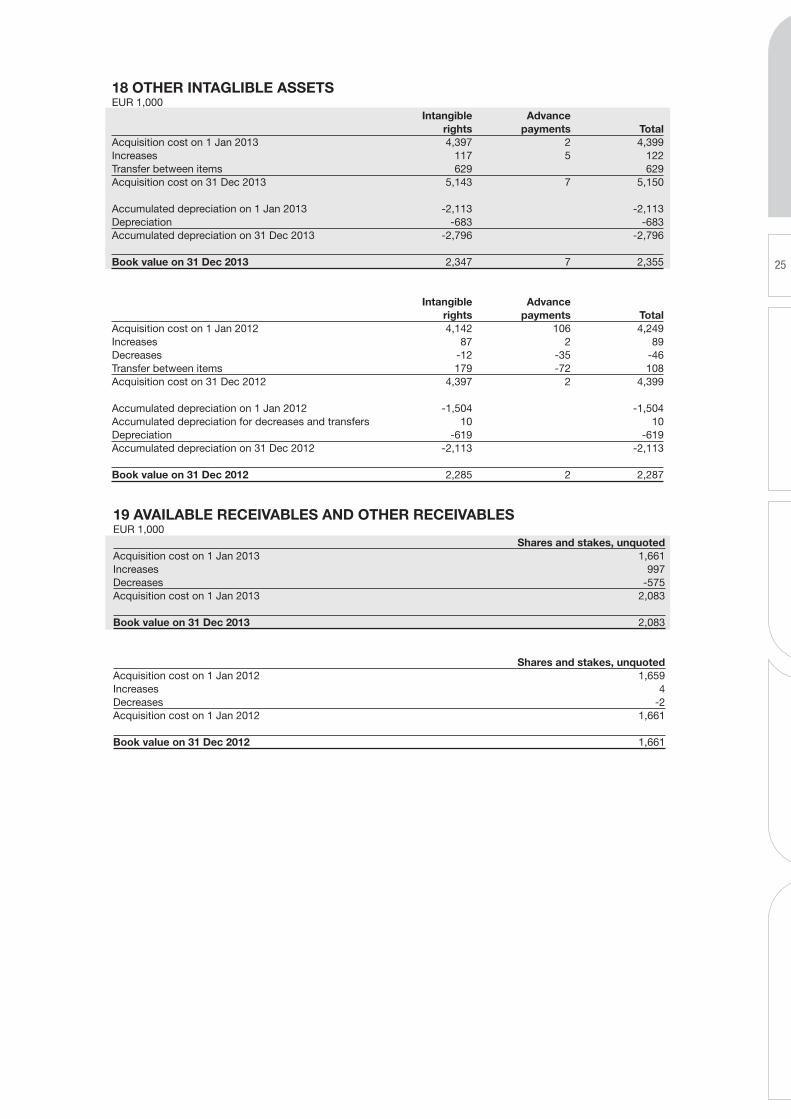
25
18 OTHER INTAGLIBLE ASSETS EUR 1,000 Intangible Advance rights payments TotalAcquisition cost on 1 Jan 2013 4,397 2 4,399Increases 117 5 122Transfer between items 629 629Acquisition cost on 31 Dec 2013 5,143 7 5,150 Accumulated depreciation on 1 Jan 2013 -2,113 -2,113Depreciation -683 -683Accumulated depreciation on 31 Dec 2013 -2,796 -2,796 Book value on 31 Dec 2013 2,347 7 2,355 Intangible Advance rights payments TotalAcquisition cost on 1 Jan 2012 4,142 106 4,249Increases 87 2 89Decreases -12 -35 -46Transfer between items 179 -72 108Acquisition cost on 31 Dec 2012 4,397 2 4,399 Accumulated depreciation on 1 Jan 2012 -1,504 -1,504Accumulated depreciation for decreases and transfers 10 10Depreciation -619 -619Accumulated depreciation on 31 Dec 2012 -2,113 -2,113 Book value on 31 Dec 2012 2,285 2 2,287
19 AVAILABLE RECEIVABLES AND OTHER RECEIVABLES EUR 1,000 Shares and stakes, unquotedAcquisition cost on 1 Jan 2013 1,661Increases 997Decreases -575Acquisition cost on 1 Jan 2013 2,083 Book value on 31 Dec 2013 2,083
Shares and stakes, unquotedAcquisition cost on 1 Jan 2012 1,659Increases 4Decreases -2Acquisition cost on 1 Jan 2012 1,661 Book value on 31 Dec 2012 1,661
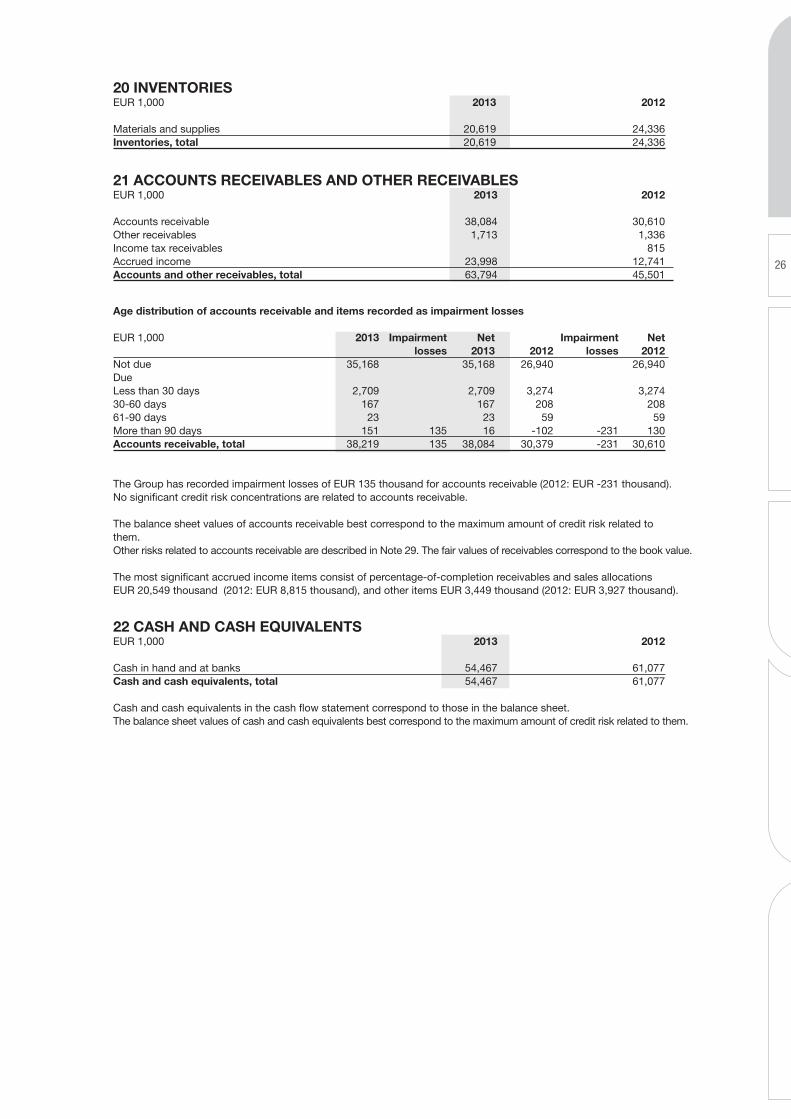
26
21 ACCOUNTS RECEIVABLES AND OTHER RECEIVABLES EUR 1,000 2013 2012 Accounts receivable 38,084 30,610 Other receivables 1,713 1,336 Income tax receivables 815 Accrued income 23,998 12,741 Accounts and other receivables, total 63,794 45,501
22 CASH AND CASH EQUIVALENTS EUR 1,000 2013 2012 Cash in hand and at banks 54,467 61,077Cash and cash equivalents, total 54,467 61,077 Cash and cash equivalents in the cash flow statement correspond to those in the balance sheet. The balance sheet values of cash and cash equivalents best correspond to the maximum amount of credit risk related to them.
20 INVENTORIES EUR 1,000 2013 2012 Materials and supplies 20,619 24,336Inventories, total 20,619 24,336
Age distribution of accounts receivable and items recorded as impairment losses
EUR 1,000 2013 Impairment Net Impairment Net losses 2013 2012 losses 2012 Not due 35,168 35,168 26,940 26,940Due Less than 30 days 2,709 2,709 3,274 3,27430-60 days 167 167 208 20861-90 days 23 23 59 59More than 90 days 151 135 16 -102 -231 130Accounts receivable, total 38,219 135 38,084 30,379 -231 30,610
The Group has recorded impairment losses of EUR 135 thousand for accounts receivable (2012: EUR -231 thousand). No significant credit risk concentrations are related to accounts receivable. The balance sheet values of accounts receivable best correspond to the maximum amount of credit risk related to them. Other risks related to accounts receivable are described in Note 29. The fair values of receivables correspond to the book value. The most significant accrued income items consist of percentage-of-completion receivables and sales allocations EUR 20,549 thousand (2012: EUR 8,815 thousand), and other items EUR 3,449 thousand (2012: EUR 3,927 thousand).
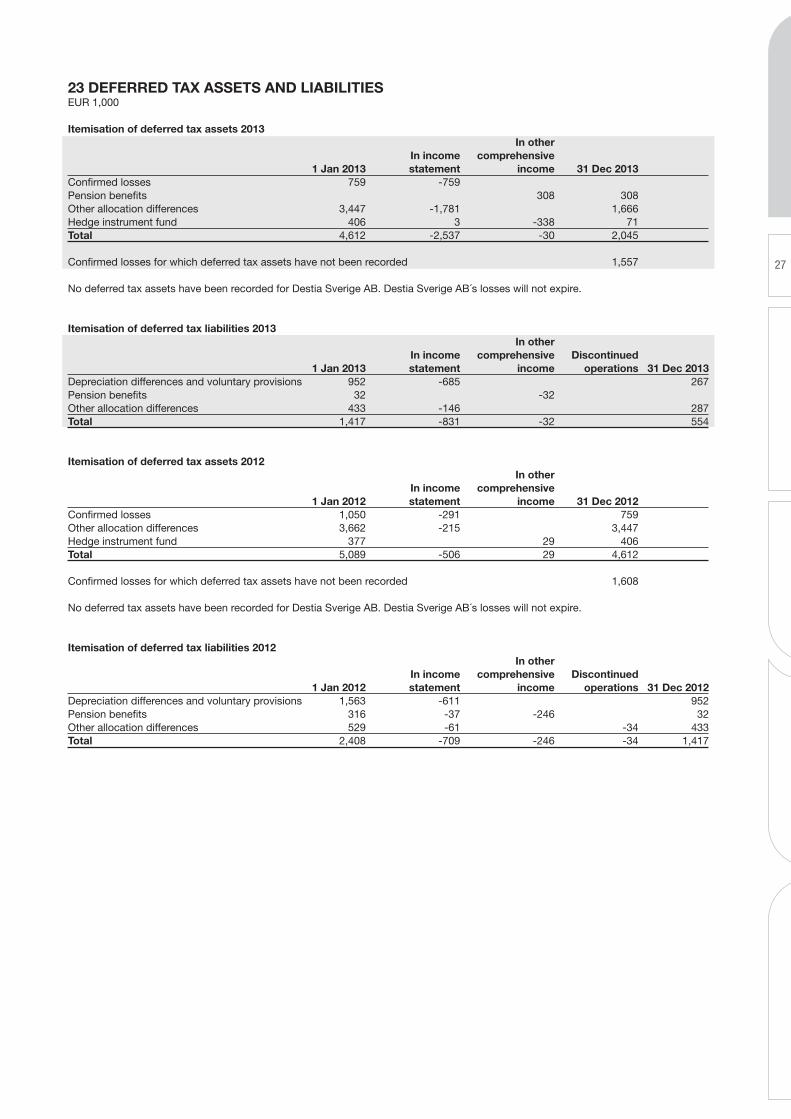
27
23 DEFERRED TAx ASSETS AND LIABILITIES EUR 1,000
Itemisation of deferred tax assets 2013 In other In income comprehensive 1 Jan 2013 statement income 31 Dec 2013 Confirmed losses 759 -759 Pension benefits 308 308 Other allocation differences 3,447 -1,781 1,666 Hedge instrument fund 406 3 -338 71 Total 4,612 -2,537 -30 2,045 Confirmed losses for which deferred tax assets have not been recorded 1,557 No deferred tax assets have been recorded for Destia Sverige AB. Destia Sverige AB´s losses will not expire.
Itemisation of deferred tax liabilities 2013 In other In income comprehensive Discontinued 1 Jan 2013 statement income operations 31 Dec 2013Depreciation differences and voluntary provisions 952 -685 267Pension benefits 32 -32 Other allocation differences 433 -146 287Total 1,417 -831 -32 554 Itemisation of deferred tax assets 2012 In other In income comprehensive 1 Jan 2012 statement income 31 Dec 2012 Confirmed losses 1,050 -291 759 Other allocation differences 3,662 -215 3,447 Hedge instrument fund 377 29 406 Total 5,089 -506 29 4,612 Confirmed losses for which deferred tax assets have not been recorded 1,608 No deferred tax assets have been recorded for Destia Sverige AB. Destia Sverige AB´s losses will not expire. Itemisation of deferred tax liabilities 2012 In other In income comprehensive Discontinued 1 Jan 2012 statement income operations 31 Dec 2012Depreciation differences and voluntary provisions 1,563 -611 952Pension benefits 316 -37 -246 32Other allocation differences 529 -61 -34 433Total 2,408 -709 -246 -34 1,417
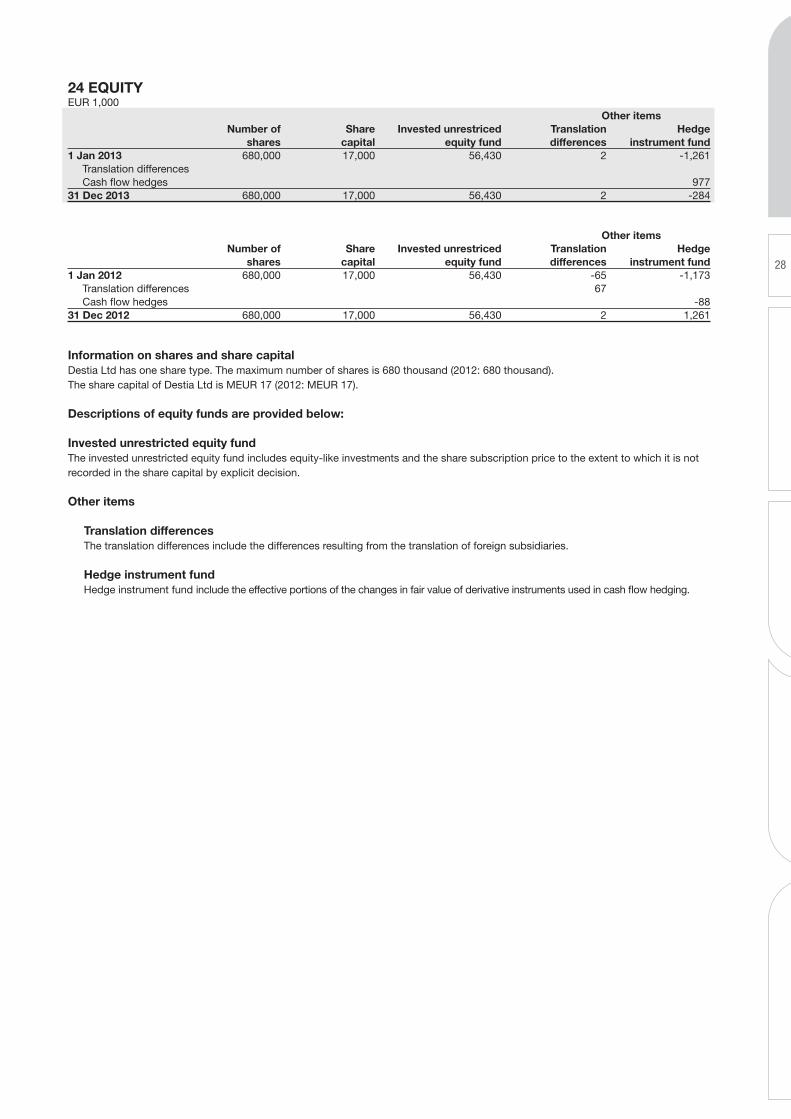
28
24 EQUITY EUR 1,000 Other items Number of Share Invested unrestriced Translation Hedge shares capital equity fund differences instrument fund1 Jan 2013 680,000 17,000 56,430 2 -1,261 Translation differences Cash flow hedges 97731 Dec 2013 680,000 17,000 56,430 2 -284
Other items Number of Share Invested unrestriced Translation Hedge shares capital equity fund differences instrument fund1 Jan 2012 680,000 17,000 56,430 -65 -1,173 Translation differences 67 Cash flow hedges -8831 Dec 2012 680,000 17,000 56,430 2 1,261
Information on shares and share capitalDestia Ltd has one share type. The maximum number of shares is 680 thousand (2012: 680 thousand). The share capital of Destia Ltd is MEUR 17 (2012: MEUR 17).
Descriptions of equity funds are provided below:
Invested unrestricted equity fundThe invested unrestricted equity fund includes equity-like investments and the share subscription price to the extent to which it is not recorded in the share capital by explicit decision.
Other items
Translation differences The translation differences include the differences resulting from the translation of foreign subsidiaries.
Hedge instrument fund Hedge instrument fund include the effective portions of the changes in fair value of derivative instruments used in cash flow hedging.
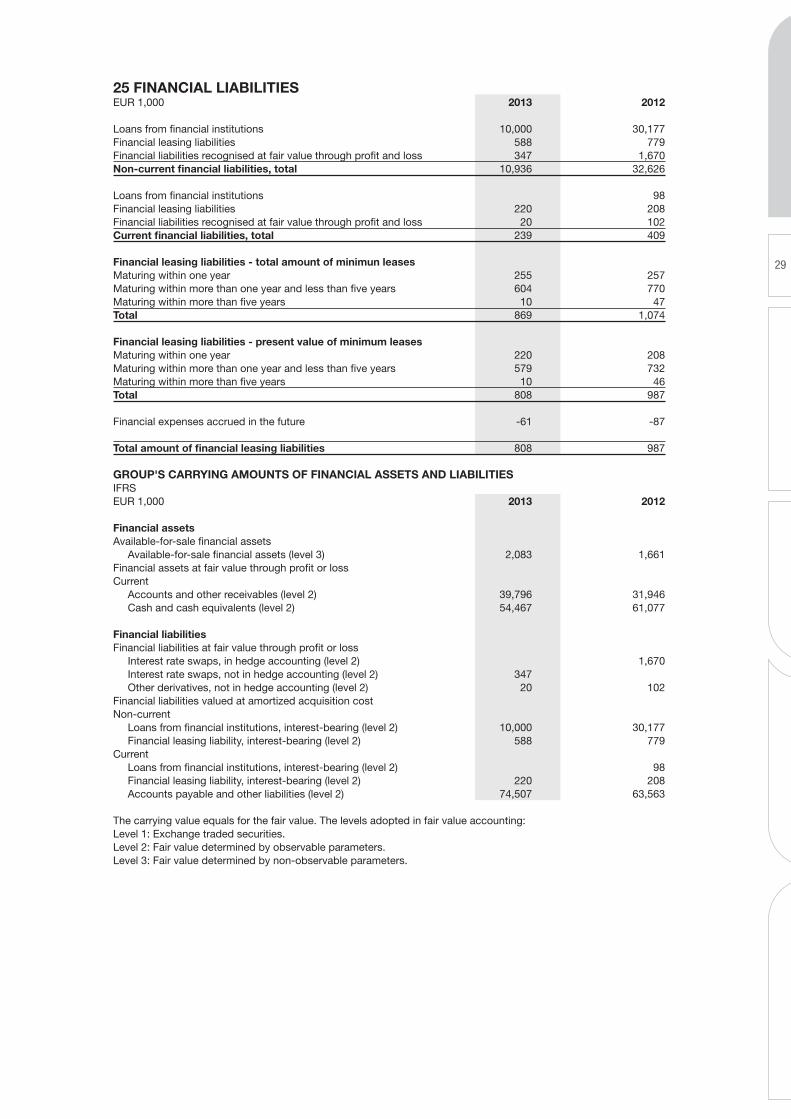
29
25 FINANCIAL LIABILITIES EUR 1,000 2013 2012 Loans from financial institutions 10,000 30,177Financial leasing liabilities 588 779Financial liabilities recognised at fair value through profit and loss 347 1,670Non-current financial liabilities, total 10,936 32,626 Loans from financial institutions 98Financial leasing liabilities 220 208Financial liabilities recognised at fair value through profit and loss 20 102Current financial liabilities, total 239 409 Financial leasing liabilities - total amount of minimun leases Maturing within one year 255 257Maturing within more than one year and less than five years 604 770Maturing within more than five years 10 47Total 869 1,074 Financial leasing liabilities - present value of minimum leases Maturing within one year 220 208Maturing within more than one year and less than five years 579 732Maturing within more than five years 10 46Total 808 987 Financial expenses accrued in the future -61 -87 Total amount of financial leasing liabilities 808 987 GROUP'S CARRYING AMOUNTS OF FINANCIAL ASSETS AND LIABILITIES IFRS EUR 1,000 2013 2012 Financial assets Available-for-sale financial assets Available-for-sale financial assets (level 3) 2,083 1,661Financial assets at fair value through profit or loss Current Accounts and other receivables (level 2) 39,796 31,946 Cash and cash equivalents (level 2) 54,467 61,077 Financial liabilities Financial liabilities at fair value through profit or loss Interest rate swaps, in hedge accounting (level 2) 1,670 Interest rate swaps, not in hedge accounting (level 2) 347 Other derivatives, not in hedge accounting (level 2) 20 102Financial liabilities valued at amortized acquisition cost Non-current Loans from financial institutions, interest-bearing (level 2) 10,000 30,177 Financial leasing liability, interest-bearing (level 2) 588 779Current Loans from financial institutions, interest-bearing (level 2) 98 Financial leasing liability, interest-bearing (level 2) 220 208 Accounts payable and other liabilities (level 2) 74,507 63,563 The carrying value equals for the fair value. The levels adopted in fair value accounting: Level 1: Exchange traded securities. Level 2: Fair value determined by observable parameters. Level 3: Fair value determined by non-observable parameters.
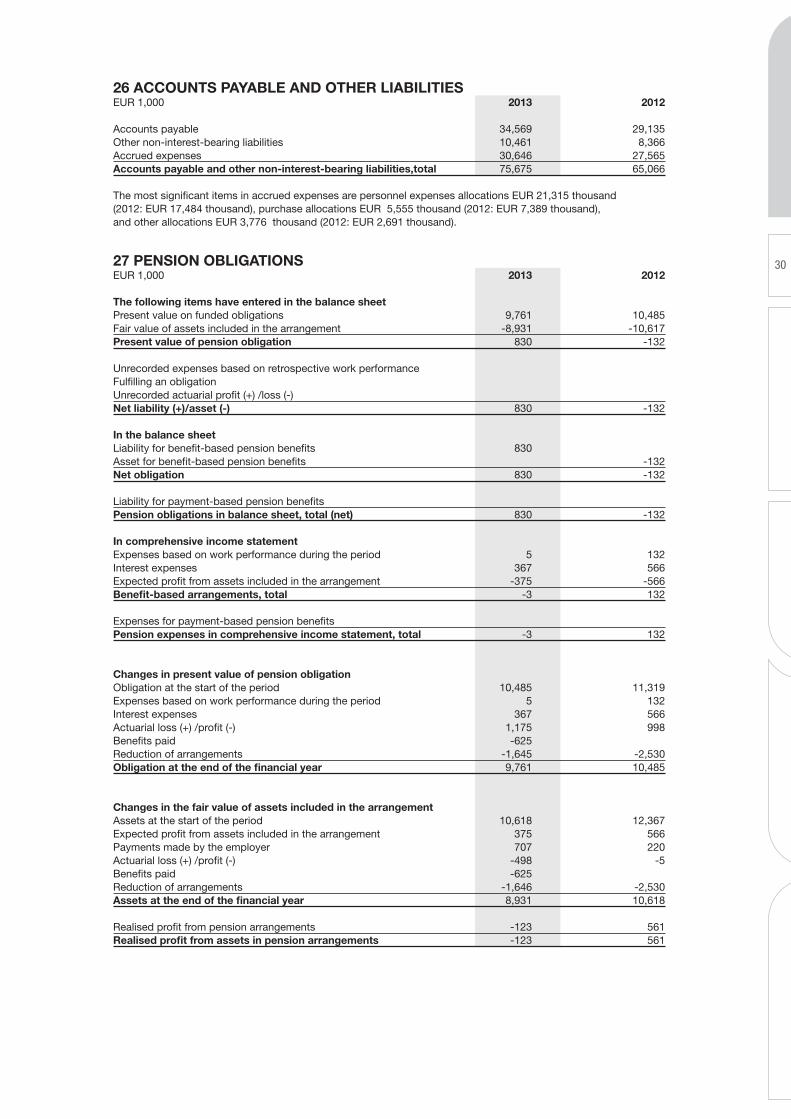
30
26 ACCOUNTS PAYABLE AND OTHER LIABILITIES EUR 1,000 2013 2012 Accounts payable 34,569 29,135Other non-interest-bearing liabilities 10,461 8,366Accrued expenses 30,646 27,565Accounts payable and other non-interest-bearing liabilities,total 75,675 65,066
The most significant items in accrued expenses are personnel expenses allocations EUR 21,315 thousand (2012: EUR 17,484 thousand), purchase allocations EUR 5,555 thousand (2012: EUR 7,389 thousand), and other allocations EUR 3,776 thousand (2012: EUR 2,691 thousand).
27 PENSION OBLIGATIONS EUR 1,000 2013 2012
The following items have entered in the balance sheet Present value on funded obligations 9,761 10,485Fair value of assets included in the arrangement -8,931 -10,617Present value of pension obligation 830 -132 Unrecorded expenses based on retrospective work performance Fulfilling an obligation Unrecorded actuarial profit (+) /loss (-) Net liability (+)/asset (-) 830 -132 In the balance sheet Liability for benefit-based pension benefits 830 Asset for benefit-based pension benefits -132Net obligation 830 -132 Liability for payment-based pension benefits Pension obligations in balance sheet, total (net) 830 -132 In comprehensive income statement Expenses based on work performance during the period 5 132Interest expenses 367 566Expected profit from assets included in the arrangement -375 -566Benefit-based arrangements, total -3 132 Expenses for payment-based pension benefits Pension expenses in comprehensive income statement, total -3 132 Changes in present value of pension obligation Obligation at the start of the period 10,485 11,319Expenses based on work performance during the period 5 132Interest expenses 367 566Actuarial loss (+) /profit (-) 1,175 998Benefits paid -625 Reduction of arrangements -1,645 -2,530Obligation at the end of the financial year 9,761 10,485
Changes in the fair value of assets included in the arrangement Assets at the start of the period 10,618 12,367Expected profit from assets included in the arrangement 375 566Payments made by the employer 707 220Actuarial loss (+) /profit (-) -498 -5Benefits paid -625 Reduction of arrangements -1,646 -2,530Assets at the end of the financial year 8,931 10,618 Realised profit from pension arrangements -123 561Realised profit from assets in pension arrangements -123 561
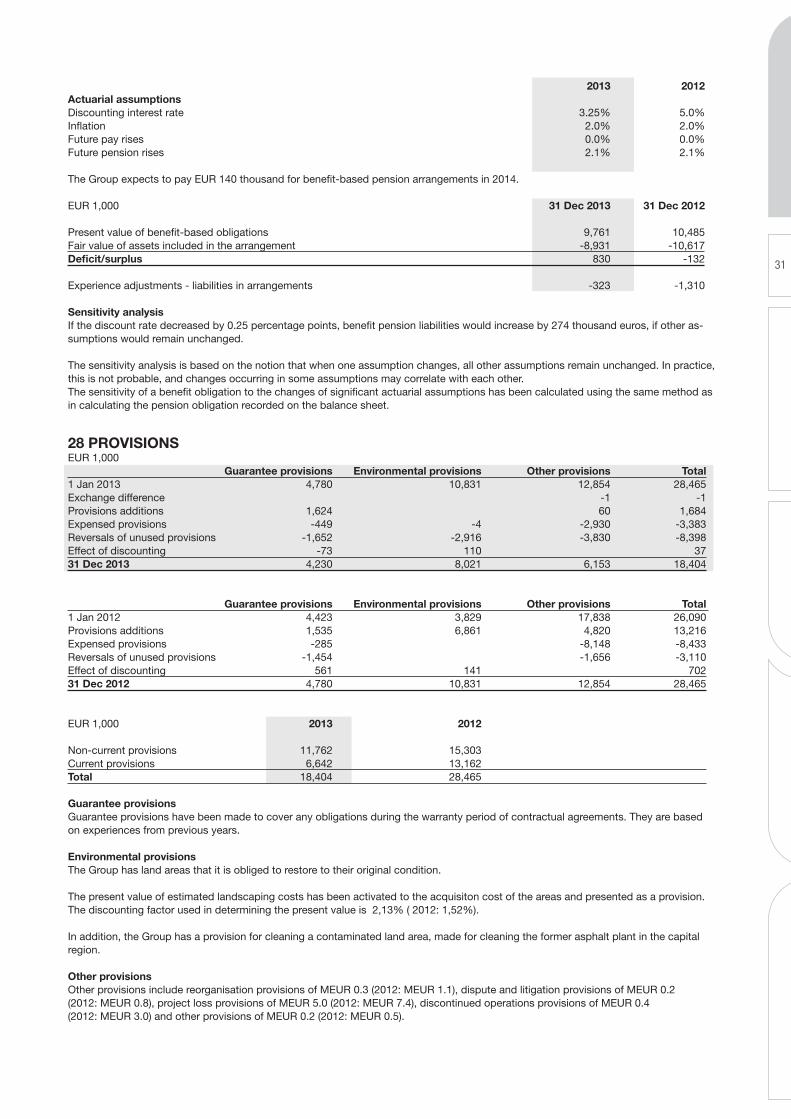
31
2013 2012Actuarial assumptions Discounting interest rate 3.25% 5.0%Inflation 2.0% 2.0%Future pay rises 0.0% 0.0%Future pension rises 2.1% 2.1% The Group expects to pay EUR 140 thousand for benefit-based pension arrangements in 2014. EUR 1,000 31 Dec 2013 31 Dec 2012 Present value of benefit-based obligations 9,761 10,485Fair value of assets included in the arrangement -8,931 -10,617Deficit/surplus 830 -132 Experience adjustments - liabilities in arrangements -323 -1,310 Sensitivity analysis If the discount rate decreased by 0.25 percentage points, benefit pension liabilities would increase by 274 thousand euros, if other as-sumptions would remain unchanged.
The sensitivity analysis is based on the notion that when one assumption changes, all other assumptions remain unchanged. In practice, this is not probable, and changes occurring in some assumptions may correlate with each other. The sensitivity of a benefit obligation to the changes of significant actuarial assumptions has been calculated using the same method as in calculating the pension obligation recorded on the balance sheet.
28 PROVISIONS EUR 1,000 Guarantee provisions Environmental provisions Other provisions Total1 Jan 2013 4,780 10,831 12,854 28,465 Exchange difference -1 -1 Provisions additions 1,624 60 1,684 Expensed provisions -449 -4 -2,930 -3,383 Reversals of unused provisions -1,652 -2,916 -3,830 -8,398 Effect of discounting -73 110 3731 Dec 2013 4,230 8,021 6,153 18,404
Guarantee provisions Environmental provisions Other provisions Total 1 Jan 2012 4,423 3,829 17,838 26,090 Provisions additions 1,535 6,861 4,820 13,216 Expensed provisions -285 -8,148 -8,433 Reversals of unused provisions -1,454 -1,656 -3,110 Effect of discounting 561 141 70231 Dec 2012 4,780 10,831 12,854 28,465
EUR 1,000 2013 2012 Non-current provisions 11,762 15,303 Current provisions 6,642 13,162 Total 18,404 28,465
Guarantee provisions Guarantee provisions have been made to cover any obligations during the warranty period of contractual agreements. They are based on experiences from previous years.
Environmental provisionsThe Group has land areas that it is obliged to restore to their original condition.
The present value of estimated landscaping costs has been activated to the acquisiton cost of the areas and presented as a provision. The discounting factor used in determining the present value is 2,13% ( 2012: 1,52%).
In addition, the Group has a provision for cleaning a contaminated land area, made for cleaning the former asphalt plant in the capital region.
Other provisionsOther provisions include reorganisation provisions of MEUR 0.3 (2012: MEUR 1.1), dispute and litigation provisions of MEUR 0.2 (2012: MEUR 0.8), project loss provisions of MEUR 5.0 (2012: MEUR 7.4), discontinued operations provisions of MEUR 0.4 (2012: MEUR 3.0) and other provisions of MEUR 0.2 (2012: MEUR 0.5).
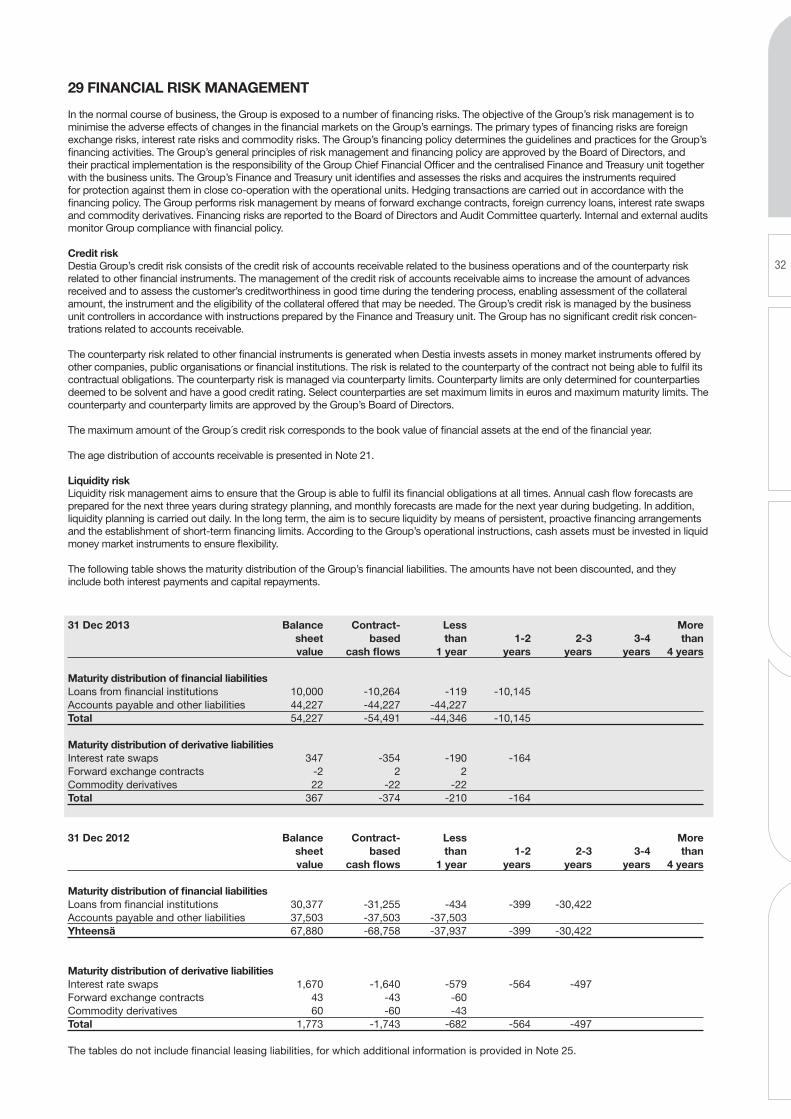
32
29 FINANCIAL RISK MANAGEMENT
In the normal course of business, the Group is exposed to a number of financing risks. The objective of the Group’s risk management is to minimise the adverse effects of changes in the financial markets on the Group’s earnings. The primary types of financing risks are foreign exchange risks, interest rate risks and commodity risks. The Group’s financing policy determines the guidelines and practices for the Group’s financing activities. The Group’s general principles of risk management and financing policy are approved by the Board of Directors, and their practical implementation is the responsibility of the Group Chief Financial Officer and the centralised Finance and Treasury unit together with the business units. The Group’s Finance and Treasury unit identifies and assesses the risks and acquires the instruments required for protection against them in close co-operation with the operational units. Hedging transactions are carried out in accordance with the financing policy. The Group performs risk management by means of forward exchange contracts, foreign currency loans, interest rate swaps and commodity derivatives. Financing risks are reported to the Board of Directors and Audit Committee quarterly. Internal and external audits monitor Group compliance with financial policy.
Credit risk Destia Group’s credit risk consists of the credit risk of accounts receivable related to the business operations and of the counterparty risk related to other financial instruments. The management of the credit risk of accounts receivable aims to increase the amount of advances received and to assess the customer’s creditworthiness in good time during the tendering process, enabling assessment of the collateral amount, the instrument and the eligibility of the collateral offered that may be needed. The Group’s credit risk is managed by the business unit controllers in accordance with instructions prepared by the Finance and Treasury unit. The Group has no significant credit risk concen-trations related to accounts receivable.
The counterparty risk related to other financial instruments is generated when Destia invests assets in money market instruments offered by other companies, public organisations or financial institutions. The risk is related to the counterparty of the contract not being able to fulfil its contractual obligations. The counterparty risk is managed via counterparty limits. Counterparty limits are only determined for counterparties deemed to be solvent and have a good credit rating. Select counterparties are set maximum limits in euros and maximum maturity limits. The counterparty and counterparty limits are approved by the Group’s Board of Directors.
The maximum amount of the Group´s credit risk corresponds to the book value of financial assets at the end of the financial year.
The age distribution of accounts receivable is presented in Note 21.
Liquidity risk Liquidity risk management aims to ensure that the Group is able to fulfil its financial obligations at all times. Annual cash flow forecasts are prepared for the next three years during strategy planning, and monthly forecasts are made for the next year during budgeting. In addition, liquidity planning is carried out daily. In the long term, the aim is to secure liquidity by means of persistent, proactive financing arrangements and the establishment of short-term financing limits. According to the Group’s operational instructions, cash assets must be invested in liquid money market instruments to ensure flexibility.
The following table shows the maturity distribution of the Group’s financial liabilities. The amounts have not been discounted, and they include both interest payments and capital repayments.
31 Dec 2013 Balance Contract- Less More sheet based than 1-2 2-3 3-4 than value cash flows 1 year years years years 4 years Maturity distribution of financial liabilities Loans from financial institutions 10,000 -10,264 -119 -10,145 Accounts payable and other liabilities 44,227 -44,227 -44,227 Total 54,227 -54,491 -44,346 -10,145
Maturity distribution of derivative liabilities Interest rate swaps 347 -354 -190 -164 Forward exchange contracts -2 2 2 Commodity derivatives 22 -22 -22 Total 367 -374 -210 -164 31 Dec 2012 Balance Contract- Less More sheet based than 1-2 2-3 3-4 than value cash flows 1 year years years years 4 years Maturity distribution of financial liabilities Loans from financial institutions 30,377 -31,255 -434 -399 -30,422 Accounts payable and other liabilities 37,503 -37,503 -37,503 Yhteensä 67,880 -68,758 -37,937 -399 -30,422 Maturity distribution of derivative liabilities Interest rate swaps 1,670 -1,640 -579 -564 -497 Forward exchange contracts 43 -43 -60 Commodity derivatives 60 -60 -43 Total 1,773 -1,743 -682 -564 -497
The tables do not include financial leasing liabilities, for which additional information is provided in Note 25.
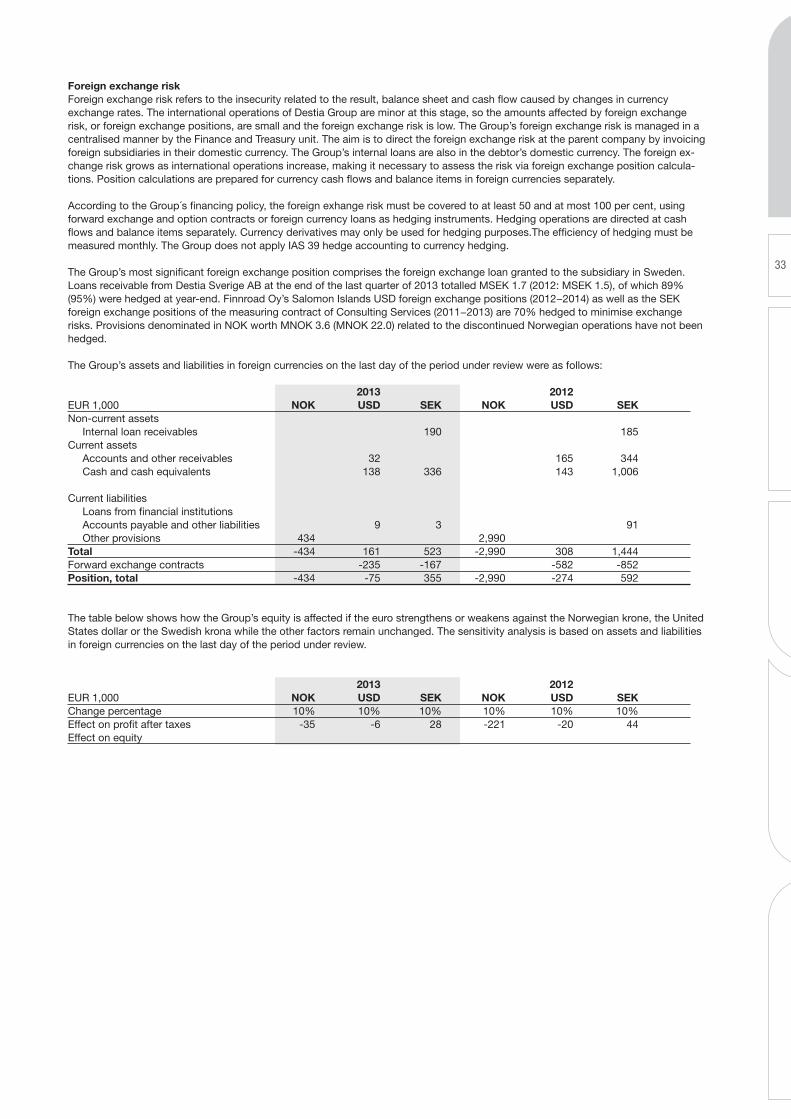
33
Foreign exchange risk Foreign exchange risk refers to the insecurity related to the result, balance sheet and cash flow caused by changes in currency exchange rates. The international operations of Destia Group are minor at this stage, so the amounts affected by foreign exchange risk, or foreign exchange positions, are small and the foreign exchange risk is low. The Group’s foreign exchange risk is managed in a centralised manner by the Finance and Treasury unit. The aim is to direct the foreign exchange risk at the parent company by invoicing foreign subsidiaries in their domestic currency. The Group’s internal loans are also in the debtor’s domestic currency. The foreign ex-change risk grows as international operations increase, making it necessary to assess the risk via foreign exchange position calcula-tions. Position calculations are prepared for currency cash flows and balance items in foreign currencies separately.
According to the Group´s financing policy, the foreign exhange risk must be covered to at least 50 and at most 100 per cent, using forward exchange and option contracts or foreign currency loans as hedging instruments. Hedging operations are directed at cash flows and balance items separately. Currency derivatives may only be used for hedging purposes.The efficiency of hedging must be measured monthly. The Group does not apply IAS 39 hedge accounting to currency hedging.
The Group’s most significant foreign exchange position comprises the foreign exchange loan granted to the subsidiary in Sweden. Loans receivable from Destia Sverige AB at the end of the last quarter of 2013 totalled MSEK 1.7 (2012: MSEK 1.5), of which 89% (95%) were hedged at year-end. Finnroad Oy’s Salomon Islands USD foreign exchange positions (2012−2014) as well as the SEK foreign exchange positions of the measuring contract of Consulting Services (2011−2013) are 70% hedged to minimise exchange risks. Provisions denominated in NOK worth MNOK 3.6 (MNOK 22.0) related to the discontinued Norwegian operations have not been hedged.
The Group’s assets and liabilities in foreign currencies on the last day of the period under review were as follows: 2013 2012 EUR 1,000 NOK USD SEK NOK USD SEK Non-current assets Internal loan receivables 190 185 Current assets Accounts and other receivables 32 165 344 Cash and cash equivalents 138 336 143 1,006 Current liabilities Loans from financial institutions Accounts payable and other liabilities 9 3 91 Other provisions 434 2,990 Total -434 161 523 -2,990 308 1,444 Forward exchange contracts -235 -167 -582 -852 Position, total -434 -75 355 -2,990 -274 592
The table below shows how the Group’s equity is affected if the euro strengthens or weakens against the Norwegian krone, the United States dollar or the Swedish krona while the other factors remain unchanged. The sensitivity analysis is based on assets and liabilities in foreign currencies on the last day of the period under review.
2013 2012 EUR 1,000 NOK USD SEK NOK USD SEK Change percentage 10% 10% 10% 10% 10% 10% Effect on profit after taxes -35 -6 28 -221 -20 44 Effect on equity
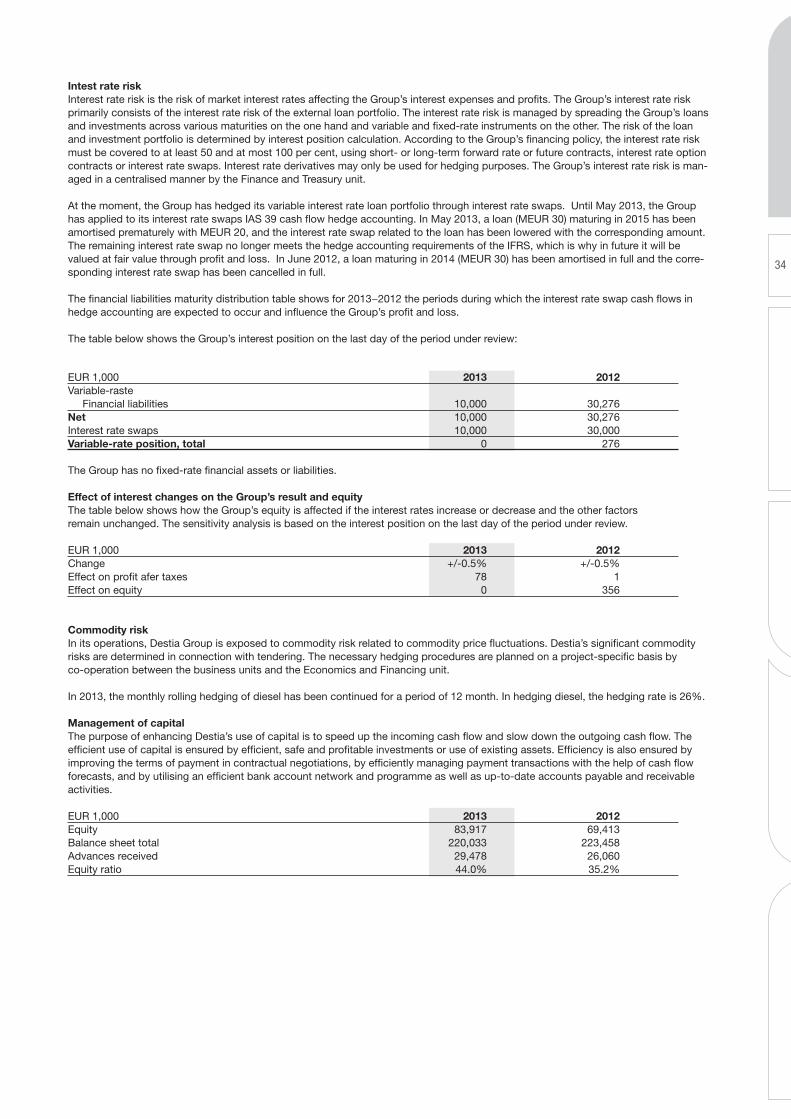
34
EUR 1,000 2013 2012 Variable-raste Financial liabilities 10,000 30,276 Net 10,000 30,276 Interest rate swaps 10,000 30,000 Variable-rate position, total 0 276
The Group has no fixed-rate financial assets or liabilities.
Effect of interest changes on the Group’s result and equity The table below shows how the Group’s equity is affected if the interest rates increase or decrease and the other factors remain unchanged. The sensitivity analysis is based on the interest position on the last day of the period under review. EUR 1,000 2013 2012 Change +/-0.5% +/-0.5% Effect on profit afer taxes 78 1 Effect on equity 0 356
Commodity riskIn its operations, Destia Group is exposed to commodity risk related to commodity price fluctuations. Destia’s significant commodity risks are determined in connection with tendering. The necessary hedging procedures are planned on a project-specific basis by co-operation between the business units and the Economics and Financing unit.
In 2013, the monthly rolling hedging of diesel has been continued for a period of 12 month. In hedging diesel, the hedging rate is 26%.
Management of capitalThe purpose of enhancing Destia’s use of capital is to speed up the incoming cash flow and slow down the outgoing cash flow. The efficient use of capital is ensured by efficient, safe and profitable investments or use of existing assets. Efficiency is also ensured by improving the terms of payment in contractual negotiations, by efficiently managing payment transactions with the help of cash flow forecasts, and by utilising an efficient bank account network and programme as well as up-to-date accounts payable and receivable activities. EUR 1,000 2013 2012 Equity 83,917 69,413 Balance sheet total 220,033 223,458 Advances received 29,478 26,060 Equity ratio 44.0% 35.2%
Intest rate risk Interest rate risk is the risk of market interest rates affecting the Group’s interest expenses and profits. The Group’s interest rate risk primarily consists of the interest rate risk of the external loan portfolio. The interest rate risk is managed by spreading the Group’s loans and investments across various maturities on the one hand and variable and fixed-rate instruments on the other. The risk of the loan and investment portfolio is determined by interest position calculation. According to the Group’s financing policy, the interest rate risk must be covered to at least 50 and at most 100 per cent, using short- or long-term forward rate or future contracts, interest rate option contracts or interest rate swaps. Interest rate derivatives may only be used for hedging purposes. The Group’s interest rate risk is man-aged in a centralised manner by the Finance and Treasury unit.
At the moment, the Group has hedged its variable interest rate loan portfolio through interest rate swaps. Until May 2013, the Group has applied to its interest rate swaps IAS 39 cash flow hedge accounting. In May 2013, a loan (MEUR 30) maturing in 2015 has been amortised prematurely with MEUR 20, and the interest rate swap related to the loan has been lowered with the corresponding amount. The remaining interest rate swap no longer meets the hedge accounting requirements of the IFRS, which is why in future it will be valued at fair value through profit and loss. In June 2012, a loan maturing in 2014 (MEUR 30) has been amortised in full and the corre-sponding interest rate swap has been cancelled in full.
The financial liabilities maturity distribution table shows for 2013−2012 the periods during which the interest rate swap cash flows in hedge accounting are expected to occur and influence the Group’s profit and loss.
The table below shows the Group’s interest position on the last day of the period under review:
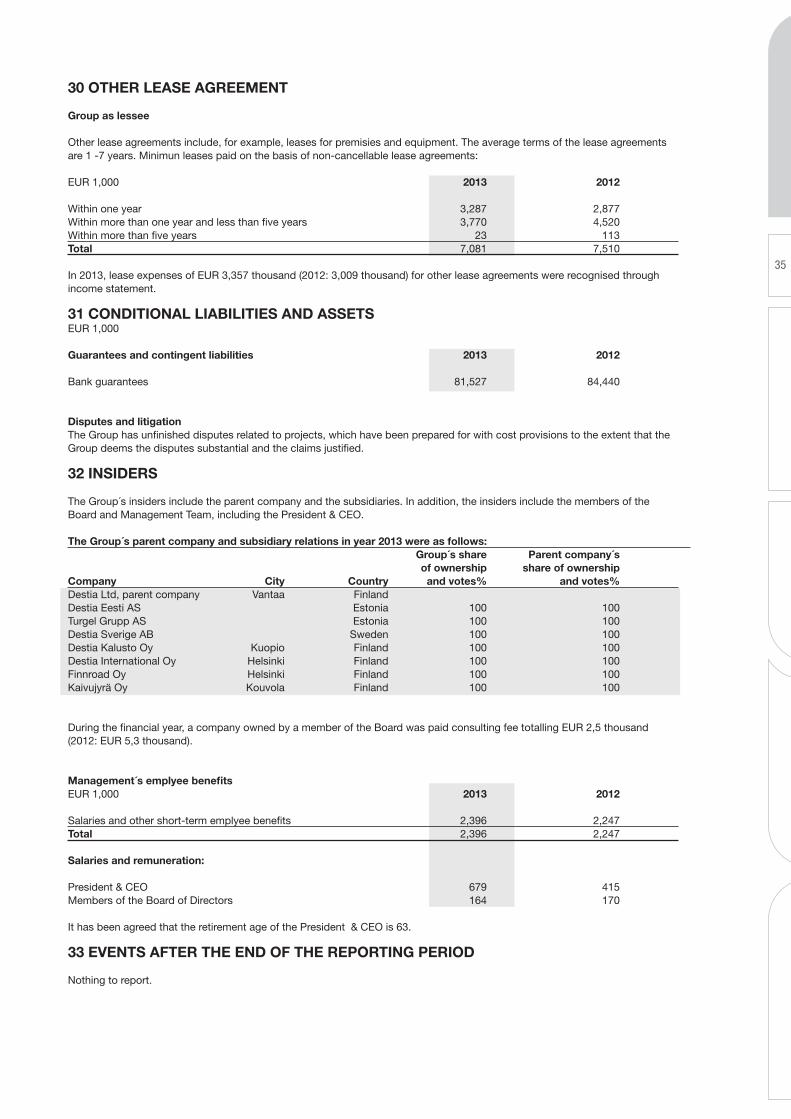
35
30 OTHER LEASE AGREEMENT
Group as lessee
Other lease agreements include, for example, leases for premisies and equipment. The average terms of the lease agreements are 1 -7 years. Minimun leases paid on the basis of non-cancellable lease agreements: EUR 1,000 2013 2012 Within one year 3,287 2,877 Within more than one year and less than five years 3,770 4,520 Within more than five years 23 113 Total 7,081 7,510 In 2013, lease expenses of EUR 3,357 thousand (2012: 3,009 thousand) for other lease agreements were recognised through income statement. 31 CONDITIONAL LIABILITIES AND ASSETS EUR 1,000 Guarantees and contingent liabilities 2013 2012
Bank guarantees 81,527 84,440
Disputes and litigation The Group has unfinished disputes related to projects, which have been prepared for with cost provisions to the extent that the Group deems the disputes substantial and the claims justified. 32 INSIDERS The Group´s insiders include the parent company and the subsidiaries. In addition, the insiders include the members of the Board and Management Team, including the President & CEO. The Group´s parent company and subsidiary relations in year 2013 were as follows: Group´s share Parent company´s of ownership share of ownership Company City Country and votes% and votes% Destia Ltd, parent company Vantaa Finland Destia Eesti AS Estonia 100 100 Turgel Grupp AS Estonia 100 100 Destia Sverige AB Sweden 100 100 Destia Kalusto Oy Kuopio Finland 100 100 Destia International Oy Helsinki Finland 100 100 Finnroad Oy Helsinki Finland 100 100 Kaivujyrä Oy Kouvola Finland 100 100 During the financial year, a company owned by a member of the Board was paid consulting fee totalling EUR 2,5 thousand (2012: EUR 5,3 thousand). Management´s emplyee benefits EUR 1,000 2013 2012 Salaries and other short-term emplyee benefits 2,396 2,247 Total 2,396 2,247 Salaries and remuneration: President & CEO 679 415 Members of the Board of Directors 164 170 It has been agreed that the retirement age of the President & CEO is 63.
33 EVENTS AFTER THE END OF THE REPORTING PERIOD
Nothing to report.
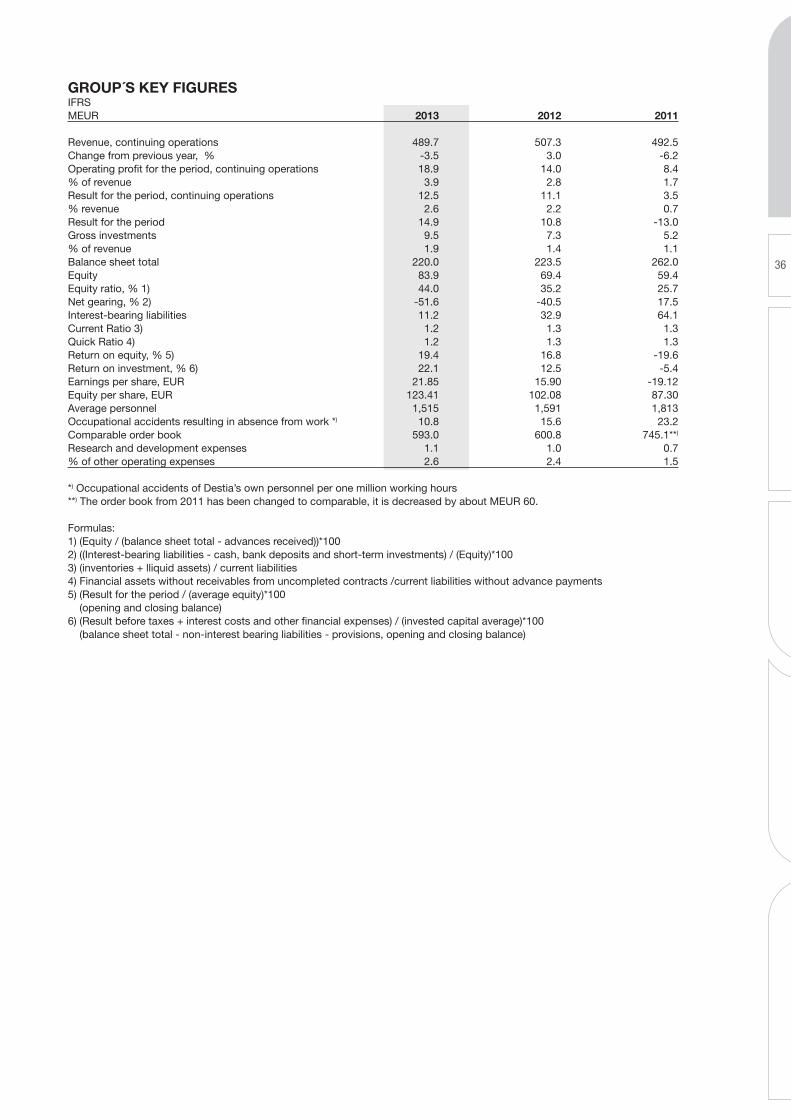
36
GROUP´S KEY FIGURES IFRS MEUR 2013 2012 2011
Revenue, continuing operations 489.7 507.3 492.5Change from previous year, % -3.5 3.0 -6.2Operating profit for the period, continuing operations 18.9 14.0 8.4% of revenue 3.9 2.8 1.7Result for the period, continuing operations 12.5 11.1 3.5% revenue 2.6 2.2 0.7Result for the period 14.9 10.8 -13.0Gross investments 9.5 7.3 5.2% of revenue 1.9 1.4 1.1Balance sheet total 220.0 223.5 262.0Equity 83.9 69.4 59.4Equity ratio, % 1) 44.0 35.2 25.7Net gearing, % 2) -51.6 -40.5 17.5Interest-bearing liabilities 11.2 32.9 64.1Current Ratio 3) 1.2 1.3 1.3Quick Ratio 4) 1.2 1.3 1.3Return on equity, % 5) 19.4 16.8 -19.6Return on investment, % 6) 22.1 12.5 -5.4Earnings per share, EUR 21.85 15.90 -19.12Equity per share, EUR 123.41 102.08 87.30Average personnel 1,515 1,591 1,813Occupational accidents resulting in absence from work *) 10.8 15.6 23.2Comparable order book 593.0 600.8 745.1**)
Research and development expenses 1.1 1.0 0.7% of other operating expenses 2.6 2.4 1.5
*) Occupational accidents of Destia’s own personnel per one million working hours **) The order book from 2011 has been changed to comparable, it is decreased by about MEUR 60.
Formulas:1) (Equity / (balance sheet total - advances received))*100 2) ((Interest-bearing liabilities - cash, bank deposits and short-term investments) / (Equity)*100 3) (inventories + lliquid assets) / current liabilities 4) Financial assets without receivables from uncompleted contracts /current liabilities without advance payments 5) (Result for the period / (average equity)*100
(opening and closing balance) 6) (Result before taxes + interest costs and other financial expenses) / (invested capital average)*100
(balance sheet total - non-interest bearing liabilities - provisions, opening and closing balance)
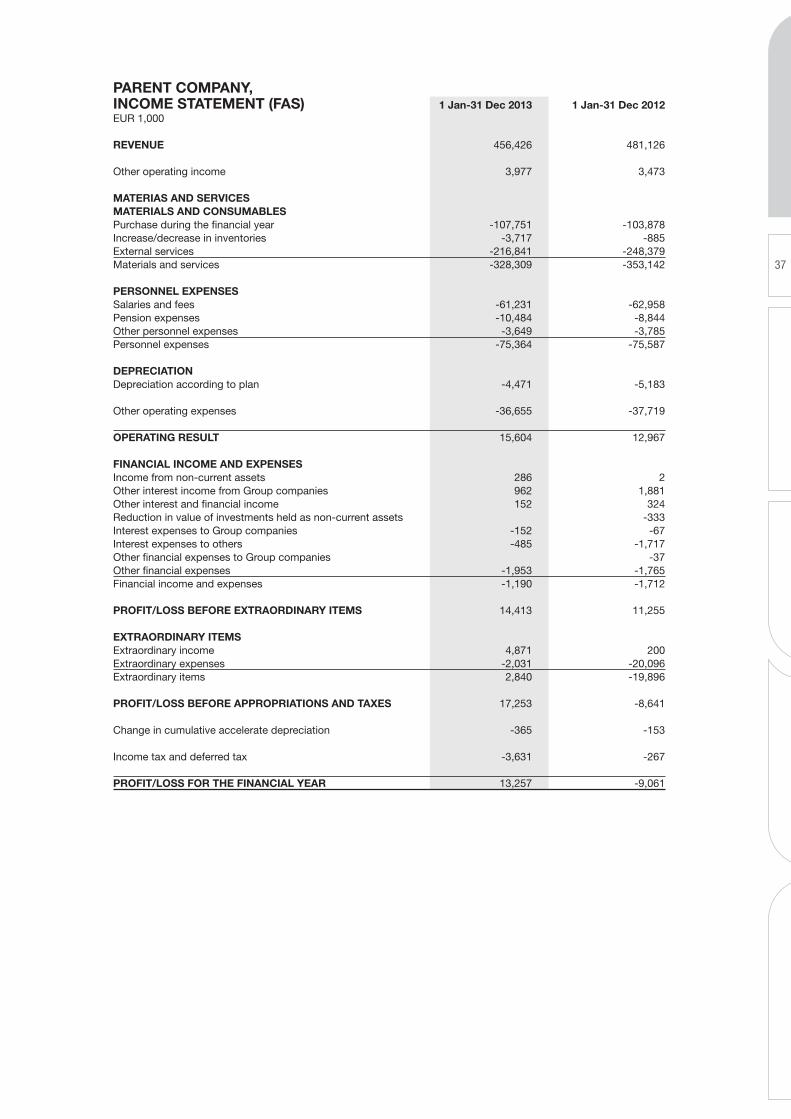
37
PARENT COMPANY, INCOME STATEMENT (FAS) 1 Jan-31 Dec 2013 1 Jan-31 Dec 2012EUR 1,000 REVENUE 456,426 481,126 Other operating income 3,977 3,473 MATERIAS AND SERVICES MATERIALS AND CONSUMABLES Purchase during the financial year -107,751 -103,878Increase/decrease in inventories -3,717 -885External services -216,841 -248,379Materials and services -328,309 -353,142 PERSONNEL ExPENSES Salaries and fees -61,231 -62,958Pension expenses -10,484 -8,844Other personnel expenses -3,649 -3,785Personnel expenses -75,364 -75,587 DEPRECIATION Depreciation according to plan -4,471 -5,183 Other operating expenses -36,655 -37,719 OPERATING RESULT 15,604 12,967 FINANCIAL INCOME AND ExPENSES Income from non-current assets 286 2Other interest income from Group companies 962 1,881Other interest and financial income 152 324Reduction in value of investments held as non-current assets -333Interest expenses to Group companies -152 -67Interest expenses to others -485 -1,717Other financial expenses to Group companies -37Other financial expenses -1,953 -1,765Financial income and expenses -1,190 -1,712 PROFIT/LOSS BEFORE ExTRAORDINARY ITEMS 14,413 11,255 ExTRAORDINARY ITEMS Extraordinary income 4,871 200Extraordinary expenses -2,031 -20,096Extraordinary items 2,840 -19,896 PROFIT/LOSS BEFORE APPROPRIATIONS AND TAxES 17,253 -8,641 Change in cumulative accelerate depreciation -365 -153 Income tax and deferred tax -3,631 -267 PROFIT/LOSS FOR THE FINANCIAL YEAR 13,257 -9,061
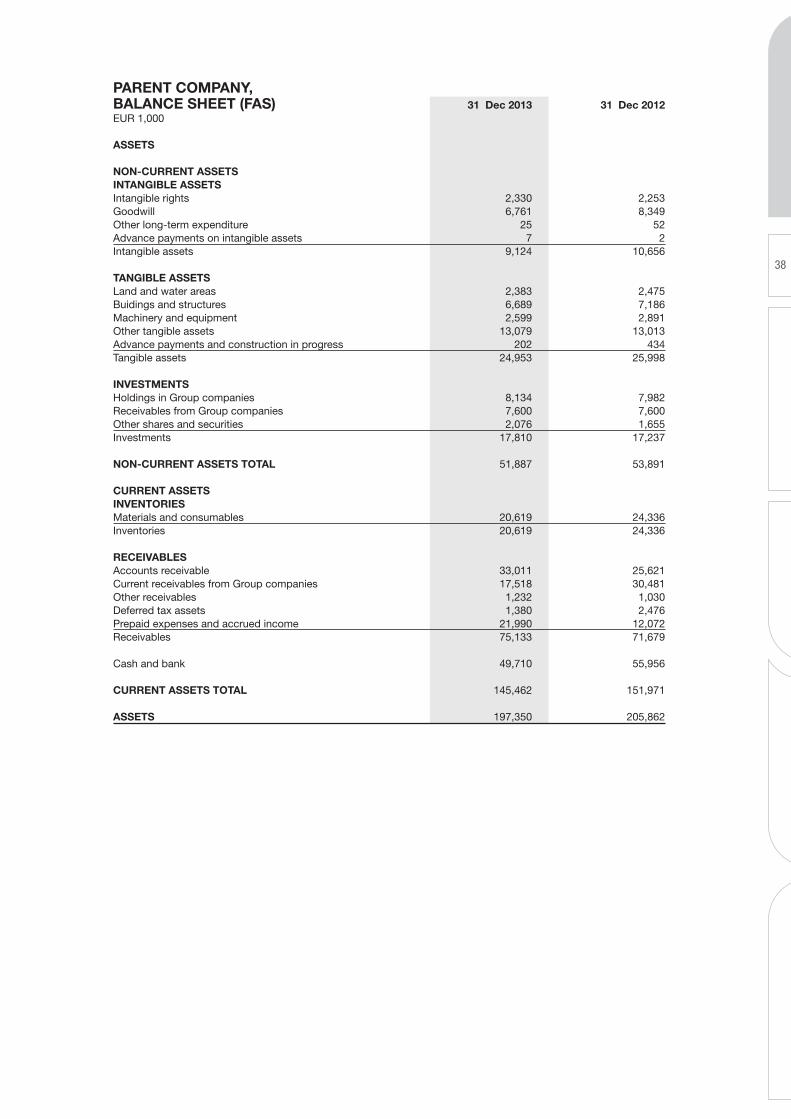
38
PARENT COMPANY, BALANCE SHEET (FAS) 31 Dec 2013 31 Dec 2012EUR 1,000 ASSETS NON-CURRENT ASSETS INTANGIBLE ASSETS Intangible rights 2,330 2,253Goodwill 6,761 8,349Other long-term expenditure 25 52Advance payments on intangible assets 7 2Intangible assets 9,124 10,656 TANGIBLE ASSETS Land and water areas 2,383 2,475Buidings and structures 6,689 7,186Machinery and equipment 2,599 2,891Other tangible assets 13,079 13,013Advance payments and construction in progress 202 434Tangible assets 24,953 25,998 INVESTMENTS Holdings in Group companies 8,134 7,982Receivables from Group companies 7,600 7,600Other shares and securities 2,076 1,655Investments 17,810 17,237 NON-CURRENT ASSETS TOTAL 51,887 53,891 CURRENT ASSETS INVENTORIES Materials and consumables 20,619 24,336Inventories 20,619 24,336 RECEIVABLES Accounts receivable 33,011 25,621Current receivables from Group companies 17,518 30,481Other receivables 1,232 1,030Deferred tax assets 1,380 2,476Prepaid expenses and accrued income 21,990 12,072Receivables 75,133 71,679 Cash and bank 49,710 55,956 CURRENT ASSETS TOTAL 145,462 151,971
ASSETS 197,350 205,862
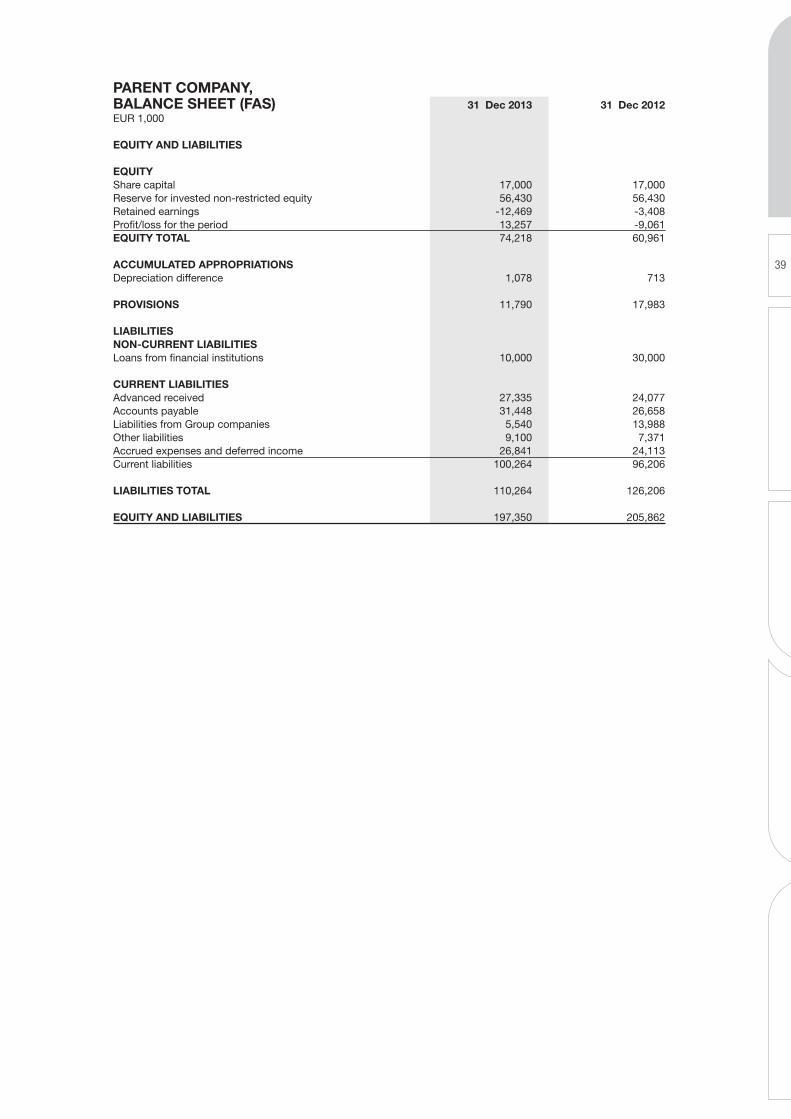
39
PARENT COMPANY, BALANCE SHEET (FAS) 31 Dec 2013 31 Dec 2012EUR 1,000 EQUITY AND LIABILITIES EQUITY Share capital 17,000 17,000Reserve for invested non-restricted equity 56,430 56,430Retained earnings -12,469 -3,408Profit/loss for the period 13,257 -9,061EQUITY TOTAL 74,218 60,961 ACCUMULATED APPROPRIATIONS Depreciation difference 1,078 713 PROVISIONS 11,790 17,983 LIABILITIES NON-CURRENT LIABILITIES Loans from financial institutions 10,000 30,000 CURRENT LIABILITIES Advanced received 27,335 24,077Accounts payable 31,448 26,658Liabilities from Group companies 5,540 13,988Other liabilities 9,100 7,371Accrued expenses and deferred income 26,841 24,113Current liabilities 100,264 96,206 LIABILITIES TOTAL 110,264 126,206
EQUITY AND LIABILITIES 197,350 205,862
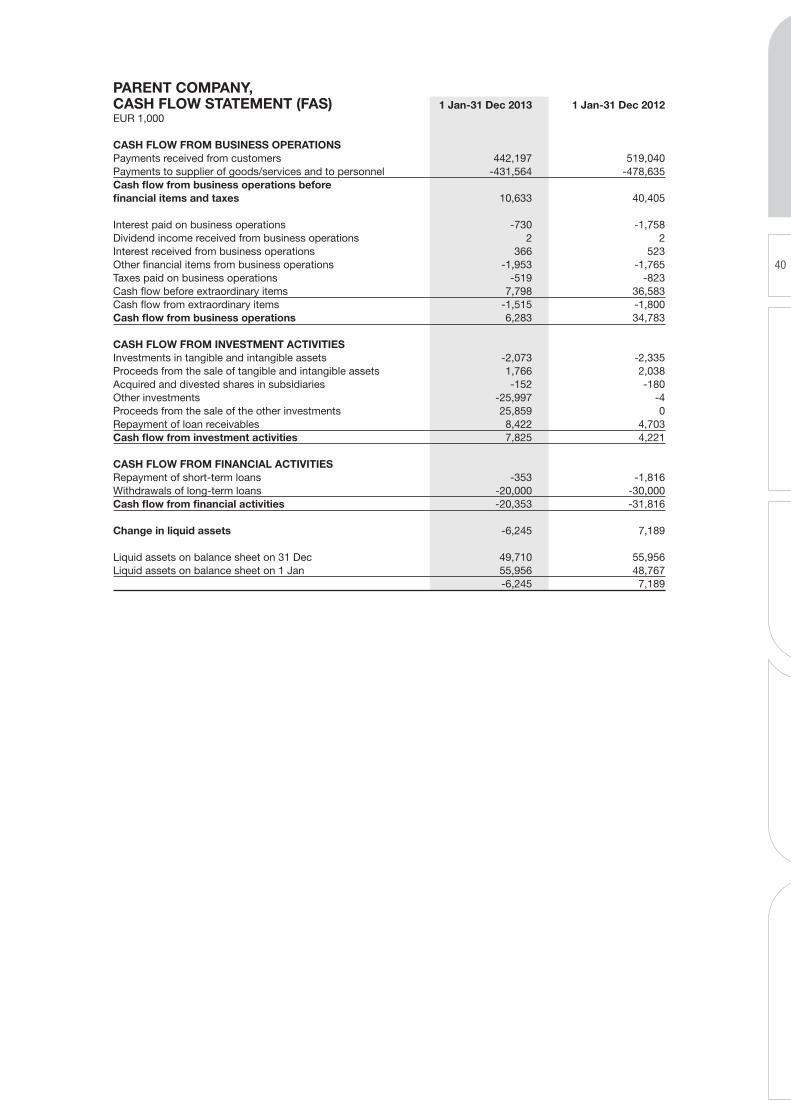
40
PARENT COMPANY, CASH FLOW STATEMENT (FAS) 1 Jan-31 Dec 2013 1 Jan-31 Dec 2012EUR 1,000 CASH FLOW FROM BUSINESS OPERATIONSPayments received from customers 442,197 519,040Payments to supplier of goods/services and to personnel -431,564 -478,635Cash flow from business operations before financial items and taxes 10,633 40,405 Interest paid on business operations -730 -1,758Dividend income received from business operations 2 2Interest received from business operations 366 523Other financial items from business operations -1,953 -1,765Taxes paid on business operations -519 -823Cash flow before extraordinary items 7,798 36,583Cash flow from extraordinary items -1,515 -1,800Cash flow from business operations 6,283 34,783 CASH FLOW FROM INVESTMENT ACTIVITIES Investments in tangible and intangible assets -2,073 -2,335Proceeds from the sale of tangible and intangible assets 1,766 2,038Acquired and divested shares in subsidiaries -152 -180Other investments -25,997 -4Proceeds from the sale of the other investments 25,859 0Repayment of loan receivables 8,422 4,703Cash flow from investment activities 7,825 4,221 CASH FLOW FROM FINANCIAL ACTIVITIES Repayment of short-term loans -353 -1,816Withdrawals of long-term loans -20,000 -30,000Cash flow from financial activities -20,353 -31,816 Change in liquid assets -6,245 7,189 Liquid assets on balance sheet on 31 Dec 49,710 55,956Liquid assets on balance sheet on 1 Jan 55,956 48,767 -6,245 7,189
41
Recognition of sales
Income from work that requires a long production period is recognised using the percentage of completion method. Projects are considered to require a long production period if they extend over two financial periods and have a value of more than EUR 50,000. The percentage of completion of long-term projects is determined by the actual accumulated variable costs in propor-tion to the estimated total variable costs of the project. The risks related to the completion of long-term projects are taken into account by applying the prudence principle to their recognition. Predicted losses are expensed in full.
Leasing
In the financial statements, leasing payments have been entered as annual expenses in line with the Finnish Accounting Act.
Pensions
Personnel pensions have been ensured by means of insurances at an external pension insurance company. Pension expenses have been entered as expenses during the year when they were incurred.
Research and development expenses
Research and development expenses have been entered as expense during the year when they were incurred.
Taxes
Income tax has been entered as required by the Finnish tax legislation.
NOTES TO INCOmE STATEmENT, PARENT COmPANy (FAS)
Comparability to the previous year
The operating result for the financial year was EUR 15.6 million (12.9 million), 3.4% (2.7%) of revenue. The Operating result for the financial year includes EUR 3.9 million (3.4 million) of other operating income, which for the most part are made up of rental income and capital gains on the sale of non-current assets. A to-tal of EUR 0.1 million (-0.3 million) of credit losses were recorded for the financial year. Group-internal one-time expenses were not recorded in financing costs for the reporting year (0.3 million). Additional information on extraordinary income and expenses is provided in next page.
NOTES TO FINANCIAl STATEmENTS, PARENT COmPANy (FAS)
Accounting principles
Destia Ltd’s financial statements for the financial year 1 Jan-uary−31 December 2013 have been prepared in accordance with the Finnish Accounting Act (FAS). The Group has adopted the reporting principles of the International Financial Reporting Standards (IFRS) on 31 December 2011.
Foreign-currency items
Foreign-currency receivables and liabilities have been translated into euro at the average rate of the closing date. The exchange differences generated in valuing receivables and liabilities have been entered in the income statement in the profits and expens-es corresponding to the balance sheet item in question. The realised and unrealised profits and losses of derivatives used to hedge against the foreign exchange rate risk of foreign-currency receivables and liabilities have been entered in the income state-ment in the profits and expenses corresponding to the balance sheet item in question.
Valuing fixed assets
Fixed assets have been valued at acquisition cost. The variable expenses from acquisition and manufacturing have been includ-ed in the acquisition cost. The planned depreciation calculated based on the economic lifetime has been deducted from the acquisition cost. Depreciation for soils in other tangible goods has been calculated as use-based depreciation.
Valuing current assets
Inventories have been valued at acquisition price, or at transfer price or replacement price lower than the acquisition price. The variable expenses from acquisition and manufacturing have been included in the acquisition cost.
Financial assets
Financial assets have been valued at acquisition cost, or at a likely transfer price which is lower than the acquisition cost.
Derivative instruments
To hedge the receivables and liabilities in the balance sheet, the fair value of derivative contracts has been entered in the balance sheet and the changes in fair value in the income statement. The fair value of derivative contracts prepared to hedge cash flows to be generated in future financial years has been processed as an off-balance-sheet liability.
Provisions
During the financial year, compulsory provisions have been released in the amount of the sum incurred by meeting all obli-gations or in the amount of the change foreseen in the provision. Warranty provisions for work concluded during the financial year have been increased, and the amount of the landscaping provi-sion of soil areas has been revised to meet future obligations.
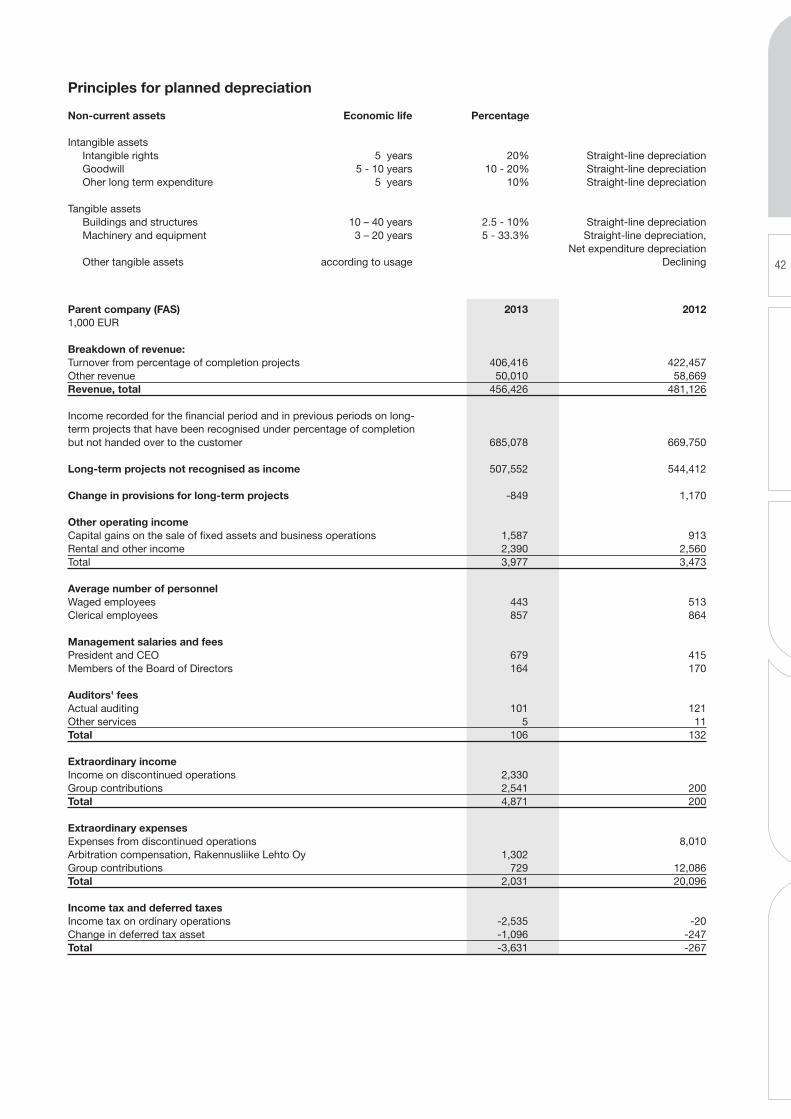
42
Principles for planned depreciation
Non-current assets Economic life Percentage Intangible assets Intangible rights 5 years 20% Straight-line depreciation Goodwill 5 - 10 years 10 - 20% Straight-line depreciation Oher long term expenditure 5 years 10% Straight-line depreciation Tangible assets Buildings and structures 10 – 40 years 2.5 - 10% Straight-line depreciation Machinery and equipment 3 – 20 years 5 - 33.3% Straight-line depreciation, Net expenditure depreciation Other tangible assets according to usage Declining
Parent company (FAS) 2013 20121,000 EUR
Breakdown of revenue: Turnover from percentage of completion projects 406,416 422,457Other revenue 50,010 58,669Revenue, total 456,426 481,126 Income recorded for the financial period and in previous periods on long- term projects that have been recognised under percentage of completion but not handed over to the customer 685,078 669,750 Long-term projects not recognised as income 507,552 544,412 Change in provisions for long-term projects -849 1,170 Other operating income Capital gains on the sale of fixed assets and business operations 1,587 913Rental and other income 2,390 2,560Total 3,977 3,473 Average number of personnel Waged employees 443 513Clerical employees 857 864 Management salaries and fees President and CEO 679 415Members of the Board of Directors 164 170 Auditors' fees Actual auditing 101 121Other services 5 11Total 106 132 Extraordinary income Income on discontinued operations 2,330 Group contributions 2,541 200Total 4,871 200 Extraordinary expenses Expenses from discontinued operations 8,010Arbitration compensation, Rakennusliike Lehto Oy 1,302 Group contributions 729 12,086Total 2,031 20,096 Income tax and deferred taxes Income tax on ordinary operations -2,535 -20Change in deferred tax asset -1,096 -247Total -3,631 -267
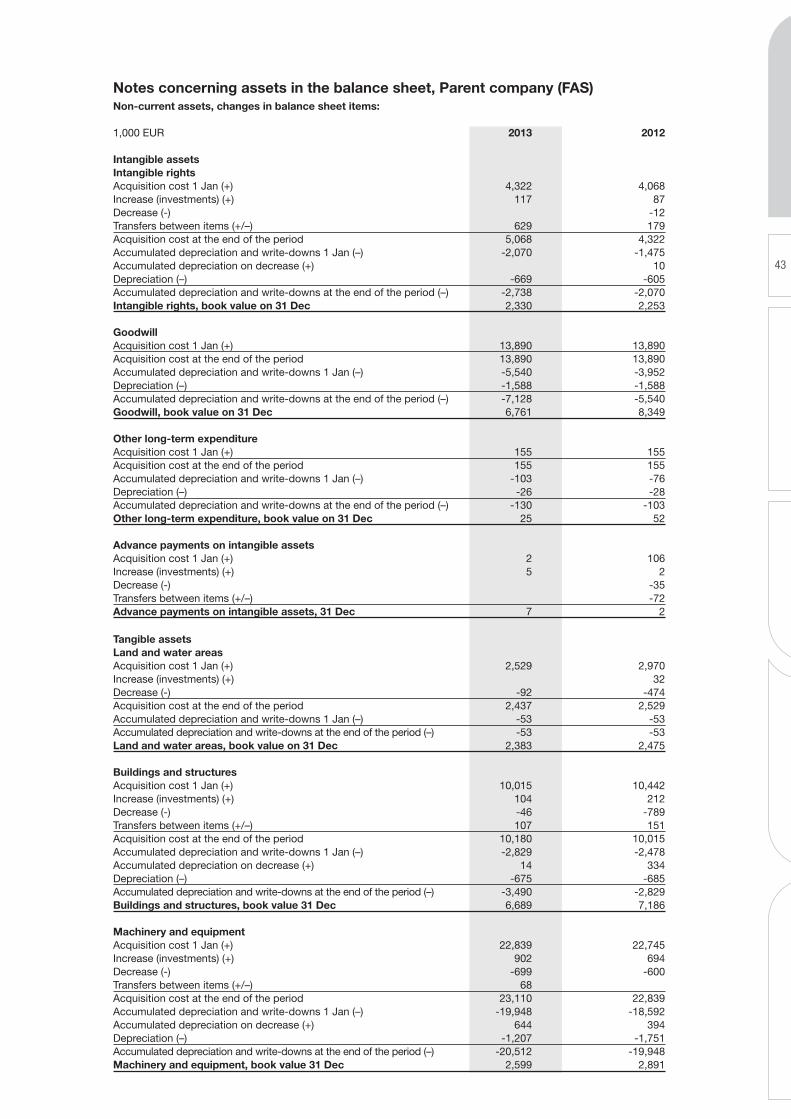
43
Notes concerning assets in the balance sheet, Parent company (FAS)Non-current assets, changes in balance sheet items: 1,000 EUR 2013 2012 Intangible assets Intangible rights Acquisition cost 1 Jan (+) 4,322 4,068Increase (investments) (+) 117 87Decrease (-) -12Transfers between items (+/–) 629 179Acquisition cost at the end of the period 5,068 4,322Accumulated depreciation and write-downs 1 Jan (–) -2,070 -1,475Accumulated depreciation on decrease (+) 10Depreciation (–) -669 -605Accumulated depreciation and write-downs at the end of the period (–) -2,738 -2,070Intangible rights, book value on 31 Dec 2,330 2,253 Goodwill Acquisition cost 1 Jan (+) 13,890 13,890Acquisition cost at the end of the period 13,890 13,890Accumulated depreciation and write-downs 1 Jan (–) -5,540 -3,952Depreciation (–) -1,588 -1,588Accumulated depreciation and write-downs at the end of the period (–) -7,128 -5,540Goodwill, book value on 31 Dec 6,761 8,349 Other long-term expenditure Acquisition cost 1 Jan (+) 155 155Acquisition cost at the end of the period 155 155Accumulated depreciation and write-downs 1 Jan (–) -103 -76Depreciation (–) -26 -28Accumulated depreciation and write-downs at the end of the period (–) -130 -103Other long-term expenditure, book value on 31 Dec 25 52 Advance payments on intangible assets Acquisition cost 1 Jan (+) 2 106Increase (investments) (+) 5 2Decrease (-) -35Transfers between items (+/–) -72Advance payments on intangible assets, 31 Dec 7 2
Tangible assets Land and water areas Acquisition cost 1 Jan (+) 2,529 2,970Increase (investments) (+) 32Decrease (-) -92 -474Acquisition cost at the end of the period 2,437 2,529Accumulated depreciation and write-downs 1 Jan (–) -53 -53Accumulated depreciation and write-downs at the end of the period (–) -53 -53Land and water areas, book value on 31 Dec 2,383 2,475 Buildings and structures Acquisition cost 1 Jan (+) 10,015 10,442Increase (investments) (+) 104 212Decrease (-) -46 -789Transfers between items (+/–) 107 151Acquisition cost at the end of the period 10,180 10,015Accumulated depreciation and write-downs 1 Jan (–) -2,829 -2,478Accumulated depreciation on decrease (+) 14 334Depreciation (–) -675 -685Accumulated depreciation and write-downs at the end of the period (–) -3,490 -2,829Buildings and structures, book value 31 Dec 6,689 7,186 Machinery and equipment Acquisition cost 1 Jan (+) 22,839 22,745Increase (investments) (+) 902 694Decrease (-) -699 -600Transfers between items (+/–) 68 Acquisition cost at the end of the period 23,110 22,839Accumulated depreciation and write-downs 1 Jan (–) -19,948 -18,592Accumulated depreciation on decrease (+) 644 394Depreciation (–) -1,207 -1,751Accumulated depreciation and write-downs at the end of the period (–) -20,512 -19,948Machinery and equipment, book value 31 Dec 2,599 2,891
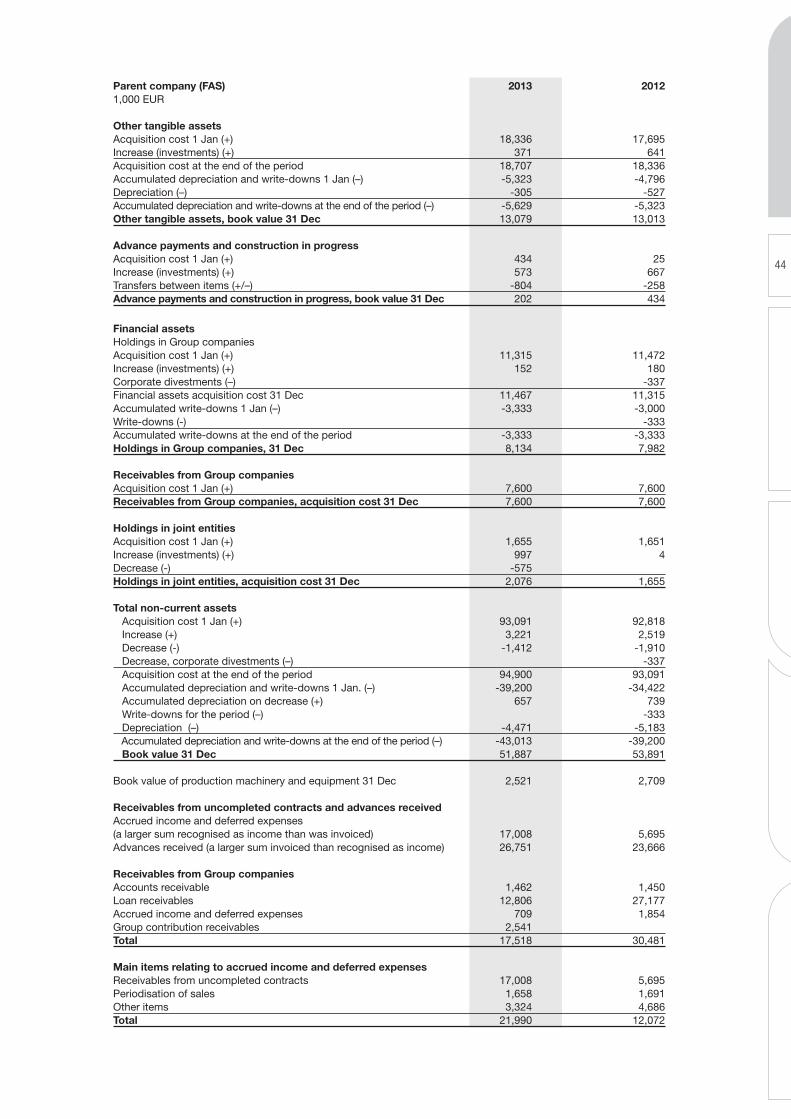
44
Parent company (FAS) 2013 20121,000 EUR
Other tangible assets Acquisition cost 1 Jan (+) 18,336 17,695Increase (investments) (+) 371 641Acquisition cost at the end of the period 18,707 18,336Accumulated depreciation and write-downs 1 Jan (–) -5,323 -4,796Depreciation (–) -305 -527Accumulated depreciation and write-downs at the end of the period (–) -5,629 -5,323Other tangible assets, book value 31 Dec 13,079 13,013 Advance payments and construction in progress Acquisition cost 1 Jan (+) 434 25Increase (investments) (+) 573 667Transfers between items (+/–) -804 -258Advance payments and construction in progress, book value 31 Dec 202 434
Financial assets Holdings in Group companies Acquisition cost 1 Jan (+) 11,315 11,472Increase (investments) (+) 152 180Corporate divestments (–) -337Financial assets acquisition cost 31 Dec 11,467 11,315Accumulated write-downs 1 Jan (–) -3,333 -3,000Write-downs (-) -333Accumulated write-downs at the end of the period -3,333 -3,333Holdings in Group companies, 31 Dec 8,134 7,982 Receivables from Group companies Acquisition cost 1 Jan (+) 7,600 7,600Receivables from Group companies, acquisition cost 31 Dec 7,600 7,600 Holdings in joint entities Acquisition cost 1 Jan (+) 1,655 1,651Increase (investments) (+) 997 4Decrease (-) -575 Holdings in joint entities, acquisition cost 31 Dec 2,076 1,655 Total non-current assets Acquisition cost 1 Jan (+) 93,091 92,818 Increase (+) 3,221 2,519 Decrease (-) -1,412 -1,910 Decrease, corporate divestments (–) -337 Acquisition cost at the end of the period 94,900 93,091 Accumulated depreciation and write-downs 1 Jan. (–) -39,200 -34,422 Accumulated depreciation on decrease (+) 657 739 Write-downs for the period (–) -333 Depreciation (–) -4,471 -5,183 Accumulated depreciation and write-downs at the end of the period (–) -43,013 -39,200 Book value 31 Dec 51,887 53,891 Book value of production machinery and equipment 31 Dec 2,521 2,709 Receivables from uncompleted contracts and advances received Accrued income and deferred expenses (a larger sum recognised as income than was invoiced) 17,008 5,695Advances received (a larger sum invoiced than recognised as income) 26,751 23,666 Receivables from Group companies Accounts receivable 1,462 1,450Loan receivables 12,806 27,177Accrued income and deferred expenses 709 1,854Group contribution receivables 2,541 Total 17,518 30,481 Main items relating to accrued income and deferred expenses Receivables from uncompleted contracts 17,008 5,695Periodisation of sales 1,658 1,691Other items 3,324 4,686Total 21,990 12,072
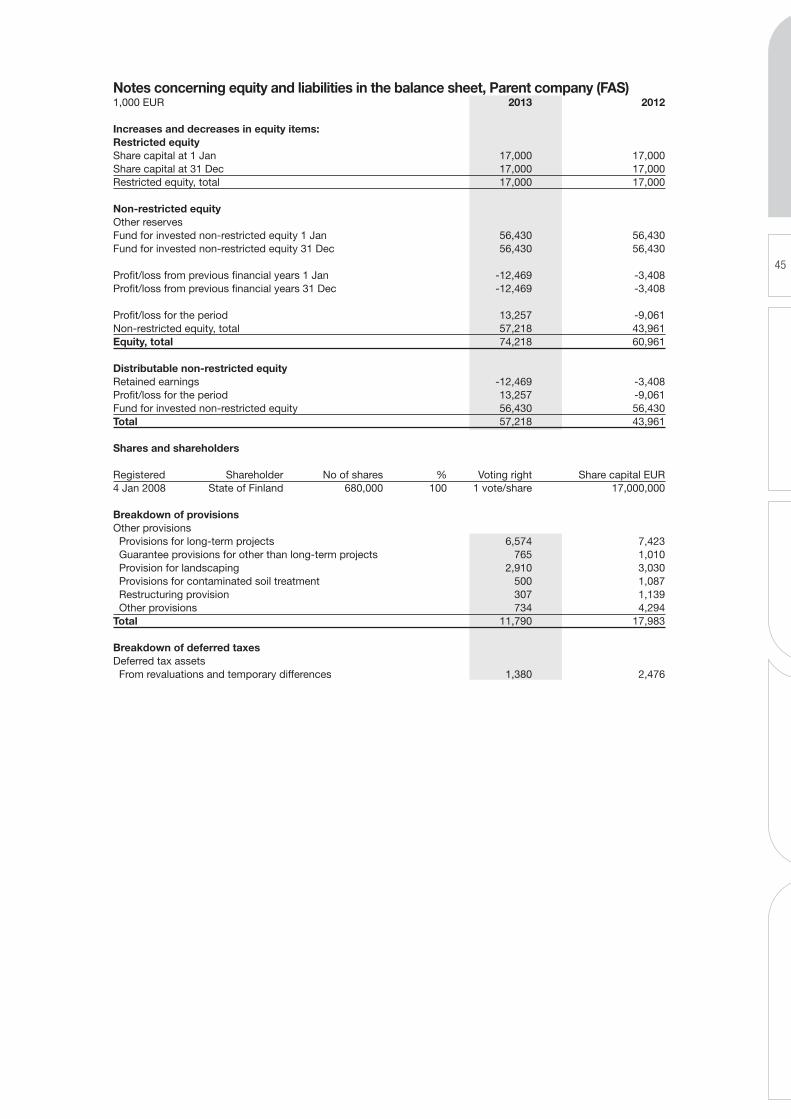
45
Notes concerning equity and liabilities in the balance sheet, Parent company (FAS)1,000 EUR 2013 2012 Increases and decreases in equity items: Restricted equity Share capital at 1 Jan 17,000 17,000Share capital at 31 Dec 17,000 17,000Restricted equity, total 17,000 17,000 Non-restricted equity Other reserves Fund for invested non-restricted equity 1 Jan 56,430 56,430Fund for invested non-restricted equity 31 Dec 56,430 56,430 Profit/loss from previous financial years 1 Jan -12,469 -3,408Profit/loss from previous financial years 31 Dec -12,469 -3,408 Profit/loss for the period 13,257 -9,061Non-restricted equity, total 57,218 43,961Equity, total 74,218 60,961 Distributable non-restricted equity Retained earnings -12,469 -3,408Profit/loss for the period 13,257 -9,061Fund for invested non-restricted equity 56,430 56,430Total 57,218 43,961 Shares and shareholders
Registered Shareholder No of shares % Voting right Share capital EUR4 Jan 2008 State of Finland 680,000 100 1 vote/share 17,000,000 Breakdown of provisions Other provisions Provisions for long-term projects 6,574 7,423 Guarantee provisions for other than long-term projects 765 1,010 Provision for landscaping 2,910 3,030 Provisions for contaminated soil treatment 500 1,087 Restructuring provision 307 1,139 Other provisions 734 4,294Total 11,790 17,983 Breakdown of deferred taxes Deferred tax assets From revaluations and temporary differences 1,380 2,476
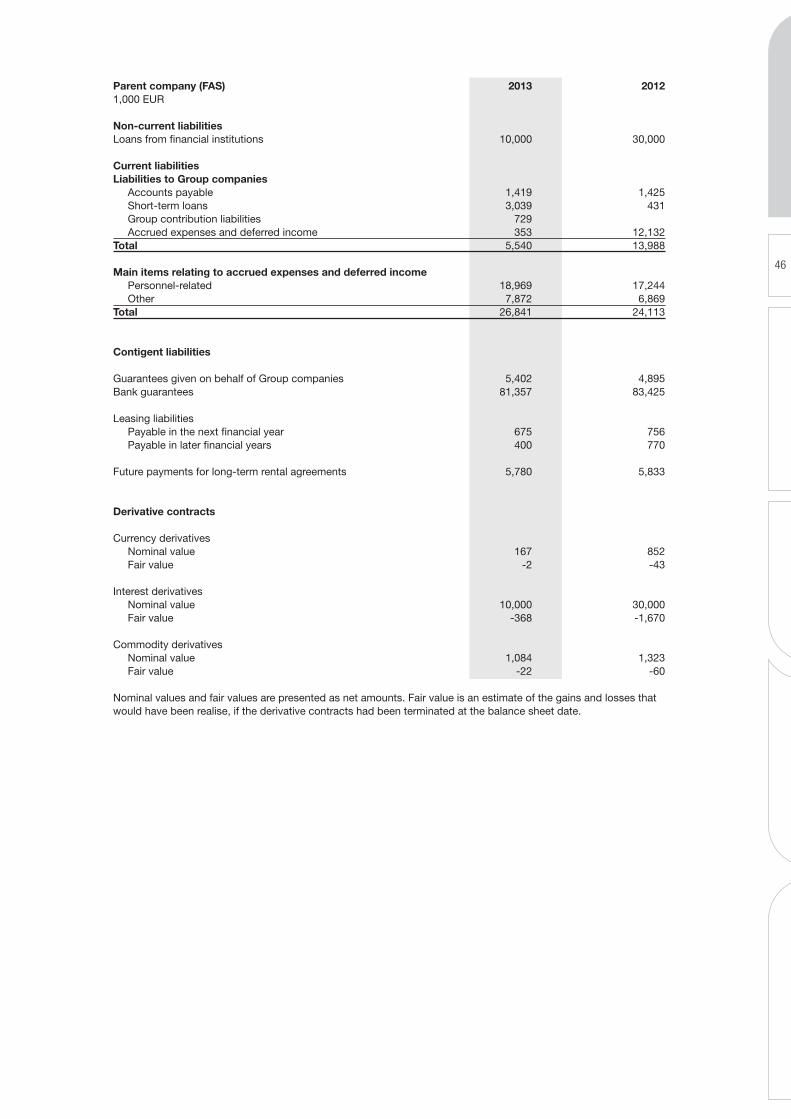
46
Parent company (FAS) 2013 20121,000 EUR
Non-current liabilities Loans from financial institutions 10,000 30,000
Current liabilities Liabilities to Group companies Accounts payable 1,419 1,425 Short-term loans 3,039 431 Group contribution liabilities 729 Accrued expenses and deferred income 353 12,132Total 5,540 13,988 Main items relating to accrued expenses and deferred income Personnel-related 18,969 17,244 Other 7,872 6,869Total 26,841 24,113 Contigent liabilities Guarantees given on behalf of Group companies 5,402 4,895Bank guarantees 81,357 83,425 Leasing liabilities Payable in the next financial year 675 756 Payable in later financial years 400 770 Future payments for long-term rental agreements 5,780 5,833 Derivative contracts Currency derivatives Nominal value 167 852 Fair value -2 -43 Interest derivatives Nominal value 10,000 30,000 Fair value -368 -1,670 Commodity derivatives Nominal value 1,084 1,323 Fair value -22 -60 Nominal values and fair values are presented as net amounts. Fair value is an estimate of the gains and losses that would have been realise, if the derivative contracts had been terminated at the balance sheet date.
47
Proposal by the Board on the use of distributable assets
The profit of the parent company in the accounting period was EUR13,256,966.26, which is proposed to be recorded on the profits and losses account. Destia Ltd’s distributable assets total EUR57,217,630.87, including the invested unrestricted equity fund of EUR56,430,070.64.
Destia Ltd’s Board of Directors proposes to the Annual General meeting that no dividends and no repayment of capital be paid for the accounting period ending 31 December 2013.
Vantaa, 12 February 2014
Karri Kaitue Kalevi AlestaloMembers of the Board and Chairman Members of the Board
Elina Engman Solveig Törnroos-HuhtamäkiMembers of the Board Members of the Board
Matti Mantere Hannu LeinonenMembers of the Board President and CEO
The Auditor’s Note
Our auditor’s report has been issued today.
Vantaa, 12 February 2014
Deloitte & Touche OyAuthorized Public Audit Firm.
Aleksi MartamoAuthorized Public Accountant
48
AUDITOR 'S R E PO RT
To the Annual General Meeting of Destia Oy
We have audited the accounting records, the financial state-ments, the report of the Board of Directors, and the adminis-tration of Destia Oy for the year ended 31 December, 2013. The financial statements comprise the consolidated balance sheet, income statement, statement of comprehensive income, statement of changes in equity and statement of cash flows, and notes to the consolidated financial statements, as well as the parent company’s balance sheet, income statement, cash flow statement and notes to the financial statements.
Responsibility of the Board of Directors and the Managing Director
The Board of Directors and the Managing Director are respon-sible for the preparation of consolidated financial statements that give a true and fair view in accordance with International Financial Reporting Standards (IFRS) as adopted by the EU, as well as for the preparation of financial statements and the report of the Board of Directors that give a true and fair view in accord-ance with the laws and regulations governing the preparation of the financial statements and the report of the Board of Directors in Finland. The Board of Directors is responsible for the appro-priate arrangement of the control of the company’s accounts and finances, and the Managing Director shall see to it that the accounts of the company are in compliance with the law and that its financial affairs have been arranged in a reliable manner.
Auditor’s responsibility
Our responsibility is to express an opinion on the financial statements, on the consolidated financial statements and on the report of the Board of Directors based on our audit. The Auditing Act requires that we comply with the requirements of profession-al ethics. We conducted our audit in accordance with good au-diting practice in Finland. Good auditing practice requires that we plan and perform the audit to obtain reasonable assurance about whether the financial statements and the report of the Board of Directors are free from material misstatement, and whether the members of the Board of Directors of the parent company or the Managing Director are guilty of an act or negligence which may result in liability in damages towards the company or have violated the Limited Liability Companies Act or the articles of association of the company.
An audit involves performing procedures to obtain audit evidence about the amounts and disclosures in the financial statements and the report of the Board of Directors. The procedures selected depend on the auditor’s judgment, including the assessment of
the risks of material misstatement, whether due to fraud or error. In making those risk assessments, the auditor considers internal control relevant to the entity’s preparation of financial statements and report of the Board of Directors that give a true and fair view in order to design audit procedures that are appropriate in the cir-cumstances, but not for the purpose of expressing an opinion on the effectiveness of the company’s internal control. An audit also includes evaluating the appropriateness of accounting policies used and the reasonableness of accounting estimates made by management, as well as evaluating the overall presentation of the financial statements and the report of the Board of Directors.
We believe that the audit evidence we have obtained is sufficient and appropriate to provide a basis for our audit opinion.
Opinion on the consolidated financial statements
In our opinion, the consolidated financial statements give a true and fair view of the financial position, financial performance, and cash flows of the group in accordance with International Financial Reporting Standards (IFRS) as adopted by the EU.
Opinion on the company’s financial statements and the report of the Board of Directors
In our opinion, the financial statements and the report of the Board of Directors give a true and fair view of both the consol-idated and the parent company´s financial performance and financial position in accordance with the laws and regulations governing the preparation of the financial statements and the report of the Board of Directors in Finland. The information in the report of the Board of Directors is consistent with the information in the financial statements.
Other opinions
We support that the financial statements should be adopted. The proposal by the Board of Directors regarding the treatment of distributable funds is in compliance with the Limited Liability Companies Act. We support that the Board of Directors of the parent company and the Managing Director should be dis-charged from liability for the financial period audited by us.
Vantaa, 12. February. 2014
Deloitte & Touche OyAuthorized Public Audit Firm
Aleksi MartamoAuthorized Public Accountant
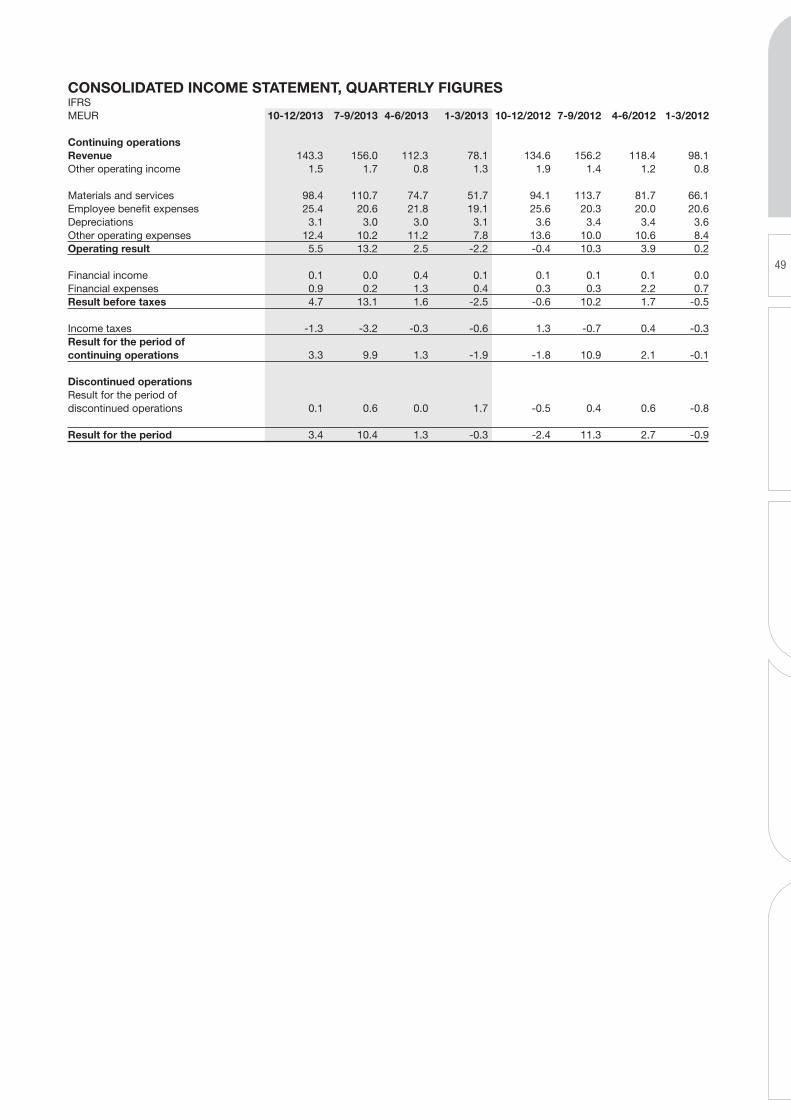
49
CONSOLIDATED INCOME STATEMENT, QUARTERLY FIGURES IFRS MEUR 10-12/2013 7-9/2013 4-6/2013 1-3/2013 10-12/2012 7-9/2012 4-6/2012 1-3/2012 Continuing operations Revenue 143.3 156.0 112.3 78.1 134.6 156.2 118.4 98.1Other operating income 1.5 1.7 0.8 1.3 1.9 1.4 1.2 0.8 Materials and services 98.4 110.7 74.7 51.7 94.1 113.7 81.7 66.1Employee benefit expenses 25.4 20.6 21.8 19.1 25.6 20.3 20.0 20.6Depreciations 3.1 3.0 3.0 3.1 3.6 3.4 3.4 3.6Other operating expenses 12.4 10.2 11.2 7.8 13.6 10.0 10.6 8.4Operating result 5.5 13.2 2.5 -2.2 -0.4 10.3 3.9 0.2 Financial income 0.1 0.0 0.4 0.1 0.1 0.1 0.1 0.0Financial expenses 0.9 0.2 1.3 0.4 0.3 0.3 2.2 0.7Result before taxes 4.7 13.1 1.6 -2.5 -0.6 10.2 1.7 -0.5 Income taxes -1.3 -3.2 -0.3 -0.6 1.3 -0.7 0.4 -0.3Result for the period of continuing operations 3.3 9.9 1.3 -1.9 -1.8 10.9 2.1 -0.1 Discontinued operations Result for the period of discontinued operations 0.1 0.6 0.0 1.7 -0.5 0.4 0.6 -0.8 Result for the period 3.4 10.4 1.3 -0.3 -2.4 11.3 2.7 -0.9
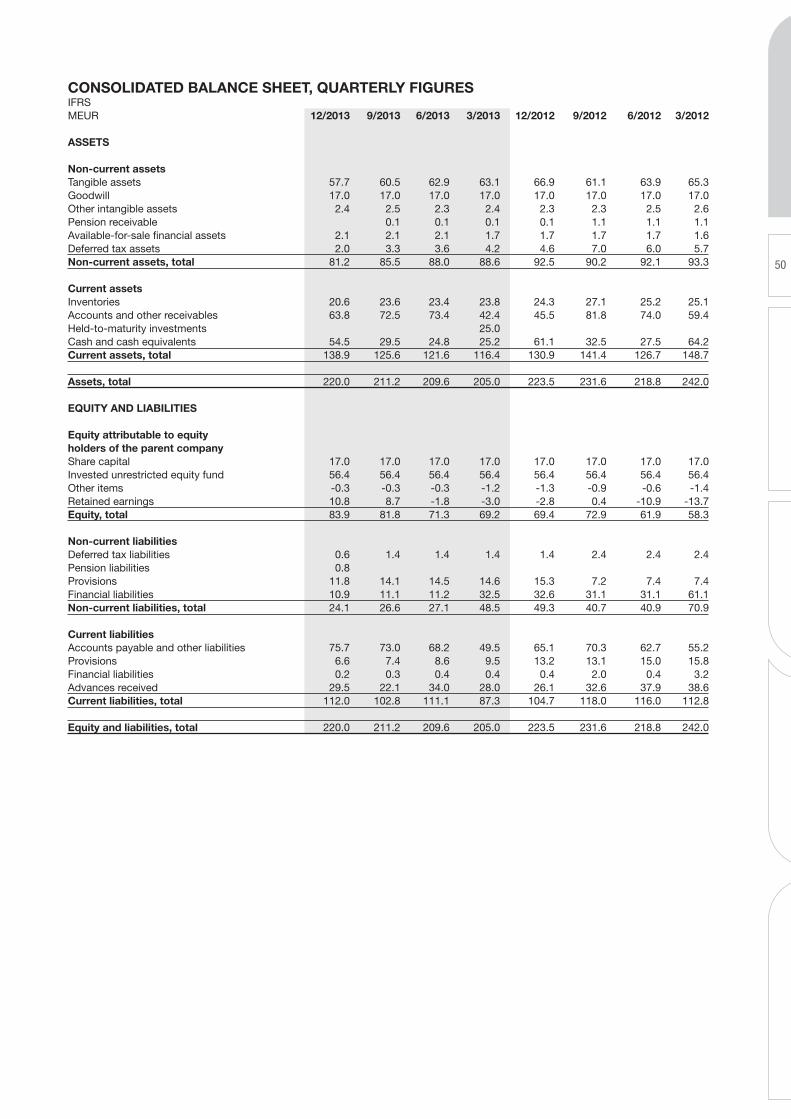
50
CONSOLIDATED BALANCE SHEET, QUARTERLY FIGURES IFRS MEUR 12/2013 9/2013 6/2013 3/2013 12/2012 9/2012 6/2012 3/2012 ASSETS Non-current assets Tangible assets 57.7 60.5 62.9 63.1 66.9 61.1 63.9 65.3Goodwill 17.0 17.0 17.0 17.0 17.0 17.0 17.0 17.0Other intangible assets 2.4 2.5 2.3 2.4 2.3 2.3 2.5 2.6Pension receivable 0.1 0.1 0.1 0.1 1.1 1.1 1.1Available-for-sale financial assets 2.1 2.1 2.1 1.7 1.7 1.7 1.7 1.6Deferred tax assets 2.0 3.3 3.6 4.2 4.6 7.0 6.0 5.7Non-current assets, total 81.2 85.5 88.0 88.6 92.5 90.2 92.1 93.3 Current assets Inventories 20.6 23.6 23.4 23.8 24.3 27.1 25.2 25.1Accounts and other receivables 63.8 72.5 73.4 42.4 45.5 81.8 74.0 59.4Held-to-maturity investments 25.0 Cash and cash equivalents 54.5 29.5 24.8 25.2 61.1 32.5 27.5 64.2Current assets, total 138.9 125.6 121.6 116.4 130.9 141.4 126.7 148.7 Assets, total 220.0 211.2 209.6 205.0 223.5 231.6 218.8 242.0 EQUITY AND LIABILITIES Equity attributable to equity holders of the parent company Share capital 17.0 17.0 17.0 17.0 17.0 17.0 17.0 17.0Invested unrestricted equity fund 56.4 56.4 56.4 56.4 56.4 56.4 56.4 56.4Other items -0.3 -0.3 -0.3 -1.2 -1.3 -0.9 -0.6 -1.4Retained earnings 10.8 8.7 -1.8 -3.0 -2.8 0.4 -10.9 -13.7Equity, total 83.9 81.8 71.3 69.2 69.4 72.9 61.9 58.3 Non-current liabilities Deferred tax liabilities 0.6 1.4 1.4 1.4 1.4 2.4 2.4 2.4Pension liabilities 0.8 Provisions 11.8 14.1 14.5 14.6 15.3 7.2 7.4 7.4Financial liabilities 10.9 11.1 11.2 32.5 32.6 31.1 31.1 61.1Non-current liabilities, total 24.1 26.6 27.1 48.5 49.3 40.7 40.9 70.9 Current liabilities Accounts payable and other liabilities 75.7 73.0 68.2 49.5 65.1 70.3 62.7 55.2Provisions 6.6 7.4 8.6 9.5 13.2 13.1 15.0 15.8Financial liabilities 0.2 0.3 0.4 0.4 0.4 2.0 0.4 3.2Advances received 29.5 22.1 34.0 28.0 26.1 32.6 37.9 38.6Current liabilities, total 112.0 102.8 111.1 87.3 104.7 118.0 116.0 112.8 Equity and liabilities, total 220.0 211.2 209.6 205.0 223.5 231.6 218.8 242.0
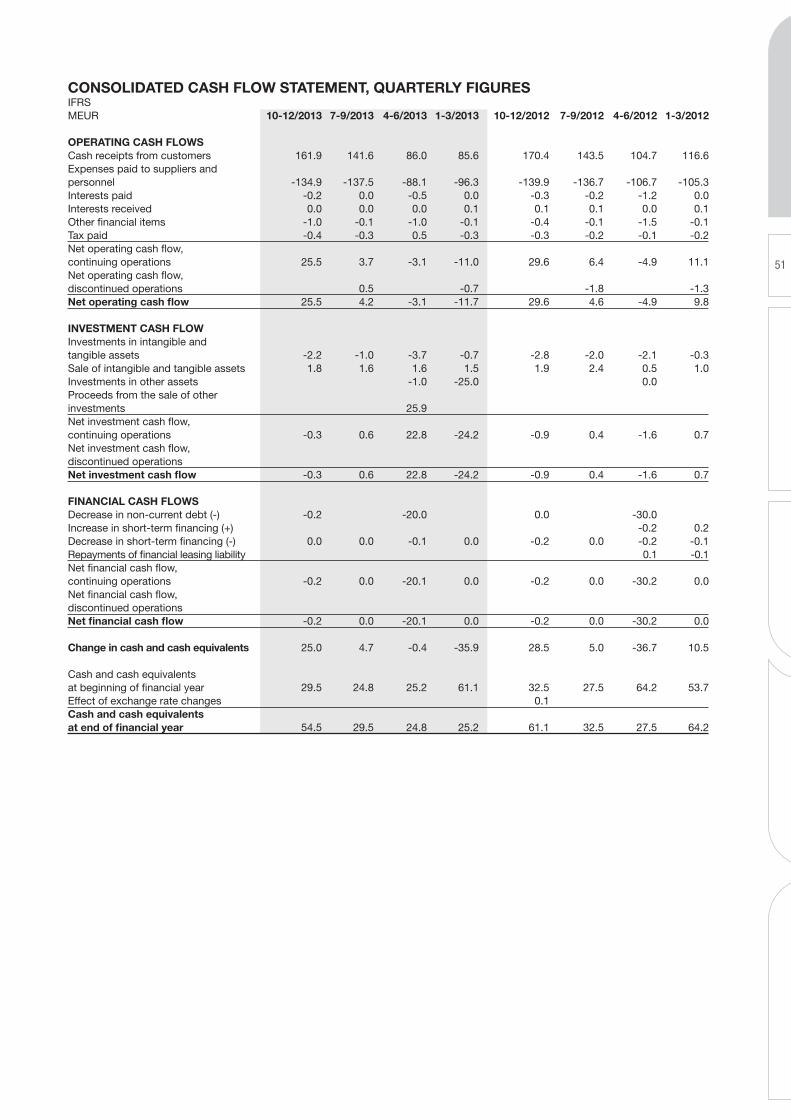
51
CONSOLIDATED CASH FLOW STATEMENT, QUARTERLY FIGURES IFRS MEUR 10-12/2013 7-9/2013 4-6/2013 1-3/2013 10-12/2012 7-9/2012 4-6/2012 1-3/2012 OPERATING CASH FLOWS Cash receipts from customers 161.9 141.6 86.0 85.6 170.4 143.5 104.7 116.6Expenses paid to suppliers and personnel -134.9 -137.5 -88.1 -96.3 -139.9 -136.7 -106.7 -105.3Interests paid -0.2 0.0 -0.5 0.0 -0.3 -0.2 -1.2 0.0Interests received 0.0 0.0 0.0 0.1 0.1 0.1 0.0 0.1Other financial items -1.0 -0.1 -1.0 -0.1 -0.4 -0.1 -1.5 -0.1Tax paid -0.4 -0.3 0.5 -0.3 -0.3 -0.2 -0.1 -0.2Net operating cash flow, continuing operations 25.5 3.7 -3.1 -11.0 29.6 6.4 -4.9 11.1Net operating cash flow, discontinued operations 0.5 -0.7 -1.8 -1.3Net operating cash flow 25.5 4.2 -3.1 -11.7 29.6 4.6 -4.9 9.8 INVESTMENT CASH FLOW Investments in intangible and tangible assets -2.2 -1.0 -3.7 -0.7 -2.8 -2.0 -2.1 -0.3Sale of intangible and tangible assets 1.8 1.6 1.6 1.5 1.9 2.4 0.5 1.0Investments in other assets -1.0 -25.0 0.0 Proceeds from the sale of other investments 25.9 Net investment cash flow, continuing operations -0.3 0.6 22.8 -24.2 -0.9 0.4 -1.6 0.7Net investment cash flow, discontinued operations Net investment cash flow -0.3 0.6 22.8 -24.2 -0.9 0.4 -1.6 0.7 FINANCIAL CASH FLOWS Decrease in non-current debt (-) -0.2 -20.0 0.0 -30.0 Increase in short-term financing (+) -0.2 0.2Decrease in short-term financing (-) 0.0 0.0 -0.1 0.0 -0.2 0.0 -0.2 -0.1Repayments of financial leasing liability 0.1 -0.1Net financial cash flow, continuing operations -0.2 0.0 -20.1 0.0 -0.2 0.0 -30.2 0.0Net financial cash flow, discontinued operations Net financial cash flow -0.2 0.0 -20.1 0.0 -0.2 0.0 -30.2 0.0 Change in cash and cash equivalents 25.0 4.7 -0.4 -35.9 28.5 5.0 -36.7 10.5 Cash and cash equivalents at beginning of financial year 29.5 24.8 25.2 61.1 32.5 27.5 64.2 53.7Effect of exchange rate changes 0.1 Cash and cash equivalents at end of financial year 54.5 29.5 24.8 25.2 61.1 32.5 27.5 64.2