Embed Size (px)
Citation preview
CONSOLIDATED FINANCIAL STATEMENTS / MANAGEMENT’S DISCUSSION AND ANALYSIS Second quarter ended September 30, 2020
INTERIM CONDENSED CONSOLIDATED FINANCIAL STATEMENTS
Second quarter ended September 30, 2020
TABLE OF CONTENTSInterim condensed consolidated financial statements............................................................................................................................. 5Notes to the interim condensed consolidated financial statements........................................................................................................ 10
Note 1 Nature of activities and corporate information.......................................................................................................................... 10Note 2 Basis of preparation................................................................................................................................................................. 10Note 3 Revenue from contracts with customers.................................................................................................................................. 10Note 4 Government assistance........................................................................................................................................................... 11Note 5 Cost of sales, selling and administrative expenses.................................................................................................................. 11Note 6 Non-recurring items.................................................................................................................................................................. 11Note 7 Net financial expenses............................................................................................................................................................. 12Note 8 Earnings per share................................................................................................................................................................... 12Note 9 Derivative financial instruments............................................................................................................................................... 12Note 10 Long-term debt......................................................................................................................................................................... 13Note 11 Issued capital........................................................................................................................................................................... 13Note 12 Accumulated other comprehensive income............................................................................................................................. 15Note 13 Net change in non-cash items.................................................................................................................................................. 15
3
DISCLOSURE OF NON-REVIEW OF INTERIM CONDENSED CONSOLIDATED FINANCIAL STATEMENTS FOR THE QUARTERS ENDED SEPTEMBER 30, 2020 AND 2019
Pursuant to National Instrument 51-102, Part 4, subsection 4.3(3)(a) issued by the Canadian Securities Administrators, if the external auditors have not performed a review of the financial statements, the financial statements must be accompanied by a notice indicating that they have not been reviewed by the external auditors.
The accompanying unaudited interim condensed consolidated financial statements of the Corporation for the quarters ended September 30, 2020 and 2019 have been prepared in accordance with International Accounting Standard 34, Interim Financial Reporting, and are the responsibility of the Corporation’s management.
The Corporation’s external auditors, Ernst & Young LLP, have not performed a review of these interim condensed consolidated financial statements in accordance with the standards established by Chartered Professional Accountants Canada for a review of financial statements by the external auditors of an entity.
November 12, 2020
4
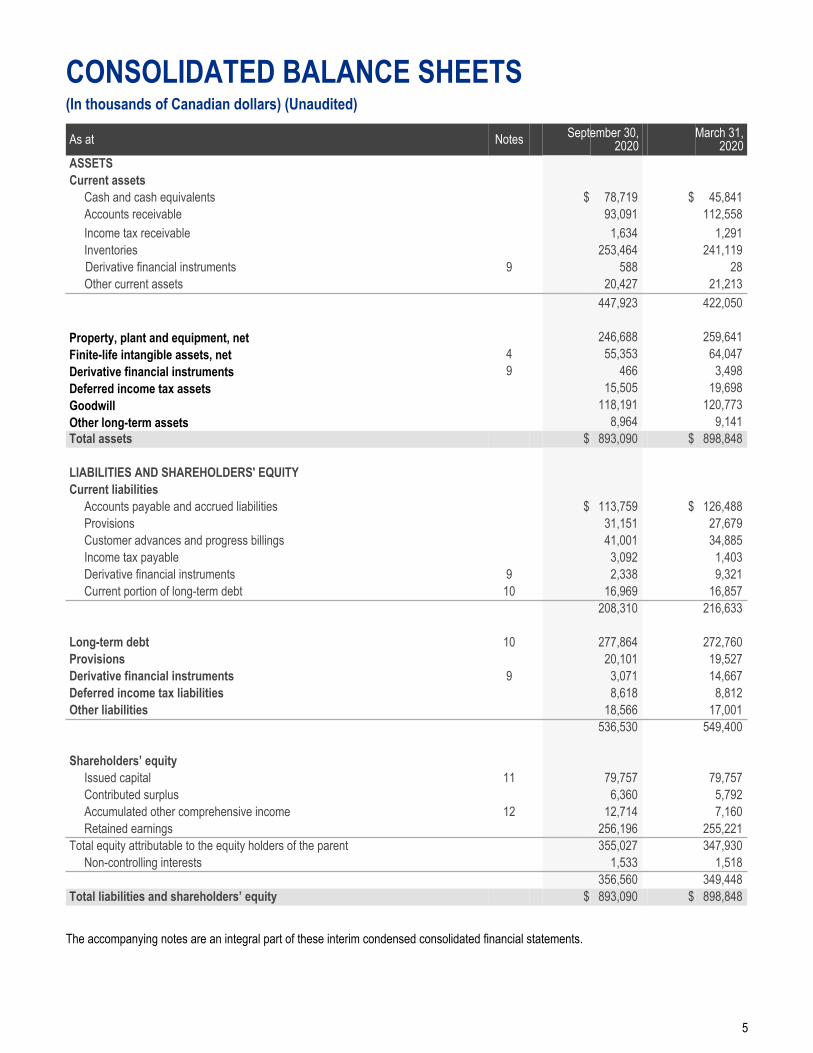
CONSOLIDATED BALANCE SHEETS(In thousands of Canadian dollars) (Unaudited)
As at Notes September 30,2020
March 31,2020
ASSETSCurrent assets
Cash and cash equivalents $ 78,719 $ 45,841 Accounts receivable 93,091 112,558 Income tax receivable 1,634 1,291 Inventories 253,464 241,119 Derivative financial instruments 9 588 28 Other current assets 20,427 21,213
447,923 422,050
Property, plant and equipment, net 246,688 259,641 Finite-life intangible assets, net 4 55,353 64,047 Derivative financial instruments 9 466 3,498 Deferred income tax assets 15,505 19,698 Goodwill 118,191 120,773 Other long-term assets 8,964 9,141 Total assets $ 893,090 $ 898,848
LIABILITIES AND SHAREHOLDERS' EQUITYCurrent liabilities
Accounts payable and accrued liabilities $ 113,759 $ 126,488 Provisions 31,151 27,679 Customer advances and progress billings 41,001 34,885 Income tax payable 3,092 1,403 Derivative financial instruments 9 2,338 9,321 Current portion of long-term debt 10 16,969 16,857
208,310 216,633
Long-term debt 10 277,864 272,760 Provisions 20,101 19,527 Derivative financial instruments 9 3,071 14,667 Deferred income tax liabilities 8,618 8,812 Other liabilities 18,566 17,001
536,530 549,400
Shareholders’ equityIssued capital 11 79,757 79,757 Contributed surplus 6,360 5,792 Accumulated other comprehensive income 12 12,714 7,160 Retained earnings 256,196 255,221
Total equity attributable to the equity holders of the parent 355,027 347,930 Non-controlling interests 1,533 1,518
356,560 349,448 Total liabilities and shareholders’ equity $ 893,090 $ 898,848
The accompanying notes are an integral part of these interim condensed consolidated financial statements.
5
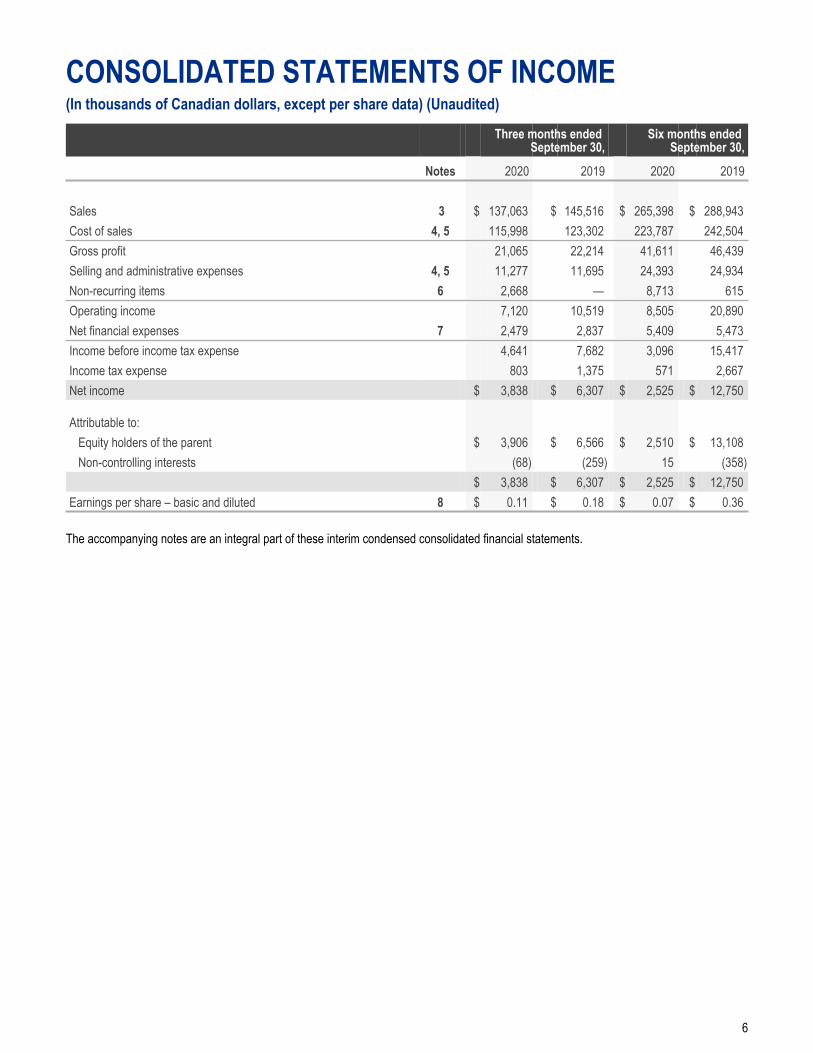
CONSOLIDATED STATEMENTS OF INCOME(In thousands of Canadian dollars, except per share data) (Unaudited)
Three months ended September 30,
Six months ended September 30,
Notes 2020 2019 2020 2019
Sales 3 $ 137,063 $ 145,516 $ 265,398 $ 288,943 Cost of sales 4, 5 115,998 123,302 223,787 242,504 Gross profit 21,065 22,214 41,611 46,439 Selling and administrative expenses 4, 5 11,277 11,695 24,393 24,934 Non-recurring items 6 2,668 — 8,713 615 Operating income 7,120 10,519 8,505 20,890 Net financial expenses 7 2,479 2,837 5,409 5,473 Income before income tax expense 4,641 7,682 3,096 15,417 Income tax expense 803 1,375 571 2,667 Net income $ 3,838 $ 6,307 $ 2,525 $ 12,750
Attributable to:Equity holders of the parent $ 3,906 $ 6,566 $ 2,510 $ 13,108 Non-controlling interests (68) (259) 15 (358)
$ 3,838 $ 6,307 $ 2,525 $ 12,750 Earnings per share – basic and diluted 8 $ 0.11 $ 0.18 $ 0.07 $ 0.36
The accompanying notes are an integral part of these interim condensed consolidated financial statements.
6

CONSOLIDATED STATEMENTS OF COMPREHENSIVE INCOME(In thousands of Canadian dollars) (Unaudited)
Three months ended September 30,
Six months ended September 30,
Notes
2020 2019 2020 201912
Other comprehensive income (loss): Items that may be reclassified to net income
Gains (losses) arising from conversion of the financial statements of foreign operations $ 1,544 $ (3,118) $ (10,631) $ (12,421)
Cash flow hedges:Net gains (losses) on valuation of derivative financial instruments 6,404 (3,744) 16,802 (1,754) Net losses on derivative financial instruments transferred to net
income 765 69 3,723 480 Deferred income taxes (1,915) 980 (5,484) 373
5,254 (2,695) 15,041 (901) Gains (losses) on hedge of net investments in foreign operations (1,644) 1,072 1,289 2,348 Deferred income taxes 226 (486) (145) (557)
(1,418) 586 1,144 1,791 Items that are never reclassified to net income
Defined benefit pension plans:Gains (losses) from remeasurement 1,534 (1,816) (2,099) (3,470) Deferred income taxes (395) 466 564 917
1,139 (1,350) (1,535) (2,553) Other comprehensive income (loss) $ 6,519 $ (6,577) $ 4,019 $ (14,084)
Comprehensive income (loss)Net income $ 3,838 $ 6,307 $ 2,525 $ 12,750 Other comprehensive income (loss) 6,519 (6,577) 4,019 (14,084)
Comprehensive income (loss) $ 10,357 $ (270) $ 6,544 $ (1,334)
Attributable to:Equity holders of the parent $ 10,425 $ (11) $ 6,529 $ (976) Non-controlling interests (68) (259) 15 (358)
$ 10,357 $ (270) $ 6,544 $ (1,334)
The accompanying notes are an integral part of these interim condensed consolidated financial statements.
7
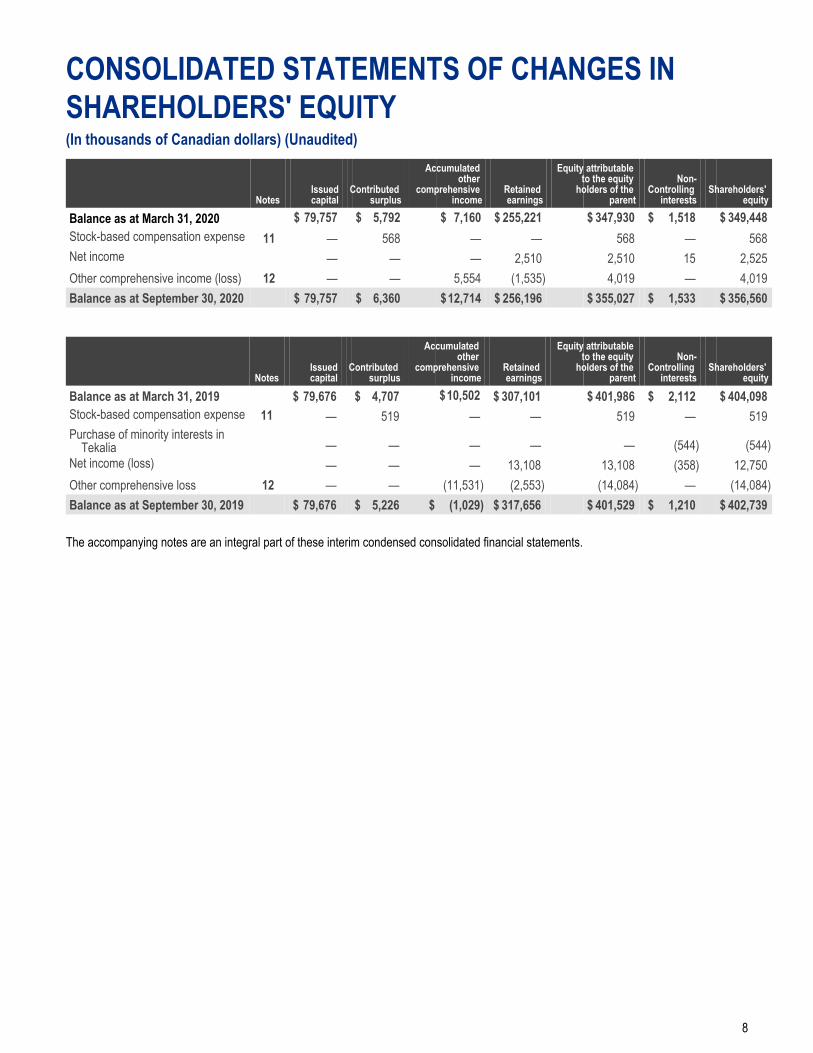
CONSOLIDATED STATEMENTS OF CHANGES IN SHAREHOLDERS' EQUITY(In thousands of Canadian dollars) (Unaudited)
NotesIssuedcapital
Contributed surplus
Accumulated other
comprehensive income
Retained earnings
Equity attributable to the equity
holders of the parent
Non-Controlling
interestsShareholders'
equity
Balance as at March 31, 2020 $ 79,757 $ 5,792 $ 7,160 $ 255,221 $ 347,930 $ 1,518 $ 349,448 Stock-based compensation expense 11 — 568 — — 568 — 568 Net income — — — 2,510 2,510 15 2,525 Other comprehensive income (loss) 12 — — 5,554 (1,535) 4,019 — 4,019 Balance as at September 30, 2020 $ 79,757 $ 6,360 $ 12,714 $ 256,196 $ 355,027 $ 1,533 $ 356,560
NotesIssuedcapital
Contributed surplus
Accumulated other
comprehensive income
Retained earnings
Equity attributable to the equity
holders of the parent
Non-Controlling
interestsShareholders'
equity
Balance as at March 31, 2019 $ 79,676 $ 4,707 $ 10,502 $ 307,101 $ 401,986 $ 2,112 $ 404,098 Stock-based compensation expense 11 — 519 — — 519 — 519 Purchase of minority interests in
Tekalia — — — — — (544) (544) Net income (loss) — — — 13,108 13,108 (358) 12,750 Other comprehensive loss 12 — — (11,531) (2,553) (14,084) — (14,084) Balance as at September 30, 2019 $ 79,676 $ 5,226 $ (1,029) $ 317,656 $ 401,529 $ 1,210 $ 402,739
The accompanying notes are an integral part of these interim condensed consolidated financial statements.
8
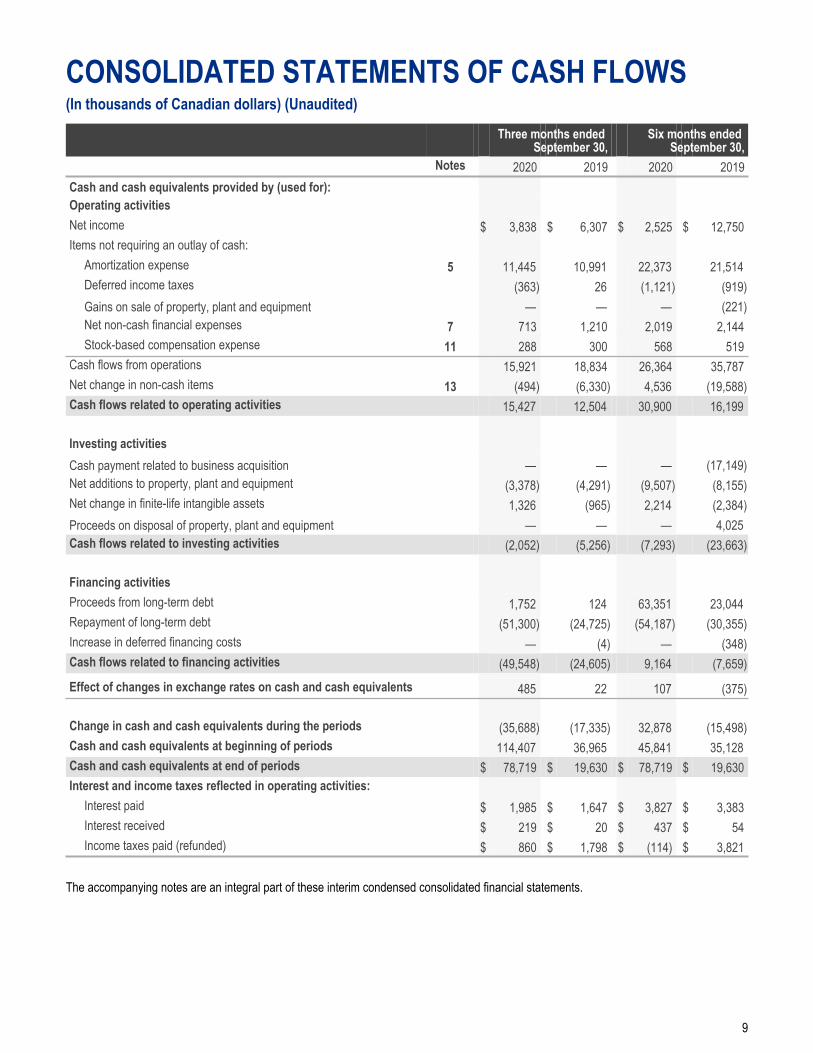
CONSOLIDATED STATEMENTS OF CASH FLOWS (In thousands of Canadian dollars) (Unaudited)
Three months ended September 30,
Six months ended September 30,
Notes 2020 2019 2020 2019Cash and cash equivalents provided by (used for):Operating activitiesNet income $ 3,838 $ 6,307 $ 2,525 $ 12,750 Items not requiring an outlay of cash:
Amortization expense 5 11,445 10,991 22,373 21,514 Deferred income taxes (363) 26 (1,121) (919) Gains on sale of property, plant and equipment — — — (221) Net non-cash financial expenses 7 713 1,210 2,019 2,144 Stock-based compensation expense 11 288 300 568 519
Cash flows from operations 15,921 18,834 26,364 35,787 Net change in non-cash items 13 (494) (6,330) 4,536 (19,588) Cash flows related to operating activities 15,427 12,504 30,900 16,199
Investing activitiesCash payment related to business acquisition — — — (17,149) Net additions to property, plant and equipment (3,378) (4,291) (9,507) (8,155) Net change in finite-life intangible assets 1,326 (965) 2,214 (2,384) Proceeds on disposal of property, plant and equipment — — — 4,025 Cash flows related to investing activities (2,052) (5,256) (7,293) (23,663)
Financing activitiesProceeds from long-term debt 1,752 124 63,351 23,044 Repayment of long-term debt (51,300) (24,725) (54,187) (30,355) Increase in deferred financing costs — (4) — (348) Cash flows related to financing activities (49,548) (24,605) 9,164 (7,659) Effect of changes in exchange rates on cash and cash equivalents 485 22 107 (375)
Change in cash and cash equivalents during the periods (35,688) (17,335) 32,878 (15,498) Cash and cash equivalents at beginning of periods 114,407 36,965 45,841 35,128 Cash and cash equivalents at end of periods $ 78,719 $ 19,630 $ 78,719 $ 19,630 Interest and income taxes reflected in operating activities:
Interest paid $ 1,985 $ 1,647 $ 3,827 $ 3,383 Interest received $ 219 $ 20 $ 437 $ 54 Income taxes paid (refunded) $ 860 $ 1,798 $ (114) $ 3,821
The accompanying notes are an integral part of these interim condensed consolidated financial statements.
9
NOTES TO THE INTERIM CONDENSED CONSOLIDATED FINANCIAL STATEMENTSFor the quarters and six-month periods ended September 30, 2020 and 2019 (In thousands of Canadian dollars, except per share data) (Unaudited)
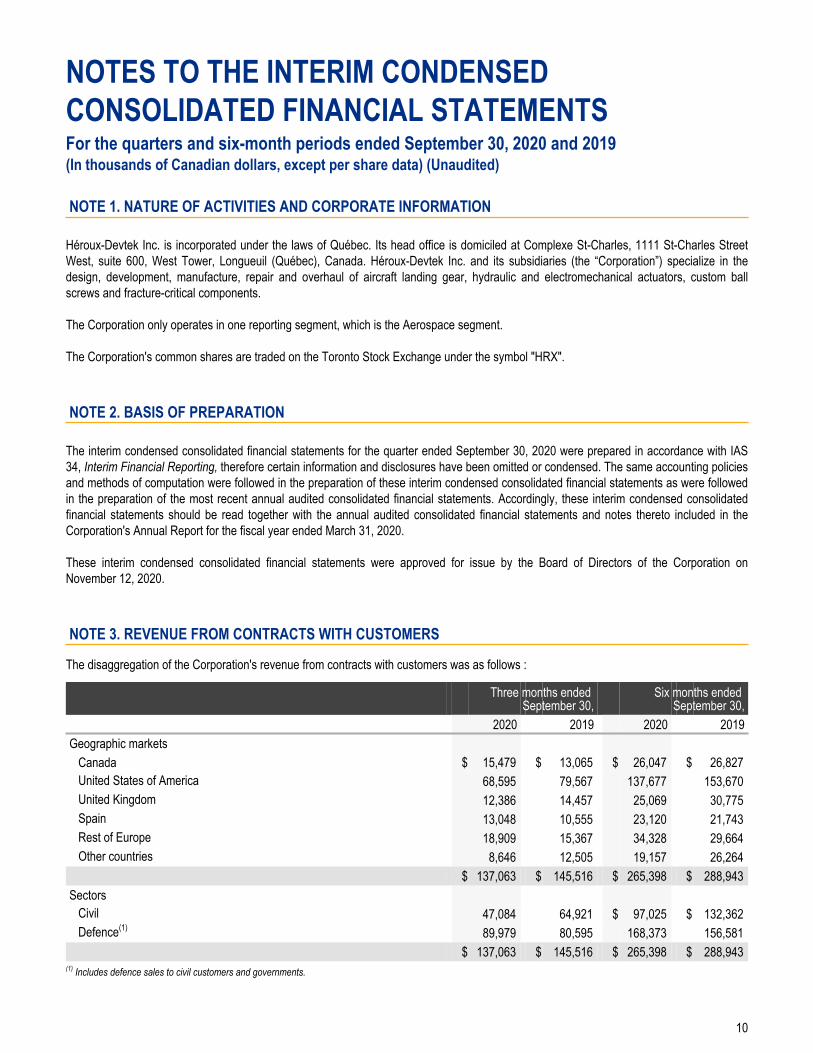
NOTE 1. NATURE OF ACTIVITIES AND CORPORATE INFORMATION
Héroux-Devtek Inc. is incorporated under the laws of Québec. Its head office is domiciled at Complexe St-Charles, 1111 St-Charles Street West, suite 600, West Tower, Longueuil (Québec), Canada. Héroux-Devtek Inc. and its subsidiaries (the “Corporation”) specialize in the design, development, manufacture, repair and overhaul of aircraft landing gear, hydraulic and electromechanical actuators, custom ball screws and fracture-critical components.
The Corporation only operates in one reporting segment, which is the Aerospace segment.
The Corporation's common shares are traded on the Toronto Stock Exchange under the symbol "HRX".
NOTE 2. BASIS OF PREPARATION
The interim condensed consolidated financial statements for the quarter ended September 30, 2020 were prepared in accordance with IAS 34, Interim Financial Reporting, therefore certain information and disclosures have been omitted or condensed. The same accounting policies and methods of computation were followed in the preparation of these interim condensed consolidated financial statements as were followed in the preparation of the most recent annual audited consolidated financial statements. Accordingly, these interim condensed consolidated financial statements should be read together with the annual audited consolidated financial statements and notes thereto included in the Corporation's Annual Report for the fiscal year ended March 31, 2020.
These interim condensed consolidated financial statements were approved for issue by the Board of Directors of the Corporation on November 12, 2020.
NOTE 3. REVENUE FROM CONTRACTS WITH CUSTOMERS
The disaggregation of the Corporation's revenue from contracts with customers was as follows :
Three months ended September 30,
Six months ended September 30,
2020 2019 2020 2019Geographic markets
Canada $ 15,479 $ 13,065 $ 26,047 $ 26,827 United States of America 68,595 79,567 137,677 153,670 United Kingdom 12,386 14,457 25,069 30,775 Spain 13,048 10,555 23,120 21,743 Rest of Europe 18,909 15,367 34,328 29,664 Other countries 8,646 12,505 19,157 26,264
$ 137,063 $ 145,516 $ 265,398 $ 288,943 Sectors
Civil 47,084 64,921 $ 97,025 $ 132,362 Defence(1) 89,979 80,595 168,373 156,581
$ 137,063 $ 145,516 $ 265,398 $ 288,943 (1) Includes defence sales to civil customers and governments.
10
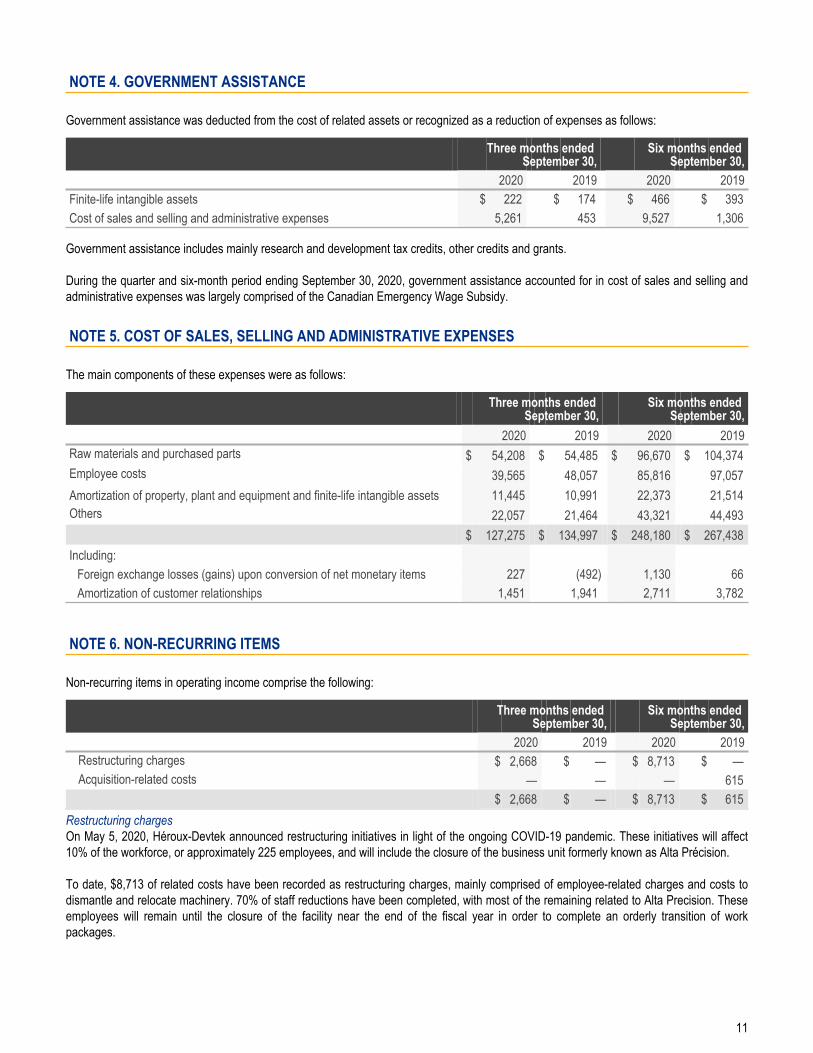
NOTE 4. GOVERNMENT ASSISTANCE
Government assistance was deducted from the cost of related assets or recognized as a reduction of expenses as follows:
Three months ended September 30,
Six months ended September 30,
2020 2019 2020 2019Finite-life intangible assets $ 222 $ 174 $ 466 $ 393 Cost of sales and selling and administrative expenses 5,261 453 9,527 1,306
Government assistance includes mainly research and development tax credits, other credits and grants.
During the quarter and six-month period ending September 30, 2020, government assistance accounted for in cost of sales and selling and administrative expenses was largely comprised of the Canadian Emergency Wage Subsidy.
NOTE 5. COST OF SALES, SELLING AND ADMINISTRATIVE EXPENSES
The main components of these expenses were as follows:
Three months ended September 30,
Six months ended September 30,
2020 2019 2020 2019Raw materials and purchased parts $ 54,208 $ 54,485 $ 96,670 $ 104,374 Employee costs 39,565 48,057 85,816 97,057 Amortization of property, plant and equipment and finite-life intangible assets 11,445 10,991 22,373 21,514 Others 22,057 21,464 43,321 44,493
$ 127,275 $ 134,997 $ 248,180 $ 267,438 Including:
Foreign exchange losses (gains) upon conversion of net monetary items 227 (492) 1,130 66 Amortization of customer relationships 1,451 1,941 2,711 3,782
NOTE 6. NON-RECURRING ITEMS
Non-recurring items in operating income comprise the following:
Three months ended September 30,
Six months ended September 30,
2020 2019 2020 2019Restructuring charges $ 2,668 $ — $ 8,713 $ — Acquisition-related costs — — — 615
$ 2,668 $ — $ 8,713 $ 615 Restructuring chargesOn May 5, 2020, Héroux-Devtek announced restructuring initiatives in light of the ongoing COVID-19 pandemic. These initiatives will affect 10% of the workforce, or approximately 225 employees, and will include the closure of the business unit formerly known as Alta Précision.
To date, $8,713 of related costs have been recorded as restructuring charges, mainly comprised of employee-related charges and costs to dismantle and relocate machinery. 70% of staff reductions have been completed, with most of the remaining related to Alta Precision. These employees will remain until the closure of the facility near the end of the fiscal year in order to complete an orderly transition of work packages.
11
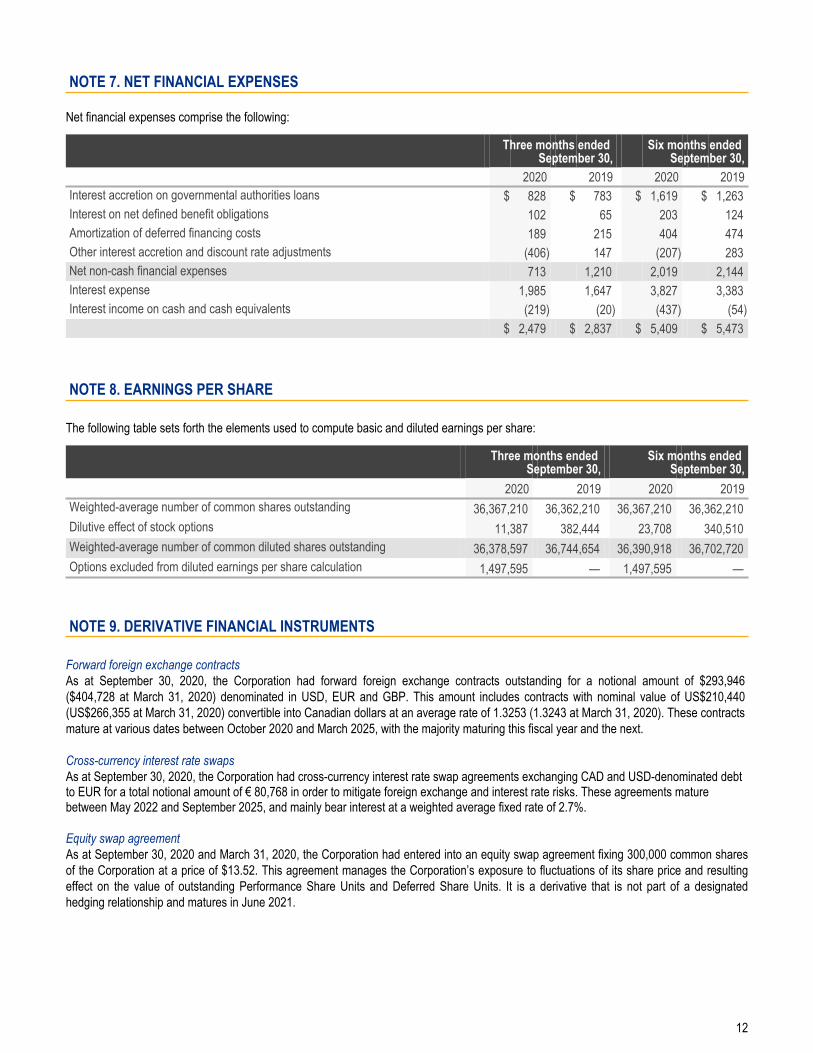
NOTE 7. NET FINANCIAL EXPENSES
Net financial expenses comprise the following:
Three months ended September 30,
Six months ended September 30,
2020 2019 2020 2019Interest accretion on governmental authorities loans $ 828 $ 783 $ 1,619 $ 1,263 Interest on net defined benefit obligations 102 65 203 124 Amortization of deferred financing costs 189 215 404 474 Other interest accretion and discount rate adjustments (406) 147 (207) 283 Net non-cash financial expenses 713 1,210 2,019 2,144 Interest expense 1,985 1,647 3,827 3,383 Interest income on cash and cash equivalents (219) (20) (437) (54)
$ 2,479 $ 2,837 $ 5,409 $ 5,473
NOTE 8. EARNINGS PER SHARE
The following table sets forth the elements used to compute basic and diluted earnings per share:
Three months ended September 30,
Six months ended September 30,
2020 2019 2020 2019Weighted-average number of common shares outstanding 36,367,210 36,362,210 36,367,210 36,362,210 Dilutive effect of stock options 11,387 382,444 23,708 340,510 Weighted-average number of common diluted shares outstanding 36,378,597 36,744,654 36,390,918 36,702,720 Options excluded from diluted earnings per share calculation 1,497,595 — 1,497,595 —
NOTE 9. DERIVATIVE FINANCIAL INSTRUMENTS
Forward foreign exchange contractsAs at September 30, 2020, the Corporation had forward foreign exchange contracts outstanding for a notional amount of $293,946 ($404,728 at March 31, 2020) denominated in USD, EUR and GBP. This amount includes contracts with nominal value of US$210,440 (US$266,355 at March 31, 2020) convertible into Canadian dollars at an average rate of 1.3253 (1.3243 at March 31, 2020). These contracts mature at various dates between October 2020 and March 2025, with the majority maturing this fiscal year and the next.
Cross-currency interest rate swapsAs at September 30, 2020, the Corporation had cross-currency interest rate swap agreements exchanging CAD and USD-denominated debt to EUR for a total notional amount of € 80,768 in order to mitigate foreign exchange and interest rate risks. These agreements mature between May 2022 and September 2025, and mainly bear interest at a weighted average fixed rate of 2.7%.
Equity swap agreementAs at September 30, 2020 and March 31, 2020, the Corporation had entered into an equity swap agreement fixing 300,000 common shares of the Corporation at a price of $13.52. This agreement manages the Corporation’s exposure to fluctuations of its share price and resulting effect on the value of outstanding Performance Share Units and Deferred Share Units. It is a derivative that is not part of a designated hedging relationship and matures in June 2021.
12
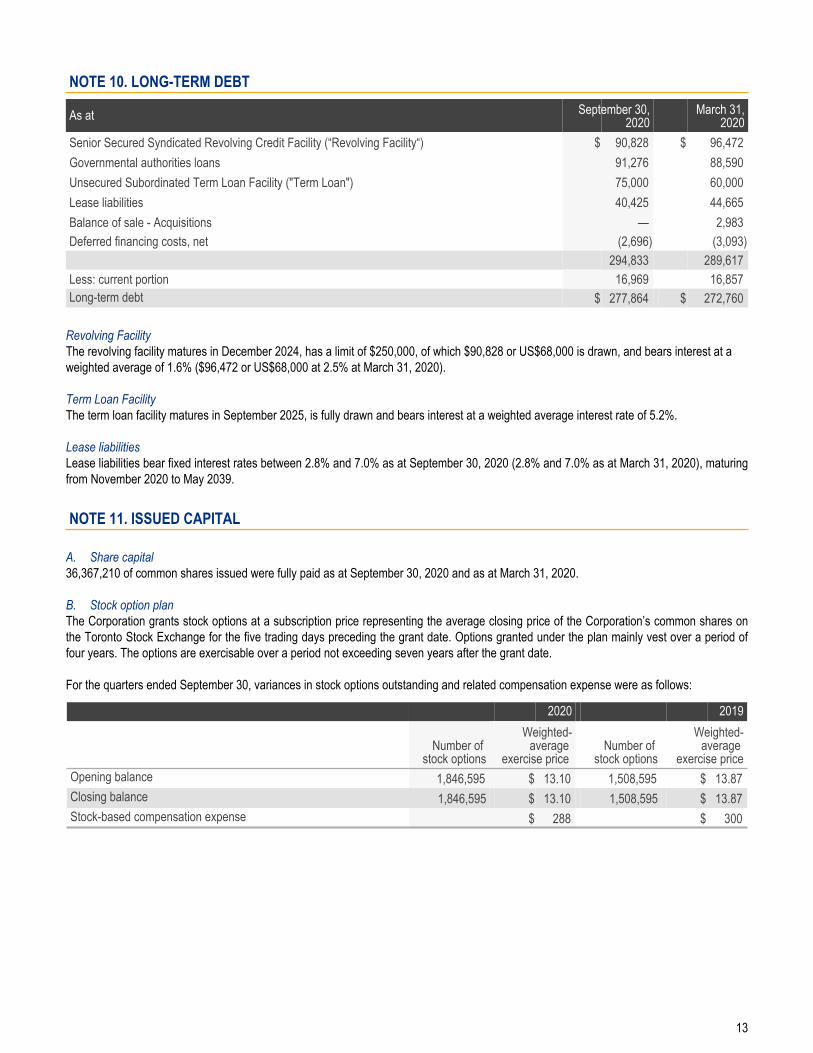
NOTE 10. LONG-TERM DEBT
As at September 30,2020
March 31,2020
Senior Secured Syndicated Revolving Credit Facility (“Revolving Facility“) $ 90,828 $ 96,472 Governmental authorities loans 91,276 88,590 Unsecured Subordinated Term Loan Facility ("Term Loan") 75,000 60,000 Lease liabilities 40,425 44,665 Balance of sale - Acquisitions — 2,983 Deferred financing costs, net (2,696) (3,093)
294,833 289,617 Less: current portion 16,969 16,857 Long-term debt $ 277,864 $ 272,760
Revolving FacilityThe revolving facility matures in December 2024, has a limit of $250,000, of which $90,828 or US$68,000 is drawn, and bears interest at a weighted average of 1.6% ($96,472 or US$68,000 at 2.5% at March 31, 2020).
Term Loan FacilityThe term loan facility matures in September 2025, is fully drawn and bears interest at a weighted average interest rate of 5.2%.
Lease liabilitiesLease liabilities bear fixed interest rates between 2.8% and 7.0% as at September 30, 2020 (2.8% and 7.0% as at March 31, 2020), maturing from November 2020 to May 2039.
NOTE 11. ISSUED CAPITAL
A. Share capital36,367,210 of common shares issued were fully paid as at September 30, 2020 and as at March 31, 2020.
B. Stock option planThe Corporation grants stock options at a subscription price representing the average closing price of the Corporation’s common shares on the Toronto Stock Exchange for the five trading days preceding the grant date. Options granted under the plan mainly vest over a period of four years. The options are exercisable over a period not exceeding seven years after the grant date.
For the quarters ended September 30, variances in stock options outstanding and related compensation expense were as follows:
2020 2019
Number of stock options
Weighted-average
exercise price Number of
stock options
Weighted-average
exercise priceOpening balance 1,846,595 $ 13.10 1,508,595 $ 13.87 Closing balance 1,846,595 $ 13.10 1,508,595 $ 13.87 Stock-based compensation expense $ 288 $ 300
13
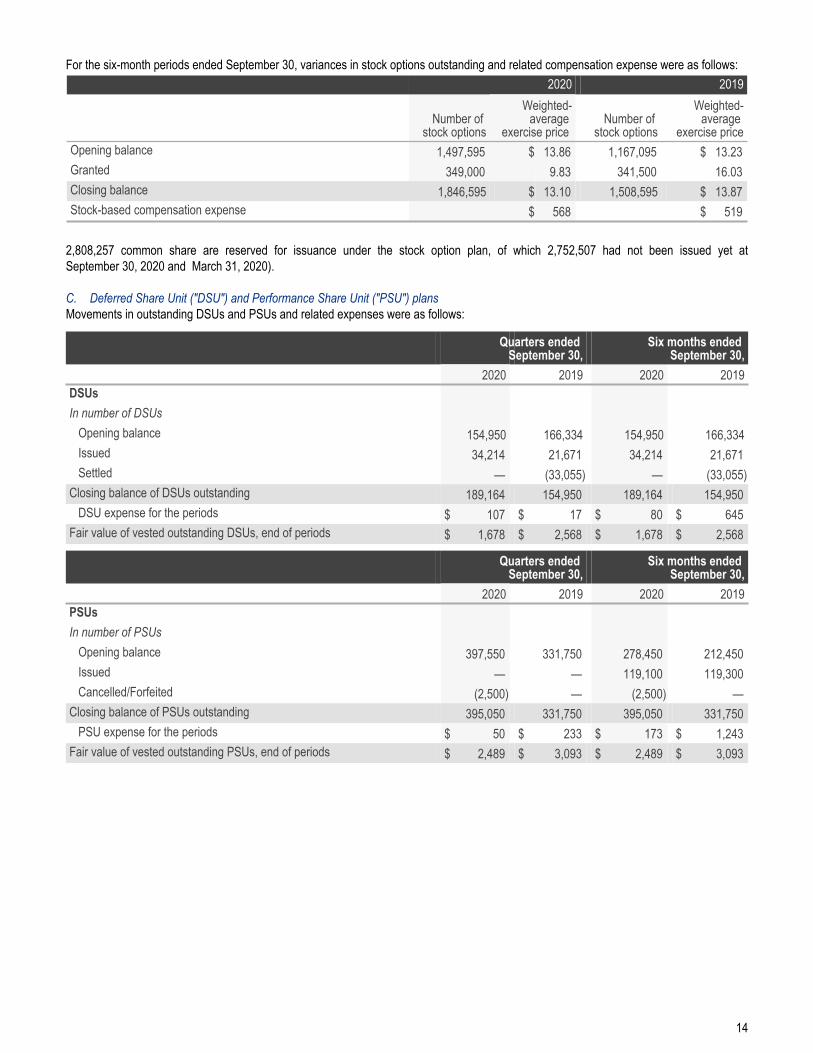
For the six-month periods ended September 30, variances in stock options outstanding and related compensation expense were as follows:2020 2019
Number of stock options
Weighted-average
exercise price Number of
stock options
Weighted-average
exercise priceOpening balance 1,497,595 $ 13.86 1,167,095 $ 13.23 Granted 349,000 9.83 341,500 16.03 Closing balance 1,846,595 $ 13.10 1,508,595 $ 13.87 Stock-based compensation expense $ 568 $ 519
2,808,257 common share are reserved for issuance under the stock option plan, of which 2,752,507 had not been issued yet at September 30, 2020 and March 31, 2020).
C. Deferred Share Unit ("DSU") and Performance Share Unit ("PSU") plansMovements in outstanding DSUs and PSUs and related expenses were as follows:
Quarters ended September 30,
Six months ended September 30,
2020 2019 2020 2019DSUsIn number of DSUs
Opening balance 154,950 166,334 154,950 166,334Issued 34,214 21,671 34,214 21,671 Settled — (33,055) — (33,055)
Closing balance of DSUs outstanding 189,164 154,950 189,164 154,950 DSU expense for the periods $ 107 $ 17 $ 80 $ 645
Fair value of vested outstanding DSUs, end of periods $ 1,678 $ 2,568 $ 1,678 $ 2,568
Quarters ended September 30,
Six months ended September 30,
2020 2019 2020 2019PSUsIn number of PSUs
Opening balance 397,550 331,750 278,450 212,450 Issued — — 119,100 119,300 Cancelled/Forfeited (2,500) — (2,500) —
Closing balance of PSUs outstanding 395,050 331,750 395,050 331,750 PSU expense for the periods $ 50 $ 233 $ 173 $ 1,243
Fair value of vested outstanding PSUs, end of periods $ 2,489 $ 3,093 $ 2,489 $ 3,093
14
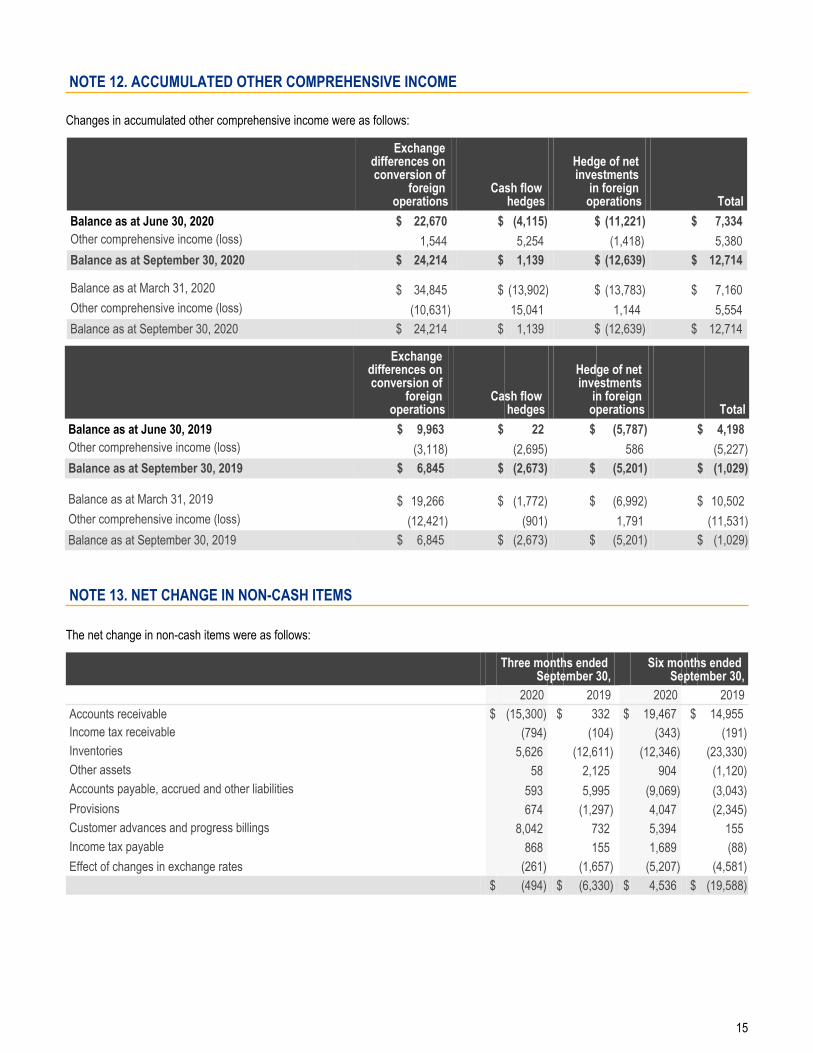
NOTE 12. ACCUMULATED OTHER COMPREHENSIVE INCOME
Changes in accumulated other comprehensive income were as follows:
Exchange differences on conversion of
foreign operations
Cash flow hedges
Hedge of net investments
in foreign operations Total
Balance as at June 30, 2020 $ 22,670 $ (4,115) $ (11,221) $ 7,334 Other comprehensive income (loss) 1,544 5,254 (1,418) 5,380 Balance as at September 30, 2020 $ 24,214 $ 1,139 $ (12,639) $ 12,714
Balance as at March 31, 2020 $ 34,845 $ (13,902) $ (13,783) $ 7,160 Other comprehensive income (loss) (10,631) 15,041 1,144 5,554 Balance as at September 30, 2020 $ 24,214 $ 1,139 $ (12,639) $ 12,714
Exchange differences on conversion of
foreign operations
Cash flow hedges
Hedge of net investments
in foreign operations Total
Balance as at June 30, 2019 $ 9,963 $ 22 $ (5,787) $ 4,198 Other comprehensive income (loss) (3,118) (2,695) 586 (5,227) Balance as at September 30, 2019 $ 6,845 $ (2,673) $ (5,201) $ (1,029)
Balance as at March 31, 2019 $ 19,266 $ (1,772) $ (6,992) $ 10,502 Other comprehensive income (loss) (12,421) (901) 1,791 (11,531) Balance as at September 30, 2019 $ 6,845 $ (2,673) $ (5,201) $ (1,029)
NOTE 13. NET CHANGE IN NON-CASH ITEMS
The net change in non-cash items were as follows:
Three months ended September 30,
Six months ended September 30,
2020 2019 2020 2019Accounts receivable $ (15,300) $ 332 $ 19,467 $ 14,955 Income tax receivable (794) (104) (343) (191) Inventories 5,626 (12,611) (12,346) (23,330) Other assets 58 2,125 904 (1,120) Accounts payable, accrued and other liabilities 593 5,995 (9,069) (3,043) Provisions 674 (1,297) 4,047 (2,345) Customer advances and progress billings 8,042 732 5,394 155 Income tax payable 868 155 1,689 (88) Effect of changes in exchange rates (261) (1,657) (5,207) (4,581)
$ (494) $ (6,330) $ 4,536 $ (19,588)
15
MANAGEMENT’S DISCUSSION AND ANALYSIS
Second quarter ended September 30, 2020
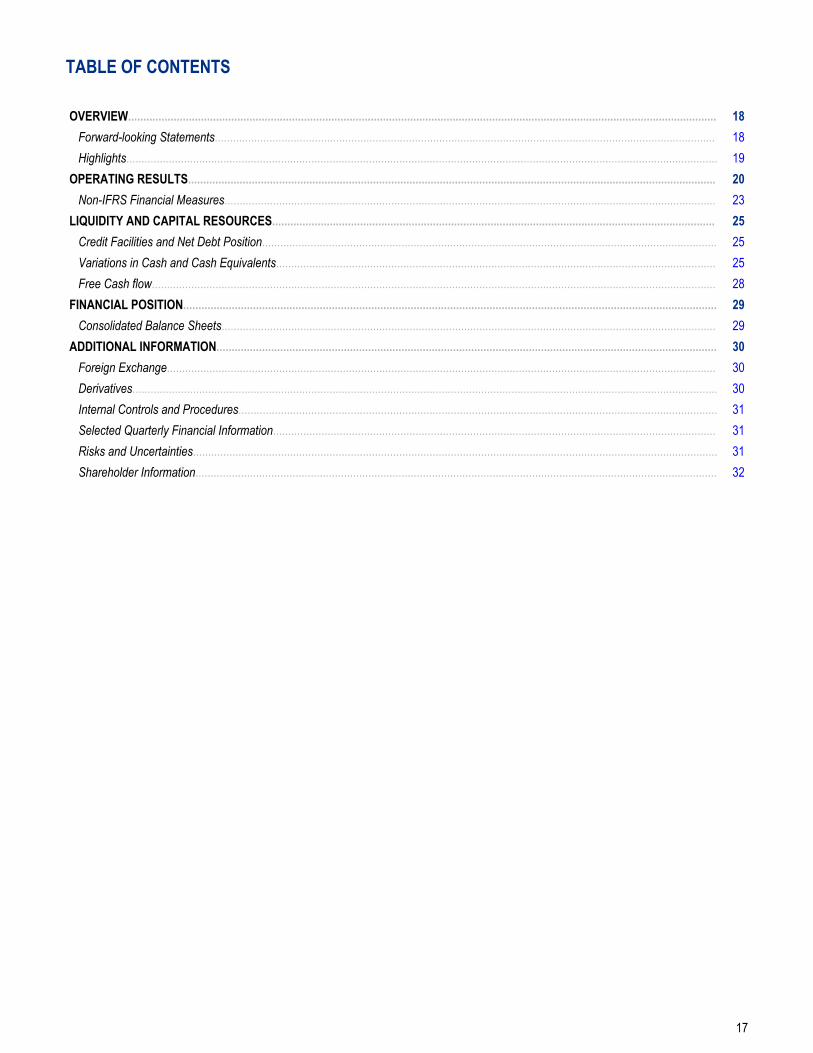
TABLE OF CONTENTS
OVERVIEW.................................................................................................................................................................................................. 18Forward-looking Statements..................................................................................................................................................................... 18Highlights................................................................................................................................................................................................... 19
OPERATING RESULTS.............................................................................................................................................................................. 20Non-IFRS Financial Measures.................................................................................................................................................................. 23
LIQUIDITY AND CAPITAL RESOURCES.................................................................................................................................................. 25Credit Facilities and Net Debt Position...................................................................................................................................................... 25Variations in Cash and Cash Equivalents................................................................................................................................................. 25Free Cash flow.......................................................................................................................................................................................... 28
FINANCIAL POSITION................................................................................................................................................................................ 29Consolidated Balance Sheets................................................................................................................................................................... 29
ADDITIONAL INFORMATION..................................................................................................................................................................... 30Foreign Exchange..................................................................................................................................................................................... 30Derivatives................................................................................................................................................................................................. 30Internal Controls and Procedures.............................................................................................................................................................. 31Selected Quarterly Financial Information.................................................................................................................................................. 31Risks and Uncertainties............................................................................................................................................................................. 31Shareholder Information............................................................................................................................................................................ 32
17
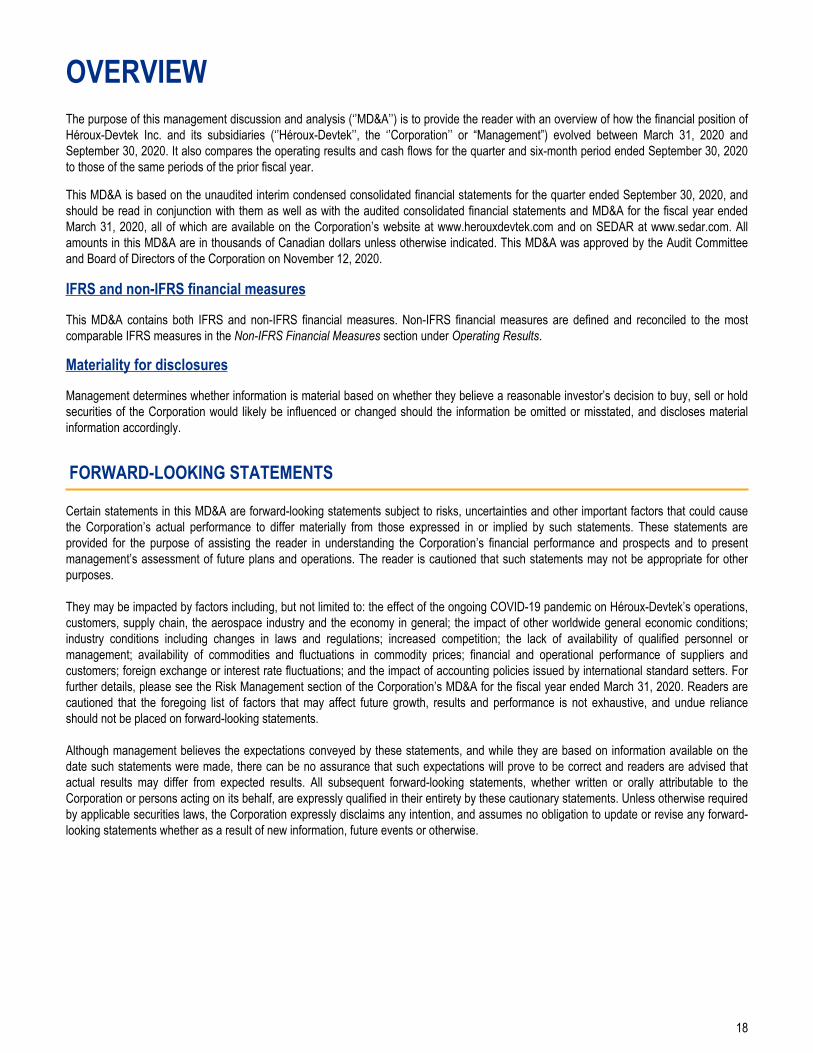
OVERVIEWThe purpose of this management discussion and analysis (‘’MD&A’’) is to provide the reader with an overview of how the financial position of Héroux-Devtek Inc. and its subsidiaries (‘’Héroux-Devtek’’, the ‘’Corporation’’ or “Management”) evolved between March 31, 2020 and September 30, 2020. It also compares the operating results and cash flows for the quarter and six-month period ended September 30, 2020 to those of the same periods of the prior fiscal year.
This MD&A is based on the unaudited interim condensed consolidated financial statements for the quarter ended September 30, 2020, and should be read in conjunction with them as well as with the audited consolidated financial statements and MD&A for the fiscal year ended March 31, 2020, all of which are available on the Corporation’s website at www.herouxdevtek.com and on SEDAR at www.sedar.com. All amounts in this MD&A are in thousands of Canadian dollars unless otherwise indicated. This MD&A was approved by the Audit Committee and Board of Directors of the Corporation on November 12, 2020.
IFRS and non-IFRS financial measures
This MD&A contains both IFRS and non-IFRS financial measures. Non-IFRS financial measures are defined and reconciled to the most comparable IFRS measures in the Non-IFRS Financial Measures section under Operating Results.
Materiality for disclosures
Management determines whether information is material based on whether they believe a reasonable investor’s decision to buy, sell or hold securities of the Corporation would likely be influenced or changed should the information be omitted or misstated, and discloses material information accordingly.
FORWARD-LOOKING STATEMENTS
Certain statements in this MD&A are forward-looking statements subject to risks, uncertainties and other important factors that could cause the Corporation’s actual performance to differ materially from those expressed in or implied by such statements. These statements are provided for the purpose of assisting the reader in understanding the Corporation’s financial performance and prospects and to present management’s assessment of future plans and operations. The reader is cautioned that such statements may not be appropriate for other purposes.
They may be impacted by factors including, but not limited to: the effect of the ongoing COVID-19 pandemic on Héroux-Devtek’s operations, customers, supply chain, the aerospace industry and the economy in general; the impact of other worldwide general economic conditions; industry conditions including changes in laws and regulations; increased competition; the lack of availability of qualified personnel or management; availability of commodities and fluctuations in commodity prices; financial and operational performance of suppliers and customers; foreign exchange or interest rate fluctuations; and the impact of accounting policies issued by international standard setters. For further details, please see the Risk Management section of the Corporation’s MD&A for the fiscal year ended March 31, 2020. Readers are cautioned that the foregoing list of factors that may affect future growth, results and performance is not exhaustive, and undue reliance should not be placed on forward-looking statements.
Although management believes the expectations conveyed by these statements, and while they are based on information available on the date such statements were made, there can be no assurance that such expectations will prove to be correct and readers are advised that actual results may differ from expected results. All subsequent forward-looking statements, whether written or orally attributable to the Corporation or persons acting on its behalf, are expressly qualified in their entirety by these cautionary statements. Unless otherwise required by applicable securities laws, the Corporation expressly disclaims any intention, and assumes no obligation to update or revise any forward-looking statements whether as a result of new information, future events or otherwise.
18
HIGHLIGHTSThree months ended
September 30,Six months ended
September 30,2020 2019 2020 2019
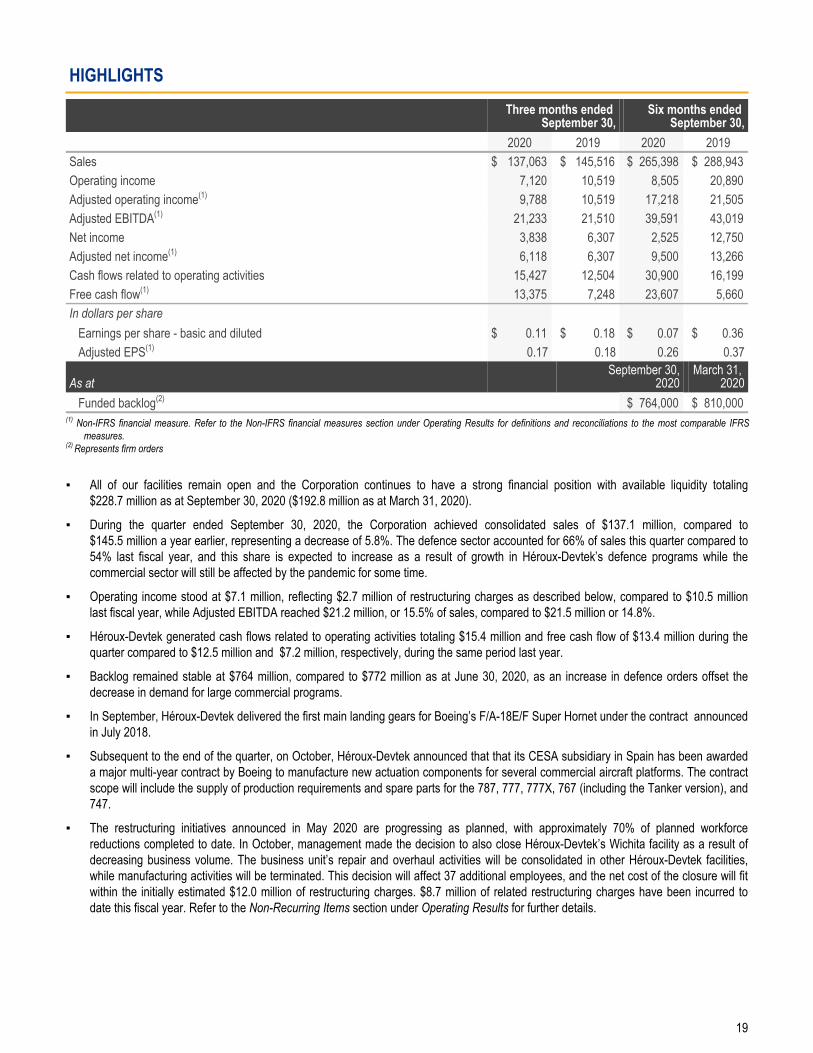
Sales $ 137,063 $ 145,516 $ 265,398 $ 288,943 Operating income 7,120 10,519 8,505 20,890 Adjusted operating income(1) 9,788 10,519 17,218 21,505 Adjusted EBITDA(1) 21,233 21,510 39,591 43,019 Net income 3,838 6,307 2,525 12,750 Adjusted net income(1) 6,118 6,307 9,500 13,266 Cash flows related to operating activities 15,427 12,504 30,900 16,199 Free cash flow(1) 13,375 7,248 23,607 5,660 In dollars per share
Earnings per share - basic and diluted $ 0.11 $ 0.18 $ 0.07 $ 0.36 Adjusted EPS(1) 0.17 0.18 0.26 0.37
As atSeptember 30,
2020March 31,
2020Funded backlog(2) $ 764,000 $ 810,000
(1) Non-IFRS financial measure. Refer to the Non-IFRS financial measures section under Operating Results for definitions and reconciliations to the most comparable IFRS measures.
(2) Represents firm orders
▪ All of our facilities remain open and the Corporation continues to have a strong financial position with available liquidity totaling $228.7 million as at September 30, 2020 ($192.8 million as at March 31, 2020).
▪ During the quarter ended September 30, 2020, the Corporation achieved consolidated sales of $137.1 million, compared to $145.5 million a year earlier, representing a decrease of 5.8%. The defence sector accounted for 66% of sales this quarter compared to 54% last fiscal year, and this share is expected to increase as a result of growth in Héroux-Devtek’s defence programs while the commercial sector will still be affected by the pandemic for some time.
▪ Operating income stood at $7.1 million, reflecting $2.7 million of restructuring charges as described below, compared to $10.5 million last fiscal year, while Adjusted EBITDA reached $21.2 million, or 15.5% of sales, compared to $21.5 million or 14.8%.
▪ Héroux-Devtek generated cash flows related to operating activities totaling $15.4 million and free cash flow of $13.4 million during the quarter compared to $12.5 million and $7.2 million, respectively, during the same period last year.
▪ Backlog remained stable at $764 million, compared to $772 million as at June 30, 2020, as an increase in defence orders offset the decrease in demand for large commercial programs.
▪ In September, Héroux-Devtek delivered the first main landing gears for Boeing’s F/A-18E/F Super Hornet under the contract announced in July 2018.
▪ Subsequent to the end of the quarter, on October, Héroux-Devtek announced that that its CESA subsidiary in Spain has been awarded a major multi-year contract by Boeing to manufacture new actuation components for several commercial aircraft platforms. The contract scope will include the supply of production requirements and spare parts for the 787, 777, 777X, 767 (including the Tanker version), and 747.
▪ The restructuring initiatives announced in May 2020 are progressing as planned, with approximately 70% of planned workforce reductions completed to date. In October, management made the decision to also close Héroux-Devtek’s Wichita facility as a result of decreasing business volume. The business unit’s repair and overhaul activities will be consolidated in other Héroux-Devtek facilities, while manufacturing activities will be terminated. This decision will affect 37 additional employees, and the net cost of the closure will fit within the initially estimated $12.0 million of restructuring charges. $8.7 million of related restructuring charges have been incurred to date this fiscal year. Refer to the Non-Recurring Items section under Operating Results for further details.
19
OPERATING RESULTSThree months ended September 30, Six months ended September 30,
2020 2019 Variance 2020 2019 Variance
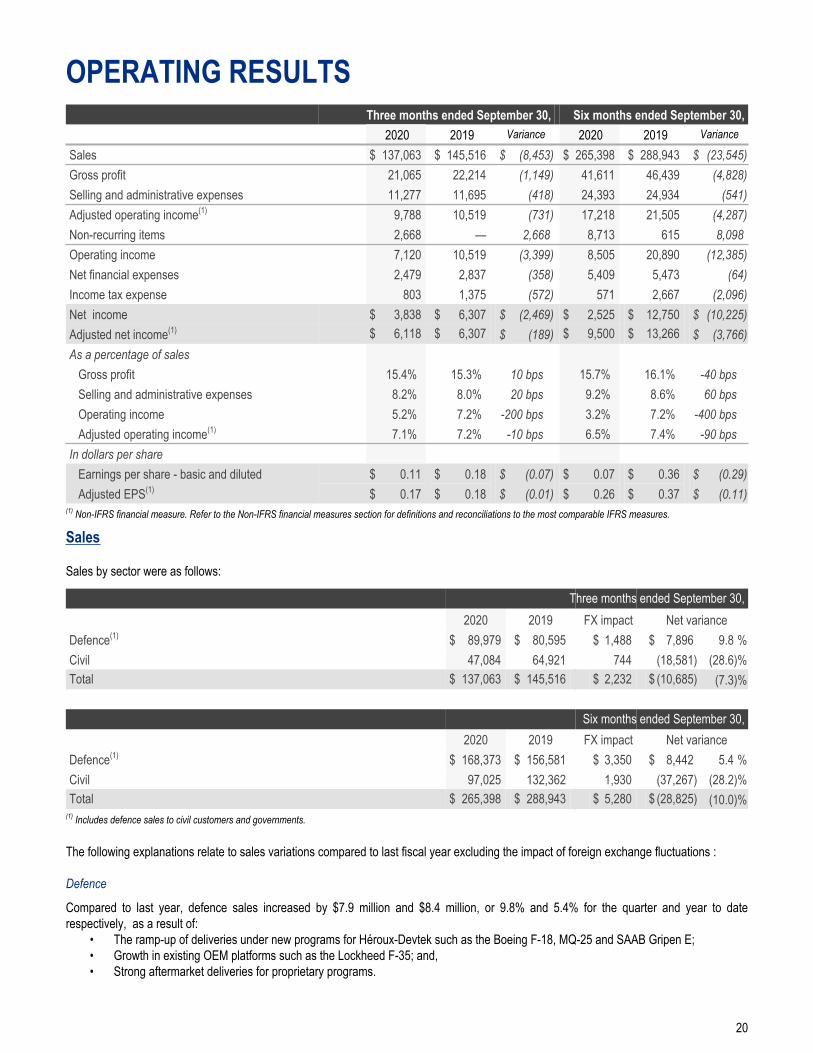
Sales $ 137,063 $ 145,516 $ (8,453) $ 265,398 $ 288,943 $ (23,545) Gross profit 21,065 22,214 (1,149) 41,611 46,439 (4,828) Selling and administrative expenses 11,277 11,695 (418) 24,393 24,934 (541) Adjusted operating income(1) 9,788 10,519 (731) 17,218 21,505 (4,287) Non-recurring items 2,668 — 2,668 8,713 615 8,098 Operating income 7,120 10,519 (3,399) 8,505 20,890 (12,385) Net financial expenses 2,479 2,837 (358) 5,409 5,473 (64) Income tax expense 803 1,375 (572) 571 2,667 (2,096) Net income $ 3,838 $ 6,307 $ (2,469) $ 2,525 $ 12,750 $ (10,225) Adjusted net income(1) $ 6,118 $ 6,307 $ (189) $ 9,500 $ 13,266 $ (3,766) As a percentage of sales
Gross profit 15.4 % 15.3 % 10 bps 15.7 % 16.1 % -40 bpsSelling and administrative expenses 8.2 % 8.0 % 20 bps 9.2 % 8.6 % 60 bpsOperating income 5.2 % 7.2 % -200 bps 3.2 % 7.2 % -400 bpsAdjusted operating income(1) 7.1 % 7.2 % -10 bps 6.5 % 7.4 % -90 bps
In dollars per shareEarnings per share - basic and diluted $ 0.11 $ 0.18 $ (0.07) $ 0.07 $ 0.36 $ (0.29) Adjusted EPS(1) $ 0.17 $ 0.18 $ (0.01) $ 0.26 $ 0.37 $ (0.11)
(1) Non-IFRS financial measure. Refer to the Non-IFRS financial measures section for definitions and reconciliations to the most comparable IFRS measures.
Sales
Sales by sector were as follows:
Three months ended September 30,2020 2019 FX impact Net variance
Defence(1) $ 89,979 $ 80,595 $ 1,488 $ 7,896 9.8 %Civil 47,084 64,921 744 (18,581) (28.6) %Total $ 137,063 $ 145,516 $ 2,232 $ (10,685) (7.3) %
Six months ended September 30,2020 2019 FX impact Net variance
Defence(1) $ 168,373 $ 156,581 $ 3,350 $ 8,442 5.4 %Civil 97,025 132,362 1,930 (37,267) (28.2) %Total $ 265,398 $ 288,943 $ 5,280 $ (28,825) (10.0) %
(1) Includes defence sales to civil customers and governments.
The following explanations relate to sales variations compared to last fiscal year excluding the impact of foreign exchange fluctuations :
Defence
Compared to last year, defence sales increased by $7.9 million and $8.4 million, or 9.8% and 5.4% for the quarter and year to date respectively, as a result of:
• The ramp-up of deliveries under new programs for Héroux-Devtek such as the Boeing F-18, MQ-25 and SAAB Gripen E;• Growth in existing OEM platforms such as the Lockheed F-35; and,• Strong aftermarket deliveries for proprietary programs.
20
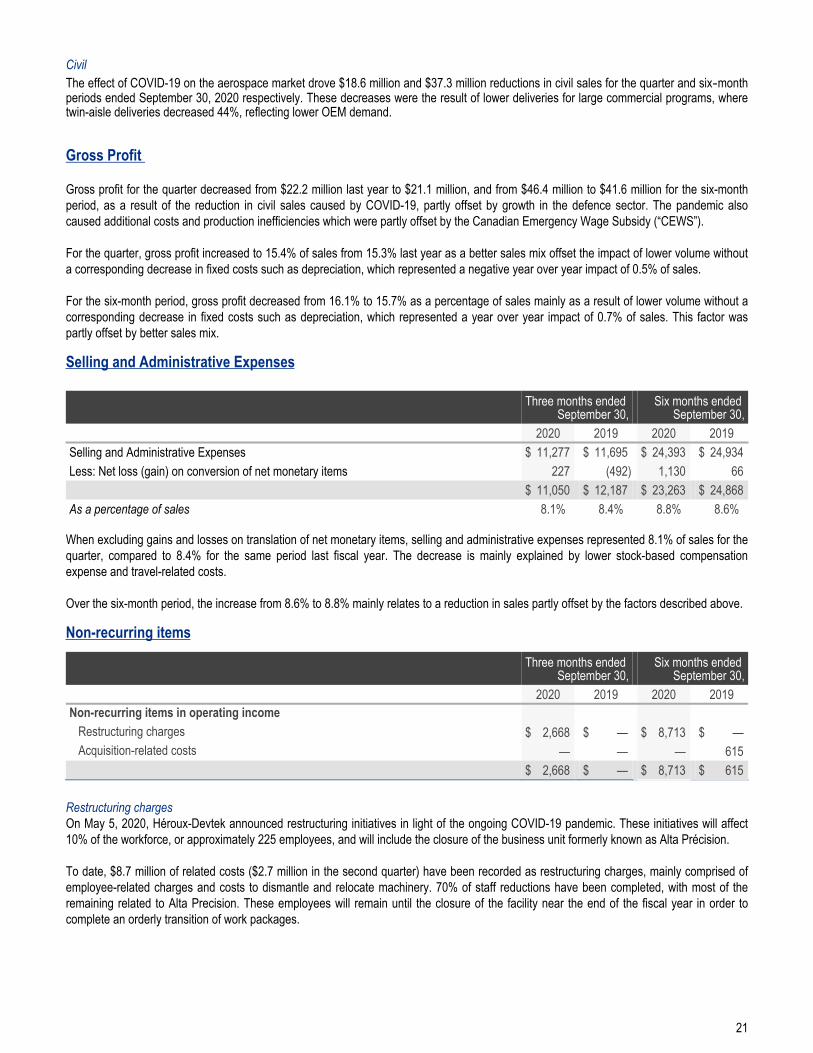
CivilThe effect of COVID-19 on the aerospace market drove $18.6 million and $37.3 million reductions in civil sales for the quarter and six‑month periods ended September 30, 2020 respectively. These decreases were the result of lower deliveries for large commercial programs, where twin-aisle deliveries decreased 44%, reflecting lower OEM demand.
Gross Profit
Gross profit for the quarter decreased from $22.2 million last year to $21.1 million, and from $46.4 million to $41.6 million for the six-month period, as a result of the reduction in civil sales caused by COVID-19, partly offset by growth in the defence sector. The pandemic also caused additional costs and production inefficiencies which were partly offset by the Canadian Emergency Wage Subsidy (“CEWS”).
For the quarter, gross profit increased to 15.4% of sales from 15.3% last year as a better sales mix offset the impact of lower volume without a corresponding decrease in fixed costs such as depreciation, which represented a negative year over year impact of 0.5% of sales.
For the six-month period, gross profit decreased from 16.1% to 15.7% as a percentage of sales mainly as a result of lower volume without a corresponding decrease in fixed costs such as depreciation, which represented a year over year impact of 0.7% of sales. This factor was partly offset by better sales mix.
Selling and Administrative Expenses
Three months ended September 30,
Six months ended September 30,
2020 2019 2020 2019Selling and Administrative Expenses $ 11,277 $ 11,695 $ 24,393 $ 24,934 Less: Net loss (gain) on conversion of net monetary items 227 (492) 1,130 66
$ 11,050 $ 12,187 $ 23,263 $ 24,868 As a percentage of sales 8.1 % 8.4 % 8.8 % 8.6 %
When excluding gains and losses on translation of net monetary items, selling and administrative expenses represented 8.1% of sales for the quarter, compared to 8.4% for the same period last fiscal year. The decrease is mainly explained by lower stock-based compensation expense and travel-related costs.
Over the six-month period, the increase from 8.6% to 8.8% mainly relates to a reduction in sales partly offset by the factors described above.
Non-recurring items
Three months ended September 30,
Six months ended September 30,
2020 2019 2020 2019Non-recurring items in operating income
Restructuring charges $ 2,668 $ — $ 8,713 $ — Acquisition-related costs — — — 615
$ 2,668 $ — $ 8,713 $ 615
Restructuring chargesOn May 5, 2020, Héroux-Devtek announced restructuring initiatives in light of the ongoing COVID-19 pandemic. These initiatives will affect 10% of the workforce, or approximately 225 employees, and will include the closure of the business unit formerly known as Alta Précision.
To date, $8.7 million of related costs ($2.7 million in the second quarter) have been recorded as restructuring charges, mainly comprised of employee-related charges and costs to dismantle and relocate machinery. 70% of staff reductions have been completed, with most of the remaining related to Alta Precision. These employees will remain until the closure of the facility near the end of the fiscal year in order to complete an orderly transition of work packages.
21
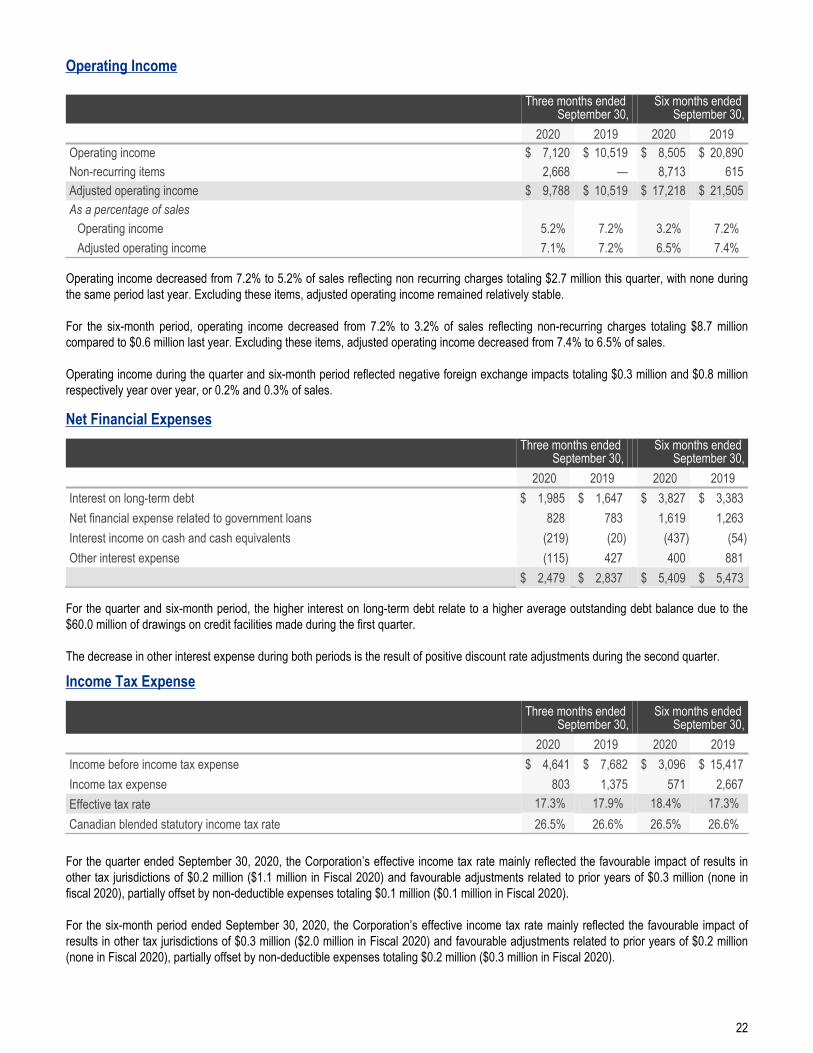
Operating Income
Three months ended September 30,
Six months ended September 30,
2020 2019 2020 2019Operating income $ 7,120 $ 10,519 $ 8,505 $ 20,890 Non-recurring items 2,668 — 8,713 615 Adjusted operating income $ 9,788 $ 10,519 $ 17,218 $ 21,505 As a percentage of sales
Operating income 5.2 % 7.2 % 3.2 % 7.2 %Adjusted operating income 7.1 % 7.2 % 6.5 % 7.4 %
Operating income decreased from 7.2% to 5.2% of sales reflecting non recurring charges totaling $2.7 million this quarter, with none during the same period last year. Excluding these items, adjusted operating income remained relatively stable.
For the six-month period, operating income decreased from 7.2% to 3.2% of sales reflecting non-recurring charges totaling $8.7 million compared to $0.6 million last year. Excluding these items, adjusted operating income decreased from 7.4% to 6.5% of sales.
Operating income during the quarter and six-month period reflected negative foreign exchange impacts totaling $0.3 million and $0.8 million respectively year over year, or 0.2% and 0.3% of sales.
Net Financial ExpensesThree months ended
September 30,Six months ended
September 30,2020 2019 2020 2019
Interest on long-term debt $ 1,985 $ 1,647 $ 3,827 $ 3,383 Net financial expense related to government loans 828 783 1,619 1,263 Interest income on cash and cash equivalents (219) (20) (437) (54) Other interest expense (115) 427 400 881
$ 2,479 $ 2,837 $ 5,409 $ 5,473
For the quarter and six-month period, the higher interest on long-term debt relate to a higher average outstanding debt balance due to the $60.0 million of drawings on credit facilities made during the first quarter.
The decrease in other interest expense during both periods is the result of positive discount rate adjustments during the second quarter.
Income Tax Expense
Three months ended September 30,
Six months ended September 30,
2020 2019 2020 2019Income before income tax expense $ 4,641 $ 7,682 $ 3,096 $ 15,417 Income tax expense 803 1,375 571 2,667 Effective tax rate 17.3 % 17.9 % 18.4 % 17.3 %Canadian blended statutory income tax rate 26.5 % 26.6 % 26.5 % 26.6 %
For the quarter ended September 30, 2020, the Corporation’s effective income tax rate mainly reflected the favourable impact of results in other tax jurisdictions of $0.2 million ($1.1 million in Fiscal 2020) and favourable adjustments related to prior years of $0.3 million (none in fiscal 2020), partially offset by non-deductible expenses totaling $0.1 million ($0.1 million in Fiscal 2020).
For the six-month period ended September 30, 2020, the Corporation’s effective income tax rate mainly reflected the favourable impact of results in other tax jurisdictions of $0.3 million ($2.0 million in Fiscal 2020) and favourable adjustments related to prior years of $0.2 million (none in Fiscal 2020), partially offset by non-deductible expenses totaling $0.2 million ($0.3 million in Fiscal 2020).
22
Net Income
Net income decreased from $6.3 million to $3.8 million during the quarter (or decreased from $6.3 million to $6.1 million excluding non-recurring items net of taxes) and decreased from $12.8 million to $2.5 million (or decreased from $13.3 million to $9.5 million excluding non-recurring items net of taxes) during the six-month period compared to the same periods last fiscal year mainly as a result of the factors described above.
NON-IFRS FINANCIAL MEASURES
This MD&A is based on earnings in accordance with IFRS and the following non-IFRS financial measures:Adjusted operating income: Operating income excluding non-recurring items.Adjusted EBITDA: Operating income excluding amortization expense and non-recurring itemsAdjusted net income: Net income excluding non-recurring items net of taxes.Adjusted earnings per share: Diluted earnings per share calculated on the basis of adjusted net income.Free cash flow: Cash flows related to operating activities less additions to property, plant and equipment and net increase or decrease in finite-life intangible assets.
These Non-IFRS financial measures do not have any standardized meaning prescribed by IFRS and may therefore not be comparable to similar measures presented by other issuers. Management considers these metrics to be information which may assist investors in evaluating the Corporation’s profitability and enable better comparability of the results from one period to another and with peers who may employ similar measures.
These measures are not considered by management to be a substitute for IFRS measures, nor to be superior as they often do not fully reflect periodic costs, the long-term costs of investing or financing decisions or the impact of events which are not a result of operations.
The following are reconciliations of these items to their most comparable IFRS measures as well as additional information on what they represent, excluding free cash flow. For the reconciliation of free cash flow to cash flows related to operating activities, refer to Liquidity and Capital Resources.
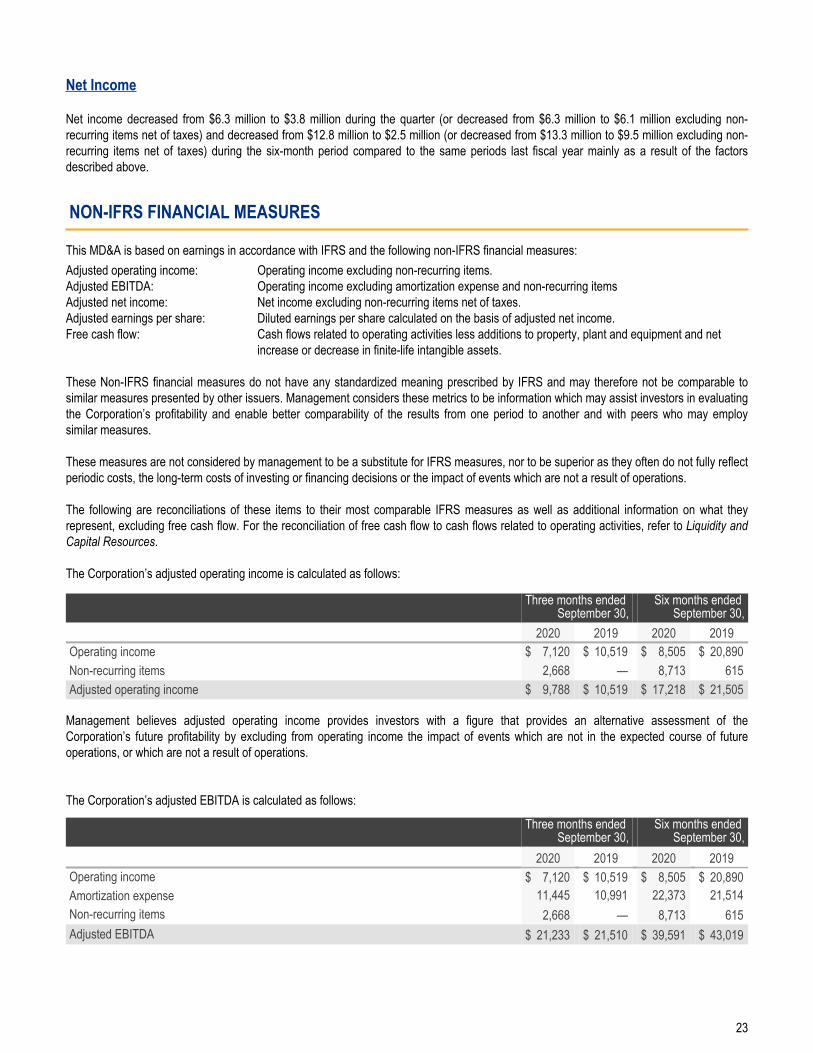
The Corporation’s adjusted operating income is calculated as follows:
Three months ended September 30,
Six months ended September 30,
2020 2019 2020 2019Operating income $ 7,120 $ 10,519 $ 8,505 $ 20,890 Non-recurring items 2,668 — 8,713 615 Adjusted operating income $ 9,788 $ 10,519 $ 17,218 $ 21,505
Management believes adjusted operating income provides investors with a figure that provides an alternative assessment of the Corporation’s future profitability by excluding from operating income the impact of events which are not in the expected course of future operations, or which are not a result of operations.
The Corporation’s adjusted EBITDA is calculated as follows:
Three months ended September 30,
Six months ended September 30,
2020 2019 2020 2019Operating income $ 7,120 $ 10,519 $ 8,505 $ 20,890 Amortization expense 11,445 10,991 22,373 21,514 Non-recurring items 2,668 — 8,713 615 Adjusted EBITDA $ 21,233 $ 21,510 $ 39,591 $ 43,019
23
Management believes adjusted EBITDA provides valuable insight into the Corporation’s day-to-day operations as they exclude from earnings factors that are more reflective of long-term financing or investing decisions than of current performance.
Adjusted EBITDA, in addition, provides an alternative assessment of future operating results as it excludes the impact of events which are not in the expected course of future operations, or which are not a result of operations. Adjusted EBITDA is also used by management to assess operational performance and is a component of certain performance-based employee remuneration.
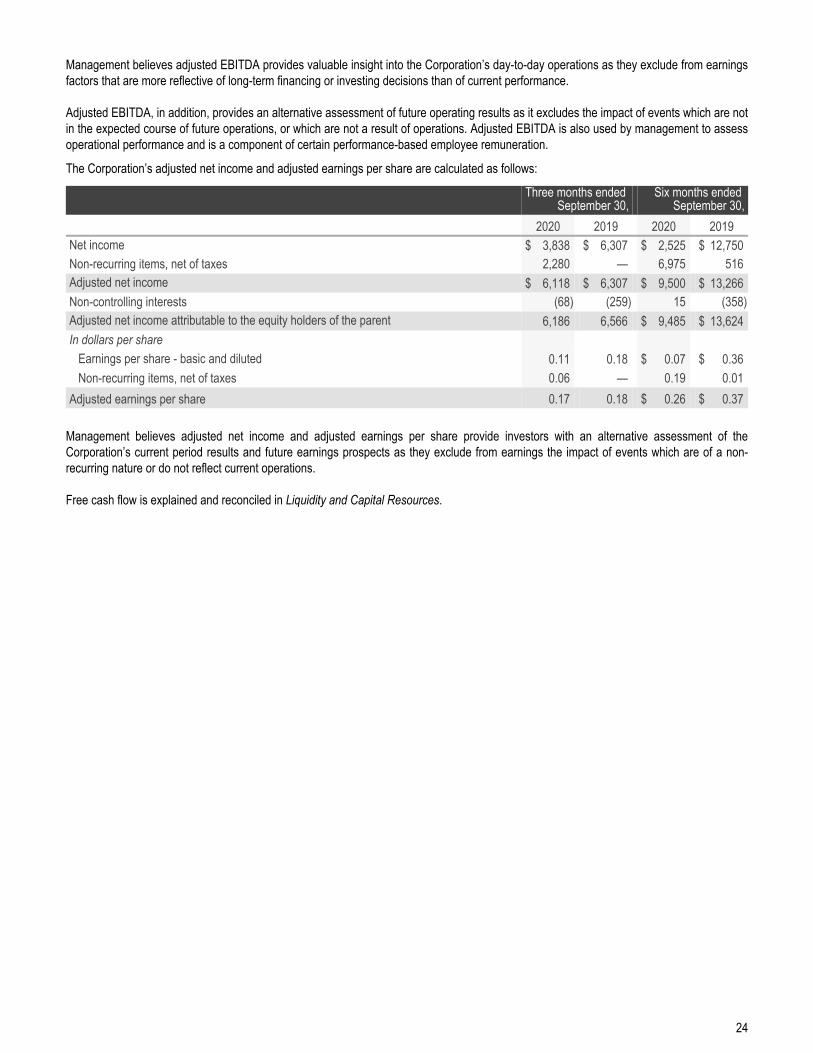
The Corporation’s adjusted net income and adjusted earnings per share are calculated as follows:
Three months ended September 30,
Six months ended September 30,
2020 2019 2020 2019Net income $ 3,838 $ 6,307 $ 2,525 $ 12,750 Non-recurring items, net of taxes 2,280 — 6,975 516 Adjusted net income $ 6,118 $ 6,307 $ 9,500 $ 13,266 Non-controlling interests (68) (259) 15 (358) Adjusted net income attributable to the equity holders of the parent 6,186 6,566 $ 9,485 $ 13,624 In dollars per share
Earnings per share - basic and diluted 0.11 0.18 $ 0.07 $ 0.36 Non-recurring items, net of taxes 0.06 — 0.19 0.01
Adjusted earnings per share 0.17 0.18 $ 0.26 $ 0.37
Management believes adjusted net income and adjusted earnings per share provide investors with an alternative assessment of the Corporation’s current period results and future earnings prospects as they exclude from earnings the impact of events which are of a non-recurring nature or do not reflect current operations.
Free cash flow is explained and reconciled in Liquidity and Capital Resources.
24
LIQUIDITY AND CAPITAL RESOURCES
CREDIT FACILITIES AND NET DEBT POSITIONSenior Secured Syndicated Revolving Credit Facility (“Revolving Facility”)
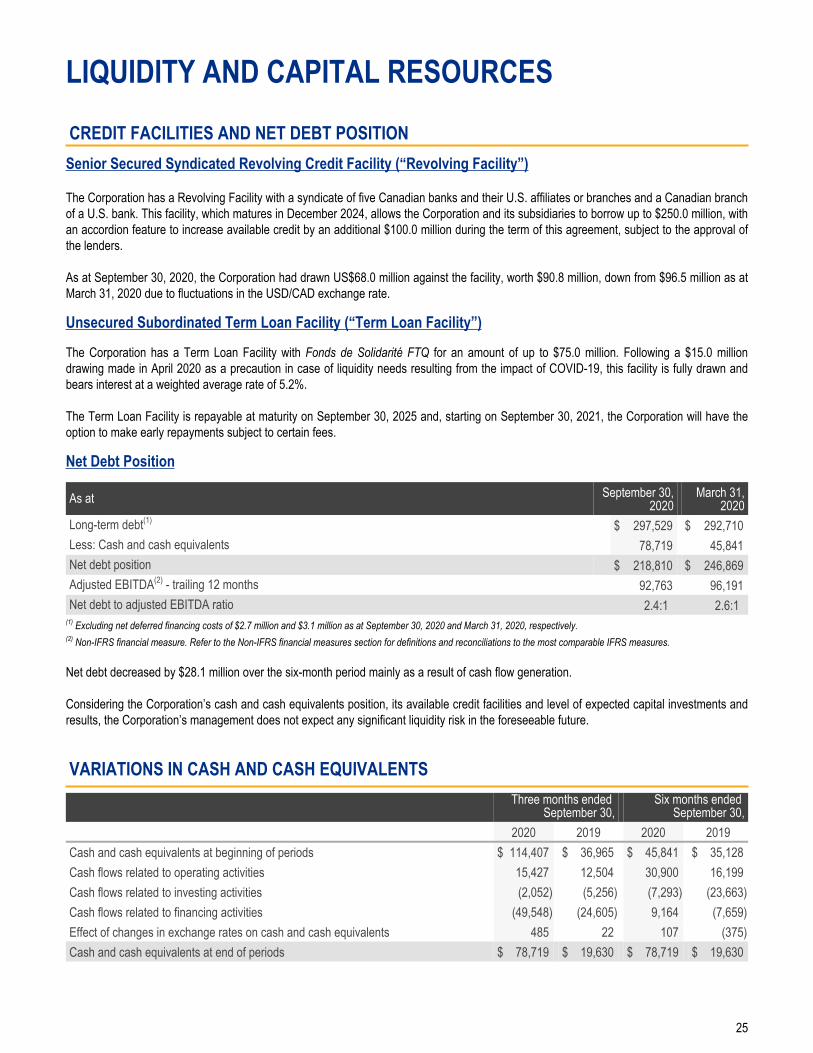
The Corporation has a Revolving Facility with a syndicate of five Canadian banks and their U.S. affiliates or branches and a Canadian branch of a U.S. bank. This facility, which matures in December 2024, allows the Corporation and its subsidiaries to borrow up to $250.0 million, with an accordion feature to increase available credit by an additional $100.0 million during the term of this agreement, subject to the approval of the lenders.
As at September 30, 2020, the Corporation had drawn US$68.0 million against the facility, worth $90.8 million, down from $96.5 million as at March 31, 2020 due to fluctuations in the USD/CAD exchange rate.
Unsecured Subordinated Term Loan Facility (“Term Loan Facility”)
The Corporation has a Term Loan Facility with Fonds de Solidarité FTQ for an amount of up to $75.0 million. Following a $15.0 million drawing made in April 2020 as a precaution in case of liquidity needs resulting from the impact of COVID-19, this facility is fully drawn and bears interest at a weighted average rate of 5.2%.
The Term Loan Facility is repayable at maturity on September 30, 2025 and, starting on September 30, 2021, the Corporation will have the option to make early repayments subject to certain fees.
Net Debt Position
As at September 30,2020
March 31,2020
Long-term debt(1) $ 297,529 $ 292,710 Less: Cash and cash equivalents 78,719 45,841 Net debt position $ 218,810 $ 246,869 Adjusted EBITDA(2) - trailing 12 months 92,763 96,191 Net debt to adjusted EBITDA ratio 2.4 :1 2.6 :1
(1) Excluding net deferred financing costs of $2.7 million and $3.1 million as at September 30, 2020 and March 31, 2020, respectively.(2) Non-IFRS financial measure. Refer to the Non-IFRS financial measures section for definitions and reconciliations to the most comparable IFRS measures.
Net debt decreased by $28.1 million over the six-month period mainly as a result of cash flow generation.
Considering the Corporation’s cash and cash equivalents position, its available credit facilities and level of expected capital investments and results, the Corporation’s management does not expect any significant liquidity risk in the foreseeable future.
VARIATIONS IN CASH AND CASH EQUIVALENTSThree months ended
September 30,Six months ended
September 30,2020 2019 2020 2019
Cash and cash equivalents at beginning of periods $ 114,407 $ 36,965 $ 45,841 $ 35,128 Cash flows related to operating activities 15,427 12,504 30,900 16,199 Cash flows related to investing activities (2,052) (5,256) (7,293) (23,663) Cash flows related to financing activities (49,548) (24,605) 9,164 (7,659) Effect of changes in exchange rates on cash and cash equivalents 485 22 107 (375) Cash and cash equivalents at end of periods $ 78,719 $ 19,630 $ 78,719 $ 19,630
25
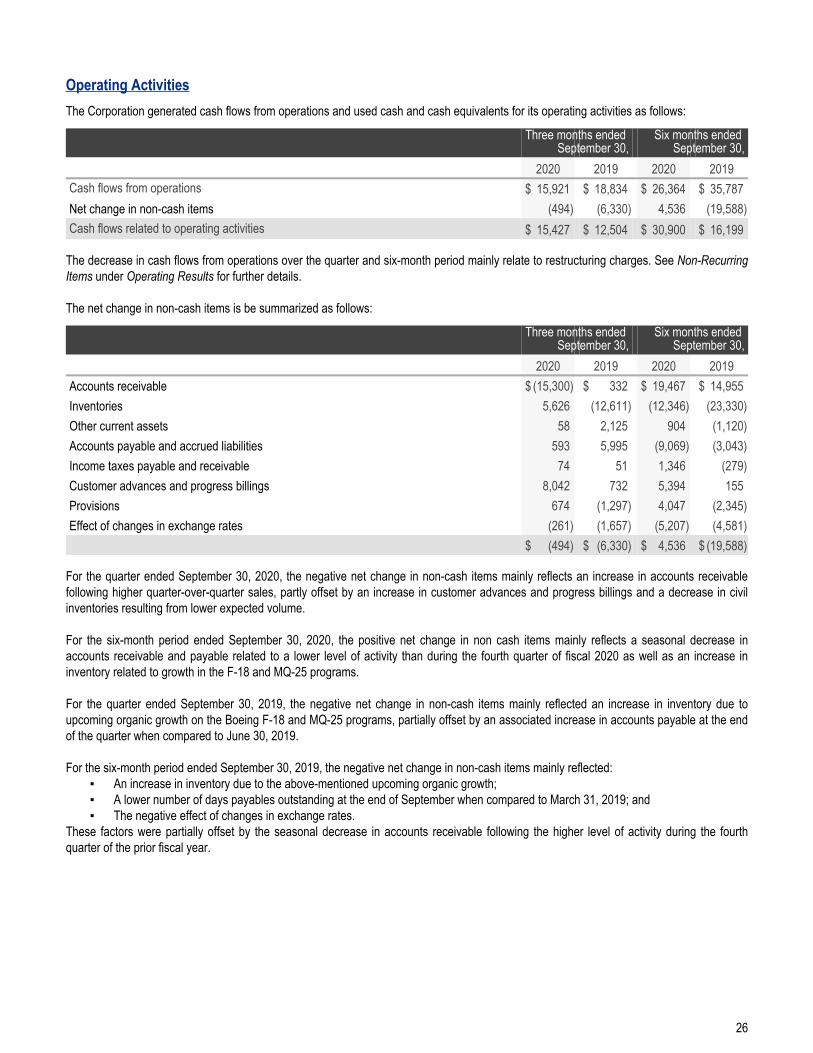
Operating ActivitiesThe Corporation generated cash flows from operations and used cash and cash equivalents for its operating activities as follows:
Three months ended September 30,
Six months ended September 30,
2020 2019 2020 2019Cash flows from operations $ 15,921 $ 18,834 $ 26,364 $ 35,787 Net change in non-cash items (494) (6,330) 4,536 (19,588) Cash flows related to operating activities $ 15,427 $ 12,504 $ 30,900 $ 16,199
The decrease in cash flows from operations over the quarter and six-month period mainly relate to restructuring charges. See Non-Recurring Items under Operating Results for further details.
The net change in non-cash items is be summarized as follows:
Three months ended September 30,
Six months ended September 30,
2020 2019 2020 2019Accounts receivable $ (15,300) $ 332 $ 19,467 $ 14,955 Inventories 5,626 (12,611) (12,346) (23,330) Other current assets 58 2,125 904 (1,120) Accounts payable and accrued liabilities 593 5,995 (9,069) (3,043) Income taxes payable and receivable 74 51 1,346 (279) Customer advances and progress billings 8,042 732 5,394 155 Provisions 674 (1,297) 4,047 (2,345) Effect of changes in exchange rates (261) (1,657) (5,207) (4,581)
$ (494) $ (6,330) $ 4,536 $ (19,588)
For the quarter ended September 30, 2020, the negative net change in non-cash items mainly reflects an increase in accounts receivable following higher quarter-over-quarter sales, partly offset by an increase in customer advances and progress billings and a decrease in civil inventories resulting from lower expected volume.
For the six-month period ended September 30, 2020, the positive net change in non cash items mainly reflects a seasonal decrease in accounts receivable and payable related to a lower level of activity than during the fourth quarter of fiscal 2020 as well as an increase in inventory related to growth in the F-18 and MQ-25 programs.
For the quarter ended September 30, 2019, the negative net change in non-cash items mainly reflected an increase in inventory due to upcoming organic growth on the Boeing F-18 and MQ-25 programs, partially offset by an associated increase in accounts payable at the end of the quarter when compared to June 30, 2019.
For the six-month period ended September 30, 2019, the negative net change in non-cash items mainly reflected:▪ An increase in inventory due to the above-mentioned upcoming organic growth; ▪ A lower number of days payables outstanding at the end of September when compared to March 31, 2019; and▪ The negative effect of changes in exchange rates.
These factors were partially offset by the seasonal decrease in accounts receivable following the higher level of activity during the fourth quarter of the prior fiscal year.
26
Investing Activities
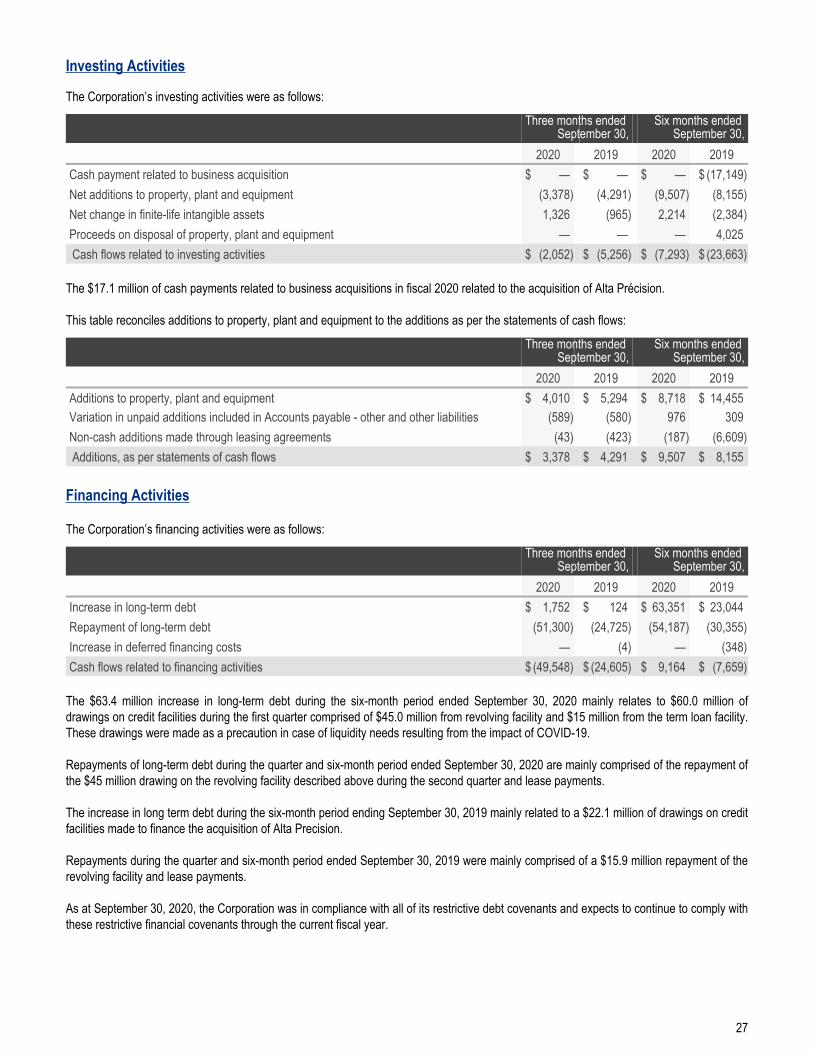
The Corporation’s investing activities were as follows:
Three months ended September 30,
Six months ended September 30,
2020 2019 2020 2019Cash payment related to business acquisition $ — $ — $ — $ (17,149) Net additions to property, plant and equipment (3,378) (4,291) (9,507) (8,155) Net change in finite-life intangible assets 1,326 (965) 2,214 (2,384) Proceeds on disposal of property, plant and equipment — — — 4,025 Cash flows related to investing activities $ (2,052) $ (5,256) $ (7,293) $ (23,663)
The $17.1 million of cash payments related to business acquisitions in fiscal 2020 related to the acquisition of Alta Précision.
This table reconciles additions to property, plant and equipment to the additions as per the statements of cash flows:
Three months ended September 30,
Six months ended September 30,
2020 2019 2020 2019Additions to property, plant and equipment $ 4,010 $ 5,294 $ 8,718 $ 14,455 Variation in unpaid additions included in Accounts payable - other and other liabilities (589) (580) 976 309 Non-cash additions made through leasing agreements (43) (423) (187) (6,609) Additions, as per statements of cash flows $ 3,378 $ 4,291 $ 9,507 $ 8,155
Financing Activities
The Corporation’s financing activities were as follows:
Three months ended September 30,
Six months ended September 30,
2020 2019 2020 2019Increase in long-term debt $ 1,752 $ 124 $ 63,351 $ 23,044 Repayment of long-term debt (51,300) (24,725) (54,187) (30,355) Increase in deferred financing costs — (4) — (348) Cash flows related to financing activities $ (49,548) $ (24,605) $ 9,164 $ (7,659)
The $63.4 million increase in long-term debt during the six-month period ended September 30, 2020 mainly relates to $60.0 million of drawings on credit facilities during the first quarter comprised of $45.0 million from revolving facility and $15 million from the term loan facility. These drawings were made as a precaution in case of liquidity needs resulting from the impact of COVID-19.
Repayments of long-term debt during the quarter and six-month period ended September 30, 2020 are mainly comprised of the repayment of the $45 million drawing on the revolving facility described above during the second quarter and lease payments.
The increase in long term debt during the six-month period ending September 30, 2019 mainly related to a $22.1 million of drawings on credit facilities made to finance the acquisition of Alta Precision.
Repayments during the quarter and six-month period ended September 30, 2019 were mainly comprised of a $15.9 million repayment of the revolving facility and lease payments.
As at September 30, 2020, the Corporation was in compliance with all of its restrictive debt covenants and expects to continue to comply with these restrictive financial covenants through the current fiscal year.
27
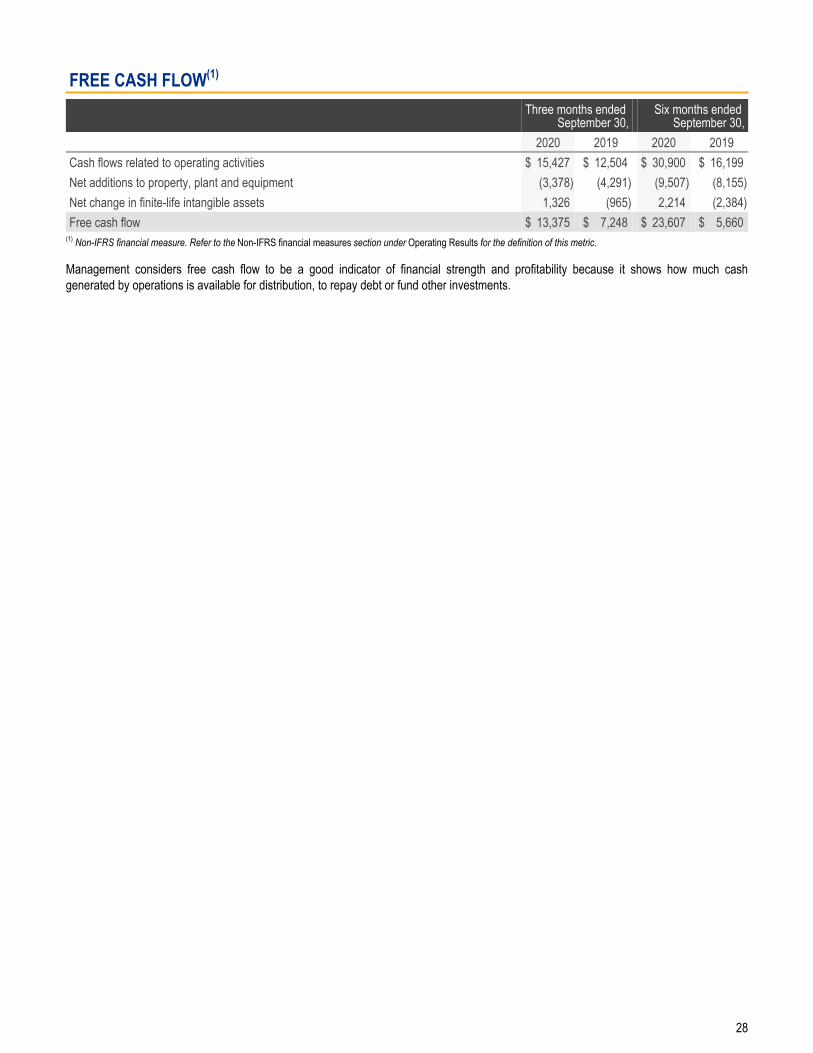
FREE CASH FLOW(1)
Three months ended September 30,
Six months ended September 30,
2020 2019 2020 2019Cash flows related to operating activities $ 15,427 $ 12,504 $ 30,900 $ 16,199 Net additions to property, plant and equipment (3,378) (4,291) (9,507) (8,155) Net change in finite-life intangible assets 1,326 (965) 2,214 (2,384) Free cash flow $ 13,375 $ 7,248 $ 23,607 $ 5,660
(1) Non-IFRS financial measure. Refer to the Non-IFRS financial measures section under Operating Results for the definition of this metric.
Management considers free cash flow to be a good indicator of financial strength and profitability because it shows how much cash generated by operations is available for distribution, to repay debt or fund other investments.
28
FINANCIAL POSITION
CONSOLIDATED BALANCE SHEETS
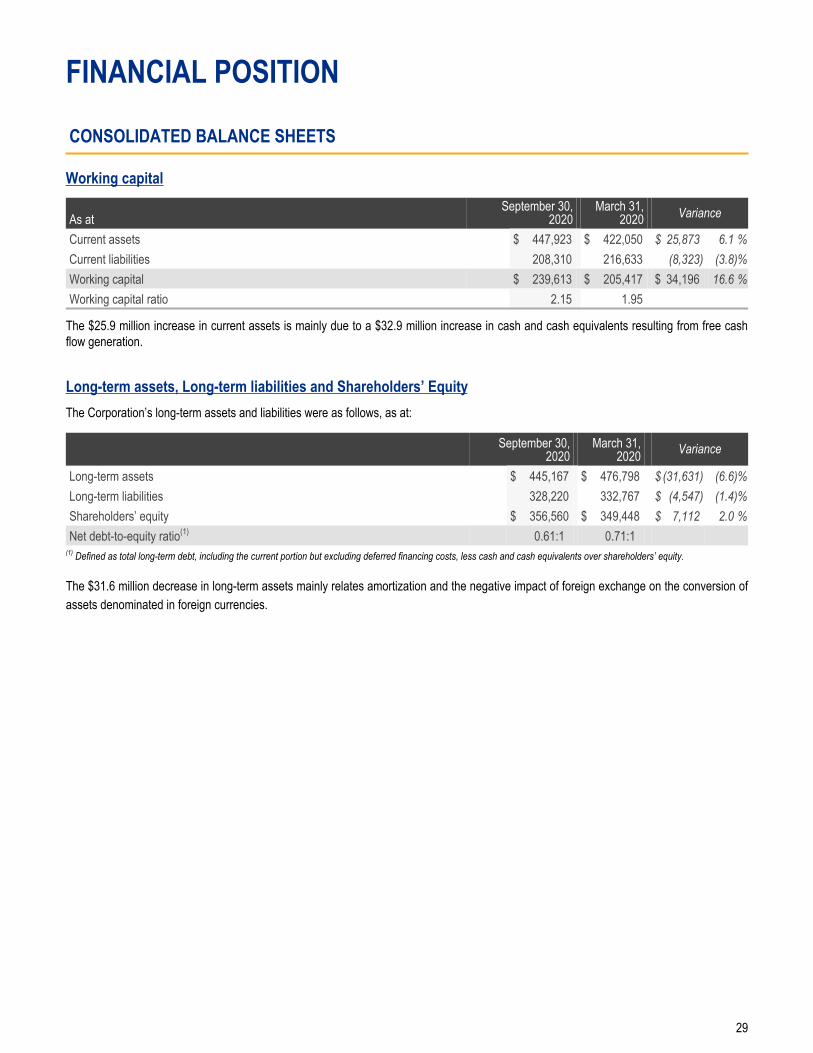
Working capital
As atSeptember 30,
2020March 31,
2020 Variance
Current assets $ 447,923 $ 422,050 $ 25,873 6.1 %Current liabilities 208,310 216,633 (8,323) (3.8) %Working capital $ 239,613 $ 205,417 $ 34,196 16.6 %Working capital ratio 2.15 1.95
The $25.9 million increase in current assets is mainly due to a $32.9 million increase in cash and cash equivalents resulting from free cash flow generation.
Long-term assets, Long-term liabilities and Shareholders’ EquityThe Corporation’s long-term assets and liabilities were as follows, as at:
September 30,2020
March 31,2020 Variance
Long-term assets $ 445,167 $ 476,798 $ (31,631) (6.6) %Long-term liabilities 328,220 332,767 $ (4,547) (1.4) %Shareholders’ equity $ 356,560 $ 349,448 $ 7,112 2.0 %Net debt-to-equity ratio(1) 0.61:1 0.71:1
(1) Defined as total long-term debt, including the current portion but excluding deferred financing costs, less cash and cash equivalents over shareholders’ equity.
The $31.6 million decrease in long-term assets mainly relates amortization and the negative impact of foreign exchange on the conversion of assets denominated in foreign currencies.
29
ADDITIONAL INFORMATIONFOREIGN EXCHANGE (“FX”)
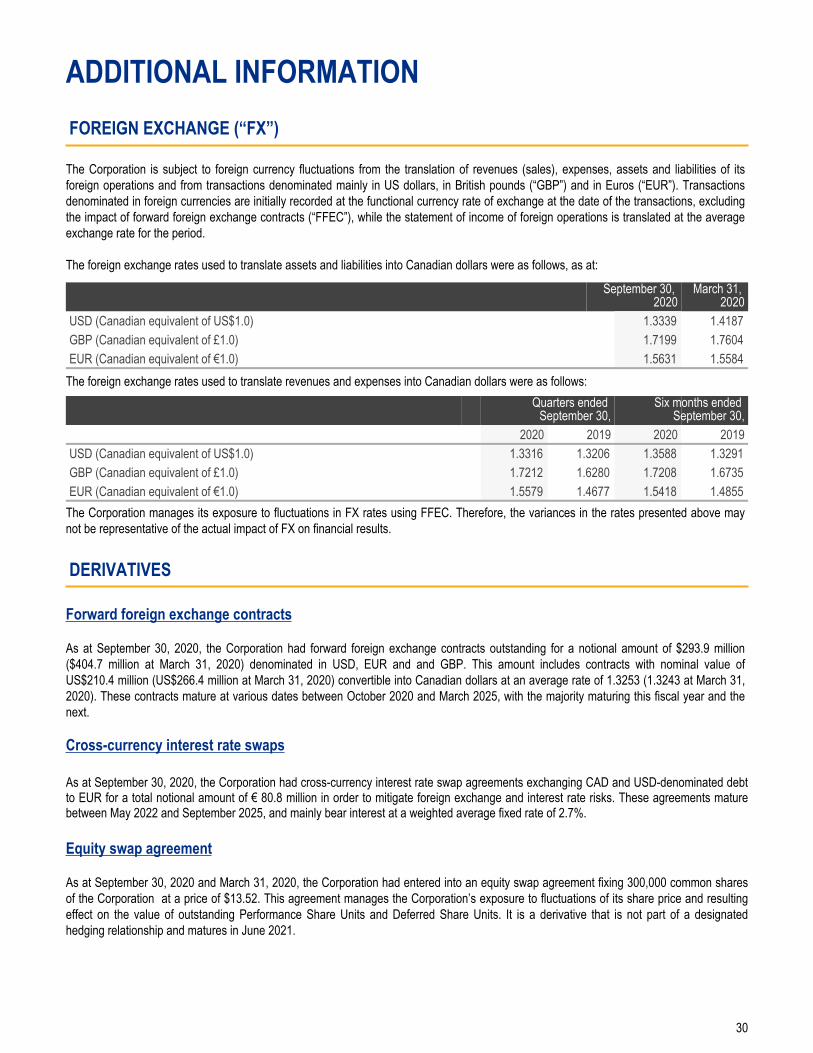
The Corporation is subject to foreign currency fluctuations from the translation of revenues (sales), expenses, assets and liabilities of its foreign operations and from transactions denominated mainly in US dollars, in British pounds (“GBP”) and in Euros (“EUR”). Transactions denominated in foreign currencies are initially recorded at the functional currency rate of exchange at the date of the transactions, excluding the impact of forward foreign exchange contracts (“FFEC”), while the statement of income of foreign operations is translated at the average exchange rate for the period. The foreign exchange rates used to translate assets and liabilities into Canadian dollars were as follows, as at:
September 30, 2020
March 31, 2020
USD (Canadian equivalent of US$1.0) 1.3339 1.4187 GBP (Canadian equivalent of £1.0) 1.7199 1.7604 EUR (Canadian equivalent of €1.0) 1.5631 1.5584
The foreign exchange rates used to translate revenues and expenses into Canadian dollars were as follows:Quarters ended
September 30,Six months ended
September 30,2020 2019 2020 2019
USD (Canadian equivalent of US$1.0) 1.3316 1.3206 1.3588 1.3291 GBP (Canadian equivalent of £1.0) 1.7212 1.6280 1.7208 1.6735 EUR (Canadian equivalent of €1.0) 1.5579 1.4677 1.5418 1.4855
The Corporation manages its exposure to fluctuations in FX rates using FFEC. Therefore, the variances in the rates presented above may not be representative of the actual impact of FX on financial results.
DERIVATIVES
Forward foreign exchange contracts
As at September 30, 2020, the Corporation had forward foreign exchange contracts outstanding for a notional amount of $293.9 million ($404.7 million at March 31, 2020) denominated in USD, EUR and and GBP. This amount includes contracts with nominal value of US$210.4 million (US$266.4 million at March 31, 2020) convertible into Canadian dollars at an average rate of 1.3253 (1.3243 at March 31, 2020). These contracts mature at various dates between October 2020 and March 2025, with the majority maturing this fiscal year and the next.
Cross-currency interest rate swaps
As at September 30, 2020, the Corporation had cross-currency interest rate swap agreements exchanging CAD and USD-denominated debt to EUR for a total notional amount of € 80.8 million in order to mitigate foreign exchange and interest rate risks. These agreements mature between May 2022 and September 2025, and mainly bear interest at a weighted average fixed rate of 2.7%.
Equity swap agreement
As at September 30, 2020 and March 31, 2020, the Corporation had entered into an equity swap agreement fixing 300,000 common shares of the Corporation at a price of $13.52. This agreement manages the Corporation’s exposure to fluctuations of its share price and resulting effect on the value of outstanding Performance Share Units and Deferred Share Units. It is a derivative that is not part of a designated hedging relationship and matures in June 2021.
30
INTERNAL CONTROLS AND PROCEDURES
In compliance with the Canadian Securities Administrators’ Regulation 52-109, the Corporation has filed certifications signed by the Chief Executive Officer (“CEO”) and the Chief Financial Officer (“CFO”) that, among other things, report on disclosure controls and procedures and the design of internal controls over financial reporting.
The CEO and the CFO have designed disclosure controls and procedures, or have caused them to be designed under their supervision, to provide reasonable assurance that material information relating to the Corporation has been made known to them and has been properly disclosed in the interim and annual filings.
The CEO and CFO have also designed internal controls over financial reporting, or have caused them to be designed under their supervision, to provide reasonable assurance regarding the reliability of financial reporting and the preparation of financial statements for external purposes in accordance with IFRS.
No changes were made to the Corporation’s internal controls over financial reporting during the quarter ended September 30, 2020 that have materially affected, or are reasonably likely to materially affect, its internal controls over financial reporting.
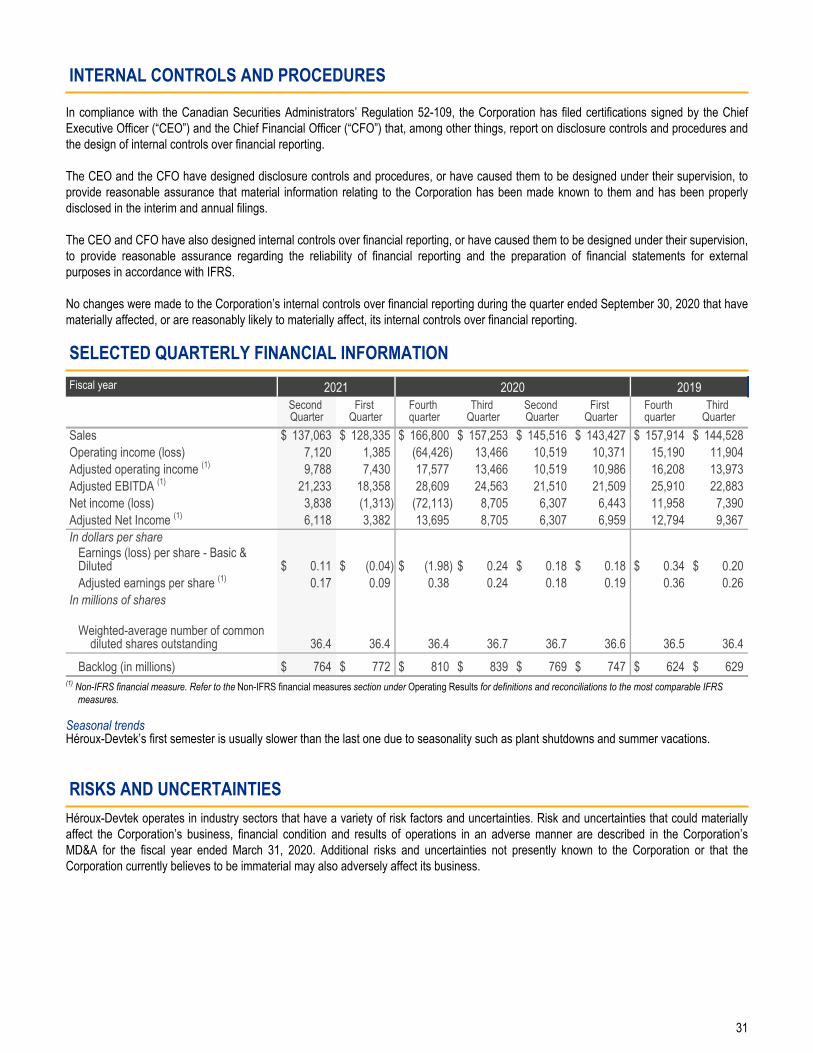
SELECTED QUARTERLY FINANCIAL INFORMATIONFiscal year 2021 2020 2019
Second Quarter
First Quarter
Fourth quarter
Third Quarter
Second Quarter
First Quarter
Fourth quarter
Third Quarter
Sales $ 137,063 $ 128,335 $ 166,800 $ 157,253 $ 145,516 $ 143,427 $ 157,914 $ 144,528 Operating income (loss) 7,120 1,385 (64,426) 13,466 10,519 10,371 15,190 11,904 Adjusted operating income (1) 9,788 7,430 17,577 13,466 10,519 10,986 16,208 13,973 Adjusted EBITDA (1) 21,233 18,358 28,609 24,563 21,510 21,509 25,910 22,883 Net income (loss) 3,838 (1,313) (72,113) 8,705 6,307 6,443 11,958 7,390 Adjusted Net Income (1) 6,118 3,382 13,695 8,705 6,307 6,959 12,794 9,367 In dollars per share
Earnings (loss) per share - Basic & Diluted $ 0.11 $ (0.04) $ (1.98) $ 0.24 $ 0.18 $ 0.18 $ 0.34 $ 0.20 Adjusted earnings per share (1) 0.17 0.09 0.38 0.24 0.18 0.19 0.36 0.26
In millions of shares
Weighted-average number of common diluted shares outstanding 36.4 36.4 36.4 36.7 36.7 36.6 36.5 36.4
Backlog (in millions) $ 764 $ 772 $ 810 $ 839 $ 769 $ 747 $ 624 $ 629 (1) Non-IFRS financial measure. Refer to the Non-IFRS financial measures section under Operating Results for definitions and reconciliations to the most comparable IFRS
measures.
Seasonal trendsHéroux-Devtek’s first semester is usually slower than the last one due to seasonality such as plant shutdowns and summer vacations.
RISKS AND UNCERTAINTIESHéroux-Devtek operates in industry sectors that have a variety of risk factors and uncertainties. Risk and uncertainties that could materially affect the Corporation’s business, financial condition and results of operations in an adverse manner are described in the Corporation’s MD&A for the fiscal year ended March 31, 2020. Additional risks and uncertainties not presently known to the Corporation or that the Corporation currently believes to be immaterial may also adversely affect its business.
31
SHAREHOLDER INFORMATION
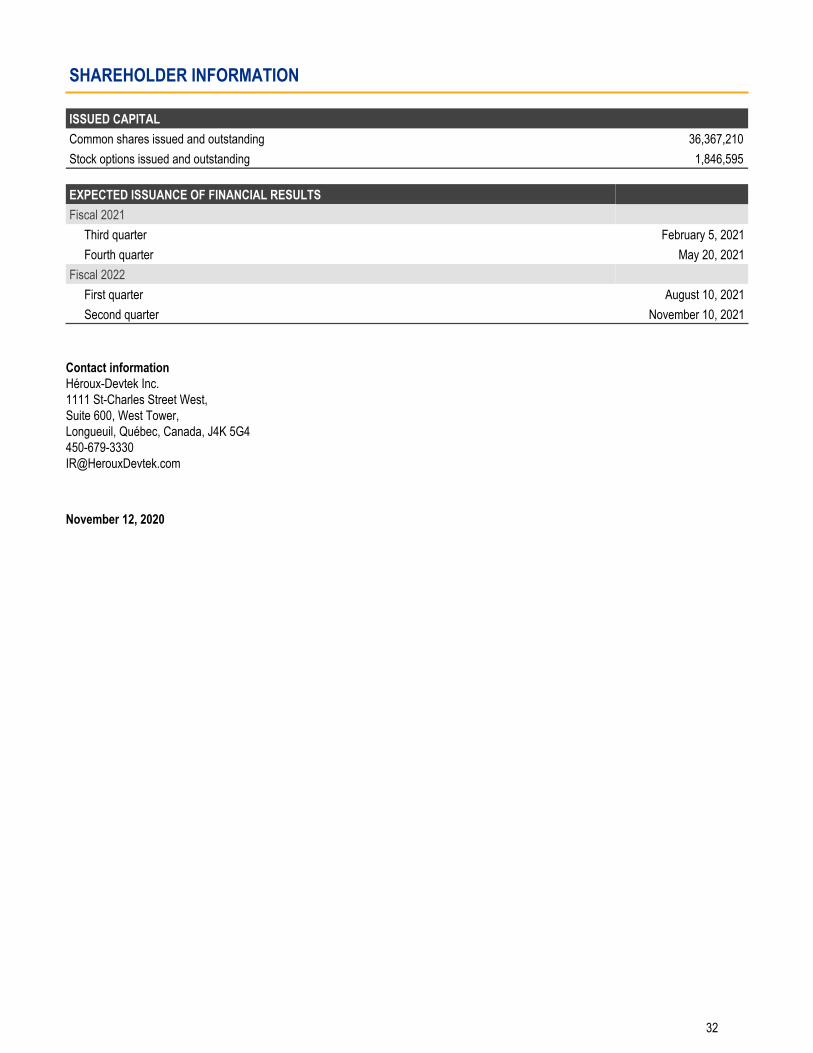
ISSUED CAPITALCommon shares issued and outstanding 36,367,210 Stock options issued and outstanding 1,846,595
EXPECTED ISSUANCE OF FINANCIAL RESULTSFiscal 2021
Third quarter February 5, 2021Fourth quarter May 20, 2021
Fiscal 2022First quarter August 10, 2021Second quarter November 10, 2021
Contact informationHéroux-Devtek Inc.1111 St-Charles Street West, Suite 600, West Tower, Longueuil, Québec, Canada, J4K [email protected]
November 12, 2020
32

HEROUXDEVTEK.COM
1111 Saint-Charles street West, suite 600 West Tower, Saint-Charles Complex Longueuil (Québec) Canada J4K 5G4 450 679-3330
CONTACT INFORMATION